dialog semiconductor plc the power to be
TRANSCRIPT

Annual report and accounts | 2011
Dialog
Semicond
uctor Plc A
nnual report and accounts | 2011
The power to be...
...personal
...portable
...connected

Section 1 | Overview02 Dialog at a glance03 Our markets06 Chairman’s statement07 Dialog Semiconductor shares in 2011
Section 2 | Business review12 Business review and strategy13 Chief Executive’s review15 Product technology and key customers20 Financial review25 Risks and their management26 Sustainability
Section 3 | Management and governance30 Executive management32 Board of Directors34 Directors’ report36 Corporate Governance38 Directors’ remuneration report 41 Statement of Directors’ responsibilities41 Responsibility statement
Section 4 | Consolidated financial statements and notes42 Independent Auditors’ report to the members of Dialog Semiconductor Plc43 Consolidated statement of financial position44 Consolidated income statement45 Statement of comprehensive income46 Consolidated statement of cash flows47 Consolidated statement of changes in Shareholders’ equity48 Notes to the consolidated financial statements
Section 5 | Company financial statements and notes98 Company statement of financial position99 Company statement of changes in equity100 Company statement of cash flows101 Notes to the Company financial statements
Section 6 | Additional information102 Glossary104 Advisers and corporate information105 Group directory
P04-05...personal
P10-11...portable
P16-17...connected

The power to be...
Dialog Semiconductor creates highly integrated, mixed signal integrated circuits (ICs) optimised for personal portable, short-range wireless, lighting, display and automotive applications. The Company provides flexible and dynamic support, world-class innovation and the assurance of dealing with an established business partner.
With its focus and expertise in energy-efficient system power management, and the addition during 2011 of low energy short-range wireless and VoIP technology to the portfolio, Dialog brings decades of experience to the rapid development of ICs for personal portable applications, including smartphones, tablet PCs, digital cordless phones and gaming applications.
Dialog’s power management processor companion chips are essential for enhancing both the performance in terms of extended battery lifetime and the consumers’ multimedia experience. With world-class manufacturing partners, Dialog operates a fabless business model.
Dialog Semiconductor Plc is headquartered near Stuttgart, with a global sales, R&D and marketing organisation. In 2011, it had US$527 million in revenue and is one of the fastest growing European public semiconductor companies. At 31 December 2011, the Company had 635 employees. The Company is listed on the Frankfurt (FWB: DLG) stock exchange and is a member of the German TecDax index.

Dialog Semiconductor Plc | Annual report and accounts 2011 | Section 1 | Overview02
2011 FINANCIAL HIGHLIGHTS – A RECORD YEAR ● US$527 million revenue in 2011 (78% over 2010
(excluding SiTel 41%))
● Full-year 2011 net profit of US$55.9 million or 10.6% of sales, completing five years of successive profitability
● Annual gross margin of 39.5%
● Closing year cash balance of US$113.6 million
● Dialog remains debt free as at 31 December 2011
● Basic and diluted 2011 IFRS earnings per share (EPS) of 89 cents and 84 cents respectively
2011 OPERATIONAL HIGHLIGHTS ● Continued success for power management and audio technologies
with the leading trendsetting smartphone manufacturers
● Emergence of the tablet PC market as a significant market for Dialog’s power management ICs, with leadership position established
● Acquisition of SiTel Semiconductor early in the year, targeting short-range wireless applications
● Continuous innovation on standard product (ASSP) portfolio and custom products (ASIC): – ARM multicore support added to new generation of system-
level PMICs – Transitioning to BCD technology enabling higher integration
of high-voltage functionality – A new generation of energy-saving green VoIP ICs – New low power audio codecs, including addition of dsp processor
for voice processing – Advanced packaging, including stacking of audio and PMIC
functionality in a single package
● Freescale announced as the latest member of Dialog’s Processor Partner Programme Initiative
Dialog at a glance
Q1Acquisition of SiTel Semiconductor in The Netherlands, adding short-range wireless connectivity to Dialog’s technology portfolio
2011 saw Dialog breaking through the US$500 million revenue barrier. The customer base was further diversified with the addition of Samsung for custom PMICs with many other customers in a broad range of applications added through the success of our Processor Partner Initiative with the leading application processor vendors, including Freescale, around their popular i.MX53 processor. In addition, through the acquisition of SiTel our technology was broadened to include short-range wireless connectivity and VoIP technology, adding leading customers including Microsoft for gaming, Panasonic for digital cordless and home security and GN Netcomm and Plantronics for professional audio headsets.
HIGHLIGHTS
* Year-on-year growth 2010-2011
TOTAL REVENUE (US$m)
+78%*600
500
400
300
200
100
007 08 09 10 11
OPERATING PROFIT (US$m)
+36%*70
60
50
40
30
20
10
0
-10
-2007 08 09 10 11
NET PROFIT (US$m)
+32%*60
50
40
30
20
10
0
-10
-2007 08 09 10 11
BASIC EPS (US$)
+27%*1.00
0.75
0.50
0.25
0
-0.25
-0.5007 08 09 10 11

03
With continuous innovation around power management and an expanding IP portfolio, Dialog is raising the bar for PMIC integration. In just three years, Dialog PMICs are offering up to approximately five times the functionality of earlier generations, enabling longer battery lifetime for our customers’ portable products.
Dialog replaces discrete power management components with high integrated single chip solutions that provide improved reliability, design simplicity as well as space-saving, power and cost advantages. Through innovative package technology, Dialog can offer multiple chip dies in a single chip package, saving board space and costs for their customers.
Dialog is a fabless semiconductor company outsourcing the capital intensive production of silicon wafers, packaging and testing of integrated circuits to leading Asian suppliers.
MOBILE SOLUTIONSOur mobile solutions power management, audio and display semiconductor solutions are designed to meet the needs of a broad range of portable devices including smartphones, tablet PCs, ebooks, MP3 and other media players.
CONNECTIVITYOur connectivity product portfolio offers both proprietary and standard-based products. We address a wide range of applications like digital cordless and professional headsets with single chip DECT solutions, Xbox gaming controllers with a proprietary technology, and now wireless sensor networks within the home with our SmartPulse™ DECT ultra low energy technology. Additionally, we offer SOCs for VoIP telephony connectivity.
AUTOMOTIVE AND INDUSTRIALInfotainment in cars is rapidly changing as multimedia and wireless technology enter the car environment. Dialog has partnered with Intel to provide companion power management and clock ICs for the Atom E6xx series of processors to address these next generation automotive infotainment systems.
Dialog Semiconductor’s motor control ICs are custom-designed for a range of automotive applications. Our current success is based around an advanced system on chip solutions for wiper motor control.
In the industrial market, Dialog provides power electronics solutions for lighting, such as electronic ballasts for fluorescent or high-intensity industrial lighting, with the future developments focused on energy-efficient retrofit bulb LED lighting solutions.
Our markets
Q2Start of first early production of PMOLED ICs for Lenovo S800 phone, offering a transparent colour display
Panasonic relationship extended beyond digital cordless to also supply PMICs for their latest feature-rich portable media players
Launch of DA9053 and DA9021, supporting the major ARM multicore mobile graphics and application processor families
Q4Samsung announced as latest customer using Dialog’s Power Management and audio in a stacked die single package, targeting Android-based TD-SCDMA smartphones for China Mobile operator
Dialog awarded the prestigious Global Semiconductor European Semiconductor Company of the Year award for the third year in succession
Q3Dialog’s Green VoIP ICs adopted by Gigaset for their latest new pro range of phones
Adlink Technology in Taiwan adopt Dialog’s Intel Atom Companion PMICs for their nanoX-TC Industrial PC modules
Launch of SmartPulse™ DECT Ultra low energy wireless sensor modules for personal medical and home automation applications
Panasonic announced as first customer utilising SmartPulse™ technology for wireless home security sensors
Source: Gartner/Dialog 2011 Source: Arete Research/Dialog Marketing 2011 Source: IMS research 2011
SMARTPHONE MARKET (billion units)
1.2
1.0
0.8
0.6
0.4
0.2
011 12 13 14 15
TABLET PC MARKET (million units)
200
150
100
50
011 12 13 14 15
WORLD MARKET FOR SHORT-RANGE WIRELESS ICs (billion units)
4.5
3.0
1.5
011 12 13 14 15

Dialog Semiconductor Plc | Annual report and accounts 2011 | Section 1 | Overview04
...personal

05
Dialog’s advanced power management ICs can be found at the heart of these personal portable devices ensuring consumers can work, play and communicate whenever and wherever life takes them without compromising on battery life.
“With the recent addition of short-range wireless technologies to our portfolio, in addition to managing the power budget of personal portable connected devices, Dialog’s strategy in the future is to also provide the wireless connectivity part of the solution. This will help us to continue to drive sales growth and maintain our leadership position in these markets through an expanding product portfolio and broader customer base.”ANDREW AUSTINVICE PRESIDENT, SALES
WIRELESS PERSONAL PORTABLE INTERNET CONNECTED DEVICES ARE BECOMING AN INCREASING PART OF OUR DAILY LIVES. TODAY, IT IS NOT UNCOMMON TO SEE FAMILIES COMMUNICATING WITH MULTIPLE SMARTPHONES AND TABLET PCS, IN ADDITION TO HAVING OTHER PORTABLE GAMING DEVICES. GOING FORWARD, THIS TREND WILL FURTHER ACCELERATE AS PERSONAL AREA NETWORKS (PANS) FURTHER EVOLVE WITH THE ADDITION OF HEALTH MONITORING AND FITNESS TYPE DEVICES.

Dialog Semiconductor Plc | Annual report and accounts 2011 | Section 1 | Overview06
2011 HAS BEEN ANOTHER GOOD YEAR FOR DIALOG SEMICONDUCTOR PLC, WITH REVENUE UP 78% YEAR-ON-YEAR TO US$527 MILLION AND THE SUCCESSFUL INTEGRATION OF SITEL SEMICONDUCTOR BV.
The Company continues its strategy of deeper and broader relationships with existing customers (more complex solutions sold into new and existing applications) whilst at the same time increasing the number of new customers. The SiTel acquisition has undoubtedly helped the Company bring on board new significant customers such as Microsoft, Gigaset and Plantronics.
I believe the Company is firmly on the way to achieving the goal of US$1 billion plus annual revenues. The Company continues to work towards ensuring it has the necessary infrastructure to support a US$1 billion turnover business with global reach, whilst at the same time maintaining best industry metrics not only in terms of quality control but also financially, where profitability has to be carefully managed, given the competing pressures of the price expectation of volume customers and supply constraints.
As last year, despite the troubled economic environment, I remain confident about the future growth prospects of the Company in 2012 and thank you for your continued support.
GREG REYESCHAIRMAN
Chairman’s statement
GREG REYESCHAIRMAN

07
DIALOG CONTINUES TO GAIN THE CONFIDENCE OF THE MARKET, BOTH IN EUROPE AND THE US, WITH MANY NEW LONG-TERM ORIENTED INSTITUTIONAL SHAREHOLDERS ADDED.
SHARE PRICE DEVELOPMENTThe following graphs chart the cumulative Shareholder return of the Company for the past 12 months and for the past five years, compared with selected technical benchmark indices – Germany’s TecDAX index – which Dialog itself entered in September 2009, and the Philadelphia SE Semiconductor index (“SOX”).
In 2011 Dialog’s share price started at €17.45 and reached a high of €19.85 on 12 January. On 9 August it declined to a low of €9.82 but recovered immediately, trading around €11 to €15 for the remaining months and closing at €12.58 on 30 December.
As can be seen from the graph below, in 2011 Dialog’s share price performance was in line with the market, following trends similar to that of TecDAX and SOX. In spite of the tough market conditions, Dialog managed to perform in line with its peer group* when benchmarked against TecDax. In the last three years, 2009-2011, Dialog has recorded remarkable growth, outperforming TecDAX by over 1,700% and SOX by more than 1,600%. During these years share price grew by approximately 1,900% and share liquidity increased by about 98%.
* Note: Peer group Index constituents: Wolfson Microelectronics plc, Texas Instruments Inc., STMicroelectronics NV, Skyworks Solutions Inc., Nordic Semiconductor ASA, Microsemi Corp., Micrel Inc., Melexis NV, MaxLinear, Inc., Maxim Integrated Products Inc., Linear Technology Corp., Intersil Corporation, Infineon Technologies, CSR plc, Cirrus Logic Inc., Broadcom Corp., Austriamicrosystems AG, Aixtron SE
Dialog Semiconductor shares in 2011
2011 12-MONTH DIALOG SEMICONDUCTOR SHARE PRICE PERFORMANCE (%)
JAN 11 FEB 11 MAR 11 APR 11 MAY 11 JUN 11 JUL 11 AUG 11 SEPT 11 OCT 11 NOV 11 DEC 11
DIALOG SEMICON. (XTRA: DLG) GERMAN TECDAX (PRICE RETURN) – INDEX PHILADELPHIA SE SEMICONDUCTOR SECTOR INDEX
15.00
10.00
5.00
0.00
-5.00
-10.00
-15.00
-20.00
-25.00
-30.00
-35.00

Dialog Semiconductor Plc | Annual report and accounts 2011 | Section 1 | Overview08
2007-2011 DIALOG SEMICONDUCTOR SHARE PRICE PERFORMANCE (%)
Jul 2007 Jan 2008 Jul 2008 Jan 2009 Jul 2009 Jan 2010 Jul 2010 Jan 2011 Jul 2011 Jan 2012
DIALOG SEMICON. (XTRA: DLG) GERMAN TECDAX (PRICE RETURN) – INDEX PHILADELPHIA SE SEMICONDUCTOR SECTOR INDEX
1.80k
1.60k
1.40k
1.20k
1.00k
800.00
600.00
400.00
-200.00
0.00
200.00
SHARE FUNDAMENTALS FOR THE FINANCIAL YEAR 2011
Total number of shares outstanding and registered as at 31 December 2011 65,068,930Weighted average number of shares during 2011 (basic) 62,872,726Weighted average number of shares during 2011 (diluted) 66,710,864Type OrdinaryPar value (in £) 0.1Bloomberg Symbol DLGReuters Symbol DLGS.DEISIN GB0059822006
KEY FIGURES FOR THE FINANCIAL YEAR 2011 BASED ON WEIGHTED AVERAGE NUMBER OF SHARES (BASIC)
Sales per share (in US$) 8.39Operating profit per share (in US$) 0.98Net profit per share (in US$) 0.89Book value per share as at 31 December 2011 (in US$) 4.18Accounting standards IAS/IFRS
MARKET DATA 2011
Exchange segment Germany Midcap, Prime All Share, Prime Technology, Technology All Share
Designated sponsor Close Brothers Seydler Cheuvreux (as at 1.1.2012)
Market capitalisation as at 31 December 2011 (in millions of €) 819Turnover of shares during 2011 848,331 shares/day
Dialog Semiconductor shares in 2011 continued

09
TRADING IN DIALOG SHARESDialog shares are traded in Germany on the XETRA and Frankfurt regulated official markets, and on all other German regional exchanges on the open market.
DIVIDEND POLICYDialog Semiconductor participates in industries that are considered to be global growth engines and provides its services and products to major players in these industries. Dialog’s Board of Directors is committed to reinvesting all profits into laying the framework for future growth and continues to believe that, in line with the strategic changes under way, this policy is by now in the best interests of all its Shareholders.
INVESTOR RELATIONSDialog Semiconductor understands the importance of clear communication with investors and analysts, particularly during a period of great uncertainty and global economic crisis. During 2011, the management team continued its efforts to ensure that the market was kept up to date with the effect the changing macroenvironment was having on its business, together with the important and exciting changes under way at the Company. Dialog Semiconductor’s shares are now followed by 13 independent financial analysts representing both European and US banking institutions. During 2011, we issued trading updates and quarterly earnings reports, we held our annual analyst conference, presented at several investor conferences and international roadshows in both Europe and the US and, in addition, kept in regular contact with our investors and analysts. In September 2011, we held our first Analyst Day in London, giving our investors and analysts an opportunity to meet with executive management, see the latest product demonstrations and to receive an update on our strategic direction and engineering innovations.
Information provided, including presentations, press releases and reports of the Company, as well as the recommendations of analysts covering the Company, can be downloaded from the corporate Website: www.dialog-semiconductor.com/investor_relations_home.php
TECDAX INDEXDialog was granted entry to the TecDAX index during 2009. The TecDAX tracks the 30 largest and most actively traded companies from the various technology sectors of the Prime Standard segment, excluding those listed in the German DAX index. It is amongst the most important and leading stock indices in Germany and membership is decided by a ranking, based on a company’s free-float market capitalisation and stock market trading volume.
FREE-FLOATDialog’s free-float is 63,801,608 or 97.8% of the outstanding shares. The free-float is calculated by excluding the 1,267,322 shares held in the Dialog Semiconductor Plc Employee Benefit Trust.
The free-float includes the following shares held on behalf of discretionary clients as per the share register on 31 December 2011.
Chase Nominees 5,906,963 9.1%Citigroup Global Markets 4,690,186 7.2%BNP Paribas Securities Services 4,442,968 6.8%State Street 4,241,936 6.5%Societe Generale 1,729,656 2.7%CACEIS Bank 1,632,582 2.5%Allianz Global Investors 1,616,645 2.5%
And 3,003,828 shares (4.6%) held by X-Fab Semiconductor AG as per the share register on 31 December 2011.
DISCLOSURE OF INTERESTSThe provisions of the DTR require that any person or fund acquiring a direct or indirect interest of 3% or more of a class of shares issued by the Company – with voting rights at the Company’s general meeting – must inform the Company of its interest within two working days. If the 3% interest is exceeded, the Shareholder must inform the Company of any increase or decrease of one percentage point in its interest.
With respect to voting rights attached to shares held by investment managers (on behalf of clients), by scheme operators and ICVCs in accordance with DTR 5.1.5, the first threshold for disclosure is set at 5% with the next level set at 10% and every percentage above 10%.
Dialog Semiconductor Plc | Annual report and accounts 2011 | Section 1 | Overview10
“Dialog is leading the mixed signal market in the use of state-of-the-art packaging technologies. It has the capability of stacking multiple integrated circuit dies in a single high-performance, small footprint package, capable of meeting the ever-increasing demands of today’s most advanced smartphones and tablet PCs.”GARY DUNCANVICE PRESIDENT, ENGINEERING
DIALOG IS EXTENDING ITS LEAD IN POWER MANAGEMENT AND HIGH-QUALITY AUDIO ICS FOR SMARTPHONES AND TABLET PCS BY BEING THE FIRST COMPANY TO COMBINE HIGHLY COMPLEX, FULLY CONFIGURABLE SYSTEM POWER MANAGEMENT WITH LOW POWER CLASS D AUDIO CODECS STACKED IN A SINGLE CHIP PACKAGE, INCLUDING A DSP PERFORMING ADVANCED SIGNAL PROCESSING FOR IMPROVEMENT OF AUDIO QUALITY.
...portable

11
“Consumer electronic manufacturers in personal, portable, connected markets build products based on standard application processor platforms. Dialog is a leader in forging strategic partnerships and supplying companion power management ICs with the world’s leading application processor providers to deliver its customers fully optimised system solutions.”MARK TYNDALLVICE PRESIDENT, BUSINESS DEVELOPMENT AND CORPORATE STRATEGY

12 Dialog Semiconductor Plc | Annual report and accounts 2011 | Section 2 | Business review
Business review and strategy
NEW CUSTOMERS ACROSS NEW APPLICATIONS AS A RESULT OF OUR PROCESSOR PARTNER PROGRAMME INITIATIVE
A key element of Dialog’s success is to engage with application processor vendors and develop power management companion chips for their processors. This allows Dialog to become an integral part of their promotional and application ecosystem and reach a much broader customer base without the need for additional sales and support investment. In 2011, Dialog continued to support and expand its relationships with the major application processor vendors within the portable space, including announcing Freescale as the latest processor company to join the programme.
BROADENED OUR CUSTOMER BASE BY LEVERAGING OUR PORTFOLIO OF STANDARD SOLUTIONS
Dialog has increasingly adapted some of its solutions to address multiple customers’ needs, thereby transitioning its portfolio to offer more standard products. In 2011, new products were launched including a third generation of configurable system power management ICs, new audio codecs, low energy green VoIP ICs, a new generation of digital cordless chips as well as SmartPulse™ technology enabling smart home sensor networks.
PERFECTION OF THE FABLESS MODEL WHILE MAINTAINING CLOSE CONTACT WITH OUR MANUFACTURING PARTNERS
Dialog remained focused on its existing business model, which included fully outsourcing silicon wafer production and test to Asian foundry manufacturing plants and test houses, and supplying ASICs and ASSPs using mainstream CMOS and BCD-based process technologies. During 2011, a year of tight wafer capacity, while growing our business to a level of more than 300 million chips, we were again commended by many of our customers for our operational excellence and support.
OUR STRATEGY WAS FURTHER VALIDATED IN 2011 WHEN WE DELIVERED RECORD FINANCIAL AND OPERATIONAL RESULTS. WE HAVE AGAIN ACHIEVED HIGH GROWTH – BEYOND THE INDUSTRY AND OUR PEERS – AND EXITED THE YEAR WITH A STRONG BALANCE SHEET WITH NO DEBT.
Major achievements from Dialog in the execution of its strategy included the following:
ACCRETIVE ACQUISITION OF SITEL SEMICONDUCTOR
Adding US$109 million of revenue in 2011 through the addition of short-range wireless technologies to the portfolio. The acquisition contributed positively to Dialog’s earnings in the first quarter post the acquisition. Through an accelerated integration programme, including a single corporate organisation for the major functions, the products are now sold under the Dialog brand through a unified sales force.
DEEPENED OUR RELATIONSHIPS WITH KEY INDUSTRY TRENDSETTERS AND LEADERS
Dialog has relationships with a number of high-volume customers, many of which are considered trendsetters and key industry leaders in their respective sectors. Dialog has in 2011 continued to focus efforts on these customers to increase both the custom semiconductor content sold into the customers’ platform and broaden the number of platforms addressed. In December 2011, Dialog announced its first platform success at Samsung for a smartphone platform, which will form the basis for a series of phones to be launched through 2012 for the Chinese TD-SCDMA market. The first of these phones has already started production and is being distributed by China Mobile, the largest cellular operator in China.
EXPANDED NORTH AMERICA AND ASIA OPERATIONS WITH ALREADY INCREASED CUSTOMER SUCCESS DEMONSTRATED
Dialog expanded its recently opened office in Silicon Valley to support its growing US customer base and application processor partners and continues to add engineering and sales resources to support local US customers. In Taiwan, Christophe Chene has joined as a new addition to the management team with a charter to further increase the Dialog brand and awareness together with building out a greater footprint for operational, sales and marketing functions in the Greater China region. Both these regions represent exciting growth opportunities for Dialog going forward.

13
Chief Executive’s review
DEAR SHAREHOLDERS,
As we enter into the first half of 2012, it is worth taking a look at the progress of Dialog in the last year. As reported in our financial results, once again Dialog continued to perform very strongly on the top line with growth of 78% year-on-year, outpacing our competitors worldwide, in a backdrop of semiconductor industry growth of 2-3%. This constitutes our fourth consecutive year of profitable and rapid growth, something that our Board, our management team and all our employees have contributed to and are justly proud of. The impressive growth in 2011 was delivered partly through our organic growth and partly through the acquisition of SiTel Semiconductor in Q1 2011, more of which I will discuss later in this letter.
However, as it is commonly known, 2011 at a macro level was dominated by world macroeconomy and financial crisis issues carried over from 2010, compounded by some tragic natural disasters in Japan and Thailand. The impact of all this on the semiconductor industry, and supply chain in particular, was insufficient manufacturing investment, periodic uncertainty about capacity and shortage of certain key essential raw materials and packaging components. The effect of increasing costs in energy, raw material and precious metals such as gold, together with the tightness in the supply chain, had the undesirable effect of impacting the cost base of our products and thereby reducing our gross operating margins as a percentage of revenue, relative to 2010. As we enter 2012, gross margin recovery is now an area where our
management team is currently focused on to bring about improvements through cost reductions and capacity planning as well as positioning the Company to benefit from the prospects of a more balanced supply and demand situation with the manufacturing subcontractors in 2012.
Dialog market performance in 2011 was driven by the major success of our lead customers in the smartphone and tablet PC global markets. This market area is expected to continue to perform strongly for several years as a wider range of smartphones and tablets from different vendors are launched into the market. In line with our belief in the secular growth trends of personal portable connected devices, we have positioned the Company to develop the right technologies such as system power management, low power audio, low power display drivers and others to benefit from this ongoing growth and expansion. We believe that beyond the boom in media players, smartphones, tablets and e-books there will be other emerging portable devices such as ultra-books, as well as personal medical, fitness and sport handheld equipment that will drive further growth for years to come. Following on from this we believe there will be additional capabilities that Dialog must develop or acquire to ensure it maintains its growing leadership in the mixed signal semiconductor market for mobile devices.
In light of the above, we believe competencies in short-range connectivity is a key addition to our portfolio of technology, allowing Dialog’s
DR JALAL BAGHERLICHIEF EXECUTIVE OFFICER

14 Dialog Semiconductor Plc | Annual report and accounts 2011 | Section 2 | Business review
Going forward into 2012 and beyond, our focus will remain on scaling our operation to tackle our next mid-term target of US$ 1billion turnover with an increasing portfolio of mixed signal low power products for portable devices. Diversification of our product portfolio and key customer base with a focus on regional growth in Asia form the main pillars of our strategy.
Achieving a larger scale per se, whilst very desirable, is not a sufficient goal by itself. We believe we should also turn our attention to our social obligations and play our part as good corporate citizens. This means that we will be fine-tuning and augmenting our policies and actions with a conscious eye on the impact on the environment, sustainability and positive social contribution.
Of course, our employees and management team remain the key essential ingredients of success at Dialog and the Company will continue to invest in their development and training, as well as career development and succession planning, to ensure our future is secured.
I look forward to the challenges of the year 2012 and remain confident of Dialog’s prospects for continuing growth and outperformance.
DR JALAL BAGHERLICHIEF EXECUTIVE OFFICER
participation in the upcoming opportunities in new and emerging standards and applications for transmitting data within a short range between, for example, a smartphone device and other client devices or smart sensor networks. In February 2011, we acquired SiTel Semiconductor, a fabless semiconductor company, based in The Netherlands and owned by a private equity fund in the UK. We have been working hard together as a team to achieve a fast and high-quality integration of this company into Dialog, while maintaining the integrity and continuity of operational support for our customers. In addition to our established customer base, we have welcomed new customers from SiTel to our list, including Panasonic, Gigaset, Microsoft and Plantronics amongst others. We expect to increasingly benefit from this acquisition with cross-selling opportunities of Dialog low power products into the new customer base.
We are very pleased with our first acquisition, the quality of the team and its fit within Dialog. We have been able to accelerate and release several new products which were already in the R&D pipeline before the acquisition, such as a new generation of digital cordless chips, low power VoIP products, as well as SmartPulse™ technology enabling smart home sensor networks. Going forward, the strategic positioning of the R&D will increasingly target short-range wireless emerging standards which could include low energy bluetooth and wifi direct amongst others.
Chief Executive’s review continued
Dialog has established application laboratories at our global sites to allow our field application engineers to work closely with its customers during the critical design-in phase of our products.
Test development is performed in Nabern Germany, reproducing the same test environment and handling interfaces that are used by our offshore test subcontractors.

15
A FOCUS ON HIGH-GROWTH EMERGING APPLICATIONS. DIALOG HAS COMBINED ITS POWER MANAGEMENT AND SHORT-RANGE WIRELESS TECHNOLOGY LEADERSHIP, DELIVERING FULLY OPTIMISED BOTH STANDARD (ASSP) AND CUSTOM (ASIC) MIXED SIGNAL INTEGRATED PRODUCTS.
OUR SOLUTIONSOur solutions address four major markets: (i) portable electronic devices, including smartphones and tablet PCs, (ii) short-range wireless applications like digital cordless, gaming, home automation, (iii) VoIP applications, and (iv) automotive and industrial electronics. The demand for an increased feature set with improved displays in lithium-ion powered portable devices, coupled with the expectation of ever-increasing battery life, is a major driver in the development of our power-saving technology solutions.
With the acceleration of social networking driving increased adoption of smartphones, internet connectivity, photo and video sharing, video streaming and high-quality audio on portable devices make huge demands on battery energy management, as well as on the technology which controls the quality of images and displays. Our skill in developing highly integrated silicon solutions enables our customers to design products which deliver excellent performance as well as market-leading talk and standby times.
As short-range connectivity becomes prevalent in our society, Dialog provides both proprietary and standard
solutions for applications, from cordless phones to wireless headsets to its latest SmartPulse™ to control home sensors. In the future, we expect personal healthcare and fitness monitoring to require short-range transmission to your smartphone for intelligent apps processing and we currently adopt our technology to offer optimised solutions for these markets.
Because of the bandwidth efficiency and low costs by allowing voice and data to run over a single network that VoIP technology can provide, businesses are migrating from traditional copper wire telephone systems to VoIP systems. Dialog provides an energy-efficient – Green VoIP – solution to address this growing market and engages with the leading global VoIP phone manufacturers from large enterprises to the small to medium business (SMB) and growing hotel market for VoIP.
Video must now be transmitted throughout the car, captured outside the car and monitored with extremely low latency to be able to react in real time to the changing external environment. Hi-fi quality is also demanded of the audio system and, of course, better GPS support. Our power management and clock companion ICs for the Intel Atom processor provide an optimum solution for next generation multimedia powered infotainment systems. Additionally, automotive customers use our products in comfort and safety sub-systems, and in the industrial market our products are used in highly integrated smart-power management systems such as intelligent electronic ballasts for fluorescent lighting.
Product technology and key customers
Teamwork with regular and open communication is an inherent part of the Dialog culture.
Dialog supplies integrated circuits with the highest quality, achieving failure rates among the lowest in the industry, meeting stringent automotive industry demands.
Launched in 2011, Gigaset’s IP PRO VoIP desktop phone – DE900 – pictured above, combines VoIP (either through ethernet or wifi) with DECT and bluetooth extensions, based on Dialog’s leading Green VoIP technology.

16 Dialog Semiconductor Plc | Annual report and accounts 2011 | Section 2 | Business review
...connected

17
SmartPulse™ is a low-cost solution that may be very simply configured in a star network configuration. With an already existing connection to the internet via DECT enabled Internet Access Devices (IADs) which are common in Europe, or the latest digital cordless phone, it is very simple to control these sensors remotely via smart applications on your smartphone or tablet PC.
SMARTPULSE™ IS A WIRELESS SENSOR NETWORK CONNECTIVITY SOLUTION BASED ON THE ULTRA LOW ENERGY DECT STANDARD FOR HOME AUTOMATION APPLICATIONS. A SMARTPULSE™-BASED SENSOR CAN LAST UP TO TEN YEARS WITH A SINGLE AAA BATTERY PACK. APPLICATIONS INCLUDE WIRELESS LIGHT SWITCHES, SMOKE OR GAS DETECTORS, SOLAR PANELS, HOME SECURITY OR EVEN MEDICAL PENDANT APPLICATIONS FOR THE ELDERLY.
September 2011 – Dialog Semiconductor launched SmartPulse™, the industry’s first wireless smart sensors based on DECT – ultra low energy technology. The sensors can be used for a broad range of home automation applications.
“The rise of the smartphone and tablet PC has led to a shift that enables ease of control. By connecting SmartPulse™ devices to the web consumers can seamlessly and securely control multiple home systems simply from anywhere… Dialog’s heritage in power efficiency, combined with our acquired expertise in DECT and IP communications, puts us in a unique position to enable these new consumer applications.”DR ASMUND TIELENSVICE PRESIDENT AND GENERAL MANAGER CONNECTIVITY, AUTOMOTIVE AND INDUSTRIAL GROUP

18 Dialog Semiconductor Plc | Annual report and accounts 2011 | Section 2 | Business review
DESIGN, DEVELOPMENT AND PRODUCTIONWe are justifiably recognised for the quality and feature-rich functionality of our mixed signal integrated circuits, achieving integration levels which we believe are the highest in the industry.
We nevertheless continually work to increase our intellectual property and improve our engineering skill base and technology portfolio.
During 2011, we invested US$90.0 million, or 17.1% of our revenues, in research and development. Our ability to develop mixed signal ASIC and Application Specific Standard Product (“ASSP”) designs rapidly enables us to respond to customers’ needs for new solutions that increase performance, while at the same time reducing cost. Our strategy of modifying and reusing a wide set of specialised analogue building blocks speeds up the design process; in addition, our use of industry standard design tools increases the level of automation and the quality of verification in our products. Our commitment to continuously deepen our expertise has resulted in increased levels of integration and product innovation in all business sectors.
POWER MANAGEMENT AND AUDIO ICSEffective power management for ever-increasing feature-rich portable devices such as tablet PCs presents increasingly new design challenges. For example, the introduction of dual or quad ARM processor cores into the application processor which needs to be powered up and down in a particular sequence or operate in different sleep modes; increased peak currents due to lower geometry technologies; lithium-ion type batteries needing to charge faster, safer and from a wider variety of sources such as USB ports; changing chemical structures of batteries; in addition to displays which are required to be brighter, bigger and incorporate touch functionality with the use of new organic substrate materials.
All these trends impact the power management IC directly, and we constantly evolve our core technology and intellectual property to extend our market-leading status. With a long legacy of delivering different power management designs for world-leading mobile phone manufacturers and portable consumer OEMs, we optimise all aspects of the design, including electrical, thermal and mechanical (packaging) considerations. These designs offer unprecedented integration with
multiple power management and analogue functions on the chip, including programmable high-performance LDOs (low dropout voltage regulators), high-efficiency DC-DC voltage converters, intelligent battery charging circuits, software programmable LED drivers, sensor ADCs, USB interfaces, and multichannel audio capabilities. By capitalising on our experience in integrating high- and low-voltage circuits on CMOS – the most widely used semiconductor technology – and combining it with our experience in developing and integrating high-performance CODECs and other analogue functions, we are able to offer a selection of differentiated power management and audio solutions. The integration of more than 40 different functions on a single chip delivers significant space, power and cost savings to our customers.
Continuous innovation and perfection of our power management IP portfolio allows our customers to typically save 30% of the power consumed in their portable devices.
In 2011, we launched a new class of power management product – DA9053 – our third generation of advanced system power management integrated circuit (PMIC) and flagship product, targeting high-end multicore-based applications, supporting the ARM Cortex™ processor. Additionally, a second member of the family – DA9021 – addresses lower power cost sensitive applications.
DISPLAY DRIVERS AND RELATED-SYSTEM ICSIn 2011, Dialog provided the SmartXtend™ IC technology together with TDK OLED glass module (operations later in 2011 acquired by Futaba) to the cellphone industry. Lenovo in China was the first customer to bring a SmartXtend™ feature phone – S800 – to the market incorporating a transparent display based on SmartXtend™.
Dialog Semiconductor partners with Qualcomm to exclusively supply driver ICs for their MEMs-based Mirasol™ technology. 2011 saw the first design wins of this technology in e-reader type applications. Qualcomm’s Mirasol™ colour display (wide viewing angle, readability in sunlight with very low power consumption and fast response time) is seeing increased adoption, with Qualcomm investing a reported US$1 billion on a new manufacturing site for mass production of Mirasol™ displays.
Product technology and key customers continued
Testing and monitoring integrated circuits first at a wafer level, ensures Dialog can reach optimum production yields of a final packaged integrated circuit.

19
AUTOMOTIVE AND INDUSTRIAL SYSTEM ICSDialog supplies motor control ASICs to a leading European automotive supplier who in turn delivers Dialog-based windscreen wiper motor products addressing mid- to high-end European cars. Additionally, our first product for a customer in Japan achieved qualification in 2011 and will shortly start production.
These devices capitalise on Dialog’s expertise and knowledge of technology, ranging from power management systems and mixed signal design, to high voltage circuits and embedded microprocessors on a single integrated circuit in an automotive- qualified CMOS process (including flash memory).
For the industrial market, Dialog develops innovative control ASICs, both for conventional light sources, such as fluorescent or high-intensity discharge (“HID”) lamps, and for emerging LEDs. These devices seek to deliver optimal control and regulation of light sources, while maximising their service life. Through intelligent control, using advanced digital signal processing, these devices help to minimise energy consumption.
MANUFACTURE, ASSEMBLY AND TESTINGWe outsource our wafer production to selected foundries, principally in Singapore and Taiwan, which provide high-quality products and have the ability to meet both our stringent qualification requirements and tight deadlines. In 2011, in addition to CMOS, through a close cooperation with TSMC we have seen volume production of our first products using a BCD process which enables higher voltage functionality to be integrated efficiently into single chip power management ICs.
The final assembly of our chips is outsourced to a number of qualified subcontractors in Asia. Our test programmes, based on our own and individual customers’ specifications, are developed by our test engineers in parallel with the design process. All test development is undertaken at our Nabern facility in Germany using the same type of test equipment and handling interfaces that are used by our offshore test subcontractors in order to speed up the volume ramp and production transfer process. All production testing and warehousing of final product is outsourced to our Asian test subcontract partners, enabling direct drop shipments to our end customers. We have also created a specialist offshore operations and a support centre in Taiwan. We have our own manufacturing and technical engineers close to foundries, and assembly and test subcontractors in Asia. By being “on the spot” to resolve any potential engineering issues quickly, they can forestall potential delays in production.
QUALITY AND ENVIRONMENT CONTROLWe have an uncompromising approach to quality assurance in every area of our operations and an uncompromising goal to deliver “zero fail” products. Active employee participation in error prevention approaches has enabled us to win the approval of all our major customers and to beat their parts per million (ppm) failure rate expectations. The overall objective of our quality management system is to provide all our customers with the assurance that our products and services not only fulfil their current contractual requirements, but will also meet their future needs. We are committed to minimising our impact on the environment by developing and promoting environmentally compatible products, and operate in accordance with the ISO 14001 international environmental quality standard. We continuously promote awareness and knowledge of environmental issues throughout the organisation to ensure that they become a natural part of the decision-making process. As we demand the same standards from our suppliers we only form supply partnerships with those who are accredited to the same international quality standards. For more detailed information on specific products, please see our Website: www.dialog-semiconductor.com.
PRINCIPAL CUSTOMERSMany of Dialog’s principal customers are leading portable device digital cordless, automotive and industrial equipment manufacturers that purchase both ASICs and ASSPs solutions. Customers with a significant contribution to revenue include Apple, Gigaset, Panasonic, RIM (Research in Motion) and Bosch. These top five customers represented 83% of revenue in 2011.
Given the rapidly evolving nature of the technology used in Dialog’s target markets, the Company strives to develop long-term relationships with its major customers and seeks to adopt a partnership approach for both standard products and custom solutions. Customers look to Dialog for high integration, innovation and technical expertise, while close working relationships with customers provide Dialog with an opportunity to develop and refine market-leading products with recognised industry leaders.
Dialog engages directly with its customers during the product definition stage, to ensure we capture our customers’ required features in our final integrated circuit product.
Dialog Semiconductor Plc | Annual report and accounts 2011 | Section 2 | Business review20
“Our guiding principles remain the same: robust platforms; tight controls; and sustained, profitable growth.” Jean-Michel Richard, CFO, Vice President Finance
The following tables detail the historical consolidated statements of the operations of Dialog for the years ended 31 December 2011 and 2010:
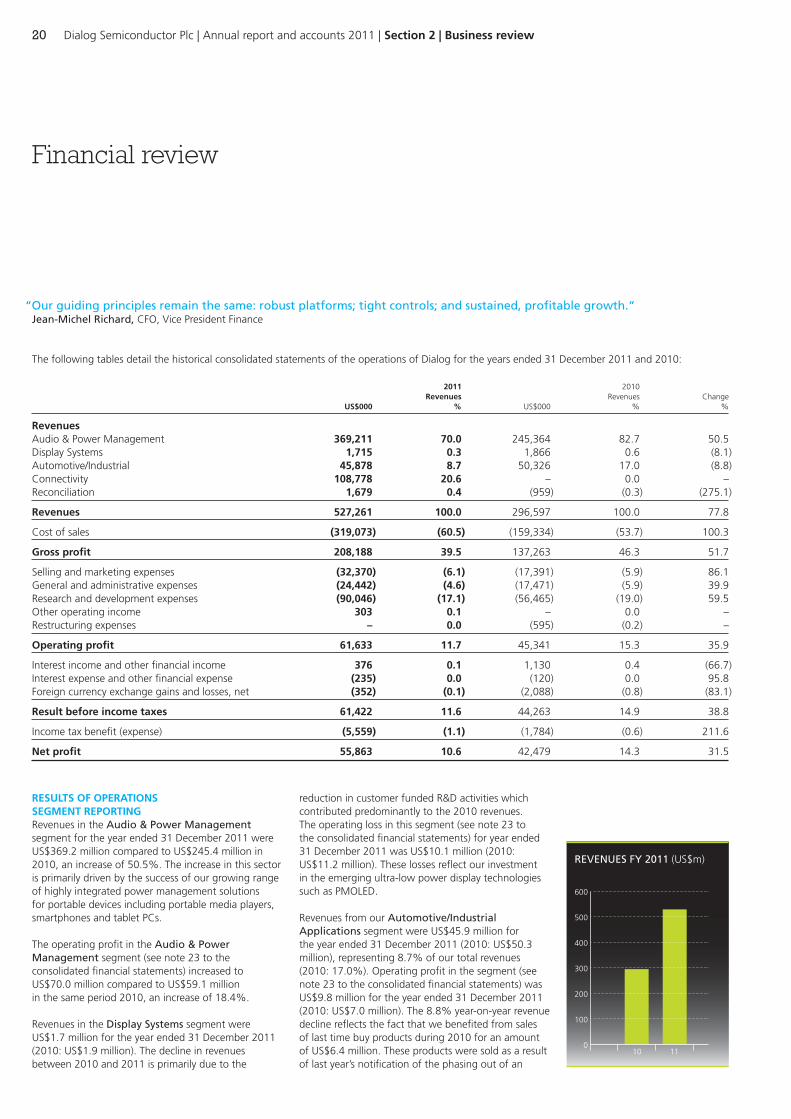
2011 2010 Revenues Revenues Change US$000 % US$000 % %
RevenuesAudio & Power Management 369,211 70.0 245,364 82.7 50.5Display Systems 1,715 0.3 1,866 0.6 (8.1)Automotive/Industrial 45,878 8.7 50,326 17.0 (8.8)Connectivity 108,778 20.6 – 0.0 –Reconciliation 1,679 0.4 (959) (0.3) (275.1)
Revenues 527,261 100.0 296,597 100.0 77.8
Cost of sales (319,073) (60.5) (159,334) (53.7) 100.3
Gross profit 208,188 39.5 137,263 46.3 51.7
Selling and marketing expenses (32,370) (6.1) (17,391) (5.9) 86.1General and administrative expenses (24,442) (4.6) (17,471) (5.9) 39.9Research and development expenses (90,046) (17.1) (56,465) (19.0) 59.5Other operating income 303 0.1 – 0.0 –Restructuring expenses – 0.0 (595) (0.2) –
Operating profit 61,633 11.7 45,341 15.3 35.9
Interest income and other financial income 376 0.1 1,130 0.4 (66.7)Interest expense and other financial expense (235) 0.0 (120) 0.0 95.8Foreign currency exchange gains and losses, net (352) (0.1) (2,088) (0.8) (83.1)
Result before income taxes 61,422 11.6 44,263 14.9 38.8
Income tax benefit (expense) (5,559) (1.1) (1,784) (0.6) 211.6
Net profit 55,863 10.6 42,479 14.3 31.5
RESULTS OF OPERATIONSSEGMENT REPORTINGRevenues in the Audio & Power Management segment for the year ended 31 December 2011 were US$369.2 million compared to US$245.4 million in 2010, an increase of 50.5%. The increase in this sector is primarily driven by the success of our growing range of highly integrated power management solutions for portable devices including portable media players, smartphones and tablet PCs.
The operating profit in the Audio & Power Management segment (see note 23 to the consolidated financial statements) increased to US$70.0 million compared to US$59.1 million in the same period 2010, an increase of 18.4%.
Revenues in the Display Systems segment were US$1.7 million for the year ended 31 December 2011 (2010: US$1.9 million). The decline in revenues between 2010 and 2011 is primarily due to the
reduction in customer funded R&D activities which contributed predominantly to the 2010 revenues. The operating loss in this segment (see note 23 to the consolidated financial statements) for year ended 31 December 2011 was US$10.1 million (2010: US$11.2 million). These losses reflect our investment in the emerging ultra-low power display technologies such as PMOLED.
Revenues from our Automotive/Industrial Applications segment were US$45.9 million for the year ended 31 December 2011 (2010: US$50.3 million), representing 8.7% of our total revenues (2010: 17.0%). Operating profit in the segment (see note 23 to the consolidated financial statements) was US$9.8 million for the year ended 31 December 2011 (2010: US$7.0 million). The 8.8% year-on-year revenue decline reflects the fact that we benefited from sales of last time buy products during 2010 for an amount of US$6.4 million. These products were sold as a result of last year’s notification of the phasing out of an
Financial review
REVENUES FY 2011 (US$m)
600
500
400
300
200
100
010 11

21
Along with the increasing revenues, selling and marketing expenses increased from 5.9% of total revenues in 2010 to 6.1% of total revenues in the year ended 31 December 2011.
Excluding the share-based compensation impact, and in 2011 the costs in connection with the SiTel acquisition, the underlying* selling and marketing expenses for 2011 were US$25.9 million (4.9% of revenues) compared to US$15.8 million or 5.3% in 2010.
GENERAL AND ADMINISTRATIVE EXPENSESGeneral and administrative expenses consist primarily of personnel and support costs for our finance, human resources and other management departments. In 2011, general and administrative expenses increased to US$24.4 million (2010: US$17.5 million). This increase predominantly reflects the consolidation of the newly acquired SiTel business which contributed US$4.2 million of general and administrative expenses and the SiTel transaction costs of US$3.3 million. For the year ended 31 December 2011, general and administrative expenses as a percentage of revenues were 4.6% (2010: 5.9%). The underlying* general and administrative expenses were US$19.9 million or 3.8% of revenues in 2011. This compares to US$12.2 million (4.1% of revenues) in 2010.
RESEARCH AND DEVELOPMENT EXPENSES Research and development expenses consist principally of design and engineering-related costs associated with the development of new Application Specific Integrated Circuits (“ASICs”) and Application Specific Standard Products (“ASSPs”). Research and development expenses (net of customer funded projects) increased to US$90.0 million in 2011 (2010: US$56.5 million). The absolute US dollar increase in research and development expenses was primarily due to an increased headcount of our R&D personnel in support of our growth strategy. A major part of this headcount increase comes from the newly acquired SiTel business, which contributed US$21.0 million of research and development expenses (including amortisation expenses resulting from the purchase price allocation). As a percentage of total revenues research and development expenses decreased from 19.0% (2010) to 17.1% (2011), resulting from a higher revenue base in the latter period.
OTHER OPERATING INCOME, RESTRUCTURING EXPENSESOther operating income of US$0.3 million in the year ended 31 December 2011 relates to the unexpected settlement against receivables which had been written down in 2006 as a result of the insolvency of BenQ Mobile. For further information please refer to note 26 to the consolidated financial statements. Restructuring expenses of US$0.6 million recorded in 2010 are related to the closure of our Heidelberg (Germany) Design Centre.
older manufacturing process from one of our foundry partners.
Revenues from our Connectivity segment were US$108.8 million. These revenues are associated with the SiTel business acquired in 2011. The operating profit achieved in the connectivity segments (see note 23 to the consolidated financial statements) was US$4.9 million.
REVENUES Total revenues for the year ended 31 December 2011 were US$527.3 million (2010: US$296.6 million). This increase of 77.8% results predominantly from higher sales volumes in our Audio & Power Management segment and the revenue from our Connectivity segment as described above.
COST OF SALESCost of sales consists of material costs, the costs of outsourced production and assembly, related personnel costs and applicable overhead and depreciation of test and other equipment. For the year ended 31 December 2011, cost of sales increased by 100.3% to US$319.1 million (2010: US$159.3 million), resulting from increased revenues recorded during the year. The newly acquired SiTel business contributed US$63.5 million to the cost of sales of the Group. As a percentage of total revenues, cost of sales in the same periods increased from 53.7% to 60.5%. The underlying* cost of sales for 2011 was US$316.0 million (59.9% of revenues) compared to US$158.9 million (53.6% of revenues) in 2010.
GROSS PROFITGross profit for the year ended 31 December 2011 was US$208.2 million (2010: US$137.3 million). Our gross profit decreased from 46.3% of revenues in 2010 to 39.5% of revenues for the year ended 31 December 2011, driven by lower cost of sales as a percentage of revenue and the accelerated introduction of new products as prescribed above.
SELLING AND MARKETING EXPENSESSelling and marketing expenses consist primarily of salaries, sales commissions, travel expenses, advertising and other marketing costs. In 2011, selling and marketing expenses increased to US$32.4 million (2010: US$17.4 million) mainly as a result of the consolidation of the newly acquired SiTel business which contributed, US$13.5 million of selling and marketing expenses (including amortisation expenses resulting from the purchase price allocation). The increase is also in line with increased production volume and is a result of the Company’s investment in creating value by increasing staff in strategic marketing functions.
COST OF SALES AS % OF REVENUE FY 2011
70
60
50
40
30
20
10
010 11
Dialog Semiconductor Plc | Annual report and accounts 2011 | Section 2 | Business review22
LIQUIDITY AND CAPITAL RESOURCESCASH FLOWSCash generated from operating activities was US$69.6 million (2010: US$52.0 million). The cash inflow in 2011 primarily resulted from the operating income (before depreciation, amortisation and other non-cash effective expenses), and an increase in trade accounts payable. This cash inflow was partly offset by cash used for the purchase of inventory and an increase in trade accounts receivable. The cash inflow in 2010 primarily resulted from the operating income (before depreciation, amortisation and other non-cash effective expenses), a decrease in trade accounts receivable and higher trade accounts payable. This cash inflow was partly offset by an increase in inventory balances and a reduction in tax liabilities.
Cash used for investing activities in 2011 was US$116.1 million (2010: cash used US$15.5 million). Cash used for investing activities in 2011 consisted mainly of the net cash outflow in connection with the SiTel acquisition in the amount of US$84.2 million (2010: nil), the purchase of tooling (masks), laboratory equipment, probe cards, load boards and other advanced test equipment for a total of US$21.2 million (2010: US$9.8 million), the purchase of intangible assets of US$5.4 million (2010: US$5.9 million) and payments related to capitalised development costs of US$5.2 million (2010: US$2.8 million).
LIQUIDITYAt 31 December 2011 we had cash and cash equivalents of US$113.6 million (31 December 2010: US$158.2 million). The decrease stands in connection with the cash outflow relating to the SiTel acquisition. The working capital (defined as current assets minus current liabilities) was US$150.8 million (31 December 2010: US$169.2 million).
If necessary, we have available for use a multi-currency 3 years (2010-2013) revolving credit line facility of £10.0 million at a rate of LIBOR +150bp and a 3 year (2011-2014) revolving credit facility of US$35.0 million that bears interest at a rate of LIBOR +140bp. At 31 December 2011 and 2010 we had no amounts outstanding under these facilities. In addition, we have two factoring agreements which provide the Company with up to US$42.0 million of readily available cash. Accordingly, we believe the funding available from these and other sources will be sufficient to satisfy our working capital requirements in the near to medium term if needed.
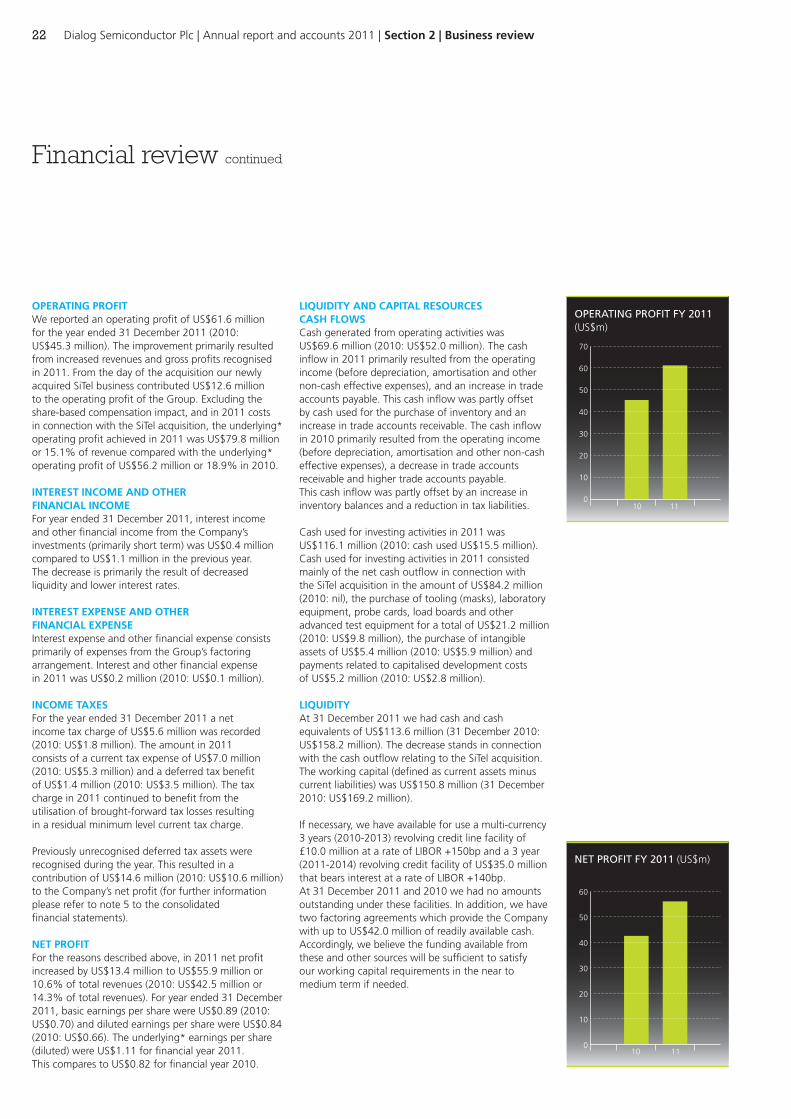
OPERATING PROFITWe reported an operating profit of US$61.6 million for the year ended 31 December 2011 (2010: US$45.3 million). The improvement primarily resulted from increased revenues and gross profits recognised in 2011. From the day of the acquisition our newly acquired SiTel business contributed US$12.6 million to the operating profit of the Group. Excluding the share-based compensation impact, and in 2011 costs in connection with the SiTel acquisition, the underlying* operating profit achieved in 2011 was US$79.8 million or 15.1% of revenue compared with the underlying* operating profit of US$56.2 million or 18.9% in 2010.
INTEREST INCOME AND OTHER FINANCIAL INCOMEFor year ended 31 December 2011, interest income and other financial income from the Company’s investments (primarily short term) was US$0.4 million compared to US$1.1 million in the previous year. The decrease is primarily the result of decreased liquidity and lower interest rates.
INTEREST EXPENSE AND OTHER FINANCIAL EXPENSEInterest expense and other financial expense consists primarily of expenses from the Group’s factoring arrangement. Interest and other financial expense in 2011 was US$0.2 million (2010: US$0.1 million).
INCOME TAXESFor the year ended 31 December 2011 a net income tax charge of US$5.6 million was recorded (2010: US$1.8 million). The amount in 2011 consists of a current tax expense of US$7.0 million (2010: US$5.3 million) and a deferred tax benefit of US$1.4 million (2010: US$3.5 million). The tax charge in 2011 continued to benefit from the utilisation of brought-forward tax losses resulting in a residual minimum level current tax charge.
Previously unrecognised deferred tax assets were recognised during the year. This resulted in a contribution of US$14.6 million (2010: US$10.6 million) to the Company’s net profit (for further information please refer to note 5 to the consolidated financial statements).
NET PROFITFor the reasons described above, in 2011 net profit increased by US$13.4 million to US$55.9 million or 10.6% of total revenues (2010: US$42.5 million or 14.3% of total revenues). For year ended 31 December 2011, basic earnings per share were US$0.89 (2010: US$0.70) and diluted earnings per share were US$0.84 (2010: US$0.66). The underlying* earnings per share (diluted) were US$1.11 for financial year 2011. This compares to US$0.82 for financial year 2010.
Financial review continued
NET PROFIT FY 2011 (US$m)
60
50
40
30
20
10
010 11
OPERATING PROFIT FY 2011 (US$m)
70
60
50
40
30
20
10
010 11

23
Dialog Semiconductor’s financial performance for FY 2011 is summarised below: 2011 2010
US$000 IFRS Share options SiTel acquisition Underlying* IFRS Adjustment Underlying*
Revenues 527,261 – – 527,261 296,597 – 296,597Cost of sales (319,073) (499) (2,552) (316,022) (159,334) (460) (158,874)
Gross profit 208,188 (499) (2,552) 211,239 137,263 (460) 137,723
Selling and marketing expenses (32,370) (1,115) (5,428) (25,827) (17,391) (1,603) (15,788)General and administrative expenses (24,442) (1,211) (3,291) (19,940) (17,471) (5,305) (12,166)Research and development expenses (90,046) (3,410) (679) (85,957) (56,465) (3,485) (52,980)Other operating income 303 – – 303 – – –Restructuring expenses – – – – (595) – (595)
Operating profit 61,633 (6,235) (11,950) 79,818 45,341 (10,853) 56,194
Interest income and other financial income 376 – – 376 1,130 – 1,130Interest expense and other financial expense (235) – – (235) (120) – (120)Foreign currency exchange gains and losses, net (352) – – (352) (2,088) – (2,088)
Result before income taxes 61,422 (6,235) (11,950) 79,607 44,263 (10,853) 55,116
Income tax benefit (expense) (5,559) – – (5,559) (1,784) – (1,784)
Net profit 55,863 (6,235) (11,950) 74,048 42,479 (10,853) 53,332
Earnings per share (in US$) Basic 0.89 (0.10) (0.19) 1.18 0.70 (0.18) 0.88Diluted 0.84 (0.09) (0.18) 1.11 0.66 (0.17) 0.82
* Underlying results are based on IFRS, adjusted to exclude share-based compensation charges of US$6.2 million (2010: US$10.9 million), excluding one-time costs of US$3.3 million associated with the acquisition of SiTel Semiconductor (“SiTel”) incurred during 2011, excluding US$6.4 million of amortisation of intangibles associated with the acquisition of SiTel and excluding amortisation expenses of US$2.2 million in relation to previously capitalised R&D expenses for close to end of life products from SiTel. The term “underlying” is not defined in IFRS and therefore may not be comparable with similarly titled measures reported by other companies. Underlying measures are not intended as a substitute for, or a superior measure to, IFRS measures.
Dialog Semiconductor Plc | Annual report and accounts 2011 | Section 2 | Business review24
Based on the expected positive net result for the near future, the management concluded that it was appropriate to recognise deferred tax assets in an amount of US$17.4 million (2010: US$10.8 million). The assessment was based on the business plan for 2011 and beyond.
Non-current liabilities relate to provisions, capital lease and hire purchase commitments and the fair value of derivative financial instruments.
Shareholders’ equity increased to US$263.1 million (US$205.3 million at 31 December 2010) which is predominantly the result of our net profit. The equity ratio (equity over total assets) was 76.4% (81.0% at 31 December 2010).
Balance sheet total was US$344.5 million at 31 December 2011 (31 December 2010: US$253.4 million). Cash and cash equivalents decreased by 28.2% to US$113.6 million at 31 December 2011 (31 December 2010: US$158.2 million). This decrease is predominantly related to a cash outflow from investing activities in the amount of US$116.1 million which was only partially offset by a cash inflow from operating activities in the amount of US$69.6 million and a cash inflow from the sale of shares in connection with the share option programme in the amount of US$2.3 million. Other current assets increased by 102.0% to US$117.7 million (31 December 2010: US$58.3 million), mainly driven by higher inventory and trade accounts receivable balances.
In 2011, total non-current assets increased by 206.6% to US$113.2 million. This increase is primarily due to the goodwill recorded in connection with the SiTel acquisition, higher balances of property, plant and equipment and intangible assets, again with an amount of US$25.6 million, the major part of this increase relates to the acquisition of SiTel. Also, in 2011, additional net deferred tax assets in the amount of US$6.6 million, principally relating to carried forward losses, were recognised of which US$2.1 million relate to SiTel.
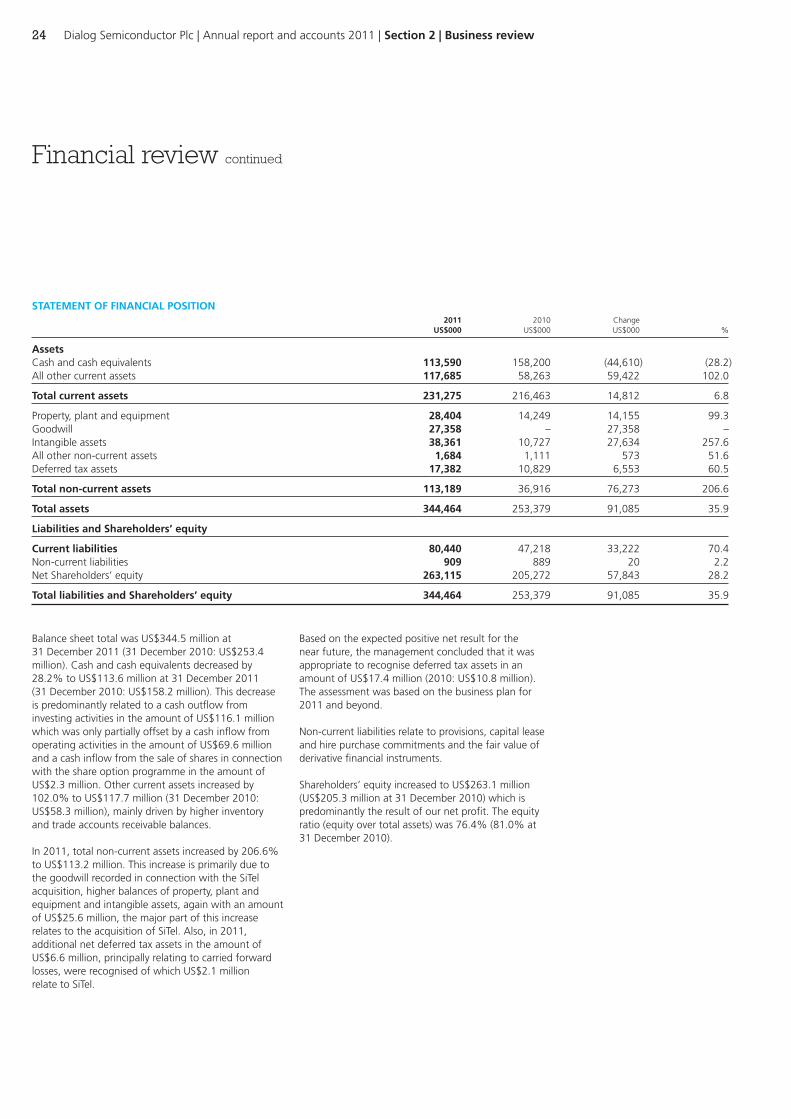
STATEMENT OF FINANCIAL POSITION 2011 2010 Change US$000 US$000 US$000 %
AssetsCash and cash equivalents 113,590 158,200 (44,610) (28.2)All other current assets 117,685 58,263 59,422 102.0
Total current assets 231,275 216,463 14,812 6.8
Property, plant and equipment 28,404 14,249 14,155 99.3Goodwill 27,358 – 27,358 –Intangible assets 38,361 10,727 27,634 257.6All other non-current assets 1,684 1,111 573 51.6Deferred tax assets 17,382 10,829 6,553 60.5
Total non-current assets 113,189 36,916 76,273 206.6
Total assets 344,464 253,379 91,085 35.9
Liabilities and Shareholders’ equity
Current liabilities 80,440 47,218 33,222 70.4Non-current liabilities 909 889 20 2.2Net Shareholders’ equity 263,115 205,272 57,843 28.2
Total liabilities and Shareholders’ equity 344,464 253,379 91,085 35.9
Financial review continued
25
Risks and their management
INTEREST RATE RISKThe Group earns interest from bank deposits and uses money market deposits with highly rated financial institutions. During the year, the Group has held cash on deposit with a range of maturities from one week to three months. This can vary in view of changes in the underlying currency’s interest rates and the Group’s cash requirements. The Group has no long-term debt and no amounts outstanding under short-term credit facilities as at 31 December 2011 (2010: nil). The Group’s policy is to manage its interest income using a mix of fixed and variable interest rate debts. In order to achieve this policy, the Group invests in highly liquid funds having a matching investment strategy. Once the operating business has been financed, short-term excess funds are invested with reputable financial institutions.
CURRENCY RISKThe Company’s functional – and presentational – currency is the US dollar, and the majority of its revenue and expenses are in that currency. There are, however, foreign exchange risks associated with transactions, and recognised assets and liabilities in other currencies, primarily the euro and the pound sterling. Transaction currency exposures arise from sales or purchases in currencies other than the US dollar. We use forward-currency contracts to eliminate our exposure associated with the payment of salaries and wages in other currencies. We maximise the effectiveness of our hedge derivatives by matching the terms and conditions of the hedge to those of the underlying obligation (see note 24 on page 91 for further information).
CREDIT RISKThe Company is exposed to credit risk from its operating activities and certain of its financing activities. We ensure that our exposure to bad debt is minimised by monitoring all customers who trade on credit terms and receivable balances. In order to finance our growth we entered into two factoring agreements with reputable financial institutions. The maximum amount of cash that can be received under these factoring agreements is US$42 million (2010: US$25 million). Since the financial institutions assume all risks associated with the collection of receivables from selected customers, the agreements significantly reduce our risks associated with their collection.
CUSTOMER CONCENTRATION RISKWe refer to note 24 to the consolidated financial statements section “vulnerability due to certain significant risk concentration”.
LIQUIDITY RISKWe monitor our liquidity on a quarterly basis, with the objective of avoiding interest on short-term bank liabilities or overdrafts. Our policy is to structure the maturity of our current financial assets in the Group to meet 100% of the respective maturities and liabilities.
THE MARKETThe market in which we compete is intensely competitive and highly cyclical, and is characterised by continuous development and technological improvement. Our future success depends on our ability to anticipate and respond to new market trends, to implement new designs rapidly to meet customers’ needs, and to keep abreast of the technological changes. As a result, we invest in research and development to enable us to create innovative designs and products on a cost-effective, timely basis.
REVENUE AND PROFITABILITYWe returned to profitability in 2008 after having not been profitable for the prior seven financial years and cannot guarantee that we will remain profitable in the future. But we constantly seek to improve profitability by launching new products and acquiring new customers. Since we continue to rely on a relatively small number of customers for a substantial proportion of our revenue, the loss of one or more of these customers would be likely to have a material effect. Our goal is to spread this risk by acquiring more customers. We are attempting to reduce the risk of our revenues, profitability and growth being affected by a slowdown in the wireless communicat- ions market by winning customers in other sectors.
THIRD-PARTY COSTS AND SUPPLIER RISKSince 2007, we have outsourced our manufacturing and testing to lower-cost environments, mainly in Asia, where there is excellent capacity to overcome the potential problem of an inability to access manufacturing capacity which would result in increased costs and, therefore, decreased revenue. The tightness in the industry supply chain that we have experienced during most of 2011, and with increased demand due to our rapid growth, has impacted our ability to extract price reductions from our suppliers. We believe now as we enter the first quarter of 2012, the situation is stabilising due to investments that most of our suppliers made in extra manufacturing capacity in 2011 and we expect to see a gradual improvement in the supply chain situation from the end of the first quarter of 2012. We remain confident that we will continue to meet our revenue plans with the capacity we have secured with our suppliers. If any of the Company’s suppliers were to become insolvent, there could be a risk of the Company’s production being interrupted.
For this reason, the Company tries to source its components from at least two different suppliers and from different sites. In addition, the Company takes the precautions for supplier insolvency with its risk management system in which information on the creditworthiness of suppliers is kept. This seeks to identify suppliers at risk at an early stage.
INTELLECTUAL PROPERTYWe seek to protect our intellectual property from being copied or used by others by appropriate use of patents, copyrights and trademarks.
Dialog Semiconductor Plc | Annual report and accounts 2011 | Section 2 | Business review26
Sustainability
ENVIRONMENTALThe environmental agenda at Dialog considers climate change environmental protection aspects (air, land and water quality), effective resource management (eco-efficiency) and sustainability. Our commitment to the environment is evidenced by our ISO 14001 certification.
RAW MATERIALSWe take the scarcity of natural resources very seriously and consider the conservation of raw materials, such as metals, to be a top priority. Dialog is continually identifying potential methods to improve existing technologies and substitute alternatives, such as copper, for precious metals without sacrificing quality and performance. We have also implemented a rigorous recycling of precious metals, such as gold and silver, from our waste and damaged product. We have increased the quantity of recovered gold by 300% and recovered silver by 200%. In addition, we are actively reducing the quantity of hazardous substances used in our labs.
ENERGY AND CLIMATEDialog is working to systematically reduce CO2 emissions to minimise the Company’s carbon footprint. The Carbon Disclosure Project recognised Dialog Semiconductor Plc as one of the 10 successful companies achieving the “Scope-2-Indirect CO2 Emission Reduction” with a reduction of 26.3%, and have set a target of 30% by 2014.
PACKING AND RECYCLINGDialog only uses packing material qualified as “green packing”, implementing a “non-wood packing”
CORPORATE RESPONSIBILITYDialog considers that the social challenges of corporate responsibility should be based on fair wages, healthy and safe working conditions, respect for human and labour rights, and honest relationships and commitment to community development. With regard to these challenges, Dialog is committed to the adoption of the Electronics Industry Code of Conduct (EICC) standard as the model for ensuring that working conditions for internal and external suppliers are safe and that all workers are treated with respect and dignity. This commitment is reflected in Dialog’s own “Code of Conduct”, which addresses all the key areas defined in the EICC standard along with recognised standards such as International Labour Organization Standards (ILO), Universal Declaration of Human Rights (UDHR), Social Accountability International (SAI), and the Ethical Trading Initiative (ETI). In addition, the Company complies with the worldwide ISO 14001 Environmental Standard – and requires its suppliers to do the same – in order to ensure that all manufacturing processes are environmentally compliant.
We are currently undertaking a complete audit of our business operations; benchmarking, revising policies and setting targets for improvement on all areas of sustainability, including our: environmental impact, supply chain, employee development, community investment and corporate governance. Our objective is to become an industry leader in sustainability and corporate responsibility.
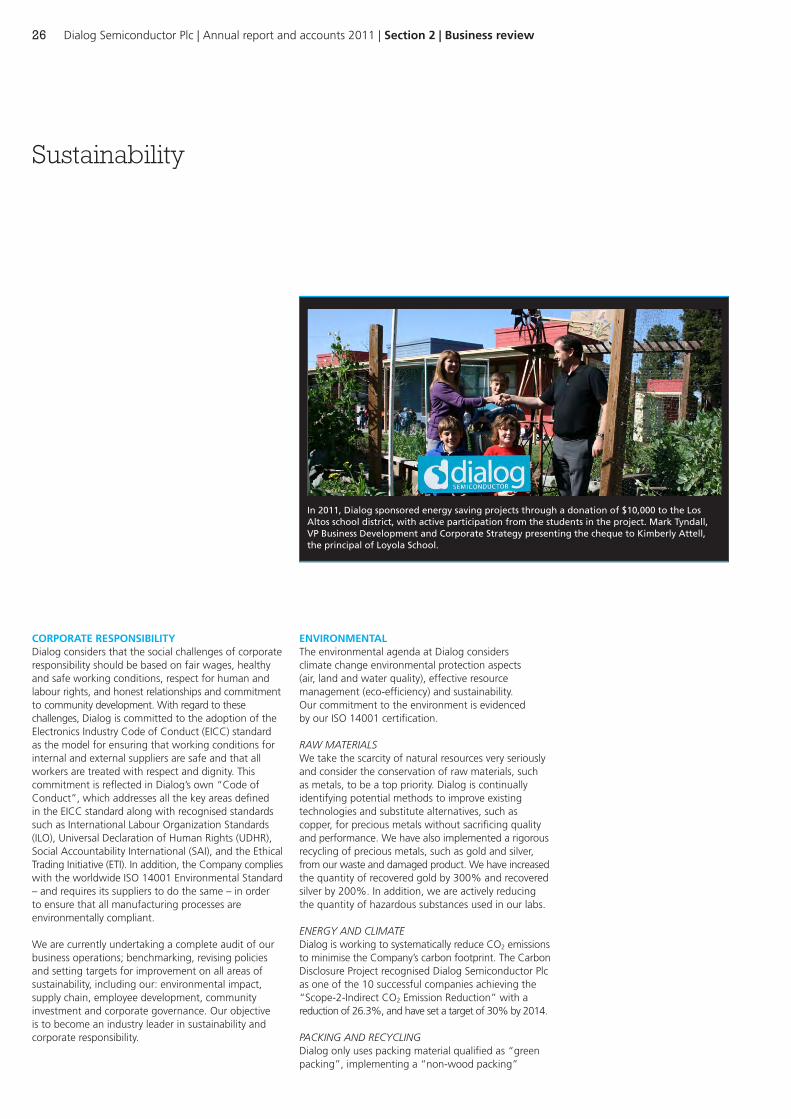
In 2011, Dialog sponsored energy saving projects through a donation of $10,000 to the Los Altos school district, with active participation from the students in the project. Mark Tyndall, VP Business Development and Corporate Strategy presenting the cheque to Kimberly Attell, the principal of Loyola School.

27
SOCIALEMPLOYEE DEVELOPMENTDialog aims to attract and retain the best people by ensuring that all employees receive comprehensive on-the-job formal training, coaching and mentoring. Employees work in a peer group that challenges, motivates, inspires and stretches the imagination – helping individuals to continue to grow and learn in their chosen field. Working in such an innovative environment means the opportunity to continue to learn happens on a daily basis. In parallel, Dialog has a range of specific learning and development initiatives, designed to enable all to develop to their full potential.
Dialog is committed to the training and development of all employees, at all levels of the organisation. Our vision is to develop a positive learning culture which fully supports the development of the individual and the growth of the business. We have a global learning and development strategy that has been written in order to support both the development of the organisation and the individuals within it. Everyone within the organisation has the opportunity to participate in a variety of career advancing training and development programmes.
As well as the wide range of development programmes provided to employees, Dialog has created a Technical Ladder which provides promotional opportunities for those who bring great value to the Company through their technical expertise and want to focus their careers on that know-how rather than on management and leadership. Employees who are successful in gaining a place on the Ladder spend around 20% of their
delivery policy in 2011. We believe that reusing and recycling packing material and waste (inclusive PET and glass bottles used in our working areas) can contribute to the effectiveness of our resource management and sustainability. Our five design locations currently recycle 91% of packing and waste; we are striving for 95% by 2013.
SUPPLIER ENGAGEMENTWe firmly believe that sustainable development can be secured only if we safeguard our valuable resources; therefore, we deal only with suppliers that have similar environmental goals and are also accredited to the ISO 14001 standard. Within our supply chain, we continually emphasis that environmental issues should be an instinctive part of any decision-making process, and suppliers should use environmentally friendly technology to:
● reduce and eliminate emissions of ozone-depleting and other volatile organic chemicals (VOC);
● design and manufacture only environmentally friendly products;
● manage, reduce and dispose of hazardous substances safely;
● monitor and control waste water and solid waste emissions;
● reduce and eliminate all types of waste, including water and energy;
● reduce waste by maximising product yields; and
● ensure all environmental permits are obtained, maintained and kept current.
As a fabless semiconductor company, it is important that all of our manufacturing partners are equally committed to respecting the environment. All Dialog’s major suppliers have committed to our “Code of Conduct”, which reflects our commitment to the Electronics Industry Code of Conduct (EICC). Compliance is monitored through a two-pronged approach: every supplier is required to complete a self-audit questionnaire to identify and document compliance as well as regular on-site audits of all of our major suppliers. In addition, 91% of our major suppliers have their own documented corporate social responsibility policy, which we aim to increase to 100% by the end of 2013.
We are continually working with our suppliers to develop recovery processes, resource-substitution technologies and methods to reduce CO2 emissions throughout the supply chain. We are assessing and developing an all-suppliers policy related to conflict minerals.
Jalal Bagherli, Dialog Semiconductor CEO, at a Silicon Valley event in December 2011, being presented with the prestigious Global Semiconductor Award for the top European Semiconductor company for the third successive year.

Dialog Semiconductor Plc | Annual report and accounts 2011 | Section 2 | Business review28
Sustainability continued
“GIVING BACK” – COMMUNITY DEVELOPMENTDialog is committed to being a responsible member of the community and increased corporate giving by 41% in 2011. A plan has been put in place to continue to do more by setting a target of giving 1% of pre-tax profit by 2015.
During 2011, Dialog significantly ramped up its relations with key universities throughout the UK and Europe. As well as giving the Company access to the brightest graduate talent, it has also afforded us the opportunity to give something back to the community. During 2011 Dialog sponsored three electronics engineering students from UK universities through the UK Electronic Skills Foundation, an organisation that aims to attract students of school and university age into the electronics industry. We have committed to a further three for 2012, and have an ongoing commitment for an additional three per year.
Dialog has also kicked off a programme of industrial scholarships within European universities, notably Karlsruhe and Aalen universities in Germany. During 2011 we sponsored one scholar at each university who received a laptop, an annual bursary, paid work placements, an opportunity for a summer job and an industrial mentor. The target is to add a further four scholars during 2012 at other universities.
In 2011, Dialog implemented a programme to provide prizes and bursaries for various degree programmes, such as two “access bursaries” of £1,000 each at the University of Edinburgh to assist low-income engineering
time on Technical Ladder activities such as researching new initiatives, university relationships, speaking at conferences, internal communication and training.
Clear and consistent communication is achieved through regular Company-wide information sessions, led by the CEO; every effort is made to keep employees fully aware of Company matters that affect them. We encourage employee feedback at all levels for new ideas to improve business efficiency and performance.
EMPLOYEE WELL-BEINGDialog has been implementing a programme of growth and investment in many of our locations, expanding facilities and work space. When we expand or refurbish a site, employee suggestions are incorporated to create an environment that both meets the Company’s business needs while also being a pleasant place in which to work.
Dialog is committed to supporting the health and well-being of its employees. Employees and their families are eligible to participate in non-contributory medical plans where local culture and practice supports this. Additionally, Dialog currently offers a selection of “well-being” initiatives across a variety of locations, including an on-site, free flu vaccination programme, cycle to work schemes and an on-site gym.
Furthermore, a key element of Dialog’s 2012 employee engagement plans is to define and implement further local initiatives that build upon the current health and well-being programmes in place and support the needs of our employees.
Dialog donated €2,000 in total to help to fund a film competition for young people in Kirchheim, Germany to raise awareness of alcohol abuse in children.
Dialog are proud to be associated with Advanced Sports Coaching, who provide sports coaching in safe, happy environments in South West England. Dialog UK also donated a new kit for the under-8 team.

29
Dialog opened its own fitness room at the start of the year in a further step to promote a healthy lifestyle for its employees.
audits and inspections are performed regularly by Dialog to verify its continuing maintenance.
HEALTH AND SAFETYDialog considers a safe and healthy working environment to be essential in the maintenance of employees’ morale and in the production of high-quality and innovative products. As a result, we require our major suppliers to be committed to ensuring the creation of safe and healthy working conditions. We expect them to provide evidence of suitable controls, safe working procedures, preventative maintenance and general protective measures in their working environments. When hazards cannot be adequately controlled by these means alone, suitable protective clothing or equipment is supplied, and evacuation procedures and facilities are in place at Dialog’s and suppliers’ premises.
ETHICSDialog believes that continued success in the semiconductor market can be achieved only by adopting high standards of ethical behaviour when dealing with customers, suppliers and workers.
It is particularly important to protect Intellectual Property (“IP”), which is the key to ensuring the development of innovative solutions to complex problems. Any transfer of technology or know-how is always done in a manner that protects IP rights; effective protection also means that products can be discussed openly with our business partners. The disclosure of information which is related to business activities, structure, our financial situation and performance is always carried out in accordance with applicable regulations and prevailing industry practices. We expect the highest standards of integrity from all Dialog stakeholders; any malpractice is strictly prohibited and may result in immediate termination and legal action.
Neither we nor our suppliers offer or accept inducements or any other means of obtaining undue or improper advantage. We have a “whistle-blower” policy in place to protect employees’ confidentiality and encourage our suppliers to do the same. Dialog’s management system complies with the EICC code. It is certified to the ISO 9001 and ISO 14001 international standard as a formal implementation of the code, is committed to implementing and facilitating continuous improvements and to mitigating operations-related risks. To enable us to comply with all applicable laws, regulations and customer requirements, as required by the code, we also ensure that all our major supply chain partners are accredited to at least the same standard. To ensure that we constantly improve our management systems we regularly review and audit internal and supply chain management systems.
students; and giving cash prizes for best second year project of £800 at Imperial College London.
The range of other activities the Company has been involved in during 2011 includes careers counselling for students, lectures from Dialog engineers as part of university curriculum content, presentations to schools from engineers and employees about electronics as an industry, an active work experience programme, visits to Dialog sites and participation in schools careers days.
In addition, we are undertaking a Company-wide employee volunteerism initiative, and have a formal policy to match all employee contributions or funds raised for charitable causes that are important to our employees and the community. Donations in 2011 included Children in Need (UK), Cancer Research (UK), Welcome Home Ministries Africa (Orphanage in Uganda sponsored by our employees in The Netherlands), The Red Cross Japan (Earthquake/Tsunami appeal), Japan Guide Dog Association, a local charity for children with mental and physical handicaps (Dettingen – Germany), Taiwan Fund for Children and Families (for orphans and needy children), UNICEF (Korea), National Kidney Foundation (Singapore), Children Protection against alcohol abuse campaign (Kirchheim – Germany), local community brass band and youth football club (UK), local Royal Air Force cadets (UK), ORBIS Hong-Kong (fight against preventable blindness), “Steirer helfen Steirern” (Help for the disadvantaged – Austria) and the local fire brigade (Swindon – UK).
GOVERNANCEHUMAN RIGHTS AND CODE OF CONDUCTDialog’s philosophy is that all its suppliers must demonstrate a commitment to upholding workers’ human rights and to treating them with dignity and respect. Standards such as the UDHR, SAI and the ETI have been used as a basis for these requirements. All labour must be given voluntarily and workers must be free to leave their employment on reasonable notice. Child labour must not be used at any stage of manufacturing. Working hours must not exceed the maximum set by local laws and wages must comply with all applicable laws. Dialog and its suppliers must ensure that workers are not threatened or subjected to inhumane or harsh treatment, harassment or any form of unlawful discrimination. Open communication and direct engagement between workers and management is encouraged, even in those countries where there is no meaningful legal protection. In order to promote its philosophy, several new initiatives have been introduced to all of Dialog’s manufacturing partners, including a detailed code of conduct for them to review and implement. Detailed self-audits have been performed by all of our suppliers in order to verify the implementation of this code of conduct, and on-site

30 Dialog Semiconductor Plc | Annual report and accounts 2011 | Section 3 | Management and governance
operations, starting initially with IBM in France and the US. He was previously Senior Vice President and Chief Technology Officer of the Unisem group, an assembly and test subcontractor based in Malaysia and China. He also held the position of Vice President of Test Operations at ASAT based in Hong Kong before becoming one of the original members of the management buy-out team of ASAT UK (Atlantis Technology UK), where he served as the Technical Director. Mohamed holds an Electronic and Electrotechnic degree from the Paris University of Technology.
GARY DUNCANVICE PRESIDENT, ENGINEERINGGary, who joined the Company in 1987, is responsible for the design and development of our semiconductor products. Before joining Dialog, he held senior engineering and management roles at Plessey and ES2.
CHRISTOPHE CHENEVICE PRESIDENT, ASIAChristophe joined Dialog in 2011 as Vice President Asia. He has over 20 years of experience in the semiconductor industry focused on building international businesses and organisations with a strong Asian footprint. Previously based in Taiwan, he served as Senior Vice President and General Manager of the TV Business Unit as well as Senior Vice President of worldwide sales for Trident Microsystems. Prior to that, Christophe served in various international executive and managerial positions at Texas Instruments, Sharp and Xilinx. Christophe holds an electronics engineering degree from INSA, Toulouse.
DR JALAL BAGHERLICHIEF EXECUTIVE OFFICERJalal joined Dialog, as CEO, in September 2005. He was previously Vice President and General Manager of the Mobile Multimedia business unit for Broadcom Corporation and the CEO of Alphamosaic. He has extensive experience of the semiconductor industry through his previous professional and executive positions at Texas Instruments and Sony, and a wealth of knowledge about the Far Eastern, European and North American markets. He is a non-executive Director of Lime Microsystems Ltd.
ANDREW AUSTINVICE PRESIDENT, SALESAndrew joined Dialog in April 2009. He was previously a Sales and Marketing consultant specialising in the semiconductor and high-performance sports industries. He has extensive experience of the semiconductor industry through his previous professional positions at Texas Instruments and Raytheon Systems. Andrew holds a degree in Electrical and Electronics from Hertford University.
MOHAMED DJADOUDIVICE PRESIDENT, GLOBAL MANUFACTURING OPERATIONS AND QUALITYMohamed joined Dialog in March 2007 and is responsible for product engineering, test and assembly development, data automation, software support, offshore manufacturing operations and quality. Mohamed has more than 25 years’ experience in the field of semiconductor manufacturing
Executive management
DR JALAL BAGHERLICHIEF EXECUTIVE OFFICER
ANDREW AUSTINVICE PRESIDENT, SALES
MOHAMED DJADOUDIVICE PRESIDENT, GLOBAL MANUFACTURING OPERATIONS AND QUALITY
GARY DUNCANVICE PRESIDENT, ENGINEERING
CHRISTOPHE CHENEVICE PRESIDENT, ASIA

31
teams can thrive. Prior to Dialog Martin has held a variety of senior and executive HR roles with Medtronic Inc, General Electric (GE) and the Dell Corporation, and most recently was a member of the executive team at C-MAC MicroTechnology, a private equity-backed leader in the high reliability electronics sector. During his career Martin has been located in Asia, continental Europe as well as the United Kingdom.
JEAN-MICHEL RICHARDCFO, VICE PRESIDENT FINANCEJean-Michel joined the Company in September 2006 to head up its finance department. He was previously Finance Director for the Global Manufacturing and Technology Division of ON Semiconductor, in Phoenix, Arizona, and before that held senior finance and treasury positions at ON and Motorola, in Europe and the US. Jean-Michel holds a Masters in Economics from the University of Geneva, Switzerland.
MARK TYNDALLVICE PRESIDENT, BUSINESS DEVELOPMENT AND CORPORATE STRATEGYMark Tyndall joined Dialog Semiconductor as Vice President of Business Development and Corporate Strategy in September 2008. Prior to Dialog, Mark was Vice President of Business Development and Corporate Relations at MIPS Technologies. From 1999 to 2006, he held the position of Vice President of Business Development at Infineon and has also served as a Board Director of a number of start-up companies, several of which were successfully acquired. Earlier in his career, Mark held management positions in marketing at Fujitsu Microelectronics and in design at Philips Semiconductors.
DR ASMUND TIELENSVICE PRESIDENT AND GENERAL MANAGER CONNECTIVITY, AUTOMOTIVE AND INDUSTRIAL GROUPAsmund is Vice President and General Manager of Dialog’s “Connectivity and Automotive and Industrial Business Group”. He joined Dialog in February 2011 through the acquisition of SiTel Semiconductor, where he was CEO and founder. Prior to SiTel, Asmund worked at National Semiconductor as product line director, PMC Sierra as marketing director for ATM chips, and Philips Semiconductor (now NXP) as marketing manager for its digital TV circuits and later for all of its custom/asic products. Asmund obtained his masters degree in Physics (summa cum laude) at Hamburg University and his PhD at the University of Utrecht.
UDO KRATZSENIOR VICE PRESIDENT, GENERAL MANAGER AUDIO AND POWER MANAGEMENT BUSINESS GROUPUdo joined Dialog in May 2006. He is responsible for the Audio and Power Management Business Unit, which makes products for the mobile phone and portable consumer markets. His 20+ years’ experience in the semiconductor industry was gained in general management, senior marketing and engineering at Robert Bosch GmbH, Sony Semiconductor and Infineon Technologies. Udo holds an Electronic Engineering degree from the University for Applied Sciences, Mannheim.
MARTIN POWELLVICE PRESIDENT, HUMAN RESOURCESMartin joined the Company in 2010 and is responsible for developing and driving people strategies in support of Dialog’s business goals and initiatives worldwide, including fostering an environment where Dialog’s
DR ASMUND TIELENSVICE PRESIDENT AND GENERAL MANAGER CONNECTIVITY, AUTOMOTIVE AND INDUSTRIAL GROUP
UDO KRATZSENIOR VICE PRESIDENT, GENERAL MANAGER AUDIO AND POWER MANAGEMENT BUSINESS GROUP
MARTIN POWELLVICE PRESIDENT, HUMAN RESOURCES
JEAN-MICHEL RICHARDCFO, VICE PRESIDENT FINANCE
MARK TYNDALLVICE PRESIDENT, BUSINESS DEVELOPMENT AND CORPORATE STRATEGY

32 Dialog Semiconductor Plc | Annual report and accounts 2011 | Section 3 | Management and governance
Board of Directors
DR JALAL BAGHERLICHIEF EXECUTIVE OFFICER
AIDAN HUGHESNON-EXECUTIVE DIRECTORCHAIR OF AUDIT COMMITTEE
GREGORIO REYESCHAIRMAN
CHRIS BURKENON-EXECUTIVE DIRECTOR
CHRIS BURKENON-EXECUTIVE DIRECTORChris joined the Board in July 2006. He has a career of 30 years in Telecoms and Technology. Post his degree in Computer Science in 1982, he spent 15 years in Nortel Research and Development. Followed by Technology Business Leadership roles as Chief Technology Officer (CTO) in Energis Communications (at time of IPO into the London Stock Exchange), then CTO at Vodafone UK Ltd. Post-Vodafone Chris has made over 20 technology investments from his own investment fund, founded/co-founded a number of start-up companies, and provides a Strategy and Technology Advisory service for some of the biggest technology manufacturers in the industry as well both private and venture investors. Presently Chris serves on the public company boards of Kontron, Tranzeo Wireless, as well as the private company boards of Aicent, Pay Liquid, One Access, Navmii, and Muzicall.
AIDAN HUGHESNON-EXECUTIVE DIRECTOR, CHAIR OF AUDIT COMMITTEEAidan joined the Board in October 2004. He qualified as a Chartered Accountant with Price Waterhouse in the 1980s before taking senior accountant roles at Lex Service Plc and Carlton Communications Plc. He was Finance Director of the Sage Group plc from 1993 until 2000 and, from December 2001 to August 2004, was a director of Communisis Plc. He is a director of, and investor in, a number of UK private technology companies.
GREGORIO REYESCHAIRMANGregorio joined the Board in December 2003. His experience is primarily in data storage and magnetic recording, semiconductors and telecommunications. He was President and CEO of National Micronetics from 1981 to 1984, and Chairman and CEO of American Semiconductor Equipment Technologies from 1986 to 1990. He co-founded Sunward Technologies in 1985 and was Chairman and CEO until 1994. He is currently non-executive Chairman of LSI Logic and a non-executive director of Seagate Technology.
DR JALAL BAGHERLICHIEF EXECUTIVE OFFICERJalal joined Dialog, as CEO, in September 2005. He was previously Vice President & General Manager of the Mobile Multimedia business unit for Broadcom Corporation and the CEO of Alphamosaic. He has extensive experience of the semiconductor industry, through his previous professional and executive positions at Texas Instruments and Sony, and a wealth of knowledge about the Far Eastern, European and North American markets. He is a non-executive director of Lime Microsystems Ltd.

33
RUSS SHAWNON-EXECUTIVE DIRECTORCHAIR OF REMUNERATION AND NOMINATION COMMITTEE
PETER WEBERNON-EXECUTIVE DIRECTOR
JOHN MCMONIGALLNON-EXECUTIVE DIRECTOR
PETER TANNON-EXECUTIVE DIRECTOR
PETER TANNON-EXECUTIVE DIRECTORPeter joined the Board in July 2006. He has held senior management roles across a wide range of technology companies, including Apple Computer, Molex and Flextronics. During more than 30 years’ experience of operating in the Far East he has built up expertise in world-class manufacturing and technology companies. Today, Peter is the Managing Partner of JP Asia Capital, a private equity fund in Singapore. He is also Chairman of SMRT Road Holdings and a director of SMRT Corporation and Innotek.
PETER WEBERNON-EXECUTIVE DIRECTORPeter joined Dialog on 1 February 2006. He brought with him 35 years’ experience, gained at a broad range of companies in the semiconductor sector, including Texas Instruments, Intel, Siliconix, the Temic Group and Netro Corporation. Since 1998 he has been an investor and management consultant, and is a director of a number of companies in Europe and the US. Peter holds an MSEE degree in communications engineering.
JOHN MCMONIGALLNON-EXECUTIVE DIRECTORJohn joined the Board in March 1998. He joined Apax Partners Worldwide LLP in 1990 and was responsible for investments in telecommunications, electronics and software. After leaving Apax he remained on the boards of several companies, including Autonomy Corporation, which was successfully sold in 2011. He currently serves on the boards of several private companies.
RUSS SHAWNON-EXECUTIVE DIRECTOR, CHAIR OF REMUNERATION AND NOMINATION COMMITTEERussell joined the Board in July 2006 and is currently a non-executive director for Unwire A.p.S. and GAME Group plc; he is also the current Chairman of the Marketing Group of Great Britain and an investor in Ariadne Capital’s ACE Fund. Until recently, Russell was the Vice President & General Manager for Skype, with responsibilities for its Mobile Division as well as Europe, Middle East and Africa. Previously, he was at Telefonica where he was the Global Director of Innovation. Before joining Telefonica, he was the Innovation Director at O2, which he joined as Marketing Director in 2005. The strong brand and product range he established resulted in significant customer growth. His 20+ years’ senior marketing and brand management experience in the technology, telecoms and financial services areas has enabled him to bring an excellent level of knowledge to Dialog.

34 Dialog Semiconductor Plc | Annual report and accounts 2011 | Section 3 | Management and governance
GOING CONCERNAfter reviewing the 2012 budget and longer-term plans, the Directors are satisfied that, at the time of approving the financial statements, it is appropriate to adopt the going-concern basis in preparing the financial statements of the Company.
DIVIDENDSThe Directors do not recommend the payment of a dividend (2010: nil). They are committed to re-investing all profits into the business and believe that this policy is in the best interests of its Shareholders.
PURCHASE OF OWN SHARESThe Company operates an Employee Benefit Trust which purchases shares in the Company for the benefit of employees under the Company’s share option scheme, Long Term Incentive Plan and Executive Incentive Plan. Since the Company has de facto control of the assets and liabilities of the Trust, they are included in the Company and Group balance sheets. At 31 December 2011, the Trust held 1,267,322 shares, which represented 1.95% of the total called-up share capital, at a nominal value of £126,732.
SHARE CAPITALDetails of the share capital are set out in note 18 to the consolidated financial statements.
SUBSTANTIAL SHAREHOLDINGSDetails of substantial shareholdings are on page 9 of this annual report.
DIRECTORSThe Directors, together with their biographies, are listed on pages 32 and 33 of this annual report.
DIRECTORS’ REMUNERATION AND INTERESTSDirectors’ remuneration and interests are detailed in the Directors’ remuneration report on pages 38 to 40 of this annual report. No Director had a material interest during the year ended 31 December 2011 in any contract of significance with any Group company.
DIRECTORS’ THIRD-PARTY INDEMNITY PROVISIONSThe Company has granted an indemnity to its Directors against proceedings brought against them by third parties, by reason of their being Directors of the Company, to the extent permitted by the Companies Act 2006. Such indemnity remains in force as at the date of approving the Directors’ report.
ELECTION AND RE-ELECTION OF DIRECTORSIn accordance with the Company’s Articles of Association, one-third of the Directors have to stand for re-election at the Annual General Meeting. The next Annual General Meeting will be held on 24 April 2012 at 9am.
CORPORATE GOVERNANCEThe Company’s Corporate Governance statement is set out on pages 36 and 37 of this annual report.
The Directors of Dialog Semiconductor Plc (“Dialog” or “the Company”) present their annual report and audited financial statements for the year ended 31 December 2011. These accounts have been prepared under IFRS for UK reporting purposes and are available on the Company’s Website: www.dialog-semiconductor.com.
PRINCIPAL ACTIVITIES AND REVIEW OF THE BUSINESSDialog Semiconductor creates highly integrated, mixed signal integrated circuits (ICs) optimised for personal portable, low energy short-range wireless, lighting, display and automotive applications. The Company provides flexible and dynamic support, innovation and the assurance of dealing with an established business partner.
With its focus and expertise in energy-efficient system power management, and now with the recent addition of low energy short-range wireless and VoIP technology to the portfolio, Dialog brings decades of experience to the rapid development of ICs for personal portable applications, including smartphones, tablet PCs, digital cordless phones and gaming applications.
Dialog’s power management processor companion chips enhance the performance in terms of extended battery lifetime and the consumers’ multimedia experience. With world-class manufacturing partners, Dialog operates a fabless business model.
Dialog Semiconductor Plc is headquartered near Stuttgart, with a global sales, R&D and marketing organisation. In 2011, it had approximately US$527 million in revenue and is one of the fastest growing European public semiconductor companies. It currently has approximately 650 employees. The Company is listed on the Frankfurt (FWB: DLG) stock exchange and is a member of the German TecDax index.
More information about the business is set out in the CEO’s statement, on pages 13 and 14, and in the Business review, on page 12.
FUTURE DEVELOPMENTSThe Group’s stated objective is to be the leading global supplier of lowest power, highest-quality mixed signal components and system level solutions to the wireless and automotive markets. The Company is currently leveraging its expertise to expand its standalone audio product portfolio, capitalising on the success of its newly introduced low power and high-quality audio IC, and to add innovative ultra low power display technologies such as PM-OLED.
RESEARCH AND DEVELOPMENT (R&D)The Group believes that its future competitive position will depend on its ability to respond to the rapidly changing needs of its customers by developing new designs in a timely and cost-effective manner. To this end, the Company’s management is committed to investing in researching and developing new products and customising existing products.
To date, R&D projects have been in response to key customers’ requests to assist in the development of new products, and for the development of application-specific standard products (ASSPs). The Company does not expect any material change to this approach in the foreseeable future.
Directors’ report

35
RESPONSIBILITY STATEMENT UNDER THE DISCLOSURE AND TRANSPARENCY RULESEach of the Directors listed on pages 32 and 33 confirm that to the best of their knowledge:
● the financial statements, prepared in accordance with IFRS as adopted by the European Union, give a true and fair view of the assets, liabilities, financial position and profit of the Company and the undertakings included in the consolidation taken as a whole; and
● the Directors’ report and the Group operating and financial review include a fair review of the development and the performance of the business and the position of the Company and the undertakings included in the consolidation taken as a whole, together with a description of the principal risks and uncertainties that they face.
ANNUAL GENERAL MEETINGThe notice convening the Annual General Meeting will be published separately and posted on the Company’s Website. The meeting will be held at Tower Bridge House, St Katherine’s Way, London E1W 1AA on 24 April 2012 at 9am.
AUDITORSIn accordance with Section 384 of the Companies Act 2006, a resolution for the reappointment of Ernst & Young LLP as auditors of the Company is to be proposed at the forthcoming Annual General Meeting.
By order of the Board
DR JALAL BAGHERLIDIRECTOR16 February 2012
SUPPLIER PAYMENT POLICYIt is the Group’s policy to pay creditors in accordance with the terms and conditions agreed with them, and in accordance with contractual and other legal obligations. Days payable outstanding for the Group at 31 December 2011 was 58 days (2010: 65 days).
FINANCIAL INSTRUMENTSThe Group’s financial risk management and policies, and exposure to risks, are set out on pages 24 and 25.
POLITICAL AND CHARITABLE CONTRIBUTIONSThe Group made no political contributions during the period. We made charitable contributions of US$23,813 to local community projects (2010: US$16,875).
EMPLOYEE POLICIESIt is our policy to support our people through training, career development and opportunities for promotion. We operate an open management approach and consult with our staff on matters which are of concern to them. We share information with employees on the performance of the Company which, together with profit-related bonuses and stock option awards, encourage staff involvement.
DISABLED PERSONSOur policy provides for disabled persons, whether registered or not, to be considered for employment, training and career development in accordance with their aptitudes and abilities.
STATEMENT ON DISCLOSURE OF INFORMATION TO AUDITORSThe Directors who were members of the Board at the time of approving the Directors’ report are listed on pages 32 and 33. Having made enquiries of fellow Directors and of the Company’s auditors, each of the Directors affirms that:
● to the best of their knowledge and belief, there is no information relevant to the preparation of their report of which the Company’s auditors are unaware; and
● they have taken all reasonable steps to be aware of relevant audit information and to establish that the Company’s auditors are aware of that information.

36 Dialog Semiconductor Plc | Annual report and accounts 2011 | Section 3 | Management and governance
The Remuneration and Nomination Committee is chaired by Russ Shaw, who is assisted by Chris Burke and Peter Weber. The responsibility of the Committee, among other things, is to determine, subject to Board approval, the salaries and incentives of Dialog’s senior executives and decide on the size and composition of the Board. Corporate Governance is monitored at Board level – a reflection of the importance it is given by the Board.
During the year, the Audit, and Remuneration and Nomination Committees met frequently to analyse issues under their jurisdiction, usually on the day of, or the day before, each Board meeting.
TRANSPARENCYUnder UK Disclosure and Transparency Rules, significant Shareholders are required to notify Dialog of a shareholding of 3% or more. Dialog must then notify BaFin and the Stock Exchange. Under S.15a of the German Securities Trading Act (Wertpapierhandelsgesetz) transactions in the Company’s shares carried out by members of the Board of Directors and their family members are reported and published without delay.
Our shares are listed with Clearstream Germany as legal owner. As far as we are aware, those holding a significant beneficial interest (>3%) in our Company as of 31 December 2011 were:
The Dialog Employee Benefit Trust (1.95%); Robert Citrone and Discovery Capital Management LLC (5.61%) as notified on 8 December 2010; JP Morgan (4.86%) as notified on 4 May 2010; X-FAB Semiconductor Foundries AG (4.62%) as notified by email on 19 January 2012; Allianz Global Investors Kapitalanlagegesellschaft mbH (3.64%) as notified on 2 October 2009.
The Company operates a Code of Dealing in its shares which is designed to prevent insider trading and the abuse of price sensitive information.
The Board appreciates the value of keeping Shareholders informed of Dialog’s performance throughout the year. As a result, it publishes quarterly financial reports, together with key information on the AGM, on its Website.
TAKEOVERS DIRECTIVEAt 31 December 2011, the Company’s issued share capital comprised a single class of shares referred to as ordinary shares. Details of the share capital can be found in note 18 to the consolidated financial statements.
On a show of hands at a general meeting of the Company every holder of shares present in person and entitled to vote shall have one vote, and on a poll every member present in person or by proxy and entitled to vote shall have one vote for every ordinary share held. The notice of the general meeting specifies deadlines for exercising voting rights either by proxy notice or by presence in person or by proxy in relation to resolutions to be passed at a general meeting. All proxy votes are counted and the numbers for, against or withheld in relation to each resolution are announced at the AGM and published on the Company’s Website after the meeting.
GOVERNANCE STANDARDSDialog Semiconductor Plc is committed to implementing high levels of governance. Accordingly, Dialog (as a foreign company listed on the German stock exchange) has established and published its own Corporate Governance principles, corresponding in substance to the provision of the “German Declaration on Corporate Governance”.
Dialog’s Corporate Governance principles are published on its Website (www.dialog-semiconductor.com). The Website also contains a full version of the Company’s Code of Business Conduct and Ethics. This details Dialog’s expectations regarding the ethical standards that each Director, officer and employee should follow while acting on the Company’s behalf.
Corporate Governance information relating to the past financial year is set out below.
SHAREHOLDERS AND THE ANNUAL GENERAL MEETING (“AGM”)The AGM, at which the annual financial statements and audit reports are presented, is the main forum for Shareholders to exercise their voting rights. Directors appointed by the Board during any given year are subject to Shareholder approval at the AGM.
In addition, one-third of the Directors must resign each year and may put themselves forward for re-election. Changes to the constitution of the Company are decided by Shareholders’ resolution. Similarly, the AGM is the forum at which Shareholders can authorise the Directors to issue new shares.
Dialog does not have any shares in issue which have multiple voting rights, preferential voting rights or maximum voting rights.
BOARD OF DIRECTORSThe Board is responsible for determining Dialog’s business strategy and ensuring that an executive is appointed to implement it.
It is also responsible for overseeing the financial aspects of the business.
The Board, which met five times during the year, currently consists of seven non-executive Directors and one executive Director. The compensation provided to each Director is detailed in the Directors’ remuneration report on pages 38 to 40. The executive Director’s remuneration is largely performance related and is connected to a set of goals determined by the Board.
AUDIT COMMITTEE, AND REMUNERATION AND NOMINATION COMMITTEEDialog’s Audit Committee comprises the following Directors: Aidan Hughes (Chairman), John McMonigall and Peter Tan. The Committee is responsible for monitoring financial statements and reviewing the performance of the external auditors. It also assesses the efficiency of the audit process and (among other things) considers compliance with accounting standards. The Chief Executive Officer, Chief Financial Officer, the Company Secretary and representatives of the external auditors usually attend Audit Committee meetings.
Corporate Governance
37
BUSINESS CONDUCT AND ETHICSDialog seeks to comply with all laws and regulations that have an impact on its business. In addition, the Company expects its employees and Directors to act with honesty, integrity and fairness in the conduct of its business. Dialog’s Code of Business Conduct and Ethics is published on the Company’s Website.
Dialog is committed to taking account of interests outside the Company, including those of employees, business partners, the environment and the local communities on which it has an impact. The Board values, and has developed, a culture of corporate social responsibility that takes the above factors into consideration.
AUDIT AND AUDITORSThe consolidated financial statements have been audited by Dialog’s auditors, Ernst and Young (“E&Y”). E&Y were appointed in October 2006 following a tender process.
The remuneration given to the auditors over the past two financial years is detailed in notes 3 and 30 to the consolidated financial statements on pages 65 and 101.
The Company’s audited financial statements for the year ended 31 December 2010, and the reports from the Directors and auditors thereon, were presented to, and approved by, the Shareholders at the AGM of the Company held on 21 April 2011. E&Y, the Company’s independent auditors, were reappointed until the following AGM.
Given the acquisition of SiTel Semiconductor B.V. (“SiTel”) on 10 February 2011, the Board has requested that Kevin Harkin, the Senior Statutory Auditor, extend his period of service from five years to seven years (to end with audit of the 31 December 2012 annual report). The Board believes that this will give the Group greater stability and more comfort over audit quality over the next two years as SiTel is integrated into the Group. After due consideration, Kevin Harkin and Ernst & Young LLP have accepted this request and have advised that they will implement additional review procedures in order to mitigate any potential risk of familiarity impairing their independence.
DECLARATION OF CONFORMITY WITH REGARD TO THE GERMAN CORPORATE GOVERNANCE CODEDialog Semiconductor Plc has established and published its own Corporate Governance principles corresponding in substance to the provisions of the German “Corporate Governance Code” as amended on 14 June 2007, thereby adopting in substance the recommendations of the Government Commission on the German Corporate Governance Code. This declaration is available on the internet at: www.dialog-semiconductor.com.
GREGORIO REYESCHAIRMAN16 February 2012
There are no restrictions on the transfer of ordinary shares in the Company other than:
● certain restrictions may from time to time be imposed by laws and regulations (for example, insider trading laws);
● employees of the Company are not allowed to trade in shares or exercise options in certain close periods (such close periods normally start two weeks before the end of each quarter and end 48 hours after the release of the financial results).
Details of changes in share capital can be found in note 18 to the consolidated financial statements. Besides that, the Company did not purchase its own shares and the Company holds no shares in treasury.
The Company is not aware of any agreements between Shareholders that may result in restrictions on the transfer of securities and for voting rights.
Dialog has an Employee Benefit Trust which holds Dialog shares for the benefit of employees, including for the purpose of satisfying awards made under the various employee and executive share plans. The trustee may vote the shares as it sees fit, and if there is an offer for the shares the trustee is not obliged to accept or reject the offer but will have regard to the interests of the employees and may consult them to obtain their views on the offer and may otherwise take action with respect to the offer it thinks fair.
There are no agreements between the Company and its Directors or employees providing for compensation for loss of office or employment (whether through resignation, purported redundancy or otherwise) that occur because of a takeover bid. The agreements between the Company and its Directors for compensation for loss of office are given in the Directors’ remuneration report on page 38.
The Company’s Articles of Association may only be amended by a special resolution at a general meeting of Shareholders.
INTERNAL CONTROLIn accordance with the EU Transparency Directive (DTR 7.2.5), Dialog’s Board of Directors and Audit Committee acknowledge that they are responsible for the Company’s processes of internal control and for reviewing its effectiveness. Such processes are designed to manage rather than eliminate the risk of failure to achieve business objectives, and can only provide reasonable and not absolute assurance against material misstatement or loss.
The Company has an ongoing process for identifying, evaluating and managing the significant risks it faces. This process is reviewed in accordance with the EU Transparency Directive. The process was in place during 2011 and up to the date of the approval of the 2011 annual report and financial statements.
The Company’s Board and Audit Committee can confirm that necessary actions have been taken to remedy any significant failings or weaknesses identified from these process reviews.
38 Dialog Semiconductor Plc | Annual report and accounts 2011 | Section 3 | Management and governance
COMPENSATION OF NON-EXECUTIVE DIRECTORSNon-executive Directors are paid quarterly for their roles as Directors. Additional fees are paid to the Chairman of the Company’s Board committees, the Audit Committee, and the Remuneration and Nomination Committee.
Our Directors and the Chairman are all reimbursed for any reasonable travel expenses incurred in connection with their attendance at Board meetings or Board committees.
There is no contractually agreed termination benefit for non-executive Directors.
DIRECTORS’ CONTRACTSThe service agreement with Dr Jalal Bagherli, executive Director, dated 19 July 2005, is of unlimited duration. The agreement may be terminated by either party on six months’ notice (increasing to 12 months on a change of control of the Company).
PERFORMANCE GRAPHDetails are set out on pages 7 and 8 of this annual report.
SHARE OPTIONSDetails are set out in note 20 to the consolidated financial statements, on pages 80 to 83.
DIRECTORS’ SHARE INTERESTSDirectors’ beneficial interests (as defined by the Companies Act 2006) in 10 pence ordinary shares of the Company are set out in note 20a, on page 80, in the notes to the consolidated financial statements.
DIRECTORS’ PENSION ARRANGEMENTSThe Company contributes 9% of the executive Director’s basic salary to a defined contribution pension scheme. There are no pension arrangements for non-executive Directors.
POLICY ON DIRECTORS’ REMUNERATIONThe Board is responsible for setting the Company’s policy on Directors’ remuneration; the Remuneration and Nomination Committee agrees the remuneration for each executive Director.
The primary objectives of the Company’s policy on executive Directors’ remuneration are first, that it should be structured so as to attract and retain executives of a high calibre, with the skills and experience necessary to develop the Company successfully and, second, to reward them in a way which encourages the creation of value for the Company’s Shareholders.
The performance measurement of each executive Director and the determination of his annual remuneration package are undertaken by the Remuneration and Nomination Committee.
No Director is involved in deciding his or her own remuneration. The Remuneration and Nomination Committee comprises non-executive Directors and its role, inter alia, is to apply the Board’s policy on remuneration. The current members of the Committee are Russ Shaw (Chairman), Chris Burke and Peter Weber.
The Company has one executive Director, Dr Jalal Bagherli, who was appointed on 12 September 2005. The executive Director’s remuneration consists of three components:
1. Salary – reflects the executive’s experience, responsibilities and market value;
2. Bonus – as part of his remuneration Dr Bagherli receives bonuses based on objectives set by the Remuneration and Nomination Committee relative to the performance of the Group, as an incentive to Dr Bagherli to achieve relevant and demanding targets; and
3. Share options – details are set out in note 20 to the consolidated financial statements.
Directors’ remuneration report
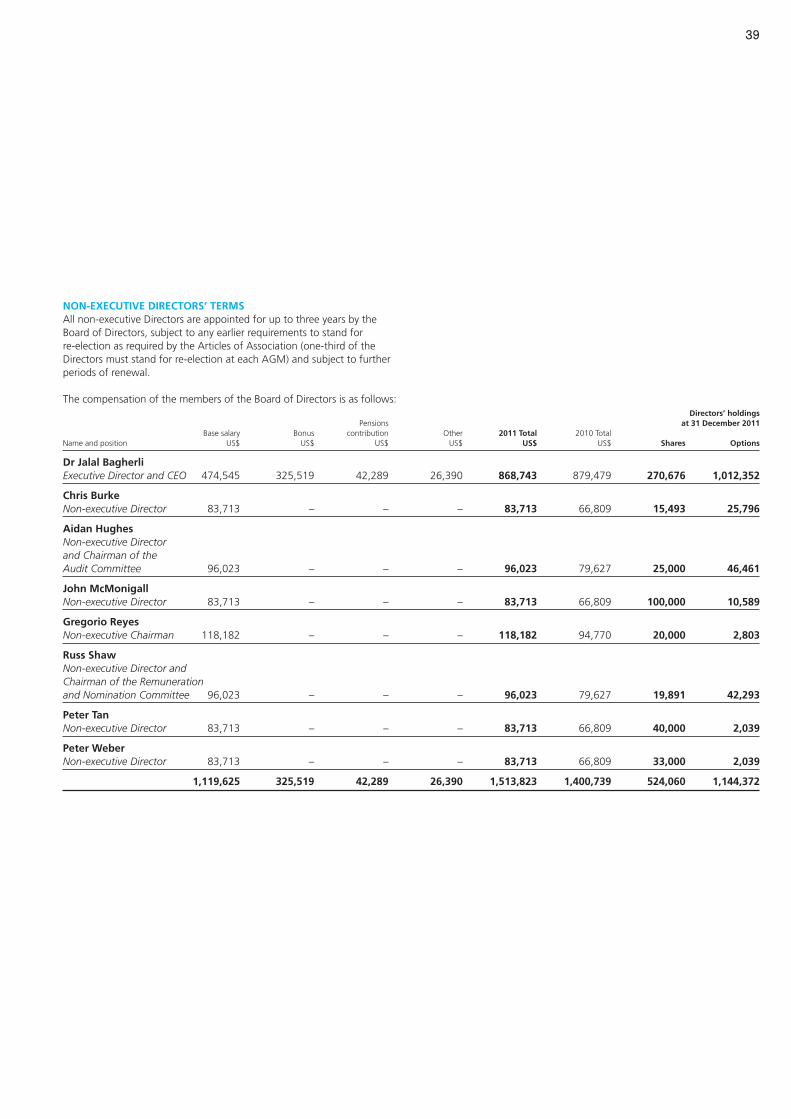
39
NON-EXECUTIVE DIRECTORS’ TERMSAll non-executive Directors are appointed for up to three years by the Board of Directors, subject to any earlier requirements to stand for re-election as required by the Articles of Association (one-third of the Directors must stand for re-election at each AGM) and subject to further periods of renewal.
The compensation of the members of the Board of Directors is as follows: Directors’ holdings Pensions at 31 December 2011 Base salary Bonus contribution Other 2011 Total 2010 Total Name and position US$ US$ US$ US$ US$ US$ Shares Options
Dr Jalal BagherliExecutive Director and CEO 474,545 325,519 42,289 26,390 868,743 879,479 270,676 1,012,352
Chris BurkeNon-executive Director 83,713 – – – 83,713 66,809 15,493 25,796
Aidan HughesNon-executive Director and Chairman of the Audit Committee 96,023 – – – 96,023 79,627 25,000 46,461
John McMonigallNon-executive Director 83,713 – – – 83,713 66,809 100,000 10,589
Gregorio ReyesNon-executive Chairman 118,182 – – – 118,182 94,770 20,000 2,803
Russ ShawNon-executive Director and Chairman of the Remuneration and Nomination Committee 96,023 – – – 96,023 79,627 19,891 42,293
Peter TanNon-executive Director 83,713 – – – 83,713 66,809 40,000 2,039
Peter WeberNon-executive Director 83,713 – – – 83,713 66,809 33,000 2,039
1,119,625 325,519 42,289 26,390 1,513,823 1,400,739 524,060 1,144,372

40 Dialog Semiconductor Plc | Annual report and accounts 2011 | Section 3 | Management and governance
SHARE OPTIONS GRANTED TO THE EXECUTIVE DIRECTOR As at 31 December 2011, Jalal Bagherli, executive Director, held 1,012,352 options over ordinary shares which entitle him to acquire the same amount of shares. Market price of Gain on the exercised options¹) exercise of options Exercise price Date of grant Expiry date Vesting period 31 December 2010 Granted Exercised 31 December 2011 € €
€1.52 13.05.2009 12.05.2016 1-44 months 75,712 – (16,820) 58,892 14.32 215,296£0.10 21.02.2010 03.02.2015 12 months 799,290 – (354,000) 445,290 14.15 4,969,566£0.10 18.02.2011 10.02.2021 Immediately – 508,170 – 508,170 – –
875,002 508,170 (370,820) 1,012,352 5,184,862
1) The market price as a weighted average price
SHARE OPTIONS GRANTED TO THE NON-EXECUTIVE DIRECTORSEach non-executive Director was previously entitled to an initial grant of 50,000 options vesting monthly in 48 equal tranches. At each AGM (ending with the 2009 AGM), non-executive Directors received a further 20,000 options vesting over 12 months. Options may be exercised at the market price prevailing at the date of grant. The non-executive Directors are not subject to performance criteria related to their remuneration. The stock options granted to non-executive Directors are not, therefore, subject to the achievement of performance targets. At the 2010 AGM the Shareholders voted against the continuance of this share option plan.
At the 2011 AGM Shareholders resolved that one-third of the non-executive Directors’ remuneration should be satisfied in shares in the Company. These shares are issued through the mechanism of options (with an exercise value of Euro 15 cents) the exercise of which, subject to certain exceptions, is conditional on the Director still being a member of the Board immediately before the third AGM following grant.
The share option grants to non-executive Directors are as follows:
Market price Gain on 31 31 of exercised the exerciseDirector Exercise price December December options¹) of options € Date of grant Expiry date Vesting period 2010 Forfeited Granted Exercised 2011 € €
Chris Burke 1.40 12.07.2006 11.07.2013 48 months 5,210 – – – 5,210 – – 1.17 22.04.2009 21.04.2016 12 months 18,547 – – – 18,547 – – 0.15 21.07.2011 21.07.2018 48 months – – 2,039 – 2,039 – –
Aidan Hughes 1.27 19.06.2006 18.06.2013 48 months 4,168 – – – 4,168 – – 1.35 30.04.2008 29.04.2015 12 months 20,000 – – – 20,000 – – 1.17 22.04.2009 21.04.2016 12 months 20,000 – – – 20,000 – – 0.15 21.07.2011 21.07.2018 48 months – – 2,293 – 2,293 – –
John McMonigall 1.27 19.06.2006 18.06.2013 48 months 5,210 – – – 5,210 – – 1.17 22.04.2009 21.04.2016 12 months 3,340 – – – 3,340 – – 0.15 21.07.2011 21.07.2018 48 months – – 2,039 – 2,039 – –
Gregorio Reyes 1.27 19.06.2006 18.06.2013 48 months 6,252 – – (6,252) – 15.03 86,049 1.17 22.04.2009 21.04.2016 12 months 17,088 – – (17,088) – 15.03 236,898 0.15 21.07.2011 21.07.2018 48 months – – 2,803 – 2,803 – –
Russ Shaw 1.40 12.07.2006 11.07.2013 48 months 5,210 – – (5,210) – 12.75 59,134 1.80 10.05.2007 09.05.2014 12 months 20,000 – – (20,000) – 12.75 279,000 1.35 30.04.2008 29.04.2015 12 months 20,000 – – – 20,000 – – 1.17 22.04.2009 21.04.2016 12 months 20,000 – – – 20,000 – – 0.15 21.07.2011 21.07.2018 48 months – – 2,293 – 2,293 – –
Peter Tan 0.15 21.07.2011 21.07.2018 48 months – – 2,039 – 2,039 – –
Peter Weber 0.15 21.07.2011 21.07.2018 48 months – – 2,039 – 2,039 – –
Total 165,025 – 15,545 (48,550) 132,020 601,081
1) The market price as a weighted average price
Approved by the Board of Directors and signed on its behalf by:
TIM ANDERSONSECRETARY16 February 2012
Directors’ remuneration report continued

41
To the best of our knowledge, and in accordance with the applicable reporting principles, the consolidated financial statements give a true and fair view of the assets, liabilities, financial position and profit and loss of the Group, and the Group management report includes a fair review of the development and performance of the business and the position of the Group, together with a description of the principal opportunities and risks associated with the expected development of the Group.
DR JALAL BAGHERLI JEAN-MICHEL RICHARDCHIEF EXECUTIVE OFFICER CFO, VICE PRESIDENT FINANCE16 February 2012
● prepare the financial statements on the going-concern basis unless it is inappropriate to presume that the Group and the parent company will continue in business.
The Directors are responsible for keeping proper accounting records that disclose with reasonable accuracy at any time the financial position of the parent company and enable them to ensure that its financial statements comply with the Companies Act 2006.
They have a general responsibility for taking such steps as are reasonably open to them to safeguard the assets of the Group and to prevent and detect fraud and other irregularities.
Under applicable law and regulations, the Directors are also responsible for preparing a Directors’ report and Directors’ remuneration report that comply with that law and those regulations.
The Directors are responsible for the maintenance and integrity of the corporate and financial information included on the Company’s Website. Legislation in the UK governing the preparation and dissemination of financial statements may differ from legislations in other jurisdictions.
The Directors are responsible for preparing the IFRS report and accounts 2011 and the Group and parent company financial statements in accordance with the applicable law and regulations. Company law requires the Directors to prepare Group and parent company financial statements for each financial year. Under the law the Directors are required to prepare the Group financial statements in accordance with IFRS as adopted by the EU and have elected to prepare the parent company financial statements on the same basis.
The Group and parent company financial statements are required by law and IFRS as adopted by the EU to present fairly the financial position of the Group and the parent company and the performance for that period; the Companies Act 2006 provides in relation to such financial statements that references in the relevant part of the Act to financial statements giving a true and fair view are references to their achieving a fair presentation. In preparing each of the Group and parent company financial statements, the Directors are required to:
● select suitable accounting policies and then apply them consistently;
● make judgements and estimates that are reasonable and prudent;
● state whether they have been prepared in accordance with IFRS as adopted by the EU; and
Statement of Directors’ responsibilities
Responsibility statement

42 Dialog Semiconductor Plc | Annual report and accounts 2011 | Section 4 | Consolidated financial statements and notes
We have audited the financial statements of Dialog Semiconductor Plc for the year ended 31 December 2011 which comprise the Group and Parent Company Statements of Financial Position, the Group Statement of Comprehensive Income, the Group and Parent Company Statements of Cash Flow, the Group and Parent Company Statements of Changes in Equity and the related notes 1 to 33. The financial reporting framework that has been applied in their preparation is applicable law and International Financial Reporting Standards (IFRSs) as adopted by the European Union and, as regards the parent company financial statements, as applied in accordance with the provisions of the Companies Act 2006.
This report is made solely to the Company’s members, as a body, in accordance with Chapter 3 of Part 16 of the Companies Act 2006. Our audit work has been undertaken so that we might state to the Company’s members those matters we are required to state to them in an auditor’s report and for no other purpose. To the fullest extent permitted by law, we do not accept or assume responsibility to anyone other than the Company and the Company’s members as a body, for our audit work, for this report, or for the opinions we have formed
RESPECTIVE RESPONSIBILITIES OF DIRECTORS AND AUDITORAs explained more fully in the Directors’ Responsibilities Statement set out on page 38, the Directors are responsible for the preparation of the financial statements and for being satisfied that they give a true and fair view. Our responsibility is to audit and express an opinion on the financial statements in accordance with applicable law and International Standards on Auditing (UK and Ireland). Those standards require us to comply with the Auditing Practices Board’s Ethical Standards for Auditors.
SCOPE OF THE AUDIT OF THE FINANCIAL STATEMENTSAn audit involves obtaining evidence about the amounts and disclosures in the financial statements sufficient to give reasonable assurance that the financial statements are free from material misstatement, whether caused by fraud or error. This includes an assessment of: whether the accounting policies are appropriate to the Group’s and the parent company’s circumstances and have been consistently applied and adequately disclosed; the reasonableness of significant accounting estimates made by the Directors; and the overall presentation of the financial statements.
OPINION ON FINANCIAL STATEMENTSIn our opinion:
• ThefinancialstatementsgiveatrueandfairviewofthestateoftheGroup’s and of the parent company’s affairs as at 31 December 2011 and of the Group’s profit for the year then ended;
• TheGroupfinancialstatementshavebeenproperlypreparedinaccordance with IFRSs as adopted by the European Union;
• Theparentcompanyfinancialstatementshavebeenproperlypreparedin accordance with IFRSs as adopted by the European Union and as applied in accordance with the provisions of the Companies Act 2006; and
• Thefinancialstatementshavebeenpreparedinaccordancewiththerequirements of the Companies Act 2006 and, as regards the Group financial statements, Article 4 of the IAS Regulation.
Independent Auditors’ report to the members of Dialog Semiconductor Plc
OPINION ON OTHER MATTERS PRESCRIBED BY THE COMPANIES ACT 2006In our opinion:
• ThepartoftheDirectors’remunerationreporttobeauditedhasbeenproperly prepared in accordance with the Companies Act 2006;
• TheinformationgivenintheDirectors’reportforthefinancialyear for which the financial statements are prepared is consistent with the financial statements; and
• TheinformationgivenintheCorporateGovernancestatementsetouton pages 36 and 37 and the web address (www.dialog-semiconductor.com) with respect to internal control and risk management systems in relation to financial reporting processes and about share capital structures is consistent with the financial statements.
MATTERS ON WHICH WE ARE REQUIRED TO REPORT BY EXCEPTIONWe have nothing to report in respect of the following:
Under the Companies Act 2006 we are required to report to you if, in our opinion:
• Adequateaccountingrecordshavenotbeenkeptbytheparentcompany, or returns adequate for our audit have not been received from branches not visited by us; or
• TheparentcompanyfinancialstatementsandthepartoftheDirectors’remuneration report to be audited are not in agreement with the accounting records and returns; or
• CertaindisclosuresofDirectors’remunerationspecifiedbylawarenotmade; or
• Wehavenotreceivedalltheinformationandexplanationswerequirefor our audit; or
• ACorporateGovernancestatementhasnotbeenpreparedbytheCompany.
KEVIN HARKIN (SENIOR STATUTORY AUDITOR) for and on behalf of Ernst & Young LLP, Statutory Auditor Reading 16 February 2012

43
Notes At 31 December
2011
US$000
At 31 December
2010
US$000
Assets
Cash and cash equivalents 6 113,590 158,200
Trade accounts receivable and other receivable 7 46,729 12,556
Inventories 8 62,637 40,733
Income tax receivables 5 58 60
Other financial assets 9 25 836
Other current assets 10 8,236 4,078
Total current assets 231,275 216,463
Property, plant and equipment 11 28,404 14,249
Goodwill 4, 12 27,358 –
Other intangible assets 12 38,361 10,727
Deposits 1,445 741
Income tax receivables 5 239 370
Deferred tax assets 5 17,382 10,829
Total non-current assets 113,189 36,916
Total assets 344,464 253,379
Liabilities and Shareholders' equity
Trade and other payables 13 50,457 28,413
Other financial liabilities 14 7,213 845
Provisions 15 1,040 877
Income taxes payable 5,178 1,208
Other current liabilities 16 16,552 15,875
Total current liabilities 80,440 47,218
Provisions 15 536 428
Other non-current financial liabilities 17 373 461
Total non-current liabilities 909 889
Ordinary shares 12,380 12,380
Additional paid-in capital 203,911 202,416
Retained earnings (Accumulated deficit) 58,233 (3,961)
Other reserves (8,251) (1,648)
Employee stock purchase plan shares (3,158) (3,915)
Net Shareholders´ equity 18 263,115 205,272
Total liabilities and Shareholders´ equity 344,464 253,379 These financial statements were approved by the Board of Directors on 16 February 2012 and were signed on its behalf by:
Dr Jalal Bagherli Director
Consolidated statement of financial position As at 31 December 2011

44 Dialog Semiconductor Plc | Annual report and accounts 2011 | Section 4 | Consolidated financial statements and notes
Notes 2011
US$000
2010
US$000
Revenue 3, 23, 26 527,261 296,597
Cost of sales (319,073) (159,334)
Gross profit 208,188 137,263
Selling and marketing expenses (32,370) (17,391)
General and administrative expenses (24,442) (17,471)
Research and development expenses 23 (90,046) (56,465)
Other operating income 3, 26 303 –
Restructuring expenses – (595)
Operating profit 3 61,633 45,341
Interest income 3 376 1,130
Interest expense 3 (235) (120)
Foreign currency exchange gains (losses), net (352) (2,088)
Result before income taxes 61,422 44,263
Income tax expense 5 (5,559) (1,784)
Net profit 55,863 42,479
2011 2010
Earnings per share (in US$)
Basic 0.89 0.70
Diluted 0.84 0.66
Weighted average number of shares (in thousands) 2
Basic 62,873 60,313
Diluted 66,711 64,841
Consolidated income statementFor the year ended 31 December 2011
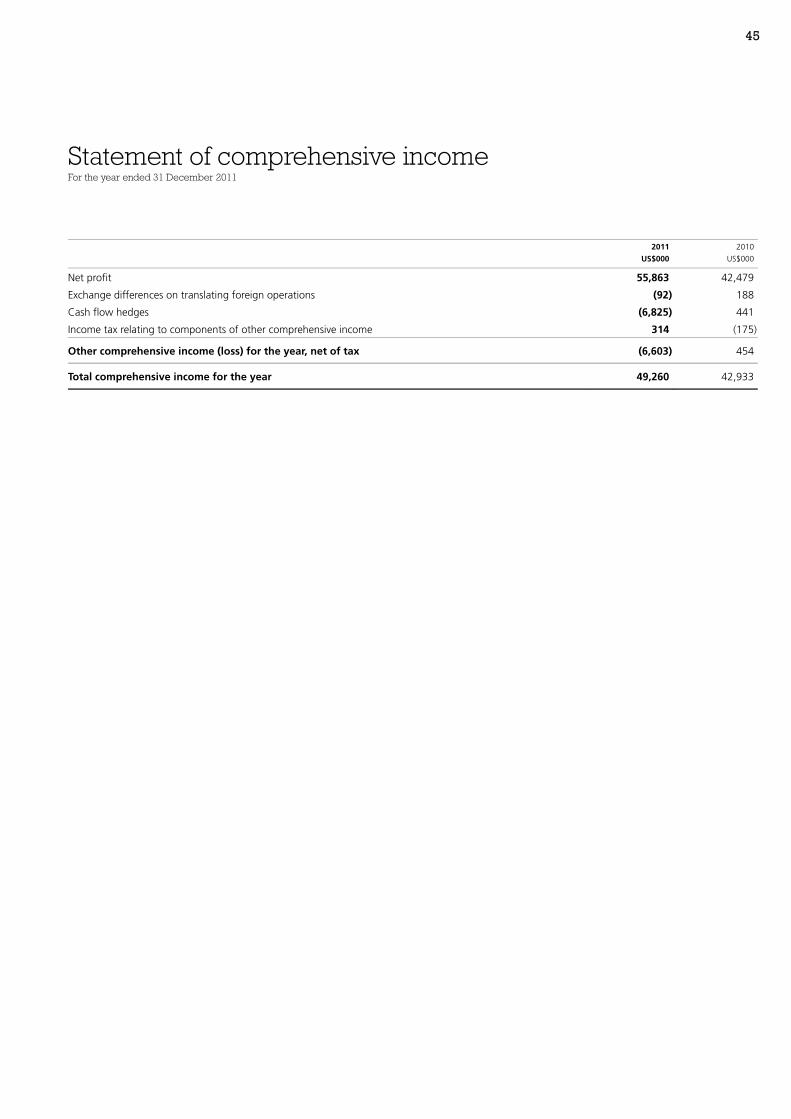
45
2011 2010
US$000 US$000
Net profit 55,863 42,479
Exchange differences on translating foreign operations (92) 188
Cash flow hedges (6,825) 441
Income tax relating to components of other comprehensive income 314 (175)
Other comprehensive income (loss) for the year, net of tax (6,603) 454
Total comprehensive income for the year 49,260 42,933
Statement of comprehensive incomeFor the year ended 31 December 2011

46 Dialog Semiconductor Plc | Annual report and accounts 2011 | Section 4 | Consolidated financial statements and notes
Notes 2011
US$000
2010
US$000
Cash flows from operating activities:
Net profit 55,863 42,479
Adjustments to reconcile net profit to net cash used for operating activities:
Interest income, net 3 (141) (1,010)
Income tax expense 5 5,559 1,784
Impairment of inventories 3,660 1,121
Depreciation of property, plant and equipment 11 8,801 4,880
Amortisation of intangible assets 12 16,030 2,678
Losses on disposals of fixed assets and impairment of fixed and financial assets 1,106 240
Expense related to share-based payments 20 6,329 4,227
Changes in working capital:
Trade accounts receivable, other receivables and factoring 7 (21,451) 4,930
Inventories (10,716) (15,661)
Prepaid expenses (967) (1,475)
Trade accounts payable 11,958 11,157
Provisions (334) (665)
Other assets and liabilities (3,336) 3,641
Cash generated from operations 72,361 58,326
Interest paid (109) (3)
Interest received 381 1,005
Income taxes paid (3,078) (7,378)
Cash flow from operating activities 69,555 51,950
Cash flows from investing activities:
Cash transferred from restricted cash 24 – 3,000
Purchase of property, plant and equipment 11 (21,161) (9,768)
Purchase of intangible assets 12 (5,414) (5,883)
Payments for capitalised development costs 12 (5,165) (2,823)
Purchase of SiTel Semiconductor B.V. 4 (84,166) –
Deposits made (157) –
Cash flow used for investing activities (116,063) (15,474)
Cash flows from financing activities:
Cash flow used for capital increase – (36)
Purchase of employee stock purchase plan shares – (2,844)
Sale of employee stock purchase plan shares 2,254 4,013
Cash flow from financing activities 2,254 1,133
Cash flow from (used for) operating, investing and financing activities (44,254) 37,609
Net foreign exchange difference (356) 443
Net increase (decrease) in cash and cash equivalents (44,610) 38,052
Cash and cash equivalents at beginning of period 158,200 120,148
Cash and cash equivalents at end of period 6 113,590 158,200
Consolidated statement of cash flowsFor the year ended 31 December 2011

47
Other reserves
Ordinary Shares
US$000
Additional paid-in
capital
US$000
Retained earnings
(Accumulated
deficit)
US$000
Currency
translation
adjustment
US$000
Hedges
US$000
Employee stock
purchase plan
shares
US$000
Total
US$000
Balance at 1 January 2010 11,825 283,733 (135,667) (1,730) (372) (810) 156,979
Total comprehensive income – – 42,479 13 441 – 42,933
Reduction of additional paid-in capital – (85,000) 85,000 – – – –
Capital increase for employee share option plan (gross proceeds) 555 414 – – – (969) –
Transaction costs of capital increase - employee share option plan – (36) – – – – (36)
Purchase of employee stock purchase plan shares – – – – – (2,844) (2,844)
Sale of employee stock purchase plan shares – 3,305 – – – 708 4,013
Equity settled transactions, net of tax – – 4,227 – – – 4,227
Changes in Equity total 555 (81,317) 131,706 13 441 (3,105) 48,293
Balance at 31 December 2010 / 1 January 2011
12,380 202,416 (3,961) (1,717) 69 (3,915) 205,272
Total comprehensive income – – 55,863 (162) (6,441) – 49,260
Sale of employee stock purchase plan shares – 1,495 – – – 757 2,252
Equity settled transactions, net of tax – – 6,331 – – – 6,331
Changes in Equity total – 1,495 62,194 (162) (6,441) 757 57,843
Balance at 31 December 2011 12,380 203,911 58,233 (1,879) (6,372) (3,158) 263,115 For further details, please refer to note 18.
Consolidated statement of changes in Shareholders´ equityFor the year ended 31 December 2011

48 Dialog Semiconductor Plc | Annual report and accounts 2011 | Section 4 | Consolidated financial statements and notes
Notes to the consolidated financial statementsFor the year ended 31 December 2011
1. GENERAL The consolidated financial statements of Dialog Semiconductor Plc (“Dialog or the Group”) for the year ended 31 December 2011 were authorised for issue in accordance with a resolution of the Directors on 16 February 2012. Dialog Semiconductor Plc is a company incorporated in the UK, whose shares are publicly traded. The principal activities of the Group are set out in the segment reporting (note 23).
COMPANY NAME AND REGISTERED OFFICE Dialog Semiconductor Plc Tower Bridge House St Katharine’s Way London E1W 1AA United Kingdom
BASIS OF PRESENTATION The consolidated financial statements are prepared on the historical cost basis except that derivative financial instruments are stated at their fair value. The consolidated financial statements are presented in US dollars (“US$”) and all values are rounded to the nearest thousand (US$000) except when otherwise stated.
STATEMENT OF COMPLIANCE The accompanying consolidated financial statements have been prepared on the basis of the recognition and measurement requirements of International Financial Reporting Standards (IFRS) and its interpretation as adopted by the EU. Based on these standards, management has applied the accounting policies as provided in note 2.
2. SUMMARY OF SIGNIFICANT ACCOUNTING POLICIES CHANGES IN ACCOUNTING POLICIES AND DISCLOSURES The accounting policies are consistent with those of the previous financial year except for the changes resulting from the adoption of the following amended, revised and new Standards and new IFRIC interpretations during the year:
IAS 24 RELATED PARTY DISCLOSURES (REVISED) The revised IAS 24 was issued in November 2009 and is effective for periods beginning on or after 1 January 2011. The changes to IAS 24 simplify the disclosure requirements for government-related entities and clarify the definition of a related party. The revised standard did not have an impact on the disclosures regarding related party transactions.
IMPROVEMENTS TO IFRSS – A COLLECTION OF AMENDMENTS TO INTERNATIONAL FINANCIAL REPORTING STANDARDS (ANNUAL IMPROVEMENTS PROJECT) The IASB has also issued a collection of amendments to various IFRSs (“Improvements to IFRSs”) in May 2010. This includes amendments to various existing IFRSs. The amendments have no impact on the financial position nor the financial performance of Dialog, however, disclosures for financial instruments have been adjusted accordingly.
All following amended or new interpretations did not result in changes to the accounting policies and did not have a material effect on the financial statements, as they currently do not apply to Dialog:
Interpretation Title Effective date
IFRIC 14 Amendment to IFRIC 14 Prepayments of a minimum funding requirement 1 January 2011
IFRIC 19 Extinguishing financial liabilities with equity instruments 1 July 2010
Notes to the consolidated financial statementsFor the year ended 31 December 2011

49
RECENTLY ISSUED ACCOUNTING STANDARDS NOT YET ADOPTED (STANDARDS AND INTERPRETATIONS ARE ENDORSED BY THE EU EXCEPT AS NOTED OTHERWISE) IFRS 7 FINANCIAL INSTRUMENTS: DISCLOSURES (AMENDED) The amendment was issued in October 2010 and is effective for annual periods beginning on or after 1 July 2011. The amendments will allow users of financial statements to improve their understanding of transfer transactions of financial assets (for example, securitisations), including understanding the possible effects of any risks that may remain with the entity that transferred the assets. The amendments also require additional disclosures if a disproportionate amount of transfer transactions are undertaken around the end of a reporting period.
IFRS 7 FINANCIAL INSTRUMENTS: DISCLOSURES (AMENDED / IAS 32 FINANCIAL INSTRUMENTS: PRESENTATION (AMENDED) The amended IFRS 7 / IAS 32 were issued in December 2011 and are effective for periods beginning on or after 1 January 2013. The amendment standards comprise disclosure requirements to assess the effect or potential effect of offsetting arrangements on a company’s financial position. The new disclosure requirements also improve transparency in the reporting of how companies mitigate credit risk, including disclosure of related collateral pledged or received. The amended standards have not yet been endorsed by the EU.
IFRS 9 FINANCIAL INSTRUMENTS The new IFRS 9 was issued in November 2009. The new standard for financial instruments sets out provisions for the classification and measurement of financial assets. IFRS 9 uses a single approach to determine whether a financial asset is measured at amortised cost or fair value, replacing the many different rules in IAS 39. The approach in IFRS 9 is based on how an entity manages its financial instruments (its business model) and the contractual cash flow characteristics of the financial assets. The new standard also requires a single impairment method to be used, replacing the many different impairment methods in IAS 39. The revised standard has not yet been endorsed by the EU.
In October 2010 additions to IFRS 9 Financial instruments were issued. The additions outline the requirements on the accounting for financial liabilities. The new requirements address the problem of volatility in profit or loss (P&L) arising from an issuer choosing to measure its own debt at fair value (often referred to as the ‘own credit’ problem). The IASB decided to maintain the existing amortised cost measurement for most liabilities, limiting change to that required to address the own credit problem. With the new requirements, an entity choosing to measure a liability at fair value will present the portion of the change in its fair value due to changes in the entity’s own credit risk in the other comprehensive income (OCI) section of the income statement, rather than within profit or loss. The revised standard has not yet been endorsed by the EU.
The new IFRS 9 is effective for periods beginning on or after 1 January 2015 (as amended in December 2011). The impact will be further analysed in the future when the project is complete.
IFRS 10 CONSOLIDATED FINANCIAL STATEMENTS, IFRS 11 JOINT ARRANGEMENTS, IFRS 12 DISCLOSURES OF INTERESTS IN OTHER ENTITIES, IAS 27 (REVISED) SEPARATE FINANCIAL STATEMENTS, IAS 28 (REVISED) INVESTMENTS IN ASSOCIATES AND JOINT VENTURES The International Accounting Standards Board (IASB) completed in May 2011 its improvements to the accounting requirements for off balance sheet activities and joint arrangements by issuing IFRS 10 Consolidated Financial Statements, IFRS 11 Joint Arrangements and IFRS 12 Disclosure of Interests in Other Entities. The new and revised standards are effective for periods beginning on 1 January 2013:
IFRS 10 builds on existing principles by identifying the concept of control as the determining factor in whether an entity should be included within the consolidated financial statements of the parent company. The standard provides additional guidance to assist in the determination of control where this is difficult to assess. The Group does not expect a material effect on its financial statements resulting from this new standard.
IFRS 11 provides for a more realistic reflection of joint arrangements by focusing on the rights and obligations of the arrangement, rather than its legal form (as is currently the case). The standard addresses inconsistencies in the reporting of joint arrangements by requiring a single method to account for interests in jointly controlled entities. The Group does not expect a material effect on its financial statements resulting from this new standard, as the group is not engaged in joint arrangements.
2. SUMMARY OF SIGNIFICANT ACCOUNTING POLICIES CONTINUED
50 Dialog Semiconductor Plc | Annual report and accounts 2011 | Section 4 | Consolidated financial statements and notes
Notes to the consolidated financial statementsFor the year ended 31 December 2011
IFRS 12 is a new and comprehensive standard on disclosure requirements for all forms of interests in other entities, including joint arrangements, associates, special purpose vehicles and other off balance sheet vehicles. The Group expects additional disclosures from this new standard.
IAS 27 (revised) now includes the provisions on separate financial statements that are left after the control provisions of IAS 27 have been included in the new IFRS 10.
IAS 28 (revised) now includes the requirements for joint ventures, as well as associates, to be equity accounted following the issue of IFRS 11.
IFRS 13 FAIR VALUE MEASUREMENT The new IFRS 13 was issued in May 2011 and is effective for periods beginning on or after 1 January 2013. The requirements of IFRS 13 do not extend the use of fair value accounting, but provide guidance on how it should be applied where its use is already required or permitted by other standards within IFRSs. The impact will be further analysed in the future not expect a material effect on its financial statements resulting from this new statement.
IAS 1 PRESENTATION OF FINANCIAL STATEMENTS The amendments to IAS 1 were issued in June 2011 and are effective for annual periods beginning on or after 1 July 2012. The amendments require companies preparing financial statements in accordance with IFRSs to group together items within Other Comprehensive Income (“OCI”) that may be reclassified to the profit or loss section of the income statement. The amendments also reaffirm existing requirements that items in OCI and profit or loss should be presented as either a single statement or two consecutive statements. The Group does not expect a material effect on its financial statements resulting from this amendment.
IAS 12 INCOME TAXES (AMENDED) The amendments to IAS 12 Income Taxes were issued in December 2010 and are effective for annual periods beginning on or after 1 January 2012. IAS 12 requires an entity to measure the deferred tax relating to an asset depending on whether the entity expects to recover the carrying amount of the asset through use or sale. It can be difficult and subjective to assess whether recovery will be through use or through sale when the asset is measured using the fair value model in IAS 40 Investment Property. The amendment provides a practical solution to the problem by introducing a presumption that recovery of the carrying amount will, normally be , be through sale. As a result of the amendments, SIC-21 Income Taxes—Recovery of Revalued Non-Depreciable Assets would no longer apply to investment properties carried at fair value. The amendments also incorporate into IAS 12 the remaining guidance previously contained in SIC-21, which is accordingly withdrawn. The amended standard has not yet been endorsed by the EU.
The impact will be further analysed in the future and cannot be measured at the moment.
IAS 19 EMPLOYEE BENEFITS (AMENDED) The amendments to IAS 19 Employee Benefits were issued in December 2010 and are effective for annual periods beginning on or after 1 January 2013. The amendments especially relate to:
eliminating an option to defer the recognition of gains and losses, known as the ‘corridor method’, improving comparability and faithfulness of presentation.
streamlining the presentation of changes in assets and liabilities arising from defined benefit plans, including requiring remeasurements to be presented in other comprehensive income (OCI), thereby separating those changes from changes that many perceive to be the result of an entity’s day-to-day operations.
enhancing the disclosure requirements for defined benefit plans, providing better information about the characteristics of defined benefit plans and the risks that entities are exposed to through participation in those plans.
Since the group does not operate any defined benefit plan, the Group does not expect a material effect on its financial statements resulting from this amendment.
2. SUMMARY OF SIGNIFICANT ACCOUNTING POLICIES CONTINUED

51
IAS 32 FINANCIAL INSTRUMENTS: PRESENTATION (AMENDED) The amended IAS 32 was issued in October 2009 and is effective for periods beginning on or after 1 February 2010. The amendment addresses the accounting for rights issues (rights, options or warrants) that are denominated in a currency other than the functional currency of the issuer. Previously such rights issues were accounted for as derivative liabilities. However, the amendment requires that, provided certain conditions are met, such rights issues are classified as equity regardless of the currency in which the exercise price is denominated.
In addition, the following interpretations and amendments to interpretations have been issued:
Interpretation Title Effective date
IFRIC 14 Amendment to IFRIC 14 Prepayments of a minimum funding requirement 1 January 2011
IFRIC 19 Extinguishing financial liabilities with equity instruments 1 July 2010
IFRIC 20 Stripping Costs in the Production Phase of a Surface Mine (The Interpretation has not yet been endorsed by the EU)
1 January 2013
The Group does not intend to make early application of the amended or revised Standards and Interpretation listed above.
PRINCIPLES OF CONSOLIDATION AND INVESTMENTS IN AFFILIATED COMPANIES The consolidated financial statements include Dialog Semiconductor Plc and its subsidiaries as at 31 December each year:
Name Registered office Participation
Dialog Semiconductor GmbH Kirchheim/Teck, Germany 100%
Dialog Semiconductor B.V. ’s-Hertogenbosch, The Netherlands 100%
Dialog Semiconductor (UK) Limited Swindon, UK 100%
Dialog Semiconductor Inc. Wilmington, Delaware, USA 100%
Dialog Semiconductor KK Tokyo, Japan 100% Subsidiaries are fully consolidated from the date of acquisition, being the date on which Dialog obtains control, and continue to be consolidated until the date such control ceases.
The financial statements of the subsidiaries are prepared for the same reporting period as the parent company, using consistent accounting policies.
All intra-group balances, transactions, unrealised gains and losses resulting from intra-group transactions and dividends are eliminated in full.
A change in the ownership interest of a subsidiary, without a loss of control, is accounted for as an equity transaction for changes incurred since 1 January 2010. No changes in ownership interest of a subsidiary incurred prior to 2010. If Dialog loses control over a subsidiary, it:
Derecognises the assets (including goodwill) and liabilities of the subsidiary Derecognises the carrying amount of any non-controlling interest Derecognises the cumulative translation differences, recorded in equity Recognises the fair value of the consideration received
2. SUMMARY OF SIGNIFICANT ACCOUNTING POLICIES CONTINUED

52 Dialog Semiconductor Plc | Annual report and accounts 2011 | Section 4 | Consolidated financial statements and notes
Notes to the consolidated financial statementsFor the year ended 31 December 2011
Recognises the fair value of any investment retained Recognises any surplus or deficit in profit or loss Reclassifies the parent’s share of components previously recognised in other comprehensive income to profit or loss or retained earnings, as
appropriate.
The above-mentioned requirements were applied on a prospective basis.
BUSINESS COMBINATIONS Business combinations are accounted for using the acquisition method. The cost of an acquisition is measured as the aggregate of the consideration transferred, measured at acquisition date fair value and the amount of any non-controlling interest in the acquiree. For each business combination, the Group measures the non-controlling interest in the acquiree either at fair value or at the proportionate share of the acquiree’s identifiable net assets. Acquisition costs incurred are expensed and included in administrative expenses.
When the Group acquires a business, it assesses the financial assets and liabilities assumed for appropriate classification and designation in accordance with the contractual terms, economic circumstances and pertinent conditions as at the acquisition date. This includes the separation of embedded derivatives in host contracts by the acquiree.
If the business combination is achieved in stages, the acquisition date fair value of the acquirer’s previously held equity interest in the acquiree is remeasured to fair value at the acquisition date through profit or loss.
Any contingent consideration to be transferred by the acquirer will be recognised at fair value at the acquisition date. Subsequent changes to the fair value of the contingent consideration which is deemed to be an asset or liability will be recognised in accordance with IAS 39 either in profit or loss or as a change to other comprehensive income. If the contingent consideration is classified as equity, it should not be remeasured until it is finally settled within equity.
Goodwill is initially measured at cost being the excess of the aggregate of the consideration transferred and the amount recognised for non-controlling interest over the net identifiable assets acquired and liabilities assumed. If this consideration is lower than the fair value of the net assets of the subsidiary acquired, the difference is recognised in profit or loss.
After initial recognition, goodwill is measured at cost less any accumulated impairment losses. For the purpose of impairment testing, goodwill acquired in a business combination is, from the acquisition date, allocated to each of the Group’s cash-generating units that are expected to benefit from the combination, irrespective of whether other assets or liabilities of the acquiree are assigned to those units. Where goodwill forms part of a cash-generating unit and part of the operation within that unit is disposed of, the goodwill associated with the operation disposed of is included in the carrying amount of the operation when determining the gain or loss on disposal of the operation. Goodwill disposed of in this circumstance is measured based on the relative values of the operation disposed of and the portion of the cash-generating unit retained.
FOREIGN EXCHANGE The functional currency for the Group entities is generally the currency in which they primarily generate and expend cash. Each entity in the Group determines its own functional currency. Accordingly, the assets and liabilities of companies whose functional currency is other than the US dollar are included in the consolidation by translating the assets and liabilities into the presentation currency (US$) at the exchange rates applicable at the end of the reporting period. Equity accounts are measured at historical rates. The statements of income and cash flows are translated at the average exchange rates during the year. The exchange differences arising on the translation are directly recognised in equity (other reserves).
2. SUMMARY OF SIGNIFICANT ACCOUNTING POLICIES CONTINUED

53
Transactions in foreign currencies are initially recorded at the functional currency rate ruling at the date of the transaction. Monetary assets and liabilities denominated in foreign currencies are retranslated at the functional currency rate of exchange ruling at the reporting date. All differences are taken to profit and loss with the exception of differences on monetary items that form part of a net investment in a foreign operation as well as differences on foreign currency borrowings that provide a hedge against a net investment in a foreign entity. These are taken directly to equity until the disposal of the net investment at which time they are recognised in profit or loss. Tax charges and credits attributable to exchange differences on those monetary items and borrowings are also dealt with in equity. Non-monetary items that are measured in terms of historical cost in a foreign currency are translated using the exchange rates as at the dates of the initial transaction. Non-monetary items measured at fair value in a foreign currency are translated using the exchange rates at the date when the fair value is determined. Foreign currency transaction gains and losses are disclosed separately in the income statement, at each reporting period. Key exchange rates against US dollars used in preparing the consolidated financial statements were:
Exchange rate at Annual average exchange rate
31 December 2011 31 December 2010 2011 2010
Currency US$1 = US$1 = US$1 = US$1 =
Great Britain 0.65 0.64 0.62 0.65
Japan 77.37 81.29 79.71 87.69
Euro 0.77 0.75 0.72 0.76 FINANCIAL INSTRUMENTS A financial instrument is any contract that gives rise to a financial asset in one entity and a financial liability or equity instrument in another. Financial assets include, in particular, cash and cash equivalents, trade receivables and other loans and receivables, held-to-maturity investments and derivative and non-derivative financial assets accounted for at fair value through profit or loss, as well as investments available for sale.
Financial liabilities generally substantiate claims for repayment in cash or another financial asset. In particular, this includes trade payables, liabilities to banks and derivative financial liabilities.
Financial assets and financial liabilities are offset and the net amount presented in the balance sheet when, and only when, the entity currently has a legal right to set off the recognised amounts and intends to settle on a net basis.
FINANCIAL ASSETS Financial assets within the scope of IAS 39 are classified as being at fair value through profit or loss, held-to-maturity investments, loans and receivables or available-for-sale financial assets, as appropriate. When financial assets are first recognised, they are measured at fair value, plus, in case of investments not at fair value through profit or loss, directly attributable transaction costs.
The Group determines the classification of its financial assets on first recognition and, where allowed and appropriate, re-evaluates this designation at each financial year end.
All regular purchases and sales of financial assets are recognised on the settlement date, which is the date that the Group receives the asset. Regular purchases or sales are classified as purchases or sales of financial assets that require delivery of assets within the period generally established by regulation or convention of the market place.
At each reporting date, the Group assesses whether a financial asset or group of financial assets is impaired.
2. SUMMARY OF SIGNIFICANT ACCOUNTING POLICIES CONTINUED

54 Dialog Semiconductor Plc | Annual report and accounts 2011 | Section 4 | Consolidated financial statements and notes
Notes to the consolidated financial statementsFor the year ended 31 December 2011
FINANCIAL ASSETS AT FAIR VALUE THROUGH PROFIT OR LOSS Financial assets at fair value through profit or loss include financial assets held for trading and financial assets designated upon initial recognition at fair value through profit or loss. Financial assets are classified as held for trading if they are acquired for the purpose of selling or repurchasing in the near term. This category includes derivative financial instruments entered into by the Group that are not designated as hedging instruments in hedge relationships as defined by IAS 39. Derivatives, including separated embedded derivatives are also classified as held for trading unless they are designated as effective hedging instruments. Financial assets at fair value through profit and loss are carried in the statement of financial position at fair value with changes in fair value recognised in finance income or finance costs in the income statement.
Derivatives embedded in host contracts are accounted for as separate derivatives and recorded at fair value if their economic characteristics and risks are not closely related to those of the host contracts and the host contracts are not held for trading or designated at fair value though profit or loss. These embedded derivatives are measured at fair value with changes in fair value recognised in the income statement. Reassessment only occurs if there is a change in the terms of the contract that significantly modifies the cash flows that would otherwise be required.
The Group has not entered into trading actions nor designated financial asset as financial asset through profit or loss in 2011 and 2010.
FINANCIAL ASSETS HELD TO MATURITY Non-derivative financial assets with fixed or determinable payments and fixed maturities are classified as held to maturity when the Group has the positive intention and ability to do so. After initial measurement, held-to-maturity investments are measured at amortised cost using the effective interest method. The effective interest method takes into account any premium or discount on acquisition and includes transaction costs and fees that are an integral part of the effective interest rate.
Gains and losses are recognised in profit or loss when the investments are de-recognised or impaired, as well as through the amortisation process. The carrying amount of financial assets held-to-maturity are tested at each reporting date to determine whether there is objective, material evidence of impairment as outlined in IAS 39.59. Any impairment losses caused by the fair value being lower than the carrying amount are recognised in profit or loss. The Group does not use allowance accounts in order to record the impairment in the statement of financial position but credits the impairment loss directly against the book value of the financial assets.
If in a subsequent period the fair value increases and this increase can be related objectively to events occurring after the impairment was recognised, the impairment loss is reversed to the extent that the carrying value of the asset does not exceed its amortised cost at the reversal date. The fair value which is required for impairment testing corresponds to the present value of the estimated future cash flows discounted using the original effective interest rate.
The Group has not entered into trading actions nor designated financial asset as financial asset held to maturity in 2011 and 2010.
LOANS AND RECEIVABLES Loans and receivables are non-derivative financial assets with fixed or determinable payments that are not quoted on an active market, such as trade accounts receivable. Loans and receivables are recorded initially at fair value and do not bear interest. As of 31 December 2011 as well as 31 December 2010, loans and receivables of the Group comprise trade accounts receivable from customers, cash and cash equivalents (except for deposits designated as hedging instruments). After initial recognition, loans and receivables are subsequently carried at amortised cost using the effective interest method, less any allowance for impairment, if necessary.
Gains and losses are recognised in the income statement when the loans and receivables are de-recognised or impaired. Interest income and expense on the application of the effective interest method are also recognised in profit or loss.
2. SUMMARY OF SIGNIFICANT ACCOUNTING POLICIES CONTINUED

55
The Group continuously reviews its allowance for doubtful accounts. Management considers the collectability of a trade account receivable to be impaired when it is probable that the Group will be unable to collect all amounts due according to the sales terms, based on current information and events regarding the customers’ ability to meet their obligations. The amount of the impairment loss on loans and receivables is measured as the difference between the carrying amount of the asset and the present value of estimated future cash flows, discounted at the original effective interest rate of the financial asset. The amount of the impairment loss is recognised in profit or loss.
If, in a subsequent reporting period, the amount of the impairment loss decreases, and the decrease can objectively be related to an event occurring after the impairment was recognised, the previously recognised impairment loss is reversed and recognised in profit or loss.
When a trade receivable is considered to be impaired, any credit losses are included in the allowance for doubtful accounts through a charge to bad debt expenses. Account balances are set off against the allowance after all means of collection have been exhausted and the potential for recovery is considered remote. Recoveries of trade receivables previously written-off are recorded as other income when received. Reversals of impairment losses are recognised in profit and loss. The Group does not have any off-balance sheet credit exposure related to its customers.
Receivables from work in process for customer specific development projects according to IAS 11 are recorded in the balance sheet line “trade accounts receivable and other receivables” and are disclosed in the notes respectively.
AVAILABLE-FOR-SALE FINANCIAL ASSETS Available-for-sale financial assets are those non-derivative financial assets that are designated as available-for-sale or are not classified as loans and receivables, held-to-maturity investments or as financial assets at fair value through profit or loss.
After initial measurement available-for-sale financial assets are measured at fair value. Unrealised gains and losses, net of the related tax effect, on available-for-sale financial assets are excluded from earnings and are reported as a component of other reserves until realised, or the investment is determined as being impaired.
At each reporting date, the carrying amounts of available-for-sale assets are assessed to determine whether there is objective, significant evidence of impairment as outlined in IAS 39.59. Any impairment losses on available-for-sale financial assets are charged to profit or loss. The Group does not use allowance accounts in order to record the impairment in the statement of financial position but credits the impairment loss directly against the book value of the financial assets. If this impairment relates to losses previously recognised in equity then the impairment loss is transferred from equity to the income statement. Reversals of impairment losses in respect of equity instruments or investment funds that are classified as available-for-sale are not recognised in profit or loss. Reversals of impairment losses on debt instruments are reversed through profit or loss if the increase in fair value of the instrument can be objectively related to an event occurring after the impairment loss was recognised in profit or loss.
The fair value of available-for-sale financial assets actively traded in organised financial markets is determined by reference to quoted market bid prices at the close of business on the reporting date.
For investments in which there is no active market, fair value is determined using valuation techniques, including recent arm’s length market transactions; reference to the current market value of another instrument which is substantially the same; discounted cash flow analysis; or other valuation models. If the fair value of unquoted equity instruments cannot be measured with sufficient reliability, these instruments are measured at cost (less any impairment losses, if applicable).
2. SUMMARY OF SIGNIFICANT ACCOUNTING POLICIES CONTINUED
56 Dialog Semiconductor Plc | Annual report and accounts 2011 | Section 4 | Consolidated financial statements and notes
Notes to the consolidated financial statementsFor the year ended 31 December 2011
The Group has not entered into trading actions nor designated financial asset as available-for-sale financial asset in 2011 and 2010.
DERECOGNITION OF FINANCIAL ASSETS A financial asset is derecognised when:
the right to receive cash flows from the asset have expired;
the Group retains the right to receive cash flows from the asset, but has assumed an obligation to pay them in full without material delay to a third party under a “pass through agreement”; or
the Group has transferred its rights to receive cash flows from the asset and either (a) has transferred substantially all the risks and rewards of the asset, or (b) has neither transferred nor retained substantially all the risks and rewards of the asset, but has transferred control of the asset.
When the Group has transferred its rights to receive cash flows from an asset and has neither transferred nor retained substantially all the risks and rewards of the asset, nor transferred control of the asset, the asset is recognised to the extent of the Group’s continuing involvement in it.
FINANCIAL LIABILITIES Financial liabilities primarily include trade accounts payable, liabilities due to banks, derivative financial liabilities and other liabilities.
FINANCIAL LIABILITIES MEASURED AT AMORTISED COSTS After initial recognition at fair value, less directly attributable transaction costs, financial liabilities are subsequently measured at amortised cost using the effective interest method.
FINANCIAL LIABILITIES AT FAIR VALUE THROUGH PROFIT OR LOSS Financial liabilities at fair value through profit or loss include liabilities held for trading and financial liabilities designated upon initial recognition as at fair value through profit or loss. Gains and losses on liabilities held for trading are recognised in profit or loss.
During the financial years 2011 and 2010 the Group did not classify any financial liabilities as financial liabilities at fair value through profit or loss.
DERECOGNITION OF FINANCIAL LIABILITIES A financial liability is derecognised when the obligation under the liability is discharged, cancelled or expires.
HEDGING INSTRUMENTS AND HEDGE ACCOUNTING The Group uses derivative financial instruments, such as forward contracts, mainly for the purposes of hedging currency risks that arise from its operating activities. Beside the derivative financial instruments the Group designated certain deposits as hedging instruments in order to hedge foreign currency risks as well. Such derivative financial instruments and deposits were initially recognised at fair value on the date on which a derivative contract was entered into or the cash deposit was designated as a hedging instrument and was subsequently remeasured at fair value on each subsequent reporting date. Derivatives are carried as assets when the fair value is positive and as liabilities when the fair value is negative.
Any gains and losses arising from changes in the fair value on derivatives and the deposits (only in 2010) during the year that do not qualify for hedge accounting are taken directly to profit or loss.
The fair value of derivatives is equal to their positive or negative market value. The fair value of forward currency contracts is calculated by reference to current forward exchange rates for contracts with similar maturity profiles. The fair value of the deposits in 2010 was measured based on foreign currency market rates at each reporting date.
2. SUMMARY OF SIGNIFICANT ACCOUNTING POLICIES CONTINUED

57
If the requirements for hedge accounting set out in IAS 39 are met, the Group designates and documents the hedge relationship from the date a derivative contract is entered into or the cash deposit (only in 2010) is designated as a hedging instrument, either as a fair value hedge or a cash flow hedge.
The Group did not enter into fair value hedges in 2011 and 2010.
In a cash flow hedge, the variability of cash flows to be received or paid related to a recognised asset or liability, or a highly probable forecast transaction, or a firm commitment (in case of currency risks) is hedged. To hedge a currency risk of an unrecognised firm commitment, the Group makes use of the option to recognise this as a cash flow hedge. The documentation of the hedge relationship includes identification of the hedging instrument, the hedged item or transaction, the nature of the risk being hedged and how the entity will assess the hedging instrument’s effectiveness in offsetting the exposure to changes in the hedged cash flows attributable to the hedged risk. Such hedges are expected to be highly effective in achieving offsetting changes in cash flows, and are assessed on an on-going basis to determine that they actually have been highly effective throughout the financial reporting periods for which they were designated.
For cash flow hedges, fair value changes of the effective portion of the hedging instrument are recognised in other reserves, net of applicable taxes, while any ineffective portion of the fair value changes are recognised immediately in profit or loss. Amounts taken to equity are transferred to the income statement when the hedged transaction affects the income statement, such as when the forecast or committed expenses occur. If the forecast transaction or firm commitment is no longer expected to occur, amounts previously recognised in equity are transferred to profit or loss.
If the hedging instrument does not, or no longer, qualifies for hedge accounting because the qualifying criteria for hedge accounting are not, or are no longer met, the derivative financial instruments are classified as held for trading and the deposits are classified as loans and receivables. Amounts previously recognised in equity are transferred to profit or loss.
If the hedging instrument expires or is sold, terminated or exercised without replacement or rollover, or if its designation as a hedge is revoked, amounts previously recognised in equity remain in equity until the forecast transaction or the firm commitment occurs.
CASH AND CASH EQUIVALENTS Cash and cash equivalents include highly liquid investments with original maturity dates of three months or less and are subject to an insignificant risk of changes in value. The financial position cash and cash equivalents in 2010 also included deposits designated as hedging instruments.
INVENTORIES Inventories include assets held for sale in the ordinary course of business (finished goods), in the process of production (work in process) or in the form of materials to be consumed in the production process (raw materials). Inventories are valued at the lower of cost and net realisable value. Cost, which includes direct materials, labour and overhead, plus indirect overhead, is determined using the first-in, first-out (FIFO) method. Net realisable value is the estimated selling price in the ordinary course of business, less estimated costs of completion and estimated costs to make the sale.
2. SUMMARY OF SIGNIFICANT ACCOUNTING POLICIES CONTINUED
58 Dialog Semiconductor Plc | Annual report and accounts 2011 | Section 4 | Consolidated financial statements and notes
Notes to the consolidated financial statementsFor the year ended 31 December 2011
PROPERTY, PLANT AND EQUIPMENT Property, plant and equipment are stated at cost less accumulated depreciation and accumulated impairment losses. These include the cost of replacing part of the plant and equipment when that cost is incurred, if the recognition criteria are met. Depreciation is charged on a straight-line basis over the estimated useful lives of the assets as follows:
Equipment Useful life
Test equipment Three to eight years
Leasehold improvements Shorter of useful life or lease term
Office and other equipment 18 months to 13 years The asset’s residual values, useful lives and methods of depreciation are reviewed, and adjusted if appropriate, at each financial year end.
INTANGIBLE ASSETS Intangible assets acquired separately (primarily licences, software and patents) are measured on initial recognition at cost. The cost of intangible assets acquired in a business combination (primarily customer based intangible assets, technology) is its fair value as at the date of acquisition. Intangible assets with finite useful lives are carried at cost less accumulated amortisation and accumulated impairment losses, if any. The amortisation period and the amortisation method for an intangible asset with a finite useful life is reviewed at least at the end of each reporting period. Changes in the expected useful life or the expected pattern of consumption of future economic benefits embodied in the asset is accounted for by changing the amortisation period or method, as appropriate, and are treated as changes in accounting estimates.
Intangible assets are amortised on a straight-line basis over the estimated useful lives as follows:
Intangible asset Useful life
Customer relationships and order backlog 1.5 years
Brand / base technology 2 to 4.5 years
Particular software 10 years
Other intangible assets 3 to 5 years Amortisation expenses are allocated to the cost of goods sold, selling expenses, research and development expenses, or general administration expenses. The Group has no intangible assets with an indefinite useful life.
Self-developed intangible assets are recorded on a cost basis. They are amortised on a straight-line basis over the estimated usefulness of 12-60 months. The costs of internally generated intangible assets comprise all directly attributable costs necessary to create, produce and prepare the asset to be capable of operating in a manner intended by management, e.g. costs of materials and services used or consumed in generating the intangible asset, costs of employee benefits or fees to register a legal right. Reference is also made to the accounting policy regarding research and development costs in this section.
Patents have been granted by the relevant government agency for a certain period, depending on the specific country, with the option of renewal at the end of this period. In most cases the maximum lifetime of the patents is 20 years. They are amortised over the shorter period of expected future benefit, which is principally ten years. Acquisition costs for patents are based on the cost of patent registration.
2. SUMMARY OF SIGNIFICANT ACCOUNTING POLICIES CONTINUED

59
IMPAIRMENT OF NON-MONETARY ASSETS In accordance with IAS 36, at each reporting date an assessment is made as to whether there is an indication that a non-monetary asset, such as property, plant and equipment or purchased intangibles, may be impaired. If any such indication exists, an estimate is made of the asset’s recoverable amount: the higher of an asset’s fair value, less cost to sell and its value in use. Where the carrying amount of an asset exceeds its recoverable amount, the asset is considered impaired and is written down to its recoverable amount. In assessing value in use, the estimated future cash flows are discounted to their present value, using a pre-tax discount rate that reflects current market assessments of the time value of money and the risks specific to the asset. In determining the fair value less costs to sell, an appropriate valuation model is used. For assets, an assessment is made at each reporting date as to whether any indication that previously recognised impairment losses may no longer exist or may have decreased. If such indication exists, an estimation of the recoverable amount is made. A previously recognised impairment loss is reversed only if there has been a change in the estimates used to determine the asset’s recoverable amount since the last impairment loss was recognised. If that is the case the carrying amount of the asset is increased to its recoverable amount. That increased amount, however, cannot exceed the carrying amount that would have been determined, net of depreciation, had no impairment loss been recognised for the asset in prior years. Such reversal is recognised in profit or loss.
LEASES The determination of whether an arrangement is, or contains, a lease is based on the substance of the arrangement at inception date of whether the fulfilment of the arrangement is dependent on the use of a specific asset or assets or the arrangement conveys a right to use the asset.
Where the Group is lessee, finance leases, which transfer to the Group substantially all the risks and benefits incidental to ownership of the leased item, are capitalised at the inception of the lease at the fair value of the leased property or, if lower, the present value of the minimum lease payments. Lease payments are apportioned between the finance charges and reduction of the lease liability so as to achieve a constant rate of interest on the remaining balance of the liability. Finance charges are reflected in profit and loss.
A leased asset is depreciated over the useful life of the asset. However, if there is no reasonable certainty that Dialog will obtain ownership by the end of the lease term, the asset is depreciated over the shorter of the estimated useful life of the asset and the lease term.
Operating lease payments are recognised as an expense in the income statement on a straight-line basis over the lease term.
REVENUE RECOGNITION Revenue is recognised to the extent that it is probable that the economic benefits will flow to the Group and the revenue can be reliably measured. Revenue is measured at the fair value of the consideration received or receivable, excluding discounts, rebates, and other sales taxes or duty. The Group assesses its revenue arrangements against specific criteria in order to determine if it is acting as principal or agent. The Group has concluded that it is acting as a principal in all of its revenue arrangements. The following specific recognition criteria must also be met before revenue is recognised:
SALE OF GOODS Revenue from the sale of goods is derived from the sale of products, application specific integrated circuit (“ASIC”) and application specific standard product (“ASSP”) to end customers. These products are manufactured and tested in accordance with customers’ technical specifications prior to delivery.
Revenue is recognised when title passes, the risks and rewards of ownership have been transferred to the customer, the fee is fixed or determinable, and collection of the related receivable is probable. Revenues are recorded net of sales taxes and customer discounts, if any.
The Group has insurance for product claims and also records a provision for warranty costs as a charge in cost of sales, based on historical trends of warranty costs incurred as a percentage of sales, which management has determined to be a reasonable estimate of the probable costs to be incurred for warranty claims in a period.
2. SUMMARY OF SIGNIFICANT ACCOUNTING POLICIES CONTINUED

60 Dialog Semiconductor Plc | Annual report and accounts 2011 | Section 4 | Consolidated financial statements and notes
Notes to the consolidated financial statementsFor the year ended 31 December 2011
Customer returns are permitted only for quality-related reasons within the applicable warranty period and any potential warranty claims are subject to the Group’s determination that it is at fault for damages. Such claims must usually be submitted within a short period of the date of sale.
RESEARCH AND DEVELOPMENT Revenue from customer-specific research and development contracts involving the development of new customer-specific technology is recognised on the percentage of completion basis when the outcome of the contract can be estimated reliably. A contract’s outcome can be estimated reliably when total contract revenue can equally be estimated, it is probable that economic benefits associated with the contract will flow to the Group, and the stage of contract completion can be measured reliably. When the Group is not able to meet those conditions, the policy is to recognise revenues only to the extent the expenses incurred are eligible to be recovered. Completion is measured by reference to costs incurred to date as a percentage of estimated total project costs. The percentage of completion method relies on estimates of total expected contract revenue and costs, as well as the dependable measurement of the progress made towards completing the particular project. Losses on projects in progress are recognised in the period they become likely and can be estimated. GOVERNMENT GRANTS Government grants are recognised where there is reasonable assurance that the grant will be received and all attaching conditions will be complied with. When the grant relates to an expense item, it is recognised as income over the period necessary to match the grant on a systematic basis to the costs that it is intended to compensate. Grants are deducted in reporting the related expense. The Group does not receive grants that relate to assets.
COST OF SALES Cost of sales consists of the costs of outsourced production, assembly and test, personnel costs and applicable overheads and depreciation of equipment. Provisions for estimated product warranties are recorded in cost of sales at the time the related sale is recognised.
SALES AND MARKETING EXPENSES Sales and marketing expenses consist primarily of salaries, travel expenses, sales commissions, bad debt expenses and costs associated with advertising and other marketing activities.
GENERAL AND ADMINISTRATIVE EXPENSES General and administrative expenses consist primarily of personnel and support costs for finance, human resources, ERP system and other management departments which are not attributable to development, production or sales functions.
RESEARCH AND DEVELOPMENT COSTS Costs identified as research costs are expensed as incurred, whereas development costs on an individual project are capitalised as an intangible asset and amortised over the period of expected future benefit if the Group can demonstrate the following: The technical feasibility of completing the intangible asset so that it will be available for use or sale;
Its intention to complete the intangible asset and use or sell it;
Its ability to use or sell the intangible asset;
How the intangible asset will generate probable future economic benefits. Among other things, the Group can demonstrate the existence of a market for the output of the intangible asset or the intangible asset itself or, if it is to be used internally, the usefulness of the intangible asset;
The availability of adequate technical, financial and other resources to complete the development and use or sell the intangible asset; and
Its ability to measure reliably the expenditure attributable to the intangible asset during its development.
2. SUMMARY OF SIGNIFICANT ACCOUNTING POLICIES CONTINUED

61
INTEREST INCOME/EXPENSE Interest income is recognised as interest accrues. Interest income includes interest income from investments in securities, cash and cash equivalents. Income and expense resulting from the allocation of premiums and discounts is also included. Interest expense is generally expensed as incurred.
Borrowing costs directly attributable to the acquisition, construction or production of an asset that necessarily takes a substantial period of time to get ready for its intended use or sale are capitalised as part of the cost of the respective assets. All other borrowing costs are expensed in the period they occur. Borrowing costs consist of interest and other costs that an entity incurs in connection with the borrowing of funds. The Group capitalises borrowing costs for all eligible assets where construction was commenced on or after 1 January 2009.
FOREIGN CURRENCY EXCHANGE GAINS AND LOSSES The foreign currency exchange gains and losses mainly result from foreign currency cash transactions and period end revaluation of foreign currency denominated cash into US dollars. It is the Group’s view that these gains and losses are driven by the financing activities of the Group and are therefore shown as non-operating results.
EMPLOYEE BENEFITS – DEFINED CONTRIBUTION PLANS Contributions to defined contribution and state-funded pension plans are recognised in the income statement as incurred.
INCOME TAXES Current income taxes for current and prior periods are measured at the amount expected to be recovered from or paid to the taxation authorities. The tax rates and tax laws used to compute the amount are those that are enacted or substantively enacted by the reporting date.
Deferred tax assets and liabilities are accounted for using the liability method and are recognised for the future tax consequences attributable to differences between the financial statement carrying amounts of assets and liabilities, and their respective tax bases, as well as on the carry-forward of unused tax losses that can be utilised.
Deferred tax assets and liabilities are measured using tax rates that have been enacted, or substantially enacted, by the reporting date and which are expected to apply to taxable income in the years, in which those temporary differences are expected to be recovered or settled. The effect of a change in tax rates on deferred tax assets and liabilities is recognised in income in the period that includes the enactment date.
A deferred tax asset is recognised to the extent that it is probable that taxable profit will be available against which the deductible temporary differences can be utilised. The carrying amount of deferred tax assets is reviewed at each reporting date and reduced to the extent that it is no longer probable that sufficient taxable profit will be available to allow all or part of the deferred tax asset to be utilised. Unrecognised deferred tax assets are reassessed at each reporting date and are recognised to the extent, that it has become probable that future taxable profit will allow the deferred tax asset to be recovered. Deferred tax assets being reduced in the past are presented in the notes gross less respective provisions. If in future periods it becomes probable that taxable profits will be available against which the unused tax losses can be utilized, it is assumed that tax losses incurred first will be utilized first and the respective provision will be reversed.
Deferred tax relating to items recognised outside profit or loss is recognised outside profit or loss. Deferred tax items are recognised in correlation to the underlying transaction either in other comprehensive income or directly in equity.
2. SUMMARY OF SIGNIFICANT ACCOUNTING POLICIES CONTINUED

62 Dialog Semiconductor Plc | Annual report and accounts 2011 | Section 4 | Consolidated financial statements and notes
Notes to the consolidated financial statementsFor the year ended 31 December 2011
Deferred tax assets and deferred tax liabilities are offset, if a legally enforceable right exists, to set off current tax assets against current tax liabilities and the deferred income taxes relate to the same taxable entity and the same taxation authority.
SALES TAX Revenues, expenses and assets are recognised net of the amount of sales tax, except:
Where the sales tax incurred on a purchase of assets or services is not recoverable from the taxation authority, in which case the sales tax is recognised as part of the cost of acquisition of the asset or as part of the expense item as applicable.
Receivables and payables that are stated with the amount of sales tax included.
The net amount of sales tax recoverable from, or payable to, the taxation authority is included as part of receivables or payables in the statement of financial position.
SHARE-BASED PAYMENTS The cumulative expense recognised for equity-settled transactions at each reporting date until the vesting date, reflects the extent to which the vesting period has expired and the best estimate of the number of equity instruments that will ultimately vest. The income statement charge or credit for a period represents the movement in cumulative expense in the period.
STOCK OPTIONS The Group has established an equity-settled share option scheme under which employees and Directors may be granted stock options to acquire shares of Dialog.
The fair value of options granted is recognised as a compensation expense with a corresponding increase in equity. The fair value is measured at grant date and spread over the service period during which the employees become unconditionally entitled to the options. The fair value of the options granted is measured using the Black-Scholes option pricing model, taking into account the terms and conditions on which the options were granted. Expectations of early exercise are accounted for within the average life of the options. The Group applies IFRS 2 to all options granted after 7 November 2002 that had not been vested as of 1 January 2005.
EXECUTIVES’ LONG TERM INCENTIVE PLAN The Group operates an equity settled Long-Term Incentive Plan (LTIP). Under this plan, key executives are eligible to share in a percentage of the value created for Shareholders in excess of an annual return hurdle measured over a four year performance period.
Each participant in the LTIP is awarded a number of units which convert into Company shares according to the level of outperformance of the Company’s share price over the annual return hurdle. If this hurdle is not reached no units convert into Company shares.
The fair value of the awards is recognised as a compensation expense with a corresponding increase in equity. The fair value is measured at grant date, using a Monte Carlo Model, taking into account the terms and conditions on which awards are granted and is spread over the service period during which the key executives become unconditionally entitled to the awards.
EMPLOYEE BENEFIT TRUST – TREASURY SHARES The Group has established an employee benefit trust. The employee benefit trust is separately administrated and is funded by the Group, which consolidates the assets, liabilities, income and expenses in its own accounts. The shares held by the trust are recorded at cost and are shown under “Employee stock purchase plan shares” in the statement of changes in Shareholders’ equity.
2. SUMMARY OF SIGNIFICANT ACCOUNTING POLICIES CONTINUED
63
EARNINGS PER SHARE Basic earnings per share amounts are calculated by dividing net profit (loss) for the year attributable to ordinary equity holders of Dialog by the weighted average number of ordinary shares outstanding during the year.
Diluted earnings per share amounts are calculated by dividing the net profit attributable to ordinary equity holders of Dialog by the weighted average number of ordinary shares outstanding during the year plus the weighted average number of ordinary shares that would be issued if all the securities or other contracts to issue ordinary shares were exercised.
The weighted average number of shares outstanding is as follows:
2011
000
2010
000
Basic number of shares 62,873 60,313
Effect of dilutive options outstanding 3,838 4,528
Dilutive number of shares 66,711 64,841 The number of anti-dilutive share options outstanding was 615,744 (2010: 288,114).
SIGNIFICANT ACCOUNTING JUDGEMENTS, ESTIMATES AND ASSUMPTIONS The preparation of financial statements requires management to make judgements, estimates and assumptions that affect the reported amounts of assets and liabilities, as well as disclosure of contingent assets and liabilities at the date of the financial statements and the reported amounts of revenues and expenses during the reporting period.
The significant accounting estimates and assumptions are outlined below:
IMPAIRMENT OF NON-FINANCIAL ASSETS The Group assesses whether there are any indicators of impairment for all non-financial assets at each reporting date. In case of such an indicator, an impairment test is made. This requires the determination of the value in use and the fair value less costs to sell respectively of the assets. Estimating the value in use requires management to make an estimate of the expected future cash flows from the asset and also to choose a suitable discount rate in order to calculate the present value of those cash flows. The carrying amount of such assets at 31 December 2011 was US$156,760,000 (2010: US$65,709,000).
ESTIMATION OF USEFUL LIVES Although the estimates of the useful lives of certain assets, assumptions concerning the macroeconomic environment and developments in the industry in which the Group operate, and estimates of the discounted future cash flows are believed to be appropriate, changes in assumptions or circumstances could require changes in the analysis. This could lead to impairment losses in the future or – except in the case of goodwill – to reversals of impairment losses.
BUSINESS COMBINATIONS
In accordance with business combination accounting, we allocate the purchase price of acquired companies to the tangible and intangible assets
acquired and liabilities assumed, based on their estimated fair values. We engage third-party appraisal firms to assist management in determining the
fair values of certain assets acquired and liabilities assumed. Such valuations require management to make significant estimates and assumptions,
especially with respect to intangible assets.
Management makes estimates of fair value based upon assumptions believed to be reasonable. These estimates are based on historical experience and
information obtained from the management of the acquired companies and are inherently uncertain. Critical estimates in valuing certain assets acquired
and liabilities assumed include but are not limited to: future expected cash flows from the sale of products, and engineering service sales, the acquired
company’s brand awareness and discount rate. Unanticipated events and circumstances may occur that may affect the accuracy or validity of such
assumptions, estimates or actual results. Subject to these estimates are the fair values recorded as shown in Note 4 (Business Combinations).
2. SUMMARY OF SIGNIFICANT ACCOUNTING POLICIES CONTINUED

64 Dialog Semiconductor Plc | Annual report and accounts 2011 | Section 4 | Consolidated financial statements and notes
Notes to the consolidated financial statementsFor the year ended 31 December 2011
2. SUMMARY OF SIGNIFICANT ACCOUNTING POLICIES CONTINUED DEFERRED TAX ASSETS Deferred tax assets are recognised for all unused tax losses to the extent that it is probable that taxable profit will be available against which the losses can be utilised.
Significant management judgement is required to determine the amount of deferred tax assets that can be recognised, based upon the likely timing of future taxable profits, together with future tax planning strategies. At yearend 2011, net deferred tax assets amounting to US$17,382,000 were recognised (2010: US$10,829,000). Impaired deferred tax assets at 31 December 2011 were nil (2010: US$2,079,000).
Further information regarding the assessment of future taxable income is disclosed in note 5.
SHARE-BASED EMPLOYEE COMPENSATION AWARDS Stock options
Share-based payment transactions for stock options are measured by reference to the fair value at the date on which they are granted. The fair value of share-based payments is determined using the Black-Scholes model, which involves making assumptions about interest rates, volatilities, market conditions, dividend yield, expected life and fluctuation. Due to the nature of these assumptions, such estimates are subject to significant uncertainty. In 2011, the expense related to stock options was US$5,279,000 (2010: US$2,823,000). For further information on stock options please refer to note 20a and 20c.
Executives’ Long Term Incentive Plan The fair value of the awards is recognised as a compensation expense with a corresponding increase in equity. The fair value is measured at grant date, using a Monte Carlo Model, based on standard inputs such as the Company’s share price, interest rate, and volatility of the Company’s share price, dividend yield and expected life. Due to the nature of these assumptions, such estimates are subject to significant uncertainty. In 2011, an expense of US$1,050,000 was booked (2010: US$1,404,000). Further information regarding LTIP is provided in note 20b and 20c.
CUSTOMER-SPECIFIC RESEARCH AND DEVELOPMENT For the determination of revenue and costs for customer-specific research and development contracts, management judgement is required. It is, therefore, necessary to determine the stage of completion based on the progress made towards completing the particular project, as well as the contract revenue and the contract costs. Besides an advance payment received from one customer, at 31 December 2011 no receivables or liabilities from constructions contracts were outstanding (2010: nil).
SELF-DEVELOPED INTANGIBLE ASSETS Development costs are capitalised in accordance with the accounting policy mentioned above, i.e. they are recorded on a cost basis. However, initial capitalisation of costs is based on management’s judgement that technological and economical feasibility is confirmed, usually when a product development project has reached a defined milestone according to an established project management model. In determining the probable future economic benefits of the self-developed intangible asset, management makes assumptions regarding the expected future cash generation of the assets, discount rates to be applied and the expected period of benefits. At 31 December 2011, the carrying amount of capitalised development costs was US$16,041,000 (2010: US$3,235,000).
Actual results may differ from all of the above judgements and estimates.

65
3. OTHER DISCLOSURES TO THE INCOME STATEMENT A) OPERATING EXPENSES AND REVENUES The operating result before income taxes is stated after charging:
2011
US$000
2010
US$000
Auditors' remuneration
for the audit (371) (226)
for other audit related services (67) (86)
for other services (69) (238)
(507) (550)
Depreciation of property, plant and equipment (8,801) (4,880)
Amortisation of intangible assets
thereof included in cost of sales (2,120) (1,395)
thereof included in selling and marketing expenses (5,810) (75)
thereof included in general and administrative expenses (300) (156)
thereof included in research and development expenses (7,800) (1,052)
(16,030) (2,678)
Personnel costs
Wages and salaries (68,585) (43,634)
Social and security costs (6,976) (10,259)
Share-based payment (6,331) (4,227)
Pension costs from defined contribution plans1) (5,685) (3,000)
(87,577) (61,120)
Included in revenues
Revenue from the sale of goods 524,114 293,727
Revenue from customer specific research and development contracts 1,362 2,870
Included in revenue from sale of goods income attributable to prior periods from BenQ cash settlement
(see note 26) 1,785 –
Included in cost of sales:
Costs in relation to customer specific research and development contracts (1,362) (2,870)
Amount of inventory recognised as expense (286,396) (140,733)
Impairment of inventories recognised as an expense (3,660) (1,121)
Included in other operating income
Income from recoveries on trade accounts receivable impaired in prior periods 303 106
[1] The pension costs from defined contribution plans include costs for the state funded pension plan In Germany of US$1,999,000 (2010: US$1,640,000).

Notes to the consolidated financial statementsFor the year ended 31 December 2011
66 Dialog Semiconductor Plc | Annual report and accounts 2011 | Section 4 | Consolidated financial statements and notes
B) DIRECTORS’ REMUNERATION
2011
US$000
2010
US$000
Aggregate remuneration in respect of qualifying services 1,514 1,401
2011
No.
2010
No.
Number of directors who received shares in respect of qualifying services 8 1
Number of directors who exercised share options 3 8
2011
US$000
2010
US$000
In respect of the highest paid director:
Aggregate remuneration 869 879
Of which pension contribution for the year 42 30 The highest paid director exercised 370,820 (2010: 293,342) share options during the year.
C) INTEREST INCOME AND INTEREST EXPENSE Interest income and expenses comprise the following items:
2011
US$000
2010
US$000
Interest income 376 1,130
Interest expense (235) (120)
141 1,010
Of which: from financial instruments relating to categories in accordance with IAS 39
Loans and receivables 239 1,115
Financial liabilities measured at amortised costs (98) (105)
141 1,010 D) HEADCOUNT The average number of persons employed by the Group (including the Executive Director) during the year, analysed by category, was as follows:
2011 2010
Research and Development 367 234
Production 69 52
Sales and Marketing 76 45
Admin 41 25
IT 20 13
573 369
3. OTHER DISCLOSURES TO THE INCOME STATEMENT CONTINUED

67
4. BUSINESS COMBINATION ACQUISITIONS IN 2011 On 10 February 2011, Dialog Semiconductor Plc acquired 100% of the voting shares of SiTel Semiconductor B.V. (“SiTel”) (now Dialog Semiconductor B.V.), an unlisted company headquartered and incorporated in the Netherlands and a leader in short-range wireless, digital cordless and VoIP technology. Dialog acquired SiTel in order to expand its product portfolio with short-range wireless and VoIP based internet connectivity products. This will allow Dialog to develop new products for these markets as well as to cross-sell Dialog’s existing Power Management technology to SiTel’s customer base. The acquisition significantly expands Dialog’s addressable market targeting high growth wireless personal devices. ASSETS ACQUIRED AND LIABILITIES MEASURED
Fair value recognised
on acquisition
US$000
Assets
Cash and cash equivalents 5,052
Trade accounts receivable and other receivable 12,722
Inventories 14,849
Other current assets 1,798
Property, plant and equipment 2,886
Intangible assets 1) 32,975
Income tax receivables 788
Deferred tax assets 4,776
Other non-current assets 411
Total assets 76,257
Liabilities
Trade and other payables (10,106)
Provisions (606)
Income taxes payable (40)
Other current liabilities (3,645)
Total liabilities (14,397)
Total identifiable net assets at fair value 61,860
Goodwill arising on acquisition 27,358
Purchase consideration transferred 89,218
[1] For further information please refer to note 12.
The fair value of the trade receivables and other receivables amounts to US$12,722,000. None of the trade receivables have been impaired and it is expected that the full contractual amounts can be collected.

Notes to the consolidated financial statementsFor the year ended 31 December 2011
68 Dialog Semiconductor Plc | Annual report and accounts 2011 | Section 4 | Consolidated financial statements and notes
The goodwill of US$27,358,000 comprises the value of expected synergies arising from the acquisition. Furthermore, we expect additional value from the acquisition in respect of entry to new markets, internationalisation, cross-selling opportunities and customer diversification. We were not able to allocate the goodwill to our Cash Generating Units which consists of our four operating segments as the synergies and other effects described above cannot be measured yet, as due to the timing and volatile business environment no reliable and sufficient information was available at year end 2011. As a result, no goodwill impairment test was prepared for the year ended 31 December 2011. No indications of goodwill impairment were apparent at year end.
The goodwill recognised is not expected to be deductible for income tax purposes.
From the date of the acquisition, SiTel has contributed US$108,780,000 of revenue and US$8,997,000 of net profit after tax to the Group. If the combination had taken place at the beginning of the year, revenues would have been US$120,197,000 and the profit after tax would have been US$6,550,000. PURCHASE CONSIDERATION The total purchase considerations amounted to US$89,218,000. ANALYSIS OF CASH FLOWS FROM ACQUISITION US$000
Transaction costs of the acquisition (included in cash flows from operating activities) (3,291)
Total cash outflow for acquisition (included in cash flows from investing activities) (89,218)
Net cash acquired with the subsidiary (included in cash flows from investing activities) 5,052
Net cash flow on acquisition (87,457) Transaction costs of US$3,291,000 have been expensed and are included in administrative expenses.
4. BUSINESS COMBINATION CONTINUED

69
5. INCOME TAXES Income (loss) before income taxes consists of the following:
2011
US$000
2010
US$000
Germany 60,673 52,470
Foreign 749 (8,207)
61,422 44,263 Income tax benefit (expense) is comprised of the following components:
2011
US$0002010
US$000
Current taxes:
Germany (6,682) (4,880)
Foreign (273) (372)
Deferred taxes:
Germany 4,282 3,036
Foreign (2,886) 432
Income tax expense (5,559) (1,784) 2011
US$0002010
US$000
Current taxes:
Current income tax charge (6,876) (5,252)
Adjustments in respect of current income tax of previous year (79) –
Deferred taxes:
Relating to origination and reversal of temporary differences (13,211) (7,082)
Relating to a reversal of a previous write-down of a deferred tax asset 14,607 10,550
Income tax expense (5,559) (1,784) Although Dialog is a UK company, its principal operations are located in Germany. Accordingly, the following information is based on German corporate tax law.
The tax rate for its German subsidiary is 15%; considering the impact of the solidarity surcharge of 5.5%, the federal corporate tax rate amounts to 15.825%. Combining the federal corporate tax rate with the trade tax rate of 12.551%, the combined statutory tax rate of the German subsidiary is 28.376%.

Notes to the consolidated financial statementsFor the year ended 31 December 2011
70 Dialog Semiconductor Plc | Annual report and accounts 2011 | Section 4 | Consolidated financial statements and notes
A reconciliation of income taxes determined using the combined German income tax rate of 28.376% (2010: 28.376%), is as follows:
2011
US$000 2010
US$000
Expected income tax expense (17,429) (12,560)
Tax rate differential 158 (69)
Non-deductible portion of share based payments (1,668) (1,216)
Tax benefit from share based payments (398) 13,564
Tax free income (non-deductible expenses) (2,703) (746)
Recognized deferred tax assets relating to a reversal of a previous write-down of deferred tax assets and first time recognition of deferred tax assets relating to prior years. 14,607 10,550
Benefit from previously unrecognised deferred tax assets that is used to reduce current tax expense 1,295 3,308
Additional losses for which no deferred tax asset is recognised – (14,482)
Adjustments recognised for tax of prior periods 144 134
Temporary differences arising from differences between functional currency and tax currency 462 (276)
Other (27) 9
Actual income tax expense (5,559) (1,784) Deferred income tax assets and liabilities are summarised as follows:
At 31 December 2011
US$000
At 31 December 2010
US$000
Temporary differences relating to intangible assets (3,432) (545)
Other temporary differences 361 279
Deferred taxes in relation to tax credits 1,105 1,156
Net operating loss carryforwards 19,348 12,018
Total net deferred tax assets 17,382 12,908
Impaired deferred tax assets1) – 2,079
Recognised net deferred tax assets 17,382 10,829
[1] Impaired in FY 2005. In 2011 an impairment of US$2,079,000 (2010: US$10,550,000) was reversed
5. INCOME TAXES CONTINUED

71
5. INCOME TAXES CONTINUED Tax loss carryforwards, temporary differences and net deferred tax assets are summarised as follows:
31 December 2011 31 December 2010
Tax loss
carryforwards
US$000
Temporary
Differences
US$000
Tax credits
US$000
Net deferred tax
assets
US$000
Tax loss
carryforwards
US$000
Temporary
Differences
US$000
Tax credits
US$000
Net deferred tax
assets
US$000
Germany 67,161 (4,673) – 13,726 106,825 (3,203) – 11,473
UK 51,387 25,588 4,420 1,105 33,419 46,975 4,280 1,156
Netherlands 17,184 (8,772) – 2,103 – – – –
US1) 4,290 – – – 4,317 – – –
Other 20 1,061 – 448 33 661 – 279
Total 140,042 13,204 4,420 17,382 144,594 44,433 4,280 12,9082)
[1] Including an amount of US$2,910,000 (2010: US$3,126,000) for state tax loss carryforwards
[2] The amount consists of US$10,829,000) recognised deferred tax assets and US$2,079,000 deferred tax assets impaired in 2005
The amount of deductible temporary differences and unused tax loss carryforwards for which no deferred tax asset is recognised in the balance sheet is US$95,382,000 (2010: US$155,434,000).
In assessing whether the deferred tax assets can be used, management considers the probability that some, or all, of the deferred tax assets will not be realised. The utilization of deferred tax assets depends upon generating taxable profit during the periods in which those temporary differences become deductible or tax-loss carryforwards can be utilised. Management considers the reversal of deferred tax liabilities, projected future taxable income, benefits that could be realised from available tax planning strategies and other positive and negative factors in making this assessment.
The Group recorded the fourth consecutive year of positive net income in 2011. Therefore, based on the expected positive net result for the near future, the management concluded to recognise deferred tax assets in an amount of US$17,382,000 (2010: US$10,829,000). The assessment was based on the business plan for 2012 and beyond.
The utilization of further tax loss carryforwards and temporary differences is subject to the achievement of positive income in periods which are beyond the company’s current business plan and therefore this utilization is uncertain. Consequently no deferred tax assets were recognised for these losses and temporary differences.
The state tax loss carryforwards in the US will expire between 2012 and 2024; other tax loss carryforwards have no expiration date.
Included in impaired deferred tax assets is an amount of US$1,105,000 (2010: US$1,156,000) (the increase results from foreign currency adjustments and the change of the corporation tax rate in the UK) in relation to tax credits in the UK. This asset may be recovered against future taxable profits derived from certain overseas dividends for the company concerned.
The amount shown under “income tax receivables” in the statement of financial position includes a corporation tax refund claim of the Group’s German subsidiary. The total amount the German subsidiary is entitled to receive amounts to €414,000 to be paid out in ten equal amounts during 2008 to 2017. The amount shown within the non-current assets represents the discounted part of the claim that is due after 2012. The amount that will be paid in 2012 is shown within the current assets.

Notes to the consolidated financial statementsFor the year ended 31 December 2011
72 Dialog Semiconductor Plc | Annual report and accounts 2011 | Section 4 | Consolidated financial statements and notes
6. CASH AND CASH EQUIVALENTS At 31 December
2011
US$000
At 31 December
2010
US$000
Cash at bank 91,010 80,398
Short-term deposits 20,381 70,172
Deposits designated as a hedging instrument 2,199 7,630
Cash & cash equivalents 113,590 158,200 Short-term deposits are made for varying periods of between one day and three months, depending on the immediate cash requirements of the Group. Deposits designated as a hedging instrument are classified as cash flow hedges to cover firm commitments and forecast transactions in Euros, Pound Sterling and Japanese Yen.
7. TRADE ACCOUNTS RECEIVABLE AND OTHER RECEIVABLE At 31 December
2011
US$000
At 31 December
2010
US$000
Trade accounts receivable 38,929 8,424
Receivables from factoring agreement 7,800 4,132
46,729 12,556 Trade receivables are non-interest bearing and are generally on 30-60-day terms.
As described in note 24, in 2007 the Group entered into a selective factoring agreement. The amount shown as receivables from the factoring agreement represents a 15% retainer kept by the factoring bank against sold receivables. The retainer is released only once the receivable is fully paid by the customer, at the latest, 120 days after the receivable becomes due or if the insurance event occurs. The amounts are non-interest bearing and are generally on 30-60-day terms.
The recorded trade accounts receivable for which an impairment has been recognised, was US$1,180,000 and US$1,410,000 at 31 December 2011 and 2010, respectively. The related allowance for doubtful accounts was US$1,180,000 and US$1,410,000 at 31 December 2011 and 2010, respectively.

73
The allowance for doubtful accounts developed as follows:
At 31 December
2011
US$000
At 31 December
2010
US$000
Allowance for doubtful accounts at beginning of year 1,410 1,406
Reductions credited to income (303) (106)
Effect of movements in foreign currency 73 110
Allowance for doubtful accounts at end of year 1,180 1,410 As at 31 December 2011 and 2010, the aging analysis of trade account receivable is as follows:
7. TRADE ACCOUNTS RECEIVABLE AND OTHER RECEIVABLE CONTINUED
At 31 December
2011
US$000
At 31 December
2010
US$000
Receivables neither past due nor impaired 35,969 7,310
Receivables past due, not impaired individually – –
Less than 30 days 2,780 1,114
30 to 59 days 171 –
60 to 89 days – –
90 to 130 days 9 –
Total 38,929 8,424

Notes to the consolidated financial statementsFor the year ended 31 December 2011
74 Dialog Semiconductor Plc | Annual report and accounts 2011 | Section 4 | Consolidated financial statements and notes
8. INVENTORIES Inventories are comprised of the following:
At 31 December 2011
US$000
At 31 December 2010
US$000
Raw materials 4,031 8,298
Work-in-process 22,496 7,238
Finished goods 36,110 25,197
62,637 40,733
9. OTHER FINANCIAL ASSETS Other financial assets comprise:
At 31 December 2011
US$000
At 31 December 2010
US$000
Deposits for hedging contracts – 395
Hedging instruments 25 441
25 836 The deposits for hedging contracts are an advance settlement for hedging instruments with a negative fair value. The deposits are interest bearing with 1% below the current base rate and are offset with amounts due when the hedge is settled.
The amount shown under hedging instruments includes the fair value of derivative financial instruments used for cash flow hedges. The Group is exposed to currency risks in the course of its operating activities. These risks are reduced by the use of forward currency exchange contracts.
The Group has clear guidelines as to the use of those derivatives, and compliance is constantly monitored. For further information on the Group’s hedging policy please see note 24.
10. OTHER CURRENT ASSETS Other current assets comprise:
At 31 December 2011
US$000
At 31 December 2010
US$000
Prepaid expenses 5,400 2,650
Other tax receivables 1,448 1,014
Other 1,388 414
8,236 4,078
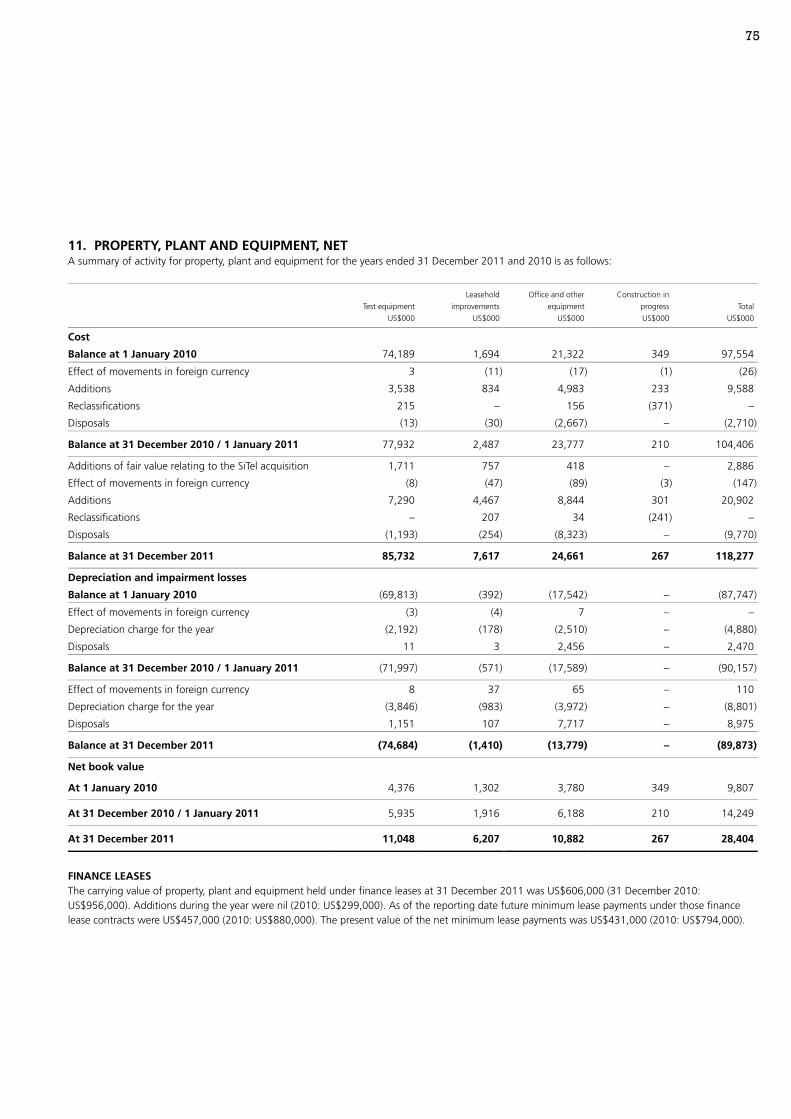
75
11. PROPERTY, PLANT AND EQUIPMENT, NET A summary of activity for property, plant and equipment for the years ended 31 December 2011 and 2010 is as follows:
Test equipment
US$000
Leasehold
improvements
US$000
Office and other
equipment
US$000
Construction in
progress
US$000
Total
US$000
Cost
Balance at 1 January 2010 74,189 1,694 21,322 349 97,554
Effect of movements in foreign currency 3 (11) (17) (1) (26)
Additions 3,538 834 4,983 233 9,588
Reclassifications 215 – 156 (371) –
Disposals (13) (30) (2,667) – (2,710)
Balance at 31 December 2010 / 1 January 2011 77,932 2,487 23,777 210 104,406
Additions of fair value relating to the SiTel acquisition 1,711 757 418 – 2,886
Effect of movements in foreign currency (8) (47) (89) (3) (147)
Additions 7,290 4,467 8,844 301 20,902
Reclassifications – 207 34 (241) –
Disposals (1,193) (254) (8,323) – (9,770)
Balance at 31 December 2011 85,732 7,617 24,661 267 118,277
Depreciation and impairment losses
Balance at 1 January 2010 (69,813) (392) (17,542) – (87,747)
Effect of movements in foreign currency (3) (4) 7 – –
Depreciation charge for the year (2,192) (178) (2,510) – (4,880)
Disposals 11 3 2,456 – 2,470
Balance at 31 December 2010 / 1 January 2011 (71,997) (571) (17,589) – (90,157)
Effect of movements in foreign currency 8 37 65 – 110
Depreciation charge for the year (3,846) (983) (3,972) – (8,801)
Disposals 1,151 107 7,717 – 8,975
Balance at 31 December 2011 (74,684) (1,410) (13,779) – (89,873)
Net book value
At 1 January 2010 4,376 1,302 3,780 349 9,807
At 31 December 2010 / 1 January 2011 5,935 1,916 6,188 210 14,249
At 31 December 2011 11,048 6,207 10,882 267 28,404 FINANCE LEASES The carrying value of property, plant and equipment held under finance leases at 31 December 2011 was US$606,000 (31 December 2010: US$956,000). Additions during the year were nil (2010: US$299,000). As of the reporting date future minimum lease payments under those finance lease contracts were US$457,000 (2010: US$880,000). The present value of the net minimum lease payments was US$431,000 (2010: US$794,000).
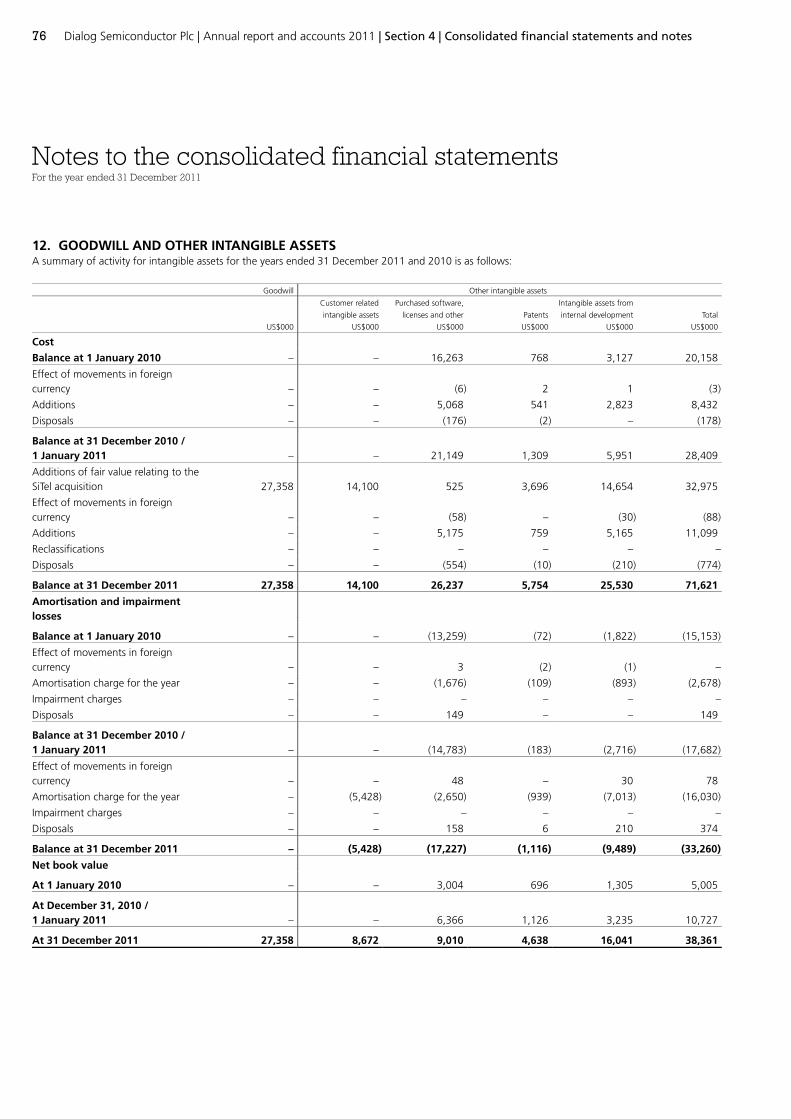
Notes to the consolidated financial statementsFor the year ended 31 December 2011
76 Dialog Semiconductor Plc | Annual report and accounts 2011 | Section 4 | Consolidated financial statements and notes
12. GOODWILL AND OTHER INTANGIBLE ASSETS A summary of activity for intangible assets for the years ended 31 December 2011 and 2010 is as follows:
Goodwill Other intangible assets
US$000
Customer related
intangible assets
US$000
Purchased software,
licenses and other
US$000
Patents
US$000
Intangible assets from
internal development
US$000
Total
US$000
Cost
Balance at 1 January 2010 – – 16,263 768 3,127 20,158
Effect of movements in foreign currency – – (6) 2 1 (3)
Additions – – 5,068 541 2,823 8,432
Disposals – – (176) (2) – (178)
Balance at 31 December 2010 / 1 January 2011 – – 21,149 1,309 5,951 28,409
Additions of fair value relating to the SiTel acquisition 27,358 14,100 525 3,696 14,654 32,975
Effect of movements in foreign currency – – (58) – (30) (88)
Additions – – 5,175 759 5,165 11,099
Reclassifications – – – – – –
Disposals – – (554) (10) (210) (774)
Balance at 31 December 2011 27,358 14,100 26,237 5,754 25,530 71,621
Amortisation and impairment losses
Balance at 1 January 2010 – – (13,259) (72) (1,822) (15,153)
Effect of movements in foreign currency – – 3 (2) (1) –
Amortisation charge for the year – – (1,676) (109) (893) (2,678)
Impairment charges – – – – – –
Disposals – – 149 – – 149
Balance at 31 December 2010 / 1 January 2011 – – (14,783) (183) (2,716) (17,682)
Effect of movements in foreign currency – – 48 – 30 78
Amortisation charge for the year – (5,428) (2,650) (939) (7,013) (16,030)
Impairment charges – – – – – –
Disposals – – 158 6 210 374
Balance at 31 December 2011 – (5,428) (17,227) (1,116) (9,489) (33,260)
Net book value
At 1 January 2010 – – 3,004 696 1,305 5,005
At December 31, 2010 / 1 January 2011 – – 6,366 1,126 3,235 10,727
At 31 December 2011 27,358 8,672 9,010 4,638 16,041 38,361

77
A key element of the additions in 2010 was the purchase of power management technology through an asset transaction from Diodes Zetex GmbH. As part of this transaction, Dialog has acquired specific Diodes intellectual property rights. The expected weighted average useful life of the acquired intangible assets is four years. A key element of the 2011 additions was the acquisition of SiTel Semiconductor B.V. In connection with this acquisition the company acquired goodwill, internally developed intangible assets, patents and customer related intangible assets, such customer relationship and order backlog. For further information, please refer to Note 4.
HIRE PURCHASE The carrying value of intangible assets held under hire purchase leases at 31 December 2011 was US$851,000 (31 December 2010: US$195,000). Additions during the year were US$668,000 (2010: nil). As of the reporting date future minimum payments under those hire purchase contracts were US$662,000 (2010: US$67,000). The present value of the net minimum payments was US$602,000 (2010: US$63,000).
13. TRADE AND OTHER PAYABLES Trade and other payables comprise:
At 31 December 2011
US$000
At 31 December 2010
US$000
Trade accounts payable 46,567 24,984
Other payables 3,890 3,429
50,457 28,413 Terms and conditions of the above trade and other payables:
trade payables are non-interest bearing and are normally settled on 30-60-day terms; and
other payables are non-interest bearing and have a term of less than three months.
14. OTHER FINANCIAL LIABILITIES Other financial liabilities comprise:
At 31 December 2011
US$000
At 31 December 2010
US$000
Hire purchase agreements and finance lease obligations 661 396
Fair value of derivative financial instruments 6,552 449
7,213 845 The Group is exposed to currency risks in the course of its operating activities. These risks are reduced by the use of forward currency exchange contracts.
12. GOODWILL AND OTHER INTANGIBLE ASSETS CONTINUED

Notes to the consolidated financial statementsFor the year ended 31 December 2011
78 Dialog Semiconductor Plc | Annual report and accounts 2011 | Section 4 | Consolidated financial statements and notes
15. PROVISIONS The Group issues various types of contractual product warranties under which it guarantees the performance of products delivered for a certain period or term. The estimated provision is based on historical warranty data. The provision for dilapidation includes costs of dismantling and restoring the offices of the Group to their original condition at end the end of the lease terms. The changes in the provision are summarised as follows:
At 1 January 2011
US$000
Currency change
US$000
Discount
000US$
Additions
US$000
Used
US$000
Released
US$000
At 31 December
2011
US$000
Obligations for product warranties 437 – – 573 (437) – 573
Dilapidation 110 – – – (61) (33) 16
Pending legal claims 311 (10) – – – – 301
Other 19 – – 150 (19) – 150
Total current 877 (10) – 723 (517) (33) 1,040
Dilapidation 428 (6) 32 82 – – 536
Total non-current 428 (6) 32 82 – – 536
Total 1,305 (16) 32 805 (517) (33) 1,576
16. OTHER CURRENT LIABILITIES Other current liabilities comprise:
At 31 December 2011
US$000
At 31 December 2010
US$000
Obligations for personnel and social expenses 12,206 12,400
Advances received in relation to customer specific research and development contracts 721 742
Other 3,625 2,733
16,552 15,875 Terms and conditions of the above other current liabilities:
obligations for personnel and social expenses have an average term of three months (2010: three months); and other payables are non-interest bearing and are normally settled on 30 day terms.
17. OTHER NON-CURRENT FINANCIAL LIABILITIES Other non-current financial liabilities include hire purchase agreements and finance lease obligations.
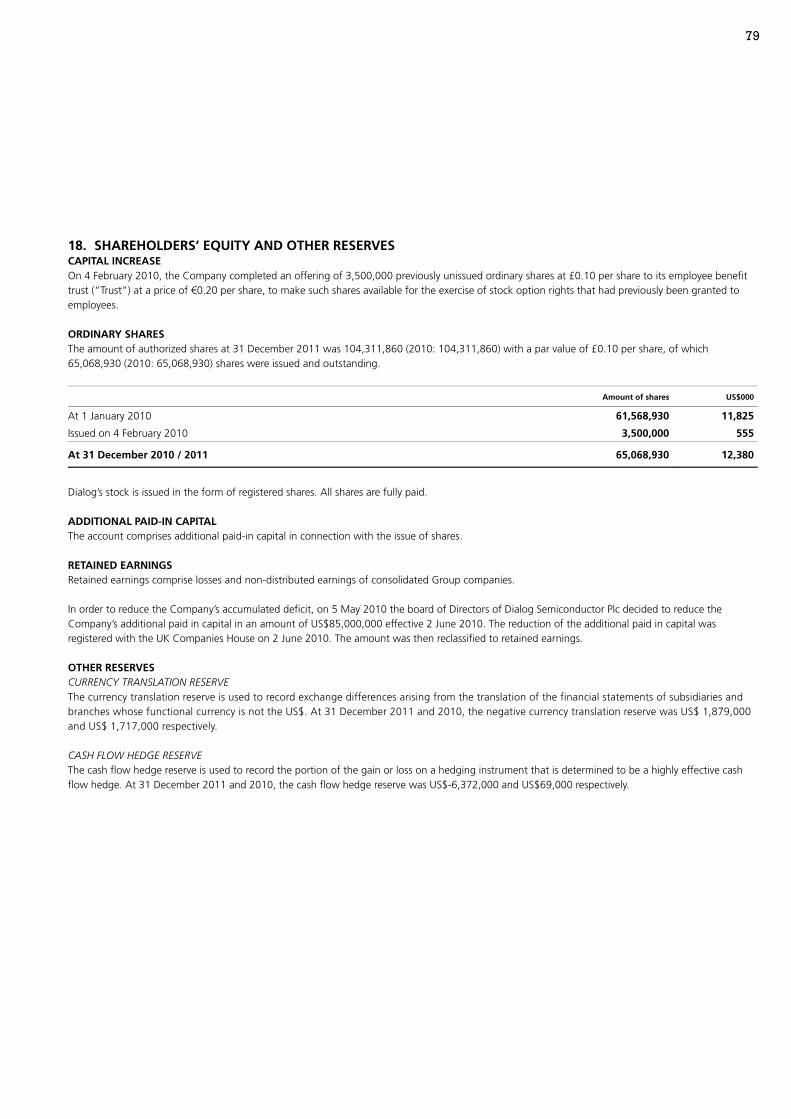
79
18. SHAREHOLDERS’ EQUITY AND OTHER RESERVES CAPITAL INCREASE On 4 February 2010, the Company completed an offering of 3,500,000 previously unissued ordinary shares at £0.10 per share to its employee benefit trust (“Trust”) at a price of €0.20 per share, to make such shares available for the exercise of stock option rights that had previously been granted to employees.
ORDINARY SHARES The amount of authorized shares at 31 December 2011 was 104,311,860 (2010: 104,311,860) with a par value of £0.10 per share, of which 65,068,930 (2010: 65,068,930) shares were issued and outstanding.
Amount of shares US$000
At 1 January 2010 61,568,930 11,825
Issued on 4 February 2010 3,500,000 555
At 31 December 2010 / 2011 65,068,930 12,380 Dialog’s stock is issued in the form of registered shares. All shares are fully paid.
ADDITIONAL PAID-IN CAPITAL The account comprises additional paid-in capital in connection with the issue of shares.
RETAINED EARNINGS Retained earnings comprise losses and non-distributed earnings of consolidated Group companies.
In order to reduce the Company’s accumulated deficit, on 5 May 2010 the board of Directors of Dialog Semiconductor Plc decided to reduce the Company’s additional paid in capital in an amount of US$85,000,000 effective 2 June 2010. The reduction of the additional paid in capital was registered with the UK Companies House on 2 June 2010. The amount was then reclassified to retained earnings.
OTHER RESERVES CURRENCY TRANSLATION RESERVE The currency translation reserve is used to record exchange differences arising from the translation of the financial statements of subsidiaries and branches whose functional currency is not the US$. At 31 December 2011 and 2010, the negative currency translation reserve was US$ 1,879,000 and US$ 1,717,000 respectively.
CASH FLOW HEDGE RESERVE The cash flow hedge reserve is used to record the portion of the gain or loss on a hedging instrument that is determined to be a highly effective cash flow hedge. At 31 December 2011 and 2010, the cash flow hedge reserve was US$-6,372,000 and US$69,000 respectively.
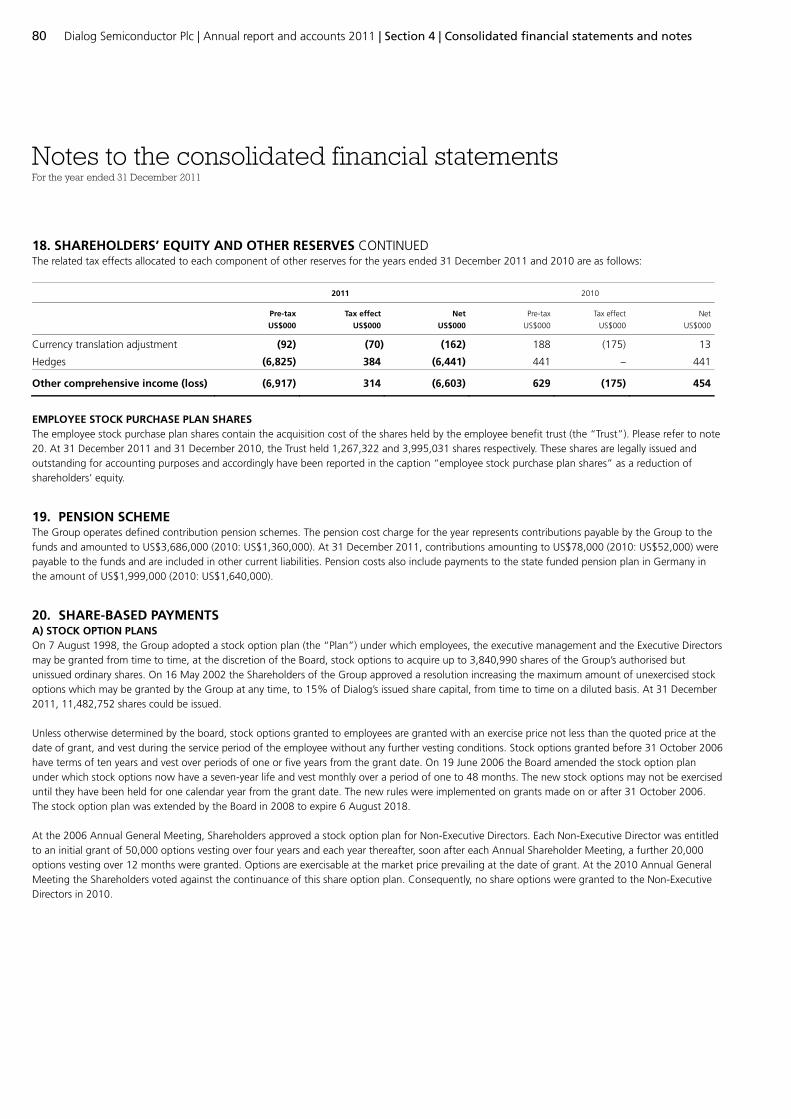
Notes to the consolidated financial statementsFor the year ended 31 December 2011
80 Dialog Semiconductor Plc | Annual report and accounts 2011 | Section 4 | Consolidated financial statements and notes
The related tax effects allocated to each component of other reserves for the years ended 31 December 2011 and 2010 are as follows:
2011 2010
Pre-tax
US$000
Tax effect
US$000
Net
US$000
Pre-tax
US$000
Tax effect
US$000
Net
US$000
Currency translation adjustment (92) (70) (162) 188 (175) 13
Hedges (6,825) 384 (6,441) 441 – 441
Other comprehensive income (loss) (6,917) 314 (6,603) 629 (175) 454
EMPLOYEE STOCK PURCHASE PLAN SHARES The employee stock purchase plan shares contain the acquisition cost of the shares held by the employee benefit trust (the “Trust”). Please refer to note 20. At 31 December 2011 and 31 December 2010, the Trust held 1,267,322 and 3,995,031 shares respectively. These shares are legally issued and outstanding for accounting purposes and accordingly have been reported in the caption “employee stock purchase plan shares” as a reduction of shareholders’ equity.
19. PENSION SCHEME The Group operates defined contribution pension schemes. The pension cost charge for the year represents contributions payable by the Group to the funds and amounted to US$3,686,000 (2010: US$1,360,000). At 31 December 2011, contributions amounting to US$78,000 (2010: US$52,000) were payable to the funds and are included in other current liabilities. Pension costs also include payments to the state funded pension plan in Germany in the amount of US$1,999,000 (2010: US$1,640,000).
20. SHARE-BASED PAYMENTS A) STOCK OPTION PLANS On 7 August 1998, the Group adopted a stock option plan (the “Plan”) under which employees, the executive management and the Executive Directors may be granted from time to time, at the discretion of the Board, stock options to acquire up to 3,840,990 shares of the Group’s authorised but unissued ordinary shares. On 16 May 2002 the Shareholders of the Group approved a resolution increasing the maximum amount of unexercised stock options which may be granted by the Group at any time, to 15% of Dialog’s issued share capital, from time to time on a diluted basis. At 31 December 2011, 11,482,752 shares could be issued.
Unless otherwise determined by the board, stock options granted to employees are granted with an exercise price not less than the quoted price at the date of grant, and vest during the service period of the employee without any further vesting conditions. Stock options granted before 31 October 2006 have terms of ten years and vest over periods of one or five years from the grant date. On 19 June 2006 the Board amended the stock option plan under which stock options now have a seven-year life and vest monthly over a period of one to 48 months. The new stock options may not be exercised until they have been held for one calendar year from the grant date. The new rules were implemented on grants made on or after 31 October 2006. The stock option plan was extended by the Board in 2008 to expire 6 August 2018.
At the 2006 Annual General Meeting, Shareholders approved a stock option plan for Non-Executive Directors. Each Non-Executive Director was entitled to an initial grant of 50,000 options vesting over four years and each year thereafter, soon after each Annual Shareholder Meeting, a further 20,000 options vesting over 12 months were granted. Options are exercisable at the market price prevailing at the date of grant. At the 2010 Annual General Meeting the Shareholders voted against the continuance of this share option plan. Consequently, no share options were granted to the Non-Executive Directors in 2010.
18. SHAREHOLDERS’ EQUITY AND OTHER RESERVES CONTINUED
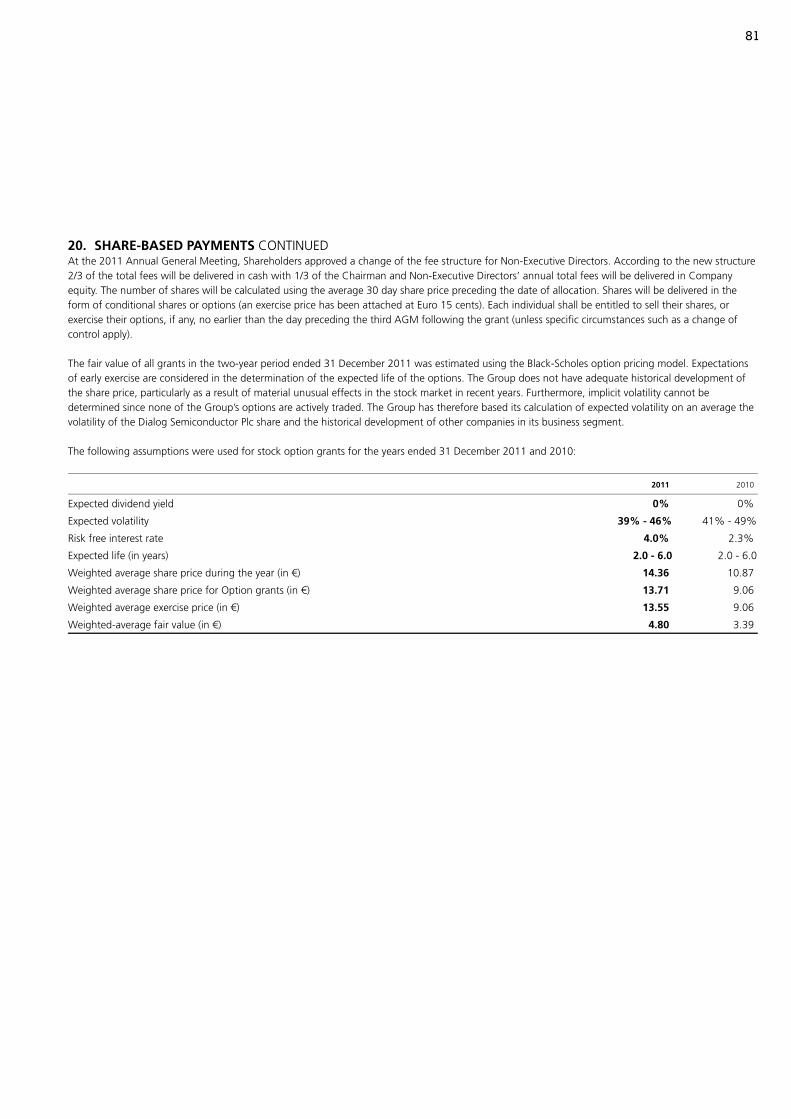
81
At the 2011 Annual General Meeting, Shareholders approved a change of the fee structure for Non-Executive Directors. According to the new structure 2/3 of the total fees will be delivered in cash with 1/3 of the Chairman and Non-Executive Directors’ annual total fees will be delivered in Company equity. The number of shares will be calculated using the average 30 day share price preceding the date of allocation. Shares will be delivered in the form of conditional shares or options (an exercise price has been attached at Euro 15 cents). Each individual shall be entitled to sell their shares, or exercise their options, if any, no earlier than the day preceding the third AGM following the grant (unless specific circumstances such as a change of control apply).
The fair value of all grants in the two-year period ended 31 December 2011 was estimated using the Black-Scholes option pricing model. Expectations of early exercise are considered in the determination of the expected life of the options. The Group does not have adequate historical development of the share price, particularly as a result of material unusual effects in the stock market in recent years. Furthermore, implicit volatility cannot be determined since none of the Group’s options are actively traded. The Group has therefore based its calculation of expected volatility on an average the volatility of the Dialog Semiconductor Plc share and the historical development of other companies in its business segment.
The following assumptions were used for stock option grants for the years ended 31 December 2011 and 2010:
2011 2010
Expected dividend yield 0% 0%
Expected volatility 39% - 46% 41% - 49%
Risk free interest rate 4.0% 2.3%
Expected life (in years) 2.0 - 6.0 2.0 - 6.0
Weighted average share price during the year (in €) 14.36 10.87
Weighted average share price for Option grants (in €) 13.71 9.06
Weighted average exercise price (in €) 13.55 9.06
Weighted-average fair value (in €) 4.80 3.39
20. SHARE-BASED PAYMENTS CONTINUED

Notes to the consolidated financial statementsFor the year ended 31 December 2011
82 Dialog Semiconductor Plc | Annual report and accounts 2011 | Section 4 | Consolidated financial statements and notes
B) EXECUTIVES’ LONG TERM INCENTIVE PLAN (LTIP) The Group also operates the Dialog Semiconductor Plc Long Term Incentive Plan (LTIP) which was approved by shareholders at the Annual General Meeting in April 2008. Under the LTIP, key executives are eligible to share in a percentage of the value created for shareholders in excess of an annual return hurdle measured over a four-year performance period (this was originally a three-year period, extended by one year at the Annual General Meeting in April 2009). This value is delivered to a participant in the form of a series of nil-cost options which can be exercised within five years of the date of grant. The first award under the LTIP was made on 8 May 2008.
In 2010 a new award under LTIP was made to selected new and existing members of the executive management. These awards are shown under “Second award” in the table below. In 2011, no further awards under the LTIP plan were made.
The fair value of the LTIP, where the number of nil-cost options granted to an individual is contingent upon the returns to Shareholders, was calculated using a Monte Carlo simulation model. As a portion of each award is capable of vesting at three separate measurement dates each tranche has been valued separately in accordance with IFRS2.
The fair values used in the calculations are as follows:
First award Second award
Inputs Tranche 1 Tranche 2 Tranche 3 LTIP extension Tranche 1 Tranche 2
Share price at grant date €1.40 €1.40 €1.40 €4.08 €10.51 €10.51
Exercise price £0.10 £0.10 £0.10 £0.10 £0.10 £0.10
Expected life (years) 0.64 1.64 2.64 2.35 0.54 1.54
Expected volatility 40% 40% 40% 42% 42% 42%
Risk-free-interest-rate 4.8202% 4.8202% 4.8202% 1.4900% 0.4820% 0.7040% Expected volatility has been determined on the same basis as the input into the fair value calculation for share options granted during the year.
MEASUREMENT DATE 31 JANUARY 2010 The measurement share price at 31 January 2010 (average share price over the prior 30 days) was €9.8942. As this price was above the return hurdle for January 2010 of €1.82 (prior year return hurdle of €1.62+12.5%), 3,055,064 nil cost option grants were approved by the board on 4th February 2010, with 25% exercisable from 22 February 2010 and the remaining 75% exercisable for 4 years from 21 February 2011.
MEASUREMENT DATE 31 JANUARY 2011 The measurement share price at 31 January 2011 (average share price over the prior 30 days) was €17.6632. As this price was above the return hurdle for January 2010 of €11.1310 (prior year measurement share price of €9.8942+12.5%), 1,575,327 nil cost option grants were approved by the board on 18 February 2011, all exercisable for 5 years from 18 February 2011.
20. SHARE-BASED PAYMENTS CONTINUED

83
C) DEVELOPMENT OF PLANS Stock option plan activity (including stock options granted under the LTIP) for the years ended 31 December 2011 and 2010 was as follows:
2011 2010
Options
Weighted average
exercise price
€ Options
Weighted average
exercise price
€
Outstanding at beginning of year 6,098,193 2.88 4,803,342 2.27
Granted 2,975,730 6.45 3,979,392 2.49
Exercised (2,727,709) 0.60 (2,364,603) 1.13
Forfeited (185,635) 7.35 (319,938) 1.80
Outstanding at end of year 6,160,579 5.48 6,098,193 2.88
Options exercisable at year end 3,532,169 1.90 1,644,626 1.89 The weighted average share price at the date of exercise of options was €14.04 and €13.61 in the years ended 31 December 2011 and 2010 respectively.
Liabilities from share option exercises to employees were US$135,000 at 31 December 2011 (2010: US$920,000).
The following table summarises information on stock options outstanding (including stock options granted under the LTIP) at 31 December 2011:
Options outstanding Options exercisable
Range of Exercise Prices
Number
outstanding at 31
December 2011
Weighted average
remaining
contractual life
(in years)
Weighted average
exercise price
€
Number exercisable
at 31 December 2011
Weighted average
exercise price
€
€0.11 - 2.99 3,247,740 6.2 0.67 2,878,827 0.61
€3.00 - 8.00 745,949 4.4 6.23 387,356 5.75
€8.00 - 15.50 2,166,890 6.0 12.42 265,986 10.32
€0.11 - 15.50 6,160,579 3.8 5.48 3,532,169 1.90 D) EMPLOYEE BENEFIT TRUST The Group established an employee benefit trust (the “Trust”). The Trust purchases shares in the Group for the benefit of employees under the Group’s share option scheme. At 31 December 2011 the Trust held 1,267,322 shares (2010: 3,995,031).
20. SHARE-BASED PAYMENTS CONTINUED

Notes to the consolidated financial statementsFor the year ended 31 December 2011
84 Dialog Semiconductor Plc | Annual report and accounts 2011 | Section 4 | Consolidated financial statements and notes
21. ADDITIONAL DISCLOSURES ON FINANCIAL INSTRUMENTS Amount categorised in accordance with IAS 39:
Amounts recognised in the statement of financial position according to IAS 39
Category
in accordance
with IAS 39
Carrying
amount
31 December 2011
US$000
Amortised cost
US$000
Cost
US$000
Fair value
recognised
in other
comprehensive
income
US$000
Fair value
recognised in
profit or loss
US$000
Fair value
31 December
2011
US$000
Assets
Cash at bank and Short-term deposits LaR 111,391 111,391 – – – 111,391
Restricted cash LaR – – – – – –
Deposits designated as a hedging instrument n/a 2,199 – – 2,199 – 2,199
Trade accounts receivable and other receivable LaR 46,729 46,729 – – – 46,729
Other non-derivative financial assets
Deposits for hedging contracts LaR – – – – – –
Derivative financial assets
Derivatives without hedging relationship n/a – – – – – –
Derivatives with hedging relationship n/a 25 – – 25 – 25
Liabilities
Trade account payables FLAC 46,567 46,567 – – – 46,567
Other payables FLAC 3,890 3,890 – – – 3,890
Other financial liabilities FLAC 1,034 1,034 – – 1,034
Derivative financial liabilities
Derivatives without hedging relationship n/a – – – – – –
Derivatives with hedging relationship n/a 6,552 – – 6,552 – 6,552
Of which aggregated by category in accordance with IAS 39:
Loans and receivables (LaR) 158,120 158,120 – – – 158,120
Deposits designated as a hedging instrument 2,199 – – 2,199 – 2,199
Held-to-maturity investments (HtM) – – – – – –
Available-for-sale financial assets (AfS) – – – – – –
Derivatives without hedging relationship – – – – – –
Derivatives with hedging relationship (6,527) – – (6,527) – (6,527)
Financial liabilities at amortised cost (FLAC) (51,491) (51,491) – – – (51,491)

85
Amounts recognised in the statement of financial position according to IAS 39
Category
in accordance
with IAS 39
Carrying
amount
31 December 2010
US$000
Amortised cost
US$000
Cost
US$000
Fair value
recognised
in other
comprehensive
income
US$000
Fair value
recognised in
profit or loss
US$000
Fair value
31 December
2010
US$000
Assets
Cash at bank and Short-term deposits LaR 150,570 150,570 – – – 150,570
Restricted cash LaR – – –
Deposits designated as a hedging instrument n/a 7,630 – – 7,630 – 7,630
Trade accounts receivable and other receivable LaR 12,556 12,556 – – – 12,556
Other non-derivative financial assets
Deposits for hedging contracts LaR 395 395 – – – 395
Derivative financial assets
Derivatives without hedging relationship n/a – – – – – –
Derivatives with hedging relationship n/a 441 – – 441 – 441
Liabilities
Trade account payables FLAC 24,984 24,984 – – – 24,984
Other payables FLAC 3,429 3,429 – – – 3,429
Other financial liabilities FLAC 857 857 – – – 857
Derivative financial liabilities
Derivatives without hedging relationship n/a – – – – – –
Derivatives with hedging relationship n/a 449 – – 449 – 449
Of which aggregated by category in accordance with IAS 39:
Loans and receivables (LaR) 163,521 163,521 – – – 163,521
Deposits designated as a hedging instrument 7,630 – – 7,630 – 7,630
Held-to-maturity investments (HtM) – – – – – –
Available-for-sale financial assets (AfS) – – – – – –
Derivatives without hedging relationship – – – – – –
Derivatives with hedging relationship (8) – – (8) – (8)
Financial liabilities at amortised cost (FLAC) (29,270) (29,270) – – – (29,270) The fair value of derivatives has been determined with reference to available market information (Level 2). The carrying amounts of the loans and receivables and financial liabilities approximate their fair values due to short-term maturities.
21. ADDITIONAL DISCLOSURES ON FINANCIAL INSTRUMENTS CONTINUED

Notes to the consolidated financial statementsFor the year ended 31 December 2011
86 Dialog Semiconductor Plc | Annual report and accounts 2011 | Section 4 | Consolidated financial statements and notes
22. COMMITMENTS OPERATING LEASE, SOFTWARE AND SERVICE COMMITMENTS The Group leases all its office facilities and vehicles, and some of its office and test equipment, under operating leases. Future minimum lease payments under non-cancellable operating rental and lease agreements and payments for other commitments are as follows:
Operating leases and
software
commitments
Other commitments Operating leases and
software
commitments
Other commitments
2011
US$000
2011
US$000
2010
US$000
2010
US$000
Within one year 7,682 3,034 5,724 2,689
Between one and two years 7,078 1,528 4,388 2,567
Between two and three years 4,565 188 3,453 1,019
Between three and four years 2,490 – 2,750 130
Between four and five years 2,332 – 2,052 –
Thereafter 8,266 – 11,934 –
Total minimum payments 32,413 4,750 30,301 6,405 Total payments for operating leases and software commitments, charged as an expense in the income statement, amounted to US$9,219,361 and US$5,313,000 for the years ended 31 December 2011 and 2010 respectively.
FINANCE LEASE, HIRE PURCHASE AND SOFTWARE COMMITMENTS The Group has finance leases and hire purchase contracts for test and IT equipment and has software contracts. The leases have terms of renewal but no purchase options and escalation clauses. Renewals are at the option of the specific entity that holds the lease. Future minimum payments under finance leases and hire purchase and software contracts together with the present value of the net minimum payments are as follows:
Minimum payments
2011
US$000
2010
US$000
Within one year 700 445
Between one and two years 418 397
Between two and three years – 105
Total minimum payments 1,118 947
Less amounts representing finance charges (84) (90)
Present value of minimum payments 1,034 857 CAPITAL COMMITMENTS The Group has contractual commitments for the acquisition of property, plant and equipment in 2011of US$2,264,000 (2010: US$2,485,000) and for the acquisition of intangible assets of US$2,501,000 (2010: US$3,110,000).
In addition the company has a contingent liability of US$400,000 in connection with the purchase of intangible assets. This liability is contingent to certain shipping volumes, relating to the acquired technology, being met. We expect to reach these shipping volumes in 2012.

87
23. SEGMENTAL REPORTING Following the provisions of IFRS 8, reportable operating segments are identified based on the “management approach”. The management approach requires external segment reporting based on the Group’s internal organisational and management structure and on internal financial reporting to the chief operating decision maker, which considered the Group as being the Board of Management.
The Group reports on four operating segments, which are independently managed by bodies responsible for the respective segments depending on the nature of products offered. The identification of Company components as operating segments is based in particular on the existence of business unit managers who report directly to the Board of Management of Dialog and who are responsible for the performance of the segment under their charge. Following the change in IFRS 8.23, the Group does no longer report assets and liabilities as only inventories are reported to the chief operating decision maker. Prior-year figures have been adjusted accordingly.
A) OPERATING SEGMENTS The Group’s operating segments are:
AUDIO AND POWER MANAGEMENT This segment includes our power management and audio chips especially designed to meet the needs of the wireless systems markets.
DISPLAY SYSTEMS The products in this segment include a range of advanced driver technologies for low power display applications – from PMOLEDs, to electronic paper and MEMS displays.
AUTOMOTIVE AND INDUSTRIAL In the automotive and industrial market our products address the safety, management and control of electronic systems in cars and for industrial applications.
CONNECTIVITY The activities of this segment include short-range wireless, digital cordless and VoIP technology. The new Connectivity segment includes the operating segment of our newly acquired subsidiary SiTel Semiconductor B.V. SiTel was acquired on 10 February 2011; therefore its results are consolidated from this date.

Notes to the consolidated financial statementsFor the year ended 31 December 2011
88 Dialog Semiconductor Plc | Annual report and accounts 2011 | Section 4 | Consolidated financial statements and notes
2011 2010
Audio & Power
Management
US$000
Display
Systems 3) 4)
US$000
Automotive/
Industrial
US$000
Connectivity
US$000 Reconciliation
US$000
Total
US$000
Audio & Power
Management
US$000
Display
Systems 3) 4)
US$000
Automotive/
Industrial
US$000
Reconciliation
US$000
Total
US$000
Revenues 1) 369,211 1,715 45,878 108,778 1,679 5) 527,261 245,364 1,866 50,326 (959) 296,597
R&D expenses 56,763 5,302 4,527 20,012 3,442 90,046 40,711 5,121 8,510 2,123 56,465
Operating profit (loss) 2) 69,960 (10,146) 9,844 4,853 (12,878) 61,633 59,078 (11,205) 6,987 (9,519) 45,341
Depreciation/ amortisation 16,915 1,556 1,353 5,007 – 24,831 4,878 1,227 1,453 – 7,558
Inventory impairment and fixed asset disposal losses
3,876 156 661 73 – 4,766 4,880 1,229 1,455 2 7,560
Investments 21,907 2,015 1,752 6,484 – 32,158 11,629 2,926 3,465 – 18,020
At 31 Dec 2011 At 31 Dec 2010
Inventories 45,505 296 5,957 10,879 – 62,637 33,659 500 6,574 – 40,733
[1] All revenues are from sales to external customers
[2] Certain overhead costs are predominantly allocated based on sales and headcount.
[3] Revenue is partially generated from funded research and development activity.
[4] The operating loss reflects the investment in the emerging display technology.
[5] The revenue in the reconciliation column include mainly the BenQ settlement please refer to note 26 and sales discounts
Revenues in the reconciliation column include the BenQ Cash settlement of US$1,785,000 (2010: nil) and sales discounts on early payment of US$107,000 (2010: US$959,000). R&D expenses in the reconciliation column predominantly include stock option expenses and expenses for the Management Long Term Incentive Plan (LTIP) of US$3,442,000 (2010: US$2,123,000).
The operating losses recorded in the reconciliation column for the year ended 31 December 2011of US$12,112,000 (2010: US$9,519,000) are primarily resulting from stock option expenses, bonus payments for employees, expenses in relation to the Long Term Incentive Plan introduced in 2008, sales discounts for early payments and the costs of the holding company. Additionally in 2011 the BenQ cash settlement in the amount of US$2.1 million was included.
Investments comprise additions to property, plant and equipment, and intangible assets.
In 2011 and 2010 the Group had no inter-segment sales, income, expenses, receivables, payables or provisions.
There are no differences between the measurements of the reportable segments profits and losses, assets and liabilities and the entity’s profit and losses, assets and liabilities.
23. SEGMENTAL REPORTING CONTINUED

89
B) GEOGRAPHIC INFORMATION – REVENUES BY SHIPMENT DESTINATION 2011
US$000
2010
US$000
Revenues
Hungary 29,159 38,171
United Kingdom 3,499 518
Other European countries 54,240 24,328
China 336,910 182,300
Other Asian countries 83,941 26,472
Other countries 19,512 24,808
Total revenues 527,261 296,597
Investments
Germany 25,371 15,122
Japan 785 147
United Kingdom 3,034 2,615
Netherlands 2,612 –
Other 356 136
Total investments 32,158 18,020 At 31 December 2011
US$000
At 31 December 2010
US$000
Assets
Germany 236,561 245,828
Japan 2,925 1,455
United Kingdom 8,052 5,503
Netherlands 93,763 –
Other 3,163 593
Total assets 344,464 253,379
Revenues are allocated to countries based on the location of the shipment destination. Segmental investments and assets are allocated based on the geographic location of the asset.
23. SEGMENTAL REPORTING CONTINUED

90 Dialog Semiconductor Plc | Annual report and accounts 2011 | Section 4 | Consolidated financial statements and notes
Notes to the consolidated financial statementsFor the year ended 31 December 2011
24. FINANCIAL RISK MANAGEMENT OBJECTS AND POLICIES VULNERABILITY DUE TO CERTAIN SIGNIFICANT RISK CONCENTRATIONS The Group’s future results of operations involve a number of risks and uncertainties. Factors that could affect the Group’s future operating results and cause actual results to vary materially from historical results include, but are not limited to, the highly cyclical nature of both the semiconductor and wireless communications industries, dependence on certain customers and the ability to obtain an adequate supply of sub-micron wafers.
The Group's products are generally utilised in the wireless and automotive industries. The Group generates a substantial portion of its revenue from the wireless communications market, which accounted for 70% and 83% of its total revenue for the years ended 31 December 2011 and 2010, respectively.
The Group’s revenue base is diversified by geographic region and by individual customer. Changes in foreign currency exchange rates influence the Group’s results of operations. The Group’s sales, purchases of raw materials and manufacturing services are primarily denominated in US$. The Group also has foreign currency exchange risks with respect to its net investments in foreign subsidiaries and branches in the United Kingdom, Japan, Taiwan, Hong Kong, Korea and Singapore. Fluctuations in the currencies of these countries could have a significant impact on the Group’s reported results from operations.
The Group depends on a relatively small number of customers for a substantial portion of its revenues, and the loss of one or more of these customers may result in a significant decline in future revenue.
During 2011, one customer individually accounted for more than 10% of the Group's revenues. Total revenues from this customer were US$321,367,000. Net receivables from this customer were US$28,311,000 at 31 December 2011. This customer is part of the Audio & Power Management Segment.
During 2010, three customers individually accounted for more than 10% of the Group's revenues. Total revenues from these three customers were US$222,550,000. Net receivables from these three customers were US$7,051,000 at 31 December 2010. The three customers are part of the Audio & Power Management Segment (for further information please see Section 2 – Principal customers).
The Group is performing on-going credit evaluations of its customers' financial condition.
FINANCIAL RISK MANAGEMENT OBJECTIVES AND POLICIES The Group’s principal financial instruments, other than derivatives, comprise cash, cash equivalents, restricted cash and short-term deposits. The main purpose of these financial instruments is to raise finance for the Group’s operations. The Group has other financial instruments which mainly comprise trade receivables and trade payables which arise directly from its operations.
The Group also entered into derivative transactions (forward currency contracts). The purpose is to manage the currency risks arising from the Group’s operations.
It is, and has been throughout 2011 and 2010, the Group’s policy that no trading in derivatives shall be undertaken.
91
Exposure to currency, interest rate and credit risk arises in the normal course of the Group’s business. The Board of Directors reviews and agrees policies for managing each of these risks which are summarised below:
MARKET RISK Market risk is the risk that the fair value of future cash flows of a financial instrument will fluctuate because of changes in market prices. Market prices comprise three types of risk: interest rate risk, currency risk and other price risk, such as equity risk. Financial instruments affected by market risk include loans and borrowings, deposits, available-for-sale investments, and derivative financial instruments.
INTEREST RISK The Group earns interest from deposits and uses money market deposits with highly rated financial institutions. During the year, the Group has held cash on deposit with a range of maturities from one week to one month. This can vary in view of changes in the underlying currency’s interest rates and the Group’s cash requirements.
The Group pays interest on amounts received in connection with the factoring agreement as prescribed below.
The Group has no long-term debt outstanding under short-term credit facilities as at 31 December 2011 (2010: nil).
The Group’s policy is to manage its interest income using a mix of fixed and variable interest rate debts. In order to achieve this policy, the Group invests in highly liquid funds having a matching investment strategy. Once the operating business has been financed, short-term excess funds are invested in floating interest rate securities. Only short-term deposits bear fixed interest rates.
The following table demonstrates the sensitivity to a reasonably possible change in interest rates, with all other variables held constant, of the Group’s profit before tax as well as the Group’s equity:
Increase/decrease in
basis points
Effect on profit
US$000
Effect on equity
US$000
2011
34 129 129
(34) (129) (129)
2010
65 881 881
(65) (881) (881) CURRENCY RISK The main functional currency within the Group and the presentation currency for the consolidated financial statements is the US$. Accordingly, foreign exchange risks arise from transactions, and recognised assets and liabilities, the functional currency of which is not the US$. The currencies giving rise to these exposure risks are primarily the Euro and Pound Sterling. The majority of the Group’s revenue and material expenses are denominated in US$. The majority of other operating expenses are denominated in Euros and Pounds Sterling. The Group has transactional currency exposures. Such exposure arises from the sales or purchases by an operating unit in currencies other than the unit’s functional currency. In 2011 and 2010 nearly all the Group’s sales were denominated in US$.
The Group uses forward currency contracts as well as certain deposits (together referred to as the “hedging instruments”) to eliminate the currency exposure of recurring expected payments, such as salaries, wages and office rents non-US$ denominated. The hedging instruments must be the same currency as the hedged item.
It is the Group’s policy not to enter into forward contracts nor classify deposits as non-derivative hedging instruments until a firm commitment is in place and to maximise hedge effectiveness by negotiating the terms of hedge instruments to match the terms of the hedged item.
The following table demonstrates the sensitivity to a reasonably possible change in the US dollar exchange rate, with all other variables held constant, of the Group’s profit before tax (resulting from changes in the fair value of monetary assets, excluding securities, and liabilities) and the Group’s equity (resulting from changes in the fair value of deposits designated as cash flow hedges).
24. FINANCIAL RISK MANAGEMENT OBJECTIVES AND POLICIES CONTINUED

92 Dialog Semiconductor Plc | Annual report and accounts 2011 | Section 4 | Consolidated financial statements and notes
Notes to the consolidated financial statementsFor the year ended 31 December 2011
24. FINANCIAL RISK MANAGEMENT OBJECTS AND POLICIES CONTINUED Loans and receivables (LaR) 1) Financial liabilities at amortised cost (FLAC) 1)
Increase/decrease
against US$
Effect on profit
US$000
Effect on equity
US$000
Effect on profit
US$000
Effect on equity
US$000
2011
Euro 3% 300 374 (33) (33)
Pound Sterling 0.5% 8 8 (5) (5)
Euro (3%) (300) (374) 33 33
Pound Sterling (0.5%) (8) (8) 5 5
2010
Euro 7% 514 913 (145) (145)
Pound Sterling 4% 4 4 (36) (36)
Euro (7%) (514) (913) 145 145
Pound Sterling (4%) (4) (4) 36 36 [1] Categories according to IAS 39
A risk analysis for the Group’s securities was done separately, based on the inherent historic volatility of the specific securities, see below.
CREDIT RISK The Group is exposed to credit risk from its operating activities and certain financing activities. The Group trades only with recognised, creditworthy third parties. It is the Group’s policy that all customers who wish to trade on credit terms are subject to credit verification procedures. In addition, receivable balances are monitored on an on-going basis, with the result that the Group’s exposure to bad debts is not significant. Regarding the risk concentration please see above, “vulnerability due to certain significant considerations”.
In order to finance its growth the Group entered into two factoring agreements with reputable financial institutions. The maximum amount of cash that can be received under these agreements is US$42,000,000 (2010: US$25,000,000), the increase represents a newly signed agreement for Dialog B.V., the company acquired in 2011. The agreements, which comprise receivables from selective customers, significantly reduce the underlying credit risk because the financial institutions assume all credit risks associated with the collection of the receivables financed under the programmes.
The Group’s exposure to credit risk arising from other financial assets of the Group, which comprise cash, cash equivalents and restricted, would arise from default by counterparty.
LIQUIDITY RISK The Group uses quarterly cash flow forecasts to monitor its liquidity risk. It takes financial investments and financial assets (e.g. trade accounts receivable and other financial assets) into consideration, as well as projected cash flows from operations. The Group’s objective is to minimise interest expense by avoiding the use of short-term bank liabilities or bank overdrafts within the Group.
At 31 December 2011, the Group had cash and cash equivalents of US$113,590,000 (2010: US$158,200,000).

93
The Group’s policy is to structure its maturities of current financial assets within the Group to meet 100% of the respective maturities of the liabilities. The table below summarises the maturity profile of the Group’s financial liabilities at 31 December 2011, based on contractual undiscounted payments:
Less than 3 months
US$000
3 to 12 months
US$000
1 to 5 years
US$000
Total
US$000
Financial year ended 2011
Trade accounts payable 46,567 – – 46,567
Other payables 3,890 – – 3,890
Other financial liabilities 7,213 – 373 7,586
57,670 – 373 58,043
Financial year ended 2010
Trade accounts payable 24,984 – – 24,984
Other payables 3,429 – – 3,429
Other financial liabilities 248 597 461 1,306
28,661 597 461 29,719 At 31 December 2011, the Group had unused short-term credit lines of US$5 million (2010: US$5 million) and a multi-currency revolving credit line facility of £10 million (2010: £10 million) There were no amounts outstanding under these credit lines at 31 December 2011 (2010: nil).
CAPITAL MANAGEMENT The primary objective of the Group’s capital management is to ensure that it maintains healthy and strong capital ratios in order to support its business and strategies for growth. The company is considering its total equity as capital.
The Group manages its capital structure and makes adjustments to it in the light of changes in economic conditions. To maintain or adjust its capital structure, the Group may generally issue new shares. No changes were made in the objectives, policies or processes during the years ending 31 December 2011 and 31 December 2010.
The Group monitors capital using an equity ratio (total equity divided by total assets). The equity ratio as of 31 December 2011 was 76.4% (2010: 81.1%). Capital includes net Shareholders’ equity. The Group’s policy is to finance business development and growth if at all possible with equity rather than long-term liabilities. It is, therefore, also its policy to keep a strong equity ratio. This policy will be reconsidered as soon as sustainable profits are earned in order to achieve leverage.
24. FINANCIAL RISK MANAGEMENT OBJECTIVES AND POLICIES CONTINUED

94 Dialog Semiconductor Plc | Annual report and accounts 2011 | Section 4 | Consolidated financial statements and notes
Notes to the consolidated financial statementsFor the year ended 31 December 2011
HEDGING ACTIVITIES At 31 December 2011, the Group held deposits (referred to as the “hedging instruments”) designated as hedges of firm commitments in Euros. At 31 December 2010, the Group held deposits (referred to as the “hedging instruments”) designated as hedges of firm commitments and forecast transactions in Euros and Pound Sterling and Japanese Yen.
The hedging instruments are being used to hedge the foreign currency risk of contractual cash flows, principally resulting from wages and salaries, and rental payments with the aim of eliminating the currency risk by transforming these cash flows from Euros or Pounds Sterling or Japanese Yen into US dollars. The fair values of the forward exchange contracts which equal the book values are as follows:
At 31 December 2011 At 31 December 2010
Assets
US$000
Liabilities
US$000
Assets
US$000
Liabilities
US$000
Fair values
Forward exchange contracts 25 6,552 441 449
Deposits 2,199 – 7,630 – The critical terms of the deposits have been set to match the terms of the hedged cash flows.
The cash flow hedges of the expected future cash flows in each month from January 2012 to December 2012 and January 2011 to December 2011 respectively were assessed to be highly effective and, at 31 December 2011, a net unrealised loss of US$6,372,000 was included in other comprehensive income in respect of these cash flows (2010: gain of US$69,000). During the financial year 2011 a net loss of US$3,768,000 (2010: loss of US$2,390,000) was recognised in other comprehensive income and a net gain of US$3,058,000 (2010: loss of US$2,831,000) was reclassified from other comprehensive income and recognised in profit and loss. The months of occurrence of the cash flows are the same as the month when the income statement is affected.
The following tables show the contractual maturities of the payments for which deposits are used as hedging instruments, i.e., when the hedged item will be recognised in profit or loss.
24. FINANCIAL RISK MANAGEMENT OBJECTS AND POLICIES CONTINUED

95
Hedging instruments for Euro commitments:
Maturity Nominal amount €000 Forward rate Nominal amount €000 Spot rate
Derivatives Deposits
2011
January 2012 9,000 1.3622 – –
February 2012 5,000 1.3823 – –
March 2012 9,400 1.3505 – –
April 2012 5,000 1.3915 – –
May 2012 5,000 1.3907 – –
June 2012 5,000 1.3901 – –
July 2012 5,000 1.3768 – –
August 2012 5,000 1.3994 1,700 1.4293
September 2012 5,000 1.3985 – –
October 2012 5,000 1.3654 – –
November 2012 5,000 1.3654 – –
December 2012 5,000 1.3654 – –
2010
January 2011 3,000 1.3443 1,667 1.3409
February 2011 1,600 1.3500 1,667 1.3409
March 2011 1,600 1.3497 1,667 1.3409
April 2011 3,100 1.3097 700 1.2124
May 2011 3,300 1.3106 – –
June 2011 3,300 1.3104 – –
July 2011 3,000 1.3300 – –
August 2011 3,000 1.3297 – –
September 2011 3,000 1.3293 – –
October 2011 3,000 1.3289 – –
November 2011 – – – –
December 2011 – – – –
24. FINANCIAL RISK MANAGEMENT OBJECTIVES AND POLICIES CONTINUED

96 Dialog Semiconductor Plc | Annual report and accounts 2011 | Section 4 | Consolidated financial statements and notes
Notes to the consolidated financial statementsFor the year ended 31 December 2011
Hedging instruments for Pound Sterling commitments:
Maturity Nominal amount £000 Forward rate
Derivatives
2011
January 2012 1,900 1.5951
February 2012 1,900 1.5945
March 2012 2,600 1.5897
April 2012 1,900 1.5944
May 2012 1,900 1.5947
June 2012 1,900 1.5908
July 2012 1,900 1.6005
August 2012 1,900 1.6005
September 2012 1,900 1.6001
October 2012 1,900 1.5827
November 2012 1,900 1.5827
December 2012 1,900 1.5827
2010
January 2011 1,550 1.5435
February 2011 2,050 1.5513
March 2011 2,350 1.5606
April 2011 1,450 1.5770
May 2011 1,750 1.5769
June 2011 1,750 1.5766
July 2011 1,600 1.5775
August 2011 1,700 1.5770
September 2011 1,700 1.5764
October 2011 1,500 1.5759
November 2011 1,700 1.5754
December 2011 – –
Hedging instruments for Japanese Yen commitments:
Maturity Nominal amount ¥000 Forward rate
Derivatives
2011
January 2012 60,000 0.0129
February 2012 64,000 0.0129
March 2012 75,000 0.0129
24. FINANCIAL RISK MANAGEMENT OBJECTS AND POLICIES CONTINUED

97
25. TRANSACTIONS WITH RELATED PARTIES For the relationship between the parent company, Dialog Semiconductor Plc, and its subsidiaries please see note 2.
Related parties are comprised of seven (2010: seven) non-executive members of the Board of Directors and ten (2010: ten) members of the executive management which are named in the management and governance section. These are the only related parties of the Group.
All transactions with related parties are carried out at arm´s length.
COMPENSATION OF KEY MANAGEMENT PERSONNEL OF THE GROUP For the composition of our key management please see management and governance beginning on page 29. Compensation of key management personnel of the Group is as follows:
2011
US$000
2010
US$000
Short term employee benefits 4,129 4,319
Post-employment benefits1) 170 165
Share based payments 1,180 1,439
5,479 5,923 [1] The amounts include payments for defined contribution plans.
COMPENSATION OF NON-EXECUTIVE DIRECTORS The compensation of Non-Executive Directors was US$645,080 (2010: US$521,000). As at 31 December 2011 the amount of US$67,000 for Board member fees was outstanding (2010: US$23,000). For further information please see the Directors’ remuneration report within the management and governance section on pages 35 to 37.
OTHER RELATED PARTY TRANSACTIONS In 2011 and 2010 there were no other transactions with related parties. None of the related parties has a major influence in one of the Group’s major suppliers or customers.
26. BENQ SETTLEMENT In the second quarter of 2011, the company received an unexpected cash settlement of US$2.1 million. As the allocation of the payment was not confirmed by the paying party, we were only able to allocate it in Q3 to receivables which had been previously written down and revenues that had not been recognised in 2006 as a result of the insolvency of BenQ Mobile. The amount represents 30% of the original claim to BenQ Mobile. Of this amount, US$1.8 million were classified as revenue and US$0.3 million were classified as other operating income. The amount shown as revenue represents prior period revenue. As one of the criteria for revenue recognition under IFRS was not met, for this amount the related revenue was not accounted for in 2006. The amount shown as other operating income was previously recognised as revenue in the periods preceding the insolvency but the underlying receivables were written down against other operating expenses.
27. SUBSEQUENT EVENT There are no known events after the date of the Statement of Financial Position that require disclosure.

Company financial statements On the following pages information regarding the holding company Dialog Semiconductor Plc is given
98 Dialog Semiconductor Plc | Annual report and accounts 2011 | Section 5 | Company financial statements and notes
Notes At 31 December 2011
US$000
At 31 December 2010
US$000
Assets
Cash and cash equivalents 27,429 80,307
Amounts owed by group undertakings 14,599 30,580
Prepaid expenses 371 91
Other financial assets – 507
Other current assets 180 195
Total current assets 42,579 111,680
Investments 28 161,855 97,521
Total non-current assets 161,855 97,521
Total assets 204,434 209,201
Trade and other payables 684 1,119
Other payables 367 124
Total current liabilities 1,051 1,243
Ordinary Shares 12,380 12,380
Share Premium 203,911 202,416
Retained deficit (9,519) (2,992)
Other reserves (231) 69
Employee stock purchase plan shares (3,158) (3,915)
Total Shareholders´ equity 31 203,383 207,958
Total liabilities and Shareholders´ equity 204,434 209,201 PROFIT FOR THE FINANCIAL YEAR As permitted by Section 408 of the Companies Act 2006, the parent company’s profit and loss account has not been included in these financial statements. The parent company’s loss after taxation was US$6,629,000 (2010: US$7,030,000).
These financial statements were approved by the Board of Directors on 16 February 2012 and were signed on its behalf by:
Dr Jalal Bagherli Director
Company statement of financial position For the year ended 31 December 2011
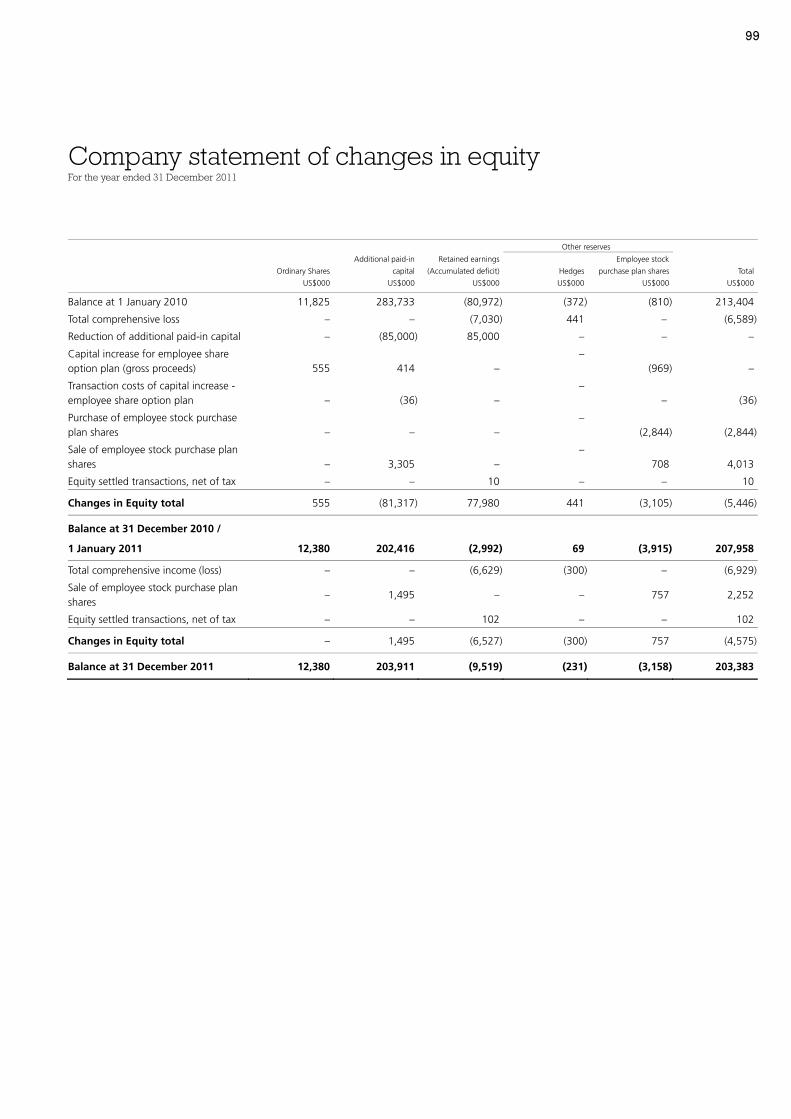
99
Other reserves
Ordinary Shares
US$000
Additional paid-in
capital
US$000
Retained earnings
(Accumulated deficit)
US$000
Hedges
US$000
Employee stock
purchase plan shares
US$000
Total
US$000
Balance at 1 January 2010 11,825 283,733 (80,972) (372) (810) 213,404
Total comprehensive loss – – (7,030) 441 – (6,589)
Reduction of additional paid-in capital – (85,000) 85,000 – – –
Capital increase for employee share option plan (gross proceeds) 555 414 –
– (969) –
Transaction costs of capital increase - employee share option plan – (36) –
– – (36)
Purchase of employee stock purchase plan shares – – –
– (2,844) (2,844)
Sale of employee stock purchase plan shares – 3,305 –
– 708 4,013
Equity settled transactions, net of tax – – 10 – – 10
Changes in Equity total 555 (81,317) 77,980 441 (3,105) (5,446)
Balance at 31 December 2010 /
1 January 2011 12,380 202,416 (2,992) 69 (3,915) 207,958
Total comprehensive income (loss) – – (6,629) (300) – (6,929)
Sale of employee stock purchase plan shares
– 1,495 – – 757 2,252
Equity settled transactions, net of tax – – 102 – – 102
Changes in Equity total – 1,495 (6,527) (300) 757 (4,575)
Balance at 31 December 2011 12,380 203,911 (9,519) (231) (3,158) 203,383
Company statement of changes in equityFor the year ended 31 December 2011

Company financial statements
100 Dialog Semiconductor Plc | Annual report and accounts 2011 | Section 5 | Company financial statements and notes
2011
US$000
2010
US$000
Cash flows from operating activities:
Net loss (6,629) (7,030)
Adjustments to reconcile net loss to net cash provided by (used for) operating activities:
Interest income, net (940) (1,567)
Expense related to share-based payments 102 8
Changes in working capital:
Trade accounts payable (435) 346
Other assets and liabilities 447 (402)
Cash used for operations (7,455) (8,645)
Interest received 258 898
Cash flow used for operating activities (7,197) (7,747)
Cash flows from investing activities:
Purchase of SiTel Semiconductor B.V. (89,218) –
Loans repaid by other group companies 41,577 14,547
Cash flow from (used for) investing activities (47,641) 14,547
Cash flows from financing activities:
Cash flow used for capital increase – (36)
Purchase of employee stock purchase plan shares – (2,844)
Sale of employee stock purchase plan shares 2,254 4,013
Cash flow from financing activities 2,254 1,133
Net foreign exchange difference (294) 450
Net increase (decrease) in cash and cash equivalents (52,878) 8,383
Cash and cash equivalents at beginning of period 80,307 71,924
Cash and cash equivalents at end of period 27,429 80,307
Company statement of cash flowsFor the year ended 31 December 2011

101
28. INVESTMENTS This represents the investment of the Company in Dialog Semiconductor GmbH and in 2011 also Dialog Semiconductor BV. Investments in subsidiaries are stated at cost less any provision for impairment in value.
The aggregate amount of capital and reserves and the results of this undertaking were as follows:
2011
US$000
2010
US$000
Capital and reserves 147,048 70,583
Profit for the year 65,145 48,455 Based on preliminary unaudited results.
29. DEFERRED TAX The utilization of tax loss carryforwards and temporary differences of the holding company is subject to the achievement of positive income in periods which are beyond the company’s current business plan and therefore this utilization is uncertain. Consequently no deferred tax assets were recognised for these losses and temporary differences.
For further information on deferred taxes see note 5 to the consolidated financial statements as at 31 December 2011.
30. AUDITORS’ REMUNERATION 2011
US$000
2010
US$000
Auditors' remuneration
for the audit 310 185
for other audit related services 67 78
for other services 69 230
446 493
31. SHARE CAPITAL AND SHARE OPTIONS Details of the Company’s share capital and share options are set out in notes 18 and 20 to the consolidated financial statements as at 31 December 2011. Because of the accumulated deficit, the Company cannot pay a dividend and does not plan to pay dividends in the foreseeable future.
32. HEADCOUNT AND COSTS The Company does not have any employees.
33. EVENTS AFTER THE REPORTING PERIOD There are no known events after the date of the Statement of Financial Position that require disclosure.
Notes to the Company financial statements For the year ended 31 December 2011

Dialog
Semicond
uctor Plc A
nnual report and accounts | 2011
Dialog Semiconductor PlcTower Bridge HouseSt Katherine’s WayLondon E1W 1AAUK
www.dialog-semiconductor.com