diamond jubilee yesterday, today and tomorrow closing remarks june 7, 2011
TRANSCRIPT

Diamond JubileeYesterday, Today and Tomorrow
Closing RemarksJune 7, 2011

Thanks

Overview
• How we view our world • Trends and Back to the Future thinking• Changes. Yes more changes. Are We Ready?
– Systems Thinking– Sustainable Materials Management
• Saving Tomorrow The Old Fashion Way: With hard work and collaboration
• Future is now!

Thanks to you
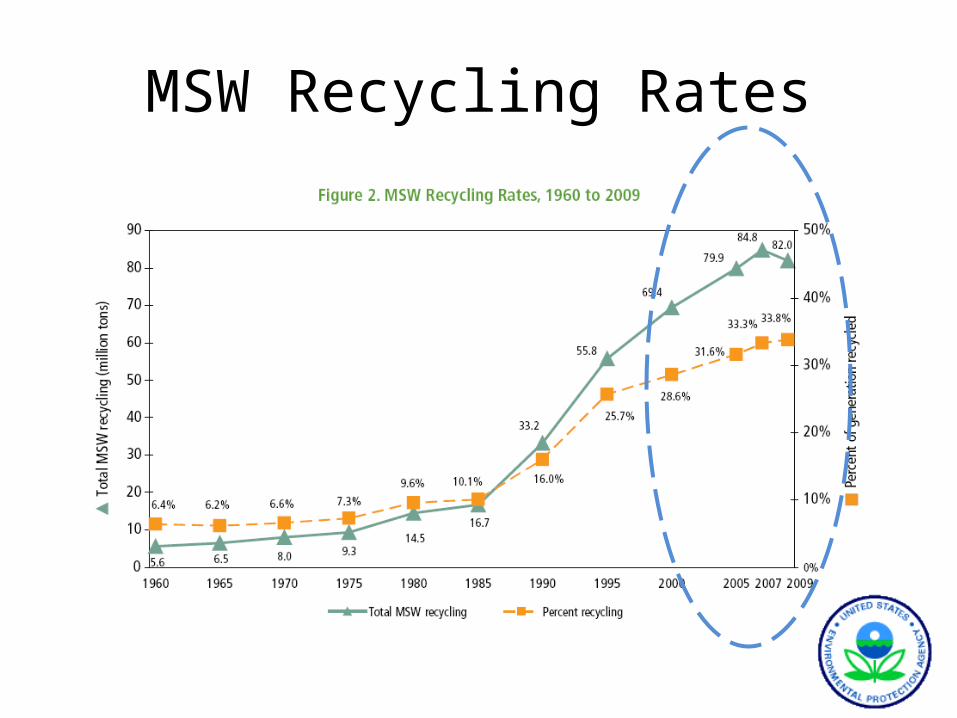
MSW Recycling Rates

It was the race to the moon

First Earth Shot from the moonLunar Orbiter 1 August 23, 1966

Apollo 8Christmas Eve 1968

Christmas Eve Earthrise 1968

And Stewart Brand insistence

Google before Google

For the first time to see ourselves

In a different way

And that little blue ball

Called Planet Earth

Our home

World Population Trends
• 1 billion 1804• 2 billion 1927• 3 billion 1960• 4 billion 1974• 5 billion 1987• 6 billion 1999• 7 billion Oct 2011

How many Earth’s needed by 2030?

How many Earth’s needed by 2030?

How many Earth’s needed by 2050?

How many Earth’s needed by 2030?

But we only have one!

o In past 50 yrs, humans consumed more resources than in all past history
o In 2000, U.S. consumed 57% more materials than in 1975; global consumption increase was even greater
o U.S. has < 5% of world’s population but is responsible for about 1/3 of world’s total materials consumption in 1970-1995
o Our reliance on minerals as fundamental ingredients in manufactured products used in U.S. (e.g., cell phones, paint, toothpaste) requires extraction of >25,000 lbs of new nonfuel minerals per capita each year
o 1992 Earth Summit world leaders declared that “a principal cause of the continued deterioration of the global environment is the steady increase in materials production, consumption and disposal”
Unsustainable Trajectory

1960 1965 1970 1975 1980 1985 1990 1995 2000 20052007200820090
50
100
150
200
250
300
0
2
4
6
8
10
0.0
88.1
0.00.00.00.0
104.4
0.00.00.00.0
121.1
0.0
0.00.00.0
127.8
0.00.00.00.0
151.6
0.00.00.00.0
166.3
0.00.00.00.0
208.3
0.00.00.00.0
217.3
0.00.00.00.0
242.5
0.00.00.00.0
252.4
0.0
255.0
0.00.00.0
243.0
0.0
0.00
2.68
0.000.000.000.00
2.96
0.000.000.000.00
3.25
0.00
0.000.000.00
3.25
0.000.000.000.00
3.66
0.000.000.000.00
3.83
0.000.000.000.00
4.57
0.000.000.000.00
4.52
0.000.000.000.00
4.72
0.000.000.000.00
4.67
0.00
4.63
0.000.000.00
4.34
0.00
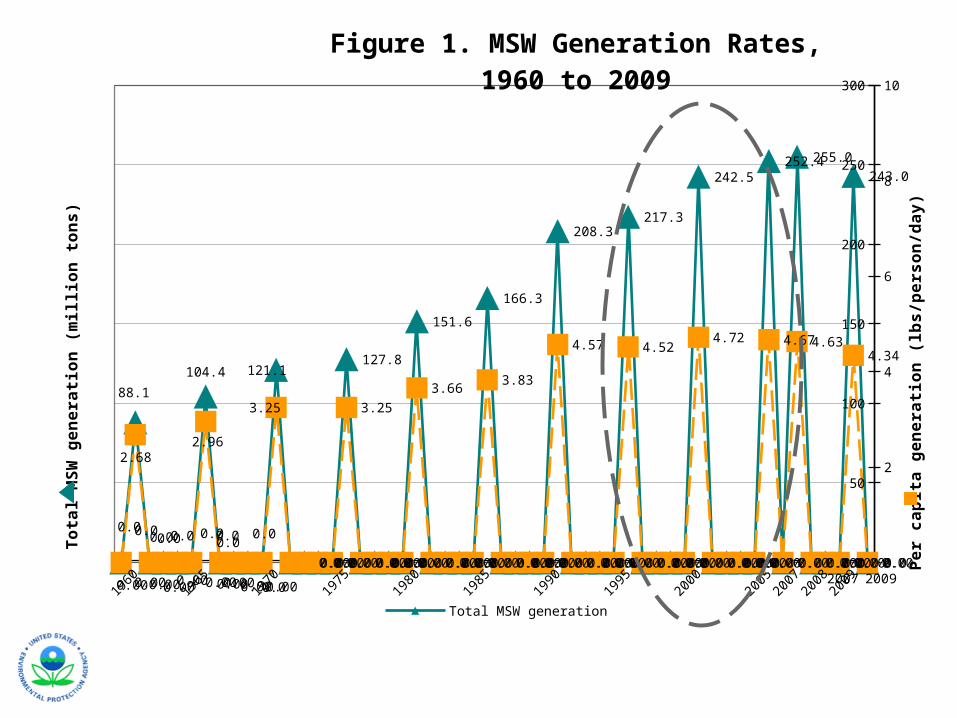
Figure 1. MSW Generation Rates,1960 to 2009
Total MSW generation Per capita generation
To
tal M
SW
ge
ne
rati
on
(m
illio
n t
on
s)
Pe
r c
ap
ita
ge
ne
rati
on
(lb
s/p
ers
on
/da
y)
20092007

1960 1965 1970 1975 1980 1985 1990 1995 2000 20052007200820090
50
100
150
200
250
300
0
2
4
6
8
10
0.0
88.1
0.00.00.00.0
104.4
0.00.00.00.0
121.1
0.0
0.00.00.0
127.8
0.00.00.00.0
151.6
0.00.00.00.0
166.3
0.00.00.00.0
208.3
0.00.00.00.0
217.3
0.00.00.00.0
242.5
0.00.00.00.0
252.4
0.0
255.0
0.00.00.0
243.0
0.0
0.00
2.68
0.000.000.000.00
2.96
0.000.000.000.00
3.25
0.00
0.000.000.00
3.25
0.000.000.000.00
3.66
0.000.000.000.00
3.83
0.000.000.000.00
4.57
0.000.000.000.00
4.52
0.000.000.000.00
4.72
0.000.000.000.00
4.67
0.00
4.63
0.000.000.00
4.34
0.00
Figure 1. MSW Generation Rates,1960 to 2009
Total MSW generation Per capita generation
To
tal M
SW
ge
ne
rati
on
(m
illio
n t
on
s)
Pe
r c
ap
ita
ge
ne
rati
on
(lb
s/p
ers
on
/da
y)
20092007

1970’s
Godfather, Rocky and The Sting

1960 1965 1970 1975 1980 1985 1990 1995 2000 20052007200820090
50
100
150
200
250
300
0
2
4
6
8
10
0.0
88.1
0.00.00.00.0
104.4
0.00.00.00.0
121.1
0.0
0.00.00.0
127.8
0.00.00.00.0
151.6
0.00.00.00.0
166.3
0.00.00.00.0
208.3
0.00.00.00.0
217.3
0.00.00.00.0
242.5
0.00.00.00.0
252.4
0.0
255.0
0.00.00.0
243.0
0.0
0.00
2.68
0.000.000.000.00
2.96
0.000.000.000.00
3.25
0.00
0.000.000.00
3.25
0.000.000.000.00
3.66
0.000.000.000.00
3.83
0.000.000.000.00
4.57
0.000.000.000.00
4.52
0.000.000.000.00
4.72
0.000.000.000.00
4.67
0.00
4.63
0.000.000.00
4.34
0.00
Figure 1. MSW Generation Rates,1960 to 2009
Total MSW generation Per capita generation
To
tal M
SW
ge
ne
rati
on
(m
illio
n t
on
s)
Pe
r c
ap
ita
ge
ne
rati
on
(lb
s/p
ers
on
/da
y)
20092007

The 1980’s
Platoon, Gandhi, Out of Africa
1960 1965 1970 1975 1980 1985 1990 1995 2000 20052007200820090
50
100
150
200
250
300
0
2
4
6
8
10
0.0
88.1
0.00.00.00.0
104.4
0.00.00.00.0
121.1
0.0
0.00.00.0
127.8
0.00.00.00.0
151.6
0.00.00.00.0
166.3
0.00.00.00.0
208.3
0.00.00.00.0
217.3
0.00.00.00.0
242.5
0.00.00.00.0
252.4
0.0
255.0
0.00.00.0
243.0
0.0
0.00
2.68
0.000.000.000.00
2.96
0.000.000.000.00
3.25
0.00
0.000.000.00
3.25
0.000.000.000.00
3.66
0.000.000.000.00
3.83
0.000.000.000.00
4.57
0.000.000.000.00
4.52
0.000.000.000.00
4.72
0.000.000.000.00
4.67
0.00
4.63
0.000.000.00
4.34
0.00
Figure 1. MSW Generation Rates,1960 to 2009
Total MSW generation Per capita generation
To
tal M
SW
ge
ne
rati
on
(m
illio
n t
on
s)
Pe
r c
ap
ita
ge
ne
rati
on
(lb
s/p
ers
on
/da
y)
20092007

The 1990’s
Internet and Cable explosion
Dances with Wolves,Forest Gump, Braveheart, Titanic

1960 1965 1970 1975 1980 1985 1990 1995 2000 20052007200820090
50
100
150
200
250
300
0
2
4
6
8
10
0.0
88.1
0.00.00.00.0
104.4
0.00.00.00.0
121.1
0.0
0.00.00.0
127.8
0.00.00.00.0
151.6
0.00.00.00.0
166.3
0.00.00.00.0
208.3
0.00.00.00.0
217.3
0.00.00.00.0
242.5
0.00.00.00.0
252.4
0.0
255.0
0.00.00.0
243.0
0.0
0.00
2.68
0.000.000.000.00
2.96
0.000.000.000.00
3.25
0.00
0.000.000.00
3.25
0.000.000.000.00
3.66
0.000.000.000.00
3.83
0.000.000.000.00
4.57
0.000.000.000.00
4.52
0.000.000.000.00
4.72
0.000.000.000.00
4.67
0.00
4.63
0.000.000.00
4.34
0.00
Figure 1. MSW Generation Rates,1960 to 2009
Total MSW generation Per capita generation
To
tal M
SW
ge
ne
rati
on
(m
illio
n t
on
s)
Pe
r c
ap
ita
ge
ne
rati
on
(lb
s/p
ers
on
/da
y)
20092007


35
• Independently, EPA’s “Sustainable Materials Management: The Road Ahead” report and the WBCSD’s “Vision 2050” report concluded:
– “Business as usual” cannot continue
– A systems approach is needed
– We must start now to achieve the necessary changes to minimize negative environmental impacts or unintended consequences of actions
A Different Future is Needed

Life Cycle Thinking• The UN describes one way to include life cycle thinking as the “6 RE philosophy”
Source: UNEP “Life Cycle Management: A Business Guide to Sustainability”
“6 RE Philosophy”
RE-thinking• examining the
product’s functions
RE-pair• design the product so
that it’s easy to repair
RE-place• substitute safer
materials for hazardous or unsafe ones
RE-use• design the product so it
can be disassembled
RE-duce• lower the energy,
water, material use and other impacts over the
life cycle
RE-cycle• choose recyclable
materials

Life Cycle Management
Source: UNEP “Life Cycle Management: A Business Guide to Sustainability”
Natural Resources
Manufacturing
Product Design
Extraction of Raw Materials
Pollution, Waste, Byproducts
Transportation and Distribution
Consumer Use
Recycling of Materials
Product Reuse
Recycling and Remanufacturing
Landfill and Incineration
Disposal
A company might first look to its internal operations
Life Cycle thinking means looking beyond the manufacturing process to examine the impacts of the product over its complete life cycle, from the design of the product, the natural resources and materials, through manufacturing and use, to end of life.
The UN defines Life Cycle Management as “a product management system aiming to minimize environmental and socio-economic burdens associated with an organization’s product or product portfolio during its entire life cycle and value chain. “
This is different from conducting a Life Cycle Assessment (LCA) for your product. LCA is an advanced tool and not necessary for getting started with life cycle thinking.

Manufacturers have to consider the product’s impact throughout it’s entire life cycle.
Materials
End of Life Disposal
Use Phase
Manufacturing and Distribution
The Footprint of Products

Looking at the Basic Life Cycle of Your Product
Materials and inputs
Manufacturing Product Use End of Life
Inputs Processes Product Disposal
Examples – tropical hardwoods in furniture,
lead paint, BPA in plastics,
-extraction pollution-use of non-renewable resources such as fossil
fuels-use of hazardous and
restricted materials
Examples – water use in food processing,
energy use in metals, hazardous materials or pollutants with some
chemicals
-use of energy, water and materials in plant
-waste, byproduct, and pollution production
-use of packaging-transportation of
materials and products
Examples – car fuel economy,
EnergyStar products, VOC emissions from
paint
Examples – mercury light switches in cars, e-waste from electronics,
plastic grocery bags
-electricity or fuel the product uses
-materials it consumes-waste or other pollution
it produces
-waste and hazardous materials that go to
landfill-products that aren’t
biodegradable

The Manufacturing and Product Life Cycle
Inputs and Procurement
Pollution
Product End-of-Life Issues
Waste
Product Reuse
RecyclingRemanufacturing
Distribution
Retailing
Raw Materials
Product Design
Processing
Transportation and Distribution
Manufacturing
Consumer Use
Waste Byproducts

Design For Sustainability ProcessProduct concept•Use, function, service integration
Materials Choice•Renewable, recycled, recyclable, low energy content, less harmful
Materials consumption•Less weight and transport
Production Technology•Cleaner manufacturing processes
Distribution and packaging•Less packaging, energy efficient transport and logistics
Product Use•Lower impact from use phase of product such as energy consumption
Product Life•More reliable and durable products, easy to care for
End –of-Life•Recyclability, disassembly, reusability
Source: UNEP “Life Cycle Management: A Business Guide to Sustainability”

Sustainable Manufacturing

Materials Matter 44
EPA Packaging Dialogue
So who is at the table?
• 10 consumer packaging goods companies• 2 retailers• 7 state governments• 5 local governments• 6 NGOs• 4 EPA staff members

Materials Matter 45
Who?: EPA Packaging Dialogue

Materials Matter 46
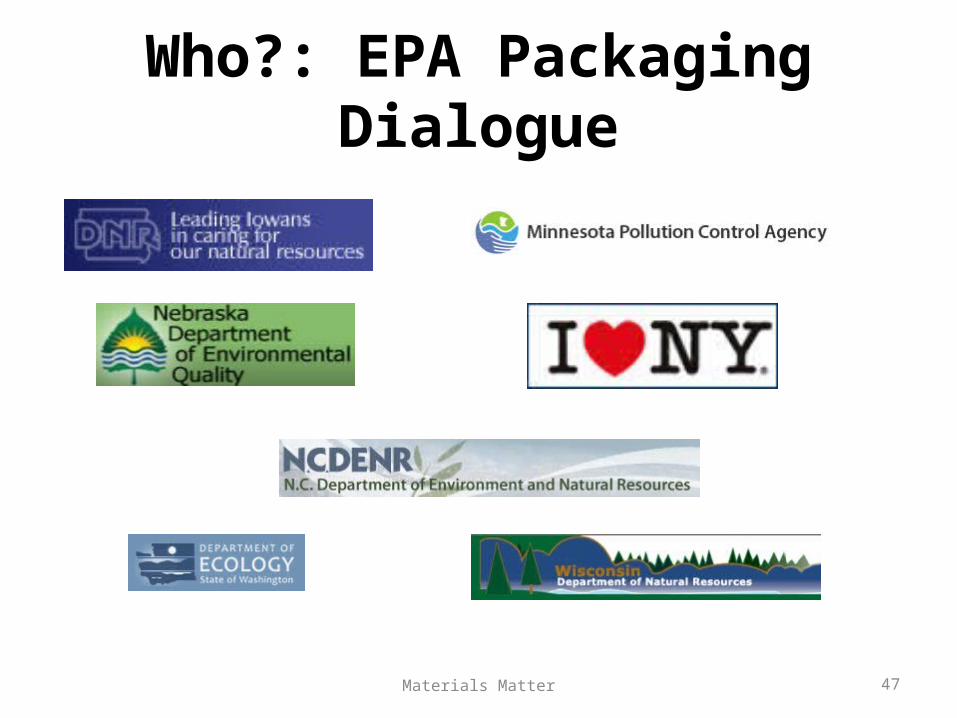
Who?: EPA Packaging Dialogue
States• Iowa Department of Natural Resources• Minnesota Pollution Control Agency• Nebraska Department of Environmental Quality• New York• North Carolina State Recycling• Washington State Dept of Ecology • Wisconsin Department of Natural Resources
Materials Matter 47
Who?: EPA Packaging Dialogue

Materials Matter 48
Who?: EPA Packaging Dialogue
Local Governments• Chittenden Solid Waste District, Vermont
• Alameda County Solid Waste Authority

Materials Matter 49
Who?: EPA Packaging Dialogue
Local Governments• Onondaga County Resource Recovery Agency
(OCRRA), Syracuse, New York
• Snohomish County (WA) and Tacoma WA
Materials Matter 50
Who?: EPA Packaging Dialogue
Non Government Organizations (NGO’s)

Materials Matter 51
Who?: EPA Packaging Dialogue
Community Based Recycler• Bridging the Gap (Kansas City)
Shadowcliff (Grand Lake, CO)

Materials Matter 52
Who?: EPA Packaging Dialogue
EPA Staff for this convening effort• Sara Hartwell, lead EPA HQ• Jay Bassett (Region 4), • Chris Newman (Region 5) and • Kent Foerster (HQ)

Materials Matter 53
EPA Packaging Dialogue
Project Focus• Packaging and Printed Materials • In municipal waste stream (MSW)• From households, businesses, institutions &
locations away from home

Materials Matter 54
EPA Packaging Dialogue
Project Goals• Optimize existing system components• Identify mechanisms to address shortfalls in
current recycling system – including long term financing
• Maximize source reduction, collection, reuse and recycling of packaging and print materials

Materials Matter 55
EPA Packaging Dialogue Results
• Meetings in September, December 2010 and January and April 2011
• Considerable information sharing & webinars between each meeting
• Subcommittees working on existing system optimization and financing options
• Final report to be released this summer

• Vance Packard Opening quote in his book The Waste Makers (1960)“A society in which consumption has to be artificially stimulated in order to keep production going is a society founded on trash and waste, and such a society is a house built upon sand.” Dorothy L. Sayers in Creed or Chaos

Times are a changing, again
• You are part of this change.• You must become the change• Congratulations Graduates of 2011!
– You are & always were Material Managers • Why is it possible for this to happen?
Time: June 6, 2011

Future
• It is not just about recycling anymore*• Zero Waste • Reduce and Reuse • Organics Revolution• Local & regional markets revolution• Product Stewardship (including EPR)• Sustainable Materials Management

Dawning of another era

Back to the Future
• Learn from Yesterday (3 R’s and what lifestyles create happiness, environmental, social and economic well being)
• Do it Today • Save Tomorrow (the old fashioned way)with
collaboration and hard work! The NRRA way!

Materials Matter

Credits
• NASA GRIN Photos• EPA Photo Files• Wikipedia• Department of Commerce Morgan Barr
Sustainability 101 Training PowerPoint• Kent Foerster archives & personal files

EPA HeadquartersOffice of Resource Conservation and Recovery
(ORCR)1200 Pennsylvania Ave, NW (5306P)
Washington, DC 20460(703) 308 0199
Kent Foerster