diet in early life and antibody responses to cow's milk and type 1
TRANSCRIPT

Department of Department of Epidemiologyand Health Promotion National Public Health InstituteHelsinki, Finland
Diet in Early Life and Antibody Responses to Cow’s Milk and Type 1 Diabetes Associated Autoantigens
Maijaliisa Erkkola
Publications of the National Public Health Institute A 24/2005

Maijaliisa Erkkola
DIET IN EARLY LIFE AND ANTIBODY
RESPONSES TO COW’S MILK AND TYPE 1
DIABETES ASSOCIATED AUTOANTIGENS
A C A D E M I C D I S S E R T A T I O N
To be presented with the permission of the Faculty of Medicine, University of Tampere, for public examination in the main auditorium of Tampere
School of Public Health, on January 4th, 2006, at 12 o’clock noon.
National Public Health Institute, Helsinki, Finland and
Tampere School of Public Health, University of Tampere, Finland
Helsinki 2005


P u b l i c a t i o n s o f t h e N a t i o n a l P u b l i c H e a l t h I n s t i t u t e
K T L A 2 4 / 2 0 0 5
Copyright National Public Health Institute
Julkaisija-Utgivare-Publisher
Kansanterveyslaitos (KTL)Mannerheimintie 166 00300 Helsinki Puh. vaihde (09) 474 41, telefax (09) 4744 8408
FolkhälsoinstitutetMannerheimvägen 166 00300 Helsingfors Tel. växel (09) 474 41, telefax (09) 4744 8408
National Public Health Institute Mannerheimintie 166 FIN-00300 Helsinki, Finland Telephone +358 9 474 41, telefax +358 9 4744 8408
ISBN 951-740-550-2 ISSN 0359-3584 ISBN 951-740-551-0 (pdf) ISSN 1458-6290 (pdf)
Kannen kuva - cover graphic: “Minea Amanda Illusia Erkkola, 2 years” photographed by Taavi Erkkola
Edita Prima Oy Helsinki 2005
Electronic dissertationActa Electronica Universitatis Tamperensis 502ISBN 951-44-6508-3ISSN 1456-954Xhttp://acta.uta.fi

S u p e r v i s e d b y
Professor Suvi M.Virtanen Tampere School of Public Health
University of Tampere and
Nutrition Unit Department of Epidemiology and Health Promotion
National Public Health Institute Helsinki
Professor Pirjo Pietinen Nutrition Unit
Department of Epidemiology and Health Promotion National Public Health Institute
Helsinki
R e v i e w e d b y
Adjunct professor Ilkka Sipilä Hospital for Children and Adolescents
University of Helsinki
Adjunct professor Satu Männistö Cancer Prevention Unit
Department of Epidemiology and Health Promotion National Public Health Institute
Helsinki
O p p o n e n t
Adjunct professor Mikael Fogelholm UKK Institute for Health Promotion Research
Tampere
Äiti leipoo hymyellen. –
Kelle leivot, äiti, kellen?
Vielä kysyt - kelles muille:
pienoisille piimäsuille.
Tää on kakku pikku Annin,
tuo on Heikin, tää on Hannin.
Tämän saapi pikku Asta,
joll’ on yksi hammas vasta.
Immi Hellén (Lasten runokirja, 1930)
Äidilleni ja Isälleni kiitokseksi vahvoista juurista &
Amandalle, Adalmiinalle, Eemelille ja Taaville
jokapäiväisen kasvun mahdollisuudesta

Maijaliisa Erkkola, Diet in early life and antibody responses to cow’s milk and type 1diabetes associated autoantigens Publications of the National Public Health Insitute, A24/2005, 150 Pages ISBN 951-740-550-2; 951-740-551-0 (pdf-version) ISSN 0359-3584; 1458-6290 (pdf-version) http://www.ktl.fi/portal/suomi/julkaisut/julkaisusarjat/kansanterveyslaitoksen_julkaisuja_a/
ABSTRACT
This study evaluated diet during pregnancy and infancy and assessed the relation between the early dietary exposures and the humoral immune responses to cow’s milk and type 1 diabetes associated autoantigens in the offspring. Research ques-tions were assessed in three different populations. Altogether 113 pregnant women in the city of Oulu between August 1995 and April 1996 participated in a validation study and 111 in a reproducibility study. In the framework of the validation study, the diet of 118 women for whom we had complete food records was assessed. Hu-moral immune responses to cow’s milk in the offspring were assessed among 97 infants, born between 1995 – 1997 randomized to receive hydrolysed infant formula in the Trial to Reduce Insulin dependent diabetes mellitus in the Genetically at Risk (TRIGR) study. The diet during infancy and humoral immune responses to type 1 diabetes associated autoantigens in the offspring was assessed among a cohort of infants in the Type 1 Diabetes Prediction and Prevention (DIPP) Nutrition Study (children born between 1996 – 2001) in Oulu and Tampere University hospital areas in Finland. Subjects in TRIGR and DIPP studies have a genetically determined in-creased risk for type 1 diabetes.
The first aim of the present doctoral thesis was to evaluate the validity and repro-ducibility of a self-administered food frequency questionnaire developed to be used as a dietary instrument, which could be administered after delivery to effectively study the putative effects of the maternal diet during pregnancy on the development of type 1 diabetes. The validity and reproducibility of our 181-item food frequency questionnaire were found to be reasonably good. On average, 70% of the foods and 69% of the nutrients fell into same or adjacent quintiles, according to the food fre-quency questionnaire and the food record as a comparative method. Pregnancy seemed to be an incitement for dietary overreporting. Our study represents an inter-nationally important contribution to the methodological field of studies into diet during pregnancy.
The second aim was to measure food consumption and nutrient intake during preg-nancy, and to evaluate dietary habits and nutrient intake of pregnant women. The results showed that a balanced diet met the increased nutrient requirements during pregnancy, except for vitamin D, folate, and iron. An increase in the consumption of

whole grain cereals, vegetables, and fish, and a decrease in the consumption of foods rich in sugar and saturated fatty acids represent the strategy for improving the intake of critical nutrients: essential fatty acids, dietary fibre, vitamin D, folate, and thia-mine. This is also a strategy for reducing the risk of overweight. Our findings sug-gest that the use of dietary supplements increases during pregnancy, but unfortu-nately their use is focused on the wrong nutrients. Supplementation is needed to ensure an overall adequate intake of iron and vitamin D. Young, less well educated and smokers were less likely to adhere to dietary recommendations.
The third aim was to assess whether maternal consumption of milk and milk prod-ucts could affect the development of cow’s milk antibodies in infants. In a unique intervention setting, in which the infants did not receive any intact cow’s milk pro-teins during the first 6 months of life, few relationships were established. Protein intake from raw milk products and cheese tended to slightly inhibit the humoral immune responses to cow’s milk proteins in the offspring: cheese during the first 6 months and raw milk later, close to 2 years, with the impact being stronger during lactation than pregnancy.
The fourth aim was to investigate infant feeding patterns during the first two years of life, and to study the effects of breastfeeding and age at introduction of comple-mentary foods on the development of type 1 diabetes associated autoantibodies. The results on infant feeding indicated that national and international goals have not been achieved. The median duration of exclusive breast feeding among 3565 infants was 1.5 months, and only every second child was still receiving breast milk at the age of six months. Of the children, 63% were introduced to complementary foods (including cow’s milk formula) before the age of 4 months. The diet during infancy was strongly influenced by sociodemographic factors; maternal age and education had a positive and infant’s male gender and maternal smoking exhibited an inverse asso-ciation with the duration of breast feeding and the age at introduction of supplemen-tary foods.
In the largest cohort series so far reported, an early introduction of fruits and berries was related to the risk of advanced -cell autoimmunity. The finding of the inde-pendent association of fruits and berries with -cell autoimmunity is novel. The next step will be to assess whether these findings can be replicated, and if so, whether they are proxies for other life style characteristics, or reflect a causal relationship.
Keywords: diet; nutrition; pregnancy; infant; breast feeding; complementary feed-ing; cow’s milk; food frequency questionnaire; reliability and validity; type 1 diabe-tes; autoimmunity; autoantibodies; etiology; socioeconomic factor

Maijaliisa Erkkola, Ravinto raskauden aikana ja imeväisiässä ja lapsen vasta-aineet lehmänmaidolle ja tyypin 1 diabetekseen kytkeytyville autoantigeeneille Kansanterveyslaitoksen julkaisuja, A24/2005, 150 sivua ISBN 951-740-550-2; 951-740-551-0 (pdf-versio) ISSN 0359-3584; 1458-6290 (pdf-versio) http://www.ktl.fi/portal/suomi/julkaisut/julkaisusarjat/kansanterveyslaitoksen_julkaisuja_a/
TIIVISTELMÄ
Väitöskirjatyössä arvioitiin raskausajan ja imeväisiän ruokavaliota ja niiden yhteyttä lapsen humoraalisiin immuunivasteisiin lehmänmaidolle ja nuoruustyypin diabetek-seen kytkeytyville autoantigeeneille. Väitöskirjatutkimus tehtiin kolmessa eri aineis-tossa. Äidin raskauden ja imetyksen aikaisen ruoankäytön selvittämiseksi kehittä-mämme kyselylomakkeen validointitutkimukseen (viitemenetelmänä 2 x 5 vrk:n ruo-kapäiväkirja) osallistui 224 raskaana olevaa oululaisäitiä elokuun 1995 ja huhtikuun 1996 välisenä aikana. Validointitutkimuksen puitteissa selvitettiin tarkemmin 118 tutkittavan raskaudenaikainen ruokavalio. Äidin raskauden ja imetyksen aikaisen mai-don kulutuksen yhteyttä lapsen immuunivasteisiin maitoproteiineille selvitettiin lap-suusiän diabeteksen ravintoperäisen ehkäisytutkimuksen (TRIGR) immunologisen esitutkimusaineiston interventioryhmältä. Tutkittavat 97 vastasyntynyttä (syntymä-vuodet 1995 – 1997) olivat nuoruustyypin diabeetikoiden 1. asteen sukulaisia, joilla on lisääntynyt diabetesriski HLA-DQB1-tekijöiden perusteella. Tutkimus oli satunnaistet-tu kaksoissokkokoe, jossa verrattiin tavanomaista äidinmaidonkorviketta ja hydro-lysaattia (Nutramigen). Äitien ravitsemusta selvitettiin kehittämällämme frekvenssi-kyselyllä. Kolmannen aineiston muodostivat kaikki 1996 – 2001 Oulun ja Tampereen yliopistollisissa sairaaloissa syntyneet perinnöllisen diabetesalttiuden omaavat lapset, joiden vanhemmat suostuivat Tyypin 1 diabeteksen ennustaminen ja ehkäisy (DIPP) -tutkimukseen. Lapsen ravitsemusta, menetelminä ruokapäiväkirja, kyselylomake ja lisäruoan aloitusikälomake, infektioita sekä diabetekseen kytkeytyvien autovasta-aineiden ilmaantumista seurattiin 3-12 kuukauden välein.
Väitöskirjatyön ensimmäinen tavoite oli arvioida kehittämämme ruoankäytön frek-venssikyselylomakkeen luotettavuutta ja toistettavuutta ja täten sen käyttökelpoi-suutta raskaudenajan ruoankäytön retrospektiivisenä mittausmenetelmänä DIPP -tutkimuksessa. Lomakkeen luotettavuus ja toistettavuus osoittautuivat kohtuullisen hyviksi. Keskimäärin 70 % ruoka-aineista ja 69 % ravintoaineista sijoittui samaan tai vierekkäiseen viidennesluokkaan verrattaessa 181-kohtaisen lomakkeemme ja vertailumenetelmänä käytetyn ruokapäiväkirjan saantimääriä toisiinsa. Raskaus näyttäisi lisäävän ruoankäytön yliraportointia. Tutkimuksemme tuotti kansainväli-sestikin merkittävää tietoa raskaudenajan ruoankäytön tutkimisen metodologiasta.

Toisena tavoitteena oli arvioida suomalaisnaisten raskaudenaikaista ruoankäyttöä ja ravinnonsaantia. Monipuolisesti ja tasapainoisesti koostettu ruokavalio tyydyttää ras-kauden ajan lisääntyneen tarpeen D-vitamiinia, folaattia ja rautaa lukuun ottamatta. Täysjyväviljatuotteiden, kasvisten ja kalan käytön lisääminen sekä runsaasti sokeria ja kovaa rasvaa sisältävien ruoka-aineiden kulutuksen vähentäminen on suositeltava tapa kohentaa ruokavalion ravintokoostumusta kriittisten ravintoaineiden osalta. Ravinto-valmisteiden käyttö on runsasta, mutta osittain väärin painottunutta. Nuorten, vähän koulutettujen ja tupakoivien äitien ruokavalio oli kauimpana suosituksista. Äitiyshuol-lon ravitsemusneuvonnan haasteita ovat riskiryhmien seulominen, paino-ongelmien ehkäisy ja hoito sekä erityisruokavaliota noudattavien äitien neuvonta.
Väitöskirjatyön kolmantena tavoitteena oli selvittää vaikuttaako äidin raskauden- ja imetyksenaikainen maitotuotteiden käyttö lapsen immuunivasteisiin maitoproteii-neille. Ainutlaatuisessa tutkimusasetelmassa, jossa lasten ruokavaliosta puuttuivat kaikki lehmänmaitoaltisteet ensimmäisen puolen vuoden aikana, havaittiin muutama yhteys. Proteiininsaanti juustoista oli yhteydessä lapsen lievästi alentuneisiin im-muunivasteisiin maitoproteiineille ensimmäisen puolen elinvuoden aikana ja prote-iininsaanti käsittelemättömistä maitotuotteista vastaavasti lähempänä kahta ikävuot-ta. Äidin imetyksenaikainen maitotuotteiden käyttö oli raskaudenaikaista käyttöä selkeämmin yhteydessä lapsen immuunivasteisiin maitoproteiineille.
Neljäs tavoite oli arvioida suomalaislasten imeväisruokintaa kahden ensimmäisen ikävuoden aikana ja selvittää vaikuttaako lapsen imeväisiän aikainen ravitsemus diabeteksen immunologisten merkki-ominaisuuksien perusteella määräytyvän diabe-teksen esiasteen kehittymiseen lapsilla. Imeväisruokinnan kansalliset ja kansainväli-set suositukset ovat Suomessa vielä saavuttamatta. Yksinomaisen imetyksen kesto 3565 tutkitulla lapsella oli vain 1.5 kk, ja vain joka toinen lapsi sai vielä puolen vuoden iässä äidinmaitoa. Lapsista 63 % sai lisäravintoa (tavanomainen korvike huomioitu) ennen suositeltua neljän kuukauden ikää. Perheiden sosioekonomiset erot heijastuvat vahvasti imeväisruokintaan; äidin ikä, koulutus ja tupakointi sekä lapsen sukupuoli olivat vahvasti yhteydessä imetyksen kestoon ja lisäruokien aloi-tusikään. Aikainen altistus marjoille ja hedelmille oli yhteydessä diabetekseen kyt-ketyvien autovasta-aineiden ilmaantuvuuteen laajimmassa tähän saakka raportoidus-sa syntymäkohortissa. Marjojen ja hedelmien itsenäinen yhteys -solujen autoim-muniteettiin on täysin uusi tulos. Seuraava askel on tutkia löydöksen toistettavuus isommalla aineistolla sekä arvioida sen kausaalisuutta.
Avainsanat: ravinto, ruokavalio, raskaus, imetys, lisäruoka, lehmänmaito, frekvens-sikyselylomake, imeväisruokinta, diabetes, vasta-aine, autoimmuniteetti, sosioeko-nomiset erot

4
CONTENTS
ABBREVIATIONS........................................................................................................................................................... 6
LIST OF ORIGINAL PUBLICATIONS........................................................................................................................ 8
1. INTRODUCTION ........................................................................................................................................................ 9
2. REVIEW OF THE LITERATURE .......................................................................................................................... 12
2.1 ASSESSMENT OF DIET DURING PREGNANCY AND INFANCY...................................................................................... 122.1.1 Pregnancy ...................................................................................................................................................... 122.1.2 Infancy............................................................................................................................................................ 13
2.2 METHODOLOGICAL ISSUES IN DIETARY ASSESSMENT IN LONG-TERM STUDIES ........................................................ 142.2.1 Food frequency questionnaire (FFQ) ............................................................................................................ 142.2.2 Assessing reproducibility and validity of the FFQ......................................................................................... 162.2.3 Under- and over reporting ............................................................................................................................. 182.2.4 Quality of food composition database............................................................................................................ 19
2.3 NUTRITION IN PREGNANCY ..................................................................................................................................... 202.3.1 Influence on fetal growth................................................................................................................................ 202.3.2 Fetal origins of diseases................................................................................................................................. 212.3.3 Transfer of nutrients and antibodies to the fetus............................................................................................ 222.3.4 Dietary recommendations during pregnancy................................................................................................. 232.3.5 Nutrient intake in pregnancy.......................................................................................................................... 252.3.6 Obesity in pregnancy...................................................................................................................................... 32
2.4 DIET IN INFANCY..................................................................................................................................................... 332.4.1 Breastfeeding.................................................................................................................................................. 332.4.2 Weaning ......................................................................................................................................................... 372.4.3 Impact of weaning on infant’s growth............................................................................................................ 42
2.5 SOCIAL INEQUALITIES IN MATERNAL AND INFANT HEALTH..................................................................................... 432.6 EPIDEMIOLOGY OF TYPE 1 DIABETES (T1D)............................................................................................................ 46
2.6.1 Autoimmune process and genetic susceptibility ............................................................................................. 462.6.2 The role of environmental factors .................................................................................................................. 472.6.3 Dietary factors in the development of T1D .................................................................................................... 50
3. AIMS OF THE PRESENT STUDY .......................................................................................................................... 57
4. SUBJECTS AND METHODS ................................................................................................................................... 58
4.1 SUBJECTS AND STUDY DESIGN ................................................................................................................................ 584.1.1 Validation study (I and II) .............................................................................................................................. 594.1.2 Trial to Reduce Insulin dependent diabetes mellitus in the Genetically at Risk (TRIGR) study (III)............. 594.1.3 The Type 1 Diabetes Prediction and Prevention (DIPP) Nutrition Study (IV and V) .................................... 60
4.2 DIETARY METHODS................................................................................................................................................. 614.2.1 Food records (I, II, III)................................................................................................................................... 614.2.2 Food frequency questionnaire, FFQ (I and III) ............................................................................................. 614.2.3 Follow-up record of introducing new foods (IV and V) ................................................................................. 634.2.4 Structured dietary questionnaire (V).............................................................................................................. 644.2.5 Breastfeeding.................................................................................................................................................. 65
4.2.6 CONVERTING FOOD RECORDS AND QUESTIONNAIRES TO FOOD AND NUTRIENT INTAKES...................................... 654.3 SOCIODEMOGRAPHIC AND PERINATAL CHARACTERISTICS ...................................................................................... 674.4 GENETIC METHODS ................................................................................................................................................. 674.5 IMMUNOLOGICAL METHODS.................................................................................................................................... 684.6 STATISTICAL METHODS........................................................................................................................................... 70
5. RESULTS.................................................................................................................................................................... 74
5.1 VALIDITY OF DIETARY METHODS (I, II, AND III) ..................................................................................................... 745.2 DIETARY INTAKE DURING PREGNANCY (I, II, AND III) ............................................................................................ 795.3 INFANT FEEDING PATTERNS (III, IV, V) .................................................................................................................. 865.4 THE ASSOCIATIONS BETWEEN MATERNAL DIET AND DEVELOPMENT OF COW’S MILK ANTIBODIES IN INFANT (III) .. 905.5 RELATION BETWEEN DIETARY FACTORS AND APPEARANCE OF AUTOANTIBODIES (V) ............................................ 91

5
6. DISCUSSION.............................................................................................................................................................. 94
6.1 SCIENCE AND CONCLUSIONS ARE ONLY AS GOOD AS OUR TOOLS AND THEIR PROPER APPLICATION; VALIDITY OF THE FOOD FREQUENCY QUESTIONNAIRE ....................................................................................................................... 946.2 FOCUSING ON QUALITY RATHER THAN QUANTITY WHEN BUILDING BASIS FOR A NEW LIFE; DIET DURING PREGNANCY.................................................................................................................................................................. 976.3 GOALS OF INFANT FEEDING HAVE NOT BEEN ACHIEVED........................................................................................ 1006.4 NEW PERSPECTIVES ON ANTIBODY RESPONSES; DO MILK PRODUCTS DIFFER IN THEIR EFFECTS ON COW’S MILK ANTIBODY RESPONSES? .............................................................................................................................................. 1056.5 NEW FINDINGS OBSERVED IN THE LARGEST T1D FOCUSED BIRTH COHORT STUDY CHALLENGES FUTURE STUDIES1076.6 THE INFERENCES DRAWN CANNOT BE STRONGER THAN THE WEAKEST PART OF THE STUDY; EVALUATING SELECTED ISSUES IN STUDIES I – V .............................................................................................................................................. 111
7. CONCLUSIONS; IMPLICATIONS ON PUBLIC HEALTH AND FUTURE PERSPECTIVES.................... 114
8. ACKNOWLEDGEMENTS ..................................................................................................................................... 117
9. REFERENCES ......................................................................................................................................................... 119
6
ABBREVIATIONS
BABYDIAB Baby Diabetes Study
BLG Beta-lactoglobulin
BSA Bovine serum albumin
CAS Alpha-casein
CI Confidence interval
DAISY Diabetes Autoimmunity Study in the Young
DASP Diabetes Autoantibody Standardization Program
DIPP Type 1 Diabetes Prediction and Prevention Project
DNA Deoxyribonucleic acid
ELISA Enzyme-linked immunosorbent assay
en% Energy percentage (percentages of total energy intake)
EU European Union
FAO Food and Agriculture Organization
FFQ Food frequency questionnaire
FR Food record
GADA Autoantibodies to the 65-kD isoform of glutamic acid decarboxylase
HLA Human leukocyte antigen
HR Hazard ratio
IAA Insulin autoantibodies
IA-2A Autoantibodies to the protein tyrosine phosphatase-related IA-2 molecule
ICA Classic islet cell antibodies
IgA Immunoglobulin A
IgG Immunoglobulin G
IU International Units
7
MJ Mega Joule
OR Odds ratio
SD Standard deviation
TRIGR Trial to Reduce Insulin dependent diabetes mellitus in the Genetically at Risk –study
T1D Type 1 diabetes
UK United Kingdom
UNICEF United Nations Children’s Fund
US/USA United States/United States of America
WHO World Health Organization

8
List of original publications
This thesis is based on the following original publications referred to in the text by their Roman
numerals (I – V):
I. Erkkola M, Karppinen M, Javanainen J, Räsänen L, Knip M, Virtanen SM. Validity and
reproducibility of a food frequency questionnaire for pregnant Finnish women. Am J
Epidemiol 2001;154:466-476.
II. Erkkola M, Karppinen M, Järvinen A, Knip M, Virtanen SM. Folate, vitamin D, and iron
intakes are low among pregnant Finnish women. Eur J Clin Nutr 1998;52:742-748.
III. Erkkola M, Kronberg-Kippilä C, Savilahti E, Kenward M, Salonen M, Ilonen J, Knip M,
Åkerblom HK, Virtanen SM. Maternal consumption of dairy products during pregnancy and
lactation and the development of cow’s milk antibodies in the offspring. Acta Paediatrica
2005;94:696-704.
IV. Erkkola M, Pigg H-M, Virta-Autio P, Hekkala A, Hyppönen E, Knip M, Virtanen SM.
Infant feeding patterns in the Finnish type 1 diabetes prediction and prevention nutrition
study cohort. Eur J Clin Nutr 2005;59:107-13.
V. Virtanen SM, Kenward MG, Erkkola M, Kautiainen S, Kronberg-Kippilä C, Hakulinen T,
Ahonen S, Uusitalo L, Niinistö S, Veijola R, Simell OG, Ilonen J, Knip M. Age at
introduction of new foods and advanced beta-cell autoimmunity in young children with
HLA-conferred susceptibility to type 1 diabetes. (Submitted).
These articles are reproduced with the kind permission of their copyright holders.

9
1. Introduction
Type 1 diabetes (T1D) is perceived as a chronic immune-mediated disease with a subclinical
prodrome characterized by selective loss of insulin-producing -cells in the pancreatic islets in
genetically susceptible persons (Atkinson & Eisenbarth 2001, Knip 2002a). It is diagnosed by the
presence of elevated blood glucose levels, usually before the age of 15 years. T1D is the second
most common chronic disease among Finnish children after allergies and asthma and the incidence
of this disease in Finland is the highest in the world; more than 40 new cases per 100,000 person-
years in 0- to 14-year old children (Karvonen et al. 2000). T1D requires long-term medical attention
and it is an expensive disease; the costs to the health service in Finland are on average 6 600
EUR/year per person with complications and 600 EUR/year per person with no complications
(Kangas 2002). Large geographic differences, a globally reported conspicuous increase in
incidence, and the relatively low concordance in monozygotic twins are factors favouring a major
role for environmental factors in the etiology of T1D (Barnett et al. 1981, Bingley & Gale 1989,
Kaprio et al. 1992, Green & Patterson 2001, Onkamo et al. 1999, Gale 2002).
Evidence for a role of dietary factors in the development of T1D is inconsistent (e.g. Dahlquist
1994, Gerstein 1994, Norris & Scott 1996, Åkerblom & Knip 1998, Vaarala et al. 1999, Virtanen &
Knip 2003). Cow’s milk protein has been proposed as being a potential initiating factor in the
autoimmune process leading to the destruction of pancreatic -cells and subsequent development of
T1D. The major shortcomings of the human studies performed into diet-diabetes relation so far,
using most often the case-control design, are that only single dietary exposures have been assessed
at single time points, and that inadequate attention has been paid to confounding factors as well as
to the limitations of the dietary methods used. Due to lack of knowledge on the relevant period of
exposure, and the relatively low incidence of this most likely multifactorial disease, the long-term
diet needs to be evaluated if one wishes to study diet-based relations of T1D.
10
There is clear evidence to suggest that the environmental processes influencing the propensity to
disease in adulthood operate during the periconceptual, fetal, and infant phases of life (Barker
1995). This emphasizes the need for consistent and thorough assessments of women's diet
throughout pregnancy and children’s diet in early infancy. There have been very few
methodological studies conducted in pregnant women and infants (Suitor et al. 1989, Greeley et al.
1992, Forsythe & Gage 1994, Brown et al. 1996, Robinson et al. 1996, Wei et al. 1999, De Vriese
et al. 2001, Fawzi et al. 2004, Andersen et al. 2003; 2004). Despite the frequent use of food
frequency questionnaires in epidemiological studies, there is a need to develop and evaluate
questionnaires that extend the range of ages, populations, settings, and dietary factors to be studied
(Willett 1994).
Dietary data on Finnish pregnant women and children is dispersed, scanty and out-of-date. The
latest survey on the diet of pregnant Finnish women dates from the early 1970s (Pietinen 1974).
According to more recent surveys, the intakes of folate, thiamine, and vitamin D are low among
Finnish women of childbearing age (Alfthan et al. 2003, Männistö et al. 2003). Increasing obesity is
the main nutritional problem in Finnish women of childbearing age (reviewed by Lahti-Koski &
Sirén 2004) and in Finnish pregnant women (Kinnunen et al. 2003). In the recently published
Finnish nutrition recommendations for infants and young children (Hasunen et al. 2004), exclusive
breastfeeding is recommended until the age of 6 months, complementary feeding starting
individually at the latest at the age of six months. A short duration of breastfeeding and introduction
of complementary foods at an early age is claimed to be associated with the development of several
adverse health outcomes, such as impaired neurocognitive development and development of chronic
diseases and obesity (Anderson et al. 1999, Chandra 2002, Ivarsson et al. 2002, Jain et al. 2002,
Owen et al. 2002; 2003; 2005, Virtanen & Knip 2003). Promoting the health and nutrition of
females of reproductive age and children in early infancy could be seen as one element for the
prevention of health problems in the coming generation.

11
This thesis aims to evaluate diet of pregnant women and infants, and to assess the relation between
the early dietary exposures to the development of cow’s milk antibodies and T1D associated
autoantibodies. Accordingly, one specific objective was to evaluate the validity and reproducibility
of a self-administered food frequency questionnaire (FFQ) developed to measure food consumption
and nutrient intake during pregnancy.

12
2. Review of the literature
2.1 Assessment of diet during pregnancy and infancy
2.1.1 Pregnancy The assessment of dietary intake in pregnant women is complicated by various factors depending on
the phase of the pregnancy. The obtained overall picture of the diet during pregnancy is, therefore,
most probably influenced by the timing of the dietary assessment. Nausea and vomiting are the
most common symptoms experienced in early pregnancy, with nausea affecting between 70 and
85% of women and about half of women vomit during pregnancy (Jewell &Young 2003).
Accordingly, approximately two thirds of pregnant women develop heartburn, this occurring most
frequently during the last two trimesters of pregnancy (Richter 2003). In general, most food
cravings cause an increase in calcium and energy intakes, whereas food aversions lead to decreases
in the intakes of alcohol, caffeine, and animal protein (King 2000). Food cravings and aversions do
not necessarily have any deleterious effect on the quality of the diet, but appetite fluctuations and
nausea may influence the long-term diet reports (Wirfält 1998).
The ability of women to recall their diet during pregnancy and the accuracy of the information they
do recall has rarely been assessed. Changes in food intake during pregnancy tend to be relatively
small and, therefore, difficult to detect by using the rather imprecise dietary assessment methods
currently available (King 2000). Evidence exists that people whose dietary habits are relatively
stable are more likely to be able to successfully recall past diet (Cade et al. 2002). However, based
on a few studies, diet during pregnancy is recalled with similar accuracy as, or perhaps even a
slightly lower accuracy than the adult diet in general (Bunin et al. 2001). In the Tecumseh Diet
Methodology Study (Thompson et al. 1990), greater total diet reproducibility was found among
normal weight women who did not report consuming any special diet and among women reporting
no medication.

13
2.1.2 Infancy Diet during childhood tends to be highly variable from day to day (at least twice as great as that of
the adults), this being especially true after the age of one year when most of the complementary
foods are introduced (e.g. Miller et al. 1991, Thompson & Byers 1994). Due to the dramatic
changes in food patterns during the first years of life with significant individual variation in the
timing of these changes, the food consumption and nutrient intake vary extensively among 1-2
years old children, as has been demonstrated in previous Finnish studies among infants (Räsänen &
Ylönen 1992, Simell et al. 2000). Food records of 7 to 8 days seemed to be a reasonable way of
assessing current individual intake of energy and macronutrients in a child population aged 5 to 14
years, though a proper assessment of the intakes of some vitamins would have required keeping a
diary for more than 20 days (Miller et al. 1991). Simple, valid, and reliable tools to measure infant
feeding are lacking (Ruel et al. 2003). The problem of measurement arises primarily because infant
feeding practices encompass a series of age-specific, interrelated behaviours that are difficult to
summarize into one or even a few variables. Piwoz and colleagues (2003) offer three indicators to
be used to measure and define dietary diversity, quality and frequency of complementary feeding
both in developed and developing countries. It is recommended that the proportions of children
fulfilling the defined indicators should be described in studies on infant feeding.
When assessing diet in infancy and early childhood, all information by necessity has to be obtained
by surrogate reporters. An individual who spends most of the time with the child is thus the best
surrogate reporter. The accuracy of surrogate information does not seem to differ between mothers
and fathers (Eck et al. 1989). Factors that lessen the time that the parents spend with the child, such
as employment outside of the home and larger family size, could possibly lead to less accurate
reporting of the child’s diet (Willett 1998). The process of food registration does not affect the
appetite or food preferences of the infant. However, it is possible that parents want to idealize what
they actually give to their infants or report having given them. In the well conducted Norwegian
validation studies among 12 and 24 months old children, the food items underreported were typical
14
unhealthy foods like cake, soft drinks and sweets, while the overreported foods were more healthy
foods like bread, fruit and potatoes (Andersen et al. 2003; 2004). It was also found that the parents
with more than one child seemed to provide more valid data of their child’s diet than the parents
with only one child.
Another important question is whether the child’s health affects the parents’ recall. Emotional and
behavioural impacts have been associated with islet autoantibody-positive status, some individuals
even reporting lifestyle or health behaviour changes in an effort to delay or prevent type 1 diabetes
(T1D) onset (Bennett Johnson & Tercyak 1995, Bennett Johnson et al. 2004, Hummel et al. 2004b).
In the longitudinal investigation of the impact of newborn genetic screening for T1D, low level of
maternal education, having a child of female gender, being a single mother and having a first degree
relative with T1D were the characteristics related to difficulties in understanding the T1D risk and
to experience greater anxiety in response to risk notification (Bennett Johnson et al. 2004).
However, in most of the cases the initial anxiety appears to dissipate to normal levels over time, and
long-term behavioural changes will not be likely to occur.
2.2 Methodological issues in dietary assessment in long-term studies
2.2.1 Food frequency questionnaire (FFQ) = a questionnaire in which the respondent is presented with a list of foods and is required to say how often and in what quantity each is eaten in broad terms such as x times per day/per week/per month (Margetts and Nelson 1997).
In the 1940s Burke (1947) developed a detailed dietary history including a checklist of foods
consumed over the preceding month. This checklist represents the forerunner of the more structured
dietary questionnaires in use today. During the 1950s a FFQ was further developed and its role in
dietary assessment was evaluated (reviewed by Willett 1998). After the failure to observe any
correlations with serum cholesterol in the Tecumseh Heart Study (Nichols et al. 1976), interest in
the FFQ waned. However, as a result of initiation of several large cohort studies in nutritional
epidemiology in the 1980s, there has been a new upswing in the popularity of FFQ and it is now

15
considered as the primary dietary assessment method in nutritional epidemiology (Willett 1998,
Cade et al. 2002). Despite the current frequent use of the FFQ, there are still target groups whose
special characteristics as FFQ users are not well evaluated. Additional effort must be given to
developing and evaluating questionnaires that extend the range of ages (especially for children),
populations, settings, and dietary factors that are studied (Willett 1994). Recently published
validation studies among 12-24 month old Norwegian children claimed that FFQ was able raly
poorly to rank small children according to intakes of nutrients and food items (Andersen et al. 2003;
2004). The average proportions of subjects appearing in the same quartile of nutrient intake
estimated by the FFQ and weighed records were 38% among 1 year old and 36% among 2 years
old. Despite that, the FFQ seemed to represent a valuable tool for measuring average intakes of
macronutrients and several food items if estimates were adjusted for energy intake.
Developing an FFQ on the basis of common foods may not explain the between-person variation
required for ranking individual intake in diet-disease studies (Cade et al. 2002, Shai et al. 2004), and
careful attention must be given to choice of foods as well as the format of the frequency response
section. It is preferable in aetiological studies to have a comprehensive food list enabling
computation of the full range of nutrients rather than a restricted list to determine the intakes of a
few nutrients. A comprehensive food list is also a prerequisite for energy adjustment. The median
number of food items in the questionnaires analyzed in the comprehensive review of Cade et al.
(2002) was 79 (range 5 – 350). There is a rapidly decreasing marginal gain in the amount of
information obtained with increasingly detailed questionnaires (Pietinen et al. 1988a; 1988b).
Particularly in a self-administered format, approximately 130 food items may be approaching the
limit after which fatigue and boredom can impair concentration and accuracy, and increase the risk
of over reporting (Willett 1998). Additional questions producing qualitative information would
improve the validity of some estimates; however, energy adjustment has a greater impact on the
validity of fat estimates than can be obtained by asking additional questions (Wolk et al. 1998). In

16
long-term cohort studies, the FFQ may need to be continuously modified due to new foods
becoming available over the duration of the study and changes in dietary patterns.
Foods consumed near the time of FFQ administration may prime the memory, such that FFQ
responses emphasize recently consumed foods. The FFQ data obtained from 74,958 women in the
Shanghai Women's Health Study was consistent with that theory (Fowke et al. 2004). However, it
was concluded that the season of FFQ administration does not alter dietary exposure category
assignments sufficiently to impact on the interpretation of most epidemiologic studies. The FFQ
requires respondents to present rather complex cognitive tasks, which could increase the
possibilities of bias and lead to a more selected group of subjects (Flegal 1999).
2.2.2 Assessing reproducibility and validity of the FFQ
The reproducibility of FFQs has generally been assessed by administering them at two time points
to the same group of people and testing the association, most often via a correlation coefficient,
between the two responses (Willett 1998, Cade et al. 2002). The use of the correlation coefficient
has been criticized because it measures only the degree to which the two measurements are related;
not the agreement between two administrations of the questionnaire unlike the more comprehensive
method created by Bland and Altman (1995; 1999). The time interval between two responses could
affect the reproducibility. A very short interval may lead an overestimation of the true
reproducibility due to the respondents’ ability to remember their previous answers. The interval
between repeat measurements should be chosen to minimize changes over time and recall of
previous answers, and will depend on the reference period of the FFQ (Cade et al. 2002). For
individual food items, a lower initial reproducibility, infrequent consumption, and a larger
difference in seasonal intake have been shown to be associated with a greater reduction in
reproducibility over time (Tsubono et al. 1995). Consequently, the risk ratios based on exposure
data obtained from food frequencies could be markedly affected by misclassification and temporal
changes in responses (Hashimoto et al. 1997). However, Willet (1998) does not consider the

17
difficulty in separating variation due to questionnaire performance from a true change in diet
extremely serious from the standpoint of evaluating measurement error; both sources of variation
realistically contribute to misclassification of long-term dietary intakes.
Validation studies assess the degree of the FFQ to measure those aspects of diet that it was intended
to measure (Willett 1998). A valid FFQ accurately reflects typical food consumption over a
designated period of time, being undistorted by behavioural patterns or false memory. Due to the
fact that all dietary assessment methods involve some degree of measurement error, the relative
validity, rather than absolute validity, is measured. Among the feasible comparative methods
available for validating FFQ, food records are likely to have the smallest correlated errors and have,
therefore, been commonly used for this purpose. A reasonable size for a validation study is from
100 to 200 persons assuming that a sufficient number of days of dietary information are obtained to
reasonably describe an individual’s true diet over the reference period (Willett 1998). In most
settings, the optimal study design will rarely require more than four or five diet records per subject
(Stram et al. 1995). The number of days needed depends also on the within-person variability for
the nutrients of interest (e.g. Willett 1998). The days should be randomly dispersed over the time
period of interest to include short- and long-term sources of variation. Biochemical markers are
potentially useful but often expensive and available only for certain nutrients.
There is no consensus on the best statistical method to be used for assessing the validity of FFQ
(Cade et al. 2002, Flood et al. 2004). The use of a variety of statistical approaches guided by the
purpose of measuring diet with the FFQ is recommended (Burley et al. 2000, Cade et al. 2002).
Two recent papers have compared several different statistical methods for assessing the relative
validity of FFQ with 4-day weighed diet records (Masson et al. 2003, Flood et al. 2004). Different
methods of analysis provide different information, and measures of agreement differ also between
nutrients and gender. None of the methods is fully comprehensive when used alone, and the need to

18
use several methods was demonstrated in both studies. Masson et al. (2003) concluded that with
Spearman correlation coefficients above 0.5, more than 50% of subjects correctly classified and
less than 10% of subjects grossly misclassified into thirds, and weighted kappa values above 0.4
are recommended for nutrients of interest in epidemiological studies. However, Willett (1998)
discouraged the use of the kappa statistic for comparing ordinal nutrient intakes due to its
considerable disadvantages.
2.2.3 Under- and over reporting
In addition to a selection bias of better-off populations, a systematic bias due to under- or over
reporting is a major source of bias in dietary surveys. It is evident that bias in reporting total energy
intake is associated with variable bias in estimated nutrient intake. There are three main
determinants of variation in energy intake between individuals: body size, physical activity, and
metabolic efficiency (e.g. Willett 1998). Epidemiological studies of diet and disease should be
principally directed to the effects of the nutrient composition of the diet independent of total energy
intake. Adjustment for total energy is appropriate to control for confounding, reduce extraneous
variation, and predict the effect of dietary interventions (Willett et al. 1997).
Subjects commonly tend to report their food intake in a socially desirable way, by reporting less
frequently the foods which are considered unhealthy or fattening, whereas foods considered healthy
are reported more frequently (Andersen et al. 2003; 2004, Scagliusi et al. 2003). Body mass index
over 25 kg/m2, female gender, older age and high educational level are among the most common
predictors for underreporting (reviewed by Livingstone & Black 2003), and also noted in a Finnish
survey (Hirvonen et al. 1997). Though it has been thought that there is an inverse association with
socio-economic status, Black and Cole (2001) found that biased over- or underreporting is
characteristic of some persons and not overtly dependent on socio-economic differences. In the
European Prospective Investigation of Cancer (EPIC) Norfolk –study (Bingham et al. 2001), which

19
is one of the largest epidemiological studies of nutrition in the United Kingdom, there were
significant differences in mean intake of all nutrients measured by two different methods, FFQs and
diet records, in women but less so in men. In validation studies, FFQs have generally overestimated
absolute intakes when compared with food records or 24-hour recalls (Willett 1998, Cade et al.
2002). However, overestimation is not necessarily problematic in epidemiological studies if the
ranking of the persons according to their dietary intake is valid (Willett 1998).
2.2.4 Quality of food composition database
Assessment of a long-term diet requires a continuously and properly updated food composition
database (Cade et al. 2002, Kronberg-Kippilä et al. 2003). Changes over time in the content of
prepared and processed foods, variations in recipes and cooking practices, and geographic and
environmental variability may all contribute to a difference between the actual nutrient value of a
specific food and the value calculated from a food database (Flegal 1999). For most nutrients and
most populations, the groups at risk are those in the upper or lower percentiles of nutrient
consumption. The lack of database updating and inadequate sampling underpinning the estimates of
mean nutrient concentrations will create the greatest errors in the regions of greatest risk (Stewart
1997). Cowin and Emmett (1999) studied the effect of missing data in McCance and Widdowson's
food tables and supplements (Royal Society of Chemistry 2003) used for calculating nutrient intake
of 3-day dietary diaries completed for 1026 children aged 18 months. The underestimation of
nutrient intake was largest for vitamins E and D (13.8% and 14.7% of total intake, respectively).
The effect of missing data on calculated nutrient intakes was proportionately greater at the bottom
end of the nutrient intake distribution. Even though missing data had a fairly small effect on
calculated mean daily intakes, it could result in some individuals being misranked within a nutrient
intake distribution.
Collection of data on supplement use is often limited by costly and time-consuming process of
setting and updating a reliable database due to expanding and highly changeable market in these

20
products. Estimates of consumption of specific supplements may provide sufficient precision to
correctly classify individuals into either users or non-users of those supplements. However, precise
details of the products consumed are required in order to rank individuals into categories of nutrient
intakes (Cade et al. 2002).
The quality of research data is also affected by how skilful and well trained the research personnel
are and by how standardized are the data collection and entering methodologies. Validating and
standardizing the dietary methods is very important in long-term cohort studies, in which the
research personnel may change over the course of the study. In the comparison of surveys and in
international surveys of food consumption and nutrient intake, it is essential that the dietary data are
comparable when different databases and calculation programs are used. In the comparison between
Swedish and Finnish food databases, differences between estimated intakes reflected either actual
differences in foods between the two countries or methodological differences in the assessment of
nutrient intakes (Hakala et al. 2003).
2.3 Nutrition in pregnancy
2.3.1 Influence on fetal growth
Nutrition is the major intrauterine environmental factor that alters expression of the fetal genome
and may have lifelong consequences (e.g. Wu et al. 2004). Perinatal nutrition is recognized to have
a profound and persistent influence on neurologic development and cognitive functions (e.g. Larque
et al. 2002). It has been shown in animal studies that both maternal undernutrition and overnutrition
reduce placental-fetal blood flow and can stunt fetal growth. Fetal growth seems to be most
vulnerable to maternal dietary deficiencies of nutrients during the pre-implantation period and also
during the period of rapid placental development, i.e. the first trimester of gestation (Hobel &
Culhane 2003). The early stages of fetal nutrition and growth are to a large extent determined by the
nutritional state of the mother at the time of conception (Jackson 1996). Therefore, the nutritional
status, and body composition of a woman at the time she becomes pregnant are at least as important

21
as her nutrient intake during the course of the pregnancy itself for the growth of her fetus. Fetal
development can be affected by nutritional variation within the normal range of western diets
(Godfrey et al. 1996). A large body of epidemiological evidence supports the association between
several nutritional deficiencies before or during pregnancy and maternal morbidity, length of
pregnancy or fetal growth (Kramer 2003). It is unlikely that any specific nutrient on its own can
prevent the major health problems encountered in pregnant women and developing fetuses. The
complex relationship between maternal nutritional and birth outcomes emphasizes the need for
consistent and thorough assessments of women's diets throughout the duration of their pregnancy.
2.3.2 Fetal origins of diseases
Epidemiological observations have led to the hypothesis that certain conditions, most likely
nutritional in origin, “program” the fetus for the development of chronic diseases in adulthood
(Waterland & Garza 1999, Rasmussen 2001, Bateson et al. 2004, Gluckman & Hanson 2004a;
2004b). The extensive literature on research in evolutionary biology, developmental biology, and
animal and human physiology provides support for this idea and suggests that environmental
processes influencing the propensity to disease in adulthood operate during the periconceptual,
fetal, and infant phases of life. Since the first evidence for programming obtained in birds over 100
years ago (Spalding 1873), some of the most ground-breaking observational studies in humans were
done by Barker (1992) in the late 1980s. He and his colleagues showed that small size at birth or in
infancy is associated with an increased propensity to adverse health outcomes in adulthood. Based
also on later additional data, Barker and his colleagues proposed that different profiles of poor fetal
growth for each trimester are associated with hypertension and/or diabetes and stroke (Barker 1995,
Godfrey et al. 1996). The proposed mechanism is related to the regulation of allometric growth with
those organs most crucial for continued survival of the organism, in particular the brain, being
favoured over organs such as the pancreas, kidney or endothelial cells. This "developmental origins
of health and disease" is not yet established to be causal. Only a handful of studies have been able
to examine the relationship between maternal nutrition in pregnancy with the health of offspring in
22
adult life directly. In fact, some studies could find no evidence for maternal intake of nutrients being
an important determinant of the long-term health of infants of the relatively well-nourished women
in industrialized countries (e.g. Mathews et al. 2004). In fact, an opposite relationship has been
observed. Researchers in this field are faced with the methodological difficulties of eliminating
biases and adequately adjusting for potentially important confounding factors in retrospective
studies; this is known to be a complex task (reviewed by Waterland & Garza 1999).
Gluckman and Hanson (2004a, 2004b) have introduced a model in which the embryo or the fetus
develops predictive responses (either disruptive or adaptive) according to environmental stimuli. If
the prenatal and postnatal environments match, the physiological settings achieved through the
processes of developmental plasticity will leave the organism well prepared for the postnatal
environment. Conversely, a mismatch between the prenatal and postnatal environments may be
pathogenic. Based on that model, they have emphasized the importance of the need to promote the
health and nutrition of females of reproductive age as one element for the prevention of chronic
disease in future generations across the globe. Other have claimed that it is too early to use the
“metabolic imprinting” hypothesis as a basis for new interventions directed at pregnant women for
the purpose of reducing chronic disease in their offspring (Rasmussen 2001). However, such
interventions could be important in populations that experience high rates of low birth weight
(Waterland & Garza 1999).
2.3.3 Transfer of nutrients and antibodies to the fetus
The transfer of nutrients to the fetus depends on the maternal nutritional status and on the adequacy
of uterine blood flow. Fat-soluble vitamins cross the placenta by simple diffusion, carbohydrates by
facilitated diffusion, and amino acids, water-soluble vitamins, and some minerals by active
transport (McGanity et al. 1994). Placental transport mechanisms and placental metabolism play
major roles, independently and together, in providing for the nutritional requirements of fetal
growth and metabolism. For some nutrients, the infant’s status is maintained at the expense of the
23
mother; for other nutrients mother and offspring compete more evenly, and for others the infant can
suffer more severe consequences due to deficiency than the mother (Garza 1993). The neonatal
immune system is functionally immature and undergoes a period of extensive differentiation and
maturation once exposed to foreign proteins and other dietary components (Hughes 1998). There is
a transfer of anti-idiotypic antibodies from the mother to the fetus (Malek et al. 1996). Newborns
have predominantly maternal IgG in their serum, but after 3 months, most of the serum IgG has
been produced by the infant (Sarvas et al. 1993).
In utero fetal exposure to an allergen from around 22 weeks of gestation may result in primary
sensitisation to that allergen, leading to positive proliferative responses, at birth (Jones et al. 1996).
However, the placenta seems to protect the fetus against the effect of maternal food antigens, and
specific sensitization has been demonstrated only occasionally in newborn infants (Lovegrove et al.
1994, Zeiger 2000). The latest Cochrane database review concluded that prescription of an antigen
avoidance diet to a high-risk woman during pregnancy is unlikely to reduce substantially her child's
risk of atopic diseases; such a diet may even adversely affect maternal and/or fetal nutrition
(Kramer & Kakuma 2003).
2.3.4 Dietary recommendations during pregnancy
The latest national nutrition recommendations for infants and young children as well as pregnant
and breastfeeding mothers were published in Finland in 2004 (Hasunen et al. 2004). The dietary
guidelines are based on the Finnish Nutrition Recommendations issued by the National Nutrition
Council (Valtion ravitsemusneuvottelukunta 2005) and the latest research. The main message
concerning nutrition during pregnancy is simple; healthy mothers with a balanced diet do not need
to make any specific changes in their diet during pregnancy and breastfeeding. Some specific
quantitative guidelines are given for fruits and vegetables (5-6 portions per day), and liquid milk
products (8 dl per day), but the given overall picture is that dietary guidelines may be achieved with
24
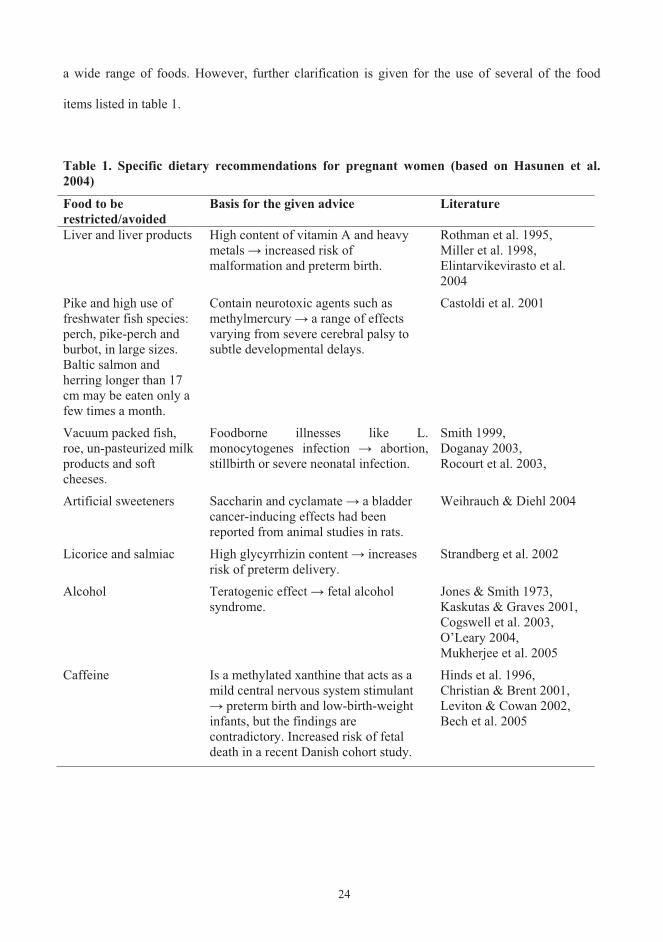
a wide range of foods. However, further clarification is given for the use of several of the food
items listed in table 1.
Table 1. Specific dietary recommendations for pregnant women (based on Hasunen et al. 2004)
Food to be restricted/avoided
Basis for the given advice Literature
Liver and liver products High content of vitamin A and heavy metals increased risk of malformation and preterm birth.
Rothman et al. 1995, Miller et al. 1998, Elintarvikevirasto et al. 2004
Pike and high use of freshwater fish species: perch, pike-perch and burbot, in large sizes. Baltic salmon and herring longer than 17 cm may be eaten only a few times a month.
Contain neurotoxic agents such as methylmercury a range of effects varying from severe cerebral palsy to subtle developmental delays.
Castoldi et al. 2001
Vacuum packed fish, roe, un-pasteurized milk products and soft cheeses.
Foodborne illnesses like L. monocytogenes infection abortion, stillbirth or severe neonatal infection.
Smith 1999, Doganay 2003, Rocourt et al. 2003,
Artificial sweeteners Saccharin and cyclamate a bladder cancer-inducing effects had been reported from animal studies in rats.
Weihrauch & Diehl 2004
Licorice and salmiac High glycyrrhizin content increases risk of preterm delivery.
Strandberg et al. 2002
Alcohol Teratogenic effect fetal alcohol syndrome.
Jones & Smith 1973, Kaskutas & Graves 2001, Cogswell et al. 2003, O’Leary 2004, Mukherjee et al. 2005
Caffeine Is a methylated xanthine that acts as a mild central nervous system stimulant
preterm birth and low-birth-weight infants, but the findings are contradictory. Increased risk of fetaldeath in a recent Danish cohort study.
Hinds et al. 1996, Christian & Brent 2001, Leviton & Cowan 2002, Bech et al. 2005

25
2.3.5 Nutrient intake in pregnancy
The estimated energy requirement during a full-term pregnancy, in excess of a woman’s
nonpregnant need, is estimated to be 335 MJ (FAO/WHO/UNU 1985). Well-nourished women
use different strategies to meet the energy demands of pregnancy including reductions of diet-
induced thermogenesis or activity energy expenditure, increases in energy intake, and deposition of
less body fat mass than anticipated (Kopp-Hoolihan et al. 1999), and therefore, the use of a single
recommendation for increased energy intake in all pregnant women is not justified. Butte and his
colleagues (Butte et al. 2003, Butte et al. 2004) have recently questioned the common thinking that
the energy cost of pregnancy could be met without any increase of food intake by economy of
activity; their studies showed that appropriate, but not excessive, gestational weight gain is needed
to optimize infant birth weight and to minimize maternal postpartum fat retention. They also
showed that weight gain above the recommendations based on prepregnancy basal metabolic
indexes tends to consist of fat, which confirms the belief that such weight gain is undesirable.
The fetal pattern of nutrient demand varies in detail at each stage of gestation. Nutritional
deficiencies and infections among pregnant women are rather prevalent in many developing
countries as well as in inner-city populations of industrialized countries. Nutrients are provided to
pregnant women as supplements to food either to increase the intake of those individuals with a
deficiency or to obtain a pharmacological, perhaps non-nutritional, effect in individuals with an
adequate intake of the nutrient; a borderline situation in between those two extremes being
sometimes fluctuating and critical during pregnancy. Several nutritional interventions have been
shown to be effective during pregnancy including iron and folate supplements in reducing anemia,
and calcium supplementation in lowering the risk of hypertension (Fall et al. 2003, Villar et al.
2003). There has been an increasing interest in the role of essential fatty acids during pregnancy
during the last two decades. The essential fatty acids requirements are especially high during the
last trimester of pregnancy because of the rapid synthesis of brain tissue (Al et al. 2000). However,
26
more studies are still needed to clarify their functional benefits for mothers and children. Studies in
developed countries have indicated that folate, vitamin D, and iron are the most critical nutrients in
terms of deficiencies during pregnancy (Table 11; Ortega et al. 1994, Henriksen et al. 1995, Rogers
& Emmett 1998, Rogers et al. 1998, Giddens et al. 2000, Hess et al. 2001, French et al. 2003,
Turner et al. 2003) and they are therefore reviewed in more detail below. The only data on dietary
habits and nutrient intakes of Finnish pregnant women dates from the early 1970s (Pietinen 1974).
According to the Findiet 2002 –study (Männistö et al. 2003), the intakes of folate, thiamine, and
vitamin D were low in Finnish women of childbearing age.
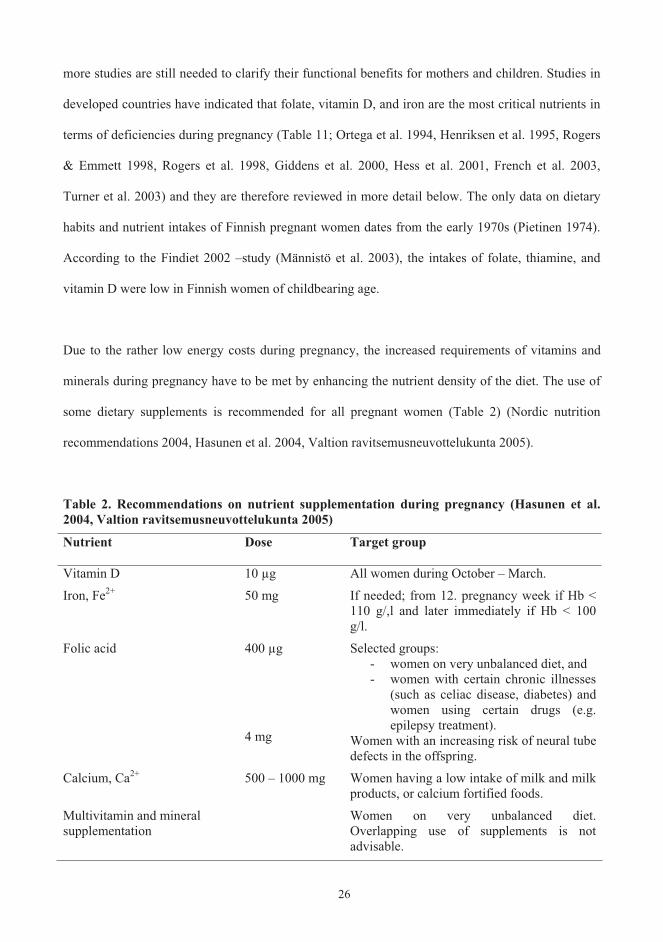
Due to the rather low energy costs during pregnancy, the increased requirements of vitamins and
minerals during pregnancy have to be met by enhancing the nutrient density of the diet. The use of
some dietary supplements is recommended for all pregnant women (Table 2) (Nordic nutrition
recommendations 2004, Hasunen et al. 2004, Valtion ravitsemusneuvottelukunta 2005).
Table 2. Recommendations on nutrient supplementation during pregnancy (Hasunen et al. 2004, Valtion ravitsemusneuvottelukunta 2005)
Nutrient Dose Target group
Vitamin D 10 μg All women during October – March.
Iron, Fe2+ 50 mg If needed; from 12. pregnancy week if Hb < 110 g/,l and later immediately if Hb < 100 g/l.
Folic acid 400 μg
4 mg
Selected groups: - women on very unbalanced diet, and - women with certain chronic illnesses
(such as celiac disease, diabetes) and women using certain drugs (e.g. epilepsy treatment).
Women with an increasing risk of neural tube defects in the offspring.
Calcium, Ca2+ 500 – 1000 mg Women having a low intake of milk and milk products, or calcium fortified foods.
Multivitamin and mineral supplementation
Women on very unbalanced diet. Overlapping use of supplements is not advisable.

27
Folate
During the last decade, folate has become a topic of considerable interest and there is an intense,
on-going debate on the folate needs of women of childbearing age if one wishes to reduce the risk
of babies born with neural tube defect (e.g. Lewis et al. 1999). A new interest of research is the
relation between folate and homocysteine intakes and the risk of cardiovascular disease (Boushey et
al. 1995, Rasmussen et al. 2000). Due to the increased demands that are placed on the supply of
folate during pregnancy for the synthesis of DNA and other one-carbon transfer reactions, pregnant
women are at a higher risk of developing folate deficiency than non-pregnant women (Bailey 2000).
Spina bifida (neural tube defect) results from failure of fusion of the caudal neural tube, and is one
of the most common malformations of human structure (Mitchell et al. 2004). As many as 70% of
spina bifida cases can be prevented by maternal, periconceptional folic acid supplementation, first
demonstrated in the trials of Smithells and colleagues (1980). The mechanism underlying this
protective effect is unknown, but it is likely to include the genes that regulate folate transport and
metabolism. Inadequate folate intake and low serum folate concentrations have also been shown to
be associated with other poor pregnancy outcomes, including a greater risk of preterm delivery and
infant low birth weight (Scholl et al. 1996, Siega-Riz et al. 2004).
The main dietary sources of folate in Finnish diet are vegetables 12%, wholemeal ryebread 11%,
fruits 10%, and potato 10% (Alfthan et al. 2003). Folic acid supplements taken with food are
calculated to be 1.7 times more available than the folate occurring naturally in foods (Bailey 2000).
The losses of folate by oxidation and during heat treatments have to be taken into account when
evaluating the actual intake from food (Bergström 1994). It is also assumed that nutrient databases
currently provide underestimates of the folate contents of foods due to methodological problems in
the analytic assays used to measure food folate (Bailey 2000).

28
In the Finnish study of Alfthan et al. (2003), the mean dietary folate intake in women was 205 g
/day (33 g/MJ), which is half of the recommended daily intake (400 g/day) during pregnancy.
Furthermore, the dietary folate intake is also inadequate for those who want to become pregnant; a
finding which has been noted in many other countries as well (Brussaard et al. 1997). Pregnant
women are advised to increase their consumption of foods rich in folate (Hasunen et al. 2004).
However, the international retrospective cohort study covering more than 13 million births (Finland
included) detected no detectable change in rates of neural tube defects associated with
recommendations to consume more folic acid (Botto et el. 2005). The authors recommended rapid
integrated food fortification with greater implementation of recommendations on supplements; a
strategy which is also supported by other studies on the same field (e.g. Langley-Evans & Langley-
Evans 2002). Lack of awareness of the importance of folate seems to be the most common reason
given for choosing not to use folic acid supplements before pregnancy (French et al. 2003).
However, the knowledge about folate seems not to be related to its intake.
Vitamin D
Unlike many other nutrients used in the fortification of foods, the purpose of vitamin D is to correct
for an environmental deficit (less ultraviolet exposure) and not to correct for lack due to classical
nutritional reasons (Vieth 1999). Our evolution has effectively adapted human beings to live in the
presence of far more vitamin D than the levels present today for much of the world’s population, yet
there is no consensus about optimal or safe vitamin D intake. The recommended dietary allowance
of vitamin D (National Academy of Sciences 1989) as well as the Nordic (Nordic Nutrition
Recommendations 2004) and the Finnish nutrition recommendation (Valtion
ravitsemusneuvottelukunta 2005) during pregnancy is 10 g (400 IU). The scientific basis for this
recommendation is not well defined; nor is the appropriate dose of vitamin D during pregnancy.
The recommended dose has been criticized as having little or no effect in women (Vieth 1999,
Hollis & Wagner 2004). Several studies have indicated that doses exceeding 25 g (1000 IU)

29
vitamin D per day during pregnancy and lactation are required to achieve a robust normal
concentration of circulating 25(OH)D (reviewed by Vieth 1999, Hollis & Wagner 2004). Studies
reviewed by Vieth (1999) support the belief that total-body sun exposure can easily provide the
equivalent of 250 g (10 000 IU) vitamin D/day, suggesting that this is a physiologic limit. The
exact amount of vitamin D required to induce toxicity is unknown in humans. In the well known
case series by Adams and Lee (1997) four individuals taking several dietary supplements containing
vitamin D presented with hypercalciuria that moderated after vitamin D intake was terminated.
Since vitamin D is potentially toxic, intake of > 25 g (1000 IU)/day has not been recommended
even though there is no evidence of adverse effects on serum 25(OH)D concentrations which do not
exceed 140 nmol/L, to exceed that level is thought to require a total vitamin supply of 250 g
(10 000 IU) (reviewed by Vieth 1999). In comparison to the toxic amounts in animal models,
millions of units of vitamin D would have to be ingested to achieve the same results in humans.
Adequate vitamin D concentrations during pregnancy are necessary to ensure appropriate maternal
responses to the calcium demands of the fetus, which are estimated to be up to 250 mg/day during
the last trimester (Widdowson 1981). Vitamin D insufficiency and deficiency during pregnancy is
reflected in lower maternal weight gain and in extreme situations, reduced bone mineralization,
rickets and fractures in the infant (reviewed by Pawley & Bishop 2004). The vitamin D status of the
human fetus and neonate is totally dependent on the vitamin D stores of the mother (Hollis &
Pittard 1984). Observational studies and vitamin D supplementation trials among pregnant women
at high risk of vitamin D deficiency showed improved neonatal handling of calcium with improved
maternal vitamin D status (reviewed by Specker 2004). However, results concerning the effects of
vitamin D on maternal weight gain and fetal growth were conflicting and inconclusive. There was
no evidence to indicate any beneficial effects of vitamin D intakes in excess of the amounts
routinely recommended during pregnancy to prevent vitamin D deficiency (Specker 2004).

30
In the updated Finnish nutrition recommendations (Valtion ravitsemusneuvottelukunta 2005) the
recommended daily intake for vitamin D for people aged 2 – 60 years has increased to 7.5 g (vs.
the old recommendation of 5 g) to try to combat the decrease in the circulating 25(OH)D
concentration occurring during the winter months and in order to prevent the risk of some chronic
diseases. Since February 2003, most Finnish liquid milk products have been supplemented with
vitamin D and the dose in margarines has been increased (KTMa n:o 917/2002; Kauppa- ja
teollisuusministeriö 2002). Due the fortification, the Ministry of Social Affairs and Health updated
its recommendation on vitamin D supplementation (Sosiaali ja terveyministeriö 2003), though the
recommendation on supplementation during pregnancy remained unchanged. Populations at risk for
vitamin D deficiency are those for which, for environmental, cultural, or medical reasons, exposure
to sunlight is poor and the dietary intake of vitamin D is low. The Findiet 2002 Study (done before
the new vitamin D fortification) showed that especially in the youngest age group, the intake of
vitamin D in Finnish women was below the recommendation (Männistö et al. 2003). The main
dietary sources of vitamin D were fish dishes (about the half of the total intake) followed by
fortified margarines. In the simulated risk assessment of vitamin D fortification, two modelled
scenarios (1: all potential foods in question were fortified; 2: only part of food brands were
fortified) showed that foods potentially fortified with vitamin D were mainly safe in the adult
population (Hirvonen et al. 2004). The real impact of the recent vitamin D fortification on the total
dietary intake of vitamin D or vitamin D status in Finns has yet to be demonstrated.
Iron
A considerable proportion of pregnant women in both the developing and industrialized countries
become anemic during pregnancy (Mungen 2003). In Europe, iron deficiency is considered to be
one of the main nutritional deficiency disorders affecting large proportions of the population,
particularly those that are at peak rates of growth, namely, infants, children, and pregnant women
(Hercberg et al. 2001). Moreover, women, especially adolescents consuming low-energy diets,

31
vegetarians and vegans are at high risk of suffering iron deficiency. The necessity of routine iron
supplementation during pregnancy has been widely debated in industrialized countries and routine
supplementation is not universally practiced in all countries. Routine iron supplementation results in
a substantial reduction of women with haemoglobin levels < 100 g/L in late pregnancy (Villar et al.
2003). The major problem with iron supplementation during pregnancy is compliance. Despite
many studies, the relationship between maternal anemia and adverse pregnancy outcome is unclear.
Existing data suggest that severe iron deficiency anemia (haemoglobin concentration of 90 – 100
g/L) may be associated with both impaired fetal and maternal health, including preterm delivery and
higher maternal mortality (Allen 1997).
The Nordic Council of Ministers has issued a statement that the physiological need for iron during
the second and third trimester of pregnancy cannot be supplied solely through the diet, and the
statement is also followed in Finland (Nordic Nutrition Recommendations 2004, Valtion
ravitsemusneuvottelukunta 2005). Iron supplementation during pregnancy is therefore
recommended (Table 2). It is assumed that targeting intervention programs to the prenatal period
may be of greater benefit than relying on intervention during the late pregnancy, when the real
window of opportunity for a positive impact on fetal growth and development has possibly passed
(Beard 2000). Large iron stores may represent a health hazard since they can promote the
production of free radicals and evoke oxidative damage; most evidently increasing cardiovascular
disease risk (Schumann 2001). Gastrointestinal distress is primarily observed in individuals who
have consumed high levels of supplemental iron on an empty stomach.
There are clear relationships between iron requirements, bioavailability of dietary iron, and amounts
of stored iron. A reduction in iron stores and a decrease of hemoglobin iron had the same increasing
impact on iron absorption, suggesting that the control of iron absorption is mediated from a
common cell (most likely the hepatocyte), which may register both the size of the iron stores and

32
haemoglobin-derived iron deficit (Hallberg & Hulthen 2002). Dietary recommendations during
pregnancy should include all means for increasing the content of dietary factors enhancing iron
absorption or reducing the content of factors inhibiting iron absorption.
2.3.6 Obesity in pregnancy
The rising prevalence of obesity as well as the high proportion of women who gain weight in excess
of recommendations during pregnancy are significant health problems in the Western World (Siega-
Riz et al. 2004). Different weight gain targets are recommended during pregnancy according to
prepregnancy BMI so that recommendable weight gain is 12,5 – 18; 11,5 – 16; and 7 – 11,5 kg in
BMI-classes 18,5 – 19,9; 20,0 – 25,9; and > 26, respectively (Scientific Committee for Food 1993,
Stakesin perhesuunnittelun ja äitiyshuollon asiantuntijaryhmä 1999). Among women of
childbearing age, one potential pathway for the development of obesity has been attributed to the
retention of gestational weight gain (Rössner & Ohlin 1995). The mean age and prepregnancy body
mass index of all Finnish pregnant women increased from the 1960s to the year 2000 (from 26.5 to
29.6 years, from 21.9 to 23.7 kg/m2) (Kinnunen et al. 2003). Also the mean pregnancy weight gain
in all body mass index categories has increased in Finland since the 1960s; on average from 13.2 to
14.3 kg (adjusted for mother's age, body mass index and parity).
According to the results of a Swedish follow-up study (Linne et al. 2004), targeting to the weight
gain during pregnancy is more important than focusing on weight control programs for women who
are obese already before pregnancy. High weight gainers during pregnancy seem to retain more
weight over the long-term, whereas women who are overweight before pregnancy do not have a
higher risk of postpartum weight retention than normal weight women. However, women who are
overweight or obese before pregnancy breastfeed for a shorter time than normal-weight women
(e.g. Baker et al. 2004). Higher pre-pregnancy body mass index is also associated with increased
risk of neural tube defects due to some unknown mechanism (Mojtabai 2004).

33
The largest retrospective analysis to date among 287 213 pregnant London women demonstrated
that many adverse outcomes of pregnancy are associated with maternal obesity, and the risk
increases with the degree of obesity (Sebire et al. 2001). Increasing maternal body mass index was
associated with increased magnitude of gestational diabetes, proteinuric pre-eclampsia, induction of
labour, delivery by emergency caesarean section, postpartum haemorrhage, genital and urinary tract
infections, wound infection, birthweight above the 90th centile, and intrauterine death. However,
social class was not used as a covariate in that study, despite the fact that social class has been
shown to have an association with some of the outcome variables. In Finland, as well as in most
Western countries, the least well educated sector of the community has the greatest risk for obesity
(reviewed by Lahti-Koski & Sirén 2004).
2.4 Diet in infancy
2.4.1 Breastfeeding
The benefits of breastfeeding are probably one of the most frequently stated claims in the scientific
nutritional literature and the last decades have produced an enormous amount of new information
on this issue. More than 100 years ago Ehrlich (1892) demonstrated that milk contains protective
factors and although it was realized that some of these factors would be antibodies, it was not until
1961 (Hanson 1961) that the main human-milk immunoglobulin secretory immunoglobulin A
(SIgA), was characterized immunologically and isolated. Anti-idiotypic antibodies as well as T and
B lymphocytes are transferred via milk and seem to actively stimulate the immune system of the
offspring (reviewed by Hanson 1998; 1999). The ability of the mother to secrete antibodies directed
against specific antigens that she and the infant encounter in the environment would appear to
confer on human milk an environmental specificity and a significant protective potential, possibly
with several long-term positive effects (Hanson 1998). Another unique character of human milk is
its rich diversity of approximately 130 different oligosaccharides which are involved in a number of
functions, such as protecting the breast-fed infant from pathogens and providing substrates for
bacteria in the infant colon (Miller & Mc Veagh 1999).
34
Although breastfeeding is universally accepted as the optimal feeding method for newborns,
opinions and recommendations are still divided on its optimal duration. Exclusive breastfeeding is
recommended worldwide for infants during the first 4-6 months (Statement of the Standing
Committee on Nutrition 1994, Høst et al; The European Society for Paediatric Allergology and
Clinical Immunology and the European Society for Paediatric Gastroenterology, Hepatology and
Nutrition 1999) or until the age of 6 months (Position of the American Dietetic Association 2001,
WHO 2002; 2003, Gartner et al; American Academy of Pediatrics 2005) based on scientific
evidence of health benefits in breastfed infants, as well as the advantages for the mothers, the health
system and society (Forsyth 1995, Heinig & Dewey 1996, Heinig & Dewey 1997; Anderson et al.
1999, Lutter 2000, Yngve & Sjöström 2001a, Kramer & Kakuma 2002; 2004). In the previous
version of the Finnish nutrition recommendations for infants (Hasunen et al. 1997), exclusive
breastfeeding was recommended for 4-6 months. The recently published updated version (Hasunen
et al. 2004) took into consideration the WHO recommendations (WHO 2003) and the duration of
exclusive breastfeeding is now recommended until the age of 6 months, complementary feeding
starting individually at the latest at the age of 6 months (Table 3). Breastfeeding should continue
partially until the end of the first year.
Insufficient prenatal breastfeeding training, short postpartum hospital stay, insufficient professional
support, maternal employment, lack of broad societal support, and powerful marketing of infant
formulas are some of the barriers to breastfeeding (Position of the American Dietetic Association
1997, Rogers et al. 1997a, Dennis 2002, Gartner et al. 2005). A short duration of breastfeeding and
introduction of complementary foods at an early age can be associated with impaired
neurocognitive development (Anderson et al. 1999, Jain et al. 2002), obesity (Arenz et al. 2004,
Owen et al. 2005), and chronic diseases, such as celiac disease (Ivarsson et al, 2002), T1D
(Virtanen & Knip 2003), and cardiovascular diseases (Owen et al. 2002; 2003). A multidisciplinary
review of infant feeding mode in relation to allergy concluded that breastfeeding seems to protect

35
from the development of atopic disease (van Odijk et al. 2003). However, the immunomodulatory
properties of breast milk may vary according to the maternal diet; a maternal diet low in saturated
fat and rich in natural sources of vitamin C during breastfeeding was associated with a lower risk of
atopic sensitisation and dermatis in the Finnish prospective birth cohort study and in a follow-up
study (Hoppu et al. 2000; 2005). The long-term effect of breastfeeding on atopic diseases has been
claimed to double-edged: in children with atopic heredity, breastfeeding protects against atopy,
whereas in children without atopic heredity, breastfeeding could increase the risk of atopy (Siltanen
et al. 2003).
Results from a Finnish national survey performed in 2000 (Hasunen 2002) indicated that 68% of
infants younger than 1 month were exclusively breastfed, but the target of breastfeeding exclusively
up to the age 4 to 6 months was rarely achieved (14% and <1%, respectively). The proportions of
exclusively breastfed infants at the age of 6 months in local descriptive breastfeeding surveys done
in central Finland and Vantaa were 8% and 6%, respectively (Tepora et al. 1999, Sihvola 2001).
Since 1995, the length of breastfeeding has also been reported in two Finnish child targeted surveys
in Turku; Special Turku Coronary Risk Factor Intervention Project for Babies (STRIP) (Simell et
al. 2000) and in some studies of the Nutrition, Allergy, Mucosal immunology and Intestinal
microbiota (NAMI) Research group (Hoppu et al. 2000; 2005). Only the length of total
breastfeeding was reported among the STRIP subjects, being on average 5.3 months in the
intervention and 4.9 (SD 3.7 for both groups) months in the control group (Simell et al. 2000). The
inclusion criteria of NAMI studies (Hoppu et al. 2000; 2005) have included the certain length of
breastfeeding and the reported breastfeeding rates are therefore, not directly comparable with other
Finnish surveys.

Tab
le 3
. Die
tary
rec
omm
enda
tions
in in
fanc
y (b
ased
on
Has
unen
et a
l. 20
04)
R
ecom
men
ded
earl
iest
ag
e at
intr
oduc
tion
(mon
ths)
Not
suita
ble
amon
g th
e fo
od g
roup
bef
ore
the
age
of 1
yea
r
Infa
nt fo
rmul
a if
brea
st m
ilk n
ot a
vaila
ble
0 So
y, o
at, r
ice,
sesa
me,
and
alm
ond
base
d dr
inks
as s
ubst
itute
s for
in
fant
form
ula
Firs
t sup
plem
enta
ry fo
od
4-6
(1
Pota
to /
carro
t 4-
6 N
ew p
otat
oes i
n sm
all s
izes
Frui
t / b
errie
s 4-
6 C
anne
d fr
uits
, rhu
barb
Veg
etab
les
4-6
Peas
, bea
ns, a
nd c
abba
ges i
n la
rge
porti
ons;
mus
hroo
ms;
nut
s, al
mon
ds a
nd se
eds;
spro
uts
Glu
ten-
cont
aini
ng c
erea
ls
(whe
at, r
ye, b
arle
y, o
at)
5-6
Oth
er c
erea
ls
(ric
e, m
aize
, etc
.) 5-
6
Mea
t 5-
6 Li
ver a
nd li
ver p
rodu
cts
Fish
6
Egg
5-6
D
airy
pro
duct
s (o
ther
than
supp
lem
enta
ry m
ilk fe
edin
g an
d fo
od c
onta
inin
g hy
drol
yzed
milk
pro
tein
) 10
-12
Flav
oure
d m
ilk p
rodu
cts c
onta
inin
g a
grea
t var
iety
of f
ood
addi
tives
Veg
etab
les h
igh
in n
itrat
es /
nitri
tes
12
Swed
e, tu
rnip
, bee
troot
, spi
nach
, and
Chi
nese
cab
bage
Saus
ages
12
A
ll sa
usag
es
Oth
ers
Sa
lt, re
ady-
to-e
at-f
oods
, cac
ao, t
ea, h
oney
(1
Excl
usiv
e br
east
feed
ing
is re
com
men
ded
until
the
age
of 6
mon
ths,
com
plem
enta
ry fe
edin
g st
artin
g in
divi
dual
ly a
t the
late
st a
t the
age
of 6
mon
ths.
36

37
Breastfeeding is heavily influenced by cultural considerations and its prevalence varies widely between
societies (Rogers et al. 1997a). Among Europeans, high rates of breastfeeding initiation are found in
Sweden, Norway and Greece; and low rates in Ireland, France and United Kingdom (The Euro-Growth
Study, Freeman 2000, Yngve & Sjöström 2001a, Lande et al. 2003). Only 25% and 15% of Euro-
Growth infants were breastfed exclusively up to the ages of 3 and 4 months. In comparison with other
European countries, the rate and duration of breastfeeding in Finland have been quite high (Yngve &
Sjöström, 2001a). The results of studies on breastfeeding are somewhat difficult to interpret due to the
different breastfeeding definitions used (e.g. Aarts et al. 2000). WHO (2002) has developed a set of
definitions, in which only drops of vitamins or minerals are allowed if the term ‘exclusive’
breastfeeding is used. In keeping with the WHO definitions, it is now stated in the new Finnish nutrition
recommendations for infants (Hasunen et al. 2004) that only tastes of water are recommended for
exclusively breastfed infants. However, due to the old habit and recommendation of giving water to
breastfed infants, the possibility that infants classified to the exclusive category in the Finnish studies
have been given more than tastes of water, cannot be ruled out.
2.4.2 Weaning
Infants are at the mercy of their parents regarding feeding from the very beginning. Flavours from the
mother’s diet during pregnancy are transmitted to the amniotic fluid and swallowed by the fetus
(Mennella et al. 2001). Consequently, the cultural-specific flavour principles may be experienced by
the infants before their first exposure to complementary foods (Birch 1998). During the first year of
life, patterns of food intake change dramatically. The infant moves from a completely milk-based diet
to consumption of a wide range of foods and there is the potential for significant variation in how this
change is achieved. This early learning of eating is constrained by the child’s genetic predispositions,
which includes the unlearned preference for sweet and salty tastes, and the rejection of sour and bitter
tastes (Birch 1998, Birch & Fisher 1998). Children usually learn to prefer energy-dense foods and
foods offered in positive contexts (Birch 1998). Feeding milestones, based on physiologic and
neurologic maturation, with a significant impact on weaning behaviors include taking food from a
38
spoon, chewing foods, self-feeding with fingers, independent feeding from a cup, and using utensils
(Pridham 1990). Persistent eating behaviours and particular dietary patterns, which are strongly
influenced by social, demographic and lifestyle factors relating to the family, particularly to the
mother, could be seen by the age of 2 to 3 years (Nicklas et al. 1991, Birch 1998, North & Emmett
2000). Some of these patterns began to emerge as early as 9 to 11 months of age in a recent survey
among infants in the US Feeding Infants and Toddlers Study (FITS), (Fox et al. 2004).
The optimal age for the introduction of complementary foods in infants is poorly known, and
recommendations given by nutritionists, health professionals, and the baby food industry may differ
greatly, which can easily confuse parents. The scientific basis for the current weaning
recommendations relies on the current knowledge on nutritional need, physiologic maturation, and the
behavioural and developmental aspects of infants (reviewed by Hendricks & Badruddin 1992).
However, more research is needed in a number of areas before the recommendations can include
more precise guidelines. WHO issued a global public health recommendation in 2002, stating that
being exclusively breastfed for the first 6 months of life, infants should receive nutritionally adequate
and safe complementary foods while breastfeeding continues for up to 2 years of age or beyond.
Similarly to the EU recommendations (Scientific Committee for Food 1990) in Finland it is advised to
start complementary feeding individually at the latest at the age of 6 months (Hasunen et al. 2004).
The recommended age when different foods can be introduced at the earliest are shown in Table 3
(Hasunen et al. 2004). In the developed countries, very early complementation is usual, not because of
nutritional need, but because of other determinants including social pressures, availability of
convenient alternatives, and maternal employment (reviewed by Wright & Schanler 2001).
Accustoming infants to complementary foods is a lengthy process, and this has been shown to take
longer the younger the infant is at introduction (Hörnell et al. 2001). Repeated exposure to new
foods, especially those that are not sweet, is critical for acceptance (Birch & Fisher 1998). In

39
contrast to other complementary foods, formula is usually given in large amounts already on the first
occasion, since it is viewed as a replacement for breast milk (see e.g. Michaelsen 1997). In a Danish
cohort study (Michaelsen 1997) about 80% of the infants received regular infant formula during the
first 3 days after delivery, despite the fact that all of the infants were healthy and full-term. With a few
exceptions, all of the infants were exclusively breastfed at discharge from the maternity ward. No
benefits, in terms of growth, of introducing complementary foods between 4 and 6 months were
demonstrated in 20 studies included in the meta-analysis of Kramer & Kakuma (2002; 2004). The
only exception was improved iron status in one developing country setting (Dewey et al. 1998). It is
assumed that prolonged breastfeeding increases resistance to weaning, and that later feeding problems
can be reduced if chewable foods are introduced at an appropriate age (Paine & Spegiorin 1983), but
this hypothesis has been strongly questioned (e.g. Hörnell et al. 2001). However, most researchers
seem to agree that foods requiring chewing should be introduced at about the ages of 6 to 8 months to
avoid later problems with the acceptance of lumpy food (Paine & Spegiorin 1983). Infants are not
passive receptacles for flavoured foods; parents offering a variety of foods will provide both a
nutritious, well-balanced diet, as well as an opportunity for their children's own personal preferences
to develop (Birch & Fisher 1998, Mennella & Beauchamp 1998).
The appropriate time for the introduction of complementary feeding varies considerably in different
sociocultural settings and among different socioeconomic groups (Underwood & Hofvander 1982).
Complementary foods are introduced early to European infants; more than half of the children in
the Euro-Growth Study were consuming some complementary food by the age of 3 months
(Freeman et al. 2000). Fruits (73%) and cereals (51%) were the first foods used for most infants.
Duration of breastfeeding was significantly correlated with age of introduction of complementary
foods. As many as, 93% of infants had received complementary foods before the age of 4 months in
a longitudinal study in UK (Savage et al. 1998). Early introduction of complementary foods (mean
age 3.4 months) was also reported recently in Lithuanian cohort, and it was assumed that such

40
patterns can be attributed to the former Soviet recommendations of introducing strained fruit at 1.5
months (Vingraite et al. 2004). Conversely, a rather positive trend has been found in Scandinavia;
only 34% and 21% of the infants had been introduced to complementary foods before the age of 4
months in Sweden and Norway, respectively (Hörnell et al. 2001, Lande et al. 2003). However,
since the data was obtained from a retrospectively completed FFQ covering the time from birth up
to 6 months of age, this could have introduced some recall bias in the Norwegian study. Being a
preterm infant seems to increase the risk for early weaning: data collected from a series of
prospective trials in UK showed that over three quarters of preterm infants were receiving
complementary food by 12 weeks corrected age, the mean age at weaning being less than 4 months
in term infants (Fewtrell et al. 2003). This is, however, not supported by Finnish studies in which
being a preterm infant was a risk factor for initiation and shorter duration of breastfeeding, but not
for earlier introduction of complementary foods (other than infant formula), (Räisänen et al. 1998,
Hasunen 2002). In a Danish national birth cohort among 3768 mother-infant pairs prepregnant
obesity (BMI 30), short durations of breastfeeding, and earlier introduction of complementary
food were associated with 0.7 kg of additional weight gain during infancy (Baker et al. 2004).
Recently, some steps have been taken to improve complementary feeding worldwide (Piwoz et al.
2003) by applying some methods used in the successful promotion of breastfeeding by the
statements of the Ten Steps to Successful Breastfeeding (WHO/UNICEF 1989).
Infant diet has changed during the last decades in Finland as well as in many other countries
(Whitehead & Paul 1984, Hasunen et al. 1996). With the growing popularity of breastfeeding, the
transition to a diet including complementary foods has shifted to a later age; from the mean age of 2
months in 1976 (Virkkunen 1978) to the age of more than 3 months in 2000 (Hasunen 2002). There
have also been marked changes in the composition of infant formula, in the consumption of ready-
made commercial infant food, and in the advice on what constitutes a weaning diet. A particularly
high consumption of ready-made commercial infant foods, averaging more than 100 kg/a child/year

41
(Europeaus 2005), is a noteworthy characteristic of the diet of the Finnish infants. There has been
a huge, about a fivefold, increase in their consumption between 1985 and 1998 (Viinisalo 2005).
Unmodified cow’s milk is known to be unsuitable for infants until 12 months of age, because they
will receive little iron, linoleic acid, and vitamin E and have excessive intakes of sodium,
potassium, and protein from cow’s milk (e.g. Hasunen et al. 2004). However, in the Euro-Growth
Study (Freeman et al. 2000) many children were exclusively fed cow’s milk from the age of 2
months at the earliest. At the ages of 6 and 9 months, 9% and 18% of infants, respectively, were
given only cow’s milk to drink. Quite similar percentages were found in the Glasgow longitudinal
infant growth study (Savage et al. 1998). Median introduction of cow’s milk was as early as 8
months in a recently published Lithuanian study (Vingraite et el. 2004). Nonetheless, there has been
a major improvement in Europe regarding the use of unmodified cow’s milk for infants. Feeding
cow’s milk earlier than recommended is most likely among women with low education, low income
and high parity (North et al. 2000, Vingraite et al. 2004).
Clinically significant nutritional problems are unusual in healthy infants and toddlers, particularly if
growth is normal (Aldous 1999). Inadequate energy and protein intake and deficiencies of iron,
zinc, vitamin A, and vitamin D are the most commonly observed nutrient deficiencies occurring
during infancy (reviewed by Hendricks & Badruddin 1992). A relatively high fat intake should
continue throughout infancy to ensure adequate energy intake to provide substrates for central
nervous system growth. Structural lipid comprises 60% of the human brain, and docosahexaenoic
acid and arachidonic acid are major lipid components (Martinez 1992). Breast milk provides the
nutrients required for rapid development of the immature brain (Jensen 1999). If infants are
exclusively breastfed beyond 6 months, they are at increasing risk of developing iron deficiency
anaemia (Krebs 2000). Iron concentrations in human milk are low (0.2 – 0.4 mg/l), but an efficient
bioavailability partly compensates for its low concentrations. Accordingly, several studies show that

42
increased meat intake by half of one year old breastfed infants would adequately support both iron
as well as zinc requirements (reviewed by Krebs 2000). Due to poor exposure to sunlight, Finnish
infants need to receive D vitamin supplements until the age of three years (Hasunen et al. 2004).
2.4.3 Impact of weaning on infant’s growth
There are many factors determining the achievement of the genetically determined growth potential
of normal infants and children, one of the most important factors is the availability of adequate
amounts of energy and nutrients. Anthropometric indices are commonly used as the principal
criteria for assessing the adequacy of nutrition in early childhood. The pattern of growth seems to
differ depending on the feeding method in infancy in the developed countries (Dewey et al. 1995,
Michaelsen 1997, Dewey 1998, Rogers et al. 1997b, Haschke et al. 2000, Kramer et al. 2004). The
most typical pattern is for exclusively breastfed infants to grow rapidly during the first 2 to 3
months. After that time, they become lighter than formula-fed infants and have markedly lower
adiposity. There is some evidence of a slightly lower rate of linear growth over the first year of life,
but any differences in weight and height do not persist beyond this point, but show a relative
deceleration thereafter. However, a meta-analysis based on nine studies from developing countries
and 11 from developed countries (all observational studies, except for two controlled trials from
Honduras) found no evidence that infants who continue to be exclusively breastfed for 6 months
exhibited deficits in weight or length gain from 3 to 7 months and thereafter (Kramer & Kakuma
2002; 2004). Data from a large (n = 17 046) cluster-randomized trial in the Republic of Belarus by
Kramer and colleagues (2002) came to a similar conclusion. To assess the potential of bias
(including confounding, reverse causality, and selection bias) in observational studies of
breastfeeding, the same data was also analyzed as if conducting an observational study. The
observational analysis produced similar growth patterns as found in other observational studies. It
was concluded that the findings reflect either some unmeasured confounding differences or a true
biological effect of formula feeding. Based on the evidence for different growth patterns, WHO is
currently developing a new international growth reference based on infants who follow WHO

43
recommendations (WHO 2000, WHO 2002). It has been questioned whether the first
complementary foods should be different in the two groups; complementary foods of breastfed
infants should contain greater amounts of certain nutrients (such as iron and zinc), which formula-
fed infants receive from infant formula (Wharton 2000).
2.5 Social inequalities in maternal and infant health
Social class differences in diet and health are seen in all ages including pregnancy and infancy. Risk
factors including lack of breastfeeding, smoking, physical inactivity, obesity and unhealthy diet are
clustered in the lower socioeconomic groups (e.g. Dubois & Girard 2003). The diet of lower
socioeconomic groups provides cheap energy from foods such as high fat meat and milk products,
butter, sugars, preserves, and potatoes, but is low in fruit, vegetables, low-fat milk, and soft
vegetable margarines (Laitinen et al. 1995, Roos et al. 1996, James et al. 1997, Groth et al. 2001,
Hulshof et al. 2003, Lopez-Azpiazu et al. 2003). However, cheap foods could differ between
countries, and the impact of price on consumption most likely changes with time and between
cultures. Higher socioeconomic groups do not necessarily follow current national dietary guidelines
any better than lower socioeconomic groups (Roos et al. 1996). Education seems to be the most
important social variable to account for social differences in dietary habits.
Social inequality in perinatal health outcomes (5 indicators including number of preterm births,
mean birthweight, numbers of low birthweight and small for gestational age children, and perinatal
deaths) exist in Finland, but does seem to have diminished in the 1990s (Gissler et al. 2003). The
data based on the Finnish Medical Birth Register detected socioeconomic differences in all perinatal
health indicators. Maternal smoking explained up to half of the excess risk for adverse perinatal
outcome in the lowest socioeconomic group. In the study of Forssas et al. (1999), the Medical Birth
Register based data on all newborns in Finland born between 1991 and 1993 found eight maternal
characteristics increasing the risks for perinatal death: in-vitro fertilization, earlier stillbirth, higher

44
maternal age, maternal diabetes, lower socioeconomic status, smoking during pregnancy, being
single mother, and first birth.
Social factors determining the initiation and length of breastfeeding are often studied separately. In
the industrialised countries, young and less well educated mothers are less likely to breast feed than
other mothers (Michaelsen 1997, Rogers et al. 1997a, Riva et al. 1999; Scott et al. 1999, Tepora et
al. 1999, North et al. 2000, Dennis 2002, Dubois & Girard 2003, Lande et al. 2003, Vingraite et al.
2004). The impact of family size is not consistent (Yngve & Sjöström, 2001b, Lande et al. 2003).
Male infants are more likely to be weaned earlier than females (Pande et al. 1997, Scott 1999, Scott
et al. 1999, Lande et al. 2003), and also noted in Finnish surveys (Sihvola 2001, Hasunen 2002).
Having a first baby and single marital status of the mother are other important negative
determinants of breastfeeding (Rogers et al. 1997a, Yngve & Sjöström, 2001b). Maternal
employment outside of the home is a risk factor for initiation and shorter duration of breastfeeding
(Dennis 2002).
Studies on social class differences in childhood health are controversial partly because of different
methods of collecting data, limited sample sizes and the use of limited numbers of health indicators.
Children of well-educated and older mothers came closer to meeting the recommended intakes for
most of the critical nutrients and maternal age and educational level seem to influence the food
habits of children (Savage et al. 1998, North et al. 2000, Dubois & Girard 2003, Fewtrell et al.
2003, Lande et al. 2003, Navia et al. 2003, Vingraite et al. 2004).
Some gender differences in infant feeding have been found in previous Finnish studies. The energy
adjusted nutrient intake of one- to two-year-old boys and girls, calculated by means of 3-day food
records, differed from each other with regard to vitamin A, iron and copper (higher for boys), and
lactose and selenium (higher for girls), (Räsänen & Ylönen 1992). Overall, the boys had a greater

45
food consumption and, thus, higher energy intake than the girls. The impact of the intervention was
slightly stronger on the diet of the boys compared to the girls in the Finnish STRIP Study (Simell et
al. 2000). Girls had higher odds of having a timely introduction to complementary foods compared
with boys in a Norwegian study, but the opposite trend was found for the odds of vitamin D
supplementation (Lande et al. 2003). A tendency towards stronger effects of infant gender was
found in the lowest educational group compared with those in the highest educational groups.
The presence of older siblings is thought to affect the introduction of some foods. The use of fruit
juices was significantly associated with the presence of older siblings among 1000 infants in the
Avon Longitudinal Study of Pregnancy and Childhood (ALSPAC) (North et al. 2000). Also the
feeding of cow’s milk as a main drink at 8 months was most likely to occur in the group of mothers
with two or more children. The study of 2103 children in the Longitudinal Study of Child
Development in Québec (LSCDQ 1998-2002) noted that adherence to the different
recommendations was interrelated, pointing to an accumulation of adverse nutritional circumstances
in the children of families having low socio-economic status (Dubois & Girard 2003).
In a study on social class differences in health among the Finnish birth cohort 1987 (health
measured as mortality and morbidity in terms of a cumulative disease index, the cumulative
incidence of asthma, diabetes, epilepsy and intellectual disability, hospitalisations, disease-related
welfare benefits and special education), Gissler and colleagues (1998) found that the health of the
children in the lowest social class was the poorest. After adjusting for confounders, the children in
the lowest social class had the highest risk for poor health outcome both in the perinatal period and
in childhood, and had the most intellectual disabilities, the highest mean number of hospitalisation
days, and received most special education. Background variables, such as maternal age and social
class, explained the difference in mortality among the Finnish children followed up until the age of
46
7 years (Gissler et al. 2000). However, they did not explain the regional health differences found for
all health indicators except for diabetes.
2.6 Epidemiology of type 1 diabetes (T1D)
2.6.1 Autoimmune process and genetic susceptibility
T1D is viewed as a chronic immune-mediated disease with a subclinical prodrome characterized by
selective loss of insulin-producing -cells in the pancreatic islets in genetically susceptible persons
(Atkinson & Eisenbarth 2001, Knip 2002a). The appearance of T1D associated autoantibodies is the
first noticeable sign of -cell destruction, which is thought to be T-cell mediated. -cell
autoimmunity may be induced in any individual at any time, even prenatally in some individuals. In
the Finnish DIPP Study population, the first antibodies appeared already before the age of 3 months
(Kimpimäki et al. 2001b). This prediabetic period offers an opportunity to identify those individuals
who are likely to develop clinical T1D. Data from the Finnish DIPP Study also indicate that a
higher proportion of the population develop signs of -cell autoimmunity rather than clinical T1D.
The slight male predominance in the incidence of T1D among Caucasian children becomes more
obvious in those diagnosed after puberty (Karvonen et al. 2000). A similar male majority was
reported with signs of humoral -cell autoimmunity among first-degree relatives older than 10 years
of age (Williams et al. 2002).
There are four disease-related autoantibodies which have been shown to predict overt T1D (Knip
2002b): classic islet cell antibodies (ICA), insulin autoantibodies (IAA), autoantibodies to the 65-
kD isoform of glutamic acid decarboxylase (GADA), and autoantibodies to the protein tyrosine
phosphatase-related IA-2 molecule (IA-2A). T1D associated autoantibodies can fluctuate from
positivity to negativity, and may occur transiently. The number of detectable autoantibodies is
related to the risk of progression to clinical T1D. Positivity for single autoantibody specificity
represents in most cases harmless nonprogressive -cell autoimmunity. Positivity to three to four
antibodies is associated with a risk of developing clinical T1D in the range of 60 – 100% over the

47
next 5-10 years (Bingley et al. 1997, LaGasse et al. 2002, Barker et al. 2004, Hummel et al. 2004a).
T1D associated autoantibodies can be used as surrogate markers of clinical T1D in individuals with
increased genetic disease susceptibility (Kimpimäki et al. 2000).
A substantial part of the transnational variation in the incidence of T1D in Europe is explained by
variations between populations in the distribution of particular DQ genotypes which confer a high
risk of T1D in the general population (Ronningen et al. 2001). Nearly 20% of the Finnish
population have an increased HLA-conferred genetic predisposition to T1D, only 0.5% of those
actually developing the clinical disease (Ilonen et al. 1996). The genetic susceptibility to T1D can
be mostly found in the MCH complex on the short arm of chromosome 6. The T1D susceptibility
genes are localized near to or are identical to genes encoding class II HLA molecules (Redondo &
Eisenbarth 2002). In Caucasian populations, T1D is strongly associated with the serologically
defined HLA-DR3 and –DR4 antigens. There is evidence that DQ rather than DR alleles primarily
influence susceptibility to T1D. In the Finnish population, the alleles significantly associated with
susceptibility (DQB1*0302, 02) and protection (DQB1*0301, 0602, 0603) can be defined with only
four DQB1 specific oligonucleotide probes. Of Finnish subjects with T1D, 60-70% have a genotype
indicating high (DQB1*02/0302) or moderate (DQB1*0302 alone in the absence of protective
alleles) risk, whereas in the general population, the prevalence of these genotypes is only 14%
(Ilonen et al. 1996).
2.6.2 The role of environmental factors
The environment factors include all influences which alter and modify the status and relationship
between the living systems and the outside world. Large geographic differences, the globally
reported conspicuous increase in disease incidence (Green & Patterson 2001, Onkamo et al. 1999,
Gale 2002, Bingley & Gale 1989), and the relatively low concordance in monozygotic twins
(Barnett et al. 1981, Kaprio et al. 1992) are factors that favour a crucial role of environmental
factors in the etiology of T1D. There is a more than 350-fold worldwide difference in incidence

48
rates, within Europe these range during the period 1989–1994 from 3.2 cases per 100,000 person-
years in the Republic of Macedonia to more than 40 new cases per 100,000 person-years in Finland,
and in Finland the incidence has increased more than fourfold since the early 1950s (Karvonen et al.
2000, Green & Patterson 2001, Ronningen et al. 2001). Such a steep increase most likely reflects
changes in lifestyle and environment. However, a shift to younger age at diagnosis seems to explain
some of the increasing incidence of childhood T1D (Pundziute-Lycka et al. 2002).
Environmental factors are thought to act as the exogenous triggers inducing the immune-mediated
process leading to extensive -cell destruction and ultimately to the clinical manifestation of T1D
(Knip & Åkerblom 1998). Viruses and dietary factors have been considered as being major
environmental factors (Hyöty & Taylor 2002, Virtanen & Knip 2003). Among the viruses
associated with T1D, enteroviruses and rubella seem to be most implicated the role of other viruses
not being clear. Enterovirus infection accompanies or precedes the onset of T1D in many children.
The increase in maternal age at delivery over the past two decades could partly account for the
increase in the incidence of T1D. Several case-control/referent studies and one cohort study have
shown that children born to older mothers have an increased risk of T1D (Blom et al. 1989,
Dahlquist & Källén 1992, Patterson et al. 1994, Dahlquist et al. 1999, McKinney et al. 1997, Stene
et al. 2004), most of them indicate that the increased risk is limited to the offspring of mothers aged
more than 35 years at delivery. The intrauterine environment has been shown to be related to the
risk of T1D in terms of preeclampsia, excessive weight gain, amniocentesis, complicated delivery,
Caesarean section, higher birth order, and maternal-child blood group incompatibility (Patterson et
al. 1994, Wadsworth et al. 1997, Tai et al. 1998, Dahlquist et al. 1999, McKinney et al. 1999,
Elfving et al. 2003, Sipetic et al. 2004, Stene et al. 2004) but the findings are not consistent (see e.g.
Stene et al. 2003). Symptoms of maternal infections (mostly respiratory or gastrointestinal) in
pregnancy are believed to lower the risk of islet autoimmunity (Stene et al. 2004). The influences of
49
socio-economic status (Sipetic et al. 2004) and maternal smoking during pregnancy (e.g. Stene et al.
2004 vs. Dahlquist & Källén 1992) remain controversial. In contrast to some earlier findings on
parental education (e.g. Virtanen et al. 1998, Sipetic et al. 2004), in a recent Swedish prospective
population-based series of 4 400 one year old children, poor paternal education was associated with
T1D -related autoimmunity in the child, independent of any family history of diabetes (Sepa et al.
2005). The development of T1D has been linked to improved hygiene and to decreased or changed
exposure to infections. Decreased exposure to common infections during infancy (Gibbon et al.
1997, The EURODIAB Substudy 2 Study Group 2000, Sipetic et al. 2003) was associated to
increased risk of T1D, and day care attendance (The EURODIAB Substudy 2 Study Group 2000,
McKinney et al. 2000) with reduced risk, but again inconsistent findings have been reported as well
(Dahlquist et al. 1999, Hummel et al. 2000). The adoption of hygiene practices is influenced to
some degree by social, lifestyle, and environmental factors (Sherriff et al. 2002).
Psychoimmunology has being offered as one possible pathway (Hagglof et al. 1991, Soltesz et al.
1994, Thernlund et al. 1995, Sepa et al. 2002). Psychosocial stress in families may affect children
negatively since there may be a link between hormonal levels and nervous signals that in turn
influence both insulin sensitivity/insulin need and the immune system. In a recent Swedish
prospective population-based series of 4 400 children aged 1 year, high parenting stress,
experiences of a serious life event, foreign origin of the mother and low paternal education were
associated with T1D -related autoimmunity in the child, independent of family history of T1D
(Sepa et al. 2005). However, psychosocial stress is a risk factor for a variety of health problems
beginning with preterm birth and low birth weight (Hobel & Culhane 2003) and may be established
in a form for which the individual has genetically or environmentally highest susceptibility.

50
2.6.3 Dietary factors in the development of T1D
Current knowledge on potential nutritional factors in the etiology of T1D has relied greatly on
animal studies and ecologic comparisons (Åkerblom & Knip 1998, Virtanen & Knip 2003). Among
the first concepts for possible dietary causes in humans was the work of Baum et al. (1975) in
which it was observed that children who later developed T1D had an accelerated weight gain during
infancy compared with control children. Since that first finding, the following nutritional factors
have been linked to the development of T1D: breastfeeding, nicotinamide, zinc, and vitamin C, D,
and E as possible protective factors, and N-nitroso compounds, cow’s milk, increased linear growth,
and obesity as possibly increasing the risk. One major shortcoming of the most studies conducted so
far is that only single dietary exposures have been assessed at single time points (Virtanen & Knip
2003). Putative nutritional and other confounding factors have received little attention as have the
limitations of the dietary methods used. Given its relatively low prevalence and the fact that the
disease is most likely multifactorial, knowledge about the long-term diet is crucial if one wishes to
examine diet-based contributions to T1D. Several studies suggest that intra-uterine factors may
cause β-cell destruction already during the fetal period (e.g. Lindberg et al. 1999, Elfving et al.
2003). The mechanisms of action of the different nutritional constituents that may play a role in the
development of β -cell autoimmunity are largely unknown and they may differ according to life
stage (Virtanen & Knip 2003).
N-nitroso compounds
Nitrate is a naturally occurring compound in vegetables; more than 90% of dietary nitrate is derived
from vegetables, including potatoes (Dich et al. 1996). Nitrate and nitrite are both used as food
additives, and they are also found in soil and water due to the use of fertilizers (WHO 1998). Nitrate
is reduced in the gut to nitrite, which can further be transformed to the N-nitroso compounds
(Slorach 1981). The dietary antioxidants may inhibit and thiocyanate ions can accelerate the
formation of N-nitroso compounds (Leaf et al. 1989). The main sources of nitrite in the Finnish diet

51
are sausages and cold-cut meat products (Dich et al. 1996, Salminen & Penttilä 1999). Nitrite intake
by children in the age group 13 months to 5 years who ate these food items frequently exceeded the
ADI-value in the survey of National Food Administration (Salminen & Penttilä 1999).
One of the most interesting early finding in the research in humans on the etiology of T1D came
from an Icelandic ecological observation published in the early 1980s (Helgason & Jonasson 1981).
A prenatally acting seasonal factor, the N-nitroso-compound content of processed mutton
traditionally consumed in Iceland around Christmas time lead to a preponderance of T1D in boys
born in October. The association between N-nitroso compounds and nitrite, and T1D have been
confirmed later in animal experiments, ecological comparisons, and case-control studies in humans
(reviewed by Åkerblom & Knip 1998, and Virtanen & Knip 2003). Mother’s intake of nitrite at the
time of pregnancy is positively related to the risk of T1D (Virtanen et al. 1994).
Energy, birth weight and height and growth
Both maternal malnutrition and overnutrition are associated with subsequent T1D in the offspring
(Jovanovic 2004). Surveys on the impact of birth weight and length on the risk of T1D remain
controversial. Low birth weight and short birth length were related to a decreased risk of T1D in a
pooled case-control analysis from seven different European centres (Dahlquist et al. 1999), but
many case-control settings have reported similar birth size indicators in cases and control infants
(reviewed by Virtanen & Knip 2003).
Increased early growth has been associated with increased disease risk in various European
populations (Johansson et al. 1994, Hyppönen et al. 1999, Bruining 2000, Hyppönen et al. 2000,
EURODIAB Substudy 2 Study Group 2002). The role of infant feeding in this association, if any,
remains unclear. Greater weight gain related to greater intake of energy has been observed in
formula-fed babies compared with breastfed infants from 3 months of age (Heinig et al. 1993). A

52
high frequency of intake of complementary foods rich in carbohydrates was a risk factor in 0 – 4
year old children developing T1D in a Swedish case-control study (Dahlquist et al. 1990). It could
be concluded that the growth pattern possibly increasing the risk for T1D is the combination of
relatively low birth weight and subsequent rapid growth during childhood.
Cow’s milk and breastfeeding
Cow’s milk represents the first foreign protein source to which the overwhelming majority of infants
are exposed. In comparison to breast milk, the protein concentration of cow’s milk is higher mostly
due to its greater casein content (Martin et al. 1991). The main whey protein component is -
lactoglobulin which is not an endogenous component of human milk. This evokes the highest rate of
positive oral challenges (Hughes 1998). Experiments in animals have demonstrated the deleterious
effect of cow’s milk proteins on pancreatic -cells (reviewed by Åkerblom & Knip 1998). Elimination
of intact cow milk proteins from the diet has significantly reduced the incidence of T1D in the
spontaneously diabetic BioBreeding (BB) rat, with the elimination being most effective when it
occurs during the pre-weaning period (Martin et al. 1991). Ecologic findings on higher per capita
consumption of cow’s milk in countries with high T1D incidence support the hypotheses linking T1D
to exposure to cow’s milk, but none of the findings is based on cow’s milk consumption by infants
(Scott 1990, Dahl-Jørgensen et al. 1991, Muntoni et al. 2000, Patterson et al. 2001).
The first case-control data postulating that insufficient breastfeeding of genetically susceptible
newborn infants may lead to -cell infection and T1D later in life was published in 1984 (Borch-
Johnsen et al. 1984). The Finnish case-control study of Virtanen et al. (1991) was the first human
study to suggest a relationship between an early introduction of complementary cow’s milk feeding
and an increased risk of T1D, independently of the duration of breastfeeding. The importance of
early exposure to cow’s milk and a short duration of breastfeeding as nutritional risk determinants
of T1D have further been studied in numerous case-control settings (reviewed by Åkerblom & Knip

53
1998, and Virtanen & Knip 2003), which have been the basis for two meta-analyses. Despite the
rather similar odds ratios in the meta-analyses based on 13 (Gerstein 1994) and 17 case-control
studies (Norris & Scott 1996), the conclusions were different. Gerstein concluded that early cow’s
milk exposure may be an important determinant of subsequent T1D and may increase the risk by
approximately 1.5 times, while Norris and Scott summarized that the weak association between
infant diet and risk of T1D may be attributable to methodological sources. Norris and Scott (1996)
claimed that differences in the participation rates of cases and controls as well as long-term
maternal recall may have biased the results of the analysed studies.
The putative effect of infant feeding on the development of T1D associated autoantibodies has been
studied in four birth cohort series: the German (Hummel et al. 2000, Ziegler et al. 2003) and the
Australian BABYDIAB (Couper et al. 1999) studies, the North-American DAISY Study in
Colorado (Norris et al. 1996), and the Finnish DIPP Study (Kimpimäki et al. 2001a). The
preliminary findings of these studies detected no association of breastfeeding or age at introduction
of complementary milk feeding with emergence of up to 3 autoantibodies. However, the statistical
power in all of these studies was low due to the small number of seroconverters. In the Finnish
DIPP Study (Kupila et al. 2001), which was the only one evaluating the positivity for IA-2A or all
four autoantibodies at the same time, short-duration exclusive breastfeeding and the early
introduction of supplementary milk feeding were related to an increased risk of both of these
outcomes (Kimpimäki et al. 2001a). The findings from the pilot study of the Trial to Reduce IDDM
in the Genetically at Risk (TRIGR) suggest that the emergence of T1D associated autoantibodies
can be prevented or delayed by avoidance of cow’s milk proteins over the first 6 or 8 months of life
(Åkerblom et al. 2005). This breakthrough evidence in humans of the possibility to manipulate
spontaneous beta cell autoimmunity by dietary intervention in infancy was, despite the limited
power of the study, the basis for the larger well-powered TRIGR -study. The current international

54
TRIGR -study is one of the largest pediatric trials in the world involving 40 study centres in North
America, Europe and Australia (http://www.trigr.org).
Several studies suggest that patients with T1D have an enhanced humoral and cellular immunity to
a series of dietary proteins as reviewed by Åkerblom & Knip (1998). High levels of antibodies to
cow’s milk proteins have been associated with increased risk of T1D independently of early
formula feeding (e.g. Savilahti et al. 1993, Saukkonen et al. 1994). It is believed that a high titre of
cow’s milk antibodies is an epiphenomenon of an insult and immunization caused by cow’s milk
proteins, which in some genetically susceptible individuals may lead to T1D after a long but
variable time interval.
Vaarala et al. (1998) proposed an interesting hypothesis that the bovine insulin present in cow’s
milk may immunize formula-fed infants. This hypothesis was based on the observation that induced
antibodies that cross-reacted with human insulin were at significantly lower titres among breastfed
and hydrolyzed formula-fed infants compared to babies fed ordinary formula.
Cereals
Wheat gluten and some other plant proteins have shown to be diabetogenic in animal models (e.g.
Scott et al. 1997, Nikulina et al. 2004). The only slightly elevated T cell responses to gluten in
newly diagnosed children did not support a major role of gluten in the pathogenesis of human T1D
(Klemetti et al. 1998). In an ecologic analysis of Muntoni et al. (2000) per capita consumption of
cereals was an inverse predictor of elevated T1D incidence. Based on the findings in two birth-
cohort studies, there may be a window of exposure to cereals in infancy outside of which initial
exposure increases islet autoimmunity risk in susceptible children (Norris et al. 2003, Ziegler et al.
2003). In the US DAISY birth cohort study (Norris et al. 2003), it was found that children initially
exposed to cereals (wheat, rye, barley, oats, or rice) between ages 0 and 3 months and those who
55
were exposed at 7 months or older exhibited an increased hazard of islet autoimmunity compared
with those who were exposed during the fourth through sixth months. Similarly, in the German
BABYDIAB cohort (Ziegler et al. 2003), food supplementation with gluten-containing foods before
the age of 3 months was associated with a significantly increased islet autoantibody risk. Children
receiving gluten foods first at the age of 6 months did not suffer an increased risk for elevated islet
autoantibodies.
Vitamins and minerals
Evidence from animal experiments and human observational studies suggests that some dietary
micronutrients, most promisingly vitamin D, may be able to protect against the development of T1D
(reviewed by Hyppönen 2004). Only the possible beneficial role of vitamin D has been studied in
both case-control and cohort settings. A European multicentre trial consistently showed a protective
effect of vitamin D supplementation in infancy (The EURODIAB Substudy 2 Study Group1999),
whereas contradictory results were found in a small Norwegian case-control study (Stene et al.
2000). However, in the latter study, cod liver oil taken during pregnancy was associated with
reduced risk of T1D. Recommended vitamin D supplementation was observed to be associated with
a reduction in the risk of T1D in the North Finland Mother-Child cohort (Hyppönen et al. 2001), but
the number of incident cases was quite small (<10). Nevertheless, the risk of T1D by age of 31
years was remarkably reduced (>80%) if vitamin D supplementation during the first year was
regular in comparison to no supplementation, and a further 80% risk reduction was seen if the given
dose had been at least on the level of the contemporary recommendation of 50 g per day (5 times
the current recommendation). In the US birth cohort study (DAISY), maternal intake of vitamin D
from food was significantly associated with a decreased risk of islet autoimmunity appearance,
whereas vitamin D intake from supplements, as well as intakes of omega-3, and omega-6 fatty acids
from food during pregnancy were not associated with appearance of IAA in the offspring after an
average of 4 years’ follow-up (Fronczak et al. 2003). The difference in the mean daily vitamin D

56
intake from food between an affected (n=16) and an unaffected (n= 206) group was 2.1 g (4.2 vs.
6.3 g, respectively).
Beneficial effects of nicotinamide and vitamin E in diabetes development remain hypothetical
(Hyppönen 2004). Despite plausible theoretical background evidence from animal experiments and
supportive data from pilot studies, randomized, controlled trials using nicotinamide have not
provided any evidence for any beneficial effects (reviewed by Hyppönen 2004). The possible
beneficial effects of vitamin E are based on its action as an antioxidant. In addition to several
animal experiments, the hypothesis of a protective effect of vitamin E against development of T1D
was supported by the human findings of Knekt and colleagues (1999). A nested case-control study
within a 21-year follow-up indicated that the serum alpha-tocopherol concentration at the baseline
examination was inversely associated with clinical T1D occurring 4-14 years later. However, a
major role for vitamin E in the development of T1D remains unlikely.

57
3. Aims of the present study
The purpose of this thesis was to evaluate diet during pregnancy and infancy and to assess the
relation between the early dietary exposures to the development of cow’s milk antibodies and T1D
associated autoantibodies in a cohort of Finnish infants with increased genetic susceptibility to T1D.
The specific objectives of this thesis were as follows:
1. to evaluate the validity and reproducibility of a self-administered food frequency questionnaire
developed to measure food consumption and nutrient intake during pregnancy (I),
2. to evaluate diet and nutrient intake of Finnish pregnant women (I, II),
3. to assess whether the maternal consumption of milk and milk products can affect the
development of cow’s milk antibodies in infants (III),
4. to investigate infant feeding patterns; the length of breast feeding and the age of introduction of
complementary foods, during the first two years (III, IV, V), and to study their effects on the
development of -cell autoimmunity (V).

58
4. Subjects and methods
4.1 Subjects and study design (Table 4)
Research questions of the present doctoral thesis are addressed in three different populations:
pregnant women taking part in a validation study in the city of Oulu (I, II), newborn infants
belonging to the intervention group of Trial to Reduce Insulin dependent diabetes mellitus in the
Genetically at Risk (TRIGR) study, (III), and a cohort of infants in Diabetes Prediction and
Prevention (DIPP) Nutrition study (IV, V), (Table 4).
Table 4. Subjects and study design (1, 2)
Paper Design Subjects N Dietary methods
Immunological variables
I Methodological survey among random population
Pregnant women in their third trimester
Validation study n = 113,
Reproducibility study n = 111
2 x 5-day food records, FFQ
2 x FFQ
-
II Population-based random survey
Pregnant women in their third trimester
118 2 x 5-day food records
-
III Randomized
double-blind pilot trial (TRIGR)
Genetically susceptible children having first-degree relative/s affected by T1D and randomized to receive hydrolyzed infant formula
97 Mothers: FFQ during pregnancy and lactation Children: 2-day food record (6 mo), 3-day food records (12, 24 mo)
IgA and IgG antibodies to cow’s milk formula,
-lactoglobulin, bovine serum albumin, and -casein
IV Population-based prospective birth cohort study (DIPP Nutrition)
Genetically susceptible children
429 follow-up record of introducing new foods (0-24 mo)
-
V Population-based prospective birth cohort study (DIPP Nutrition)
Genetically susceptible children
3565 follow-up record of introducing new foods (0-24 mo) and structured dietary questionnaire (3,6,12,24 mo)
T1D associated autoantibodies: ICA, IAA, GADA, and IA-2A
(1 All of the parents have given their written informed consent, and the ethical committees of all participating hospitals have approved the study protocols. (2 FFQ = food frequency questionnaire, TRIGR = Trial to Reduce Insulin dependent diabetes mellitus in the Genetically at Risk -study, DIPP = Type 1 Diabetes Prediction and Prevention –study, IgA = immunoglobulin A, IgG = immunoglobulin G, ICA = classic islet cell antibodies, IAA = insulin autoantibodies, GADA = Autoantibodies to the 65-kD isoform of glutamic acid decarboxylase,IA-2A = Autoantibodies to the protein tyrosine phosphatase-related IA-2 molecule, and T1D = type 1 diabetes
59
4.1.1 Validation study (I and II)
All of the pregnant women in their third trimester from 13 maternity clinics in the city of Oulu
between the August 1995 and the April 1996 were invited to participate in either the reproducibility
or the validation study. Of the 123 women invited to take part in the reproducibility study, five
women refused to participate, five women did not return both of the questionnaires, and two were
excluded because of poorly completed questionnaires. Of the 141 women invited to participate in the
validation study, 11 women refused to take part, 14 did not return all questionnaires and/or food
records, and three were excluded because of incomplete food records. Therefore, the final sample for
the reproducibility study (I) comprised 111 women (90% of those invited) while there were 113 in
the validation study (I) (80% of those invited). The research questions in study II were assessed in the
framework of the validation study. The final series comprised 118 (83% of those invited) women
having complete dietary records (11 refused to take part and 12 did not return both food records).
4.1.2 Trial to Reduce Insulin dependent diabetes mellitus in the Genetically at Risk (TRIGR) study (III)
The families of 521 newborn infants having at least one member (mother, father or sibling) affected
by T1D were invited by letter to participate in the TRIGR pilot trial between April 1995 and
November 1997 from 16 hospitals in Finland (Åkerblom et al. 2005). Altogether 471 (90% of those
invited) were screened, and 234 (45% of those invited) were identified as having HLA-DQB1
genotype [DQB1*02/*0302, *0302/x (x ≠ *02, *0301 or *0602,*0603) or 02/y (y ≠ 0302, *0301,
or *0602/*0603)], conferring increased risk for T1D. The families of these infants were asked to
continue in the intervention study. Immediately after birth, the infants were randomized to receive,
after exclusive breastfeeding in a doubled-blinded manner, either the extensively hydrolysed
casein-based formula (Nutramigen®, Mead Johnson, Evansville, IN, USA) or a whey-adapted
cow’s milk based formula (Mead Johnson) as the first milk product introduced into the infant’s
diet. The dietary intervention lasted at least until the infant reached the age of 6 months or at most

60
until the age of 8 months, in those cases where the child had not received the formula for at least 2
months by the age of 6 months.
The subjects in study III belong to the intervention group (hydrolysed infant formula) of the TRIGR
pilot trial. The final number of 97 infants (87% of those randomized to the intervention arm)
comprised those for whom data of nutrition and cow’s milk antibodies on at least one occasion were
available.
4.1.3 The Type 1 Diabetes Prediction and Prevention (DIPP) Nutrition Study (IV and V)
The research questions in studies IV and V were assessed in the cohort of Diabetes Prediction and
Prevention (DIPP) Study, which is a multidisciplinary prospective population-based prevention
study (Kupila et al. 2001). All the newborn infants from the
catchment areas of three university hospitals: Turku, Oulu, and
Tampere, in Finland are screened for genetic susceptibility for T1D
from cord blood samples. All parents of these children have given
their written informed consent for genetic screening. The high-risk
children (HLA-DQB1*0302/02 heterozygous and those positive to
DQB1*0302/x; x stands for homozygosity or neutral alleles) are
followed for diet, growth, viral infections, and T1D associated autoantibodies (ICA, IAA,
antibodies to GAD65 and IA-2) at 3 to 12 months intervals. The families are offered the possibility
to take part in a randomised double-blinded intervention trial with intra-nasal insulin when their
child tests repeatedly positive for at least two autoantibodies.
The DIPP Nutrition study was performed in the framework of the DIPP
Study. It was started on the 2nd of September, 1996 in Oulu, and on the
20th of October, 1997 in Tampere. The catchment area of the University
Hospital of Oulu includes 42 municipalities and that of Tampere 34

61
municipalities. The subjects in the study IV comprise 429 infants (64% of those invited) who were
recruited in the follow-up between September 1996 and December 1997, and who completed the
“age at introduction of new foods” -form by the age of 2 years. The series in study V comprises the
children born at the latest on the 30th of June, 2001 in Oulu and Tampere University Hospitals. The
data were available from 3565 children (81% of the children invited), of whom 93.5% were
followed up to 6 months, 81.9% up to 1 year, and 68.3% up to 2 years of age.
4.2 Dietary methods, (Table 4)
4.2.1 Food records (I, II, III)
In studies I and II (validation study), the data of diet were collected by means of two 5-day food
records comprising 4 week days and one weekend day. The first record was kept during 29-32 weeks
and the second one during 33-36 weeks of gestation. The time interval between the two records had to
be at least one week. Everything consumed (including vitamin and mineral supplements) during the
recording period was instructed to be recorded, this being facilitated by provision of a booklet with
126 portion pictures of common food items and mixed dishes (Haapa et al. 1985).
In study III, the diet of the offspring was assessed by means of a 2-day food record at the age of 6
months and by a 3-day food record at the ages of 1 and 2 years. The additional data about possible
deviations from the advised diet and age at introduction of new foods were also inquired. Personal
and written instructions on the record keeping were given in advance in all studies (I, II and III),
and the records were checked by a nutritionist after each recording period.
4.2.2 Food frequency questionnaire, FFQ (I and III)
The FFQ of 276 food items originally developed for measuring the dietary intake of 29,000 healthy
middle-aged Finnish men participating in the Alpha-Tocopherol Beta-Carotene Cancer Prevention
Study (Pietinen et al. 1988a; 1988b), and further modified to contain 110 food items for studying
the diet of Finnish women participating in the Kuopio Breast Cancer Study (Männistö et al. 1996)

62
was used as the basis for the FFQ which was evaluated and used in studies I and III. Our FFQ was
specifically designed to reflect the diet of Finnish women by using the information of the food
consumption of women in childbearing age in the Finrisk Study (Kleemola et al. 1994). The
‘recipe’ behind each food-item was weighted by the frequencies of consumption in the food group
considered (e.g., the recipe for breakfast cereals consists of rice crispies 33%, corn flakes 23%,
cereals with added sugar 22%, and Weetabix 22%). Open frequency categories were used in
increasing order: less than once per month, how many times per month, week, or day. The serving
sizes were based on commonly used portions identified in earlier Finnish dietary studies (Leino
1984, Haapa et al. 1985) and for some foods, natural units (e.g. for eggs and beverages) were used.
The FFQ was designed to assess the whole diet over a period of 1 month aiming to rank individuals
according to their food consumption and nutrient intake. The FFQ comprised 181 food items and
mixed dishes, grouped under subheadings: “milk products“, “potato, rice and pasta as a side dish“,
“cereals“, “fat on bread/spreads“, “fruits and berries“, “vegetables“, “salad dressings“, “warm main
courses“, “fish and eggs“, “beverages“, and “desserts, sweets and snacks“. There were additional
empty lines for each food group for recording foods not listed in the FFQ. Moreover, questions
were asked about where the meals were usually taken (at home, in a cafeteria/restaurant), and the
type of fat used in food cooking, baking and salad dressings. In the further analysis, the women’s
personal choices for fat used in cooking were taken into account. Butter was used in cooking in all
recipes for those subjects who generally ate their meals at home and who used butter in cooking.
For other subjects, the recipe fat was determined to be butter, margarine, and oil in equal
proportions, assuming that people who eat lunch at work do not have detailed knowledge of the
type of fat used in cooking.
The participants in the reproducibility study (I) completed the FFQ twice, at an interval of 1 month,
at the beginning and at the end of the 8th month of pregnancy. The participants in the validation

63
study (I) completed the FFQ 1 month before the start of the maternity leave (at the beginning of the
8th month of pregnancy) and 1 month after delivery.
In study III, mothers completed the FFQ after delivery covering retrospectively the maternal diet
during the eighth month of pregnancy. If the mother was breastfeeding when the child was 3
months old, her diet during the preceding month was assessed using the FFQ. In the further analysis
the cow’s milk protein intake of the mother was grouped according to the type of processing into
three groups: “Raw milk products” (regular milk, cream and ice cream), “Cheese” (all hard
cheeses), and “Sour milk products” (sour milk, cultured milk and yogurt). In both studies (I and III)
the completion of the FFQ was well guided in advance and returned FFQs were checked by a
nutritionist.
4.2.3 Follow-up record of introducing new foods (IV and V)
Information on infant feeding patterns in studies IV and V was collected with the “age at
introduction of new foods” form. During the first 2 years of life, parents were asked to mark down
on the dietary follow-up form the age of the infant when exclusive and total breastfeeding were
stopped and the age when the infant started to receive various complementary foods. The form
included the following food groups: fruit and berries; potato; carrot; spinach or beetroot; turnip or
swede; cabbages; lettuce; wheat; barley; oats; rye; maize, rice, millet or buckwheat; pork; beef;
chicken; other meats; sausage; fish; egg; sour milk products; foods containing cow’s milk; cow’s
milk or ice cream; and soy products. A blank entry for food items was taken to indicate that such
foods were not consumed before the age of 2 years or before the time when the family dropped out
of the study. The dietary form was completed at home and it was checked at every visit and the
information was transferred to the dietary form when the family visited the clinic.
In study IV, the following food groups were used in the analysis of food consumption: fruit and berries;
root vegetables (potato and carrot); vegetables high in nitrate (spinach, beetroot, swede and turnip);

64
gluten-containing cereals (wheat, barley, rye, oat); other cereals (rice, maize, buckwheat, millet); meat
and meat products; sausage; fish and fish products; egg; and dairy products. Accordingly, dietary
variables were constructed of the age when the first complementary food was given.
In the analysis of study V, the following food groupings were used: 1) fruit and berries; 2) root
vegetables: potato, carrot, turnip, swede; 3) wheat, barley, rye and oats; 4) other cereals: maize, rice,
millet or buckwheat; 5) cabbages (cauliflower, broccoli, kale, and Chinese, red and turnip cabbage);
6) milk products (cow’s milk based infant formulas, sour milk products, milk, other milk products,
foods containing milk); 7) cow’s milk based infant formulas (excluding hydrolyzed and soy
formulas); 8) fish; 9) meat (pork, beef, chicken, other meat); and 10) sausage. In addition, wheat,
rye, barley and oats were each analyzed separately.
4.2.4 Structured dietary questionnaire (V)
Age specific (3, 6, 12, and 24 month) questionnaires were used to obtain information on infant
feeding in study V. In the 3-month dietary questionnaire, the feeding at the delivery hospital was
assessed in detail: whether the child was breastfed, had received banked breast milk, was exposed to
infant formula and if so to which formula, and which of these was/were the main type of feeding
during the delivery hospital stay. The duration of breastfeeding and the age at introduction and
brand names of all infant formulas which the child had received as well as the age at introduction of
other cow’s milk and sour milk products (such as yoghurt, ice cream) and foods and drinks
containing cow’s milk were inquired for in all questionnaires. The brand name of the infant formula
was recorded and the formulas were later classified as regular cow’s milk based, special
(hydrolyzed) or soy based. At each time point all the food items the infant had so far received were
carefully recorded in the questionnaire.

65
4.2.5 Breastfeeding
In all studies exclusive breastfeeding was defined as the period during which the child received, in
addition to breast milk, only water and/or vitamin/mineral supplements (mainly vitamin D starting 2
weeks after delivery). Neither infant formula nor other complementary foods were allowed. In study
V, also the information on feeding in the maternity hospital could be taken into account when
grouping infants according to the type of breastfeeding. Total breastfeeding was defined as the
period during which the child received breast milk.
4.2.6 Converting food records and questionnaires to food and nutrient intakes, (Figure 1)
The food consumption data were analyzed using a software program developed at the National
Public Health Institute (2005). For food consumption and nutrient intake (studies I – III), an
estimate of an average daily intake was calculated by means of food records. Accordingly, the data
on nutrient intake was analyzed as by food groups. A software program linking the food frequency
data with the nutrient software program was developed in the National Public Health Institute (I and
III). The program can accommodate each woman’s personal fat choices (in cooking, baking and
salad dressings) which were inquired in the questionnaire. FFQ-data was converted into a food
record –type of data, which present an average values per day. To calculate the intakes of selected
nutrients from dietary supplements (II) an Excel database was constructed for the present study
based on information from the National Food Administration, the National Public Health Institute,
and manufacturers. Nutrient intake from supplements was as well calculated as an average daily
intake (a sum of nutrient divided by the number of recording days).

Stu
dy:
I, I
II
I, II,
III
IV, V
VP
opul
atio
n:
Mot
hers
Mot
hers
I, II
; Inf
ants
III
Infa
nts
Infa
nts
Con
verti
ng fo
od re
cord
s an
d qu
estio
nnai
res
to fo
od a
nd n
utrie
nt in
take
s
Storing and convertion
Calculation programs and databases
Dietary variables
Data from families
FFQ
FOO
D
RE
CO
RD
S
1. S
torin
g2.
Con
verti
ng F
FQ -
data
to fo
od re
cord
-ty
pe o
f dat
a
IN-H
OU
SE
SO
FTW
ARE:
sto
ring
and
calc
ulat
ion
of
food
reco
rd -t
ype
of d
ata
Fine
li fo
odco
mpo
sitio
n da
taba
se
Sup
plem
ent
com
posi
tion
data
base
DIE
TAR
Y
QU
ES
TIO
NN
AIR
E
FOLL
OW
-UP
RE
CO
RD
Dai
ly in
take
of f
oods
Dai
ly in
take
of n
utrie
nts
Inta
ke o
f nut
rient
s by
food
gro
ups
Exc
el b
ased
pro
gram
to
calc
ulat
e nu
trien
t int
ake
from
sup
plem
ents
(II)
Exce
l bas
ed p
rogr
am to
st
ore
data
1. S
torin
g in
asc
ii fo
rmat
2. C
over
ting
to d
atas
et
Nut
rient
inta
ke fr
om
supp
lem
ents
Age
at i
ntro
duct
ion
of
com
plem
enta
ry fo
ods
Leng
th o
f bre
astfe
edin
g
Feed
ing
at d
eliv
ery
hosp
ital
Leng
th o
f bre
astfe
edin
gE
xpos
ure
to in
fant
form
ulas
Intro
duct
ion
of fo
ods
and
drin
ksU
se o
f vita
min
D s
uppl
emen
tsS
ourc
e an
d ty
pe o
f drin
ksS
peci
al d
iets
Figu
re 1
. Con
vert
ing
food
rec
ords
and
que
stio
nnai
res t
o fo
od a
nd n
utri
ent i
ntak
es, (
FFQ
= fo
od fr
eque
ncy
ques
tionn
aire
)
66

67
The food composition database of the National Public Health Institute, called Fineli, (National
Public Health Institute 2005) is continuously updated and is the most comprehensive one in
Finland. The analytical nutrient values in the database are mostly based in Finnish studies. In
addition, complementary data is obtained from the Finnish food industry and international food
composition tables. The database currently includes over 3 000 individual food items and mixed
dishes, 284 nutrient factors, and more than 400 supplements. The system allows for the creation or
modification of specific recipes and personal recipes were used whenever possible. Standard recipes
in the database are based on the current Finnish cookery books. As part of the DIPP Nutrition
Study, the product information and nutrient content of infant formulas and baby foods have been
stored and are continuously updated into Fineli.
4.3 Sociodemographic and perinatal characteristics
From the structured questionnaire completed at 3 months after delivery, the following information
was obtained: parents' age, basic and vocational education, occupation, the number of siblings, the
type of day care, and the home province (I, II, IV, and V). Information on duration of gestation,
maternal weight development and smoking during pregnancy, mode of delivery, birth weight and
height was obtained from the Medical Birth Registries of the Oulu and Tampere University
Hospitals (II, IV, and V).
4.4 Genetic methods
HLA-DQB1 alleles in studies III, IV, and V were analyzed using a large-scale assay procedure that
was developed for rapid screening purposes. The method utilizes time-resolved fluorometry to
detect the hybridization of lanthanide-labeled allele-specific oligonucleotide probes with an
amplified gene product as earlier described (Ilonen et al. 1996). In brief, a part of the second exon
of the HLA-DQB1 gene was amplified using a primer pair with a biotinylated 3' primer. The
biotinylated PCR products were then transferred to streptavidin-coated microtitration plates,
denatured and hybridized with sequence-specific probes labeled with lanthanide chelates: europium

68
(Eu), terbium (Tb) or samarium (Sm). Two hybridization mixtures were used, one containing
probes hybridizing with DQB1*0602 and *0603, DQB1*0603 and *0604 and a consensus sequence
and the other containing probes specific to the DQB1*02, *0301 and *0302 alleles. After
appropriate incubations and washings, the specific hybridization products were detected using
three-color time-resolved fluorescence of the lanthanide chelates.
4.5 Immunological methods
Blood samples were obtained from the infants at birth (cord blood) and at the ages of 3, 6, 9, 12, 18,
and 24 months (III). The maternal blood samples were taken on an average 2 days after the
delivery. Antibodies of IgA and IgG isotypes to whole cow’s milk formula, beta-lactoglobulin
(BLG), bovine serum albumin (BSA), and alpha-casein (CAS) were measured using modifications
of the original enzyme-linked immunosorbent assay (ELISA) techniques as previously described
(Savilahti et al. 1993, Saukkonen et al. 1994, Vaarala et al. 1995). Microtitre plates (MaxiSorp®,
Nunc A/S, Roskilde, Denmark) were coated with one of the following antigens: adapted liquid
cow’s milk formula (Tutteli®, Valio Ltd, Helsinki, Finland); BLG (L-0130, Sigma
Pharmaceuticals, St. Louis, MO, USA); BSA (2 g/ml, grade V, Sigma), and CAS (C 6780, Sigma).
Wells were blocked either with 0.5% sheep serum (for anti-cow’s milk and BLG assays) or with 1%
gelatin in PBS pH 7.4 (for BSA and CAS assays). Serum samples were diluted in the blocking
buffers. Triplicate dilutions were used for dilutions of standard serum, duplicates for the assayed
sera. Alkaline-phosphatase-conjugated affinity purified rabbit F(ab’)2 anti-human IgG, IgA or IgM
antisera (Dako A/S, Glostrup, Denmark), and p-nitrophenyl-phosphate substrate, 1 mg/ml in TRIS
buffer, (Sigma Fast p-nitro phenyl Phosphate Tablest sets N-2770, Sigma) were added. The reaction
was followed and stopped when the absorbance of the highest standard was above 2 by addition of
100 l 1 M NaOH. The end point measure of OD405 nm was obtained in a semi-automatic
multiwell photometer (Titertek Multiscan®, Elflab Inc., Helsinki, Finland). The mean value of two
absorbancies for wells coated with blocking solution was subtracted from the mean value for the
two absorbancies in antigen-coated wells. Results were subjected to point-to-point analysis in a

69
computerized photometer using 2-fold serial dilutions of a high titer standard serum as reference.
The sample dilutions had to fall within the linear part of the standard curve, and antibody levels
were expressed as percentages of the standard. Antibody titers of IgA isotype in umbilical cord
blood were not included in the statistical analyses as IgA is not transported through the placenta to
the fetus during pregnancy and the titers detected in a few infants were considered to be due to
laboratory mistakes or contamination of the umbilical cord blood sample with maternal blood.
In the DIPP-Study (IV and V) ICA are used as the primary screening tool for -cell autoimmunity
in children with increased genetic risk of T1D (Kupila et al. 2001). Only children testing positive
for ICA were analyzed for IAA, GADA and IA-2A (all preceding and subsequent samples). ICA
were quantified by a standard indirect immunofluorescence method on sections of frozen human
pancreas from a blood group O donor (Bottazzo et al. 1974). The end-point dilution titer of positive
samples was recorded and the results expressed in Juvenile Diabetes Foundation (JDF) units. The
detection limit was 2.5 JDF units. All samples initially positive for ICA were retested to confirm
positivity. The sensitivity of the ICA assay in the used laboratory was 100% and the specificity 98%
in the most relevant standardization workshop round. Serum levels of IAA were quantified with a
microassay (Ronkainen et al. 2001) modified from that described by Williams et al. (1997). The
IAA values representing the specific binding were expressed in relative units based on a standard
curve run on each plate using the MultiCalc™ software program (PerkinElmer Life Sciences
Wallac, Turku, Finland). A subject was considered to be positive for IAA when the specific binding
exceeded 1.55 relative units (the 99th percentile in 371 non-diabetic Finnish subjects). The disease
sensitivity of the IAA microassay was 44% and its specificity 98% in the CDC-sponsored Diabetes
Autoantibody Standardization Program (DASP) Workshop 2002.
GAD antibodies were measured with a radiobinding assay as described (Savola et al. 1998a). The
results were expressed in relative units based on a standard curve constructed from a dilution of

70
positive and negative samples. The cut-off limit for antibody positivity (5.35 relative units) was set
at the 99th percentile in 373 non-diabetic Finnish children and adolescents. The sensitivity of the
GAD antibody assay was 82% and its specificity 98% in the 2002 DASP Workshop. IA-2
antibodies were quantified with a radiobinding assay as described (Savola et al. 1998b). Antibody
values were expressed in relative units based on a standard curve, as for GAD antibodies. The limit
for antibody positivity was set at 0.429 relative units, which represents the 99th percentile in 374
non-diabetic Finnish children and adolescents. The sensitivity of this assay was 62% and its
specificity 100% in the 2002 DASP Workshop. Samples with IAA, GAD, or IA-2 antibody levels
between the 97.5th and 99.5th percentiles were reanalyzed to confirm the antibody status.
Transplacentally transferred autoantibodies (Hämäläinen et al. 2000) were excluded from the
analyses for the appearance of β-cell autoimmunity. In the analysis of study V, data on T1D
associated autoantibodies until September 30, 2004 were used.
When data on T1D associated autoantibodies until September 30, 2004 were used, among the 3565
children with genetic risk for T1D, 237 (6.6%) were at least twice positive for ICA and 101 (2.8%)
repeatedly positive for ICA plus at least one other antibody (of them 83 tested at least twice as
being positive for IAA, 66 for GADA, and 49 for IA-2A) during the median follow-up time of 4
years (range 0.2 to 8.1 years) since birth. Altogether 42 children (1.2%) had progressed to clinical
T1D at a median age of 3.2 years (range 1.0-6.4 years). We decided to include clinical T1D in the
autoantibody endpoints due to three persistently seronegative children among those progressing to
T1D. This resulted in 111 children (3.1% of all children) being positive for the ICA plus at least one
other antibody, and this was used as an endpoint.
4.6 Statistical methods
Means and standard deviations for food consumption and nutrient intake were calculated for data
derived from the FFQs and food records. In addition, pooled protein intake from different milk

71
products during pregnancy and lactation was separately calculated in study III. Median and range
were used to describe the duration of breastfeeding and age at introduction of complementary foods
(IV). Several variables based on cow’s milk exposure were created in study V: any type of cow’s
milk exposure, exposure to cow’s milk-based infant formulas, and early exposure in the delivery
hospital. Log-transformation of food consumption and nutrient intake (log [x + 0.1]) was done in
studies I – III. Accordingly, antibody titres were log transformed in study III. Adjustment for total
energy intake was performed using the residual method of Willett (1997), (I – III). Further
statistical methods were as follows.
Study I
Intraclass correlation was used to measure the reproducibility between the questionnaires in the
reproducibility study. Pearson product-moment correlation and Spearman correlation were used to
compare food and nutrient intake from FFQs with those from food records. Pearson product-
moment and Spearman rank correlations were used to compare food and nutrient intake from FFQs
with those from food records in the validation study. The correction of the observed correlations for
the attenuating effect of random within-person error can be written as
rt = ro √ (1 + λx/nx )
where λx is the ratio of the within- and between-person variances for x, and nx is the number of
replicates per person for the x variable (Willett 1998, Margetts & Nelson 1991). For study II, n = 10
representing each recording day. Fisher’s normalizing transformation
z = ½loge [(1 + r)/(1 – r)] with s•e(z) = 1/(n-3)½
was used to calculate 95% confidence intervals for the Pearson correlation coefficient r. The degree
of misclassification across categories between the FFQ and the dietary records was examined by
dividing food consumption and nutrient intake into quintiles based on both methods. The
proportions of correctly categorized subjects in the same or adjacent quintiles were calculated.

72
Study II
The t-test was used for testing the significance of differences in food and nutrient intake by education
group and smoking, and analysis of variance by BMI-group and age group. Multiple linear regression
was used to take account of the independent effects of age and length of education, and logistic
regression to test the association between the use of supplements and sociodemographic variables.
Study III
Spearman correlation coefficients and Wilcoxon signed rank test were used to study associations
between maternal diet and maternal antibody titers, and between antibody titers in children and
mothers. Partial correlation coefficients were calculated between dietary variables and cow’s milk
antibody titres. Logistic regression analysis was used to test the association between antibody titers in
children (highest tertile = 1, others = 0) and maternal protein milk intake from different milk products
(Hosmer & Lemeshow 1989). Wald statistics were examined for each variable included in the model.
Study IV
Sociodemographic differences in feeding patterns were analyzed with the non-parametric Mann-
Whitney and Kruskal-Wallis tests, and with the 2-tests among categorized dietary variables. In the
logistic regression models, dietary variables were categorized according to the previous Finnish
nutrition recommendations for infants and young children (Hasunen et al. 1997), and the independent
contribution and the corresponding odds ratio of all sociodemographic factors were estimated.
Study V
Logistic regression analysis was used to study background factors associated with age at
introduction of selected foods. A piece-wise exponential survival model with constant hazard in the
intervals 0-1, 1-2 and 3 years was used to accommodate interval censored and most likely sibling
dependent outcomes. Random effects for family were introduced to accommodate familial

73
dependence and these were assumed to follow a normal distribution. Time-dependent exposures
were allowed to influence the risk in a given observational interval only if the exposure could
reasonably be expected to affect the subject for at least half of the length of the interval. The models
were fitted using maximum likelihood in SAS PROC NLMIXED, with standard errors of estimates
derived from the observed information matrix. The proportionality of the hazards was tested by
adding interaction terms of the exposure variables with time interval, to the models.
Statistical analyses were performed using SAS (SAS Institute, Inc: Cary, NC) procedures (studies I,
II, and V) and the SPSS 7.5 (IV), 10 (III), and 12 (V) statistical packages for Windows (SPSS Inc.,
Chicago, IL, USA).

74
5. Results
5.1 Validity of dietary methods (I, II, and III)
Reproducibility of FFQ
The mean intake of all foods and nutrients, except for high-fat milk, buttermilk, and soft margarine,
were generally higher when estimated using the second FFQ than the first. The greatest differences
(> ⏐ ± 25⏐ %) between the first and the second FFQ among foods were found for high-fat milk,
soft drinks, vegetables, ice cream, and fish, and among nutrients for ethanol. The intraclass
correlation coefficients between the two FFQs ranged from 0.44 (ice cream) to 0.91 (coffee) for
foods. The correlation coefficients were highest for those items consumed daily, such as coffee
(0.91), low-fat milk (0.85), and butter (0.81), and lowest for occasionally eaten foods like ice cream
(0.44), oils (0.54), and low-fat spreads (0.55). The intraclass correlation coefficients for nutrients
ranged from 0.42 for ethanol to 0.72 for sucrose, riboflavin, and calcium. The average of all
correlation coefficients for foods and nutrients was 0.65.
Validity of FFQ
The intake of foods and nutrients were higher as determined by FFQ than the intake assessed using
food records; the estimates of FFQs for foods were approximately 129% (range from 83% for soft
drinks to 188% for pork), and for nutrients 136% (range from 100% for ethanol to 169% for
thiamine) of the values based on the means of 10-day food records. The unadjusted Pearson
correlation coefficients for foods ranged from 0.01 for high-fat milk to 0.97 for coffee (Figure 2).
The correlations for foods were stronger than the corresponding coefficients for nutrients (mean
0.47 vs. 0.37), and tended to be stronger for foods consumed at higher frequencies. Adjustment for
energy led to the most conspicuous changes in the intake of butter, sausages, and pork, and the
correction for attenuation for the consumption of eggs, potatoes, sausages, and berries. The adjusted
and corrected correlation coefficients then ranged from 0.04 (high-fat milk) to 0.86 (low-fat milk).

75
0
0,1
0,2
0,3
0,4
0,5
0,6
0,7
0,8
0,9
1
Foods, unadjusted Energy adjusted Energy adjusted +attenuation
Pea
rson
cor
rela
tion
coef
ficie
nts
betw
een
FFQ
and
FR
Mean
Figure 2. Pearson correlation coefficients between food intake measured by FFQ and FR; mean and range (includes 30 foods, see Figure 4)
The energy-adjusted Pearson correlation coefficients for nutrients (Figure 3) varied from 0.19
(vitamin E) to 0.70 (thiamine). When taking the effect of attenuation into account, the coefficients
ranged between 0.22 (vitamin E) and 0.74 (thiamine). According to the improvement in the
correlation coefficient, when attenuation was taken into account, the subjects had the greatest
within-person variation with respect to their intakes of total triglycerides, vitamin D, mercury,
nitrite, copper, and vitamin B12.

76
0
0,1
0,2
0,3
0,4
0,5
0,6
0,7
0,8
0,9
1
Nutrients, unadjusted Energy adjusted Energy adjusted +attenuation
Pea
rson
cor
rela
tion
coef
ficie
nts
betw
een
FFQ
and
FR
Mean
Figure 3. Pearson correlation coefficients between nutrient intake measured by FFQ and FR; mean and range (includes 47 nutrients, see Figure 5)
An average of 70% (52-94%) of the women were classified by both methods into the same or
adjacent quintiles according to their food intake, and an average of 69% (58-81%) according to
nutrient intakes (Figures 4 and 5). The greatest misclassifications (> 15% in the highest quintile on
FFQs and in the lowest quintile on food records) in food groups were found for high-fat milk
(23%), and offals (18%), and for thiamine (18%) in the nutrients. On average, only 6% of foods,
and only 5% of nutrients were grossly misclassified into extreme quintiles.

77
0 10 20 30 40 50 60 70 80 90 100
Alcoholic drinks
Oils
Offals
High-fat milk
Poultry
Cream
Egg
Pork
Sugar and sw eets
Beef
Wheat products
Butter
Rye products
Fish
Vegetables
Ice cream
Sausages
Potatoes
Fruits
Low -fat spreads
Berries
Cheese
Soft drinks
Soft margarine
Buttermilk
Root vegetables
Fruit juices
Tea
Low -fat milk
Coffee
Overall proportion of foods categorized in the same or adjacent quintile; FFQ vs. FR
Figure 4. Overall proportion (%) of foods categorized in the same or adjacent quintile in cross classification of FFQ and FR

78
0 10 20 30 40 50 60 70 80 90
Monounsaturated fatty acids
Potassium
Energy
Available carbohydrates
Total n-3 fatty acids
Selenium
Vitamin D
Polyunsaturated fatty acids
Total n-6 fatty acids
Niacin
Vitamin E
Iron
Sodium
Iodine
Total fat
Ethanol
Manganese
Total triglycerides
Chromium
Starch
Total retinol
Mercury
Protein
Folate
Total carbohydrates
Vitamin A
Thiamine
Copper
Sucrose
Dietary f iber
Vitamin B12
Biotin
Water-soluble f iber
Zinc
Nitrite
Water-insoluble f iber
Pyridoxine
Pantothenic acid
Vitamin C
Saturated fatty acids
Calcium
Carotenoids
Magnesium
Beta-carotene
Lead
Nitrate
Riboflavin
Overall proportion of nutrients categorized in the same or adjacent quintile; FFQ vs. FR
Figure 5. Overall proportion (%) of nutrients categorized in the same or adjacent quintile in cross classification of FFQ and FR
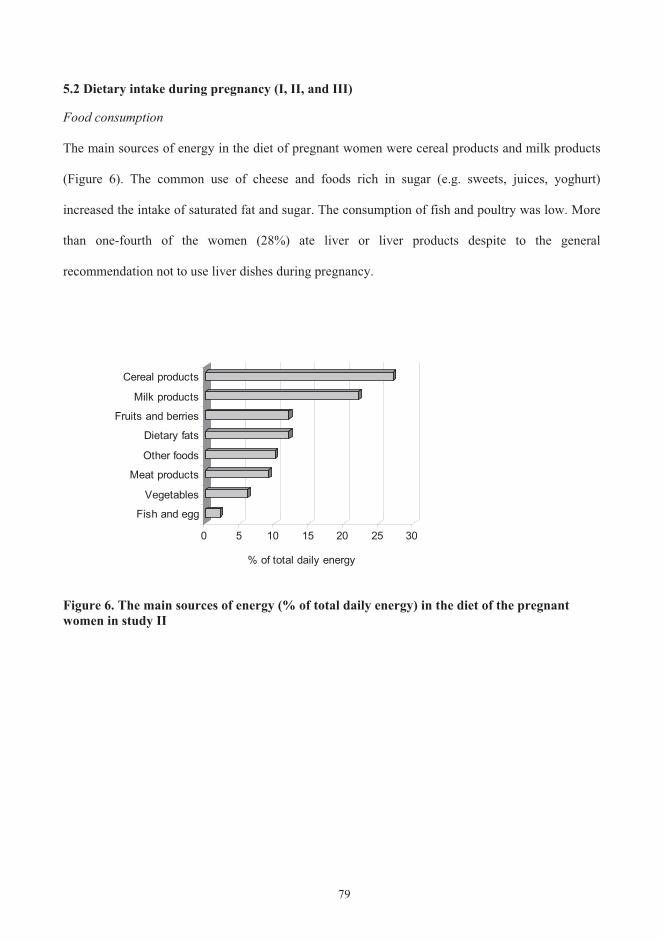
79
5.2 Dietary intake during pregnancy (I, II, and III)
Food consumption
The main sources of energy in the diet of pregnant women were cereal products and milk products
(Figure 6). The common use of cheese and foods rich in sugar (e.g. sweets, juices, yoghurt)
increased the intake of saturated fat and sugar. The consumption of fish and poultry was low. More
than one-fourth of the women (28%) ate liver or liver products despite to the general
recommendation not to use liver dishes during pregnancy.
0 5 10 15 20 25 30
Fish and egg
Vegetables
Meat products
Other foods
Dietary fats
Fruits and berries
Milk products
Cereal products
% of total daily energy
Figure 6. The main sources of energy (% of total daily energy) in the diet of the pregnant women in study II

80
The composition of the diet varied in relation to maternal age, education and smoking (Table 5),
with the education having the greatest impact.
Table 5. The associations of maternal age, education, and smoking with the diet during pregnancy; statistically significant (p 0.05) results from study II(1
Age Education Smokers
Intake of foods:
Sugar
Pork
Offals
Sausages
Vegetables
Fruits
Fruit juices
Berries
Butter
Tea
Coffee
Intake of nutrients:
Total energy
Total carbohydrate
Sucrose
Lactose
Dietary fiber
Vitamin C
Calcium
Iron
Magnesium
Ethanol (1 means that marked sociodemographic variable has a positive association and means an inverse association

81
Energy intake and nutrients
The obtained total energy intake during pregnancy was strongly dependent on the dietary
assessment method used; the mean intake was about 2 MJ higher when estimated using FFQ in
studies I and III than using the food record in study II (Figure 7). On average 15% of the total
energy was supplied by protein, 33% by fats, 52% by carbohydrates, and 12% by sucrose (II).
Figure 7. The mean intake of total energy (MJ + SD) during the eighth month of pregnancy by different dietary assessment methods in studies I – III, (FFQ = food frequency questionnaire, FR = food record)
Reproducibility study I, n = 111
Validation study I, n = 113
Study II, n = 118
Study III, n = 97
0 5 10 15 20
FFQ
FR
FFQ
Energy MJ+ S.D.
FFQ

82
Compared to the Finnish nutrition recommendations (Valtion ravitsemusneuvottelukunta 2005), the
intake of dietary fiber was low (19 g vs. 25-35 g/d) and the intake of sucrose high (12 en% vs. 10
en%). Longer educated women tended to have a higher intake of most carbohydrates (Table 5).
Saturated fatty acids contributed about half of the total fat intake (Figure 8). The diet of those
pregnant women not eating fish during the recording period (n = 17) contained significantly less
eicosapentaenoic acid, docosahexaenoic acid, and vitamin D (p < 0.001 for all), compared to the
diet of women consuming fish (n = 101).
Figure 8. Intake of dietary fat (en%) by pregnant women (II) (*Recommended monounsaturated fatty acid intake ranges between 10 – 15 en%)
0 5 10 15 20 25 30 35
% of total energy intake
Total fat
Hard fat (saturated +trans fatty acids)
Saturated fatty acids
Monounsaturated fattyacids*
Polyunsaturated fattyacids
Essential fatty acids
N-3 fatty acidsRecommendation for pregnant women
% of total energy intake of 118 pregnantwomen

83
The intakes of vitamins and minerals met or exceeded the recommended allowances, except for
vitamin D, folate, and iron (Table 6). The recommended daily intake of thiamine seemed also
difficult to meet. The main dietary source of vitamin D was fish (36% of total vitamin D intake),
and main sources of folate were vegetables and cereal products. The mean intake of vitamin A was
higher among the women eating liver or liver products than women who did not use these products
(1930 g vs. 965 g, p < 0.001). Young and less educated pregnant women tended to encounter the
greatest difficulties in meeting the dietary recommendations (Table 5).
Table 6. Dietary intake of selected nutrients in comparison to nutrition recommendations for pregnant women (II)
Nutrient I quartile Median III quartile Recommendations for pregnant women(1
Vitamin A, g 697 979 1433 800
Vitamin D, g 2.2 2.9 4.5 10
Vitamin E, g 8.2 9.5 11.1 10
Thiamine, mg 1.1 1.3 1.5 1.5
Riboflavin, mg 1.7 2.1 2.5 1.6
Niacin, mg 23 29 35 17
Pyridoxine, mg 1.6 2.0 2.2 1.5
Folate, g 262 305 352 400(2
Vitamin B12, g 4.6 5.9 7.9 2.0
Vitamin C, mg 100 143 194 85
Calcium, mg 1101 1342 1636 900
Iron, mg 9.6 11.4 12.9 (3
Magnesium, mg 296 333 394 280
Zinc, mg 10 12 14 9
Iodine, g 251 289 339 175
Selenium, g 47 57 66 55 (1 Valtion ravitsemusneuvottelukunta 2005, Nordic Nutrition Recommendations 2004. (2 In the new Finnish nutrition recommendations (Valtion ravitsemusneuvottelukunta 2005) the recommended daily intake for folate during pregnancy is 400 g vs. 500 g in the new Nordic nutrition recommendations (2004) (3 Iron balance during pregnancy requires iron stores approx. 500 mg. The physiological need for iron during the later part of pregnancy cannot be supplied solely via the diet.
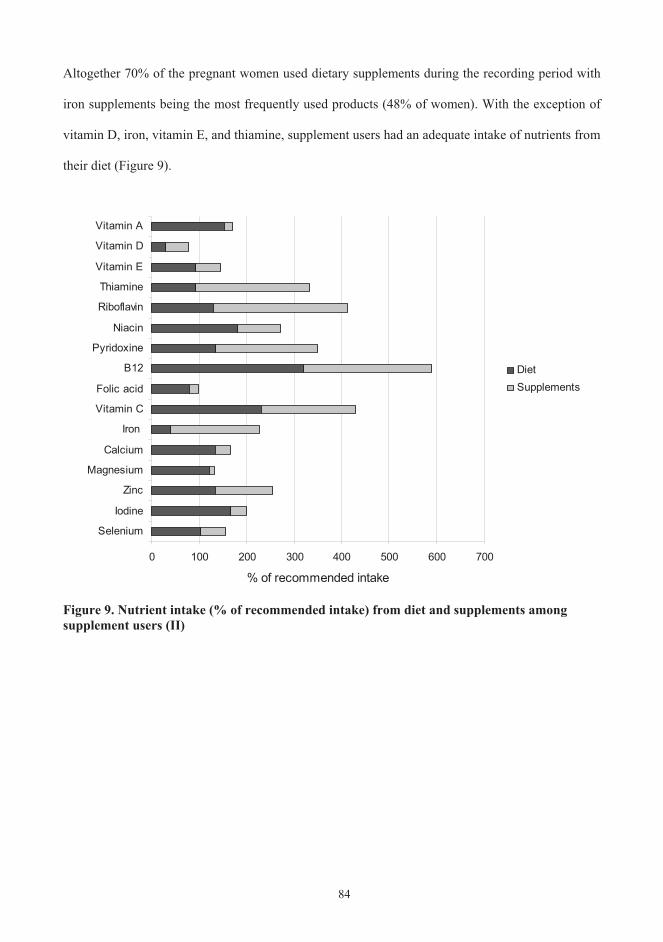
84
Altogether 70% of the pregnant women used dietary supplements during the recording period with
iron supplements being the most frequently used products (48% of women). With the exception of
vitamin D, iron, vitamin E, and thiamine, supplement users had an adequate intake of nutrients from
their diet (Figure 9).
0 100 200 300 400 500 600 700
Selenium
Iodine
Zinc
Magnesium
Calcium
Iron
Vitamin C
Folic acid
B12
Pyridoxine
Niacin
Riboflavin
Thiamine
Vitamin E
Vitamin D
Vitamin A
% of recommended intake
DietSupplements
Figure 9. Nutrient intake (% of recommended intake) from diet and supplements among supplement users (II)

85
Weight gain during pregnancy
The average weight gain during pregnancy was 14.0 kg (SD 4.6). The rate of weight gain differed
between groups based on the prepregnancy body mass index (BMI), (Figure 10). The average
weight gain of the women in the two highest BMI categories was 1 kg less compared to the women
in the two lowest BMI categories (13.4 kg vs. 14.6 kg, p < 0.05).
14,6
14,7
13,4
13,4
0
20
40
60
80
100
120
< 20 20 - 25,9 26 - 29 > 29
Prepregnancy body mass index (BMI)
Wei
ght (
kg)
w eight gain during pregnancy
prepregnancy w eight
Figure 10. Weight gain in women during pregnancy according to BMI category (II)

86
5.3 Infant feeding patterns (III, IV, V)
Breastfeeding
Both exclusive and total breastfeeding were on average one month longer in study III than in study
V, which is most likely due to a different study design (Figure 11).
Figure 11. Median duration (months, range in parenthesis) of exclusive and total breastfeeding in studies III and V. The participants were born 1995-1997 and 1996-2001, respectively.
Altogether 71% of women in study V could recall their child being fed supplementary milk
(donated breast milk or infant formula) at the maternity ward during the first days after delivery,
and 9% of all women reported that the given milk was cow’s milk based infant formula. Additional
information about hospital feeding did not markedly shorten the observed median durations for
breastfeeding; median duration of exclusive breastfeeding being 1.4 months (range 0 – 11) when
taking into account vs. 1.5 months (range 0 – 11) not taking into account hospital feeding in
calculations (Figure 12).
(0-6)
(0-11)
(.2-24)
(0-28)
0
1
2
3
4
5
6
7
8
9
Study III Study V
Total breast feedingExclusive breast feeding
Months

87
0
10
20
30
40
50
60
70
1 2 3 4 5 6
Months
% o
f inf
ants Study V
Study V+ hospitalfeeding
Figure 12. Exclusive breastfeeding in study V. Feeding at the maternity ward is taken into account in the latter model.
On average every second baby was still receiving breast milk at the age of six months, but the
proportion of the exclusively breastfed was close to zero (Figure 12, Table 7). Some form of
breastfeeding continued till the end of the first year on average in 15% of children (Table 7).
Table 7. Children receiving breast milk in different age groups in study V, (% of all children in the same age group)
Age months 1 2 3 4 5 6 7 8 9 10 11 12
Breastfed children(% of all)
84 77 70 64 57 51 45 38 32 25 20 15
Several sociodemographic variables were associated with the duration of breastfeeding (Table 8);
parental education, and the age of the mother were positively and infant’s male gender negatively
associated with the duration of breastfeeding. Accordingly infant’s ponderal index at birth was inversely
associated with the duration of total breastfeeding (OR 0.32, 95% CI 0.14 – 0.73, p = 0.007).

88
Table 8. The association of selected sociodemographic factors with infants’ diet; based on statistically significant odds (p 0.05) in study IV (1
Mother Infant Age Education Number of
siblings Male
genderDuration of breastfeeding
- exclusive breastfeeding parental
- total breastfeeding parental
Age at introduction of
- formula parental
- first complementary food parental
- vegetables high in nitrate one sibling vs. others
- meat and meat products
- sausage (1 means that marked sociodemographic variable has a positive association and means an inverse association
Introduction of complementary foods
The first complementary foods given after/in parallel with breast milk were infant formula (in 61%
of children in study V), carrots and potatoes (16%), fruits and berries (6%), with the two latter
groups being started at the same time in some infants (9%). Infant formula was introduced in study
IV at a median of 1.8 months (range 0 – 25) and in study V at 1.6 (range 0 – 18) months of age, and
the first complementary food in both groups at a median of 3.5 months of age (range 1 – 6 in study
IV, and 0.7 – 8 in study V), (Figure 13). The median age at the introduction of dairy products (other
than infant formula and infant food containing hydrolysed milk protein) was 5.5 months (range 2.5 -
>24) in study IV. With the inclusion of infant formula and infant food containing hydrolysed milk
protein, the median age at first cow’s milk exposure in study V was 1.8 months (range 0 – 23.5).
Timing of the introduction of most complementary foods was associated with the duration of
breastfeeding; the association with age at the introduction of cow’s milk products being particularly
clear (correlation with the duration of exclusive breastfeeding 0.93, and total breastfeeding 0.57 in
study V). Several sociodemographic variables were associated with the infants’ diet: maternal age,
parental education, and infant gender having the strongest influence (Table 8).

89
1
2
3
4
56
7
8
9
10
1112
Infant formula (1.8)
First complementary food (3.5)Potato / carrot (3.5)
Fruit / berries (4)
Gluten-containing cereals (5)(oats, wheat, rye, barley)
Other cereals (rice, maize, etc.) (5)Meat (5) Dairy products (5.5)
(other than infant formula)
Fish (7.5)
Egg (10)
Vegetables high in nitrates / nitrites (12)Sausage (12)
Timing of complementary foods, months
Figure 13. Timing of the introduction of complementary foods in study V (median age at introduction, months)
The associations between sociodemographic factors and age at introduction of selected foods were
also studied in study V. Maternal age and education exhibited a positive and infant’s male gender
and maternal smoking an inverse association with age at introduction of fruits and berries and root
vegetables. Maternal education and smoking were also positively associated with age at
introduction of rye. The number of siblings was positively associated with age at introduction of
root vegetables and rye. Accordingly caesarean section and Oulu as the area of birth were
associated with early introduction of rye; root vegetables; and fruits & berries and root vegetables,
respectively. In over-simplistic terms: being a female child of well educated parents with the
mother being a non-smoker and 30 years or older seems to endow a Finnish infant with the best
odds for being fed according to recommendations.
90
5.4 The associations between maternal diet and development of cow’s milk antibodies in infant (III)
Maternal milk protein intake during pregnancy and lactation
The average intakes of various milk products were slightly higher during pregnancy than lactation.
Raw milk products represented the dominant source of milk protein in the maternal diet. Milk
protein intake was rather similar during pregnancy and lactation. Spearman correlation coefficients
for energy-adjusted protein intake during pregnancy and lactation were 0.56 (p < 0.001) for all milk
products, 0.70 (p < 0.001) for raw milk products, and 0.66 (p < 0.001) for cheese. Milk protein
intake from raw milk products correlated inversely with milk protein intake from cheese (r = –0.25,
p = 0.017 and r = –0.23, p = 0.027 during pregnancy and lactation, respectively).
Cow’s milk protein antibodies in infants
The proportions of children with detectable cow’s milk antibodies of IgA class increased by age,
whereas those of IgG class had a U-shaped form as shown in Figures 1 and 2 in the article III. At
the age of 1 year, the duration of breastfeeding was inversely (r = -0.45, p < 0.001 and r = -0.54, p<
0.001), and the infant’s current milk protein intake directly (r = 0.23, p = 0.04 and r = 0.31, p =
0.004) related to both the IgA and IgG BSA antibody titers, respectively. A clear association was
noted between the detectable antibodies in the maternal circulation and the detectable levels of the
same antibodies in cord blood (except for IgA antibodies to BLG, all p-values in Wilcoxon signed
ranks test < 0.01). The median levels of IgG class antibodies were higher in maternal samples than
in the corresponding samples in cord blood, with only the median level of IgG antibodies to BLG
being higher in cord blood. Maternal titers were differently related to antibody titers in the offspring
in the two antibody classes, as might be expected. Stronger correlations were recorded for IgG
antibody titers at early time points, at birth in particular, whereas the correlations between
antibodies of the IgA class were stronger later.

91
Relatively few relationships were detected between the maternal consumption of different types of
milk products and the antibody response to specific cow’s milk proteins in the offspring. Maternal
diet during pregnancy was related to IgA BLG antibody titers; milk protein intake from cheese was
inversely related to IgA BLG antibody titers at the age of 3 (OR 0.16, 95% CI 0.03 – 0.81) and 6
months (OR 0.33, 95% CI 0.11 – 0.97). A similar inverse association was recorded for IgA CAS
antibody titers at the age of 3 months (OR 0.34, 95% CI 0.12 – 0.95). Maternal diet during lactation
was more clearly related to IgA CAS antibody titers. The maternal milk protein intake from raw
milk products was associated with IgA CAS antibody titers at 6 months of age (OR 1.92, 95% CI
1.01 – 3.64), whereas an inverse relationship was seen at the age of 2 years (OR 0.44, 95% CI 0.21
– 0.92), similarly to that detected for IgG BSA antibodies (OR 0.46, 95% CI 0.21 – 0.97). Maternal
milk protein intake from cheese was inversely related to IgA CAS antibody titers at 3 (OR 0.18,
95% CI 0.06 – 0.58) and 6 months of age (OR 0.37, 95% CI 0.17 – 0.81), and to decreased IgG
CAS antibody titers at 6 months of age (OR 0.40, 95% CI 0.19 – 0.87).
5.5 Relation between dietary factors and appearance of autoantibodies (V)
Among the 3565 children in study V, 111 children (3.1% of all children) tested positive for the ICA
plus at least one other antibody until September 30, 2004, which was used as an endpoint. Early age
at introduction of fruit and berries was related to greater risk of reaching the endpoint (Table 9).
Accordingly, the age at introduction of root vegetables in the mid-tertile was related to increased
risk of seroconversion to positivity for the endpoint. No evidence of interaction between HLA-
DQB1 risk genotypes and age at introduction of fruits and berries or roots was seen in the
development of the endpoint. The duration of total and exclusive breastfeeding and all of the
studied measures of cow’s milk exposure were not associated with the autoantibody endpoints.
Using either the combined variable or the specific cereals, no statistically significant associations
were observed with the endpoint of ICA plus at least one other autoantibody.

92
Table 9. Hazard ratio (HR) and 95% CI adjusted for genetic risk for repeated positivity for type 1 diabetes associated autoantibodies related to age at introduction of foods(1. Separate models were used for each dietary variable
AgeICA plus at least one other autoantibody
Months N of positive (total N) HR (95% CI) Total breastfeeding ns(2
- 1. tertile: 0-4 28 (1106) 0.96 (0.59-1.57)
- 2. tertile: 4.01-8.5 32 (1000) 1.09 (0.67-1.76)
- 3. tertile: >8.5 37 (1078) 1
Exclusive breastfeeding ns(2
- 1. tertile: <1 38 (1322) 0.87 (0.56-1.35)
- 2. tertile: 1-2.99 24 (934) 0.82 (0.49-1.35)
- 3. tertile: >3 42 (1174) 1
Cow’s milk ns(2
- 1. tertile: < 1 37 (1196) 0.94 (0.61-1.47)
- 2. tertile: 1- 3.99 24 (1036) 0.76 (0.46-1.25)
- 3. tertile: >4 42 (1185) 1
Fruits and berries p=0.026
- 1. tertile: < 3.5 33 (1001) 2.02 (1.03-3.95)(3
- 2. tertile: 3.5-4 47 (1330) 1.97 (1.06-3.64)(3
- 3. tertile: >4 21 (955) 1
Roots p=0.014
- 1. tertile: <3 15 (669) 1.04 (0.57-1.90)
- 2. tertile: 3-3.99 49 (1198) 1.82 (1.19-2.79)(3
- 3. tertile: >4 38 (1431) 1
Wheat, barley, rye or oats p=0.035
- 1. tertile: < 5 10 (571) 0.76 (0.37-1.54)
- 2. tertile: 5-5.49 55 (1471) 1.53 (0.99-2.37)
- 3. tertile: > 5.5 36 (1192) 1
Other cereals ns(2
- 1. tertile: < 4.5 28 (961) 0.98 (0.61-1.59)
- 2. tertile: 4.5-5 32 (1042) 0.91 (0.57-1.45)
- 3. tertile: > 5 41 (1239) 1 (1A piece-wise exponential survival model was used in the analysis. ICA were used as a primary screening tool. All samples of the children testing at least once positive for ICA were analyzed for IAA, GADA and IA-2A. Type 1 diabetes was included in the endpoints. For the endpoint based on repeated positivity for at least ICA plus one other autoantibody the trend across the tertiles was significant (p<0.05) for combined cereals (wheat, rye, oats, barley), rye alone, fruit and berries, but not for roots (2 Loglikelihood ratio test was used to test whether the model with and without the food variables differed. Ns: p>0.05(3 P<0.05

93
When bringing age at introduction of fruits and berries and roots into the same model with socio-
demographic and perinatal factors, both food variables retained their significance. When both food
variables and the sociodemographic and perinatal factors were included in the same model, the
association of fruits and berries with ICA plus at least one other autoantibody was of borderline
significance (p=0.056). The type of the first supplementary food, whether supplementary milk,
roots, or fruits and berries, was unrelated to the endpoint (data not shown).

94
6. Discussion
6.1 Science and conclusions are only as good as our tools and their proper application; Validity of the food frequency questionnaire
The validity and reproducibility of our 181-item FFQ, which was designed to effectively study the
putative effects of the maternal diet during pregnancy on the development of T1D, were found to be
reasonably good (II). Similarly to most other validation studies among different populations, the FFQ
overestimated food consumption and intake of nutrients (Willett 1998). However, more importantly,
the quintile notation was acceptable for most of the foods, nutrients and other dietary factors.
Dietary measurement error has two consequences relevant to epidemiologic studies: first, a proportion
of subjects will be misclassified according to exposure, and second, the distribution of reported
intakes will be wider than the distribution of the true intakes. The first of these two errors is more
consequential and has to be considered before we can draw firm conclusions from our FFQ. The
greatest misclassifications were found for rarely consumed foods, highlighting the fact that when the
time between the behaviour and the report increases, respondents may rely less on episodic memory
and more on generic memory. In terms of the nutrients, the greatest misclassifications were found for
different fatty acids, which needs to be taken into account when assessing the results from the studies
using our FFQ. In order to improve the classification of dietary fats, the grouping and brand names of
spreads in our FFQ are continuously checked and updated.
There are three recommended validity estimates for nutrients of interest in epidemiological studies:
Spearman correlation coefficients should be above 0.5, more than 50% of subjects should be correctly
classified and less than 10% of subjects should be grossly misclassified into thirds (Masson et al.
2003). When observing the validity estimates for dietary variables of special interest (Table 10) in the
light of the abovementioned recommendations, the validity of our FFQ to assess intakes of vitamin D
and E could partly be criticised. However, the quintile notation was acceptable for both of these
vitamins. Since February 2003, Finnish milk products have been supplemented with vitamin D and,
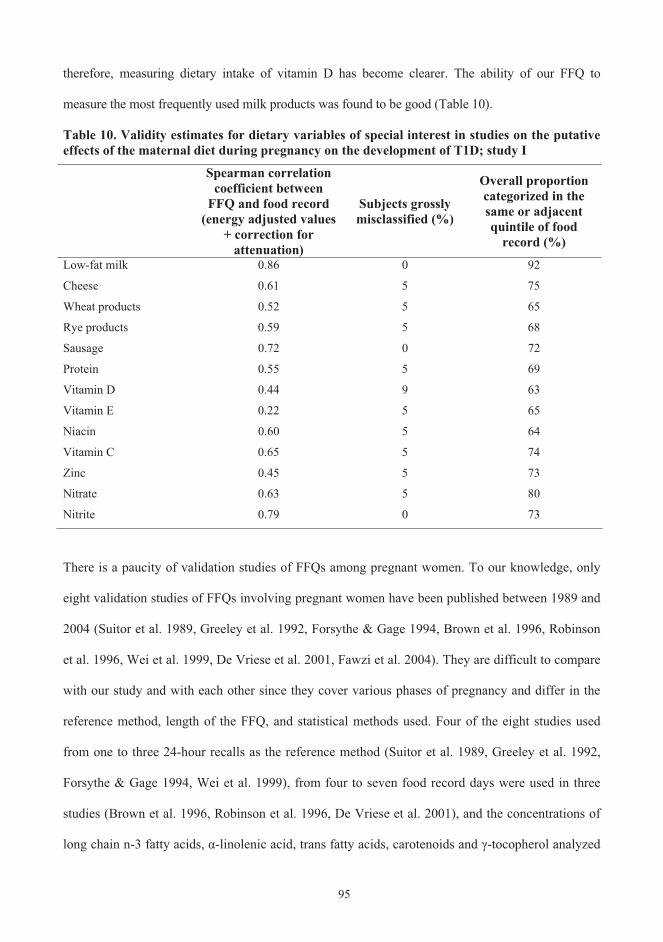
95
therefore, measuring dietary intake of vitamin D has become clearer. The ability of our FFQ to
measure the most frequently used milk products was found to be good (Table 10).
Table 10. Validity estimates for dietary variables of special interest in studies on the putative effects of the maternal diet during pregnancy on the development of T1D; study I
Spearman correlation coefficient between
FFQ and food record (energy adjusted values
+ correction for attenuation)
Subjects grossly misclassified (%)
Overall proportion categorized in the same or adjacent quintile of food
record (%)
Low-fat milk 0.86 0 92
Cheese 0.61 5 75
Wheat products 0.52 5 65
Rye products 0.59 5 68
Sausage 0.72 0 72
Protein 0.55 5 69
Vitamin D 0.44 9 63
Vitamin E 0.22 5 65
Niacin 0.60 5 64
Vitamin C 0.65 5 74
Zinc 0.45 5 73
Nitrate 0.63 5 80
Nitrite 0.79 0 73
There is a paucity of validation studies of FFQs among pregnant women. To our knowledge, only
eight validation studies of FFQs involving pregnant women have been published between 1989 and
2004 (Suitor et al. 1989, Greeley et al. 1992, Forsythe & Gage 1994, Brown et al. 1996, Robinson
et al. 1996, Wei et al. 1999, De Vriese et al. 2001, Fawzi et al. 2004). They are difficult to compare
with our study and with each other since they cover various phases of pregnancy and differ in the
reference method, length of the FFQ, and statistical methods used. Four of the eight studies used
from one to three 24-hour recalls as the reference method (Suitor et al. 1989, Greeley et al. 1992,
Forsythe & Gage 1994, Wei et al. 1999), from four to seven food record days were used in three
studies (Brown et al. 1996, Robinson et al. 1996, De Vriese et al. 2001), and the concentrations of
long chain n-3 fatty acids, -linolenic acid, trans fatty acids, carotenoids and -tocopherol analyzed

96
in pooled blood samples were measured in the final study (Fawzi et al. 2004). Two studies were
conducted in European populations (Robinson et al. 1996, De Vriese et al. 2001) and the rest in
North America (including African American, Caribbean and Caucasian descendants), two of which
focused on low-income pregnant women (Suitor et al. 1989, Wei et al. 1999). Our validation study
could be considered as a more comprehensive study than the others in terms of the number of
dietary variables, the use of several statistical methods, and the evaluation of validity estimates. The
strengths of our FFQ are its possibility to provide information on the intake of a wide selection of
nutrients and foods as well as nitrates, nitrites and some contaminants. All other validation studies
have focused only on the intakes of nutrients (max 25 in the study of Wei et al. 1999), except for
one (Robinson et al. 1996) in which the contribution of selected food groups to energy and energy-
yielding nutrients was also assessed. The strength of our FFQ is also that the information of the
most frequently used foods among the Finnish women of childbearing age (so. the target group of
the FFQ) was used as a baseline tool to create food lists and recipes. Our FFQ makes it possible to
take personal choices for fats into account. The additional questions about the use of dietary
supplements mean that it is possible to include these compounds into calculations, although their
validity was not assessed here.
Our study provided important information about a target group whose special characteristics as FFQ
users have not been adequately evaluated. When one compares validity studies between non-
pregnant and pregnant women, it seems that the tendency to over-report food consumption increases
during pregnancy (e.g. Männistö et al. 1996 vs. study I). In the study among US low-income
pregnant women, overestimation of food use was believed to occur in up to 20% of the subjects
(Suitor et al. 1989). The poor correlation between instruments may be partly explained by appetite
fluctuations and nausea, which could influence the long-term diet reports (Wirfält 1998). However,
nausea is reported to peak around 8 to 12 weeks of gestation (Jewell & Young 2003), and therefore
it should not markedly have influenced our measurements which were made during the third

97
trimester of gestation. Future research should develop and validate FFQs linking the data on most
frequently used dietary supplements to the data on food intake. As revealed in our studies (II), there
is widespread use of dietary supplements during pregnancy and, therefore, ranking the subjects
according to nutrient intake exclusively from diet could lead to serious misclassification.
6.2 Focusing on quality rather than quantity when building basis for a new life; Diet during pregnancy
The results of the dietary survey among pregnant women (II) emphasized that special attention
should be paid to the type of fat as well as the amount of carbohydrates. An increase in the
consumption of whole grain cereals, vegetables, and fish, and a decrease in the consumption of
foods rich in sugar and saturated fatty acids should be the strategy adopted for improving the intake
of critical nutrients: essential fatty acids, dietary fiber, vitamin D, folate, and thiamine. This is also a
strategy for reducing the risk of overweight. Supplementation is needed to ensure an overall
adequate intake of iron and vitamin D, and, in some reference groups, also folate. Dietary guidance
at maternity clinics needs to be focused on young and less educated women as well as on smokers.
The total intake of energy increases during pregnancy (vs. non-pregnant women aged 25-34 years in
Finravinto study; Finravinto 1997-tutkimuksen työryhmä 1998). The increasing energy content
comes in most cases from increasing consumption of foods rich in sugar and fatty milk products
and, therefore, it does not correlate positively with increasing wholesomeness of the diet. The
critical vitamins and minerals in the present study were the same as in most of the western dietary
surveys which have examined pregnant women during the last decade (Table 11). Overall, surveys
using FFQ as the dietary assessment method have not found as many critical nutrients as surveys
using food records (Table 11). This is most likely due to the tendency of FFQs to overestimate
nutrient intake, and therefore, the nutritional guidelines should not rely only on information
obtained from FFQs. Some of the estimated differences in food consumption according to the

98
length of education might reflect a tendency of well educated women to report their food intake,
particularly the consumption of fruits and vegetables, in a socially desirable way.
The use of dietary supplements has become more common over time, and pregnancy seems to be an
additional motivation to increase their use. According to the two most recent studies among Finnish
pregnant women (study II and unpublished data of Arkkola et al.), the use of supplements does not
target those nutrients with the highest risk of insufficient intake. In the present study II, only 31% of
the women had taken vitamin D supplements. In the light of that result, the milk fortification, which
started in February 2003, will be able to provide an important source of vitamin D to supplement the
diet of Finnish pregnant women. The folate intake of Finnish women is not adequate for those who
want to become pregnant (Alfthan et al. 2003); a finding which is common in many other countries as
well (Table 11). The stricter implementation of recommendations on supplements before and during
pregnancy might not be sufficient to reach the risk groups, young and less educated women. If future
research confirms the hazards (known and potential) of an inadequate intake of dietary folate, the food
fortification will surely need to be considered. It may also be debated if the same dietary
recommendations are sufficient for such a heterogeneous group as Finnish pregnant women; specially
focused additional recommendations could benefit some sub-groups.

Tab
le 1
1. D
ieta
ry su
rvey
s on
preg
nant
die
t in
deve
lope
d co
untr
ies p
ublis
hed
in 1
995
– 20
05, (
FR =
food
reco
rd, F
FQ =
food
freq
uenc
y qu
estio
nnai
re)
Yea
r, c
ount
ry
Subj
ects
T
rim
este
r D
ieta
ry m
etho
ds
Nut
rien
ts n
ot m
eetin
g re
com
men
datio
ns
Impa
ct o
f so
ciod
emog
raph
ic fa
ctor
s R
efer
ence
1995
, Nor
way
38
Pak
ista
ni
imm
igra
nts a
nd
38 N
orw
egia
ns
II
FFQ
V
itam
in D
Pl
ace
of o
rigin
; Pak
ista
nis h
ad
low
er d
ieta
ry in
take
and
tota
l in
take
(inc
l sup
plem
ents
) of
vita
min
D
Hen
rikse
n et
al.
1995
1997
, Hun
gary
70
wom
en
I, II
, and
III
FFQ
+ F
R
Thia
min
e, ri
bofla
vin,
py
ridox
ine,
nia
cin,
cal
cium
, iro
n an
d zi
nc.
- A
ntal
et a
l. 19
97
1998
, UK
11
923
resi
dent
s in
the
sout
h-w
est o
f Eng
land
. II
I FF
Q
Ener
gy, i
ron,
mag
nesi
um,
pota
ssiu
m a
nd fo
late
. In
com
e; th
e qu
ality
of d
iet i
n pr
egna
ncy
falls
with
in
crea
sing
diff
icul
ty in
af
ford
ing
food
.
Rog
ers &
Em
met
t 19
98,
Rog
ers e
t al.
1998
1998
, Fin
land
11
8 w
omen
in th
e no
rth
of F
inla
nd
III
2 x
5-da
y FR
V
itam
in D
, fol
ate,
iron
, and
th
iam
ine.
Y
oung
, les
s edu
cate
d an
d sm
oker
s hav
e th
e bi
gges
t ris
k of
not
mee
ting
the
diet
ary
reco
mm
enda
tions
.
Erkk
ola
et a
l. 19
98
2000
, Ohi
o;U
SA
59 a
dole
scen
ts a
nd
97 a
dults
par
ticip
atin
g in
a ra
ndom
ized
clin
ical
ca
lciu
m tr
ial
II a
nd II
I 2
x 7-
day
FR
Ener
gy, i
ron,
zin
c, c
alci
um,
mag
nesi
um, f
olat
e, a
nd
vita
min
s D a
nd E
.
- G
idde
ns e
t al.
2000
2001
, Sw
itzer
land
38
1 w
omen
II
and
III
Que
stio
nnai
re o
n su
pple
men
t use
- H
ess e
t al.
2001
2002
, N
orth
-C
arol
ina;
USA
2063
wom
en
parti
cipa
ting
in th
e Pr
egna
ncy,
Infe
ctio
n,
and
Nut
ritio
n (P
IN)
Stud
y
II
FFQ
Fo
late
and
iron
W
omen
>30
yea
rs o
ld, >
350%
of
pov
erty
, nul
lipar
ous a
nd
high
scho
ol g
radu
ates
had
hi
gher
ove
rall
Die
t Qua
lity
Inde
x fo
r Pre
gnan
cy sc
ores
.
Bod
nar &
Sieg
a-R
iz
2002
; Si
ega-
Riz
et a
l. 20
02
2003
, Fl
orid
a;U
SA
63 lo
w ri
sk w
omen
I,
II, a
nd II
I 9
x 3-
day
FR
Iron
, mag
nesi
um, z
inc,
vita
min
B
6, se
leni
um, a
nd v
itam
in C
. -
Turn
er e
t al.
2003
99

100
6.3 Goals of infant feeding have not been achieved
The goals for infant feeding have not yet been achieved in Finland (IV, V). The median duration of
exclusive breastfeeding is more than 4 months shorter than the recommendation (1.5 vs. 6 months),
(WHO 2003, Hasunen et al. 2004), and that of total breastfeeding half a year less than the Finnish
recommendation (6 vs. 12 months), (Hasunen et al. 2004). Only 37% of the infants were introduced
to complementary foods no earlier than at the age of 4 months, and thus only this percentage
adhered to the national recommendation (Hasunen et al. 2004). The weaning process seems to be
strongly influenced by sociodemographic characteristics; with high parental education, older
maternal age and infant’s female gender predicting later introduction of complementary foods.
The new method developed for studying the age at introduction of complementary foods among
DIPP-infants seemed to function well. The age at introduction of foods as an exposure is easier to
measure and is not so easily biased as is encountered for example with quantitative measurements of
foods. However, the time windows for exposure of most food groups are narrow in Finland, and it
could make the analyses less sensitive for detecting relations between the time at first exposure and
the endpoint variables. The questionnaire on the age at introduction of complementary foods does not
require high literal skills or burden parents to the same extent as other diet recording methods.
Our findings on the duration of exclusive breastfeeding are in line with the results from other
Finnish studies completed between 1995 and 2000 (Figure 14; Hasunen et al. 1996, Tepora et al.
1999, Sihvola 2001, Hasunen 2002). The studies of Hasunen (1996; 2002) represent data from
national surveys, whilst others come from local surveys (Tepora et al. 1999, Sihvola 2001). The
breastfeeding trends based on studies IV and V, show that a subcohort (12%) of a larger cohort (IV)
gave us a very similar figure on the duration of breastfeeding as obtained with a larger cohort (V).
The figure based on the regional study of Sihvola (2001) differs from the others and demonstrates

101
that consistent education and motivating professional support provided by maternal clinics can have
a positive impact.
The impact of hospital feeding on the duration of exclusive breastfeeding was smaller than
expected. The proportion of infants requiring supplementary milk (donated breast milk or infant
formula) at the maternity ward in our study was markedly smaller (71% vs. 87%) than the
proportion reported in a large prospective study (Saarinen et al. 1999) which was conducted in the
Helsinki region about 2 years before the beginning of our study. However, the Finnish infants are
rarely introduced to infant formula in the maternity ward in comparison to other countries. For
example: more than 80% of infants received infant formula during their first days in the hospital in
Denmark (Michaelsen 1997), whilst only 9% of mothers in our study could recall formula being
given to their offspring (V).
0
10
20
30
40
50
60
70
80
90
100
1 2 3 4 5 6
Months
%
1995 Hasunen et al.1997 Tepora et al.1997 Sihvola2000 Hasunen1996 - 2001 Study V
Figure 14. Exclusive breastfeeding in Finnish studies 1995 – 2001 (% of all infants)

102
When one reviews Finnish breastfeeding studies during the last 70 years, it can be appreciated that
the set goal of 6 months’ exclusive breastfeeding has been difficult to achieve even in the form of
total breastfeeding for most of the mothers (Figure 15). After the catastrophic decline in the 1970’s
attributable to the improved availability of alternative feeding methods (infant formulas became
available in Finland in 1974), increasing migration to urban areas, and greater employment of
women, the breastfeeding trend has been positive until the 1990s.
Figure 15. Proportion of children breastfed for at least 6 months in Finnish studies from 1933 to 2001(1, 2.(1 If there is more than one result from the same year, the one with the highest number of subjects or not being an intervention study has been chosen. (2 References: Salmi 1944, Hallman et al. 1952, Hultin et al. 1977, Verkasalo 1980, Verronen et al. 1981, Kalavainen 1984, Pakarinen & Priha 1984, Kumpula et al. 1994, Hasunen et al. 1996, Räisänen et al. 1998, Tepora et al. 1999, Hasunen 2002)
The age at introduction of complementary foods is strongly associated with the duration of
breastfeeding as shown in our studies and supported by results from earlier studies (e.g. Dubois et
al. 2003, Lande et al. 2003). The new recommendation to start introducing complementary foods at
the earliest of 4 months of age was set in Finland after the country joined the European Union
(Sosiaali- ja terveysministeriö 1994). According to nationwide surveys in 1995 and 2000 (Hasunen
0
10
20
30
40
50
60
1920 1930 1940 1950 1960 1970 1980 1990 2000 2010YEAR
%
Salmi
Salmi
Hallman et al.
Verkasalo
VerkasaloHultin et al.
Pakarinen & Priha
Verkasalo
Verronen et al.
Kalavainen
Räisänen et al.
Kumpula et al.
Hasunen et al.
IV
Tepora et al. Hasunen
V

103
et al. 1996, Hasunen 2002) and the present studies, Finnish mothers have succeeded in delaying the
average age of starting complementary feeding from the previous peak age of 3 months towards to a
new peak of 4 months. This clear milestone for the first introduction of complementary foods is
something of a Finnish phenomenon; the variation around the age at starting complementary
feeding is wider in other European countries (Savage et al. 1998, Euro-Growth Study; Freeman et
al. 2000, Lande et al. 2003). For most of the infants, cow’s milk protein is the first protein
introduced when beginning the use of infant formula. After the first six months, infants are
surprisingly often given cow’s milk in the form of regular milk products even though unmodified
cow’s milk is believed to be unsuitable for infants until 12 months of age. The long tradition
favouring the use of milk products in Finland might partly explain their early introduction. Early
introduction of cow’s milk has been associated with the risk of T1D (Virtanen & Knip 2003) and
some allergic diseases (Chandra 2002), although not consistently. However, no associations were
found between all of the measures of cow’s milk exposure used and the autoantibody endpoints in
the present study (V).
Socioeconomic differences in the diets of Finns start to develop already in pregnancy and the trend
seems to continue in infancy and thereafter; the youngest and less well educated groups exhibit a
greater risk of not following dietary advice. This is not only a Finnish phenomenon; similar findings
have been reported in several studies among pregnant women and infants in other Western countries
(Michaelsen 1997, Savage et al. 1998, North et al. 2000, Hörnell et al. 2001, Yngve and Sjöström
2001b, Dubois et al. 2003, Lande et al. 2003, Vingraite et al. 2004). A poor diet in pregnancy,
commonly correlating with smoking, leads to a greater risk of low birthweight babies, shorter
pregnancy, and possibly predisposes the infant later to diseases such as coronary heart disease and
diabetes as he/she enters adulthood. During infancy, the children born to less educated and young
women have a greater risk of being breastfed for a shorter time and introduced to complementary
food earlier than recommended (Tepora et al. 1999, IV, V). This may increase the risk for some

104
diseases (e.g. T1D, allergies) and perhaps can influence the neurocognitive development (Anderson
et al. 1999, Chandra 2002, Ivarsson et al. 2002, Jain et al. 2002, Owen et al. 2002; 2003; 2005,
Virtanen & Knip 2003). The potential to achieve an enormous health gain through improved diet in
pregnancy and infancy is unquestionable and, therefore, it should be encouraged at all levels of our
health care system. It is a challenge in Finland, as well as in most Western countries, to develop
strategies to improve the diet of families having young and less educated parents. Based on the
present study and some earlier reports (Räsänen & Ylönen 1992, Simell et al. 2000, Hasunen 2002)
gender differences in infant feeding do exist in Finland and their possible consequencies require
further investigation.
Finland has long been recognized for its excellent maternal and child health care and the high
quality of the educational system. There seems to be a dark cloud obscuring the light behind these
outstanding statistics; young and less educated families are not able, or in some cases not willing, to
seek the full benefit of the maternal and child health care system. Issues related to the recommended
diet during infancy and beyond should be included in the basic school curriculum. There is a good
channel that could be used in Finland; all girls and boys in the 7th grade have home economics
lessons for one year. The introduction of issues related to breastfeeding and weaning at that stage
could particularly target and benefit prospective young families. Increasing the awareness of boys is
important, as support from the male partner has been shown to be the most important factor for
initiating breastfeeding (Baranowski et al. 1983).
There is an urgent need in Europe to develop a valid, comparable surveillance system for infant
feeding which uses common definitions and methodology. Because of this, it is difficult to compare
and assess the results from different studies in this area. Overall the situation in Scandinavia appears
better than that in the Southern European countries; more than half of the infants have been at least
partially breastfed for at least 6 months in Denmark, Sweden, Norway, and Finland, a goal which is

105
seldom achieved in other European countries (Michaelsen 1997, Freeman et al. 2000, Yngve and
Sjöström 2001a, Lande et al. 2003, IV and V). The global goal of exclusive breastfeeding for the
first 6 months followed by partial breastfeeding until the end of the second year and for longer,
defined by WHO and UNICEF (UNICEF 1999, WHO 2003) does seem to be unachievable in
Finland as well as in most other Western societies. It has recently been questioned in Finland, if the
unachievable recommendation of 6 months’ exclusive breastfeeding without any clear scientific
evidence for its benefits in developed countries will decrease the overall willingness of mothers and
health care personnel to follow nutritional recommendations in infancy (Savilahti 2005). However,
trends point towards higher prevalence and duration of breastfeeding though there are some
exceptions (Yngve and Sjöström 2001a).
6.4 New perspectives on antibody responses; Do milk products differ in their effects on cow’s milk antibody responses?
In the unique intervention setting, few relationships were detected between the maternal
consumption of different types of milk products and the antibody response to specific cow’s milk
proteins in the offspring (III). An inverse association was found between maternal intake of cheese
during pregnancy and lactation and the humoral immune response to cow’s milk proteins in the
offspring. Accordingly, a positive relation between maternal intake of raw milk proteins during
lactation and the antibody response to cow’s milk proteins in infants at 6 months was converted to
an inverse relationship at 2 years of age. Thus, this study introduced a novel perspective into
research on cow’s milk antibodies in infants and young children.
Children belonging to the intervention group in TRIGR were not exposured to other cow’s milk
proteins except breast milk during the first 6 months of life, which provided us with an excellent
basis to study the impact of maternal cow’s milk consumption on the humoral immune response to
cow’s milk proteins in the offspring. To our knowledge, there are no comparable studies in the field
of cow’s milk antibodies. There are no other studies in which milk products have been separated
106
according to their type of processing, which we subdivided into high casein group (cheese) vs. all
milk proteins (raw milk products). The maternal diet during lactation was more strongly associated
with cow’s milk antibody titers in the offspring than with the diet during pregnancy. High levels of
cheese consumption were inversely associated with antibody titers until 6 months of age, whereas a
high consumption of raw milk products appeared to decrease the antibody titers later. Maternal
protein intake from raw milk products was inversely related to protein intake from cheese. These
findings might imply that raw milk products are the true effecters, and the impact of maternal
cheese intake on the antibody titers in infants is mediated via the intake of raw milk products.
Our study confirmed the connection between IgG antibodies in the maternal circulation and those
found in cord blood (Sarvas et al. 1993, Malek et al. 1996). Finnish women seem to increase their
consumption of milk products during pregnancy and lactation (I - III vs. Kleemola et al. 1994 and
Männistö et al. 2003). Maternal protein intake from raw milk products and cheese tended to inhibit
the humoral immune responses to cow’s milk proteins in the offspring; cheese during the first 6
months and raw milk later, around 2 years of age (III). This raises the issue of whether cow’s milk
proteins transferred through placenta and/or breast milk could induce tolerance to cow’s milk
proteins in the offspring. The rather narrow range in the consumption of different milk products
among mothers, probably partly caused by a flat-slope syndrome (large portions of food are
underestimated and smaller portions are overestimated), could have made the analyses less sensitive
for detecting any such effects. The increased levels of cow’s milk antibodies in subjects with T1D
could be an epiphenomenon of an insult and immunization caused by cow’s milk proteins, which in
some genetically susceptible individuals may lead to T1D after a long but variable time interval
(Åkerblom et al. 1996). However, it is definitely premature to issue dietary advice on the
consumption of milk products by pregnant and lactating women in an attempt to limit the
development of T1D even in high risk offspring. The evidence that T1D associated autoantibodies
may start to emerge early in infancy (Ziegler et al. 1999, Kimpimäki et al. 2001b), and that some

107
intrauterine environmental factors having links to the diet are related to the risk of T1D emphasize
the importance of studying early dietary risk predictors.
6.5 New findings observed in the largest T1D focused birth cohort study challenges future studies
Large sample size and a long follow-up are needed in studies examining potential nutritional factors
in the etiology of T1D due most likely to the lengthy period of time between exposure and outcome,
the imprecise quantification of exposure measurements and important covariates, and the complex
intercorrelation of dietary exposures. In the largest prospective cohort series so far reported, an
early age ( 4 months) for the introduction of fruit and berries and introduction of roots between 3
to 4 months of age were related to the risk of advanced -cell autoimmunity (V). The numbers of
autoantibody endpoints were markedly larger than in other birth cohort studies (Table 12), but still
slightly too small to provide precise risk estimates.
The collection of dietary data before the development of the autoantibody endpoint excluded the
possibility of differential bias in the selection of subjects and recall bias in the reporting dietary
habits. It could also be questioned if our questionnaires allow families to specify foods given to
their infants adequately enough to be able to identify potential interesting aspects in the etiology of
T1D. This is a basic question in long-term dietary studies in which all the dietary factors of interest
are not known at the starting point. The major limitation of our study is that only information on the
age at introduction of new foods, but not on the amounts of foods consumed could be studied.
Whether age at introduction of foods is related to later food consumption patterns is not known. The
surprising finding on fruits and berries, foods that are considered healthy, as potential nutritional
risk factors in the etiology of T1D is the result on a comprehensive cohort study in a well-defined
study population with a high participation rate. It needs to be taken into consideration in future
studies on the etiology of T1D.
108
The steep increase in the incidence of T1D most likely reflects changes in lifestyle and environmental
factors. Dietary exposures measured in study V can act at least partly as proxies for other life style
characteristics, and therefore it would be necessary to try to identify broader behavioural patterns
behind the early introduction of fruits, berries and roots, which were related to emergence of early -
cell autoimmunity in our study. Sociodemographic characteristics associated with early introduction
of these foods were young maternal age, less extensive education, maternal smoking, male gender of
infant, small number of siblings, caesarean section and Oulu as the area of birth. There are inter-
relationships between some of these characteristics, since the education of young people is in many
cases still continuing and the number of children (i.e. family size) will increase. The slight male
predominance in the incidence of T1D among white children (Karvonen et al. 2000) and the recently
reported male majority with signs of humoral -cell autoimmunity (Williams et al. 2002) provided us
with an interesting perspective when examining gender differences in infant feeding. Given that boys
are breastfed for a shorter time and introduced to complementary food earlier than girls, one could
propose the hypothesis that there is a relation between earlier exposure to foreign proteins in boys and
possibly increased weight gain induced by complementary feeding, and the greater incidence of T1D.
According to case-control findings, rapid weight gain in infancy and early exposure to cow’s milk are
both independent risk predictors of T1D (Hyppönen et al. 1999). These hypotheses, however, need to
be confirmed in further investigations. Among the other characteristics associated with early
introduction of fruits and berries and roots in our study, younger maternal age and maternal smoking
during pregnancy have been linked to reduced risk of T1D in earlier studies (Blom et al. 1989,
Dahlquist & Källén 1992, Patterson et al. 1994, Dahlquist et al. 1999, McKinney et al. 1997, Stene et
al. 2004). The impact of education has been controversial (e.g. Virtanen et al. 1998, Sipetic et al. 2004,
Sepa et al. 2005).
If early consumption of fruits, berries and/or roots itself has a real relationship with the risk for
early and/or more advanced -cell autoimmunity, we need to focus on the nature of the food

109
components. All of the food components are not necessarily nutrients (e.g. they may contain natural
or synthetic toxins) and therefore complete food composition data may not be available. The hidden
cause could also be another item used in some industrial food processing. For example; rice starch
is commonly used in the manufacture of fruit and berry purees for children. There is increasing
evidence that gut-associated lymphoid tissue is involved in the development of T1D and since the
immune defence mechanisms of the infant gut mature with age (Vaarala 1999), the putative dietary
regulation of autoimmunity may well depend on age. There is an urgent need in Finland for further
studies to elucidate if the frequent use of manufactured baby foods and their “hidden constituents”
have any impact on the developing gut and immune system of infants. It may also be questioned if
it would be better to serve fruits and berries, as well as other foods, as such, instead of in the form
of the processed pulp present in ready-to-eat manufactured baby foods.
There are altogether four birth cohort studies which have focused on nutrition in the etiology of
T1D (Table 12). BABYDIAB studies (Couper et al. 1999, Hummel et al. 2000, Ziegler et al. 2003)
have focused mainly on breastfeeding patterns, while a wider selection of maternal and infant
dietary variables was included in DAISY (Norris et al. 1996; 2003, Fronczak et al. 2003) and DIPP
studies (Kimpimäki et al. 2001a, Kupila et al. 2001). In the DAISY and BABYDIAB studies
positivity already for a single autoantibody specifity was used as an endpoint in the reported results
so far, even though that represents, in most cases, harmless nonprogressive -cell autoimmunity.
Our study differs from the others in that we used as an endpoint repeated positivity for ICA plus at
least one other autoantibody, which reflects more advanced and stable beta-cell autoimmunity than
positivity for only one autoantibody. Unlike the statistical analyses used in previous comparable
studies (inadequately described in some of these studies), we have accommodated between-sibling
dependence through a frailty model, and in addition to interval censoring of the seroconversion
times in the model, we have accounted for the time-dependent nature of the principal explanatory

110
variables. Accordingly, as in the present study (V), several sociodemographic variables have been
taken into account as possible confounding factors only in the DAISY Study.
Table 12. Birth cohort studies on nutrition in the etiology of pretype 1 diabetes (1
Study and the location
BABYDIAB Germany
BABYDIABAustralia
DAISY Colorado, US
DIPP Nutrition Finland
The year of study start
1989 1993 1994 1996
Setting Newborns of parents with T1D.
Newborns with first-degree relative of T1D
Newborns with an increased genetic risk of T1D or first-degree relatives of T1D individuals
Newborns with an increased genetic risk of T1D
Blood samples At birth, age 9 months, 2, 5, and 8 years.
Taken at six months intervals.
At ages 9, 15, and 24 months and yearly thereafter.
Taken at 3 to 12 months intervals.
Endpoint used At least one of IAA, GADA, IA-2A, ICA
One of IAA, GADA, IA-2A, one repeatedly
At least one of IAA, GADA, IA-2A
Repeated positivity for ICA and at least one of IAA, GADA, IA-2A
Dietary methods; pregnant and infant diet
Prospective questionnaire (the length of breastfeeding)
Home diary Age at introduction of new foods interview form
Lactation: FFQ Children: A follow-up record on introducing new foods, age specific structured questionnaires (3, 6, 12, 24 mo).
(1References: German BABYDIAB: Hummel et al. 2000, Ziegler et al. 2003 Australian BABYDIAB: Couper et al. 1999 North American DAISY: Norris et al. 1996, Fronczak et al. 2003, Norris et al. 2003 Finnish DIPP: Kimpimäki et al. 2001a, Kupila et al. 2001, (V)
Previous cohort studies of children with increased genetic risk have reported associations between
age at introduction of cereals and the development of an early and potentially reversible beta-cell
autoimmunity, i.e. positivity for at least one autoantibody (Norris et al. 2003, Ziegler et al. 2003).
However, we did not observe a significant association between age at introduction of cereals and

111
the development of ICA plus at least one other autoantibody. The findings of the birth cohort
studies showed no association between breastfeeding or age at introduction of complementary milk
feeding and the emergence of up to three autoantibodies. In our earlier study among DIPP- infants,
short-term exclusive breastfeeding and the early introduction of complementary milk feeding were
related to an increased risk of developing all four autoantibodies and IA-2A (Kimpimäki et al.
2001a). This inconsistency could be a result of the different study design (cohort vs. case-control),
or a chance finding. The cohort study could be considered as being more comprehensive because of
its higher number of endpoints, extensive statistical methods, and more accurate dietary data
collection. It should be noted, however, that the prospective studies done so far have been
underpowered for the detection of such low risk ratios (about 1.5) as have been observed in case-
control studies. However, it is noteworthy that in the present study when one includes only those
children with a first-degree relative with diabetes, then a positive association of borderline
significance was observed between early introduction of cow’s milk and the increased risk of
developing ICA (V).
6.6 The inferences drawn cannot be stronger than the weakest part of the study; Evaluating
selected issues in studies I – V
The distribution of subjects in studies I and II by age and education were comparable to Finnish
pregnant women in general (Meriläinen et al. 1995). However, the dietary habits of women living in
Oulu region might differ from women in other areas in Finland (Nummela et al. 2000). According
to the Findiet 2002 study, the use of fresh vegetables is lower in the Oulu province compared to
other areas (Männistö et al. 2003). Nonetheless, we consider the subjects in studies I and II to
represent rather well Finnish pregnant women in general. In studies III, IV and V, the children were
genetically susceptible index children. In addition subjects in study III needed to have first-degree
relative/s affected by T1D. The cohort of infants in studies IV and V is expected to be

112
representative of the population of Finnish infants, whereas the subjects in study III could more
clearly be seen as representatives of the children having a major risk for T1D.
A complicated and cumbersome dietary method might have increased the number of dropouts in
some of our present studies (e.g. in the validation study). However, the participation rates in the
present validation study are high in comparison to other validation studies done in pregnant women;
the percentages in other studies having ranged from 45 to 60% (vs. 80% in our study) of those
invited (Brown et al. 1996, Wei et al. 1999, Fawzi et al. 2004). The validity of the cohort study is
related to the completeness of the follow-up (Freudenheim 1999). People willing to participate in a
cohort study may be more interested in health and health practices than the average individual and
therefore may have different dietary practices from the general population. A highly selected study
population (i.e. those still remaining at the end of long-term studies) could lead to minimized
dietary exposure contrasts, which can decrease the informativeness of the epidemiologic studies.
The follow-up rates in four birth cohort studies on nutrition in the etiology of pretype 1 diabetes
(Table 12) are difficult to compare because of deficient and incoherent information provided in the
published articles (Norris et al. 1996, Couper et al. 1999, Hummel et al. 2000, Kimpimäki et al.
2001a, Kupila et al. 2001, Fronczak et al. 2003, Norris et al. 2003, Ziegler et al. 2003). Scientific
journals should develop comparable methods for reporting follow up rates and include them in the
requirements for submitted manuscripts. It is almost impossible to make direct numerical
comparisons of participation rates between the DIPP Nutrition study cohort and other birth cohorts.
It is mentioned in the article of Hummel et al. (2000) that 82% of recruited children in German
BABYDIAB Study participated in the 2-year follow-up visit (vs. 68.3% followed up to 2 years in
the present study). However, it is difficult to obtain a clear picture of the baseline participating rates
in the German BABYDIAB Study (Hummel et al. 2000, Ziegler et al. 2003). The DAISY Study
(Norris et al. 1996; 2003, Fronzak et al. 2003) and the Australian BAYDIAB Study (Couper et al.
1999) report only median ages at follow up.

113
In the DIPP Nutrition study there is a risk that the knowledge of increased genetic risk would affect
food choice. The impact of possible health behaviour changes on the diet of the DIPP-infants, if
any, may be strongest at the very start of follow-up time, immediately after obtaining information
about increased risk (Bennett Johnson & Tercyak 1995). This is usually the period of full
breastfeeding or/and formula feeding. The health behaviour changes might favour breastfeeding,
which in accordance to the National nutrition recommendations for infants (Hasunen et al. 2004).
However, the length of exclusive and total breastfeeding among DIPP-children was very similar to
that of Finnish infants in general (Hasunen 2002). All the nutritional guidance given to families was
based on the National nutrition recommendations for infants (Hasunen et al. 2004) and was kept as
neutral as possible.
114
7. Conclusions; Implications on public health and future perspectives
The validity and reproducibility of our food frequency questionnaire were found to be reasonably
good to be used as a dietary instrument, which could be administered after delivery to effectively
study the putative effects of the maternal diet during pregnancy on the development of T1D. This
validity study represents an internationally important addition to the methodology of studies on diet
during pregnancy. Pregnancy seems to be an incitement for dietary over reporting. Since it is
possible that the extensive FFQ used to assess diet is also subject to over reporting, the observed
absolute intakes should be viewed with caution. In long-term cohort studies, the FFQ should be
continuously updated due to new foods becoming available over the duration of the study and
changes in dietary patterns. Improving the grouping of those foods and nutrients subjected to the
greatest misclassification should be considered. A new validation study will be required for every
revised version.
A balanced diet will meet the increased nutrient requirements during pregnancy, with the exception
for some critical nutrients: vitamin D, folate, and iron. The quality of diet during pregnancy should
be improved by increasing of the consumption of whole grain cereals, vegetables, and fish, and
decreasing of the consumption of foods rich in sugar and saturated fat. Supplementation is needed
to ensure an overall adequate intake of iron and vitamin D. The use of dietary supplements
increases during pregnancy, but their use tends to be focused on the wrong nutrients. Milk
fortification provides an important additional source of vitamin D into the diet of Finnish pregnant
women. Future challenges include ensuring an adequate folate intake among women of childbearing
age and during pregnancy, levelling the dietary inequalities existing between pregnant women with
different sociodemographic characteristics, and preventing the trend to greater pregnancy weight
gain in Finland and the prevalence of obesity accelerated by pregnancy. There have been few
dietary surveys conducted in Finnish pregnant women and these should be done regularly so that we
are able to detect new and emerging problems, and to ensure that the advice is up-to-date. The need

115
for consistent assessment is also emphasized by the complex relationship between maternal
nutritional and birth outcomes and possible lifelong consequences. Promoting the health and
nutrition of women of reproductive age could be considered as one way to circumscribe health
problems in future generations.
The duration of breastfeeding in Finland is considerably shorter than recommended. Compliance is
relatively poor with the current recommendations on the timing of the introduction of first
complementary food and dairy products. Feeding infant formulas in the maternity wards does not
compete with breastfeeding. The diet during infancy is strongly influenced by the extent of parental
education, maternal age, and infant’s gender. The potential for achieving marked health gains
through improved diet in pregnancy and infancy should be encouraged at every level of our health
care system as well as in basic school education to prevent the development of even wider
sociodemographic dietary differences. Gender differences in infant feeding and their possible health
consequences should be further investigated. The dispersed local data on infant feeding in Finland
should be pooled to create national databases and linked to an international follow-up. This would
require the establishment of nationally and internationally comparable surveillance systems, which
would have common definitions and would use similar methodology. It is recommended that this
should be started at the national level.
We introduced a new approach to the research into cow’s milk antibodies in infants and young
children. Few associations were established between maternal cow’s milk protein intake during
pregnancy and lactation and cow’s milk protein antibody levels in the offspring. The milk and milk
products taken by the mother seem to slightly differ in their impact on the emerging cow’s milk
antibody response in the offspring. Protein intake from raw milk products and cheese tend to
slightly inhibit the humoral immune response to cow’s milk proteins in the offspring; i.e. cheese
during the first 6 months and raw milk later, close to 2 years of age, the impact being stronger

116
during lactation than during pregnancy. Further studies are needed to confirm whether cow’s milk
proteins transferred through the placenta and breast milk could induce tolerance to cow’s milk
proteins in the offspring, and to identify the possible pathogenic role of increased levels of cow’s
milk antibodies in subjects with T1D.
T1D is the second most important public health concern in Finnish children after allergies and
asthma and its prevalence in Finland is the highest in the world. Nutrition may play a major role in
the development of T1D. In the largest prospective cohort series so far reported, an early age at
introduction of fruit and berries was related to the risk of advanced -cell autoimmunity. The
finding is a totally new discovery. The next step is to assess whether the finding can be replicated
and if so, whether these foods are proxies of other life style characteristics, or whether there is a true
causal relationship. The study design should be repeated when a larger number of autoantibody
endpoints becomes available. Although more studies are needed to confirm the present findings, the
conclusion can be drawn that the risk of pre-type 1 diabetes and T1D could be reduced by following
the current national guidelines on age at introduction of complementary foods. In future studies,
data on infant feeding should be linked to data on maternal nutrient intake during pregnancy as well
as with data on other environmental factors (e.g. viral infections) to identify possible interactions
among these parametres. Given the relatively low prevalence and the fact that the disease is most
likely multifactorial, the long-term diet is of interest when studying diet-based relations of T1D.
The DIPP study is emerging as the most comprehensive birth cohort study so far and its potential
for providing answers to open questions in the etiology of T1D continues to expand. Despite the
fact that findings from well-conducted cohort studies carry considerable weight in the
epidemiologic literature, no single study in itself can be definitive. Multiple studies taken together
and new innovative designs, models and methodologies are needed for future research settings.

117
8. Acknowledgements
The present work was carried out in the Tampere School of Public Health, the University of Tampere, and in the Nutrition Unit of Department of Epidemiology and Health Promotion, National Public Health Institute, Helsinki. Study III was done in collaboration with the laboratory of Hospital for Children and Adolescents, University of Helsinki.
I was fortunate to have two great and totally different personalities as my supervisors. I am greatly indebted to Suvi Virtanen who introduced me to research on nutritional epidemiology, and despite my nomadic lifestyle, continuously encouraged me all the way. She is a living example of a hard working and dedicated researcher who will never fail to search for the missing pieces in scientific puzzles. I also greatly appreciate her goals to make honest and ethically acceptable science. My work owes much to the innovative example given by my other supervisor, Pirjo Pietinen. If I would need to name one individual to defend the whole field of nutritional epidemiology in Finland, she would be my chosen champion. I wish to thank you for your stimulating thoughts concerning my work as well as other aspects of a woman’s life.
I express my warm thanks to Mikael Knip and Marja-Leena Ovaskainen for being my ”shadow supervisors” in the form of a follow-up group. When sending manuscripts to co-authors I could always be sure that Mikael will be the first one to reply with the most comprehensive and incisive editing. Despite his amazing effectiveness, he never forgets to pass on some encouraging comments with a smile. I had the possibility to base my nutritional calculations on databases built by Marja-Leena and in that way, I could guarantee that I was using the very best knowledge on that area in Finland. In the initial phases of my researches, she made me realize just how much hard work lies behind these average nutritional contents, and our cooperation has always been fruitful.
Satu Männistö and Ilkka Sipilä are warmly acknowledged for promptly reviewing the manuscript of my thesis and for their constructive criticism as well as supportive comments. My appreciation goes also to Ewen MacDonald who preferred to review the English language of this thesis instead of watching the World Championships in athletics in Helsinki.
The principal investigator of the TRIGR study Hans Åkerblom and those of the DIPP study Olli Simell, Mikael Knip and Jorma Ilonen are warmly thanked for providing me with the possibility to do this thesis in connection with their studies. I would like to especially acknowledge all the co-authors of the original papers. In particular, I wish to thank Erkki Savilahti and Mike Kenward for sharing their valuable time and expertise. I am also thankful for Timo Hakulinen, the former head of the Doctoral School of Public Health for his support and flexibility on my continuously changing working environments.
This study was financially supported by personal grants from the Doctoral School of Public Health, the Finnish Association of Academic Agronomists (Agronomiliitto), the Juho Vainio foundation, and the Yrjö Jahnsson foundation. All are gratefully acknowledged.
“Nemo solus satis sapit - No man is wise enough by himself.” I wish to express my thanks and appreciation to all researchers, workers and families in the TRIGR and the DIPP studies for the excellent collaboration during these years. It has been a pleasure to work in the DIPP project, particularly with the first inspiring group of young nutritionists: Carina Kronberg-Kippilä, Liisa Uusitalo, and Paula Virta-Autio, with whom the meetings were always rewarding and never really felt like work. I am also deeply grateful to my colleague, Carina Kronberg-Kippilä, for helping me uncomplainingly on numerous issues during my years abroad, and for Susanna Kautiainen and Suvi Ahonen for their patient and practical help in Tampere. The group of former and present colleagues and friends at the Unit of Nutrition, National Public Health Institute deserves my special thanks, not only for all the nutritional, statistical, technical, and universal guidance, but also for the cheerful therapeutic moments over the years.

118
I owe my warmest thanks to my friends in Finland, Moscow, Copenhagen, and Accra for providing me with endless opportunities to ventilate work issues out of my head, ranging from relaxing moments in Sandunovskiy banya to picnics in Dyrehavnen and on the beaches of the Gulf of Guinea. Refreshing emails from friends always made my day while working alone abroad. I especially want to thank a friend from my youth, Sippi Ahonen, for sharing the ups and downs of my life, my skilful former teacher and a friend Tiina Toponen for inspiring me with a combination of nutrition and teaching, and a researcher friend in the field of forestry, Eija Juurola, for sharing the concerns in balancing the roles of being a mother of young children and a young scientist.
I express my dear thanks to my sisters and good listeners Riitta and Tiina, my other half: my twin brother Matti, my brothers-in-law Kalle and Lauri, and my sister-in-law Anna, all of whom, together with their growing lovely families, provided me with grass-root empirical experience on diet during pregnancy and infancy, and demonstrated that average statistics seldom appear in real life. I warmly remember my father-in-law Jokke, whom we lost too early. His wide knowledge and sharp comments would have been greatly appreciated at these times. I am particularly indebted to my mother-in-law Raila, who besides her constant support in everything I did, kept me in contact with poetry as well as other kinds of non-scientific literature, and let me to enjoy a stress free garden in Kotomäki. The warm social net of my relatives never failed when support was needed.
Äiti & isä ja Martta-täti, kiitos pyyteettömästä rakkaudestanne ja siunaavista ajatuksistanne! On suuri asia tietää, että teille riitän omana itsenäni.
My dearest thanks belong to my husband Taavi and my little assistants Eemeli, Adalmiina and Amanda, without whom this work could have possibly been done in half the time, but would be only half as valuable. You fill my days with enduring inspiration, challenging discussions, joyful moments, and most importantly, endless unreasoning love. I feel blessed to have you around me.
Accra, November 2005
9. References
Aarts C, Kylberg E, Hörnell A, Hofvander Y, Gebre-Medhin M, Greiner T. How exclusive is exclusive breastfeeding? A comparison of data since birth with current status data. Int J Epidemiol 2000;29:1041-6.
Adams JS, Lee G. Gains in bone mineral density with resolution of vitamin D intoxication. Ann Intern Med 1997;127:203-6.
Al MD, van Houwelingen AC, Hornstra G. Long-chain polyunsaturated fatty acids, pregnancy, and pregnancy outcome. Am J Clin Nutr 2000;71(suppl):285S-91S.
Aldous MB. Nutritional issues for infants and toddlers. Pediatr Ann 1999;28:101-5.
Alfthan G, Laurinen MS, Valsta LM, Pastinen T, Aro A. Folate intake, plasma folate and homocysteine status in a random Finnish population. Eur J Clin Nutr 2003;57:81-8.
Allen L. Pregnancy and iron deficiency: unresolved issues. Nutr Rev 1997;55:91-101.
Andersen LF, Lande B, Arsky GH, Trygg K. Validation of a semi-quantitative food-frequency questionnaire used among 12-month-old Norwegian infants. Eur J Clin Nutr 2003;57:881-8.
Andersen LF, Lande B, Trygg K, Hay G. Validation of a semi-quantitative food-frequency questionnaire used among 2-year-old Norwegian children. Public Health Nutr 2004;7:757-64.
Anderson JW, Johnstone BM, Remley DT. Breastfeeding and cognitive development: a meta-analysis. Am J Clin Nutr 1999;70:525-35.
Antal M, Regoly-Merei A, Varsanyi H, Biro L, Sagi K, Molnar DV, Zajkas G, Nagy K, Avar Z, Biro G. Nutritional survey of pregnant women in Hungary. Int J Vitam Nutr Res 1997;67:115-22.
Arenz S, Ruckerl R, Koletzko B, von Kries R. Breast-feeding and childhood obesity--a systematic review. Int J Obes Relat Metab Disord 2004;28:1247-56.
Atkinson MA, Eisenbarth GS. Type 1 diabetes: new perspective on disease pathogenesis. Lancet 2001;358:221-9.
Bailey LB. New standard for dietary folate intake in pregnant women. Am J Clin Nutr 2000;71(suppl):1304S-7S.
Baker JL, Michaelsen KF, Rasmussen KM, Sorensen TI. Maternal prepregnant body mass index, duration of breastfeeding, and timing of complementary food introduction are associated with infant weight gain. Am J Clin Nutr 2004;80:1579-88.
Baranowski T, Bee DE, Rassin DK, Richardson CJ, Brown JP, Guenther N, Nader PR. Social support, social influence, ethnicity and the breastfeeding decision. Soc Sci Med 1983;17:1599-611.
Barker DJP, (ed.). Foetal and infant origins of adult disease. London: BMJ Publishing, 1992.
Barker DJ. The foetal and infant origins of disease. Eur J Clin Invest 1995;25:457-63.
119

Barker JM, Barriga KJ, Yu L, Miao D, Erlich HA, Norris JM, Eisenbarth GS, Rewers M; Diabetes Autoimmunity Study in the Young. Prediction of autoantibody positivity and progression to type 1 diabetes: Diabetes Autoimmunity Study in the Young (DAISY). J Clin Endocrinol Metab 2004;89:3896-902.
Barnett AH, Eff C, Leslie RDG, Pyke DA. Diabetes in identical twins. A study of 200 pairs. Diabetologia 1981;20:87-93.
Bateson P, Barker D, Clutton-Brock T, Deb D, D'Udine B, Foley RA, Gluckman P, Godfrey K, Kirkwood T, Lahr MM, McNamara J, Metcalfe NB, Monaghan P, Spencer HG, Sultan SE. Developmental plasticity and human health. Nature 2004;430:419-21.
Baum JD, Ounsted M, Smith MA. Weight gain in infancy and subsequent development of diabetes mellitus in childhood. Lancet 1975;2:866.
Beard JL. Effectiveness and strategies of iron supplementation during pregnancy. Am J Clin Nutr 2000;71(suppl):1288S-94S.
Bech BH, Nohr EA, Vaeth M, Henriksen TB, Olsen J. Coffee and fetal death: A cohort study with prospective data. Am J Epidemiol 2005;162:983-90.
Bennett Johnson S, Baughcum AE, Carmichael SK, She JX, Schatz DA. Maternal anxiety associated with newborn genetic screening for type 1 diabetes. Diabetes Care 2004;27:392-7.
Bennett Johnson S, Tercyak KP Jr. Psychological impact of islet cell antibody screening for IDDM on children, adults, and their family members. Diabetes Care 1995;18:1370-2.
Bergström L. Nutrient losses and gains in the preparation of foods. Report No. 32/1994. Sweden: National Food Administration, 1994.
Bingham SA, Welch AA, McTaggart A, Mulligan AA, Runswick SA, Luben R, Oakes S, Khaw KT, Wareham N, Day NE. Nutritional methods in the European Prospective Investigation of Cancer in Norfolk. Public Health Nutr 2001;4:847-58.
Bingley PJ, Bonifacio E, Williams AJK, Genovese S, Bottazzo GF, Gale EAM. Prediction of IDDM in the general populations: strategies based on combinations of autoantibody markers. Diabetes 1997;46:1701-10.
Bingley PJ, Gale EAM. Rising incidence of IDDM in Europe. Diabetes Care 1989;12:289-95.
Birsch LL. Development of food acceptance patterns in the first years of life. Proceedings of the Nutrient Society 1998;57:617-24.
Birch LL, Fisher JO. Development of eating behaviours among children and adolescents. Pediatrics 1998;101:539-49.
Black AE, Cole TJ. Biased over- or under-reporting is characteristic of individuals whether over time or by different assessment methods. J Am Diet Assoc 2001;101:70-80.
Bland JM, Altman DG. Comparing methods of measurement: why plotting difference against standard method is misleading. Lancet 1995;346:1085-7.
120

Bland JM, Altman DG. Measuring agreement in method comparison studies. Stat Methods Med Res 1999;8:135-60.
Blom L, Dahlquist G, Nyström L, Sandström L, Wall S. The Swedish childhood diabetes study – social and perinatal determinants for diabetes in childhood. Diabetologia 1989;32:7-13.
Bodnar LM, Siega-Riz AM. A Diet Quality Index for Pregnancy detects variation in diet and differences by sociodemographic factors. Public Health Nutr 2002;5:801-9.
Borch-Johnsen K, Joner G, Mandrup-Poulsen T, Christy M, Zachau-Christiansen B, Kastrup K, Nerup J. Relation between breast-feeding and incidence rates of insulin-dependent diabetes mellitus. A hypothesis. Lancet 1984;2:1083-6.
Bottazzo GF, Florin-Christensen A, Doniach D. Islet-cell antibodies in diabetes mellitus with autoimmune polyendocrine deficiencies. Lancet 1974;ii:1279-82.
Botto LD, Lisi A, Robert-Gnansia E, Erickson JD, Vollset SE, Mastroiacovo P, Botting B, Cocchi G, de Vigan C, de Walle H, Feijoo M, Irgens LM, McDonnell B, Merlob P, Ritvanen A, Scarano G, Siffel C, Metneki J, Stoll C, Smithells R, Goujard J. International retrospective cohort study of neural tube defects in relation to folic acid recommendations: are the recommendations working? BMJ 2005;330:571.
Boushey CJ, Beresford SA, Omenn GS, Motulsky AG. A quantitative assessment of plasma homocysteine as a risk factor for vascular disease. Probable benefits of increasing folic acid intakes. JAMA 1995;274:1049-57.
Brown JE, Buzzard IM, Jacobs DR Jr, Hannan PJ, Kushi LH, Barosso GM, Schmid LA. A food frequency questionnaire can detect pregnancy-related changes in diet. J Am Diet Assoc 1996;96:262-6.
Bruining GJ. Association between infant growth before onset of juvenile type 1 diabetes and autoantibodies to IA-2. Netherlands Kolibrie study group of childhood diabetes. Lancet 2000;356:655-6.
Brussaard JH, Lowik MR, van den Berg H, Brants HA, Goldbohm RA. Folate intake and status among adults in the Netherlands. Eur J Clin Nutr 1997;51(suppl):46S-50S.
Bunin GR, Gyllstrom ME, Brown JE, Kahn EB, Kushi LH. Recall of diet during a past pregnancy. Am J Epidemiol 2001;154:1136-42.
Burke BS. The dietary history as a tool in research. J Am Diet Assoc 1947;23:1041-6.
Burley V, Cade J, Margetts B, Thompson R, Warm D. Consensus document on the development, validation and utilisation of food frequency questionnaires. London: Ministry of Agriculture Fisheries and Food, 2000.
Butte NF, Ellis KJ, Wong WW, Hopkinson JM, Smith EO. Composition of gestational weight gain impacts maternal fat retention and infant birth weight. Am J Obstet Gynecol 2003;189:1423-32.
Butte NF, Wong WW, Treuth MS, Ellis KJ, O'Brian Smith E. Energy requirements during pregnancy based on total energy expenditure and energy deposition. Am J Clin Nutr 2004;79:1078-87.
121

Cade J, Thompson R, Burley V, Warm D. Development, validation and utilisation of food-frequency questionnaires – a review. Public Health Nutr 2002;5:567-87.
Castoldi AF, Coccini T, Ceccatelli S, Manzo L. Neurotoxicity and molecular effects of methylmercury. Brain Res Bull 2001;55:197-203.
Chandra RK. Breastfeeding, hydrolysate formulas and delayed introduction of selected foods in the prevention of food hypersensitivity and allergic disease. Nutr Res 2002;22:125-35.
Christian MS, Brent RL. Teratogen update: evaluation of the reproductive and developmental risks of caffeine. Teratology 2001;64:51-78.
Cogswell ME, Weisberg P, Spong C. Cigarette smoking, alcohol use and adverse pregnancy outcomes: Implications for micronutrient supplementation J Nutr 2003;133(suppl):1722S-31S.
Couper JJ, Steele C, Beresford S, Powell T, McCaul K, Pollard A, Gellert S, Tait B, Harrison LC, Colman PG. Lack of association between duration of breast-feeding or introduction of cow’s milk and development of islet autoimmunity. Diabetes 1999;48:2145-9.
Cowin I, Emmett P. The effect of missing data in the supplements to McCance and Widdowson's food tables on calculated nutrient intakes. Eur J Clin Nutr 1999;53:891-4.
Dahl-Jørgensen K, Joner G, Hanssen KF. Relationship between cow’s milk consumption and incidence of IDDM in childhood. Diabetes Care 1991;14:1081-3.
Dahlquist G. Non-genetic risk determinants of type 1 diabetes. Diabete Metab 1994;20:251-7.
Dahlquist GG, Blom LG, Persson LA, Sandstrom AI, Wall SG. Dietary factors and the risk of developing insulin dependent diabetes in childhood. BMJ 1990;300:1302-6.
Dahlquist G, Källén B. Maternal-child blood group incompatibility and other perinatal events increase the risk for early-onset Type 1 (insulin-dependent) diabetes mellitus. Diabetologia 1992;35:671-5.
Dahlquist GG, Patterson C, Soltesz G. Perinatal risk factors for childhood type 1 diabetes in Europe. The EURODIAB Substudy 2 Study Group. Diabetes Care 1999;22:1698-702.
Dennis CL. Breastfeeding initiation and duration: a 1990-2000 literature review. J Obstet Gynecol Neonatal Nurs 2002;31:12-32
De Vriese SR, De Henauw S, De Backer G, Dhont M, Christophe AB. Estimation of dietary fat intake of Belgian pregnant women. Comparison of two methods. Ann Nutr Metab 2001;45:273-8.
Dewey KG. Growth characteristics of breast-fed compared to formula-fed infants. Biol Neonate 1998;74:94-105.
Dewey KG, Cohen RJ, Rivera LL, Brown KH. Effects of age of introduction of complementary foods on iron status of breast-fed infants in Honduras. Am J Clin Nutr 1998;67:878-84.
Dewey KG, Peerson JM, Brown KH, Krebs NF, Michaelsen KF, Persson LA, Salmenperä L, Whitehead RG, Yeung DL. Growth of breast-fed infants deviates from current reference data: a
122

pooled analysis of US, Canadian, and European data sets. World Health Organization Working Group on Infant Growth. Pediatrics 1995;96:495-503.
Dich J, Järvinen R, Knekt P, Penttilä P-L. Dietary intakes of nitrate, nitrite and NDMA in the Finnish Mobile Clinic Health Examination Survey. Food Addit Contam 1996;13:541-52.
Doganay M. Listeriosis: clinical presentation. FEMS Immunol Med Microbiol 2003;35:173-5.
Dubois L, Girard M. Social inequalities in infant feeding during the first year of life. The Longitudinal Study of Child Development in Québec (LSCDQ 1998-2002). Pub Health Nutr 2003;6:773-83.
Eck LH, Klesges RC, Hanson CL. Recall of a child’s intake from one meal: Are parents accurate? J Am Diet Assoc 1989;89:784-9.
Ehrlich P. Ueber Immunitaet durch Vererbung und Saeugung (About inherited immunity and immunity through suckling).(in German).Zeitschrift für Hygiene und Infektionskrankheiten 1892;12:183-203.
Elfving AM, Lindberg BA, Landin-Olsson M, Hampe CS, Lernmark A, Ivarsson SA. Islet cell autoantibodies in cord blood from children with blood group incompatibility or hyperbilirubinemia. Autoimmunity 2003;36:111-5.
Elintarvikevirasto, Eläinlääkintä- ja elintarviketutkimuslaitos, Maa- ja metsätalousministeriö. Eläimistä saatavien elintarvikkeiden vierasainetutkimukset 2003. (Results of residue examination of products of animal origin in Finland year 2003). (in Finnish with an English summary). EVI-EELA-MMM julkaisuja 1/2004. Helsinki: Elintarvikevirasto, Eläinlääkintä- ja elintarviketutkimuslaitos, Maa- ja metsätalousministeriö, 2004.
The EURODIAB Substudy 2 Study Group. Vitamin D supplement in early childhood and risk for Type I (insulin-dependent) diabetes mellitus. The EURODIAB Substudy 2 Study Group. Diabetologia 1999;42:51-4.
The EURODIAB Substudy 2 Study Group. Infections and vaccinations as risk factors for childhood Type I (insulin-dependent) diabetes mellitus: a multicentre case-control investigation. Diabetologia 2000;43:47-53.
The EURODIAB Substudy 2 Study Group. Rapid early growth is associated with increased risk of childhood type 1 diabetes in various European populations. Diabetes Care 2002;25:1755-60.
Europaeus J. Piltti maistuu suomalaislapsille. Piltti Web site. Saatavissa: http://www.piltti.fi/index/hoidetaan/lehtiartikkelit_ruokajaravitsemus/tuoteartikkeli_pilttimaistuu.Haettu 30.9.2005.
Fall CHD, Yajnik CS, Rao S, Davies AA, Brown N, Farrant HJW. Micronutrients and foetal growth. J Nutr 2003;133(suppl):1747S-56S.
FAO/WHO/UNU. Energy and protein requirements. Report of a joint FAO/WHO/UNU expert consultation. World Health Organ Tech Rep Ser 1985;724:1-206.
Fawzi WW, Rifas-Shiman SL, Rich-Edwards JW, Willett WC, Gillman MW. Calibration of a semi-quantitative food frequency questionnaire in early pregnancy. Ann Epidemiol 2004;14:754-62.
123

Fewtrell MS, Lucas A, Morgan JB. Factors associated with weaning in full term and preterm infants. Arch Dis Child Foetal Neonatal Ed 2003;88:296F-301F.
Finravinto 1997 –tutkimuksen työryhmä. Finravinto 1997 –tutkimus. (The National FINDIET 1997 Study). (in Finnish with an English summary). Kansanterveyslaitoksen julkaisuja B8/1998. Helsinki: Kansanterveyslaitos, 1998.
Flegal KM. Evaluating epidemiological evidence of the effects of food and nutrient exposures. Am J Clin Nutr 1999;69(suppl):1339S-44S.
Flood VM, Smith WT, Webb KL, Mitchell P. Issues in assessing the validity of nutrient data obtained from a food-frequency questionnaire: folate and vitamin B12 examples. Public Health Nutr 2004;7:751-6.
Forssas E, Gissler M, Sihvonen M, Hemminki E. Maternal predictors of perinatal mortality: the role of birthweight. Int J Epidemiol 1999;28:475-8.
Forsyth JS. The relationship between breast-feeding and infant health and development. Proceedings of the Nutrition Society 1995;54:407-18.
Forsythe HE, Gage B. Use of a multicultural food-frequency questionnaire with pregnant and lactating women. Am J Clin Nutr 1994;59(suppl):203S-6S.
Fowke JH, Schlundt D, Gong Y, Jin F, Shu XO, Wen W, Liu DK, Gao YT, Zheng W. Impact of season of food frequency questionnaire administration on dietary reporting. Ann Epidemiol 2004;14:778-85.
Fox MK, Pac S, Devaney B, Jankowski L. Feeding infants and toddlers study: What foods are infants and toddlers eating? J Am Diet Assoc 2004;104(suppl):22S-30S.
Freeman V, van't Hof M, Haschke F. Patterns of milk and food intake in infants from birth to age 36 months: the Euro-growth study. J Pediatr Gastroenterol Nutr 2000;31(suppl):76S-85S.
French MR, Barr SI, Levy-Milne R. Folate intakes and awareness of folate to prevent neural tube defects: a survey of women living in Vancouver, Canada. J Am Diet Assoc 2003;103:181-5.
Freudenheim JL. Study design and hypothesis testing: issues in the evaluation of evidence from research in nutritional epidemiology. Am J Clin Nutr 1999;69(suppl):1315S-1321S.
Fronczak CM, Baron AE, Chase HP, Ross C, Brady HL, Hoffman M, Eisenbarth GS, Rewers M, Norris JM. In utero dietary exposures and risk of islet autoimmunity in children. Diabetes Care. 2003;26:3237-42.
Gale EAM. The rise of childhood type 1 diabetes in the 20th Century. Diabetes 2002;51:3353-61.
Gartner LM, Morton J, Lawrence RA, Naylor AJ, O'Hare D, Schanler RJ, Eidelman AI; American Academy of Pediatrics Section on Breastfeeding. Breastfeeding and the use of human milk. Pediatrics 2005;115:496-506.
Garza C. Pregnancy and lactation. In: Garrow Js, James WPT, (eds.). Human nutrition and dietetics. 9th ed. New York: Churchill Livingstone, 1993:376-86.
124

Gerstein HC. Cow’s milk exposure and type I diabetes mellitus. A critical overview of the clinical literature. Diabetes Care 1994;17:13-9.
Gibbon G, Smith T, Egger P, Betts P, Phillips D. Early infection and subsequent insulin dependent diabetes. Arch Dis Child 1997;77:384-5.
Giddens JB, Krug SK, Tsang RC, Guo S, Miodovnik M, Prada JA. Pregnant adolescent and adult women have similarly low intakes of selected nutrients. J Am Diet Assoc 2000;100:1334-40.
Gissler M, Keskimäki I, Teperi J, Järvelin M, Hemminki E. Regional equity in childhood health - register-based follow-up of the Finnish 1987 birth cohort. Health Place 2000;6:329-36.
Gissler M, Meriläinen J, Vuori E, Hemminki E. Register based monitoring shows decreasing socioeconomic differences in Finnish perinatal health. J Epidemiol Community Health 2003;57:433-9.
Gissler M, Rahkonen O, Järvelin MR, Hemminki E. Social class differences in health until the age of seven years among the Finnish 1987 birth cohort. Soc Sci Med 1998;46:1543-52.
Gluckman PD, Hanson MA. Living with the past: evolution, development, and patterns of disease. Science 2004a;305:1733-6.
Gluckman PD, Hanson MA. The developmental origins of the metabolic syndrome. Trends Endocrinol Metab 2004b;15:183-7.
Godfrey K, Robinson S, Barker DJP, Osmond C, Cox V. Maternal nutrition in early and late pregnancy in relation to placental and foetal growth. BMJ 1996;312:410-4.
Greeley S, Storbakken L, Magel R. Use of a modified food frequency questionnaire during pregnancy. J Am Coll Nutr 1992;11:728-34.
Green A, Patterson CC. Trends in the incidence of childhood-onset diabetes in Europe 1989-1998. Diabetologia 2001;44(suppl):B3-8.
Groth MV, Fagt S, Brondsted L. Social determinants of dietary habits in Denmark. Eur J Clin Nutr 2001;55:959-66.
Haapa E, Toponen T, Pietinen P, Räsänen L. Annoskuvakirja. (in Finnish). Helsinki: Kansanterveyslaitos ja Helsingin yliopiston ravitsemustieteen laitos, 1985.
Hagglof B, Blom L, Dahlquist G, Lonnberg G, Sahlin B. The Swedish childhood diabetes study: indications of severe psychological stress as a risk factor for type 1 (insulin-dependent) diabetes mellitus in childhood. Diabetologia 1991;34:579-83.
Hakala P, Knuts LR, Vuorinen A, Hammar N, Becker W. Comparison of nutrient intake data calculated on the basis of two different databases. Results and experiences from a Swedish-Finnish study. Eur J Clin Nutr 2003;57:1035-44.
Hallberg L, Hulthen L. Perspectives on iron absorption. Blood Cells Mol Dis 2002;29:562-73.
Hallman N, Nevanlinna E, Tuuteri L. Valistustyön ja eräiden sosiaalisten tekijöiden vaikutuksesta rintaruokintaan. (in Finnish). Duodecim 1952;68:802-17.
125

Hanson LA. Comparative immunological studies of the immune globulins of human milk and of blood serum. Int Arch Allergy Appl Immunol 1961;18:241-67.
Hanson LA. Breastfeeding provides passive and likely long-lasting active immunity. Ann Allergy Asthma Immunol 1998;81:523-33.
Hanson LA. Human milk and host defence: immediate and long-term effects. Acta Paediatr 1999;88:42-6.
Haschke F, van't Hof MA; Euro-Growth Study Group. Euro-Growth references for breast-fed boys and girls: influence of breast-feeding and solids on growth until 36 months of age. J Pediatr Gastroenterol Nutr 2000;31(suppl):60S-71S.
Hashimoto S, Nakai S, Tsubono Y, Nishino Y, Fukao A, Hisamichi S. Effects of misclassification and temporal change of response in food frequency on risk ratio. J Epidemiol 1997;7:153-9.
Hasunen K. Imeväisikäisten ruokinta Suomessa vuonna 2000. (Infant feeding in Finland 2000). (in Finnish with an English summary). Sosiaali- ja terveysministeriön selvityksiä 2001:12. Helsinki, 2002.
Hasunen K, Heinonen K, Lyytikäinen A, Sairanen S. Imeväisikäisten ruokinta Suomessa 1995. (Infant feeding in Finland 1995). (in Finnish with an English summary). Sosiaali- ja terveysministeriön selvityksiä 1996:2. Helsinki, 1996.
Hasunen K, Kalavainen M, Keinonen H, Lagström H, Lyytikäinen A, Nurttila A, Peltola T, Talvia S. Lapsi, perhe ja ruoka. Imeväis- ja leikki-ikäisten lasten, odottavien ja imettävien äitien ravitsemussuositus. (The Child, Family and Food. Nutrition recommendations for infants and young children as well as pregnant and breastfeeding mothers). (in Finnish with an English summary). Sosiaali- ja terveysministeriön julkaisuja 2004:11. Helsinki: Sosiaali- ja terveysministeriö, terveysosasto, 2004.
Hasunen K, Kalavainen M, Keinonen H, Lyytikäinen A, Nurttila A, Peltola T. Lapsi, perhe ja ruoka. Imeväis- ja leikki-ikäisten lasten, odottavien ja imettävien äitien ravitsemussuositus. (The Child, Family and Food. Nutrition recommendations for infants and young children as well as pregnant and breastfeeding mothers). (in Finnish with an English summary). Sosiaali- ja terveysministeriön julkaisuja 1997:7. Helsinki: Sosiaali- ja terveysministeriö, 1997.
Heinig MJ, Dewey KG. Health advantages of breast feeding for infants: a critical review. Nutr Res Rev 1996;9:89-110.
Heinig MJ, Dewey KG. Health effects of breast feeding for mothers: a critical review. Nutr Res Rev 1997;10:35-56.
Heinig MJ, Nommsen LA, Peerson JM, Lonnerdal B, Dewey KG. Energy and protein intakes of breast-fed and formula-fed infants during the first year of life and their association with growth velocity: the DARLING Study. Am J Clin Nutr 1993;58:152-61.
Helgason T, Jonasson MR. Evidence for a food additive as a cause of ketosis-prone diabetes. Lancet 1981;2:716-20.
Hendricks KM, Badruddin SH. Weaning recommendations: the scientific basis. Nutr Rev 1992;50:125-33.
126

Henriksen C, Brunvand L, Stoltenberg C, Trygg K, Haug E, Pedersen JI. Diet and vitamin D status among pregnant Pakistani women in Oslo. Eur J Clin Nutr 1995;49:211-8.
Hercberg S, Preziosi P, Galan P. Iron deficiency in Europe. Public Health Nutr 2001;4:537-45.
Hess SY, Zimmermann MB, Brogli S, Hurrell RF. A national survey of iron and folate status in pregnant women in Switzerland. Int J Vitam Nutr Res 2001;71:268-73.
Hinds TS, West WL, Knight EM, Harland BF. The effect of caffeine on pregnancy outcome variables. Nutr Rev 1996;54:203-7.
Hirvonen T, Männistö S, Roos E, Pietinen P. Increasing prevalence of underreporting does not necessarily distort dietary surveys. Eur J Clin Nutr 1997;51:297-301.
Hirvonen T, Tapanainen H, Valsta L, Virtanen M, Aro A, Pietinen P. Elintarvikkeiden täydentäminen D-vitamiinilla ja kalsiumilla – riskinarviointi työikäisessä väestössä. (Food fortification with vitamin D and calcium – risk assessment in adult population). (in Finnish with an English summary). Kansanterveyslaitoksen julkaisuja B19/2004. Helsinki: Kansanterveyslaitos, epidemiologian ja terveyden edistämisen osasto, ravitsemusyksikkö, 2004.
Hobel C, Culhane J. Role of psychosocial stress and nutritional stress on poor pregnancy outcome. J Nutr 2003;133(suppl):1709S-17S.
Hollis BW, Pittard WB. Evaluation of the total fetomaternal vitamin D relationships at term: evidence for racial differences. J Clin Endocrinol Metab 1984;59:652-7.
Hollis BW, Wagner CL. Assessment of dietary vitamin D requirements during pregnancy and lactation. Am J Clin Nutr 2004;79:717-26.
Hoppu U, Kalliomäki M, Isolauri E. Maternal diet rich in saturated fat during breastfeeding is associated with atopic sensitization of the infant. Eur J Clin Nutr 2000;54:702-5.
Hoppu U, Rinne M, Salo-Väänänen P, Lampi A-M, Piironen V, Isolauri E. Vitamin C in breast milk may reduce the risk of atopy in the infant. Eur J Clin NUtr 2005;59:123-8.
Hosmer DW, Lemeshow S. Applied Logistic Regression. New York: John Wiley & Sons, 1989.
Høst A, Koletzko B, Dreborg S, Muraro A, Wahn U, Aggett P, Bresson JL, Hernell O, Lafeber H,Michaelsen KF, Micheli JL, Rigo J, Weaver L, Heymans H, Strobel S, Vandenplas Y. Dietary products used in infants for treatment and prevention of food allergy. Joint Statement of the European Society for Paediatric Allergology and Clinical Immunology (ESPACI) Committee on Hypoallergenic Formulas and the European Society for Paediatric Gastroenterology, Hepatology and Nutrition (ESPGHAN) Committee on Nutrition. Arch Dis Child 1999;81:80-4.
Hughes DA. The influence of the diet on the maturation of the immune system. Allergy 1998;46 (suppl):26S-8S.
Hulshof KF, Brussaard JH, Kruizinga AG, Telman J, Lowik MR. Socio-economic status, dietary intake and 10 y trends: the Dutch National Food Consumption Survey. Eur J Clin Nutr 2003;57:128-37.
127

Hultin H, Opas R, Sarna S. Imeväisten terveyspalvelut Suomessa 1972-1973. (in Finnish). Lääkintöhallitus 14/1977.
Hummel M, Bonifacio E, Schmid S, Walter M, Knopff A, Ziegler AG. Brief communication: early appearance of islet autoantibodies predicts childhood type 1 diabetes in offspring of diabetic parents. Ann Intern Med. 2004a;140:882-6.
Hummel M, Fuchtenbusch M, Schenker M, Ziegler AG. No major association of breast-feeding, vaccinations, and childhood viral diseases with early islet autoimmunity in the German BABYDIAB Study. Diabetes Care. 2000;23:969-74.
Hummel M, Ziegler AG, Roth R. Psychological impact of childhood islet autoantibody testing in families participating in the BABYDIAB study. Diabet Med. 2004b;21:324-8.
Hyppönen E. Micronutrients and the risk of type 1 diabetes: vitamin D, vitamin E, and nicotinamide. Nutr Rev 2004;62:340-7.
Hyppönen E, Kenward MG, Virtanen SM, Piitulainen A, Virta-Autio P, Tuomilehto J, Knip M, Åkerblom HK. Infant feeding, early weight gain, and risk of type 1 diabetes. Childhood Diabetes in Finland (DiMe) Study Group. Diabetes Care 1999;22:1961-5.
Hyppönen E, Läärä E, Reunanen A, Järvelin MR, Virtanen SM. Intake of vitamin D and risk of type 1 diabetes: a birth-cohort study. Lancet 2001;358:1500-3.
Hyppönen E, Virtanen SM, Kenward MG, Knip M, Åkerblom HK; Childhood Diabetes in Finland Study Group. Obesity, increased linear growth, and risk of type 1 diabetes in children. Diabetes Care 2000;23:1755-60.
Hyöty H, Taylor KW. The role of viruses in human diabetes. Diabetologia 2002;45:1353-61.
Hämäläinen A-M, Ronkainen MS, Åkerblom HK, Knip M; the Finnish TRIGR Study Group. Postnatal elimination of transplacentally acquired disease-associated antibodies in infants born to families with type 1 diabetes. J Clin Endocrinol Metab 2000;85:4249-53.
Hörnell A, Hofvander Y, Kylberg E. Introduction of solids and formula to breastfed infants: a longitudinal prospective study in Uppsala, Sweden. Acta Paediatr 2001;90:477-82.
Ilonen J, Reijonen H, Herva E, Sjöroos M, Iitia A, Lövgren T, Veijola R, Knip M, Åkerblom HK. Rapid HLA-DQB1 genotyping for four alleles in the assessment of risk for IDDM in the Finnish population. Diabetes Care 1996;19:795-800.
Ivarsson A, Hernell O, Stenlund H, Persson LÅ. Breast-feeding protects against celiac disease. Am J Clin Nutr 2002;75:914-21.
Jackson AA. Perinatal nutrition: the impact on postnatal growth and development. In: Gluckman PD, Heymann MA, (eds). Pediatrics & Perinatology, the scientific basis (2nd ed).Oxford: Oxford University Press, 1996.
Jain A, Concato J, Leventhal JM. How good is the evidence linking breastfeeding and intelligence? Pediatrics 2002;109:1044-53.
128

James WPT, Nelson M, Ralph A, Leather S. Socioeconomic determinants of health: the contribution of nutrition inequalities in health. BMJ 1997;314:1545.
Jensen RG. Lipids in human milk. Lipids 1999;34:1243-71.
Jewell D, Young G. Interventions for nausea and vomiting in early pregnancy. Cochrane Database Syst Rev. 2003;(4):CD000145.
Johansson C, Samuelsson U, Ludvigsson J. A high weight gain early in life is associated with an increased risk of type 1 (insulin-dependent) diabetes mellitus. Diabetologia 1994;37:91-4.
Jones AC, Miles EA, Warner JO, Colwell BM, Bryant TN, Warner JA. Foetal peripheral blood mononuclear cell proliferative responses to mitogenic and allergenic stimuli during gestation. Pediatr Allergy Immunol 1996;7:109-16.
Jones KL, Smith DW. Recognition of the foetal alcohol syndrome in early pregnancy. Lancet 1973;2:999-1001.
Jovanovic L. Nutrition and pregnancy: the link between dietary intake and diabetes. Curr Diab Rep 2004;4:266-72.
Kalavainen M. Imeväis- ja leikki-ikäisten lasten ruokintatapojen yhteys seerumin lipiditasoihin (pro gradu –tutkielma; Master’s thesis). (in Finnish). Helsinki: Helsingin yliopisto, ravitsemustieteen laitos,1984.
Kangas T. Diabeetikkojen terveyspalvelut ja niiden kustannukset. Helsinkiläisten diabeetikkojen verrokkikontrolloitu poikkileikkaustutkimus. (Health services and expenses of people with diabetes). (in Finnish with an English summary). Sosiaali- ja terveysturvan tutkimuksia 67. Helsinki: KELA 2002.
Kaprio J, Tuomilehto J, Koskenvuo M, Romanov K, Reunanen A, Eriksson J, Stengård J,Kesäniemi YA. Concordance for type I (insulin-dependent) and type II (non-insulin-dependent) diabetes mellitus in a population-based cohort of twins in Finland. Diabetologia 1992;35:1060-7.
Karvonen M, Viik-Kajander M, Moltchanova E, Libman I, LaPorte R, Tuomilehto J. Incidence of childhood type 1 diabetes worldwide. Diabetes care 2000;23:1516-25.
Kaskutas LA, Graves K. Pre-pregnancy drinking: how drink size affects risk assessment. Addiction 2001;96:1199-209.
Kauppa- ja teollisuusministeriö. Kauppa- ja teollisuusministeriön asetus vitamiinien ja eräiden muiden aineiden lisäämisestä elintarvikkeisiin 917/2002. Annettu Helsingissä 30 päivänä lokakuuta 2002/voimaantulo 01.12.2002. Saatavissa: http://www.finlex.fi/fi/laki/alkup/2002/20020917. Haettu 30.10.2005.
Kimpimäki T, Erkkola M, Korhonen S, Kupila A, Virtanen SM, Ilonen J, Simell O, Knip M. Short-term exclusive breastfeeding predisposes young children with increased genetic risk of type 1 diabetes to progressive beta-cell autoimmunity. Diabetologia 2001a;44:63-9.
Kimpimäki T, Kulmala P, Savola K, Vähäsalo P, Reijonen H, Ilonen J, Åkerblom HK, Knip M; the Childhood Diabetes in Finland Study Group. Disease-associated autoantibodies as surrogate
129

markers of type 1 diabetes in young children at increased genetic risk. J Clin Endocrinol Metab 2000;85:1126-32.
Kimpimäki T, Kupila A, Hämäläinen AM, Kukko M, Kulmala P, Savola K, Simell T, Keskinen P,Ilonen J, Simell O, Knip M. The first signs of -cell autoimmunity appear in infancy in genetically susceptible chidlren from the general population: the Finnish Type 1 Diabetes Prediction and Prevention Study. J Clin Endocrinol Metab 2001b;86:4782-8.
King JC. Physiology of pregnancy and nutrient metabolism. Am J Clin Nutr 2000;71(suppl):1218S-25S.
Kinnunen TI, Luoto R, Gissler M, Hemminki E. Pregnancy weight gain from 1960s to 2000 in Finland. Int J Obes Relat Metab Disord 2003;27:1572-7.
Kleemola P, Virtanen M, Pietinen P. The 1992 dietary survey of Finnish adults. Kansanterveyslaitoksen julkaisuja B2. Helsinki: Kansanterveyslaitos, ravitsemusosasto, 1994.
Klemetti P, Savilahti E, Ilonen J, Åkerblom HK, Vaarala O. T-cell reactivity to wheat gluten in patients with insulin-dependent diabetes mellitus. Scand J Immunol 1998;47:48-53.
Knekt P, Reunanen A, Marniemi J, Leino A, Aromaa A. Low vitamin E status is a potential risk factor for insulin-dependent diabetes mellitus. J Intern Med 1999;245:99-102.
Knip M. Natural course of preclinical type 1 diabetes. Horm Res 2002a;57(suppl):6S-11S.
Knip M. Can we predict type 1 diabetes in the general population? Diabetes Care 2002b;25:623-5.
Knip M, Åkerblom HK. Putative environmental factors in Type 1 diabetes. Diabetes Metab Rev 1998;14:31-67.
Kopp-Hoolihan LE, van Loan MD, Wong WW, King JC. Longitudinal assessment of energy balance in well-nourished, pregnant women. Am J Clin Nutr 1999;69:697-704.
Kramer MS. The epidemiology of adverse pregnancy outcomes: an overview. J Nutr 2003;133(suppl):1592S-6S.
Kramer MS, Guo T, Platt RW, Shapiro S, Collet JP, Chalmers B, Hodnett E, Sevkovskaya Z, Dzikovich I, Vanilovich I; PROBIT Study Group. Breastfeeding and infant growth: biology or bias? Pediatrics 2002;110:343-7.
Kramer MS, Guo T, Platt RW, Vanilovich I, Sevkovskaya Z, Dzikovich I, Michaelsen KF, Dewey K; Promotion of Breastfeeding Intervention Trials Study Group. Feeding effects on growth during infancy. J Pediatr 2004;145:600-5.
Kramer MS, Kakuma R. Optimal duration of exclusive breastfeeding. Cochrane Database Syst Rev 2002;(1):CD003517.
Kramer MS, Kakuma R. Maternal dietary antigen avoidance during pregnancy and/or lactation for preventing or treating atopic disease in the child. Cochrane Database Syst Rev 2003;(4):CD000133.
Kramer MS, Kakuma R.The optimal duration of exclusive breastfeeding: a systematic review. Adv Exp Med Biol 2004;554:63-77.
130
Krebs NF. Dietary zinc and iron sources, physical growth and cognitive development of breastfed infants. J Nutr 2000;130(suppl):358S-60S.
Kronberg-Kippilä C, Ovaskainen M-L, Erkkola M, Korhonen T, Virtanen SM. The frequency of use of infant formulas and baby foods in a longitudinal birth cohort study. Abstract no G75 in: Joint Meeting of the 5th International Food Data Conference and 27th US National Nutrient Databank Conference. Fostering Quality Science in Food Composition Databases. June 29 - July 3, 2003 Washington Marriott Hotel, Washington DC.
Kumpula M, Lyytikäinen A, Poikajärvi K. Vauvamyönteinen Keski-Suomi – laatua imetysohjaukseen. (in Finnish). Kätilölehti 1994;5:23-25,28,10.
Kupila A, Muona P, Simell T, Arvilommi P, Savolainen H, Hämäläinen AM, Korhonen S, Kimpimäki T, Sjöroos M, Ilonen J, Knip M, Simell O; Juvenile Diabetes Research Foundation Centre for the Prevention of Type I Diabetes in Finland. Feasibility of genetic and immunological prediction of type I diabetes in a population-based birth cohort. Diabetologia 2001;44:290-7.
LaGasse JM, Brantley MS, Leech NJ, Rowe RE, Monks S, Palmer JP, Nepom GT, McCulloch DK,Hagopian WA; Washington State Diabetes Prediction Study. Successful prospective prediction of type 1 diabetes in schoolchildren by multiple defined autoantibodies: eight year follow-up of the Washington State Diabetes Prediction Study. Diabetes Care 2002;25:505-11.
Lahti-Koski M, Sirén M. Ravitsemuskertomus 2003. (Nutrition report 2003). (in Finnish with an English summary). Kansanterveyslaitoksen julkaisuja B4/2004. Helsinki: Kansanterveyslaitos, ravitsemusyksikkö, 2004.
Laitinen S, Räsänen L, Viikari J, Åkerblom HK. Diet of Finnish children in relation to the family's socio-economic status. Scand J Soc Med 1995;23:88-94.
Lande B, Andersen LF, Baerug A, Trygg KU, Lund-Larsen K, Veierød MB, Bjørneboe GE. Infant feeding practices and associated factors in the first six months of life: the Norwegian infant nutrition survey. Acta Paediatr 2003;92:152-61.
Langley-Evans SC, Langley-Evans AJ. Use of folic acid supplements in the first trimester of pregnancy. J R Soc Health 2002;122:181-6.
Larque E, Demmelmair H, Koletzko B. Perinatal supply and metabolism of long-chain polyunsaturated fatty acids: importance for the early development of the nervous system. Ann N Y Acad Sci 2002;967:299-310.
Leaf CD, Wishnok JS, Tannebaum SR. Mechanism of endogenous nitrosation. Cancer Surv 1989;8:323-34.
Leino U. Ruokamittoja. (in Finnish). Kansanterveyslaitoksen julkaisuja B1/1984. Helsinki: Kansanterveyslaitos, 1984.
Leviton A, Cowan L. A review of the literature relating caffeine consumption by women to their risk of reproductive hazards. Food Chem Toxicol 2002;40:1271-310.
Lewis CJ, Crane NT, Wilson DB, Yetley EA. Estimated folate intakes: data updated to reflect food fortification, increased bioavailability, and dietary supplement use. Am J Clin Nutr 1999;70:198-207.
131

Lindberg B, Ivarsson SA, Landin-Olsson M, Sundkvist G, Svanberg L, Lernmark Å. Islet autoantibodies in cord blood from children who developed type 1 (insulin-dependent) diabetes mellitus before 15 years of age. Diabetologia 1999;42:181-7.
Linne Y, Dye L, Barkeling B, Rössner S. Long-term weight development in women: a 15-year follow-up of the effects of pregnancy. Obes Res 2004;12:1166-78.
Livingstone MB, Black AE. Markers of the validity of reported energy intake. J Nutr 2003;133(suppl):895S-920S.
Lopez-Azpiazu I, Sanchez-Villegas A, Johansson L, Petkeviciene J, Prattala R, Martinez-Gonzalez MA; FAIR-97-3096 Project. Disparities in food habits in Europe: systematic review of educational and occupational differences in the intake of fat. J Hum Nutr Diet 2003;16:349-64.
Lovegrove JA, Hampton SM, Morgan JB. The immunological and long-term atopic outcome of infants born to women following a milk-free diet during late pregnancy and lactation: a pilot study. Br J Nutr 1994;71:223-38.
Lutter C. Length of exclusive breastfeeding: linking biology and scientific evidence to a public health recommendation. J Nutr 2000;130:1335-8.
Malek A, Sager R, Kuhn P, Nicolaides KH, Schneider H. Evolution of maternofetal transport of immunoglobulins during human pregnancy. Am J Reprod Immunol 1996;36:248-55.
Margetts BM, Nelson M. Design concepts in nutrition epidemiology. Oxford: Oxford University Press, 1997.
Martin JM, Trink B, Daneman D, Dosch HM, Robinson B. Milk proteins in the etiology of insulin-dependent diabetes mellitus (IDDM). Ann Med 1991;23:447-52.
Martinez M. Tissue levels of polyunsaturated fatty acids during early human development. J Pediatr 1992;120(suppl):129S-38S.
Masson LF, McNeill G, Tomany JO, Simpson JA, Peace HS, Wei L, Grubb DA, Bolton-Smith C. Statistical approaches for assessing the relative validity of a food-frequency questionnaire: use of correlation coefficients and the kappa statistic. Public Health Nutr 2003;6:313-21.
Mathews F, Youngman L, Neil A. Maternal circulating nutrient concentrations in pregnancy: implications for birth and placental weights of term infants. Am J Clin Nutr 2004;79:103-10.
McGanity WJ, Dawson EB, Fogelman A. Nutrition in pregnancy and lactation. In: Shils ME, Olson JA, Shike M, eds. Modern nutrition in health and disease. 8th ed. Baltimore: Williams & Wilkins, 1994.
McKinney PA, Okasha M, Parslow RC, Law GR, Gurney KA, Williams R, Bodansky HJ. Early social mixing and childhood Type 1 diabetes mellitus: a case-control study in Yorkshire, UK. Diabetic Med 2000;17:236-42.
McKinney PA, Parslow R, Gurney K, Law G, Bodansky HJ, Williams DRR. Antenatal risk factors for childhood diabetes mellitus; a case-control study of medical record data in Yorkshire, UK. Diabetologia 1997;40:933-9.
132

McKinney PA, Parslow R, Gurney KA, Law GR, Bodansky HJ, Williams R. Perinatal and neonatal determinants of childhood type 1 diabetes. A case-control study in Yorkshire, U.K. Diabetes Care. 1999;22:928-32.
Mennella JA, Beauchamp GK. Early flavor experiences: research update. Nutr Rev 1998;56:205-11.
Mennella JA, Jagnow CP, Beauchamp GK. Prenatal and postnatal flavor learning by human infants. Pediatrics 2001;107:E88.
Meriläinen J, Gissler M, Hemminki E, Teperi J. Perinataalitilastot 1993. Tilastotiedote 18, 1995. (in Finnish). Helsinki: Sosiaali- ja terveysalan tutkimus- ja kehittämiskeskus, 1995.
Michaelsen KF, Sauer Larsen P, Lykke Thomsen B, Samuelson G. The Copenhagen cohort study on infant nutrition and growth: duration of breast feeding and influencing factors. Acta Paediatr 1997;83:565-71.
Miller JB, Mc Veagh P. Human milk oligosaccharides: 130 reasons to breast-feed. Br J Nutr 1999;82:333-5.
Miller JZ, Kimes T, Hui S, Andon MB, Johnston CC Jr. Nutrient intake variability in a pediatric population: implications for study design. J Nutr 1991;121:265-74.
Miller RK, Hendrickx AG, Mills JL, Hummler H, Wiegand UW. Periconceptional vitamin A use: how much is teratogenic? Reprod Toxicol 1998;12:75-88.
Mitchell LE, Adzick NS, Melchionne J, Pasquariello PS, Sutton LN, Whitehead AS. Spina bifida. Lancet 2004;364:1885-95.
Mojtabai R. Body mass index and serum folate in childbearing age women. Eur J Epidemiol 2004;19:1029-36.
Mukherjee RAS, Hollins S, Abou-Saleh MT, Turk J. Low level alcohol consumption and foetus. Editorial. BMJ 2005;330:375-6.
Mungen E. Iron supplementation in pregnancy. J Perinat Med 2003;31:420-6.
Muntoni S, Cocco P, Aru G, Cucca F. Nutritional factors and worldwide incidence of childhood type 1 diabetes. Am J Clin Nutr 2000;71:1525-9.
Männistö S, Ovaskainen M-L, Valsta L, (toim.). Finravinto 2002 -tutkimus. (The National FINDIET 2002 Study). (in Finnish with an English summary). Kansanterveyslaitoksen julkaisuja B3/2003. Helsinki: Kansanterveyslaitos, ravitsemusyksikkö, 2003.
Männistö S, Virtanen M, Mikkonen T, Pietinen P. Reproducibility and validity of a food frequency questionnaire in a case-control study on breast cancer. J Clin Epidemiol 1996;49:401-9.
National Academy of Sciences. Recommended dietary allowances. 10th ed. Washington DC: National Academy Press, 1989.
133

National Public Health Institute, Nutrition Unit. Fineli. Finnish food composition database. Release 5. Helsinki 2005. Available at: http://www.ktl.fi/fineli/.
Navia B, Ortega RM, Requejo AM, Perea JM, Lopez-Sobaler AM, Faci M. Influence of maternal education on food consumption and energy and nutrient intake in a group of pre-school children from Madrid. Int J Vitam Nutr Res 2003;73:439-45.
Nichols AB, Ravenscroft C, Lamphiear DE, Ostrander LDJr. Independence of serum lipid levels and dietary habits. The Tecumseh Study. J Am Med Assoc 1976;236:1948-53.
Nicklas TA, Webber LS, Berenson GS. Studies of consistency of dietary intake during the first four years of life in a prospective analysis: Bogalusa Heart Study. J Am Coll Nutr 1991;10:234-41.
Nikulina M, Habich C, Flohe SB, Scott FW, Kolb H. Wheat gluten causes dendritic cell maturation and chemokine secretion. J Immunol 2004;173:1925-33.
Nordic Nutrition Recommendations 2004. Integrating nutrition and physical activity. 4th edition. Nord 2004:13, Nordic Council of Ministers, Copenhagen 2004.
Norris JM, Barriga K, Klingensmith G, Hoffman M, Eisenbarth GS, Erlich HA, Rewers M. Timing of initial cereal exposure in infancy and risk of islet autoimmunity. JAMA. 2003;290:1713-20.
Norris JM, Beaty B, Klingensmith G, Yu Liping, Hoffman M, Chase HP, Erlich HA, Hamman RF, Eisenbarth GS, Rewers M. Lack of association between early exposure to cow’s milk protein and beta-cell autoimmunity. Diabetes Autoimmunity Study in the Young (DAISY). JAMA 1996;276:609-14.
Norris JM, Scott FW. A meta-analysis of infant diet and insulin-dependent diabetes mellitus: do biases play a role? Epidemiology 1996;7:87-92.
North K, Emmett P. Multivariate analysis of diet among three-year-old children and associations with socio-demographic characteristics. The Avon Longitudinal Study of Pregnancy and Childhood (ALSPAC) Study Team. Eur J Clin Nutr 2000;54:73-80.
North K, Emmett P, Noble S; the ALSPAC Study Team. Types of drinks consumed by infants at 4 and 8 months of age: sociodemographic variations. J Hum Nutr Dietet 2000;13:71-82.
Nummela O, Helakorpi S, Laatikainen T, Uutela A, Puska P. Terveyskäyttäytyminen ja terveydentila maakunnittain Suomessa 1978-1999. (in Finnish). Kansanterveyslaitoksen julkaisuja B10/2000. Helsinki: Kansanterveyslaitos, epidemiologian ja terveyden edistämisen osasto, terveyden edistämisen tutkimusyksikkö, 2000.
O'Leary CM. Foetal alcohol syndrome: diagnosis, epidemiology, and developmental outcomes. J Paediatr Child Health 2004;40:2-7.
Onkamo P, Väänänen S, Karvonen M, Tuomilehto J. Worldwide increase in incidence of type 1 diabetes – the analysis of the data on published incidence trends. Diabetologia 1999;42:1395-403.
Ortega RM, Gaspar MJ, Moreiras O. Dietary assessment of a pregnant Spanish women group. Int J Vitam Nutr Res 1994;64:130-4.
134

Owen CG, Martin RM, Whincup PH, Smith GD, Cook DG. Effect of infant feeding on the risk of obesity across the life course: a quantitative review of published evidence. Pediatrics 2005;115:1367-77.
Owen CG, Whincup PH, Gilg JA, Cook DG. Effect of breast feeding in infancy on blood pressure in later life: systematic review and meta-analysis. BMJ 2003;327:1189-95.
Owen CG, Whincup PH, Odoki K, Gilg JA, Cook DG. Infant feeding and blood cholesterol: a study in adolescents and a systematic review. Pediatrics 2002;110:597-608.
Paine P, Spegiorin C. Prolonged breast feeding related to later solid food acceptance. Child Care Health Dev 1983;9:321-6.
Pakarinen H, Priha L. Rintaruokintatilanteen kehittyminen Kajaanissa vuosina 1976-81. (in Finnish). Suom Lääkäril 1984;39:109-11.
Pande H, Unwin C, Haheim LL. Factors associated with the duration of breastfeeding: analysis of the primary and secondary responders to a self-completed questionnaire. Acta Paediatr 1997;86:173-7.
Patterson CC, Carson DJ, Hadden DR, Waugh NR, Cole SK. A case-control investigation of perinatal risk factors for childhood IDDM in Northern Ireland and Scotland. Diabetes Care 1994;17:376-81.
Patterson CC, Dahlquist G, Soltesz G, Green A; EURODIAB ACE Study Group. Europe and Diabetes. Is childhood-onset type I diabetes a wealth-related disease? An ecological analysis of European incidence rates. Diabetologia 2001;44(suppl):B9-16.
Patterson CC, Waugh NR. Urban/rural and deprivational differences in incidence and clustering of childhood diabetes in Scotland. Int J Epidemiol 1992;21:108-17.
Pawley N, Bishop NJ. Prenatal and infant predictors of bone health: the influence of vitamin D. Am J Clin Nutr 2004;80(suppl):1748S-51S.
Pietinen P. Raskaana olevien naisten ravitsemustila Helsingissä (lisensiaattityö; LIC. theses). (in Finnish). Helsinki: Helsingin yliopisto, ravitsemustieteen laitos, 1974.
Pietinen P, Hartman AM, Haapa E, Räsänen L, Haapakoski J, Palmgren J, Albanes D, Virtamo J, Huttunen JK. Reproducibility and validity of dietary assessment instruments. I. A self-administered food use questionnaire with a portion size picture booklet. Am J Epidemiol 1988a;128:655-66.
Pietinen P, Hartman AM, Haapa E, Räsänen L, Haapakoski J, Palmgren J, Albanes D, Virtamo J, Huttunen JK. Reproducibility and validity of dietary assessment instruments. II. A qualitative food frequency questionnaire. Am J Epidemiol 1988b;128:667-76.
Piwoz EG, Huffman SL, Quinn VJ. Promotion and advocacy for improved complementary feeding: can we apply the lessons learned from breastfeeding? Food Nutr Bull 2003;24:29-44.
Position of the American Dietetic Association: breaking the barriers to breastfeeding. J Am Diet Assoc 2001;101:1213-20.
135

Pridham KF. Feeding behavior of 6- to 12-month-old infants: assessment and sources of parental information. J Pediatr 1990;117(suppl):174S-80S.
Pundziute-Lycka A, Dahlquist G, Nyström L, Arnqvist H, Björk E, Blohme G, Bolinder J, Eriksson JW, Sundkvist G, Ostman J; Swedish Childhood Diabetes Study Group. The incidence of Type I diabetes has not increased but shifted to a younger age at diagnosis in the 0-34 years group in Sweden 1983-1998. Diabetologia 2002;45:783-91.
Rasmussen KM. The "foetal origins" hypothesis: challenges and opportunities for maternal and child nutrition. Annu Rev Nutr 2001;21:73-95.
Rasmussen LB, Ovesen L, Bülow I, Knudsen N, Laurberg P, Perrild H. Folate intake, lifestyle factors, and homocysteine concentrations in younger and older women. Am J Clin Nutr 2000; 72:1156-63.
Redondo MJ, Eisenbarth GS. Genetic control of autoimmunity in Type I diabetes and associated disorders. Diabetologia 2002;45:605-22.
Richter JE. Gastroesophageal reflux disease during pregnancy. Gastroenterol Clin North Am 2003;32:235-61.
Riva E, Banderali G, Agostoni C, Silano M, Radaelli G, Giovannini M. Factors associated with initiation and duration of breastfeeding in Italy. Acta Paediatr 1999;88:411-5.
Robinson S, Godfrey K, Osmond C, Cox V, Barker D. Evaluation of a food frequency questionnaire used to assess nutrient intakes in pregnant women. Eur J Clin Nutr 1996;50:302-8.
Rocourt J, BenEmbarek P, Toyofuku H, Schlundt J. Quantitative risk assessment of Listeria monocytogenes in ready-to-eat foods: the FAO/WHO approach. FEMS Immunol Med Microbiol 2003;35:263-7.
Rogers I, Emmett P. Diet during pregnancy in a population of pregnant women in South West England. ALSPAC Study Team. Avon Longitudinal Study of Pregnancy and Childhood. Eur J Clin Nutr 1998;52:246-50.
Rogers I, Emmett P, Baker D, Golding J. Financial difficulties, smoking habits, composition of the diet and birthweight in a population of pregnant women in the South West of England. ALSPAC Study Team. Avon Longitudinal Study of Pregnancy and Childhood. Eur J Clin Nutr 1998;52:251-60.
Rogers IS, Emmett PM, Golding J. The incidence and duration of breast feeding. Early Hum Dev 1997a;49:45S-74S.
Rogers IS, Emmett PM, Golding J. The growth and nutritional status of the breast-fed infant. Early Hum Dev 1997b;49(suppl):157S-74S.
Ronkainen M, Hämäläinen A-M, Koskela P, Åkerblom HK, Knip M; the Finnish TRIGR Study Group. Pregnancy induces non-immunoglobulin insulin-binding activity in both maternal and cord blood serum. Clin Exp Immunology 2001;124:131-6.
Ronningen KS, Keiding N, Green A; EURODIAB ACE Study Group. Europe and Diabetes. Correlations between the incidence of childhood-onset type I diabetes in Europe and HLA genotypes. Diabetologia 2001;44(suppl):B51-9.
136
Roos E, Prättälä R, Lahelma E, Kleemola P, Pietinen P. Modern and healthy?: socioeconomic differences in the quality of diet. Eur J Clin Nutr 1996;50:753-60.
Rothman KJ, Moore LL, Singer MR, Nguyen US, Mannino S, Milunsky A. Teratogenicity of high vitamin A intake. N Engl J Med 1995;333:1369-73.
Royal Society of Chemistry. McCance and Widdowson's the Composition of Foods. 6th edition. New York: Springer-Verlag, 2003.
Ruel MT, Brown KH, Caulfield LE. Moving towards with complementary feeding: Indicators and research priorities. International Food Policy Research Institute (IFPRI) Discussion Paper 146. Food Nutr Bull 2003;24:289-90.
Räisänen S, Nuutinen O, Heinonen K, Kalavainen M. Keskosten ravitsemus imeväisiässä. (in Finnish). Suom Lääkäril 1998;53:267-70.
Räsänen L, Ylönen K. Food composition and nutrient intake of one- to two-year-old Finnish children. Acta Paediatr 1992;81:7-11.
Rössner S, Öhlin A. Pregnancy as a risk factor for obesity: lessons from the Stockholm Pregnancy and Weight Development Study. Obes Res 1995;3(suppl):267S-75S.
Saarinen KM, Juntunen-Backman K, Järvenpää A-L, Kuitunen P, Lope L, Renlund M, Siivola M, Savilahti E. Supplementary feeding in maternity hospitals and the risk of cow's milk allergy: A prospective study of 6209 infants. J Allergy Clin Immunol 1999;104:457-61.
Salmi T. Imetystiheydestä ja –kestosta sekä niihin vaikuttavista tekijöistä synnytyslaitos-, poliklinikka- ja neuvola-aineiston valossa. (in Finnish). Duodecim 1944;10:509-34.
Salminen M, Penttilä P-L. Elintarvikelisäaineiden saanti 1-6-vuotiailla lapsilla. (in Finnish). Elintarvikeviraston tutkimuksia 4/1999. Helsinki: Elintarvikevirasto, 1999.
Sarvas H, Seppälä I, Kurikka S, Siegberg R, Mäkelä O. Half-life of the maternal IgG1 allotype in infants. J Clin Immunol 1993;13:145-51.
Saukkonen T, Savilahti E, Vaarala O, Virtala E, Tuomilehto J, Åkerblom H; the Childhood diabetes in Finland study group. Children with newly diagnosed insulin-dependent diabetes mellitus have increased levels of antibodies to bovine serum albumin but not to ovalalbumin. Diabetes Care 1994;17:970-6.
Savage SA, Reilly JJ, Edwards CA, Durnin JV. Weaning practice in the Glasgow Longitudinal Infant Growth Study. Arch Dis Child 1998;79:153-6.
Savilahti E. Rintamaidon terveydellinen merkitys kehittyneissä maissa. (in Finnish). Duodecim 2005;121:2189-93.
Savilahti E, Saukkonen T, Virtala E, Tuomilehto J, Åkerblom HK; the Childhood diabetes in Finland study group. Increased levels of cow’s milk and betalactoglobulin antibodies in young children with newly diagnosed insulin-dependent diabetes mellitus. Diabetes Care 1993;16:984-9.
137

Savola K, Bonifacio E, Sabbah E, Kulmala P, Vähäsalo P, Karjalainen J, Tuomilehto-Wolf E,Meriläinen J, Åkerblom HK, Knip M. IA-2 antibodies – a sensitive marker of IDDM with clinical onset in childhood and adolescence. Diabetologia 1998a;41:424-9.
Savola K, Sabbah E, Kulmala P, Vähäsalo P, Ilonen J, Knip M. Autoantibodies associated with type 1 diabetes mellitus persist after diagnosis in children. Diabetologia 1998b:41:1293-7.
Scagliusi FB, Polacow VO, Artioli GG, Benatti FB, Lancha AH Jr. Selective underreporting of energy intake in women: magnitude, determinants, and effect of training. J Am Diet Assoc 2003;103:1306-13.
Scholl TO, Hediger ML, Schall JI, Khoo CS, Fischer RL. Dietary and serum folate: their influence on the outcome of pregnancy. Am J Clin Nutr 1996;63:520-5.
Schumann K. Safety aspects of iron in food. Ann Nutr Metab 2001;45:91-101.
Scientific Committee for Food 1990. First Report of the Scientific Committee for Food on the Essential Requirements for Weaning Foods. presented at Food Science and Techniques; CEC; Luxemburg, Belgium. EUR131140 EN 9-38, Series 24. 1990.
Scientific Committee for Food: 31 Series. Nutrient and energy intakes for the European Community. Luxembourg: Office for Official Publications of the European Communities, 1993.
Scott FW. Cow milk and insulin-dependent diabetes mellitus: is there a relationship? Am J Clin Nutr 1990;51:489-91.
Scott FW, Cloutier HE, Kleemann R, Woerz-Pagenstert U, Rowsell P, Modler HW, Kolb H. Potential mechanisms by which certain foods promote or inhibit the development of spontaneous diabetes in BB rats: dose, timing, early effect on islet area, and switch in infiltrate from Th1 to Th2 cells. Diabetes 1997 ;46:589-98.
Scott JA. Breastfeeding: Are boys missing out? Birth 1999;26:276-7. Scott JA, Aitkin I, Binns CW, Aroni RA. Factors associated with the duration of breastfeeding amongst women in Perth, Australia. Acta Paediatr 1999;88:416-21.
Sebire NJ, Jolly M, Harris JP, Wadsworth J, Joffe M, Beard RW, Regan L, Robinson S. Maternal obesity and pregnancy outcome: a study of 287 213 pregnancies in London. Int J Obes 2001;25:1175-82.
Sepa A, Frodi A, Ludvigsson J. Could parenting stress and lack of support/confidence function as mediating mechanisms between certain environmental factors and the development of autoimmunity in children?: a study within ABIS. Ann N Y Acad Sci 2002;958:431-5.
Sepa A, Wahlberg J, Vaarala O, Frodi A, Ludvigsson J. Psychological stress may induce diabetes-related autoimmunity in infancy. Diabetes Care 2005;28:290-5.
Shai I, Shahar DR, Vardi H, Fraser D. Selection of food items for inclusion in a newly developed food-frequency questionnaire. Public Health Nutr 2004;7:745-9.
Sherriff A, Golding J; Alspac Study Team. Factors associated with different hygiene practices in the homes of 15 month old infants. Arch Dis Child. 2002;87:30-5.
138

Siega-Riz AM, Bodnar LM, Savitz DA. What are pregnant women eating? Nutrient and food group differences by race. Am J Obstet Gynecol 2002;186:480-6.
Siega-Riz AM, Evenson KR, Dole N. Pregnancy-related weight gain - a link to obesity? Nutr Rev 2004;62(suppl):105S-11S.
Sihvola V. Vauvamyönteinen Keski-Suomi. Imetys vuonna 1997. (in Finnish). Länsi-Suomen lääninhallituksen julkaisuja nro 2/2001.
Siltanen M, Kajosaari M, Poussa T, Saarinen KM, Savilahti E. A dual long-term effect of breastfeeding on atopy in relation to heredity in children at 4 years of age. Allergy 2003;58:524-30.
Sipetic S, Vlajinac H, Kocev N, Badmanovic S. The Belgrade childhood diabetes study: associations of infections and vaccinations on diabetes in childhood. Ann Epidemiol 2003;13:645-51
Sipetic S, Vlajinac H, Kocev N, Saji S. The Belgrade childhood diabetes study: prenatal and social associations for type 1 diabetes. Paediatr Perinat Epidemiol 2004;18:33-9.
Slorach SA. Dietary intake, in vivo formation and toxicology of nitrates and N-nitroso compounds. Vår Föda 1981;33(suppl):171S-84S.
Smith JL. Foodborne infections during pregnancy. J Food Prot 1999;62:818-29.
Smithells RW, Sheppard S, Schorah CJ, Seller MJ, Nevin NC, Harris R, Read AP, Fielding DW.Possible prevention of neural-tube defects by periconceptional vitamin supplementation. Lancet 1980;1:339-40.
Soltesz G, Jeges S, Dahlquist G. Non-genetic risk determinants for type 1 (insulin-dependent) diabetes mellitus in childhood. Hungarian Childhood Diabetes Epidemiology Study Group. Acta Paediatr 1994;83:730-5.
Sosiaali- ja terveysministeriö. A- ja D-vitamiinivalmisteiden annostelu, lisäruokinnan aloittamisikä. (in Finnish). Dno 44/623/94, 27.7.1994.
Sosiaali- ja terveysministeriö. D-vitamiinivalmisteiden käyttösuositus. Kuntakirje terveyskeskuksia ja sairaaloita ylläpitäville kunnille ja kuntayhtymille. Helsinki: Sosiaali- ja terveysministeriö 2003. Saatavissa: http://www.stm.fi/Resource.phx/ajank/suost/dvitamiini.htx. Haettu: 28.10.2005.
Spalding DA. Instinct with original observation on young animals. Br J Animal Behav 1954;2:2-11. (Reprinted from Macmillan’s Magazine 1873;27:282-93.)
Specker B. Vitamin D requirements during pregnancy. Am J Clin Nutr 2004;80(suppl):1740S-7S.
Stakesin perhesuunnittelun ja äitiyshuollon asiantuntijaryhmä, Kirsi Viisainen, (toim.). Seulontatutkimukset ja yhteistyö äitiyshuollossa, Suositukset 1999. (in Finnish). Stakes Oppaita 34. Helsinki: Stakes, 1999.
Statement of the standing Committee on Nutrition of the British Paediatric Association. Is breast feeding beneficial in the UK? Arch Dis Child 1994;71:376-80.
139

Stene LC, Barriga K, Norris JM, Hoffman M, Erlich HA, Eisenbarth GS, McDuffie RS Jr, Rewers M. Perinatal factors and development of islet autoimmunity in early childhood: the diabetes autoimmunity study in the young. Am J Epidemiol. 2004;160:3-10.
Stene LC, Magnus P, Lie RT, Sovik O, Joner G; Norwegian Childhood Diabetes Study Group. No association between preeclampsia or cesarean section and incidence of type 1 diabetes among children: a large, population-based cohort study. Pediatr Res 2003;54:487-90.
Stene LC, Ulriksen J, Magnus P, Joner G. Use of cod liver oil during pregnancy associated with lower risk of Type I diabetes in the offspring. Diabetologia 2000;43:1093-8.
Stewart KK. What are the variances of food composition data? Editorial. J Food Comp Anal 1997;10:89.
Stram DO, Longnecker MP, Shames L, Kolonel LN, Wilkens LR, Pike MC, Henderson BE. Cost-efficient design of a diet validation study. Am J Epidemiol 1995;142:353-62.
Strandberg TE, Andersson S, Jarvenpää AL, McKeigue PM. Preterm birth and licorice consumption during pregnancy. Am J Epidemiol 2002;156:803-5.
Suitor CJW, Gardner J, Willett WC. A comparison of food frequency and diet recall methods in studies of nutrient intake of low-income pregnant women. J Am Diet Assoc 1989;89:1786-94.
Tai T-Y, Wang C-Y, Lin LL-K, Lee L-T, Tsai S-T, Chen C-J. A case-control study on risk factors for type 1 diabetes in Taipei city. Diabetes Res Clin Pract 1998;42:197-203.
Tepora E, Nurttila A, Sairanen S, Riihelä J. Vantaalaisen vauvan äidinmaitokausi vuonna 1997. (Breast-feeding of babies in Vantaa in 1997). (in Finnish with an English summary). Vantaan kaupunki. Sosiaali- ja terveydenhuollon toimialan julkaisuja C:14:1999.
Thernlund GM, Dahlquist G, Hansson K, Ivarsson SA, Ludvigsson J, Sjoblad S, Hagglof B. Psychological stress and the onset of IDDM in children. Diabetes Care 1995;18:1323-9.
Thompson FE, Byers T. Dietary assessment resource manual. J Nutr 1994;124(suppl):2245S-317S.
Thompson FE, Metzner HL, Lamphiear DE, Hawthorne VM. Characteristics of individuals and long term reproducibility of dietary reports: the Tecumseh Diet Methodology Study. J Clin Epidemiol 1990;43:1169-78.
Tsubono Y, Nishino Y, Fukao A, Hisamichi S, Tsugane S. Temporal change in the reproducibility of a self-administered food frequency questionnaire. Am J Epidemiol 1995;142:1231-5.
Turner RE, Langkamp-Henken B, Littell RC, Lukowski MJ, Suarez MF. Comparing nutrient intake from food to the estimated average requirements shows middle- to upper-income pregnant women lack iron and possibly magnesium. J Am Diet Assoc 2003;103:461-6.
Underwood BA, Hofvander Y. Appropriate timing for complementary feeding of the breast-fed infant. A review. Acta Paediatr Scand 1982;294(suppl):1S-32S.
UNICEF. Breastfeeding: foundation for a healthy future. Copenhagen: UNICEF Geneva Region, 1999.
140

Vaarala O. Gut and induction of immune tolerance in type 1 diabetes. Diabetes Metab Rev 1999;15:353-61.
Vaarala O, Hyöty H, Åkerblom HK. Environmental factors in the aetiology of childhood diabetes. Diabetes Nutr Metab 1999;12:75-85.
Vaarala O, Paronen J, Otonkoski T, Åkerblom HK. Cow milk feeding induces antibodies to insulin in children - a link between cow milk and insulin-dependent diabetes mellitus? Scand J Immunol 1998;47:131-5.
Vaarala O, Saukkonen T, Savilahti E, Klemola T, Åkerblom HK. Development of immune response to cow’s milk proteins in infants receiving cow’s milk or hydrolyzed formula. Journal of Allergy & Clinical Immunology 1995;96:917-23.
Valtion ravitsemusneuvottelukunta. Suomalaiset ravitsemussuositukset. (The Finnish nutrition recommendations). (in Finnish). Komiteamietintö 1998:7. Helsinki: Maa- ja metsätalousministeriö, 1998.
Valtion ravitsemusneuvottelukunta. Suomalaiset ravitsemussuositukset – ravinto ja liikunta tasapainoon. (The Finnish nutrition recommendations). (in Finnish). Helsinki: Maa- ja metsätalousministeriö, 2005.
van Odijk J, Kull I, Borres MP, Brandtzaeg P, Edberg U, Hanson LA, Host A, Kuitunen M, Olsen SF, Skerfving S, Sundell J, Wille S. Breastfeeding and allergic disease: a multidisciplinary review of the literature (1966-2001) on the mode of early feeding in infancy and its impact on later atopic manifestations. Allergy 2003;58:833-43.
Verkasalo M. Recent trends in breast-feeding in southern Finland. Acta Paediatr Scand 1980;69:89-91.
Verronen P, Lammi A, Mäkelä I, Saarikoski S, Tamminen T, Visakorpi JK. Rintaruokinnan edistäminen synnytyssairaalassa ja lastenneuvolassa. (in Finnish). Duodecim 1981;97:1768-75.
Vieth R. Vitamin D supplementation, 25-hydroxyvitamin D concentrations, and safety. Am J Clin Nutr 1999;69:842-56.
Viinisalo M. Raaka-aineista aterioihin. Teoksessa: Leskinen J, Hallman H, Isoniemi M, Perälä L, Pohjoisaho T, Pylvänäinen E, (toim.). Vox consumptoris – Kuluttajan ääni. (in Finnish). Kuluttajatutkimuskeskuksen vuosikirja 2005. Helsinki: Kuluttajatutkimuskeskus, 2005.
Villar J, Merialdi M, Gülmezoglu AM, Abalos E, Carroli G, Kulier R, de Oni M. Nutritional interventions during pregnancy for the prevention or treatment of maternal morbidity and preterm delivery: an overview of randomized controlled trials. J Nutr 2003;133(suppl):1606S-25S.
Vingraite J, Bartkeviciute R, Michaelsen KF. A cohort study of term infants from Vilnius, Lithuania: feeding patterns. Acta Paediatr 2004;93:1349-55.
Virkkunen L. Ensimmäisen ikävuoden aikaisista ruokintatavoista ja 1-vuotiaiden lasten ravinnonsaannista Espoossa ja Kiuruvedellä (pro gradu –työ; Master’s thesis). (in Finnish). Helsinki: Helsingin yliopisto, ravitsemustieteen laitos, 1978.
141

Virtanen SM, Hyppönen E, Läärä E, Vähäsalo P, Kulmala P, Savola K, Räsänen L, Aro A, Knip M, Åkerblom HK. Cow’s milk consumption, disease associated autoantibodies and Type 1 diabetes mellitus: a follow-up study in siblings of diabetic children. Diabetic Med 1998;15:730–38.
Virtanen SM, Jaakkola L, Räsänen L, Ylönen K, Aro A, Lounamaa R, Åkerblom HK, Tuomilehto J. Nitrate and nitrite intake and the risk for type 1 diabetes in Finnish children. Diabetic Med 1994;11:656-62.
Virtanen SM, Knip M. Nutritional risk predictors of cell autoimmunity and type 1 diabetes at a young age. Am J Clin Nutr 2003;78:1053-67.
Virtanen SM, Räsänen L, Aro A, Lindström J, Sippola H, Lounamaa R, Toivanen L, Tuomilehto J, Åkerblom HK; the Childhood Diabetes in Finland Study Group. Infant feeding in Finnish children < 7 yr of age with newly diagnosed IDDM. Diabetes Care 1991;14:415-7.
Wadsworth EJK, Shield JPH, Hunt LP, Baum JD. A case-control study of environmental factors associated with diabetes in the under 5s. Diabetic Med 1997;14:390-6.
Wagener DK, LaPorte RE, Orchard TJ, Cavender D, Kuller LH, Drash AL. The Pittsburgh diabetes mellitus study 3: an increased prevalence with older maternal age. Diabetologia 1983;25:82-5.
Waterland RA, Garza C. Potential mechanism of metabolic imprinting that lead to chronic disease. Am J Clin Nutr 1999;69:179-97.
Wei EK, Gardner J, Field AE, Rosner BA, Colditz GA, Suitor CW. Validity of a food frequency questionnaire in assessing nutrient intakes of low-income pregnant women. Matern Child Health J 1999;3:241-6.
Weihrauch MR, Diehl V. Artificial sweeteners - do they bear a carcinogenic risk? Ann Oncol 2004;15:1460-5.
Wharton B. Patterns of complementary feeding (weaning) in countries of the European Union: Topic for research. Pediatrics 2000;106:1273
Whitehead RG, Paul AA. Growth charts and the assessment of infant feeding practices in the western world and in developing countries. Early Hum Dev 1984;9:187-207.
WHO. Guidelines for Drinking-water Quality, 2nd Ed., Addendum to Volume 2. Health Criteria and Other Supporting Information, Geneva: World Health Organization, 1998.
WHO. Growth patterns of breastfed infants in seven countries. WHO Working Group on the Growth Reference Protocol and WHO Task Force on Methods for the Natural Regulation of Fertility. Acta Paediatr 2000;89:215-22.
WHO. Infant and young child nutrition. Global strategy on infant and young child feeding. WHO 55th World Health Assembly, 16 April 2002. A55/15. Available at: http://www.who.int/gb/ebwha/pdf_files/WHA55/ea5515.pdf.
WHO. Global Strategy for Infant and Young Child Feeding. Geneva: World Health Organization, 2003.
WHO/UNICEF. Protecting, promoting and supporting breastfeeding. The special role of maternity services. A Joint WHO/UNICEF Statement. Geneva: World Health Organization, 1989.
142

Widdowson EM. Changes in body composition during growth. In: Davis JA, Dobbings J, eds. Scientific foundations of pediatrics. London: Wm Heinemann Medical Bools, 1981:330-42.
Willett WC. Future directions in the development of food-frequency questionnaires. Am J Clin Nutr 1994;59(suppl):171S-4S.
Willett W. Nutritional epidemiology. 2nd ed. New York: Oxford University Press, 1998. Willett WC, Howe GR, Kushi L. Adjustment for total energy intake in epidemiologic studies. Am J Clin Nutr 1997;65(suppl):1220S-8S.
Williams AJK, Bingley PJ, Bonifacio E, Palmer JP, Gale EAM. A novel micro-assay for insulin autoantibodies. J Autoimmun 1997;10:473-8.
Williams AJK, Bingley BJ, Moore WPT, Gale EAM; ENDIT Screening Group. Islet autoantibodies, nationality and gender: a multinational screening study in first-degree relatives of patients with type I diabetes. Diabetologia 2002;45:217-23.
Wirfält E. Cognitive aspects of dietary assessment. Scand J Nutr 1998;42:56-9.
Wolk A, Ljung H, Vessby B, Hunter D, Willett WC. Effect of additional questions about fat on the validity of fat estimates from a food frequency questionnaire. Study Group of MRS SWEA. Eur J Clin Nutr 1998;52:186-92.
Wright A, Schanler R. The resurgence of breastfeeding at the end of the second millennium. J Nutr. 2001;131(suppl):421S-5S.
Wu G, Bazer FW, Cudd TA, Meininger CJ, Spencer TE. Maternal nutrition and foetal development. J Nutr 2004;134:2169-72.
Yngve A, Sjöström M. Breastfeeding in countries of the European Union and EFTA: current and proposed recommendations, rationale, prevalence, duration and trends. Public Health Nutrition 2001a;4:631-45.
Yngve A, Sjöström M. Breastfeeding determinants and a suggested framework for action in Europe. Public Health Nutrition 2001b;4:729-39.
Zeiger RS. Dietary aspects of food allergy prevention in infants and children. J Pediatr Gastroenterol Nutr 2000;30(suppl):77S-86S.
Ziegler AG, Schmid S, Huber D, Hummel M, Bonifacio E. Early infant feeding and risk of developing type 1 diabetes-associated autoantibodies. JAMA. 2003;290:1721-8.
Åkerblom HK, Knip M. Putative environmental factors in type 1 diabetes. Diabetes Metab Rev 1998;14:31-67.
Åkerblom HK, Savilahti E, Vaarala O. Cow’s milk protein and insulin-dependent diabetes mellitus. Scand J Nutr 1996;40:98-103.
Åkerblom HK, Virtanen SM, Ilonen J, Savilahti E, Vaarala O, Reunanen A, Teramo K, Hämäläinen A-M, Paronen J; National TRIGR Study Groups. Dietary manipulation of beta cell autoimmunity in infants at increased risk of type 1 diabetes: a pilot study. Diabetologia 2005;48:829-37.
143


I

American Journal of EpidemiologyCopyright © 2001 by the Johns Hopkins University Bloomberg School of Public HealthAll rights reserved
466
Vol. 154, No. 5Printed in U.S.A.
Validation Study among Pregnant Finnish Women Erkkola et al.PRACTICE OF EPIDEMIOLOGY
Validity and Reproducibility of a Food Frequency Questionnaire for PregnantFinnish Women
Maijaliisa Erkkola,1,2 Marja Karppinen,3 Juha Javanainen,4 Leena Räsänen,5 Mikael Knip,2,6,7 and Suvi M.Virtanen1,4,6
The authors developed a self-administered 181-item food frequency questionnaire (FFQ) to assess dietaryintake during pregnancy for Finnish women from August 1995 to July 1996. In the validation study (n = 113), thedata that were collected by using two 5-day food records completed during the eighth month of pregnancy werecompared with FFQ data. The intake of foods and nutrients was higher as determined by FFQ than thatassessed using food records. Pearson correlation coefficients for nutrients, after adjustment for energy, rangedfrom 0.19 (vitamin E) to 0.70 (thiamin) and, for foods, from 0.03 (high-fat milk) to 0.84 (low-fat milk). Energyadjustment improved the correlations for nutrients. Correction for attenuation improved correlations for bothfoods and nutrients. On average, 70% of the foods and 69% of the nutrients fell into the same or adjacentquintiles, according to the FFQ and the food record. In the reproducibility study, 111 women completed the FFQstwice at a 1-month interval. The intraclass correlation coefficients for nutrients ranged from 0.42 (ethanol) to 0.72(sucrose, riboflavin, and calcium), and for foods, they ranged from 0.44 (ice cream) to 0.91 (coffee). The authorsconclude that the FFQ has an acceptable reproducibility and represents a useful tool for categorizing pregnantwomen according to their dietary intake. Am J Epidemiol 2001;154:466–76.
diet; pregnancy; questionnaires; reproducibility of results
Received for publication August 21 2000, and accepted for publi-cation January 31, 2001.
Abbreviations: FFQ, food frequency questionnaire; SD, standarddeviation.
1 Tampere School of Public Health, University of Tampere,Tampere, Finland.
2 Hospital for Children and Adolescents, University of Helsinki,Helsinki, Finland.
3 Oulu Deaconess Institute, Oulu, Finland.4 Nutrition Unit, National Public Health Institute, Helsinki, Finland.5 Department of Applied Chemistry and Microbiology, Division of
Nutrition, University of Helsinki, Helsinki, Finland.6 Medical School, University of Tampere, and Department of
Pediatrics, Tampere University Hospital, Tampere, Finland.7 Department of Pediatrics, University of Oulu, Oulu, Finland.Correspondence to Dr. Suvi M. Virtanen, School of Public Health,
FIN-33014 University of Tampere, Tampere, Finland (e-mail:[email protected]).
There is increasing evidence that nutrients may be impor-tant in the development of some chronic diseases duringfetal life (1). Observations suggesting that the destruction ofthe insulin-producing beta cells may begin before birth (2)led us to develop a food frequency questionnaire (FFQ) tobe able to assess the diet of pregnant women in a prospec-tive study on the development and determinants of type 1diabetes (www.utu.fi/research/dipp). FFQs have beenshown to be an appropriate method for assessing diet in awide variety of epidemiologic settings, including studiesamong pregnant women (3–7). In comparison with short-term food records, the FFQ provides a better approximation
of the habitual diet over a longer period (8). Although FFQsare not considered appropriate for estimating actual nutrientintake, they can be used for categorizing persons accuratelyaccording to intake and for identifying subjects at theextremes of intake. Among the feasible comparative meth-ods available for validating an FFQ, food records are likelyto have the smallest correlated errors (8) and have thereforebeen commonly used for this purpose.
The objective of this study was to assess the repro-ducibility and validity of a 181-item FFQ among women inthe third trimester of pregnancy.
MATERIALS AND METHODS
Study design
The participants in the reproducibility study completedthe FFQ twice at a 1-month interval and at the beginning andthe end of the eighth month of pregnancy (figure 1). Theparticipants in the validation study completed the FFQ 1month before the start of the pregnancy leave (at the begin-ning of the eighth month of pregnancy) and 1 month afterdelivery. Food records were kept for 10 days (twice during5 consecutive days at least 1 week apart) during the monthpreceding the pregnancy leave. The food record was chosenas the reference method since it is reliable for measuring theactual food consumption of an person and since its errors donot usually correlate with those of the food frequency

Validation Study among Pregnant Finnish Women 467
Am J Epidemiol Vol. 154, No. 5, 2001
FIGURE 1. The design of the validation study among pregnant Finnish women, August 1995 to July 1996. FFQ, food frequency questionnaire;FR, food record.
method. Ethical approval for this study was obtained fromthe Ethical Committee of Oulu University Medical Schooland the Ethics Committee of the Public Health CareDepartment, City of Oulu, Finland.
Subjects
All of the pregnant women in their third trimester whowere attending 13 maternity clinics in the city of Oulubetween August 1995 and April 1996 were personallyinvited by their midwives to take part in the study. Thewomen were alternately asked to participate in either thereproducibility study or the validation study.
Of the 123 pregnant women invited to take part in thereproducibility study, 111 (90 percent) completed the study.The reasons given for refusing to take part were moving toanother area (n � 2) and complications during pregnancy (n � 1). Two women reported no reason. Among the 118women who agreed to continue, 117 returned the first ques-tionnaire and 113 returned the second. The results of twowomen were excluded from the analysis because of poorlycompleted questionnaires.
Altogether, 141 pregnant women were invited to partici-pate in the validation study. Five women refused due to thestrain of record keeping, and four refused because of com-plications in their pregnancies. Two women reported no specific reason. Of the 130 subjects who agreed to continue,127 returned the first FFQ, 125 returned the first 5-day foodrecord, 120 returned the second 5-day food record, and,finally, 116 returned the second FFQ. The reasons for givingup on the study included the burden of record keeping (n �5) and premature birth (n � 2), while no reason was givenby seven subjects. In the analysis, the results from three
women were excluded because of incomplete food records.As a result, the final sample for the validation study com-prised 113 women (80 percent of those invited). One record-ing day was removed for one participant and two for anotherwoman due to gastroenteritis.
Sociodemographic data were collected by using a struc-tured questionnaire. The participants in the validation studywere similar to those in the reproducibility study with respectto age (mean, 29.6 years (5.1 standard deviation (SD))), bodymass index at the beginning of pregnancy (mean, 22.7 (3.5SD) for the validation study vs. 22.9 (3.2 SD) kg/m2 for thereproducibility study), the proportion of women educated forat least 13 years (72 for the validation study vs. 75 percent forthe reproducibility study), and number of previous pregnan-cies (median � 1 for both groups). The distribution of all sub-jects by age and education was representative of pregnantFinnish women in general (9).
FFQ
Pietinen et al. (10, 11) developed a food use questionnaireof 276 food items for measuring the dietary intake of 29,000healthy, middle-aged Finnish men participating in theAlpha-Tocopherol Beta-Carotene Cancer Prevention Study.That questionnaire was further modified into a semiquanti-tative FFQ comprising 110 food items for studying the dietof Finnish women participating in the Kuopio Breast CancerStudy (12). When further developing that questionnaire, wewere able to use the information on the food consumption ofwomen of childbearing age living in four different areas inFinland (North Karelia, Kuopio Province, Turku-Loimaa,and the capital area of Helsinki-Vantaa) collected by using
468 Erkkola et al.
Am J Epidemiol Vol. 154, No. 5, 2001
food records in the Finrisk Study (13) 1 year before our fieldstudy. The questionnaire was specifically designed to reflectthe Finnish food consumption habits. The “recipe” behindeach food item was now weighted by the frequencies of con-sumption in the food group considered (e.g., the recipe forbreakfast cereals consists of rice crisps, 33 percent; cornflakes, 23 percent; cereals with added sugar, 22 percent; andWeetabix (Weetabix Company, Kettering, Northants, UnitedKingdom), 22 percent). We used open-frequency categoriesin increasing order: less than once per month and how manytimes per month, week, or day. The serving sizes were basedon commonly used portions identified during earlier Finnishdietary studies (14, 15), and for some foods (e.g. eggs andbeverages), natural units were used.
The FFQ was designed to assess the entire diet over aperiod of 1 month. The main aim was to rank persons accord-ing to their food consumption and nutrient intake. The ques-tionnaire comprised 181 food items and mixed dishes,grouped under subheadings: “milk products,” “potato, rice,and pasta as a side dish,” “cereals,” “fat on bread/spreads,”“fruits and berries,” “vegetables,” “salad dressings,” “warmmain courses,” “fish and eggs,” “beverages,” and “desserts,sweets, and snacks.” There were additional empty lines foreach food group to record foods not listed on the question-naire. Moreover, questions were asked about where themeals were usually eaten (at home, in a cafeteria/restaurant)and the type of fat used in food preparation, baking, andsalad dressings. Intake from dietary supplements was notincluded in this analysis, since this analysis focused on foodsand nutrients obtained from the diet only.
We developed a software program linking the food fre-quency data with the nutrient software program developed atthe National Public Health Institute, Helsinki, Finland (16).The program can accommodate the women’s personalchoices for fat (in cooking, baking, and salad dressings),which were asked about on the questionnaire. In the valida-tion study, we took into account the women’s personalchoices for fat in cooking. We used butter in cooking in allrecipes for those subjects who generally ate their meals athome and used butter in cooking. For other subjects, wedetermined the recipe fat to be butter, margarine, and oil inequal proportions, assuming that people who eat lunch atwork do not usually know what type of fat is used in cooking.
Food records
Food consumption data were collected by means of two5-day estimated food records. The first record was kept dur-ing weeks 29–32 of gestation, and the second was kept dur-ing weeks 33–36 of gestation. The time interval between thetwo records had to be at least 1 week. The food records cov-ered 4 weekdays and 1 weekend day. The investigator (M.Karppinen) set the days to be recorded during the first meet-ing with the study subject, and these were mutually agreedupon. Each subject was then instructed to record everythingshe consumed during the recording periods. A booklet with126 pictures of common food items and mixed dishes wasused to facilitate the estimation of portion sizes (15).Immediately after each recording period, the records were
checked at the maternity clinics by the investigator who alsoguided the record keeping by giving participants personaland written instructions in advance. Two university studentswho were majoring in human nutrition coded the dietaryrecords.
Analysis of food consumption data
The food consumption data were analyzed by using asoftware program developed at the National Public HealthInstitute (16). The food composition database of theNational Public Health Institute is continuously updated andis the most comprehensive one in Finland. Nutrient values inthe food composition database are derived mainly fromchemical analyses of Finnish foods. In addition, comple-mentary data are obtained from the Finnish food industryand international food composition tables. The database cur-rently includes about 1,600 individual food items and mixeddishes and more than 200 nutrients and other dietary factors.The system allows creation or modification of specificrecipes, and the women’s personal recipes were used when-ever possible. However, standard recipes in the database arebased on current Finnish cookbooks.
Statistical methods
The reproducibility study. Means and standard devia-tions for food consumption and nutrient intake were calcu-lated for both of the questionnaires. Intraclass correlationwas used to measure the reproducibility between the firstand the second questionnaires. Intraclass correlation mea-sures the fraction of total variation that is due to between-individual variability. A high value for the coefficient meansa low within-person variation.
The validation study. Means and standard deviationsfor food consumption and nutrient intake were calculatedfor the questionnaires and for the food records. The dietaryvariables were log transformed when necessary to meet theassumptions of normal distribution. The formula log(x �1) was used because not all subjects consumed each fooditem, and the untransformed value would then have beenzero. Pearson product-moment correlations were used tocompare food and nutrient intake from FFQs with thosefrom food records (average intake of nutrients and con-sumption of foods during 10 days). Spearman nonparamet-ric rank correlation coefficients were compared withPearson coefficients for log-transformed values of foodsand nutrients, which retained a skewed distribution. Sincethe results were quite similar, only Pearson correlations arepresented. In addition to comparisons based on absolutefood consumption and nutrient intake, comparisons werealso made using energy-adjusted variables. Because mostof the food groups correlated with total energy intake, anenergy adjustment method was also used with food groupdata. Adjustment for total energy intake was made by usingthe residual method of Willett (8). Residuals are computedfrom regression models, with total energy as the indepen-dent variable and food consumption or nutrient intake asthe dependent variable. The correction of the observed cor-

Validation Study among Pregnant Finnish Women 469
Am J Epidemiol Vol. 154, No. 5, 2001
relations for the attenuating effect of random within-person error can be written as
,
where λx is the ratio of the within- and between-person vari-ances for x, and nx is the number of replicates per person forthe x variable (8, 17). For this study, n � 10 represents eachrecording day. Fisher’s normalizing transformation
z � 1⁄2loge [11 � r2 11 – r2] with s � e1z2 � 1 1n – 321⁄2
was used to calculate 95 percent confidence intervals for thePearson correlation coefficient r. Since the width of theinterval was affected only by the number of subjects, wepresent the results for the minimum and maximum values ofcorrelation below the tables.
The degree of misclassification across categories betweenthe FFQ and the dietary records was examined by dividing foodconsumption and nutrient intake into quintiles based on bothmethods. The proportions of correctly categorized subjects inthe same or adjacent quintiles were calculated. Statistical analy-ses were performed using SAS procedures (18).
>>
rt � ro211 � λx>nx2
RESULTS
Reproducibility
The mean intake of all foods and nutrients, except forhigh-fat milk, buttermilk, and soft margarine, were gener-ally higher when estimated using the second question-naire than the first (tables 1 and 2). The most conspicuousdifferences (>±25 percent) between the first and the second questionnaires among foods were for high-fatmilk, soft drinks, vegetables, ice cream, and fish, andamong nutrients, the largest difference was for ethanol.The intraclass correlation coefficients between question-naires (table 1) ranged from 0.44 (ice cream) to 0.91 (cof-fee) for foods. The correlation coefficients were highestfor the items consumed daily, such as coffee (0.91), low-fat milk (0.85), and butter (0.81) and lowest for rarelyeaten foods such as ice cream (0.44), oils (0.54), and low-fat spreads (0.55) (table 1). The intraclass correlationcoefficients for nutrients (table 2) ranged from 0.42 forethanol to 0.72 for sucrose, riboflavin, and calcium. Theaverage of all correlation coefficients for foods and nutri-ents was 0.65.
TABLE 1. Reproducibility study: mean daily consumption of foods (g/day) on the basis of foodfrequency questionnaires and intraclass correlations* between questionnaires completed by111 pregnant Finnish women, August 1995 to July 1996
Rye productsWheat productsPotatoesRootsVegetablesFruitsFruit juicesBerriesButterSoft margarineLow-fat spreadsOilsHigh-fat milkLow-fat milkButtermilkCreamCheeseIce creamPorkBeefPoultrySausagesInner organsFishEggsCoffeeTeaSoft drinksSweets
Foodgroup
FFQ1†(mean (SD†))
69 (48)120 (46)121 (52)39 (34)
125 (76)252 (183)241 (209)31 (26)9.3 (8.4)
13 (33)3.2 (10.6)4.5 (2.4)
22 (105)461 (356)86 (148)11 (6)60 (46)12 (14)44 (18)16 (13)19 (20)28 (25)4.0 (4.3)
19 (14)25 (12)
208 (200)106 (123)56 (87)21 (25)
% ofFFQ1
FFQ2†
Mean(SD)
* Values log-transformed when necessary.† FFQ1, food frequency questionnaire 1; SD, standard deviation; FFQ2, food frequency questionnaire 2.
FFQ1 + FFQ2intraclass correlation
coefficient
78 (53)130 (44)138 (61)43 (38)
165 (86)257 (203)299 (277)38 (30)10.2 (10.6)12 (29)3.2 (10.3)5.2 (2.7)
10 (72)473 (334)66 (103)13 (8)66 (45)16 (20)48 (20)18 (11)19 (15)32 (22)4.3 (4.5)
24 (18)28 (17)
235 (211)118 (132)74 (125)23 (23)
11310811410913210212412211092
10011647
10377
122111131109111100112108130111113111133109
0.670.620.670.650.570.720.590.760.810.680.550.540.600.850.570.580.710.440.560.600.750.620.710.640.660.910.770.590.64

470 Erkkola et al.
Am J Epidemiol Vol. 154, No. 5, 2001
Validity
Food consumption was more likely to be overestimatedthan underestimated by the questionnaires; the estimates fromthe questionnaires were approximately 134 percent (first ques-
tionnaire, data not shown) and 129 percent (second question-naire) of the values of the food records (table 3). The mostmarked overestimates (questionnaire ≥160 percent of foodrecord) were for pork, soft margarine, fruit juices, innerorgans, low-fat spreads, and vegetables. The most striking
TABLE 2. Reproducibility study: mean daily intakes of nutrients and other dietary factors on the basisof food frequency questionnaires and intraclass correlations* between questionnaires completed by 111pregnant Finnish women, August 1995 to July 1996
Energy (kcal)Protein (g)Total carbohydrate (g)Available carbohydrate (g)Starch (g)Sucrose (g)Dietary fiber (g)Water-soluble fiber (g)Water-insoluble fiber (g)Total fat (g)Total triglycerides (g)Saturated fatty acids (g)Monounsaturated fatty acids (g)Polyunsaturated fatty acids (g)Total n-3 fatty acids (g)Total n-6 fatty acids (g)Ethanol (g)Vitamin A (RE†, μg)Total retinol (μg)Carotenoids (μg)β-Carotene (μg)Vitamin D (μg)Vitamin E (mg)Thiamin (mg)Riboflavin (mg)Niacin (mg)Folate (μg)Vitamin B
12(μg)
Biotin (μg)Pyridoxine (mg)Pantothenic acid (μg)Vitamin C (mg)Calcium (mg)Potassium (g)Copper (mg)Iron (mg)Magnesium (mg)Sodium (mg)Zinc (mg)Manganese (mg)Iodine (μg)Selenium (μg)Chromium (μg)Mercury (μg)Lead (μg)Nitrate (mg)Nitrite (mg)
Dietaryfactor
FFQ1†(mean (SD†))
2,517 (689)101 (27)336 (89)278 (72)132 (35)63 (28)27 (9)6.7 (2.5)
20 (7)91 (37)81 (35)37 (14)27 (12)12 (8)2.2 (1.2)
11 (11)0.4 (0.9)
1,548 (795)876 (670)
6,998 (3,643)3,848 (2,747)
4.2 (2.7)12 (6)2.1 (0.7)2.6 (0.8)
37 (9)386 (114)
8.0 (3.2)44 (12)2.5 (0.6)7.9 (2.0)
220 (109)1,710 (654)
5.0 (1.3)2.1 (0.7)
16 (4)459 (116)
3,954 (1,011)15 (4)7.0 (2.3)
345 (93)70 (18)34 (10)5.4 (2.2)
32 (12)82 (42)1.7 (0.8)
% ofFFQ1
FFQ2†
Mean(SD)
* Values log-transformed when necessary.† FFQ1, food frequency questionnaire 1; SD, standard deviation; FFQ2, food frequency questionnaire 2; RE,
retinol equivalent.
FFQ1 + FFQ2intraclass correlationcoefficient
2,760 (697)109 (27)370 (100)306 (79)144 (40)73 (31)29 (10)7.2 (2.6)
22 (8)100 (34)89 (31)41 (14)29 (11)13 (7)2.4 (1.1)
12 (9)0.7 (2.4)
1,705 (814)948 (604)
8,334 (4,146)4,365 (2,973)
4.6 (2.5)13 (5)2.3 (0.6)2.8 (0.8)
41 (10)435 (118)
8.7 (3.0)48 (13)2.8 (0.7)8.7 (2.1)
245 (124)1,812 (632)
5.5 (1.4)2.3 (0.7)
17 (5)503 (129)
4,374 (1,105)17 (4)7.8 (2.6)
377 (100)77 (19)38 (11)6.5 (2.6)
36 (15)96 (44)1.9 (0.8)
110109110110109116110107111110109111110108109109175110108119113110108110108110113109109112110112106110110111110111110111109109112120112117112
0.660.670.670.650.620.720.660.690.650.630.630.650.620.650.620.670.420.690.700.620.640.620.630.630.720.640.640.690.670.650.680.660.720.700.560.640.680.660.660.630.710.630.640.650.590.710.65

Validation Study among Pregnant Finnish Women 471
Am J Epidemiol Vol. 154, No. 5, 2001
underestimate was for soft drinks. The mean nutrient intakesassessed using the FFQs were 138 (first questionnaire, datanot shown) and 136 percent (second questionnaire) of the val-ues, based on the means of 10-day food records (table 4). Themost marked overestimates (questionnaire ≥160 percent offood record) were observed for thiamin and nitrate.
The unadjusted Pearson correlation coefficients for foods(table 3) ranged from 0.01 for high-fat milk to 0.97 for cof-fee. The correlations for foods were stronger than those fornutrients (mean, 0.48 vs. 0.38 (first questionnaire, data notshown) and 0.47 vs. 0.37 (second questionnaire)) and tendedto be stronger for foods consumed with higher frequency.Adjustment for energy led to the most conspicuous changesfor the intake of butter, sausages, and pork and the correc-tion for attenuation for the consumption of eggs, potatoes,sausages, and berries. The adjusted and corrected correla-tion coefficients then ranged from 0.04 to 0.86.
The average correlation coefficient for nutrients was 0.37(table 4). The energy-adjusted Pearson correlation coeffi-cients for nutrients varied from 0.19 to 0.70. The most notablechanges compared with the unadjusted values were observedfor pantothenic acid, niacin, and chromium. When the effectof attenuation was taken into account, the coefficients rangedfrom 0.22 to 0.74. According to the improvement in the cor-relation coefficient, when attenuation was taken into account,the subjects had the greatest within-person variation in theintakes of total triglycerides, vitamin D, mercury, nitrite, cop-per, and vitamin B
12.
Classification
The subjects were divided into quintiles by food consump-tion (table 5) and nutrient intake (energy-adjusted estimates)(table 6) as measured by using FFQs and food records.
TABLE 3. Validation study: mean daily intakes of foods based on food records and food frequencyquestionnaires: Pearson correlation coefficients* between daily consumption of foods, on the basis offood frequency questionnaires and food records completed by 113 pregnant Finnish women, August1995 to July 1996
Rye productsWheat productsPotatoesRootsVegetablesFruitsFruit juicesBerriesButterSoft margarineLow-fat spreadsOilsHigh-fat milkLow-fat milkButtermilkCreamCheeseIce creamPorkBeefPoultrySausagesInner organsFishEggsCoffeeTeaSoft drinksSugar and sweets
Foodgroup
Foodrecord
(mean (SD†))
50 (30)105 (38)91 (42)36 (31)
102 (90)212 (140)113 (113)42 (37)11 (10)8.3 (8)4.6 (7.2)4.1 (2.3)6.9 (19)
399 (301)47 (70)11 (10)51 (28)15 (19)25 (16)20 (21)14 (18)35 (24)2.5 (5.9)
16 (17)21 (11)
199 (170)159 (186)72 (102)45 (23)
Unadjusted‡
Pearson correlation coefficients betweenFFQ and food recordFFQ†
(% offood records)
* Based on log-transformed values.† SD, standard deviation; FFQ, food frequency questionnaire.‡ Ninety-five percent confidence intervals for the minimum (r = 0.01, 95% confidence interval: –017, 0.19) and
maximum (r = 0.97, 95% confidence interval: 0.96, 0.98) values of correlation.
Energyadjusted
1251221451441641161689495184166133124125138109120101188114147111167148133108888391
0.570.470.410.510.610.550.620.520.480.610.420.140.010.810.410.090.560.370.450.350.240.770.340.440.270.970.710.440.46
0.550.440.490.570.580.470.730.590.730.600.240.180.030.840.480.160.560.500.300.270.280.620.290.370.350.770.780.410.50
Attenuationand energy
adjusted
0.590.520.590.640.600.500.780.680.770.640.250.220.040.860.520.190.610.580.380.330.370.720.360.440.450.790.800.460.58

472 Erkkola et al.
Am J Epidemiol Vol. 154, No. 5, 2001
An average of 70 percent (52–94 percent) of the womenwere classified by both methods into the same or adjacentquintiles according to their food intake, and an average of 69
percent (58–81 percent) were classified as such according tonutrient intakes. For foods, only five of 30 proportionsremained under 60 percent, and for the nutrients, only two
TABLE 4. Validation study: mean daily intakes of nutrients based on food records and food frequencyquestionnaires: Pearson correlation coefficients* between daily intake of nutrients, on the basis of foodfrequency questionnaires and food records completed by 113 pregnant Finnish women, August 1995 toJuly 1996
Energy (kcal)Protein (g)Total carbohydrate (g)Available carbohydrate (g)Starch (g)Sucrose (g)Dietary fiber (g)Water-soluble fiber (g)Water-insoluble fiber (g)Total fat (g)Total triglycerides (g)Saturated fatty acids (g)Monounsaturated fatty acids (g)Polyunsaturated fatty acids (g)Total n-3 fatty acids (g)Total n-6 fatty acids (g)Ethanol (g)Vitamin A (RE†, μg)Total retinol (μg)Carotenoids (μg)β-Carotene (μg)Vitamin D (μg)Vitamin E (mg)Thiamin (mg)Riboflavin (mg)Niacin (mg)Folate (μg)Vitamin B
12(μg)
Biotin (μg)Pyridoxine (mg)Pantothenic acid (μg)Vitamin C (mg)Calcium (mg)Copper (mg)Iron (mg)Magnesium (mg)Sodium (mg)Zinc (mg)Manganese (mg)Iodine (μg)Selenium (μg)Chromium (μg)Mercury (μg)Lead (μg)Nitrate (mg)Nitrite (mg)
Dietaryfactor
Foodrecord
(mean (SD†))
2,176 (420)82 (17)
286 (59)242 (51)113 (26)68 (25)20 (6)4.9 (1.4)
15 (5)81 (20)73 (19)34 (10)24 (6)10 (3)1.9 (0.6)8.7 (3)0.3 (0.7)
1,229 (909)692 (839)
5,906 (4,624)3,119 (2,632)
3.6 (2.2)9.7 (2.4)1.3 (0.3)2.1 (0.6)
31 (6)309 (65)
6.5 (2.7)36 (9)2.0 (0.5)6.1 (1.3)
153 (67)1,377 (405)
1.6 (0.4)12 (4)
348 (71)3,325 (676)
12 (3)5.5 (2.2)
297 (10)58 (13)27 (7)4.9 (3.1)
22 (7)60 (34)1.6 (0.8)
Unadjusted‡
Correlation coefficients betweenFFQ and food recordFFQ†
(% offood records)
* Based on log-transformed values.† SD, standard deviation; FFQ, food frequency questionnaire; RE, retinol equivalent.‡ Ninety-five percent confidence intervals for the minimum (r = 0.13, 95% confidence interval: –0.06, 0.31) and
maximum (r = 0.64, 95% confidence interval: 0.52, 0.74) values of correlation.
Energyadjusted
125133123121124101146145142127125119128137137153100150143154157144139169133132134137133135138144131138144140129136136125132130136148165119
0.240.260.300.350.500.410.480.410.530.280.270.340.230.340.300.420.420.440.640.610.410.320.190.490.230.330.320.230.370.330.470.470.360.310.300.210.350.440.360.240.130.360.440.600.570.60
0.500.450.440.390.500.560.550.560.440.390.510.310.420.340.450.370.300.680.580.440.390.190.700.500.550.390.330.460.610.570.610.490.280.560.390.540.420.470.440.400.390.560.670.590.67
Attenuationand energy
adjusted
0.550.490.470.440.530.590.580.590.480.640.550.340.470.390.490.450.370.710.620.530.440.220.740.570.600.480.380.500.660.600.650.580.320.600.440.590.450.520.510.460.470.610.790.630.79

Validation Study among Pregnant Finnish Women 473
Am J Epidemiol Vol. 154, No. 5, 2001
of 47 proportions did so. The greatest misclassifications(>15 percent in the highest quintile on questionnaires and inthe lowest quintile on food records) were found for high-fatmilk (23 percent) and inner organs (18 percent) in foodgroups and for thiamin (18 percent) among nutrients. Onaverage, 6 percent of foods and 5 percent of nutrients weregrossly misclassified into extreme quintiles.
DISCUSSION
To effectively study the putative effects of the maternaldiet during pregnancy on the development of type 1 dia-betes in the offspring, we needed a dietary instrument thatcould be administered after delivery when the genetic dis-ease susceptibility of the offspring had already been deter-
mined. We developed a 181-item FFQ that was sufficientlyaccurate for measuring the diet of the mother during thethird trimester of pregnancy. In the validation study, thecorrelation coefficients between the second questionnaire,completed 1 month after delivery (the same arrangementas in the study proper), and the food records were similarto those obtained between the first questionnaire, com-pleted during the period of interest (eighth month of preg-nancy), and the food records. As in most other validationstudies, the FFQ overestimated food consumption andintakes of nutrients. The quintile notation was acceptablefor most of the foods and nutrients of special interest. Thequestionnaire also showed a good degree of reproducibil-ity. The sample size of 113 subjects is reasonable for a val-idation study (8). The subjects came from the populationfor which the questionnaire was designed. In the validationstudy, the follow-up rate was 80 percent, which is ratherhigh, since keeping food records for 10 days and complet-ing a relatively cumbersome questionnaire twice requiresmotivation.
In reproducibility studies, the correlation coefficientshave generally ranged from 0.5 to 0.7 for nutrient intakes(8). Our results compare well with those findings, except forethanol. Moreover, in the Finnish study of nonpregnantwomen (12), the intraclass correlation for alcohol wasweaker than in other reports. Intraclass correlations from ourquestionnaire for food items had greater variability than didthose for nutrients, which is consistent with the results ofearlier surveys (8). In the validation study, in which the sub-jects also completed the questionnaire twice, the mean intra-class correlation for nutrients was similar to that in ourreproducibility study.
The absolute intakes estimated by using questionnaireswere 30–40 percent higher than the food record estimates.When we compared our results with those of a Finnish val-idation study among nonpregnant women (12), it seemedthat with the FFQ pregnant women tended to overestimatetheir food consumption more than nonpregnant women did.Earlier validation studies among pregnant women havereported similar overestimates using FFQs compared withfood records or 24-hour recalls (3, 5–7). Only in one survey(4) were contradictory results reported.
Overestimation may reflect difficulties in comparing thestandard portion size offered with the portion that is actu-ally consumed. The use of an FFQ both before and after thefood record provided minimal and maximal estimates oftrue validity; the process of keeping a food record mighthave improved the accuracy in completing the latter ques-tionnaire. However, according to the intraclass correlationsbetween foods and nutrients in the first and the secondquestionnaires (data not shown), the effect, if any, ofincreased awareness was minimal. The results of earlierstudies have shown the difficulty of measuring fruit andvegetable consumption accurately using FFQs (19–21).Our questionnaire overestimated vegetables and fruitjuices, but not fruits, relatively more than other foods.Overestimation is not necessarily problematic in epidemio-logic studies if the ranking of the persons according to theirdietary intake is valid (22).
TABLE 5. Validation study: cross-classification of foodconsumption quintiles* from food records and the foodfrequency questionnaires completed by 113 pregnantFinnish women, August 1995 to July 1996
Rye productsWheat productsPotatoesRootsVegetablesFruitsFruit juicesBerriesButterSoft margarineLow-fat spreadsOilsHigh-fat milkLow-fat milkButtermilkCreamCheeseIce creamPorkBeefPoultrySausagesInner organsFishEggsCoffeeTeaAlcoholic drinksSoft drinksSugar and sweets
Foodgroup
Lowestquintile
on FFQ†(%)
50554150505959453641453614683632554155323227363632
10064185032
Highestquintileon FFQ
(%)
Lowest quintile on food records
Lowesttwo
quintileson FFQ
(%)
* Calculated from energy-adjusted food consumption.† FFQ, food frequency questionnaire.
Overallproportion
categorizedin the
same oradjacentquintile of
food record(%)
64647768687786825577735936
10064508268645955634168450
77326459
55000505900
142305
14559090
189
1405
1499
686573817173867466767354589276607571636459725769629487527563

474 Erkkola et al.
Am J Epidemiol Vol. 154, No. 5, 2001
The crude correlations were, in general, higher for foodsthan for nutrients. The energy-adjustment method and cor-rection for attenuation were used to avoid misleading con-clusions on differences in the total energy intake between
subjects and random within-person variation. Energy adjust-ment did not markedly improve the correlations for foods,but did strengthen the correlations for nutrients to a levelsimilar to that observed for foods. In validation studies, cor-
TABLE 6. Validation study: cross-classification of nutrients* and other dietary factors* distributionquintiles from food records and food frequency questionnaires completed by 113 pregnant Finnishwomen, August 1995 to July 1996
EnergyProteinTotal carbohydratesAvailable carbohydratesStarchSucroseDietary fiberWater-soluble fiberWater-insoluble fiberTotal fatTotal triglyceridesSaturated fatty acidsMonounsaturated fatty acidsPolyunsaturated fatty acidsTotal n-3 fatty acidsTotal n-6 fatty acidsEthanolVitamin ATotal retinolCarotenoidsβ-CaroteneVitamin DVitamin EThiaminRiboflavinNiacinFolateVitamin B
12
BiotinPyridoxinePantothenic acidVitamin CPotassiumCalciumCopperIronMagnesiumSodiumZincManganeseIodineSeleniumChromiumMercuryLeadNitriteNitrate
NutrientLowestquintile
on FFQ†(%)
4132413627505055554145453627413255414164593636275023272350504564554141415023414155145564554555
Highestquintileon FFQ
(%)
Lowest quintile on food records
Lowesttwo quintiles
on FFQ(%)
* Calculated from energy-adjusted intakes.† FFQ, food frequency questionnaire.
Overall proportioncategorized in the
same or an adjacentquintile of foodrecord quintile
(%)
5955595564738273776468775059595564645986735968637355634582827782686468597755687373507373777782
0599059
14505590900055595
18550
1450555500995050
140505
6069706068727273746667755864626466706876776365708164697272747474597571657665736665626768787380

Validation Study among Pregnant Finnish Women 475
Am J Epidemiol Vol. 154, No. 5, 2001
relation coefficients lower than 0.4 will attenuate associa-tions between exposure and outcome to a significant degree(8, 23). After energy adjustment and correction for attenua-tion, the correlation coefficients of six nutrients and eightfoods were lower than 0.4. Most of those foods were notconsumed frequently, and therefore, their consumptionappears to be difficult to measure using an FFQ. We alsorecorded weak correlations for various meats, which mightreflect difficulties in recognizing and grouping meat cate-gories.
We calculated quintiles by using energy-adjusted vari-ables, since we plan to use energy-adjusted dietary intakesas exposure measures in the study proper. Comparisons ofquintiles are more informative than a correlation coefficientwhen reporting the capacity of an assessment method torank persons in relation to their intake (24). In our studyproper, we will take a special interest in milk and cerealproducts among the foods and in total protein, antioxidativevitamins, and minerals among the nutrients, and in nitrates,nitrites, and heavy metal contaminants (25, 26). It appearsthat by using our FFQ, we will be able to rank subjectsaccording to their intake of the foods and nutrients listedabove. Furthermore, our questionnaire provided accurateestimates for a large range of other foods and nutrients.
The assessment of the dietary intake of pregnant womenis complicated because of various factors depending onthe period of pregnancy. Poor correlation between instru-ments may be partly explained by appetite fluctuationsand nausea, which may also influence the long-term dietreports (27). Five other validation studies with pregnantwomen have been performed during the last decade (3–7).They are difficult to compare with our study and with eachother since they cover various periods of pregnancy anddiffer in the reference method used and in the number ofdays of dietary recording. Robinson et al. (3) and Brownet al. (4) used the food record as a reference method,whereas the 24-hour recall was used in the others (5–7).The studies have calculated only the intakes of nutrients,except for the study of Robinson et al., in which the contribution of selected food groups to energy and energy-yielding nutrients was also assessed. There are also statis-tical differences between the studies. Besides having alarger selection of nutrients, our questionnaire providesnew information about the validity of the questionnaire formeasuring food consumption and intakes of some foodadditives and contaminants during pregnancy. In general,our correlations for nutrients seem to be comparable withthe results of other validation studies of pregnant women,which range from –0.02 to 0.55 for energy-adjusted nutri-ents (3–7). Questions about the frequency of eating outand about personal choices for fats used in cooking areamong the strengths of our FFQ compared with most ofthe others (23).
The reproducibility and relative validity of the FFQassessed in this study were comparable with the results ofearlier studies. We conclude that our questionnaire is a rea-sonably good method for assessing the diet of pregnantwomen in a prospective study focusing on the developmentand determinants of type 1 diabetes.
ACKNOWLEDGMENTS
Supported by the Finnish Academy of Sciences, theFinnish Diabetes Research Foundation, and the YrjöJahnsson Foundation.
The authors thank Anne Nyberg for data entry, MikkoVirtanen and Heli Tapanainen for statistical guidance, andCatarina Ståhle-Nieminen and Jonathan Robinson for lan-guage editing.
REFERENCES
1. Barker DJP, Gluckman PD, Robinson JS. Fetal origins of adultdisease. Report of the First International Study Group, Sydney,Australia, October 29–30, 1994. Placenta 1995;16:317–20.
2. Lindberg B, Ivarsson S-A, Landin-Olsson M, et al. Isletautoantibodies in cord blood from children who developedtype 1 (insulin-dependent) diabetes mellitus before 15 years ofage. Diabetologia 1999;42:181–7.
3. Robinson S, Godfrey K, Osmond C, et al. Evaluation of a foodfrequency questionnaire used to assess nutrient intakes inpregnant women. Eur J Clin Nutr 1996;50:302–8.
4. Brown JE, Buzzard IM, Jacobs DR, et al. A food frequencyquestionnaire can detect pregnancy-related changes in diet. JAm Diet Assoc 1996;96:262–6.
5. Forsythe HE, Gage B. Use of a multicultural food-frequencyquestionnaire with pregnant and lactating women. Am J ClinNutr 1994;59(suppl):203S–6S.
6. Greeley S, Storbakken L, Magel R. Use of a modified foodfrequency questionnaire during pregnancy. J Am Coll Nutr1992;11:728–34.
7. Suitor CJW, Gardner J, Willett WC. A comparison of food fre-quency and diet recall methods in studies of nutrient intake oflow-income pregnant women. J Am Diet Assoc 1989;89:1786–94.
8. Willett W. Nutritional epidemiology. 2nd ed. New York, NY:Oxford University Press, 1998.
9. Meriläinen J, Gissler M, Hemminki E, et al. Perinatal statistics1993. Tilastotiedote 18, 1995. (In Finnish). Helsinki, Finland:Sosiaali-ja terveysalan tutkimus-ja kehittämiskeskus, 1995.
10. Pietinen P, Hartman AM, Haapa E, et al. Reproducibility andvalidity of dietary assessment instruments. I. A self-adminis-tered food use questionnaire with a portion size picture book-let. Am J Epidemiol 1988;128:655–66.
11. Pietinen P, Hartman AM, Haapa E, et al. Reproducibility andvalidity of dietary assessment instruments. II. A qualitative foodfrequency questionnaire. Am J Epidemiol 1988;128:667–76.
12. Männistö S, Virtanen M, Mikkonen T, et al. Reproducibilityand validity of a food frequency questionnaire in a case-control study on breast cancer. J Clin Epidemiol 1996;49:401–9.
13. Kleemola P, Virtanen M, Pietinen P. The 1992 dietary surveyof Finnish adults. Publication B2. Helsinki, Finland: NationalPublic Health Institute, 1994.
14. Leino U. Ruokamittoja. Publication B1. (In Finnish).Helsinki, Finland: National Public Health Institute, 1984.
15. Haapa E, Toponen T, Pietinen P, et al. Food portion pictures.(In Finnish). Helsinki, Finland: The National Public HealthInstitute and Department of Nutrition, University of Helsinki,1985.
16. Ovaskainen M-L, Valsta LM, Lauronen J. The compilation offood analysis values as a database for dietary studies—theFinnish experience. Food Chem 1996;57:133–6.
17. Margetts BM, Nelson M. Design concepts in nutritional epi-demiology. New York, NY: Oxford University Press, 1991.
18. SAS language and procedures. Version 6, 1st ed. Cary, NC:SAS Institute, Inc, 1989.
19. Smith-Warner SA, Elmer PJ, Fosdick L, et al. Reliability and

476 Erkkola et al.
Am J Epidemiol Vol. 154, No. 5, 2001
comparability of three dietary assessment methods for estimat-ing fruit and vegetable intake. Epidemiology 1997;8:196–201.
20. Calvert C, Cade J, Barrett JH, et al. Using cross-check ques-tions to address the problem of mis-reporting of specific foodgroups on food frequency questionnaires. Eur J Clin Nutr1997;51:708–12.
21. Krebs-Smith SM, Heimendinger J, Subar AF, et al. Using foodfrequency questionnaire to estimate fruit and vegetable intake:association between the number of questions and total intakes.J Nutr Educ 1995;27:80–5.
22. Beaton GH. Interpretation of results from diet history studies.In: Kohlmeier L, ed. The diet history method. London,
England: Smith-Gordon, 1991.23. Sempos CT. Invited commentary: Some limitations of semi-
quantitative food frequency questionnaires. Am J Epidemiol1992;135:1127–32.
24. Garrow JS. Validation of methods for estimating habitual diet: proposed guidelines. Eur J Clin Nutr 1995;49:231–2.
25. Åkerblom HK, Knip M. Putative environmental factors intype 1 diabetes. Diabetes Metab Rev 1998;14:31–67.
26. Virtanen SM, Aro A. Dietary factors in aetiology of diabetes.Ann Med 1994;26:469–78.
27. Wirfält E. Cognitive aspects of dietary assessment. Scand JNutr 1998;42:56–9.

II


III

Maternal consumption of dairy products during pregnancyand lactation, and the development of cow’s milkantibodies in the offspring
MAIJALIISA ERKKOLA1,2, CARINA KRONBERG-KIPPILA2, ERKKI SAVILAHTI3,
MICHAEL G. KENWARD4, MARJA SALONEN3, JORMA ILONEN5, MIKAEL KNIP3,6,
HANS K. AKERBLOM3 & SUVI M. VIRTANEN1,2,6
1Tampere School of Public Health, University of Tampere, Tampere, Finland, 2Department of Epidemiology and Health
Promotion, Nutrition Unit, National Public Health Institute, Helsinki, Finland, 3Hospital for Children and Adolescents,
University of Helsinki, Helsinki, Finland, 4London School of Hygiene and Tropical Medicine, London, United Kingdom,5Institute of Microbiology and Pathology, University of Turku, Turku, Finland, and 6Department of Paediatrics and Research
Unit, Tampere University Hospital, Tampere, Finland
AbstractObjective: To assess whether the maternal consumption of milk and milk products affects development of cow’s milk (CM)antibodies in infants. Design: A randomized pilot trial using food frequency questionnaires (mothers) and food records(infants). Setting: Families with a newborn infant with increasedHLA-DQB1-conferred risk of type 1 diabetes and at least onefirst-degree relative affected by type 1 diabetes from 16 hospitals in Finland between April 1995 and November 1997. Subjectsand intervention: Infants randomized to receive a hydrolysed formula when breast milk was not available during their first 6–8 mo (n=112). Of these, 13 dropped out by the age of 3 mo and two were excluded due to incomplete CM antibody data.Results:Maternal milk protein intake from cheese during pregnancy was inversely related to IgA-class antibody titres to beta-lactoglobulin (BLG) and casein (CAS) at 3 mo, and to IgA antibody titres to BLGat 6 mo.Maternal consumption of rawmilkproducts during lactation was positively related to the development of IgA antibody titres to CAS at 6 mo, and inverselycorrelated to IgG antibody titres to bovine serum albumin (BSA) and IgA antibody titres to CAS at 2 y. Maternal cheeseconsumption was inversely related to the IgG antibody titres to CM formula andCAS and to the IgA antibody titres to CAS inearly infancy.
Conclusions: Few associations were established between maternal CM protein intake and CM protein antibody levels in theinfants. The milk and milk products taken by the mother differed in their impact on the emerging CM antibody response inthe offspring.
Key Words: Antigen, cow’s milk, immunoglobulin, infancy, pregnancy
Introduction
Cow’s milk (CM) represents the first foreign protein
source to which the overwhelming majority of infants
are exposed. CM is the sensitizing food that most
commonly induces both gastrointestinal and skin
manifestations [1]. CM protein has been proposed as a
potential initiating factor in the autoimmune process
leading to the destruction of pancreatic b cells and
further development of type 1 diabetes [reviewed in 2].
High levels of antibodies to CM proteins have been
associated with increased risk of type 1 diabetes
independently of early formula feeding [3,4].
During pregnancy the fetus is exposed to the
maternal diet via the placental transfer of nutrients.
There is also transfer of anti-idiotypic antibodies from
the mother to the fetus [5]. The placenta seems to
protect the fetus against the effect of maternal food
antigens, and specific sensitization has been demon-
strated only rarely in newborn infants [6,7]. IgG-
class CM antibodies are present in the umbilical
serum as IgG is actively transported from the maternal
Correspondence: Suvi M. Virtanen, National Public Health Institute, Department of Epidemiology and Health Promotion, Nutrition Unit, Mannerheimintie
166, FI-00300 Helsinki, Finland. Tel: +358 9 4744 8729/+358 50 327 9696 (mobile). Fax: +358 9 4744 8591. E-mail: [email protected]
(Received 20 June 2004; revised 17 December 2004; accepted 4 January 2005)
Acta Pædiatrica, 2005; 94: 696–704
ISSN 0803-5253 print/ISSN 1651-2227 online # 2005 Taylor & Francis Group Ltd
DOI: 10.1080/08035250510029523

circulation to the fetus, whereas IgA-class CM anti-
bodies are absent at birth [8]. The IgG-class CM
antibodies detected in the newborn infant are accord-
ingly probably transplacentally transferred, and a
conspicuous correlation has been observed between
the CM antibody titres in the maternal circulation and
those found in cord blood [6,9]. The initial exposure
to CM proteins always provokes an immune response
in the infant as a normal phenomenon. The earlier CM
formula is introduced, the stronger the subsequent
IgG response [10]. IgA CM antibodies increase more
slowly, and parallel in exclusively breastfed and CM
formula-fed infants. The IgG response starts to level off
during the first year of life, while the IgA response
decreases more slowly, and the latter may persist
throughout childhood.
Secretory IgA is the predominant immunoglobulin
(90%) in breast milk [11], while beta-lactoglobulin and
casein aremajor protein fractions [12]. The occurrence
of maternal dietary antigens in breast milk is well
documented [13]. Modifying maternal diet may
control the amount of food antigens in breast milk.
However, the findings on the relationship between the
concentrations of CM antigens in human milk and
maternal milk consumption conflict [e.g. 10 vs 14].
Similarly, inconsistent findings have been recorded on
the possible effect of the maternal intake of CM during
lactation on the humoral immune response to CM
antigens in the child [15,16]. There have been no
reports on maternal consumption of various different
milk products and their putative impact on the devel-
opment of specific CM protein antibodies in infancy.
The aim of the present study was to assess whether
maternal consumption of different milk products
during pregnancy and lactation affects the develop-
ment of CM antibodies in infants, and whether such
associations are independent of the child’s own expo-
sure to CM products, if they exist.
Subjects and methods
Study design
Families with a newborn infant and at least one
member (mother, father or sibling) affected by type 1
diabetes were invited to the TRIGR (the Trial to
Reduce IDDM in the Genetically at Risk) pilot trial
between April 1995 and November 1997 [17]. Of the
521 children recruited, 234 had HLA DQB1 geno-
type conferring increased risk for type 1 diabetes
[DQB1*02/*0302, *0302/x (xl*02, *0301 or *0602,*0603) or 02/y (yl0302, *0301, or *0602/*0603)],and these infants continued in the intervention study.
Immediately after birth, the infants were randomized
to receive, after exclusive breastfeeding in a doubled-
blinded manner, either the hydrolysed infant formula
(Nutramigen1, Mead Johnson, Evansville, IN, USA;
extensively hydrolysed casein-based formula) or a
whey-adapted cow’s milk (CM)-based formula (Mead
Johnson) as the first milk product introduced into the
infant’s diet. The control formula was mixed with 20%
Nutramigen1 to make the two study formulas similar
in taste and smell. The dietary intervention lasted at
least until the infant reached the age of 6 mo. If the
child had not received the study formula for at least
2 mo by the age of 6 mo, the intervention continued at
most up to the age of 8 mo. The families received both
oral and written advice on the use of study formula and
on the avoidance of cow’s milk and beef in the infant’s
diet during the intervention period. The formula codes
were opened when the youngest child randomized had
passed the intervention period. The ethical committees
of all the participating hospitals had approved the study
protocol.
Subjects
The study population of the TRIGR pilot study was
described in detail earlier [17]. Briefly, the families of
521 newborn infants received the invitation letter and
parents signed the informed consent to take part in the
study. Twenty-five of the 521 infants were excluded
because they met the exclusion criteria. In addition,
five families decided before randomization not to
participate in the study, 12 families could not join due
to a missing HLA sample or a missing study code, and
three families dropped out without providing a reason.
Accordingly, altogether 476 newborn infants received
the study code at birth and of them 471 were screened
for their HLA DQB1 alleles. Of those screened, 230
had HLA DQB1 genotype conferring increased risk
for type 1 diabetes, and the parents of these infants
were asked to continue in the intervention study with
their child.
The present study included only infants randomized
to receive hydrolysed infant formula (n=112). Of
these, 13 (12%) dropped out by the age of 3 mo. The
reasons for discontinuing the study were mostly family
related such as moving to a distant location. The other
reasons included difficulties in using the study formula,
diagnosis or suspicion of cow’s milk allergy, parents’
unwillingness to have their child pricked for blood
sampling, or their unwillingness to learn about the
genetic risk. Two families could not be contacted after
the birth of the infants, and one family had been invited
to the study by mistake. In the final sample there were
99 infants in the casein hydrolysate group at the age of
3 mo. Two infants were excluded from the analyses
because of incomplete CM antibody data. The final
number of 97 infants included in the present analysis
comprised those subjects for whom we had nutritional
data and the results from CM antibody analyses on at
least one occasion. The neonatal variables used in the
Maternal diet and CM antibodies in infants 697

present study were birth weight and duration of
gestation (Table I).
Dietary assessment
The diet of the offspring was assessed bymeans of a 2-d
food record at the age of 6 mo and by a 3-d food record
at the ages of 1 and 2 y. The families recorded devi-
ations from the advised diet and age at introduction
of new foods. Maternal diet was studied using a
pre-tested and validated food frequency questionnaire
[18]. The questionnaire focused on the diet of the
mother during the eighth month of pregnancy. If the
mother was breastfeeding when the child was 3 mo old,
her diet during the preceding month was studied using
the same food frequency questionnaire. Maternal diet
was not modified. The data from both diet records and
food frequency questionnaires were analysed using a
software program developed at the National Public
Health Institute [19].
The dietary variables used in the present study were
the duration of exclusive (no other foods than breast
milk) and total breastfeeding, age at introduction of
milk products (CM formulas, CM and other CM
products), CM protein intake of the child at the ages of
12 and 24 mo, and CM protein intake of the mother
during pregnancy and lactation. When measuring
CM protein intake of the mothers, we grouped
milk products according to the type of processing. In
the present study, two groups used were “raw milk
products” including regular milk, cream and ice
cream, and “cheese” including all hard cheeses. The
descriptive statistics of the dietary variables are shown
in Table I.
Laboratory analysis
Blood samples were obtained from the infants at
birth and at the ages of 3, 6, 9, 12, 18 and 24 mo. The
maternal blood samples were taken on average 2 d
after the delivery. Antibodies of IgA and IgG isotypes
to whole CM formula, beta-lactoglobulin (BLG),
bovine serum albumin (BSA) and alpha-casein (CAS)
were measured using modifications of the original
enzyme-linked immunosorbent assay (ELISA) tech-
niques as previously described [3,4,20]. Microtitre
plates (MaxiSorp1, Nunc A/S, Roskilde, Denmark)
were coated with one of the following antigens:
adapted liquid CM formula (Tutteli1, Valio Ltd,
Helsinki, Finland); BLG (L-0130, Sigma Pharma-
ceuticals, St Louis, MO, USA); BSA (2 mg/ml, grade
V, Sigma); and CAS (C 6780, Sigma). Wells were
blocked either with 0.5% sheep serum (for anti-CM
andBLG assays) or with 1% gelatin in PBS pH 7.4 (for
BSA and CAS assays). Serum samples were diluted
in the blocking buffers. Triplicate dilutions were used
for dilutions of standard serum; duplicate for the
assayed sera. Alkaline phosphatase-conjugated affinity-
purified rabbit F(ab’)2 anti-human IgG, IgA or IgM
antisera (Dako A/S, Glostrup, Denmark), and
p-nitrophenyl-phosphate substrate, 1 mg/ml in TRIS
buffer (Sigma Fast p-nitrophenyl Phosphate Tablet
sets N-2770, Sigma) were added. The reaction was
followed and stopped when the absorbance of the
highest standard was above 2 with 100 ml 1 M NaOH.
The endpoint measure of OD405 nm was obtained in
a semi-automatic multiwell photometer (Titertek
Multiscan1, Elflab Inc., Helsinki, Finland). The mean
value of two absorbencies for wells coated with block-
ing solution was subtracted from themean value for the
two absorbencies in antigen-coated wells. Results were
subjected to point-to-point analysis in a computerized
photometer using twofold serial dilutions of a high titre
standard serum as reference. Sample dilutions must
Table I. Maternal and infant characteristics and dietary variables
among the 97 families who started the intervention arm of the second
TRIGR pilota.
Characteristica
Boys 56 (58%)
Birthweight, g 3681+576
Maternal age, y 30+5
Gestational age, wk 39+1.5
Duration of exclusive breastfeeding, mo 3 (0–6)
Duration of total breastfeeding, mo 8.3 (0.2–24)b
Age at introduction of study formula, mo 3 (0–8)c
Age at introduction of milk products, mo 8 (5.3–24)b
Infants with reported dietary non-compliance
during the intervention
21 (22%)
Child’s energy-adjustedd milk protein intake
at the age of 1 y, g/d
15.8+9.7e
Child’s energy-adjustedd milk protein intake
at the age of 2 y, g/d
20.0+7.1e
Pregnancy
Maternal energy-adjustedd protein intake from:
raw milk products, g/d 22.6+14.1f
cheese, g/d 17.3+10.1f
sour milk products, g/d 7.8+7.2f
Lactation
Maternal energy-adjustedd protein intake from:
raw milk products, g/d 21.8+13.9f
cheese, g/d 18.5+12.4f
sour milk products, g/d 6.6+6.1f
a Unless otherwise stated, values are the numbers of children, with
proportion given in parentheses. Plus–minus values are means+SD
and values with the range in parentheses are medians.b n=87.c n=81.d Adjustment for total energy intake was made using Willett’s [21]
residual method. Residuals are computed from regression models,
with total energy as the independent variable and food consumption
or nutrient intake as the dependent variable.e Child’s diet was assessed with a 3-d food record; n=93 at the age of
1 y and 77 at the age of 2 y. Milk protein intake from breast milk is
not included in the calculations.fMaternal diet was assessed with a food frequency questionnaire
during the eighth month of pregnancy and the third month of
lactation; n=94 in both.
698 M. Erkkola et al.

fall within the linear part of the standard curve, and
antibody levels were expressed as percentages of the
standard. Antibody titres of IgA isotype in umbilical
cord blood were not included in the statistical analyses
as IgA is not transported through the placenta to the
fetus during pregnancy, and the titres detected in a few
infants were considered to be due to laboratory
mistakes or contamination of the umbilical cord blood
sample with maternal blood.
Statistical analyses
Means and standard deviations for food consumption
and nutrient intake were calculated from the food
records and the questionnaires. In addition, protein
intake from different milk products during pregnancy
and lactation was calculated. To achieve a more
normal distribution, dietary variables and antibody
titres were log transformed. Adjustment for total
energy intake was performed using the residual method
of Willett [21]. Residuals were computed from
regression models, with total energy as the indepen-
dent variable and milk protein intake as the dependent
variable. Spearman correlation coefficients and
Wilcoxon signed ranks test were used to study asso-
ciations between maternal diet and maternal antibody
titres, and between antibody titres in children and
mothers. Partial correlation coefficients were calcu-
lated between energy-adjusted dietary variables and
CM antibody titres. In logistic regression analysis, the
antibody levels were used as dichotomized variables
(highest tertile versus others). The division into tertiles
was done based on the antibody levels in the children in
the casein hydrolysate group (n=97). In the 6 mo
analysis, the four children consuming CM products
according to food records were excluded. Wald statis-
tics were examined for each variable included in the
model [22]. Odds ratios (OR) and 95% confidence
intervals (95% CI) were used to estimate the associa-
tions of the dietary variables with the CM antibody
titres. Dietary intakes during pregnancy and during
lactation were highly correlated and were therefore not
used as explanatory variables in the same model.
Results
Milk protein intake
Energy-adjusted values for the maternal milk protein
intake are shown in Table I. The average intake of
total energy was 11.2 MJ (SD 3.1) during pregnancy
and 10.5 MJ (SD 2.6) during lactation. The average
intakes of various milk products were slightly higher
during pregnancy than lactation. Raw milk products
represented the dominant source ofmilk proteins in the
maternal diet. Milk protein intake was quite similar
during pregnancy and lactation. Spearman correlation
coefficients for energy-adjusted protein intake during
pregnancy and lactation were 0.56 ( p50.001) for all
milk products, 0.70 ( p50.001) for raw milk products
and 0.66 ( p50.001) for cheese. Milk protein intake
from raw milk products correlated inversely with milk
protein intake from cheese (r=70.25, p=0.017 and
r=–0.23, p=0.027 during pregnancy and lactation,
respectively).
As expected, the intake of milk protein increased
with age in the children (Table I). Of 97 families, 21
(22%) reported dietary non-compliance during the
intervention period. Antibody levels did not differ
among children for whom dietary deviations had been
made and the remaining children.
Antibodies to total CM, BLG, BSA and CAS
The proportions of children with detectable CM anti-
bodies of IgA and IgG classes are shown in Figures 1
(IgA) and 2 (IgG). Only one infant had IgA-class BSA
antibodies at the age of 6 mo, and accordingly this time
point could not be used in all statistical analyses.
Except for BLG, the IgG antibody titres at birth
correlated positively with the antibody titres at 3 mo of
age (r=0.49–0.76, p50.001). That relation remained
statistically significant up to the age of 6 mo for IgG
BSA (r=0.49, p50.001) and IgG CAS antibody titres
(r=0.24, p=0.04). The duration of breastfeeding was
inversely related to both the IgA and IgGBSA antibody
titres at the age of 1 y (r=70.45, p50.001 and
r=70.54, p50.001), and the infant’s current milk
protein intake directly related to both titres (r=0.23,
p=0.04 and r=0.31, p=0.004, respectively). The
child’s current milk protein intake was associated with
IgA (r=0.24, p=0.047) and IgG CM formula anti-
body titres (r=0.29, p=0.02) at the age of 2 y. Birth
weight and duration of gestation had more impact on
IgG than on IgA antibody titres (data not shown).
Maternal milk protein intake during pregnancy was
Figure 1. Development of cow’s milk IgA-class antibodies in chil-
dren by age (proportion of children with detectable titres). CM:
cow’s milk; BLG: beta-lactoglobulin; BSA: bovine serum albumin;
CAS: casein.
Maternal diet and CM antibodies in infants 699
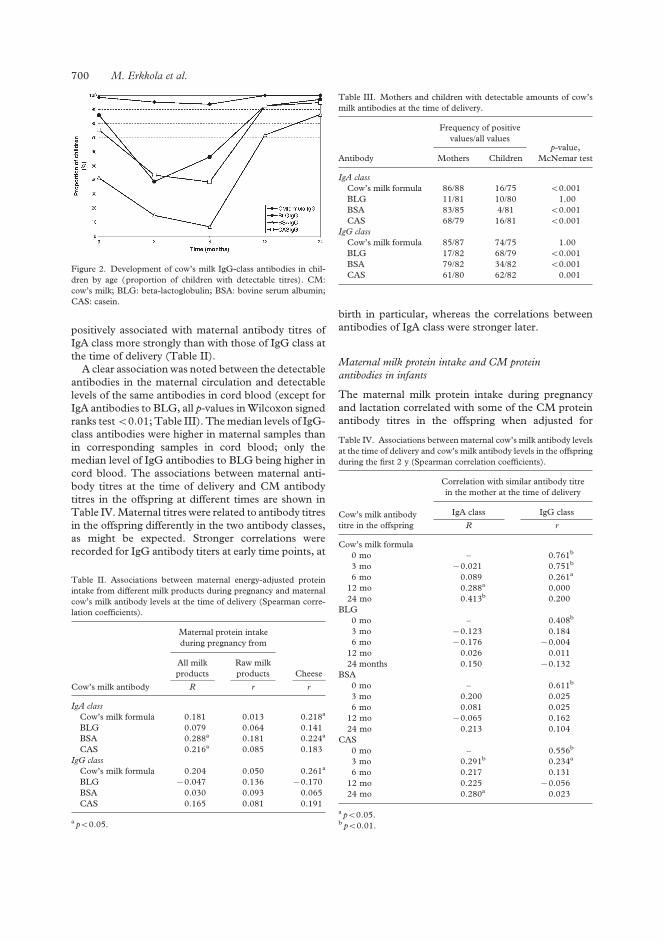
positively associated with maternal antibody titres of
IgA class more strongly than with those of IgG class at
the time of delivery (Table II).
A clear association was noted between the detectable
antibodies in the maternal circulation and detectable
levels of the same antibodies in cord blood (except for
IgA antibodies to BLG, all p-values inWilcoxon signed
ranks test50.01; Table III). Themedian levels of IgG-
class antibodies were higher in maternal samples than
in corresponding samples in cord blood; only the
median level of IgG antibodies to BLG being higher in
cord blood. The associations between maternal anti-
body titres at the time of delivery and CM antibody
titres in the offspring at different times are shown in
Table IV.Maternal titres were related to antibody titres
in the offspring differently in the two antibody classes,
as might be expected. Stronger correlations were
recorded for IgG antibody titers at early time points, at
birth in particular, whereas the correlations between
antibodies of IgA class were stronger later.
Maternal milk protein intake and CM protein
antibodies in infants
The maternal milk protein intake during pregnancy
and lactation correlated with some of the CM protein
antibody titres in the offspring when adjusted for
Figure 2. Development of cow’s milk IgG-class antibodies in chil-
dren by age (proportion of children with detectable titres). CM:
cow’s milk; BLG: beta-lactoglobulin; BSA: bovine serum albumin;
CAS: casein.
Table II. Associations between maternal energy-adjusted protein
intake from different milk products during pregnancy and maternal
cow’s milk antibody levels at the time of delivery (Spearman corre-
lation coefficients).
Cow’s milk antibody
Maternal protein intake
during pregnancy from
All milk
products
Raw milk
products Cheese
R r r
IgA class
Cow’s milk formula 0.181 0.013 0.218a
BLG 0.079 0.064 0.141
BSA 0.288a 0.181 0.224a
CAS 0.216a 0.085 0.183
IgG class
Cow’s milk formula 0.204 0.050 0.261a
BLG 70.047 0.136 70.170
BSA 0.030 0.093 0.065
CAS 0.165 0.081 0.191
a p50.05.
Table III. Mothers and children with detectable amounts of cow’s
milk antibodies at the time of delivery.
Antibody
Frequency of positive
values/all valuesp-value,
McNemar testMothers Children
IgA class
Cow’s milk formula 86/88 16/75 50.001
BLG 11/81 10/80 1.00
BSA 83/85 4/81 50.001
CAS 68/79 16/81 50.001
IgG class
Cow’s milk formula 85/87 74/75 1.00
BLG 17/82 68/79 50.001
BSA 79/82 34/82 50.001
CAS 61/80 62/82 0.001
Table IV. Associations between maternal cow’s milk antibody levels
at the time of delivery and cow’s milk antibody levels in the offspring
during the first 2 y (Spearman correlation coefficients).
Cow’s milk antibody
titre in the offspring
Correlation with similar antibody titre
in the mother at the time of delivery
IgA class IgG class
R r
Cow’s milk formula
0 mo – 0.761b
3 mo 70.021 0.751b
6 mo 0.089 0.261a
12 mo 0.288a 0.000
24 mo 0.413b 0.200
BLG
0 mo – 0.408b
3 mo 70.123 0.184
6 mo 70.176 70.004
12 mo 0.026 0.011
24 months 0.150 70.132
BSA
0 mo – 0.611b
3 mo 0.200 0.025
6 mo 0.081 0.025
12 mo 70.065 0.162
24 mo 0.213 0.104
CAS
0 mo – 0.556b
3 mo 0.291b 0.234a
6 mo 0.217 0.131
12 mo 0.225 70.056
24 mo 0.280a 0.023
a p50.05.b p50.01.
700 M. Erkkola et al.

neonatal and dietary variables (data not shown). In
general, the maternal milk protein intake during
lactation was more clearly associated with CM protein
antibody titres than maternal diet during pregnancy.
The maternal milk protein intake from raw milk
products during pregnancy correlated inversely with a
couple of the antibody titres (BSA IgG and CAS IgA)
at 2 y of age. The maternal milk protein intake from
cheese during lactation correlated inversely with some
of the CM antibody titres (cow’s milk formula IgG,
CAS IgA and CAS IgG) measured at birth and up to
the age of 6 mo.
The associations between maternal milk protein
intake and CM antibody titres in the offspring were
studied further by using a logistic regression model to
explain each CM antibody titre at each time point
(Table V). Variables included as covariates varied
depending on the time point, as described in the
footnote of Table V. Maternal diet during pregnancy
was related to IgA BLG antibody titres; milk protein
intake from cheese was inversely related to IgA BLG
antibody titres at the age of 3 and 6 mo. A similar
inverse association was recorded for IgA CAS antibody
titres at the age of 3 mo.Maternal diet during lactation
was more clearly related to IgA CAS antibody titres.
The maternal milk protein intake from raw milk
products was associated with IgA CAS antibody titres
at 6 mo of age, whereas an inverse relationship was
Table V. Risk for high cow’smilk antibody titres (highest tertile) in the offspring (odds ratio (OR), 95% confidence interval (CI))a,b associated
with maternal energy-adjusted protein intake from milk products during pregnancy and lactation.
Mother/pregnancy Mother/lactation
Protein intake from
raw milk products
Protein intake from
cheese
Protein intake from
raw milk products
Protein intake from
cheese
OR 95% CI OR 95% CI OR 95% CI OR 95% CI
BLG IgA
3 mo 0.84 (0.28–2.50) 0.16 (0.03–0.81)c 1.13 (0.46–2.81) 0.38 (0.11–1.31)
6 mo 1.55 (0.64–3.75) 0.33 (0.11–0.97)c 1.11 (0.56–2.20) 0.48 (0.21–1.13)
12 mo 0.76 (0.37–1.56) 0.70 (0.32–1.53) 0.88 (0.50–1.56) 0.75 (0.39–1.43)
24 mo 0.88 (0.50–1.56) 0.75 (0.39–1.43) 1.20 (0.62–2.34) 1.02 (0.52–1.99)
BLG IgG
0 mo 0.72 (0.35–1.49) 0.81 (0.38–1.73) – – – –
3 mo 1.03 (0.50–2.13) 0.62 (0.27–1.41) 1.29 (0.70–2.38) 0.77 (0.40–1.47)
6 mo 0.71 (0.33–1.51) 0.64 (0.30–1.36) 0.92 (0.52–1.63) 0.68 (0.35–1.30)
12 mo 0.70 (0.35–1.39) 0.72 (0.33–1.55) 0.70 (0.39–1.25) 1.13 (0.62–2.06)
24 mo 0.70 (0.39–1.25) 1.13 (0.62–2.06) 0.55 (0.27–1.10) 1.62 (0.83–3.16)
BSA IgAe
3 mo 1.57 (0.32–7.79) 0.36 (0.05–2.83) 1.18 (0.37–3.74) 0.50 (0.10–2.44)
12 mo 0.88 (0.41–1.93) 0.89 (0.39–2.03) 0.95 (0.49–1.82) 0.71 (0.33–1.55)
24 mo 0.95 (0.49–1.82) 0.71 (0.33–1.55) 0.67 (0.33–1.36) 1.66 (0.79–3.50)
BSA IgG
0 mo 1.59 (0.74–3.40) 1.62 (0.76–3.46) – – – –
3 mo 1.31 (0.49–3.49) 0.57 (0.19–1.70) 0.83 (0.39–1.76) 0.72 (0.31–1.70)
6 mo 0.48 (0.08–2.82) 2.27 (0.61–8.51) 0.43 (0.13–1.40) 1.16 (0.40–3.42)
12 mo 1.51 (0.69–3.29) 0.69 (0.31–1.54) 0.95 (0.52–1.75) 0.65 (0.32–1.34)
24 mo 0.95 (0.52–1.75) 0.65 (0.32–1.34) 0.46 (0.21–0.97)c 1.05 (0.52–2.12)
Alpha-casein IgA
3 mo 0.97 (0.42–2.24) 0.34 (0.12–0.95)c 1.52 (0.79–2.91) 0.18 (0.06–0.58)d
6 mo 1.26 (0.58–2.74) 0.50 (0.22–1.12) 1.92 (1.01–3.64)c 0.37 (0.17–0.81)c
12 mo 0.78 (0.37–1.63) 1.02 (0.49–2.10) 0.80 (0.45–1.42) 0.59 (0.29–1.17)
24 mo 0.80 (0.45–1.42) 0.59 (0.29–1.17) 0.44 (0.21–0.92)c 1.00 (0.50–1.98)
Alpha-casein IgG
0 mo 1.00 (0.48–2.08) 1.48 (0.73–3.00) – – – –
3 mo 0.92 (0.46–1.85) 0.84 (0.42–1.68) 1.26 (0.72–2.23) 0.69 (0.37–1.28)
6 mo 0.86 (0.37–1.97) 0.64 (0.28–1.46) 1.09 (0.59–1.99) 0.40 (0.19–0.87)c
12 mo 0.67 (0.31–1.43) 0.70 (0.33–1.50) 1.03 (0.59–1.80) 0.84 (0.45–1.55)
24 mo 1.03 (0.59–1.80) 0.84 (0.45–1.55) 0.90 (0.47–1.72) 0.97 (0.51–1.84)
a At 3 mo adjusted for birthweight, duration of gestation and duration of exclusive breastfeeding by 3 mo of age; at 6 mo for birthweight
and total breastfeeding (yes/no); at 12 mo for milk protein intake of the child, age at introduction of milk products and breastfeeding
(yes/no); and at 24 mo for milk protein intake of child, age at introduction of milk products and duration of total breastfeeding.b 3 mo cow’s milk antibody titres were available from 85 to 94 subjects, at 6 mo from 80 to 88 subjects, at 12 mo from 81 to 83 subjects, and
at 24 mo from 70 to 80 subjects.c p50.05 for significant ORs and their 95% CIs.d p50.01 for significant ORs and their 95% CIs.e The 6 mo analysis could not be done due to only one infant with a positive antibody titre.
Maternal diet and CM antibodies in infants 701

seen at the age of 2 y, similar to that for IgG BSA
antibodies. Maternal milk protein intake from cheese
was inversely related to IgA CAS antibody titres at 3
and 6 mo of age. Maternal protein intake from cheese
during lactation was also significantly related to
decreased IgG antibody titres toCM formula andCAS.
Discussion
Relatively few relationships were established between
the maternal consumption of different types of milk
products and the antibody response to specific CM
proteins in the offspring. By including the children
belonging to the intervention group in TRIGR in the
present series, we had a unique opportunity to study
the impact of maternal CM consumption on the
humoral immune response to CM proteins in the
offspring with no bias introduced by the infant’s CM
exposure to anything other than breast milk during the
first 6 mo of life. During that time, all CM and beef
protein was eliminated from the infant’s diet. As
expected, most of the associations between maternal
milk protein intake and CM protein antibody titres in
the infants were noted during the first 6 mo. These
results suggest that the maternal diet during pregnancy
is only weakly related to the humoral immune response
to CM proteins in the infants, as significant associ-
ations were observed only between maternal protein
intake from cheese and IgA antibodies to BLG and
CAS. The maternal diet during lactation was more
strongly associated with CM antibody titres in the
infants. Maternal protein intake from raw milk
products and cheese appeared to be inversely related
to the antibody titres in the infants. High cheese
consumption was inversely associated with antibody
titres until 6 mo of age, whereas a high consumption of
raw milk products appeared to decrease the antibody
titres later. Maternal protein intake from raw milk
products was inversely related to protein intake from
cheese. This might imply that the impact of maternal
cheese intake on the antibody titres in infants is
mediated by the intake of raw milk products, the latter
being the true effecter.
In the validation study of the food frequency ques-
tionnaire used in the present study [18], the intake of
protein was overestimated (values 133% of the values
in food records). Although food frequency ques-
tionnaires are not considered appropriate for estimat-
ing absolute nutrient intakes, they can be used to
categorize individuals accurately according to intake
and can identify subjects at the intake extremes. In the
validation study [18], the quintile notation was found
to be acceptable for protein as well as for most of the
other nutrients. Average intakes of energy and protein
among mothers in the present study were comparable
with values in the validation study.
The current study was unique in that we grouped all
milk products according to their type of processing and
separately assessed protein intake from two different
groups. To the best of our knowledge, there is no other
study in which this has been done. Our assumption that
milk products may differ in their impact on immuno-
logical responses is based on the data for protein
composition of different milk products and heat-
induced changes in milk [e.g. 23]. Cheese contains
mainly casein (whey proteins are separated in the
process), whereas other milk products contain all milk
proteins. In the group of “raw milk products”, we
included products that we assumed had the strongest
impact on antibody development.
It has been shown that the mean IgA levels do not
change during pregnancy, whereas IgG levels decrease
[24]. That could partly explain the stronger associa-
tions observed in our study between maternal CM IgA
antibody titres and maternal diet during pregnancy
than for IgG antibodies and maternal diet. It might be
more difficult to demonstrate the impact of maternal
diet on IgG antibodies, because of an unstable level of
IgG in pregnancy. Our study confirmed the connection
between IgG antibodies in thematernal circulation and
those found in cord blood. The correlations between
maternal IgG titres and titres in the offspring are
naturally strongest at birth, when transplacentally
transferred IgG levels have not yet started to decrease
in the infant. Correlations with IgA titres turned out to
be stronger at later time points when IgA levels started
to stabilize in the offspring.
In the logistic regression models at 12 and 24 mo of
age, we used the diet record information on the child’s
own CM consumption as a covariant in the analysis.
With this, however, we could not totally adjust for the
child’s own CM exposure. Even though food records
are often considered the golden standard in validation
studies [21], they have their weaknesses. In our case,
3 d may not have provided an overall picture of the
child’s diet. New foods are frequently introduced into
the diet of a 1-y-old child. In the Finnish recommen-
dations for infant feeding [25], families are advised to
start giving sour milk products to their infant at the age
of 10 mo and regular CMproducts at the age of 12 mo.
It has been demonstrated that hydrolysed infant
formulae also contain measurable amounts of potential
antigenic proteins [26]. However, the casein hydro-
lysate (Nutramigen) had the lowest BLG levels in the
hydrolysed formulas analysed in the study of Makinen-
Kiljunen et al. [26]. The mean energy and protein
intakes at the ages of 12 and 24 mo in the present
study were in accordance with Nordic Dietary
Recommendations [27].
The reaction time between the exposure and devel-
opment of antibodies is not known. Exclusive feeding
of CM formula during the first 3 d of life was still
associated with high IgG CM antibody levels at the age
702 M. Erkkola et al.

of 2 y in the study of Juvonen et al. [28]. Individual
mammary permeability influences the amount of
antigen secreted into breast milk and, in addition, the
gastrointestinal permeability differs between individual
babies. Overall, the development of CM antibodies in
infants seems to be related more closely to the type of
feeding than to age. In our study the exposure to milk
and meat products was minimal in all infants during
the first 6 mo. Subsequently, there was more inter-
individual variation in the food intake, and it is well
established that the diet represents a full variety of
different exposures, which may have a confounding
effect on the relations between a specific nutrient and
the development of an immune response.
The present findings are not directly comparable
with earlier studies because of the particular study
design, and the conclusions may not be directly
generalized because of the participating families being
selected by genetic risk for type 1 diabetes. Antibodies
to CM proteins have been measured in children in a
number of settings. Most of the studies have focused
on IgE-mediated hypersensitivity in high-risk children,
and only a few have addressed other issues such as CM
intolerance or the aetiology of diabetes. In their review,
Akerblom et al. [29] summarized various studies on the
humoral immune response to CM proteins in patients
with type 1 diabetes. Increased levels to at least one of
the IgA- and IgG-class antibodies to CM, BLG and
BSA were recorded in subjects with type 1 diabetes
compared to control subjects in the 11 studies re-
viewed. The authors suggested that temporary but
strict avoidance of CM proteins in early infancy might
prevent the development of type 1 diabetes in geneti-
cally susceptible subjects. The possible pathogenic role
of IgA- and IgG-class CM antibodies has remained
open.
To conclude, this study introduced a new viewpoint
into research on CM antibodies in infants and young
children. Milk products seem to differ in their effects
on CM antibody responses. Maternal protein intake
from raw milk products and cheese tended to inhibit
the humoral immune responses to CM proteins in the
offspring. The inverse association between maternal
intake of cheese during pregnancy and the humoral
immune response toCMproteins in early infancy raises
the issue of whether such maternal exposure could
induce tolerance to CMproteins in the offspring. Simi-
larly, the inverse relationship between maternal intake
of raw milk products and cheese during lactation and
the antibody response to CM proteins in infants indi-
cates the possibility of tolerance induction in the off-
spring by CMproteins transferred through breast milk.
References
[1] Businco L, Bruno G, Giampietro PG. Prevention and manage-
ment of food allergy. Acta Paediatr 1999;Suppl 430:104–9.
[2] Virtanen SM, Knip M. Nutritional risk predictors of b cell
autoimmunity and type 1 diabetes at a young age. Am J Clin
Nutr 2003;78:1053–67.
[3] Savilahti E, Saukkonen T, Virtala E, Tuomilehto J, Akerblom
HK, the Childhood Diabetes in Finland Study Group.
Increased levels of cow’s milk and betalactoglobulin antibodies
in young children with newly diagnosed insulin-
dependent diabetes mellitus. Diabetes Care 1993;16:984–9.
[4] Saukkonen T, Savilahti E, Vaarala O, Virtala E, Tuomilehto J,
AkerblomH, the ChildhoodDiabetes in Finland Study Group.
Children with newly diagnosed insulin-dependent diabetes
mellitus have increased levels of antibodies to bovine serum al-
bumin but not to ovalalbumin. Diabetes Care 1994;17:970–6.
[5] Hughes DA. The influence of the diet on the maturation of the
immune system. Allergy 1998;Suppl 46:26–8.
[6] Lovegrove JA, Hampton SM, Morgan JB. The immunological
and long-term atopic outcome of infants born to women
following a milk-free diet during late pregnancy and lactation: a
pilot study. Br J Nutr 1994;71:223–38.
[7] Zeiger RS. Dietary aspects of food allergy prevention in infants
and children. J Pediatr Gastroenterol Nutr 2000;Suppl 30:
77–86.
[8] Tainio V-M, Savilahti E, Arjomaa P, Salmenpera L, Perheen-
tupa J, Siimes MA. Plasma antibodies to cow’s milk are
increased by early weaning and consumption of unmodified
milk, but production of plasma IgA and IgM cow’s milk anti-
bodies is stimulated even during exclusive breast-feeding. Acta
Paediatr Scand 1988;77:807–11.
[9] Kaila M, Arvilommi H, Soppi E. A prospective study of
humoral immune responses to cow milk antigens in the first
year of life. Pediatr Allergy Immunol 1994;5:164–9.
[10] Kuitunen M, Savilahti E, Sarnesto A. Human a-lactalbumin
and bovine b-lactoglobulin absorption in infants. Allergy
1994;49:354–60.
[11] Telemo E, Hanson LA. Antibodies in milk. J Mammary Gland
Biol Neoplasia 1996;1:243–9.
[12] Savilahti E, Kuitunen M. Allergenicity of cow milk proteins.
J Pediatr 1992;Suppl 121:12–20.
[13] Kilshaw PJ, Cant AJ. The passage of maternal proteins into
breast milk. Int Arch Appl Immunol 1984;75:8–15.
[14] Fukushima Y, Kawata Y, Onda T, KitagawaM. Consumption
of cow milk and egg by lactating women and the presence of
beta-lactoglobulin and ovalbumin in breast milk. Am J Clin
Nutr 1997;65:30–5.
[15] Falth-MagnussonK,KjellmanNI,MagnussonKE. Antibodies
IgG, IgA, and IgM to food antigens during the first 18 months
of life in relation to feeding and development of atopic disease.
Allergy Clin Immunol 1988;81:743–9.
[16] Hattevig G, Kjellman B, Sigurs N, Grodzinsky E, Hed J,
Bjorksten B. The effect of maternal avoidance of eggs, cow’s
milk, and fish during lactation on the development of IgE, IgG,
and IgA antibodies in infants. J Allergy Clin Immunol
1990;85:108–15.
[17] Akerblom HK, Virtanen SM, Ilonen J, Savilahti E, Vaarala O,
Reunanen A, et al. Diabetologia 2005 (in press).
[18] Erkkola M, Karppinen M, Javanainen J, Rasanen L, Knip M,
Virtanen SM. Validity and reproducibility of a food frequency
questionnaire for pregnant Finnish women. Am J Epidemiol
2001;154:466–76.
[19] Ovaskainen M-L, Valsta LM, Lauronen J. The compilation of
food analysis values as a database for dietary studies – the
Finnish experience. Food Chem 1996;57:133–6.
[20] Vaarala O, Saukkonen T, Savilahti E, Klemola T, Akerblom
HK. Development of immune response to cow’s milk proteins
in infants receiving cow’s milk or hydrolyzed formula. J Allergy
Clin Immunol 1995;96:917–23.
[21] Willett W. Nutritional epidemiology. 2nd ed. New York:
Oxford University Press; 1998.
Maternal diet and CM antibodies in infants 703

[22] HosmerDW, Lemeshow S. Applied logistic regression, Second
edition. A Wiley-Interscience publication. New York: John
Wiley & Sons Inc, 2000.
[23] Jost R, Fritsche R, Pahud JJ. Reduction of milk protein
allergenicity through processing. Bibl Nutr Dieta 1991;48:
127–37.
[24] Ailus KT. A follow-up study of immunoglobulin levels and
autobodies in an unselected pregnant population. Am J Reprod
Immunol 1994;31:189–96.
[25] Hasunen K, Kalavainen M, Keinonen H, Lagstrom H, Lyyti-
kainen A, Nurttila A, et al. Lapsi, perhe ja ruoka. Imevais- ja
leikki-ikaisten lasten, odottavien ja imettavien aitien ravitse-
mussuositus. Sosiaali- ja terveysministerion julkaisuja 2004:11.
Helsinki: Edita Prima Oy; 2004 (in Finnish).
[26] Makinen-Kiljunen S, Sorva R. Bovine b-lactoglobulin levels in
hydrolysed protein formulas for infant feeding. Clin Exp
Allergy 1993;23:287–91.
[27] Nordisk ministerrad. Nordiska naringsrekommendationer
1996, Nord 1996:28. Kopenhamn: AKA-print; 1996.
[28] Juvonen P, Mansson M, Kjellman NI, Bjorksten B,
Jakobsson I. Development of immunoglobulin G and im-
munoglobulin E antibodies to cow’s milk proteins and oval-
bumin after a temporary neonatal exposure to hydrolyzed
and whole cow’s milk proteins. Pediatr Allergy Immunol
1999;10:191–8.
[29] Akerblom HK, Savilahti E, Vaarala O. Cow’s milk protein
and insulin-dependent diabetes mellitus. Scand J Nutr 1996;
40:98–103.
704 M. Erkkola et al.

IV


V

1
Age at introduction of new foods and advanced beta-cell autoimmunity in young
children with HLA-conferred susceptibility to type 1 diabetes
S.M. Virtanen, M. G. Kenward, M. Erkkola, S. Kautiainen, C. Kronberg-Kippilä, T. Hakulinen, S. Ahonen, L. Uusitalo, S. Niinistö, R. Veijola, O. Simell, J. Ilonen, M. Knip
Nutrition Unit, Department of Epidemiology and Health Promotion, National Public Health Institute, Helsinki, Finland (SMV, ME, C K-K), Tampere School of Public Health, University of Tampere, Tampere, Finland (SMV, ME, SK, SA, LU), Tampere University Hospital Research Unit, Tampere, Finland (SMV, SK, SA), Department of Epidemiology and Population Health, Medical Statistics Unit, London School of Hygiene & Tropical Medicine, London, UK (MGK); Finnish Cancer Registry, Helsinki, Finland (TH), Department of Public Health, University of Helsinki (SN), Department of Pediatrics, University of Oulu, Oulu, Finland (RV), Department of Paediatrics, University of Turku, Turku, Finland (OGS), Department of Virology, University of Turku, Turku, Finland (JI), Department of Pediatrics, Tampere University Hospital, Tampere, Finland (MK), Hospital for Children and Adolescents, University of Helsinki, Helsinki, Finland (MK), and the Juvenile Diabetes Research Foundation (JDRF) Centre for Prevention of Type 1 Diabetes in Finland (OGS, JI, MK).
Correspondence to:SM Virtanen, National Public Health Institute, Department of Epidemiology and Health Promotion, Nutrition Unit, Mannerheimintie 166, 00300 Helsinki, Finland E-mail: [email protected].
None of the authors had a personal or professional conflict of interest. Running head: Infant feeding pattern and risk of pre-type 1 diabetes

2
Abstract
Aims/hypothesis:
Evidence for the role of infant feeding in the development of beta-cell autoimmunity is inconsistent.
We set out to study the effects of breastfeeding and age at introduction of supplementary foods on
the development of beta-cell autoimmunity.
Methods:
A prospective birth cohort of 3565 infants with HLA-DQB1-conferred susceptibility to type 1
diabetes were recruited between 1996-2001 from two university hospital areas in Finland. Blood
samples were collected at 3 to 12 months intervals to measure antibodies against islet cells (ICA),
insulin, glutamate dehydroxylase and islet antigen 2. The families completed at home a record on
the age at introduction of new foods and, for each visit, a structured dietary questionnaire. The
endpoint was repeated positivity for ICA together with at least one of the other three antibodies.
Results: The overall or exclusive duration of breastfeeding was not associated with the risk of
developing the endpoint. An early age at introduction of fruits and berries (< 4 months) was related
to increased risk of developing positivity for the endpoint (hazard ratio (95% CI) for earliest tertile
2.02 (1.03-3.95) and for midtertile 1.97 (1.06-3.64) compared to latest tertile). This association was
independent of several putative sociodemographic, perinatal and dietary confounding factors.
Conclusions/interpretation:
Our finding suggests that an early age at introduction of fruits and berries associates independently
with beta-cell autoimmunity, contradicting earlier findings from smaller birth cohort studies.
Key words Type 1 diabetes, beta-cell autoimmunity, aetiology, nutrition, infancy.
The number of words in the abstract is 228 and in the text 4 138 (excluding the figure and the
tables) and the number of references is 40.
Abbreviations GADA: 65 kD isoform of glutamic acid decarboxylase, HR: hazard ratio, IA-2A:
tyrosine phosphatase-related islet antigen 2, IAA: insulin autoantibodies

3
Introduction
Evidence for a possible role of early infant feeding patterns in the development of beta-cell autoimmunity and clinical type 1 diabetes is inconsistent. In some case-control studies early introduction of cow’s milk has been linked to the risk of type 1 diabetes [1], while in two recent prospective birth cohort studies child’s age at introduction of cow’s milk was not related to development of at least one type 1 diabetes-associated autoantibody out of insulin autoantibodies (IAA), autoantibodies to the 65 kD isoform of glutamic acid decarboxylase (GADA) and the tyrosine phosphatase-related islet antigen 2 (IA-2A) [2, 3]. In another study using a nested case-control analysis, the age at introduction of cow’s milk was related to the emergence of IA-2A, or to all four autoantibodies (ICA, IAA, GADA, IA-2A) [4]. Recently, a putative harmful effect of early introduction of wheat, rye, barley or oats has been implicated by a German birth cohort study in offspring of parents affected by type 1 diabetes [3], whereas a protective effect of introduction of these cereals and rice between the age of 4 and 6 months was reported in a Colorado birth cohort of infants at increased genetic risk for type 1 diabetes [2]. It is possible that breastfeeding protects from beta-cell autoimmunity or progression to clinical diabetes [1, 5].
There are four disease-related autoantibodies that have been shown to predict overt type 1 diabetes: ICA, IAA, GADA and IA-2A [6]. The number of detectable autoantibodies is unequivocally related to the risk of progression to clinical type 1 diabetes both in family studies and general population cohorts [7, 8]. However, previous studies searching for dietary predictors of beta-cell autoimmunity have mostly used positivity for one autoantibody only as the endpoint, and the numbers of seroconverters have been small.
We set out to assess how age at introduction of different foods during the first year of life is related to the emergence of type 1 diabetes-associated autoantibodies in a population-based cohort of young children with increased HLA-DQB1-conferred risk of type 1 diabetes. Our endpoint was repeated positivity for ICA together with at least one other diabetes-associated major antibody, i.e., IAA, GADA or IA-2A.
Subjects and methods
SubjectsIn the Type 1 Diabetes Prediction and Prevention Project (DIPP), a prospective population-based cohort study [9], newborn infants from the areas of three university hospitals in Finland are screened for HLA-DQB1 conferred susceptibility to type 1 diabetes using samples of cord blood. Infants carrying increased genetic susceptibility (HLA-DQB1*02/0302 heterozygous and DQB1*0302/x-positive subjects; x stands for homozygosity or a neutral allele) are being monitored fordiabetes-associated autoantibodies, growth, and viral infections at 3 to 12 month intervals. The families are offered the opportunity to take part in a randomised double-blinded intervention trial with intranasal insulin when their child tests repeatedly positive for at least two autoantibodies. Procedures were approved by the local Ethics Committees. The DIPP Nutrition Study falls within the framework of DIPP. The present series comprises the at-risk children born between September 2, 1996 and June 30, 2001 at Oulu University Hospital and between October 20, 1997 and June 30, 2001 at Tampere University Hospital. In this analysis data from 3565 children (81% of the children invited) was available. Of them 93.5% were followed up to 6 months, 81.9% up to 1 year and 68.3% up to 2 years of age. Of the participants 207 (5.8%) had a first-degree relative with diabetes at the time of the study: 75 a father, 119 a mother and 21 a sibling.

4
Dietary methods Information on infant feeding patterns was collected on each child’s diet with 3, 6, 12, and 24 month questionnaires as well as with the “age at introduction of new foods” form. Trained study nurses checked the questionnaires during the respective visits. In the 3-month dietary questionnaire the feeding at delivery hospital was assessed in detail: whether the child was breast-fed, had received banked breast milk, was exposed to infant formula and if so to which formula, and which of these was/were the main type of feed during the delivery hospital stay. The duration of breastfeeding, the age at introduction of infant formulas and brand names of all formulas the child had received, as well as the age at introduction of other cow’s milk products (foods and drinks containing cow’s milk or sour milk) were requested in all questionnaires. The formulas were classified as cow’s milk based, hydrolysed or soy based. At the age of 3 months all the food items the infant had so far received were carefully recorded. For the first 2 years of the child’s life the family was asked to record the age at introduction of all new foods on a continuous form, which was checked at each visit. In the analysis the following food groupings were used: 1) fruits and berries; 2) roots: potato, carrot, turnip, swede; 3) wheat, barley, rye and oats; 4) other cereals: maize, rice, millet or buckwheat; 5) cabbages; 6) milk products and foods containing milk; 7) cow’s milk based infant formulas (excluding hydrolysed and soy formulas); 8) fish; 9) meat; and 10) sausage. In addition wheat, rye, barley and oats were each analysed separately. Exclusive breastfeeding was defined as the period during which the child received, in addition to breast milk, only water, or vitamin or mineral supplements.
Genetic methods HLA-DQB1 alleles were analysed as described earlier [10]. In brief, a part of the second exon of the HLA-DQB1 gene was amplified using a primer pair with a biotinylated 3' primer. The biotinylated PCR products were then transferred to streptavidin-coated microtitration plates, denatured and hybridised with sequence-specific probes labelled with lanthanide chelates: europium (Eu), terbium (Tb) or samarium (Sm). Two hybridisation mixtures were used, one containing probes hybridising with DQB1*0602 and *0603, DQB1*0603 and *0604 and a consensus sequence, and the other containing probes specific to the DQB1*02, *0301 and *0302 alleles. After appropriate incubations and washings, the specific hybridisation products were detected using three-colour time-resolved fluorescence of the lanthanide chelates.
Immunological methods Of the four type 1 diabetes-associated autoantibodies analysed, ICA were used as the primary screening tool for beta-cell autoimmunity. When a child seroconverted to positivity for ICA for the first time, child’s all preceding (starting from birth) and subsequent samples were analysed for IAA, GADA and IA-2A.
ICA were quantified by a standard indirect immunofluorescence method on sections of frozen human pancreas from a blood group O donor [11]. The end-point dilution titre of positive samples was recorded and the results expressed in JDF units. The detection limit was 2.5 JDF units. All samples initially positive for ICA were retested for confirmation. The disease sensitivity of the ICA assay in our laboratory was 100% and the specificity 98% in the most relevant standardisation workshop round [12]. Serum IAA were quantified with a microassay [13,14] and GADA and IA-2A with specific radiobinding assays [15,16]. The IAA values representing the specific binding were expressed in relative units based on a standard curve run on each plate using the MultiCalc™software program (PerkinElmer Life Sciences Wallac, Turku, Finland) and the GADA and IA-2A values were expressed in relative units based on a standard curve constructed from a dilution of positive and negative samples. The limits for IAA, GADA and IA-2A positivities were set at 1.55, 5.35, and 0.429 relative units, respectively, which represents the 99th percentile among more than 370 non-diabetic Finnish children and adolescents. The disease sensitivity and specificity of the IAA, GADA and IA-2A assays were 44% and 98%, 82% and 98%, and 62% and 100%, respectively, in the Centers for Disease Control sponsored Diabetes Autoantibody Standardisation

5
Programme Workshop 2002. Samples with IAA, GADA, or IA-2A values between the 97.5th and 99.5th percentiles were reanalysed to confirm the antibody status. Transplacentally transferred autoantibodies [17] were excluded from the analyses. Data on type 1 diabetes-associated autoantibodies until September 30, 2004 were used.
Among the 3565 children with genetic risk for type 1 diabetes, 237 (6.6%) were at least twice positive for ICA and 101 (2.8%) repeatedly positive for ICA plus at least one other antibody during the median follow-up time of 4 years (range 0.2 to 8.1 years) since birth. Of the 101 children who were positive for ICA plus at least one other autoantibody, 83 tested at least twice positive for IAA, 66 for GADA, and 49 for IA-2A. By September 30, 2004, 42 children (1.2%) had progressed to clinical type 1 diabetes at a median age of 3.2 years (range 1.0-6.4 years). Among these, 32 had been repeatedly positive for ICA plus at least one other autoantibody. However, seven of the remaining 10 children had or had had one or more autoantibodies in one single sample before or at the time of diagnosis. The three persistently seronegative children had had the last blood sample drawn 2.5, 3.2 and 5.1 years before the diagnosis of diabetes, respectively. Therefore we decided to include clinical type 1 diabetes in the autoantibody endpoints. This resulted in 111 children (3.1% of all children) being positive for the ICA plus at least one other antibody. None of the children were randomized for the intranasal insulin trial before testing positive for ICA plus at least one other autoantibody. Neither was any of those 10 children who were not repeatedly positive for ICA plus at least one other autoantibody, but who developed diabetes, randomised for the intranasal insulin trial.
Sociodemographic and perinatal characteristics Information on child’s sex, maternal age and education, and the number of siblings was registered by a structured questionnaire completed by the parents after the delivery. Information on duration of gestation, mode of delivery, birth weight and height, and maternal smoking during pregnancy was received from the Medical Birth Registries of the Oulu and Tampere University Hospitals. (Table 1).
Statistical methods The endpoint (positivity for ICA plus at least one other autoantibody) is interval censored and possibly dependent among siblings. To accommodate this structure, a piece-wise exponential survival model was used with constant hazard in the intervals 0-0.99, 1-1.99, 2-2.99 and >3 years. The results were not sensitive to the particular choice of intervals used. Observation intervals beyond positivity did not contribute to the analysis. Random effects for family were introduced to accommodate familial dependence and these were assumed to follow a normal distribution. For some particular covariates with missing observations the analysis dataset was reduced to the extent that the siblings were too few to allow sufficiently good estimates of the family effect variance to be obtained, and on these occasions this component of the model was omitted. In such reduced data sets the impact of familial dependence is anyway minimal. Time-dependent exposures were allowed to influence the risk in a given observational interval only if the exposure could reasonably be expected to affect the subject for at least half of the length of the interval. The models were fitted using maximum likelihood in SAS PROC NLMIXED, with standard errors of estimates derived from the observed information matrix. The proportionality of the hazards was tested by adding interaction terms of the exposure variables with time interval, to the models. The models including interaction terms did not largely differ from the models without them, only for rye and wheat, rye, oats and barley together the difference was of borderline significance. Logistic regression analysis was used to study background factors associated with age at introduction of selected foods. Predefined categories of the explanatory variables were used: tertiles for all dietary variables and in addition quartiles for the earliest exposures (exclusive breastfeeding and age at introduction of cow’s milk). Statistical significance was taken as less than 5%.

6
Results Among the baseline characteristics of the study population, only HLA-DQB1 -conferred risk, familial diabetes and gestational age were significantly related to the rate of seroconversion (Table 1).
Table 1 Characteristics of the participating infants and hazard ratio (HR) and 95% CI of repeated positivity for islet cell autoantibodies (ICA) and at least one other diabetes-associated autoantibody out of IAA, GADA and IA-2A, a,b adjusted for genetic risk.
Characteristic
(n of children with a positive endpoint)
N (%) HR (95% CI)
adjusted for genetic risk
Boys (66) 1902 (53.4) 1.33 (0.91-1.95)
Girls (45) 1663 (46.6) 1
HLA-DQB1 conferred risk group
- high risk (DQB1*02/*0302) (35) 684 (19.2) 2.04 (1.29-3.22) c
- moderate risk (DQB1*0302/xd) (76) 2881 (80.8) 1
Familial diabetes
- yes 207 (5.8) 3.35 (2.05-5.50) c
- no 3358 (94.2)
Hospital of birth
- Oulu (61) 1753 (49.2) 1.19 (0.82-1.73)
- Tampere (50) 1812 (50.8) 1
Number of siblings in the familye
- no (38) 1379 (38.7) 1
- one (39) 1040 (29.2) 1.17 (0.77-1.78)
- two or more (21) 860 (24.1) 0.83 (0.50-1.37)
- missing information (13) 286 (8.0)
Maternal basic educatione
- less than high school graduate (40) 1582 (44.4) 1
- high school graduate (60) 1808 (50.7) 1.23 (0.83-1.84)
- missing information (11) 175 (4.9)
Maternal age, yearse
- less than 25 (23) 692 (19.4) 1
- 25 to 29 (32) 1193 (33.5) 0.69 (0.41-1.17)
- 30 or more (56) 1680 (47.1) 0.83 (0.52-1.33)
Gestational age, weeksb
- 1. quartile: <39 (37) 869 1
- 2. quartile: 39 (21) 868 0.56 (0.33-0.95) c
- 3. quartile:40-40.7 (30) 886 0.77 (0.47-1.24)
- 4. quartile: 40.8- (20) 922 0.49 (0.29-0.85) c
- missing information (3) 20
Ponderal index at birth, (g/m3)*100
- 1. quartile: <2.61 (26) 888 1
- 2. quartile: 2.61-2.77 (33) 920 1.26 (0.75-2.10)

7- 3. quartile: 2.78-2.93 (25) 849 1.04 (0.60-1.80)
- 4. quartile: 2.94- (24) 891 0.91 (0.52-1.58)
- missing information (3) 17
Route of delivery
- caesarean section (10) 454 (12.7) 0.69 (0.36-1.33)
- other (98) 3094 (86.8) 1
- missing information (3) 17 (0.5)
Maternal smoking during pregnancy
- yes (6) 395 (11.1) 0.52 (0.23-1.18)
- no (100) 3060 (85.8) 1
- missing information (5) 110 (3.1)
Total (111) 3565 aA piece-wise exponential survival model was used in the analysis. ICA were used as a primary screening tool. All samples of the children testing at least once positive for ICA were analysed for IAA, GADA and IA-2A. Type 1 diabetes was included in the endpoint (see Methods page 8) bFor the endpoint based on repeated positivity for ICA and at least one other autoantibody the trend across the quartiles was significant (p<0.05) for gestational age c P<0.05
d x not equal to *02, *0301, *0602e At the time of the birth of the child
Dietary pattern The first supplementary foods given after or in parallel with breast milk were supplementary milk (in 61% of the children), carrots and potatoes (16%), and fruits and berries (6%), (Figure 1). The two latter food groups were started at the same time in 9% and fruits, berries or roots at the same time with supplementary milk in 7% of the children. Only seven children had first received cereals and 10 cereals together with some of the foods mentioned above.
Figure 1 The cumulative proportion of children (N=3565) introduced to selected foods by age. Cow’s milk includes cow’s milk based infant formulas
The total duration of breastfeeding correlated with exclusive breastfeeding (rS=0.51) and with age at introduction of most of the foods, e.g. cow’s milk products (rS=0.57), fruits and berries (rS=0.44), roots (rS=0.50), the group of wheat, rye, oats and barley (rS=0.33), and other cereals (rS=0.37). Also
0.0
0.2
0.4
0.6
0.8
1.0
Cum
ulat
ive
prop
ortio
nof
child
ren
0 2 4 6 8 10 12age (months)
cow's milk fruit and berriesroots rye

8
the duration of exclusive breastfeeding correlated with the age at introduction of most of the foods, the correlation with age at introduction of cow’s milk products being particularly strong (rS=0.93). The intercorrelation between age at introduction of cow’s milk, fruits and berries, roots, cabbages, wheat, rye, barley and oats, other cereals, fish, meat, sausage, and egg varied from 0.17 to 0.49. The intercorrelations between the age at introduction of wheat, rye, barley and oats products were strong (rS=0.54-0.80). Among cereals, oats were introduced first (median age at introduction for oats 5 months, for the others 6 months). The pattern of age at introduction of supplementary milk, fruits and berries, roots, and rye during the first year of life is presented in the Fig 1.
Duration of breastfeeding Duration of total and exclusive breastfeeding was not associated with the autoantibody endpoints (Table 2). The results regarding breastfeeding were similar when the information on feeding at the delivery hospital was taken into account (data not shown).
Table 2 Hazard ratio (HR) and 95% CI adjusted for genetic risk for repeated positivity or diabetes-associated autoantibodies related to age at introduction of foodsa,b
. Separate models were used for each dietary variableAge ICA plus at least one other autoantibodyMonths N of positive (total N) HR (95% CI)
Total breastfeeding nsc
- 1. tertile: 0-4 28 (1106) 0.96 (0.59-1.57)
- 2. tertile: 4.01-8.5 32 (1000) 1.09 (0.67-1.76)
- 3. tertile: >8.5 37 (1078) 1
Exclusive breastfeeding nsc
- 1. tertile: <1 38 (1322) 0.87 (0.56-1.35)
- 2. tertile: 1-2.99 24 (934) 0.82 (0.49-1.35)
- 3. tertile: >3 42 (1174) 1
Cow’s milk nsc
- 1. tertile: < 1 37 (1196) 0.94 (0.61-1.47)
- 2. tertile: 1- 3.99 24 (1036) 0.76 (0.46-1.25)
- 3. tertile: >4 42 (1185) 1
Fruits and berries p=0.026c
- 1. tertile: < 3.5 33 (1001) 2.02 (1.03-3.95) d
- 2. tertile: 3.5-4 47 (1330) 1.97 (1.06-3.64) d
- 3. tertile: >4 21 (955) 1
Roots p=0.014 c
- 1. tertile: <3 15 (669) 1.04 (0.57-1.90)
- 2. tertile:3-3.99 49 (1198) 1.82 (1.19-2.79) d
- 3. tertile: >4 38 (1431) 1
Wheat, barley, rye or oats p=0.035c
- 1. tertile: < 5 10 (571) 0.76 (0.37-1.54)
- 2. tertile: 5-5.49 55 (1471) 1.53 (0.99-2.37)
- 3. tertile: > 5.5 36 (1192) 1
Wheat nsc
- 1. tertile: < 5 33 (1050) 1.23 (0.75-2.02)

9- 2. tertile: 5-6 24 (807) 1.07 (0.62-1.85)
- 3. tertile: >6 32 (969) 1
Rye nsc
- 1. tertile: < 5.5 28 (789) 1.43 (0.87-2.37)
- 2. tertile: 5.5-6.9 26 (917) 1.03 (0.61-1.74)
- 3. tertile: > 7 35 (1102) 1
Oats nsc
- 1. tertile: < 5 9 (467) 0.75 (0.35-1.60)
- 2. tertile: 5-5.5 55 (1652) 1.17 (0.73-1.87)
- 3. tertile: >5.5 28 (815) 1
Barley nsc
- 1. tertile: < 5.5 22 (765) 1.03 (0.61-1.75)
- 2. tertile: 5.5-6.9 27 (870) 1.02 (0.62-1.69)
- 3. tertile: > 7 40 (1161) 1
Other cereals nsc
- 1. tertile: < 4.5 28 (961) 0.98 (0.61-1.59)
- 2. tertile: 4.5-5 32 (1042) 0.91 (0.57-1.45)
- 3. tertile: > 5 41 (1239) 1 aA piece-wise exponential survival model was used in the analysis. ICA were used as a primary screening tool. All samples of the children testing positive for ICA were analysed for IAA, GADA and IA-2A. Type 1 diabetes was included in the endpoint. For breastfeeding variables age at the end. The variables were categorised into tertiles. In some cases the same age was reported for many children, which resulted in categories unequal in size. The nearest cut point was always used b For the endpoint based on repeated positivity for at least ICA plus one other autoantibody the trend across the tertiles was significant (p<0.05) for combined cereals (wheat, rye, oats, barley), rye alone, fruit and berries, but not for roots cLoglikelihood ratio test was used to test whether the model with and without the food variables differed. Ns: p>0.05d P<0.05
Age at introduction of cow’s milk Several measures of cow’s milk exposure were used: any type of cow’s milk exposure, exposure to cow’s milk-based infant formulas (hydrolysed and soy-based formulas were excluded), and early exposure in the delivery hospital. The age at any of these first exposures was unrelated to our autoantibody endpoint (Table 2).
Age at introduction of fruits and berries and roots Early age at introduction of fruits and berries was related to a greater risk of reaching the endpoint of the study (Table 2). Age at introduction of roots in the mid-tertile was related to increased risk of seroconversion to positivity for the endpoint. No evidence of interaction between HLA-DQB1 risk genotypes and age at introduction of fruits and berries or roots was seen in the development of the primary endpoint.

10
Age at introduction of cereals The intake of wheat, rye, oats, and barley was not differentiated during the first year of the study (September 1996-August 1997). Using either the combined variable or the specific cereals, no statistically significant associations were observed with the endpoint of ICA plus at least one other autoantibody. (Table 2). The introduction of rye products during breastfeeding or during non-breastfeeding did not modify the development of beta-cell autoimmunity (data not shown).
Confounding Young maternal age, short education and maternal smoking during pregnancy were associated with early introduction (in the earliest tertile) of fruits and berries, roots and rye (data not shown). In addition, among boys those with younger mother and those living in Oulu region had received fruits and berries and roots earlier than the other children. Low gestational age was related to early introduction of rye and caesarean section to early introduction of roots.
When bringing age at introduction of fruits and berries and roots into the same model with socio-demographic and perinatal factors, both food variables retained their significance (Table 3). When both food variables and the sociodemographic and perinatal factors were included in the same model, the association of fruits and berries with ICA plus at least one other autoantibody was of borderline significance (p=0.056). The type of the first supplementary food, whether supplementary milk, roots, or fruits and berries, was unrelated to the endpoint (data not shown).
Table 3 Hazard ratio (HR) and 95% CI for repeated positivity for ICA and at least one other diabetes-associated autoantibody of IAA, GADA and IA-2A associated with the age at introduction of foods
a adjusted for several background factors. In the second column separate
models for each food variable are presented, while in the third column a model including both food variables at the same time is presented Separate models for fruits and berries and
for roots: adjusted HR* (95% CI)
Model including both foods:
adjusted HR* (95% CI) Fruits and berries p=0.047c p=0.056c
- 1. vs. 3. tertile 1.90 (1.05-3.44) b 1.99 (0.98- 4.05)
- 2. vs. 3. tertile 1.86 (1.08-3.19) b 1.59 (0.87- 2.93)
Roots p=0.007 c nsc
- 1. vs. 3. tertile 0.81 (0.41-1.60) 0.52 (0.24- 1.15)
- 2. vs. 3. tertile 1.82 (1.16-2.85) b 1.38 (0.81- 2.34) a A piece-wise exponential survival model was used in the analysis. Adjusted for sex, genetic risk, familial diabetes, gestational age, maternal age, educational level and smoking during pregnancy, number of siblings at the time of birth, and for area of birth (Oulu vs. Tampere area). ICA were used as a primary screening tool. All samples of the children testing positive for ICA were analysed for IAA, GADA and IA-2A. Type 1 diabetes was included in the endpoint b P<0.05 cLoglikelihood ratio test was used to test whether the model with and without the food variables differed.
Discussion Our findings from the largest prospective cohort series so far reported suggest that certain patterns of introduction of foods into the infant diet are associated with signs of beta-cell autoimmunity in children with increased HLA-conferred genetic susceptibility to type 1 diabetes. In contrast to most previous studies we used as an endpoint repeated positivity for ICA plus at least one other autoantibody, which reflects more advanced and stable beta-cell autoimmunity than positivity for only one autoantibody. Young age at introduction of fruits and berries was surprisingly related to greater risk of developing the endpoint.
11
The major virtues of the present study are a well-defined study population, a high participation rate and the use of an endpoint which reflects advanced beta-cell autoimmunity. Positivity for single autoantibody specificity represents in most cases harmless non-progressive beta-cell autoimmunity, while the presence of two or more autoantibodies usually reflects a progressive process that only rarely reverts [18]. Positivity for three to four antibodies is associated with a risk of developing clinical type 1 diabetes within a range from 60 to 100% over the next 5-10 years [7, 8]. In our study the collection of dietary data before the development of the autoantibody endpoint excluded the possibility of differential bias in the selection of subjects or in the reporting of dietary habits.
The major limitation of the present study is that only information on the age at introduction of new foods, but not on the amounts of foods consumed could be studied. However, there is increasing evidence that gut-associated lymphoid tissue is involved in the development of type 1 diabetes and as the immune defence mechanisms of the infant gut mature by age [19], the putative dietary regulation of autoimmunity could depend on age. Whether age at introduction of foods is related to later food consumption patterns is not known. The number of children positive for the autoantibody endpoint in our study, although markedly larger than in previous reports in the present field, is still small causing imprecision in the risk estimates.
The time window for the first exposure is conspicuously narrow in Finland for some of the supplementary foods introduced in infancy, e.g. rye and oats. This reflects that most Finnish parents comply in this respect closely with the national recommendations on infant feeding conveyed by the staff at the well-baby clinics. The narrow age range would make the analyses less sensitive for detecting any risk or protective effects of early exposure to various foods in relation to beta-cell autoimmunity.
It can be argued that the dietary exposures measured in our study can act at least partly as proxies of other life style characteristics. In industrialised countries, a low educational attainment, young age and single marital status of the mother, urban environment, having a first baby, smoking and having a baby of male sex are among the factors that associate inversely with total and exclusive duration of breastfeeding [e.g. 20-23]. Less is known how the choice of weaning foods and the age at introduction of specific foods are related to sociodemographic and perinatal factors. In our cohort infant’s sex, gestational age, maternal age, education and smoking during pregnancy, caesarean section, number of siblings in the family, and the area of birth were related to the age at introduction of some specific foods in the diet of the child. Other studies suggest that older maternal age is a risk factor for type 1 diabetes [24-28], while the influence of socio-economic status [29], maternal smoking during pregnancy [24 vs. 25], and parental education [29, 30 vs. 26] remain controversial. The increased risk of developing type 1 diabetes has been linked to improved hygiene and to decreased or changed exposure to infections. Caesarean section [25, 27] and decreased exposure to common infections during infancy [31-33] were associated, although inconsistently [24, 28, 34, 35], to increased risk of type 1 diabetes, and day care attendance [32, 34] with reduced risk. The adoption of hygiene practices is influenced to some degree by social, lifestyle, and environmental factors [36]. Adjustment for several putative confounding sociodemographic, perinatal and dietary factors, however, had minor effects on our results.
On the other hand, it is possible that the observed associations reflect causal relationships. If the observed association between early age at introduction of fruits and berries reflects a true relationship, the question arises whether natural or other toxins could be involved in the pathogenesis of type 1 diabetes. Also ingredients added to these baby foods during industrial processing or food preparation at home such as starch or sucrose could play a role.
Previous cohort studies of children with increased genetic risk have reported associations between age at introduction of cereals and the development of an early and potentially reversible beta-cell autoimmunity, i.e. positivity for at least one autoantibody [2, 3]. However, we did not observe a

12
significant association between age at introduction of cereals and the development of ICA plus at least one other autoantibody. In contrast to previous case-control findings no relationship was observed between age at introduction of cow’s milk and development of the autoantibody endpoint studied [1]. This is in agreement with previous prospective cohort studies [2-4]. It should be noted, however, that the prospective studies done so far have been underpowered for the detection of such low risk ratios (about 1.5) that have been observed in case-control studies for clinical type 1 diabetes. In the previous nested case-control analysis of the DIPP Study [4], early introduction of cow’s milk and short duration of exclusive breastfeeding were related to seroconversion to positivity for IA-2A and for all four autoantibodies, a finding which we were not able to confirm in the present analysis with three-fold higher number of endpoints and using a more accurate dietary data collection, raising the possibility of a chance finding in the previous analysis. Even when using different categorizations applied in other previous studies no relationship between age at introduction of cow’s milk and ICA plus at least one other autoantibody endpoint was observed (data not shown). Observations from the pilot study of the first nutritional primary prevention study for type 1 diabetes (Trial to Reduce IDDM in the Genetically at Risk, TRIGR) showed that development of ICA and at least one autoantibody can be delayed by giving hydrolysed formula instead of a regular cow’s milk based one during the first 6-8 months of life in children with at least one family member affected by type 1 diabetes in addition to a risk-conferring HLA genotype [37]. It is noteworthy that TRIGR compared hydrolysed formula to a cow’s milk based one. Such a comparison is not possible in the present observational study. There is some evidence suggesting that the amount of cow’s milk consumed could be related to the risk of type 1 diabetes [30, 38-40]. The present analysis did not address quantities but only the age at first exposure.
Unlike previous analyses in similar studies we have accommodated between-sibling dependence formally through a frailty model. This between-sibling dependence is not well estimated in such data, but we have been able to show that its impact on the results is minimal. Interval censoring of the seroconversion times (i.e. that seroconversion takes place between the positive and previous negative measurement) has also been formally accounted for in the model and, in contrast to the analyses in most comparable studies, we have in addition accounted for the time-dependent nature of the principal explanatory variables. Because of the interval censoring an approximation had to be introduced: such a covariate is assumed to affect the hazard in an interval for an individual if at least half the interval overlaps with the covariate exposure. This introduces some inevitable measurement error into the exposure values, but at worst one would expect this to reduce the strength of observed associations. On the other hand, using such time-dependent exposures as baseline covariates could conceivably introduce artifactual associations, because of the asymmetric nature of the errors thus introduced. We chose to use predefined categories of the explanatory variables to avoid post hoc or outcome-dependent choices of categorisation.
Our findings from a prospective population-based cohort of individuals with increased genetic risk of type 1 diabetes imply that early age at introduction of fruits and berries is related to the development of advanced beta-cell autoimmunity in Finnish children. The significance of this observation remains to be assessed. It is possible that this dietary determinant identified in the present study merely act as proxy of some other yet unidentified lifestyle or environmental factor/s.
ACKNOWLEDGEMENTS Supported by the Academy of Finland (grants 63672, 79685,79686, 80846, 201988, 210632), the Finnish Diabetes Association, the Finnish Diabetes Research Foundation, the Finnish Pediatric Research Foundation, the Häme Foundation of the Finnish Culture Fund, the Juho Vainio Foundation, the Yrjö Jahnsson Foundation, Medical Research Funds, Turku, Oulu and Tampere University Hospitals, JDRF (grants 197032, 4-1998-274, 4-1999-731, 4-2001-435), Novo Nordisk Foundation and EU Biomed 2 Program (BMH4-CT98-3314). We express our gratitude to the

13
children and parents who participated. We want to thank the DIPP research nurses, doctors, nutritionists and laboratory staff for excellent collaboration over the years. We are also grateful to Sirpa Pohjola, Tommi Korhonen and Jari Hakalax for their skilful technical assistance.
REFERENCES 1. Virtanen SM, Knip M (2003) Nutritional risk predictors of β cell autoimmunity and type 1
diabetes at young age. Am J Clin Nutr 78:1053-1067 2. Norris JM, Barriga K, Klingensmith G et al (2003) Timing of initial cereal exposure in
infancy and risk of islet autoimmunity. JAMA 290:1713-1720 3. Ziegler AG, Schmid S, Huber D, Hummel M, Bonifacio E (2003) Early infant feeding and
risk of developing type 1 diabetes-associated autoantibodies. JAMA 290:1721-1728 4. Kimpimäki T, Erkkola M, Korhonen S et al (2001) Short-term exclusive breastfeeding
predisposes young children with increased genetic risk of Type I diabetes to progressive βcell autoimmunity. Diabetologia 44:63-69
5. Borch-Johnsen K, Mandrup-Poulsen T, Zachau-Christiansen B et al (1984) Relation between breastfeeding and incidence rates of insulin-dependent diabetes mellitus. Lancet 2:1083-1086
6. Knip M (2002) Can we predict type 1 diabetes in the general population? Diabetes Care 25:623-625
7. Bingley PJ, Bonifacio E, Williams AJK, Genovese S, Bottazzo GF, Gale EAM (1997) Prediction of IDDM in the general populations: strategies based on combinations of autoantibody markers. Diabetes 46:1701-1710
8. LaGasse JM, Brantley MS, Leech NJ et al (2002) Successful prospective prediction of type 1 diabetes in schoolchildren by multiple defined autoantibodies: eight year follow-up of the Washington State Diabetes Prediction Study. Diabetes Care 25:505-511
9. Kupila A, Muona P, Simell T et al (2001) Feasibility of genetic and immunological prediction of type I diabetes in a population-based birth cohort. Diabetologia 44:290-297
10. Ilonen J, Reijonen H, Herva E et al (1996) Rapid HLA-DQB1 genotyping for four alleles in the assessment of risk for IDDM in the Finnish population. Diabetes Care 19:795-800
11. Bottazzo GF, Florin-Christensen A, Doniach D (1974) Islet-cell antibodies in diabetes mellitus with autoimmune polyendocrine deficiencies. Lancet ii:1279-1282
12. Greenbaum CJ, Palmer JP, Nagataki S, et al (1992) Improved specificity of ICA assay in the fourth international immunology of diabetes serum exchange workshop. Diabetes41:1570-1574
13. Ronkainen M, Hämäläinen A-M, Koskela P, Åkerblom HK, Knip M, the Finnish TRIGR Study Group (2001) Pregnancy induces non-immunoglobulin insulin-binding activity in both maternal and cord blood serum. Clin Exp Immunology 124:131-136
14. Williams AJK, Bingley PJ, Bonifacio E, Palmer JP, Gale EAM (1997) A novel micro-assay for insulin autoantibodies. J Autoimmun 10:473-478
15. Savola K, Sabbah E, Kulmala P, Vähäsalo P, Ilonen J, Knip M (1998) Autoantibodies associated with type 1 diabetes mellitus persist after diagnosis in children. Diabetologia 41:1293-1297
16. Savola K, Bonifacio E, Sabbah E et al (1998) IA-2 antibodies – a sensitive marker of IDDM with clinical onset in childhood and adolescence. Diabetologia 41:424-429
17. Hämäläinen A-M, Ronkainen MS, Åkerblom HK, Knip M, the Finnish TRIGR Study Group (2000) Postnatal elimination of transplacentally aquired disease-associated antibodies in infants born to families with type 1 diabetes. J Clin Endocrinol Metab 85:4249-4253
18. Knip M (2002) Natural course of preclinical type 1 diabetes. Horm Res 57(suppl):6-11 19. Vaarala O (1999) Gut and induction of immune tolerance in type 1 diabetes. Diabetes
Metab Rev 15:353-361 20. North K, Emmett P, Noble S, the ALSPAC Study Team (2000) Types of drinks consumed by
infants at 4 and 8 months of age: sociodemographic variations. J Hum Nutr Dietet 13:71-82

14
21. Dubois L, Girard M (2003) Social inequalities in infant feeding during the first year of life. The Longitudinal Study of Child Development in Québec (LSCDQ 1998-2002). Public Health Nutr 6:773-783
22. Yngve A, Sjöström M (2001) Breastfeeding determinants and a suggested framework for action in Europe. Public Health Nutr 4:729-739
23. Pande H, Unwin C, Haheim LL (1997) Factors associated with the duration of breastfeeding: analysis of the primary and secondary responders to a self-completed questionnaire. Acta Paediatr 86:173-177
24. Stene LC, Barriga K, Norris JM et al (2004) Perinatal factors and development of islet autoimmunity in early childhood: the diabetes autoimmunity study in the young. Am J Epidemiol 160:3-10
25. Dahlquist G, Källén B (1992) Maternal-child blood group incompatibility and other perinatal events increase the risk for early-onset Type 1 (insulin-dependent) diabetes mellitus. Diabetologia 35:671-675
26. Blom L, Dahlquist G, Nyström L, Sandström L, Wall S (1989) The Swedish childhood diabetes study – social and perinatal determinants for diabetes in childhood. Diabetologia 32:7-13
27. McKinney PA, Parslow R, Gurney K, Law G, Bodansky HJ, Williams DRR (1997) Antenatal risk factors for childhood diabetes mellitus; a case-control study of medical record data in Yorkshire, UK. Diabetologia 40:933-939
28. Dahlquist GG, Patterson C, Soltesz G (1999) Perinatal risk factors for childhood type 1 diabetes in Europe. The EURODIAB Substudy 2 Study Group. Diabetes Care 22:1698-1702
29. Sipetic S, Vlajinac H, Kocev N, Saji S (2004) The Belgrade childhood diabetes study: prenatal and social associations for type 1 diabetes. Paediatr Perinat Epidemiol 18:33-39.
30. Virtanen SM, Hyppönen E, Läärä E et al (1998) Cow's milk consumption, disease associated autoantibodies and Type 1 diabetes mellitus: a follow-up study in siblings of diabetic children. Diabetic Med 15:730–738
31. Gibbon C, Smith T, Egger P, Betts P, Phillips D (1997) Early infection and subsequent insulin dependent diabetes. Arch Dis Child 77:384-385
32. The EURODIAB Substudy 2 Study Group (2000) Infections and vaccinations as risk factors for childhood Type I (insulin-dependent) diabetes mellitus: a multicentre case-control investigation. Diabetologia 43:47-53
33. Sipetic S, Vlajinac H, Kocev N, Badmanovic S (2003) The Belgrade childhood diabetes study: associations of infections and vaccinations on diabetes in childhood. Ann Epidemiol 13:645-651
34. McKinney PA, Okasha M, Parslow RC et al (2000) Early social mixing and childhood Type 1 diabetes mellitus: a case-control study in Yorkshire, UK. Diabetic Med 17:236-242
35. Hummel M, Fuchtenbusch M, Schenker M, Ziegler AG (2000) No major association of breast-feeding, vaccinations, and childhood viral diseases with early islet autoimmunity in the German BABYDIAB Study. Diabetes Care 23:969-974
36. Sherriff A, Golding J; Alspac Study Team (2002) Factors associated with different hygiene practices in the homes of 15 month old infants. Arch Dis Child 87:30-35
37. Åkerblom HK, Virtanen SM, Ilonen J et al (2005) Dietary manipulation of β-cellautoimmunity in infants at increased risk for type 1 diabetes. Diabetologia 48:829-837
38. Verge CF, Howard NJ, Irwig L, Simpson JM, Mackerras D, Silink M (1994) Environmental factors in childhood IDDM. Diabetes Care 17:1381-1389
39. Virtanen SM, Läärä E, Hyppönen E et al (2000) Cow's milk consumption, HLA-DQB1 genotype and IDDM: a nested case-control study of siblings of children with diabetes. Diabetes 49:912-917
40. Pundziutè-Lyckå A, Persson L-Å, Cedermark G, et al (2004) Diet, growth, and the risk for type 1 diabetes in childhood. Diabetes Care 27:2784-2789