differences in population density and energy use between birds and mammals
TRANSCRIPT
of Animai Differences in population density and energy use between Ecolo~v1997.
'J..
66, 327-340 birds and mammals: a macroecological perspective M A R I N A SILVA, JAMES H. BROWN* and J O H N A. D O W N I N G ? Department of Biology, University of Prince Edward Island, 550 University Avenue, Charlottetown, Prince Edward Island, Canada CIA 4P3
Summary
1. Data from 364 mammal and 564 bird species were used to compare these two taxa in the patterns of variation in population density and energy use as a function of body mass. 2. This study demonstrates previously unappreciated quantitative differences between mammals and birds. Over a wide range of sizes, population densities and rates of energy use are at least one order of magnitude higher in mammals than in birds of similar size. The highest population densities are found in species that weigh about 100 g in mammals and 30 g in birds. 3. Comparisons between mammals and birds from the same dietary category indicate that mammals maintain higher densities and use more energy than birds. Insectivorous mammals and birds maintain the lowest densities. 4. Flying mammals and birds reach lower densities and use more energy than non- flying forms. 5. These findings reveal relationships between the morphology, physiology and behav- iour of individual organisms and the ecological performance of these endothermic vertebrates in populations, communities and ecosystems: relationships that have not previously been appreciated.
Key-words: birds, density, energy, mammals, mass.
Jouvnal of Animal Ecology (1997) 66, 327-340
Introduction organisms differ in these population- and species-level attributes, or what the causes and implications of these
Allometric relationships having similar exponents but differences might be (Brown & Maurer 1989; Black- differing elevations in different taxa adequately burn & Gaston 1994). characterize various morphological, physiological and Mammals and birds are important components of even behavioural traits of individual organisms (e.g. most terrestrial ecosystems and have figured largely Peters 1983; Calder 1984; Schmidt-Nielsen 1983,1984; in empirical and macroecological studies (Damuth Bonner 1988). A number of aspects of relationships 198 1 b, 1987; Peters & Raelson 1984; Brown & Maurer between body size and various ecological attributes 1986, 1987; Maurer & Brown 1988; Lawton 1989, such as population density, population energy use, 1990; Nee et al. 1991; Silva & Downing 1995). They home range and geographical range are not yet clear are endothermic, and this is associated with high rates (e.g. Blueweiss et al. 1978; Damuth 1981a, 1987, 1993; of metabolism, foraging and activity. A wide variety Mace & Harvey 1983; McNab 1986; Brown & Maurer of allometric relationships have been described for 1987, 1989; Maurer & Brown 1988; Page1 & Harvey birds and mammals concerning metabolism (e.g. 1988; Lawton 1989; Blackburn, Harvey & Page1 1990; McNab 1980,1986; Nagy 1987), life history (e.g. Page1
Blackburn, Lawton & Pimm 1993b; Blackburn et al. & Harvey 1988; Millar & Hickling 1991), home range
1993a; Gaston 1990, 1991; Silva & Downing 1995). It (e.g. Harestad & Bunnell 1979; Damuth 1981a; Hol-
is also not yet clear to what extent different kinds of ling 1992), and population density (e.g. Damuth 1987; Brown & Maurer 1987; Silva & Downing 1995).
01997 British
*Present address: Department of Biology, University of New Mexico, Albuquerque, NM 87131, USA.
?Present address: Department of Animal Ecology, Iowa
Although there are qualitative similarities between mammal and bird allometry, so far the quantitative differences between them have frequently been
Ecological Society State University, 124 Science 11, Ames, IA 5001 1-3221, USA. ignored (cf. Greenwood et al. 1996). For example,

328 mountain lions and elk have similar densities (Craig- Density and energy head et al. 1973; Seidensticker et al. 1973; Hemker, use Lindzey & Ackerman 1984; Wickstrom et al. 1984;
Delgiudice, Singer & Seal 1991) to those of golden eagles and wild turkeys (Allen 1987; Kurzejeski, Van- gilder & Lewis 1987; Watson, Rae & Stillman 1992). In a recent study, Greenwood et al. (1996) found that British mammals maintain higher population sizes than those of birds of comparable size. These studies suggest therefore that mammalian populations may generally reach higher densities than those of birds of the same body size class.
The relationship between density (D) and body mass (M) has been the subject of an intense debate in recent years (Damuth 1981b, 1987,1991,1993; Brown & Maurer 1986, 1987; Lawton 1989, 1990; Blackburn et al. 1990, 1993a, b; Cotgreave & Harvey 1992, 1994; Cotgreave 1993; Currie 1993; Gaston et al. 1993; Cotgreave & Stockley 1994; Blackburn & Gaston 1994; Gregory & Blackburn 1995; Silva & Downing 1995). Most of the discussion about this relationship is focused on the difference between pooled data from different communities and community studies. Studies of pooled data from different communities suggest that the relationship between D and M is linear (Damuth 1981b, 1987, 1991; Peters & Raelson 1984; Robinson & Redford 1986) or non-linear (Silva & Downing 1995). With very few exceptions (Marquet, Navarrete & Castilla 1990; Nee et al. 1991; Cotgreave 1995), however, studies of communities show tri- angular or polygonal data clouds with no statistically significant correlation between D and M or a weak relationship with a slope closer to zero (Stork 1987; Brown & Maurer 1987; Lawton 1989, 1990; Stork & Blackburn 1993; Blackburn et al. 1993a; Cambefort 1994). Some studies have shown that the apparent triangular shape of some D:M relationships in avian and insect communities can result from sampling arti- facts or from the range of M included in the study (Blackburn et al. 1990; Currie 1993; Gaston et al. 1993; Silva & Downing 1995). Studies of pooled-data from different communities have also been criticized because they may underestimate the number of rare and small-bodied species (Lawton 1989, 1990). Other studies of the D:M relationship have been centred on the methods used for the estimation of the allometric exponent (e.g. Griffiths 1992) and on different mea- sures of abundance (e.g. Damuth 1991; Gregory & Blackburn 1995). More recent work has shown that the phylogenetic relatedness of the species included in the analyses may influence the relationship between abundance and body size (Nee et al. 1991; Harvey & Page1 1991; Cotgreave & Harvey 1992, 1994; Cotgreave 1994, 1995).
Although an interesting controversy, the above
01997 British debate has detracted attention from other important issues. For example, several studies have investigated ~ ~ ~societyl ~ ~ i ~ ~ l
Journal of Animal the relationship between abundance and body size Ecology, 66, 327-340 in mammals and birds (e.g. Damuth 1981b, 1987,
1991,1993; Juanes 1986; Brown & Maurer 1987; Carr- ascal & Telleria 1991; Blackburn et al. 1990, 1993a, b; Cotgreave & Harvey 1991,1992,1994; Nee et al. 1991; Currie & Fritz 1993; Blackburn & Gaston 1994; Cotgreave 1994, 1995; Silva & Downing 1995; Green- wood et al. 19961, suggesting several unexpected differences. First, there is a difference in the degree of correlation between density and mass. Previous stud- ies suggest that M is a very poor predictor of avian density (r2from 0.18 to 0,35), while studies of mam- mals suggest that M explains much more of the vari- ance (r2from 0.54 0.64). Secondly, with few exceptions (Nee et al. 1991; Cotgreave 1995), bird studies fail to show that D declines with increasing M (Peters & Wassenberg 1983; Juanes 1986; Brown & Maurer 1987; Carrascal & Telleria 1991), contrasting sharply with studies of mammals in which the value of the exponent is not significantly different from -0.75 (Damuth 1981b, 1987; Robinson & Redford 1986; Currie & Fritz 1993; but see Peters & Raelson 1984). Thirdly, mammalian and avian studies show different exponents for the lower limits to density. Previous avian studies have found that minimum density is independent (Brown & Maurer 1987) or only weakly related to M (Nee et al. 1991; Pagel, Harvey & God-fray 1991; Cotgreave & Harvey 1992) while in the majority of the studies of mammals minimum density clearly declines with increasing M (Peters & Raelson 1984; Damuth 1987; Currie & Fritz 1993; Silva & Downing 1994, 1995). Some avian studies (e.g. Brown & Maurer 1987) have been criticized, however, because they include many species that are represented by a single individual resulting from incomplete sam- pling (Blackburn et al. 1990; Currie 1993; Gregory & Blackburn 1995). Fourthly, birds and mammals reach maximum densities at different M. For mammals, some studies suggest that peak densities are at c. 100 g (Brown & Maurer 1989; Silva & Downing 1995) and at least one study suggests that maximum density is reached at c. 1 kg (Damuth 1993). Although some avian studies (Brown & Maurer 1987; Maurer & Brown 1988) show that maximum densities in North American birds are reached at c. 30 g, in most studies maximum densities are reached by the smallest birds (e.g. Juanes 1986; Cotgreave 1994, 1995). On the other hand, Blackburn et al. (1990) have pointed out that maximum densities may be sampling artefacts that result from more species in the size categories where maximum densities are found.
Other ecological factors such as habitat, biogeo- graphical area, phylogeny and reproduction could also influence mammalian or avian densities (Peters & Raelson 1984; Juanes 1986; Robinson & Redford 1986; Damuth 1987; Harvey & Page1 1991; Nee et al. 1991). In particular, diet has been shown to constitute an important factor influencing mammalian and avian densities (Juanes 1986; Robinson & Redford 1986; Damuth 1993; Silva & Downing 1995). Although the same food habits can be found in both mammals and

329 birds, some diets are more common in one taxon than M. Silua, the other. Previous studies suggest that herbivorous J.H. Brown & species maintain higher densities than carnivorous J.A. Downing ones, while insectivores and omnivores are inter-
mediate (Juanes 1986; Robinson & Redford 1986; Damuth 1987; Silva & Downing 1995). Robinson & Redford (1986) show that frugivorous and gran- ivorous mammals reach higher densities than those that eat insects or vertebrates. Large animals can cap- ture and consume both small and large prey, whereas smaller predators are limited to small prey (Rosen- zweig 1968; Ashmole 1968; Barclay & Brigham 1991). Insectivory seems more common in small mammals and birds, while carnivory is more frequent in larger species. Thus, if Robinson & Redford (1986) are correct, we might expect that insectivorous small- bodied species have lower densities than herbivorous species. Furthermore, if insectivorous species are much more common in Aves than in Mammalia, birds may be less abundant than mammals in general. In contrast, carnivorous large-bodied mammals and birds may maintain lower densities than herbivorous ones.
An important concept associated with D:M relationships is the rate at which energy is used by populations. This can be approximated by multiplying population density by individual metabolic energy use rates (Damuth 1981b, 1987; Brown & Maurer 1986, 1987; Silva & Downing 1995). Damuth (1981b) pro- posed that energy use (E) is independent of M, a conclusion now known as the energetic equivalence rule. With very few exceptions (Nee et al. 1991; Cotgreave 1995) most studies do not support the ener- getic equivalence rule (Brown & Maurer 1987; Maurer & Brown 1988; Blackburn et al. 1990; Cotgreave & Harvey 1992; Griffiths 1992; Damuth 1993; Silva & Downing 1995). Maurer & Brown (1988) suggest that, for North American birds, E increases with M until c.
30 g and decreases with M in the large-bodied species. Griffiths (1992), however, uses the reduced major axis regression method to show that small organisms use more energy than larger ones. Recently, Damuth (1993) has proposed that, in mammalian dietary cat- egories containing small-bodied species, larger species tend to use more energy, but in groups containing large-bodied species, small species use the most energy. Silva & Downing (1995) suggest, however, that mammalian energy use increases with M, regard- less of M. We might expect, therefore, differences in the use of energy not only between mammals and birds but also within each taxon.
Another factor that could differentiate terrestrial birds and mammals are structural and functional differences associated with different means of loco- motion. Among terrestrial mammals, only bats (Chi-
01997 British roptera) can fly, while among land birds very few
Ecological Society species are flightless (e.g. Ratites, Tinamides). McNab
Journal of Animal (1994) shows that flightlessness is usually associated Ecology, 66, 327-3 40 with a reduced pectoral muscle mass and a reduced
rate of metabolism. He also suggests that the evolution of flightlessness appears to be related to a restricted resource supply. Aerodynamic constraints associated with flight also limit the size and functional properties of the digestive systems in flying birds and mammals (Novick & Dale 1971; Pennycuick 1978; Rayner 1981; Norberg 1986; Norberg & Rayner 1987). W. W. H. Karasov (personal communication) found that birds have systematically shorter digestive systems than mammals of a given M. If shorter guts are less efficient in extracting energy and nutrients from foods of simi- lar quality, these morphological constraints might influence the 'levels of abundance reached by flying birds and non-flying mammals. If such morphological adaptations influence the overall patterns in density, flightless birds may have densities closer to those of non-flying mammals, while flying mammals may have densities closer to those of flying birds. Very few stud- ies have dealt with differences in the D:M relationship between flying and flightless birds. Juanes (1986) sug- gests that the relationship between D and M in birds is weaker because most birds live in three-dimensional habitats which allow them a greater variety of resources. If this is true, we might expect a significant difference between flying and flightless birds because the latter live in two-dimensional habitats. Cotgreave & Harvey (1992) examined the D:M relationship in birds and found a weak relationship when all birds were considered together, and no relationship at all when flightless birds were analysed alone. They con- cluded that patterns in the D:M relationship in flying and flightless birds are not significantly different. On the other hand, the analyses of Ebenman et al. (1995) suggest that, unlike flying birds, flightless birds have a strong negative D:M relationship. It is possible, however, that the failure to show a clear difference between flying and flightless birds in Cotgreave & Harvey's (1992) study is attributable to their paucity of data on completely flightless birds (P. Cotgreave, personal communication). Although these studies have examined the qualitative differences in the D:M relationship between flying and flightless birds, quan- titative differences between these groups of birds have not been adequately examined.
This paper explores the quantitative and qualitative differences in the patterns of variation in density and energy use between mammals and birds. In particular, we focus on the influence of diet and locomotion on the patterns observed in both density and energy use between and within these two taxa.
Methods
DATA
We conducted an extensive literature search and com- piled a large number of measurements of the eco- logical population density (sensu Damuth 1987) of
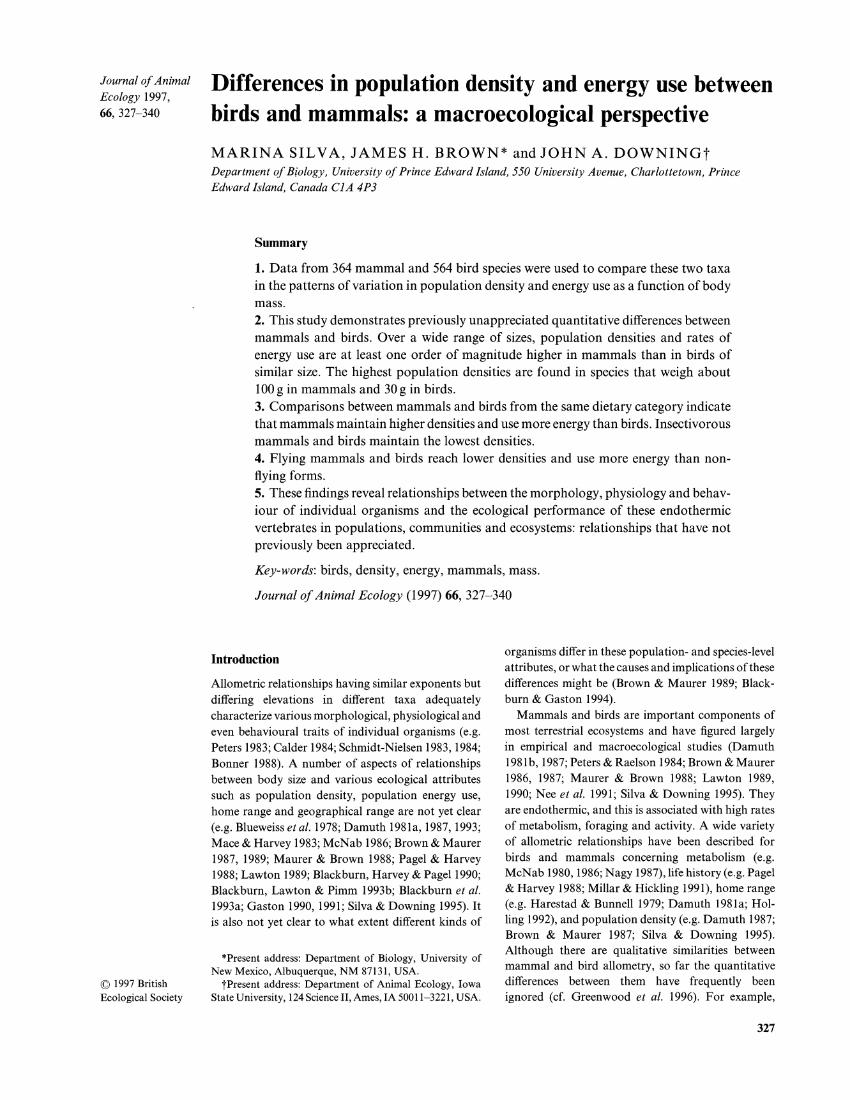
330 birds and mammals (Fig. la , b). The data on mammal Density and energy population densities include the 987 populations ana-use lysed by Silva & Downing (1995) as well as densities
of 12 populations of flying mammals (Gaisler 1975, 1979; Turner 1975; Bradbury & Vehrencamp 1977; Nowak 1991). Data on population density and body mass of 999 bird populations were obtained by can-vassing the ornithological literature. When body masses were not available in bird population studies, we collected body mass values for the same species taken from other sources (Dunning 1984, 1992; Ter-borgh et al. 1990). The data and sources are available on request from M. Silva.
A N A L Y S I S
Population-specific body masses were unavailable for a large number of the avian populations analysed here. Therefore, in order to use the same type of measurements for both birds and mammals, we cal-culated the mean population density and the mean body mass for each species by averaging the popu-lation values. Information on food habits was obtained from the same source as densities or from other sources (Campbell & Lack 1985; Robinson &
. - Mammals 0 m
0 Volant Non-volant
-.t O @O
Birds q0 -3 1 I I I I I I I
0 1 2 3 4 5 6 7 01997 British Log,, body mass (g) Ecological Society Journal of Animal Fig. 1. Relationhsip between the logarithm of population Ecology, 66, 327-340 density and body mass in mammal and bird species.
Redford 1986;Damuth 1987;Nowak 1991; Hancock, Kushlan & Kahl 1992). Diet categories used for birds were: nectarivores, granivores, folivores, herbivores, insectivores, omnivores and carnivores. Mammals were classified as: frugivores, granivores, folivores, herbivores (grazers or browsers), insectivores, omni-vores and carnivores. Although our sample sizes are large, a bias might be possible when two or more allometric equations are multiplied together (Welsh, Towsend & Altmann 1988; Medel, Bozinovic & Novoa 1995). To minimize the error associated with this problem, we calculated population energy use using the population density and the field metabolic rate calculated for each species following Nagy's (1987) specific equations for passerine and non-pass-erine birds and eutherian and marsupial mammals. Density, body mass and energy use were transformed to their logarithms before statistical analyses to remove heteroscedasticity.
We addressed comparisons of mammals and birds on two levels. First, on a species basis, linear regression was used to analyse the relationship between body mass and both population density and energy use. Distribution of the residuals for each taxo-nomic group was tested using the method of Shapiro and Wilk (Gujarati 1978). Because Brown & Maurer (1987; visual inspection) and Silva & Downing (1995; LOWESS sequential smoothing method) have inde-pendently suggested that D:M relationships behave differently across the range of body mass, separate regression analyses were performed for birds weighing more and less than 30 g, while the ranges of body mass of 0-0.1 kg, 0.1-100 kg and 100-3000 kg were used for mammals. Secondly, average values of population density and energy use were calculated among species within each logarithmic body size class. These among-species averages summarize average trends in popu-lation density and energy use.
We used Stearns's phylogenetic subtraction method (Stearns 1983; Harvey & Page1 1991) to examine the influence of phylogeny on the relationship between density and body mass in both mammals and birds. Analysis of variance (ANOVA)and Tukey's multiple comparison test were used to seek quantitative differ-ences among ranges of body mass, dietary groups and means of locomotion. In order to distinguish between the influence of trophic level and locomotion, we con-trasted mammals of similar body mass from the order of Chiroptera with those from the orders of Rodentia and Insectivora. We used regressions employing dummy variables and interaction terms to determine the significance of differences among relationships (sensu Peters & Raelson 1984).If a dummy variable is significant (P < 0.05) then the difference in the inter-cepts between two groups is significant. If an inter-action term is significant (P < 0.05)then the difference in the slopes between two groups is significant. This analysis is equivalent to ANCOVA for differences in elevation between groups, but it also allows to test for
331 M. Silva, J.H.Brown & J.A. Downing
01997 British Ecological Society Journal of Animal Ecology, 66, 327-340
the significance of differences in the slopes (Gujarati 1978).
Results
Mammalian density seems more well related to phy- logeny than to body mass, while avian density seems more well related to phylogeny than to body mass. For mammals, Stearns's phylogenetic subtraction method accounts for c. 54% of the variation in D, but the residuals of this ANOVA are still significantly correlated with M (r2 = 0.04; P = 0.0002). On the other hand, regression on M accounts for c. 55% of the variation in mammalian D, while Stearns's phylogenetic sub- traction of the residuals of this analysis shows that phylogeny accounts for no significant residual vari- ance (P = 0.0817), beyond that accounted for M. In birds, however, Stearns's phylogenetic subtraction method accounts for c. 30% of the variation in avian D, but the residuals of this ANOVA are still significantly correlated with M (r2 = 0.02; P = 0.0002). On the other hand, regression on M alone accounts for c. 25% of the variation in avian D (P = 0.0001), and Stearns's phylogenetic subtraction of the residuals of this analysis shows that phylogeny accounts for 13% of the residual variance (P = 0.0278). By Occam's Razor, therefore, we might conclude that variations in M result in variations in mammalian D, while vari- ations in avian density would result from phylogenetic differences. In both mammals and birds, however, it is difficult to decide whether the variations in D are due to different body sizes of different taxa of animals or to phylogenetic differences among animals that have evolved different body sizes, because phylogeny and size are strongly correlated.
In the other analyses performed in this study, we did not examine the influence of phylogeny partly because this factor is strongly correlated with body mass, and partly because we want our analyses to be comparable with previous studies (e.g. Juanes 1986; Damuth 1987, 1993; Brown & Maurer 1987; Green- wood et al. 1996) which have generally ignored the influence of phylogeny on both D and E.
Bird and mammal species showed qualitatively similar but quantitatively different patterns of density and energy use. Population density varies over about three orders of magnitude in both mammalian and avian species (Fig. 1). Mammalian density is related to body mass as M-0.69, while avian density is related to body mass as M-0.60 (Table 1). Body mass explains c. 55% of the variance in mammalian density but only 25% of the variance in avian density (Table 1). This difference must be interpreted with caution, however, because the range of M is about two orders of mag- nitude larger for mammals than for birds (Fig. 1). When the regression analysis is performed on species of mammals covering the same range of M as birds, M explains only 32% of the variation in D. The regression analysis employing a dummy variable and
an interaction term shows that D:M relationships in mammals and birds are significantly different in the intercepts (P < 0.05) but not in the slopes. The most abundant species of land mammals reach densities more than one order of magnitude higher than those of the most abundant terrestrial birds of similar M. In both mammals and birds, the residuals follow a normal distribution (Shapiro-Wilk, P < 0.05) and most of them fall within one order of magnitude of regression lines. This suggests that in this study, the D:M relationship for both mammals and birds shows a strong central tendency and is not simply distributed randomly within a limit polygon as some have found in other studies. Further, analyses of the residuals indicate that they do not differ significantly from zero (P > 0.05). Figure 1 shows a striking absence of data points in the lower left-hand quadrant, suggesting that minimum population density decreases with increas- ing M in both mammals and birds. This pattern is, however, less obvious in birds than in mammals because, apart from the largest volant birds, the mini- mum population density seems independent of M. The 11 species showing very low densities are all from the order of Falconiformes and are carnivorous. When these 11 species of largest birds are removed from the data, however, the negative slope of the D:M relationship remains statistically significant (slope = -0.445;r2 = 0.15; P < 0.0001), but differs significantly from that of mammals (P < 0.05).
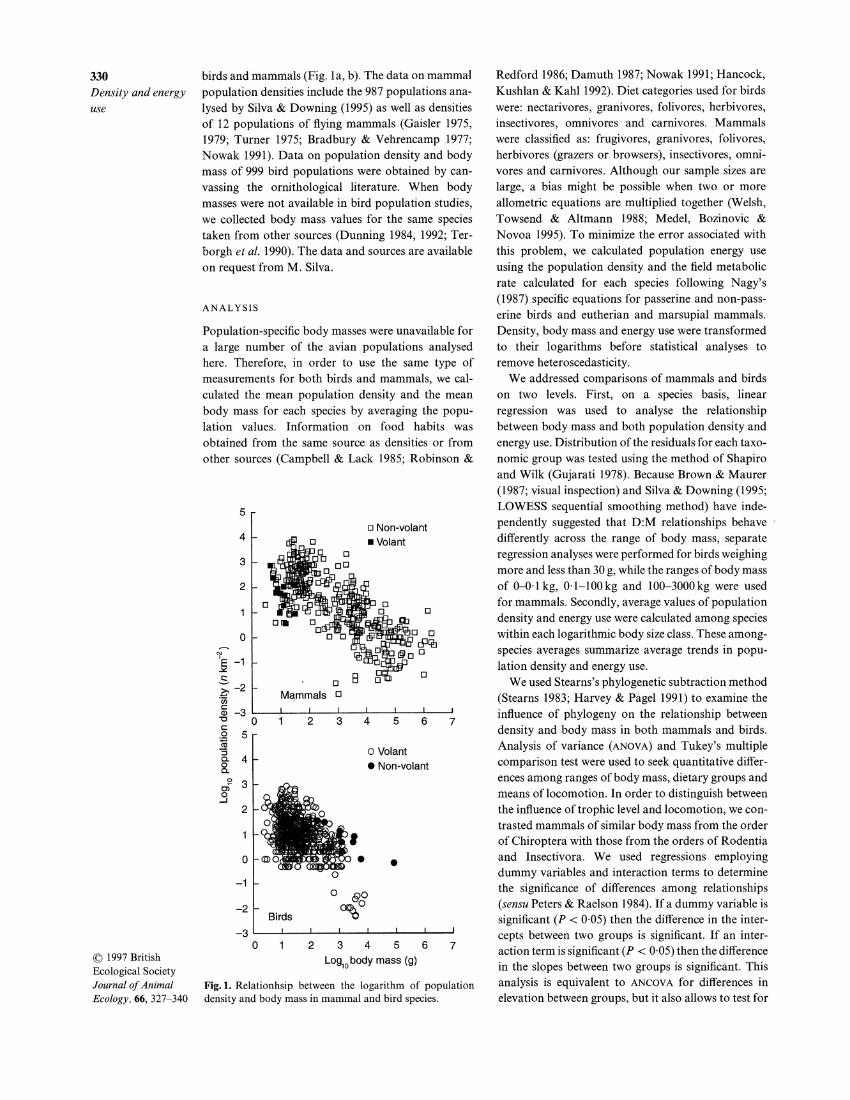
Mammals and birds reach maximal population den- sities at intermediate but differing body sizes. For mammals, the maximum average value is c. 1000 indi- viduals km-', occurring at c. lOOg (Fig. 2). In birds, however, the maximum average density is c . 75 indi- viduals km-' and is reached at c. 30 g (Fig. 2). Because of the non-linear nature of these data, a single linear regression does not fit them very well (see also Silva & Downing 1995). Instead, we have characterized them using three linear regressions for mammals and two linear regressions for birds (Table I). There is a great deal of overlap in the density values for birds (< 30 g) and mammals (< 100 g) in the smallest size classes. A regression analysis employing a dummy variable and an interaction term indicates that small-bodied mam- mals and birds differ significantly only in the slopes of the D:M relationship (P < 0.05). A similar analysis shows that medium and large-bodied mammals differ significantly in both the intercepts and the slopes of the D:M relationship (P < 0.05). Even though medium- bodied mammals and large birds cover the same range of body mass (Fig. I), they differ significantly in the intercepts of the D:M relationship (P < 0.05). In these size classes, the lower densities of medium-bodied mammals still overlap the highest values for large- bodied birds, but the most abundant mammals are about 10 times more abundant than the most abun- dant birds of comparable M (Fig. 1).
Diet significantly influences the D:M relationship in both mammals and birds (Table 2). Mammalian

332 Table 1. Results of regression analyses of population density as functions of body masses of birds and mammals
Density and energy Slope Intercept P r2 n use
Mammals All mammals -0.688 (0.033) 3.316 (0.108) 0.0001 0.545 364 M < 0.1 kg 0.434 (0.187) 1.701 (0.283) 0.0221 0.039 133 0.1 < M < 100kg -0.899 (0.082) 3.985 (0.297) 0~0001 0.378 199 m 2 100kg 0.049 (0.272) -0,451 (1.493) 0.8580 0.001 32
Birds All birds -0.604 (0.044) 1.955 (0.078) 0.0001 0.252 564 M < 0.03 g -0.296 (0.179) 1.569 (0.207) 0.0998 0.010 287 M > 0.03 g -0.784 (0.070) 2.383 (0,157) 0.0001 0.312 277
The slope and the intercept are the coefficients of the relationships between the logarithm of population density (log,, D) and the logarithm of the body mass (log,, M) determined using least squares regression. Standard errors of the slope and the intercept are in parentheses. P is the probability that the correlation would have been found by chance alone, r2is the coefficient of determination, and n is the number of observations.
Table2. Results of regression analyses of avian and mam- Mammals malian densities as functions of body mass for organisms
with differing diets
Diet Slope Intercept P r2 n
Mammals Folivores -0.64 Frugivores -0.78 Granivores -0.83 Herbivores -0.66 Insectivores -0.69 Omnivores -0.78 Carnivores -1.02
Birds Nectarivores 0.08 Frugivores -0.22
Log,, average body mass (g) Granivores -0.54
Fig.2. Relationship between population density and body Insectivores -0.64
mass expressed as species averages within logarithmic body Omnivores -0.48
size classes. Body mass classes are one-half logarithm wide. Carnivores -1.31
The slope and the intercept are the coefficients of the relationships between the logarithm of population density
and avian carnivorous species have the lowest densit- (log,, D) and the logarithm of the body mass (log,, M) ies. Figure 3 shows the quantitative differences in D determined using least squares regression. Pis the probability between mammals and birds from the same diet cate- that the correlation would have been found by chance alone,
gory. Mammals reach D about one order of mag- r2is the coefficient of determination, and n is the number of
nitude higher than birds belonging to the same dietary observations.
category. We had sufficient data to perform analyses of covariance for five of the six dietary categories shared by mammals and birds (granivores, frugivores, density and body mass in volant mammals, although insectivores, omnivores and carnivores). With the even this small sample size indicates that density exceptions of frugivores and carnivores, mammals decreases with increased body mass (slope = -0.927; and birds from the same dietary category are only P = 0.1481; n = 14). Excluding volant mammals, the significantly different in the intercepts (P < 0.05). slope of the relationship between density and body Differences between frugivorous birds and mammals mass is -0.723 (P < 0.0001). Mammals from the are significant in the slopes and in the intercepts orders of Insectivora and Rodentia cover a similar (P < 0.05). The regression analyses employing range of M as those from the order of Chiroptera. dummy variables and interaction terms indicate no The regression analyses employing dummy variables
01997 British significant difference either in the intercepts or the and interaction terms indicate no statistically sig-
Ecological Society slopes between mammalian and avian carnivores. nificant difference between the slopes of the D:M
Journal of Animal The regression analyses indicate a low statistical relationships determined for these three groups. Fur- Ecology, 66, 327-340 significance of the slope of the relationship between ther analysis, with the slope constrained to a common

333 M. Silva, J.H.Brown & J .A. Downing
Mammals Birds
C - 3 -0.-3 - so@ no
E 2 - 2 - OqO% 0 0 U 0
c 1 - 1 - O 0 q q 0 0
0.-C m O -s
0 -n 8 -1 - q -1 -
m' -2 - Granivoreso -2 - Herbivores q
0 0 q-2 1Insectivores -2 ~mnivores
-3 1-3 1 0 1 2 3 4 5 6 7 0 1 2 3 4 5 6 7
Loglo body mass (g)
Fig. 3. Relationship between the logarithm of population density and body mass for all dietary categories shared by mammals and birds.
value (slope = -0.444; P < 0,0001; n = 158) shows bats to be about seven times less abundant than rod-ents of comparable M (P < 0.05), but not significantly less abundant than species from the order of Insect-ivora. The sample size for the non-flying birds was low (n = 1I), but flightless birds tend to have densities near to those of terrestrial mammals (Fig. 1). For example, the ostrich Struthio camelus has a relatively high density (0.7 individuals kmm2).Higher densities have been also found for other flightless species such as Meleagris gallopavo (1 individual km-'), Psophia crepitans (37.2 individuals km-2), and Crux alector (8.32 individuals km-'). Although these densities are substantially higher, no statistically significant differ-ence was found between the intercepts of the D:M relationship determined for flightless (intercept = 2.698; SE = 0.523; n = 11) and flying birds (inter-
01997 British cept = 2.033; SE = 0.081; n = 553). The same analy-
Ecological Society sis also indicates that the slope of the relationship
Journal of Animal between D and M found for flightless birds (slope =
Ecology, 66, 327-340 -0.610; P = 0.004) does not differ significantly from
that of flying ones (slope = -0.661; P < 0.0001). Fur-ther analysis, with the slope constrained to the value found when all birds are pooled together (n = 564; slope = -0,604; Table 1) shows that flightless birds maintain levels of abundance about five times larger than flying forms of similar M (P < 0.05).
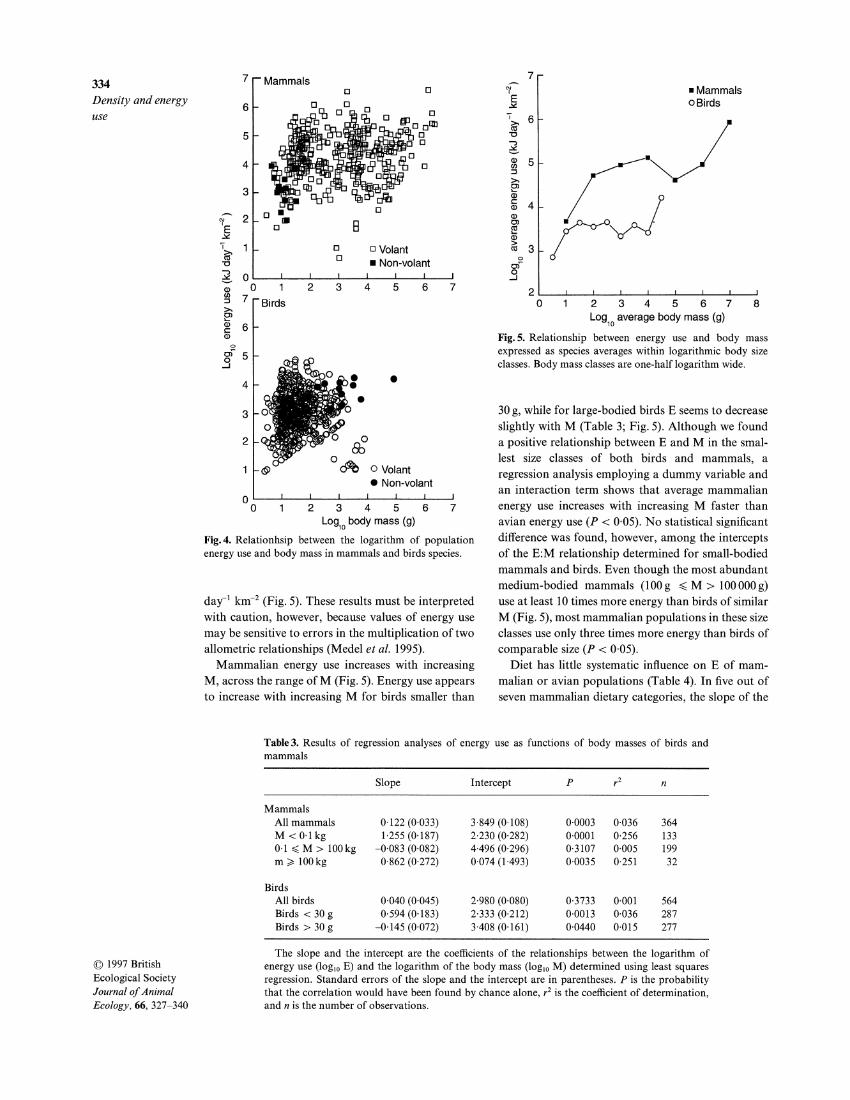
On average, avian species use less energy than mam-malian ones (Fig.4). However, rates of E vary greatly within, as well as between, these two major taxonomic groups. Within most size categories, E varies among species by about five orders of magnitude if birds and mammals are considered together, and by at least three orders of magnitude when considered separately (Fig. 4). There are highly significant differences in the intercepts of the E:M relationships among mammals and birds (Table 3). In general, the most abundant mammalian species use about 10-times more energy than the most abundant populations of birds, of simi-lar M. The most abundant mammalian species use levels of energy about lo5kJ day-' km-2 while for the most abundant avian species E reaches only lo4 kJ
7 Mammalsr n Density and energy use
om
01997 British Ecological Society Journal of Animal Ecology, 66, 327-340
Mammals 0Birds
Volant w Non-volant
2 I I I I I I I I I
0 1 2 3 4 5 6 7 8 Loglo average body mass (g)
Fig.5. Relationship between energy use and body mass expressed as species averages within logarithmic body size classes. Body mass classes are one-half logarithm wide.
Non-volant
0 I I I I I I I
0 1 2 3 4 5 6 7 Log,obody mass (g)
Fig.4. Relationhsip between the logarithm of population energy use and body mass in mammals and birds species.
day-' km-2 (Fig. 5). These results must be interpreted with caution, however, because values of energy use may be sensitive to errors in the multiplication of two allometric relationships (Medel et al. 1995).
Mammalian energy use increases with increasing M, across the range of M (Fig. 5). Energy use appears to increase with increasing M for birds smaller than
30 g, while for large-bodied birds E seems to decrease slightly with M (Table 3; Fig. 5). Although we found a positive relationship between E and M in the smal-lest size classes of both birds and mammals, a regression analysis employing a dummy variable and an interaction term shows that average mammalian energy use increases with increasing M faster than avian energy use ( P < 0.05). No statistical significant difference was found, however, among the intercepts of the E:M relationship determined for small-bodied mammals and birds. Even though the most abundant medium-bodied mammals (100 g < M > 100000 g) use at least 10 times more energy than birds of similar M (Fig. 5), most mammalian populations in these size classes use only three times more energy than birds of comparable size ( P < 0.05).
Diet has little systematic influence on E of mam-malian or avian populations (Table 4). In five out of seven mammalian dietary categories, the slope of the
Table3. Results of regression analyses of energy use as functions of body masses of birds and mammals
Slope Intercept P r2 n
Mammals All mammals 0.122 (0.033) 3.849 (0,108) 0~0003 0,036 364 M < 0.1kg 1,255(0,187) 2,230 (0,282) 0.0001 0.256 133 0.1 < M > 100kg -0,083 (0.082) 4.496 (0.296) 0.3107 0.005 199 m 3 100kg 0.862 (0.272) 0.074 (1.493) 0,0035 0.251 32
Birds All birds 0.040 (0.045) 2,980 (0.080) 0.3733 0,001 564 Birds < 30 g 0.594 (0.183) 2.333 (0.212) 0,0013 0.036 287 Birds > 30 g -0.145 (0.072) 3,408 (0,161) 0.0440 0.015 277
The slope and the intercept are the coefficients of the relationships between the logarithm of energy use (logloE) and the logarithm of the body mass (log,, M) determined using least squares regression. Standard errors of the slope and the intercept are in parentheses. P is the probability that the correlation would have been found by chance alone, r2 is the coefficient of determination, and n is the number of observations.

335 Table4. Results of regression analyses of avian and mammalian energy use as functions of body mass for organisms with M. Silua, differing diets J.H.Brown &
Mean MaxJ.A. Downing Diet Slope Intercept P v2 n log M log M
Mammals Folivores 0.18 4.06 0,5441 0.02 26 3.51 4.94 Frugivores 0.03 4.36 0.8069 0.01 48 3.20 4.63 Granivores -0.02 4.22 0.9434 <0.01 35 1.68 4.30 Herbivores 0.15 3.83 0.0376 0.04 98 4.16 6.36 Insectivores 0.13 3.35 0.2974 0.05 26 1.75 4.83 Omnivores 0.02 4.03 0.7794 <0.01 106 2.12 4.88 Carnivores -0.22 4.26 0.0826 0.13 25 3.67 5.18
s
Birds Nectarivores 0.77 1.88 0,0359 0.16 27 0.83 2.09 Frugivores -0.38 2.22 0,0929 0.10 30 1.58 2.87 Granivores 0.05 3.34 0.62 1 1 <0.01 80 1.98 3.53 Insectivores -0.06 3.08 0,4908 <0,01 277 1.40 2.85 Omnivores 0.18 2.96 0.1422 0.02 105 1.82 3.76 Carnivores -0.64 4.19 0~0001 0.38 43 2.56 3.88
The slope and the intercept are the coefficients of the relationships between the logarithm of energy use (log,, E) and the logarithm of the body mass (log,, M) determined using least squares regression. P i s the probability that the correlation would have been found by chance alone, v2is the coefficient of determination, and n is the number of observations.
E:M relationship is positive, while for birds three out in the analysis (Currie 1993). Data on terrestrial mam- of six dietary categories show positive slopes. Car- mals compiled by Silva & Downing (1995) tend to nivory seems to be the only diet that significantly support Currie's findings, while data on land birds influences E in both mammals and birds. However, compiled by Cotgreave & Harvey (1992) suggest the Fig.6 suggests that for the same dietary category contrary. In this study, the range of M for mammalian mammals tend to use more energy than birds. Con- species covers seven orders of magnitude while that of cerning the difference between volant and non-volant birds covers only four orders of magnitude. Therefore mammals, ANOVA indicates that rodent populations our analyses support Currie's findings and suggest use larger quantities of energy than bats of com- that the apparent difference in the strength of the D:M parable M (P < 0.05), but E of bats and species from correlation in birds and mammals is mainly due to the order of Insectivora do not differ significantly differences in the total range of variation and not due (P > 0.05). Flightless species have rates of E (e.g. to the magnitude of residual variation at any given M. 16218 kJ day-' km-2 for Struthio camelus) that are Our findings indicate that mammalian minimum closer to the values found for mammal populations of population density tends to vary inversely with M, similar M (Fig. 4). supporting several previous studies (e.g. Pimm 1991;
Redford & Robinson 1991; Silva & Downing 1994;
Discussion but see Gaston & Blackburn 1995). In birds, the pat- tern is somewhat less clear, however, because the nega-
Although it is difficult to decide whether the variations tive relationship at the lower limit is weak when the in the level of density and energy use within both largest 11 species of birds are not considered. The low mammals and birds are due to different body sizes of densities maintained by these 11 species may reflect different taxa of animals or to phylogenetic differences the confounding influence of taxonomy with trophic among animals, it is unlikely that these two taxa show level, however, because they are all carnivorous Fal- qualitatively similar but quantitatively different pat- coniformes. There is some recent evidence that sup- terns of D:M and E:M relationships. Our study shows ports a negative scaling of the lower bound of bird that mammals and birds of comparable M maintain density. For Australian birds, Cotgreave (1995) shows systematically different levels of density, and use that minimum density clearly decreases with increas- different amounts of energy. ing M (see fig. 1 in Cotgreave 1995). The absence of a
Body mass explains twice as much variance in den- negative scaling on the lower limit in Brown & Mau-sity in mammals than in birds. There is at least one rer's (1987) analysis of the Breeding Bird Survey data
01997 British reason why M would explain more of the variance in may be attributable to inaccurate censusing of rare
Ecological Society Jouvnal of Animal
density in mammals than in birds. Theoretical evi- dence suggest that the level of prediction of the D:M
species (Lawton 1989, 1990; Damuth 1991; Blackburn et al. 1993a; Cotgreave 1993; Currie 1993; Gaston et
Ecology, 66, 327-340 relationship might depend on the range of M included al. 1993; Blackburn & Lawton 1994).

rcarnivores 7 r Frugivores336 Density and energy use q
5 - 5 -
q4 - en
3 - ,, 2 - ee
@A1 - 1 - Mammals @Birds
r~ ran ivo res r Herbivores- q
0- 0-0 1 2 3 4 5 6 7 0 1 2 3 4 5 6 7
Loglobody mass (g)
Fig. 6. Relationship between the logarithm of energy use and body mass for all dietary categories shared by mammals and birds.
Although much research has focused on minimum viable population size, the density of local populations must be a major consideration in the conservation of biodiversity (Redford & Robinson 1991; Silva & Downing 1994). In fact, the concepts of minimum viable population size and minimum viable popu-lation density are inextricably linked because popu-lations need a minimal area of habitat to survive (Soul6 & Simberloff 1986;Redford & Robinson 1991). Thomas (1990) suggests that provisional conservation recommendations can be made by estimating minimal population densities until such time as minimum viable population sizes could be determined. For example, our findings suggest a difference in species dynamics: that flying endotherms have lower minimal densities for comparable body sizes than non-flying
01997 British forms. An explanation of this could be that birds and
~ ~ ~ l ~ ~ i ~ ~ isociety bats might use their mobility to track variation in Journal of Animal the suitability of environments over space and time, Ecology, 66, 327-340 whereas non-flying mammals or flightless birds are
trapped within smaller patches of changing habitat. Thus, the well known long-distance seasonal migrations of some birds and bats might be extreme examples of the more general capacities of these taxa to use their mobility to respond in adaptation to large-scale and long-term environmental variations. Car-nivorous species also maintain very low densities com-pared with other dietary groups. This may arise because carnivores have larger home ranges and fre-quently live in socially organized groups or families. It is also possible that the low densities found for carnivorous species reflect precisely the fact that most species from the order of Carnivora (32%) are endangered (Ceballos & Brown 1995).
This study supports some previous works (Brown & Maurer 1987; Silva & Downing 1995) showing that the upper limit of D declines in very small mammals and birds. Birds and mammals in the very smallest size classes overlap to a much greater extent in both D and E than those in larger size categories (Figs 1
337 M. Silua, J.H.Brown & J .A . Dotvning
01997 British Ecological Society Journal of Animal Ecology, 66, 327-340
and 4). There are several possible explanations for this. First, the decrease in maximum density below some threshold size may be a consequence of the con- straints of energetics on the use of space by individuals (Brown & Maurer 1989). Brown & Maurer (1989) point out that since individual energy requirements (i.e. metabolic rates) scale as ccM0 7 5 , but territory or home range size scales as EM' ",the amount of energy that must be harvested per unit area of territory to satisfy respiratory requirements actually increases with decreasing M (as EM-" 2 5 ) . This implies that below some threshold M, it is necessary for smaller organisms to use larger areas of space in order to obtain a sufficient amount of high-quality food. Sec- ondly, the body size at which density declines might be smaller in birds than in mammals, because birds can use flight to exploit much larger home ranges than non-flying mammals. Since flight is much less costly than terrestrial locomotion per unit distance travelled (Schmidt-Nielsen 1984), very small birds can exploit sparsely distributed resources with greater net ener- getic profit than non-flying endothermic vertebrates. Thus, the smallest birds maintain D and E that are closer to those of mammals of the same M, than larger birds can. On the other hand, Blackburn et al. (1990) suggest that maximum densities are artefactual because maximum density is found within the body mass category that contains the most species. We agree with other authors (Brown & Maurer 1987; Marquet 1993; Marquet, Navarrete & Castilla 1995) that maximum densities reflected in the upper bound of the D:M relationship must have a biological expla- nation. Brown, Marquet & Taper (1993) suggested that the maximum density shown by the upper bound of the D:M relationship may reflect an underlying physiological constraint associated with animal size. Medium-sized species may be more abundant because they are favoured by the effect of M on both energy acquisition and energy conversion.
Although patterns in the D:M and the E:M relation- ships between volant and non-volant species tend to be qualitatively similar, our study suggests that these relationships differ quantitatively. On one hand, flightless birds reach densities that are higher than flying forms, but closer to those of non-flying mammals. The results confirm the recent findings of Ebenman et al. (1995) that the ability to fly influences the relationship between density and body mass. On the other hand, flying mammals (Chiroptera) main- tain higher densities than non-flying forms (Rod- entia). Similar findings have been recently found using population sizes (Greenwood et al. 1996). Our findings show, however, that insectivores also maintain lower densities than rodents of comparable M, suggesting a parallel between the effects of trophic level and means of locomotion because most bats are also insec-tivorous species. It is possible, therefore, that the lower levels of abundance observed in bats may be attribu- table to the confounding influence of trophic level and
means of locomotion. Thus, it would appear that both trophic level and locomotion habits must be con-sidered when examining levels of abundance for com- paring mammals and birds. Failure to observe this pattern in Greenwood et al.'s (1996) analysis may be attributed to the limited diversity of mammalian species in Great Britain.
Our findings do not support Damuth's (1981b) energetic equivalence rule. Exceptions to this global pattern are the smallest size categories, where E increases with increasing size up to about 30 g in birds and up to about 100 gin mammals (Fig. 3). The largest mammals (M > 100 kg) are a further exception in that E seems to increase faster with increasing M (Table 3; Fig. 3). Recently, Damuth (1993) has proposed that, within dietary categories containing small species, larger species control more energy, but within those that contain the largest mammals, small species tend to control more energy. Our study does not confirm Damuth's proposal for either mammals or birds. Although most of these relationships are not stat- istically significant (Table 4), our findings show that within most dietary categories, large-bodied mammals and birds use more energy than smaller ones, just as large-bodied species tend to dominate the use of energy in many communities (Silva & Downing 1995). In some situations, however, large-bodied animals appear to do less well at obtaining and using resources. For example, large-bodied species tend to use less energy when diet categories contain few small-bodied species and many large-bodied ones, such as in both carnivorous mammals and birds.
The quantitative differences between mammals and birds in population density and energy use have important implications for the interactions between these two taxa in communities, and for their roles as consumers and agents of energy and nutrient transfer in ecosystems. Among the few previous studies that have compared densities and energy use in birds and mammals, Pulliam & Brand (1975) and Wiens & Dyer (1977) noted that granivorous birds accounted for a minor fraction of the energy transfer in grassland ecosystems, whereas small granivorous mammals were quantitatively much more important. Our study corroborates and generalizes this result because gran- ivorous mammals use 10 times more energy than gran- ivorous birds. Furthermore, our findings suggest that this difference between mammals and birds might also exist in other dietary groups.
Quantitative differences in D and E among birds and mammals also have important implications for biogeography and macroevolution. Although mam- mals have much higher population densities on aver- age than birds, there are nearly twice as many species of land birds as non-volant mammals (c. 530 vs. 280 species in Canada and the continental United States). Similarly, given that bats, like flying birds, have much lower population densities and span a much narrower range of body sizes than non-volant mammals, their
338 species richness is high (c. 977 species in the world). Density and energy These findings may result partly from differences in use the mobility and the capacity to use three-dimensional
habitats by volant mammals and birds. Since the sizes of geographical ranges are comparable in birds, bats and terrestrial mammals (Anderson 1977, 1984; Brown & Maurer 1989), local communities tend to contain many species of relatively uncommon birds and a much smaller number of species of much more common non-volant mammals. Analyses of avian communities may reveal a greater number of bird populations with very low densities because birds maintain their populations at very low densities com- pared with those of mammals. It is possible that the supply of immigrants suggested by the rescue effect hypothesis (Brown & Kodric-Brown 1977) may help avian populations, particularly volant ones, to persist with low densities. This may also explain why some studies of bird communities (Juanes 1986; Brown & Maurer 1987; Nee et al. 1991) appear to show tri- angular abundance:mass relationships. Further, because birds can exist at lower densities, under simi- lar pressures they may be able to maintain greater species richness than mammals.
Our findings clearly indicate important quantitative differences in the level of density and energy use between mammals and birds. The consistent differ- ences between these two important vertebrate groups should provide pertinent clues concerning the factors constraining and defining their population abun-dance, in particular the roles of trophic level and loco- motion. This is one of the few published discussions of these differences in the literature, despite several studies on the density:mass relationship. Finally, despite an extensive literature on the morphological and physiological adaptations for flight and terrestrial locomotion in both mammals and birds, some of the most important consequences of these attributes must now be explored.
Acknowledgements
We are grateful to Steve Albon, Tim Blackburn and Peter Cotgreave for their comments and suggestions on the manuscript. This research was supported by an operating grant to J. A. Downing from the Natural Science and Engineering Research Council of Canada (NSERC), an operating grant to J. H. Brown from the National Science Foundation (Grant BSR-8807792), and by a team grant from the Ministry of Education of the Province of Qukbec.
References
01997 British Allen, G.T. (1987) Estimating prairie falcon and golden eagle Ecological Society nesting populations in North Dakota. Journal of Wildlife Journal of Animal Management, 51,739-744. Ecology, 66, 327-340 Anderson, S. (1977) Geographic ranges of North American
terrestrial mammals. American Museum Novitates, No. 2629, pp. 1-15.
Anderson, S. (1984) Geographic ranges of North American birds. American Museum Novitates, 2785, 1-17.
Ashmole, N.P. (1968) Body size, prey size, and ecological segregation in five sympatric tropical terns (Aves: Lari- dae). Systematic Zoology, 17, 292-304.
Barclay, R.M.R. & Brigham, R.M. (1991) Prey detection, dietary niche breadth, and body size in bats: why are aerial insectivorous bats so small? American Naturalist, 137,693-703.
Blackburn, T.M. & Gaston, K.J. (1994) Animal body size distributions: patterns, mechanisms and implications. Trends in Ecology and Evolution, 9,471474.
Blackburn, T.M. & Lawton, J.H. (1994) Population abun- dance and body size in animal assemblages. Philosophical Transactions Royal Society London, B, 343, 33-39.
Blackburn, T.M., Brown, V.K., Doube, B.M., Greenwood, J.D., Lawton, J.H. & Stork, N.E. (1993a) The relationship between abundance and body size in natural assemblages. Journal of Animal Ecology, 62, 519-528.
Blackburn, T.M., Harvey, P.H. & Pagel, M.D. (1990) Species number, population density and body size relationships in natural communities. Journal of Animal Ecology, 59, 335- 345.
Blackburn, T.M., Lawton, J.H. & Pimm, S.L. (1993b) Non- metabolic explanations for the relationship between body size and animal abundance. Journal of Animal Ecology, 62, 694-702.
Blueweiss, L., Fox, H., Kudzma, V., Nakashima, D., Peters, R.H. & Sams, S. (1978) Relationships between body size and some life history parameters. Oecologia, 37, 257-272.
Bonner, J.T. (1988) The Evolution of Complexity by Means of Natural Selection. Princeton University Press, New Jersey.
Bradbury, J.W. & Vehrencamp, S.L. (1977) Social organ- ization and foraging in emballonurid bats. I. Field studies. Behavioral Ecology & Sociobiology, 1, 337-38 1.
Brown, J.H. & Kodric-Brown, A. (1977) Turnover rates in insular biogeography: effects of immigration on extinction. Ecology, 54, 775-787.
Brown, J.H. & Maurer, B.A. (1986) Body size, ecological dominance and Cope's rule. Nature, 324,248-250.
Brown, J.H. & Maurer, B.A. (1987) Evolution of species assemblages: effects of energetic constraints and species dynamics on the diversification of the North American avifauna. American Naturalist, 130, 1-17.
Brown, J.H. & Maurer, B.A. (1989) Macroecology: the div- ision of food and space among species on continents. Science, 243, 1145-1 150.
Brown, J.H., Marquet, P.A. &Taper, M.L. (1993) Evolution of body size: consequences of an energetic definition of fitness. American Naturalist, 142, 573-584.
Calder, C.A. (1984) Size, Function and Life History. Harvard University Press, Cambridge.
Cambefort, Y. (1994) Body size, abundance, and geo-graphical distribution of Afrotropical dung beetles (Coleoptera: Scarabaeidae). Acta Oecologica, 15,165-179.
Campbell, B. & Lack, E. (1985) A Dictionary of Birds. Buteo Books, Vermillion.
Carrascal, L.M. & Telleria, J.L. (1991) Bird size and density: a regional approach. American Naturalist, 138, 777-784.
Ceballos, G. &Brown, J.H. (1995) Global patterns of mam- malian diversity, endemism, and endangerment. Con-servation Biology, 9, 559-568.
Cotgreave, P. (1993) The relationship between body size and population abundance in animals. Trends in Ecology and Evolution, 8, 244-248.
Cotgreave, P. (1994) The relationship between body size and abundance in a bird community: the effects of phylogeny and competition. Proceedings of the Royal Society, B, 256, 147-149.

339 M. Silva, J.H. Brown & J.A. Downing
01997 British Ecological Society Journal of Animal Ecology, 66, 327-340
Cotgreave, P. (1995) Population density, body mass and niche overlap in Australian birds. Functional Ecology, 9, 285-289.
Cotgreave, P. & Harvey, P.H. (1991) Bird community struc- ture. Nature, 290, 699-700.
Cotgreave, P. & Harvey, P.H. (1992) Relationships between body size, abundance and phylogeny in bird communities. Functional Ecology, 6, 248-256.
Cotgreave, P. & Harvey, P.H. (1994) Phylogeny and the relationship between body size and abundance in bird communities. Functional Ecology, 8, 219-228.
Cotgreave, P. & Stockley, P. (1994) Body size, insectivory and abundance in assemblages of small mammals. Oikos, 71, 89-96.
Craighead, J.J., Craighead, F.C. Jr, Ruff., R.L. & O'Gara, B.W. (1973) Home ranges and activity patterns of non- migratory elk of the Madison drainage herd as determined by biotelemetry. Wildlife Monographs, 33, 1-50.
Currie, D. (1993) What shape is the relationship between body size and population density? Oikos, 66, 353-358.
Currie, D. &Fritz, J. (1993) Global patterns of animal abun- dance and species energy use. Oikos, 67, 56-58.
Damuth, J. (1981a) Home range, home range overlap, and species energy use among herbivorous mammals. Bio-logical Journal of the Linnean Society, 15, 185-193.
Damuth, J. (1981b) Population density and body size in mammals. Nature, 290, 699-700.
Damuth, J. (1987) Interspecific allometry of population den- sity in mammals and other animals: the independence of body mass and population energy use. Biological Journal of the Linnean Society, 31, 193-246.
Damuth, J. (1991) Of size and abundance. Nature, 351,268-269.
Damuth, J. (1993) Cope's rule, the island rule and the scaling of mammalian population density. Nature, 365, 748-750.
Delgiudice, G.D., Singer, F.J. & Seal, U.S. (1991) Physio- logical assessment of winter deprivation in elk of Yel- lowstone National Park. Journal of Wildlife Management, 55, 653-664.
Dunning, J.B. Jr (1984) Body Weights of 686 Species of North American Birds. Western Bird Banding Association Monograph 1. Eldon, Cave Creek, Arizona.
Dunning, J.B. Jr (1992) CRC Handbook of Avian Body Masses. CRC Press, Boca Raton, Florida.
Ebenman, B., Hedenstrom, A., Wennergren, U., Ekstam, B., Landin, J. & Tyrbergt, T. (1995) The relationship between population density and body size: the role of extinction and mobility. Oikos, 73, 225-230.
Gaisler, J. (1975) A quantitative study of some populations of bats in Czechoslovakia (Mammalia: Chiroptera). Acta Scientiarum Naturalium Academiae Scientiarum Bohemos- lovacae Brno, 9, 1 4 4 .
Gaisler, J. (1979) Ecology of Bats. Halsted Press, New York. Gaston, K.J. (1990) Patterns in the geographical ranges of
species. Biological Review, 65, 105-129. Gaston, K.J. (1991) How large is a species' geographic range?
Oikos, 61, 434437. Gaston, K.J. & Blackburn, T.M. (1995) Birds, body size and
the threat of extinction. Philosophical Transactions of the Royal Society of London, B, 347,205-212.
Gaston, K.J., Blackburn, T.M., Hammond, P.M. & Stork, N.E. (1993) Relationships between abundance and body size: where do tourists fit? Ecological Entomology, 18, 310- 314.
Greenwood, J.J.D., Gregory, R.D., Harris, S., Morris, P.A. & Yalden, D.W. (1996) Relationships between abundance, body size and species number in British birds and mammals. Philosophical Transactions of the Royal Society of London, B, 351,265-278.
Gregory, R.D. & Blackburn, T.M. (1995) Abundance and
body size in British birds: reconciling regional and eco- logical densities. Oikos, 72, 151-154.
Griffiths, D. (1992) Size, abundance, and energy use in com- munities. Journal of Animal Ecology, 61, 307-3 15.
Gujarati, D. (1978) Basic Econometrics. McGraw-Hill Co., New York.
Hancock, J.A., Kushlan, J.A. & Kahl, M.P. (1992) Storks, Ibises and Spoonbills of the World. Academic Press Inc., San Diego.
Harestad, A.S. & Bunnell, F.L. (1979) Home range and body weight - a re-evaluation. Ecology, 60, 389402.
Harvey, P.H. & Pagel, M.D. (1991) The Comparative Method in Evolutionary Biology. Oxford University Press, Oxford.
Hemker, T.P., Lindzey, F.G. & Ackerman, B.B. (1984) Population characteristics and movement patterns of cou- gars in southern Utah. Journal of Wildlife Management, 48, 1275-1284.
Holling, C.S. (1992) Cross-scale morphology, geometry, and dynamics of ecosystems. Ecological Monographs, 62,447-502.
Juanes, F . (1986) Population density and body size in birds. American Naturalist, 128, 921-929.
Kurzejeski, E.W., Vangilder, L.D. & Lewis, J.B. (1987) Sur- vival of wild turkey hens in North Missouri. Journal of Wildlife Management, 51, 188-193.
Lawton, J.H. (1989) What is the relationship between popu- lation density and body size in animals? Oikos, 55, 429- 434.
Lawton, J.H. (1990) Species richness and population dynam- ics of animal assemblages. Patterns in body size: abun- dance space. Philosophical Transactions Royal Society London, B , 330,283-291.
Mace, G.M. &Harvey, P.H. (1983) Energetic constraints on home-range size. American Naturalist, 121, 120-132.
McNab, B.K. (1980) Food habits, energetics, and the popu- lation biology ofmammals. American Naturalist, 116,106-124.
McNab, B.K. (1986) The influence of food habits on the energetics of eutherian mammals. Ecological Monographs, 56, 1-19.
McNab, B.K. (1994) Energy conservation and the evolution of flightlessness in birds. American Naturalist, 144, 628- 642.
Marquet, P.A. (1993) Macroscopic patterns of ecological organization. PhD thesis, University of New Mexico, Albuquerque.
Marquet, P.A., Navarrete, S.A. & Castilla, J.C. (1990) Sca- ling population density to body size in rocky intertidal communities. Science, 250, 1 125-1 127.
Marquet, P.A., Navarrete, S.A. & Castilla, J.C. (1995) Body size, population density, and the energetic equivalence rule. Journal ofAnimal Ecology, 64, 325-332.
Maurer, B.A. & Brown, J.H. (1988) Distribution of energy use and biomass among species of North American ter- restrial birds. Ecology, 69, 1923-1932.
Medel, R.G., Bozinovic, F. & Novoa, F.F. (1995) The mass exponent in population energy use: the fallacy of averages reconsidered. American Naturalist, 145, 155-162.
Millar, J.S. & Hickling, G.J. (1991) Body size and the evol- ution of mammalian life histories. Functional Ecology, 5, 588-593.
Nagy, K.A. (1987) Field metabolic rate and food require- ment scaling in mammals and birds. Ecological Mono- graphs, 57, 11 1-128.
Nee, S.A., Read, F., Greenwood, J.D. & Harvey, P.H. (1991) The relationship between abundance and body size in Brit- ish birds. Nature, 351, 312-313.
Norberg, U.M. (1986) Evolutionary convergence in foraging niche and flight morphology in insectivorous aerial-hawk- ing birds and bats. Ornis Scandinavica, 17, 253-260.
Norberg, U.M. & Rayner, J.M.V. (1987) Ecological mor-

340 phology and flight in bats (Mammalia: Chiroptera): wing
Density andenergy adaptations, flight performance, foraging strategy and echolocation. Philosophical Transactions of the Royal
use Society London, B, 316, 335427. Novick, A. & Dale, B.A. (1971) Foraging behavior in fishing
bats and their insectivorous relatives. Journal of Mammalogy, 52,8 17-8 18.
Nowak, R.M. (1991) Walker's Mammals of the World, 5th edn, Vols 1 and 2. Johns Hopkins University Press, Mary- land.
Pagel, M.D. & Harvey, P.H. (1988) Recent developments in the analysis of comparative data. The Quarterly Review of Biology, 63, 41 3440.
Pagel, M.D., Harvey, P.H. &Godfray, H.C.J. (1991) Species- abundance, biomass, and resource-use distributions. American Naturalist, 138, 836-850.
Pennycuick, C.J. (1978) Fifteen testable predictions about bird flight. Oikos, 30, 165-176.
Peters, R.H. (1983) The Ecological Implications of Body Size. Cambridge University Press, Cambridge.
Peters, R.H. & Raelson, J.V. (1984) Relations between indi- vidual size and mammalian population density. American Naturalist, 128, 665-680.
Peters, R.H. & Wassenberg, K. (1983) The effect of body size on animal abundance. Oecologia, 60, 89-96.
Pimm, S.L. (1991) The Balance of Nature: Ecological Issues in the Conservation of Species and Communities. Chicago University Press, Chicago.
Pulliam, H.R. & Brand, M.R. (1975) The production and utilization of seeds in the plains grassland of the south- western Arizona. Ecology, 56, 1158-1 166.
Rayner, J.M.V. (1981) Flight adaptations in vertebrates. Symposia of the Zoological Society of London, 48, 137- 172.
Redford, K.H. & Robinson, J.G. (1991) Park size and the conservation of forest mammals in Latin America. Latin American Mammalogy: History, Biodiversity, and Con-servation (eds M. A. Mares & D. J. Schmidly), pp. 227- 234. Oklahoma University Press, Oklahoma.
Robinson, J.G. & Redford, K.H. (1986) Body size, diet, and population density of neotropical forest mammals. American Naturalist, 128, 665-680.
Rosenzweig, M.L. (1968) The strategy of body size in mam- malian carnivores. American Midland Naturalist, 80, 299- 315.
Schmidt-Nielsen, K. (1983) Animal Physiology: Adaptation and Environment. Cambridge University Press, Cam-bridge.
Schmidt-Nielsen, K. (1984) Scaling, Why is Animal Size so Important? Cambridge University Press, Cambridge.
Seidensticker, J.C., Hornocker, M.G., Wiles, W.V. & Messick, J.P. (1973) Mountain lion social organization in the Idaho Primitive Area. Wildlfe Monographs, 35, 1-60.
Silva, M. &Downing, J.A. (1994) Allometric scaling of mini- mal mammal densities. Conservation Biology, 8, 732-743.
Silva, M. & Downing, J.A. (1995) The allometric scaling of density and body mass: a non-linear relationship for terrestrial mammals. American Naturalist, 141,704727.
Soul&, M.E. & Simberloff, D. (1986) What do genetics and ecology tell us about the design of nature reserves? Bio-logical Conservation, 35, 1940.
Stearns, S.C. (1983) The influence of size and phylogeny on patterns of covariation among life-history traits in mammals. Oikos, 41, 173-187.
Stork, N.E. (1987) Guild structure of arthropods from Bor- nean rain forest trees. Ecological Entomology, 12, 69-80.
Stork, N.E. & Blackburn, T.M. (1993) Abundance, body size and biomass of arthropods in tropical forest. Oikos, 67, 483489.
Terborgh, J., Robinson, S.K., Parker, T.A. 111, Munn, C.A. & Pierpont, N. (1990) Structure and organization of an Amazonian forest bird community. Ecological Mono-graphs, 60,213-238.
Thomas, C.D. (1990) What do real populations dynamics tell us about minimum viable population sizes? Conservation Biology, 4, 324327.
Turner, D.C. (1975) The Vampire Bat: A Field Study in Behavior and Ecology. Johns Hopkins University Press, Maryland.
Watson, J., Rae, S.R. & Stillman, R. (1992) Nesting density and breeding success of golden eagles in relation to food supply in Scotland. Journal of Animal Ecology, 61, 543- 550.
Welsh, A.H., Towsend, A. & Altmann, S.A. (1988) The fallacy of averages. American Naturalist, 132, 277-288.
Wickstrom, M.L., Robbins, C.T., Hanley, T.A., Spalinger, D.E. & Parish, S.M. (1984) Food intake and foraging energetics of elk and mule deer. Journal of Wildlife Man- agement, 48, 1285-1301.
Wiens, J.A. & Dyer, M.I. (1977) Assesing the potential impact of granivorous birds in ecosystems. Granivorous Birds in Ecosystems (eds J. Penowski & S. C. Kendeigh), pp. 205-266. Cambridge University Press, Cambridge.
Received 18 October 1995; revision received 27 March 1996
01997 British Ecological Society Journal of Animal Ecology, 66, 327-340