diffusion charging-based aerosol instrumentation for the degree of doctor of science in technology...
TRANSCRIPT

Tampere University of Technology
Diffusion Charging-Based Aerosol Instrumentation
CitationRostedt, A. (2018). Diffusion Charging-Based Aerosol Instrumentation: Design, Response Characterisation andPerformance . (Tampere University of Technology. Publication; Vol. 1527). Tampere University of Technology.
Year2018
VersionPublisher's PDF (version of record)
Link to publicationTUTCRIS Portal (http://www.tut.fi/tutcris)
Take down policyIf you believe that this document breaches copyright, please contact [email protected], and we will remove access tothe work immediately and investigate your claim.
Download date:03.07.2018

Diffusion Charging-Based Aerosol Instrumentation: Design, Response Characterisation and Performance
Julkaisu 1527 • Publication 1527
Tampere 2018

Tampereen teknillinen yliopisto. Julkaisu 1527 Tampere University of Technology. Publication 1527 Antti Rostedt Diffusion Charging-Based Aerosol Instrumentation: Design, Response Characterisation and Performance Thesis for the degree of Doctor of Science in Technology to be presented with due permission for public examination and criticism in Rakennustalo Building, Auditorium RG202, at Tampere University of Technology, on the 23rd of February 2018, at 12 noon. Tampereen teknillinen yliopisto - Tampere University of Technology Tampere 2018

Doctoral candidate: Antti Rostedt, M.Sc.
Laboratory of Physics Tampere University of Technology Tampere, Finland
Supervisor: Jorma Keskinen, Prof. Laboratory of Physics Tampere University of Technology Tampere, Finland
Instructor: Leonidas Ntziachristos, Assoc. Prof. Laboratory of Physics Tampere University of Technology Tampere, Finland Laboratory of Heat Transfer and Environmental Engineering Aristotle University of Thessaloniki Thessaloniki, Greece
Pre-examiners: Heikki Junninen, Ph.D. Institute of Physics University of Tartu Tartu, Estonia Department of Physics University of Helsinki Helsinki, Finland Pramod Kulkarni, D.Sc. Centers for Disease Control and Prevention National Institute for Occupational Safety and Health Cincinnati, USA
Opponent: Thomas A.J. Kuhlbusch, Prof. Hazardous Substances Management Federal Institute of Occupational Safety and Health Dortmund, Germany
ISBN 978-952-15-4084-4 (printed) ISBN 978-952-15-4116-2 (PDF) ISSN 1459-2045

Abstract
The growing concern for the air quality in urban areas and the subsequent developmentof measurement networks has increased the need for lightweight and cost-effective airquality instrumentation. In urban areas, traffic-related emissions are one of the majorcontributors to the worsened air quality, which in turn has led to the stringed emissionregulations set for vehicles. These regulations necessitate both on-board monitoring ofthe operation of the exhaust after-treatment devices and measurement of the real-worddriving emissions with portable emission measurement systems. Both of these aspectsincrease the demand for sensor-type instrumentation for emission measurement.
This thesis focusses on the development of diffusion charging–based aerosol instrumen-tation towards more compact and sensor-type instruments. The work was started by de-veloping an add-on module for the electrical low-pressure impactor. This extended theinstrument measurement capabilities by enabling the measurement of the effective den-sity of particles in real-time. Focussing more on the sensor-type instrumentation, threedifferent sensors were presented for measuring particle emission directly from the ex-haust line: Two of them targeting the engine laboratory work or for the portable emissionmeasurement and one designed for on-board diagnostics. The instrument developed forthe on-board emission measurement provided a very good temporal performance owingto the miniaturisation of the instrument design. Lastly, a new sensor design approachwas presented in which the flow rate dependence of the instruments response is mini-mised. This, together with the minimised pressure drop in the design, helps in loweringthe instrument cost by promoting the use of a low-cost fan for generating the sample flow.
Instrument response characterisation and response modelling made a central part of thestudy. Results from the characterisation measurements were presented for all instru-ments, and comprehensive response models were built for the sensor-type instruments.Depending on the instrument, both simplified approximations and theoretical responsesof the instrument components were used as the starting point for the response models.Additionally, the instrument performance was demonstrated in practical measurementsrelated to the application of each instrument. The obtained response models providenecessary information for the instrument performance evaluation and the measurementdata processing.


Preface
This work was carried out in the Aerosol Physics Laboratory at the Tampere Universityof Technology. I am deeply grateful for my supervisor Prof. Jorma Keskinen for all thesupport and guidance I have had. My instructor, Assoc. Prof. Leonidas Ntziachristos, Iwould like to thank for the valuable comments on this thesis and for the help in preparingPaper IV. I would also like to thank Prof. Jyrki Mäkelä, for making the work in the labor-atory easy from the administrative side.
During these years, I have had the privilege to work with many talented people. I wouldlike to acknowledge all the co-authors in the publications for their contribution. EspeciallyDr. Marko Marjamäki, Dr. Jaakko Yli-Ojanperä and Dr. Anssi Arffman deserve a majorcredit for all the valuable discussions we have had in and outside of the office. Doc. TopiRönkkö is acknowledged for providing the possibilities to test the instrument prototypesin different measurement campaigns. I would also like to thank Mr. Miska Olin for sharingthe office for several years. The work with instrument prototypes would have been im-possible without the support from the skilled people of the former Physics workshop. Iam especially thankful for the contribution of Mr. Antti Lepistö and Mr. Veli-Pekka Plym.For funding, I wish to acknowledge MMEA research program of the Cluster for Energyand Environment (CLEEN Ltd.), funded by the Finnish Funding Agency for Tech-nology and Innovation (TEKES). Additionally, I wish to thank Dekati Oy and PegasorOy and the personnel of these companies for the support and funding in different re-search projects.
All this would have been impossible without the support of the family. I am grateful to myparents and my brother and sister for laying out such a solid foundation in life. Unfortu-nately, my father is no longer with us, but his memory never fades away. I wish to thankmy wife Mia and our sunshine Mari for being there for me and keeping my thoughts(mostly) away from work at home.
Tampere, January 2018
Antti Rostedt


Symbols and Abbreviations
ε Permittivity of particleε0 Permittivity of vacuumηc Particle collection efficiency of the particle-collecting componentηg Gas viscosityηi Particle collection efficiency of an impactorηma Particle collection efficiency of the mobility analyserρeff Effective density of particlesρ0 Unit density 1 g/cm3
ξ Dimensionless term characterising the diffusion lossesτ Time constanta Fitting parameter in charging efficiency approximationb Fitting parameter in charging efficiency approximationB Particle mechanical mobilityCc Slip correction factorci Mean thermal velocity of ionsd50% Cut point diameter corresponding to 50% collection efficiencyd50%,n Cut point diameter of impactor stage nda Aerodynamic particle diameterdb Mobility equivalent particle diameterdduct Diameter of flow ductdia Aerodynamic median size of particlesdim Mobility median size of particlese Elementary chargedp Particle diameterEave Average electric field strengthEc Electric field strength in the particle-charging regionEch Charger efficiencyEt Electric field strength in the ion trapFd Drag forceIc Charger ion source supply currentIc’ Return current from the charger ion source to power supplyIch Current component related to generated ions in a chargerI Current size distribution of particlesI’ Modified current size distribution of particlesIi Current component related to ions collected in an ion trapIic Current component related to particle initial chargeIil Current component related to ions escaping the chargerIm Measured current component relatedIout Current component flowing out from the chargerIpc Current component related to particle chargeIpl Current component related to charged particle lossesk Boltzmann constantLeff Effective length of charging regionlma Length of the mobility analysernave Average number of charges per particlend Average number of charges per particle from diffusion chargingnf Average number of charges per particle from field charging

Ni Concentration of ionsPch Charger penetrationPd Particle diffusion losses expressed as penetrationPi Particle penetration through the instrumentPil Particle inertial losses expressed as penetrationPma Mobility analyser particle penetrationQp Volumetric pump flow rate of an ejectorQs Volumetric sample flow rateR Flow velocity factorRch Response of the diffusion chargerRETaPS Response of the Electrical Tail Pipe SensorRf Response of an instrument combining diffusion charger and filter collectionRi Overall response of the instrumentRma Response of an instrument combining diffusion charger and mobility analyserRPPS-M Response of the PPS-Ms Fitting parameter in the impactor collection efficiency approximationsi Inner diameter of an annular flow channelso Outer diameter of an annular flow channelT Gas temperaturet Residence timetr Rise timeu0 Fitting parameter related to diffusion lossesVflow Flow velocityVma Mobility analyser collection voltageVmin Minimum flow velocityvp Particle velocityZ0 Limiting electrical mobility of a mobility analyserZi Ion electrical mobilityZp Particle electrical mobility
CO Carbon monoxideCO2 Carbon dioxideCPC Condensation particle counterDMA Differential mobility analyserDOS di-octyl sebacateECT Escaping charge techniqueETaPS Electrical Tail Pipe SensorFCE Faraday Cup ElectrometerFIAS Flow Independent Aerosol SensorGSD Geometric standard deviation of a lognormal particle size distributionLDSA Lung deposited surface areaMOS Metal oxide semiconductorNO Nitrogen monoxideNO2 Nitrogen dioxideNOx Nitrogen oxides in generalO3 OzoneOBD On-board diagnosticsOPC Optical particle counter

PM2.5 Total mass of particles smaller than 2.5 µmPM10 Total mass of particles smaller than 10 µmPEMS Portable emission measurement systemRPM Revolutions per minuteSCAR Single charged aerosol referenceSMPS Scanning mobility particle sizerSO2 Sulfur dioxideTEOM Tapered element oscillating microbalance


List of Publications
Paper I Rostedt, A., Marjamäki, M., and Keskinen, J., 2009. Modification of theELPI to Measure Mean Particle Effective Density in Real-Time. J. Aer-osol Sci., 40:823–831, doi: 10.1016/j.jaerosci.2009.05.002.
Paper II Rostedt, A., Marjamäki, M., Yli-Ojanperä, J., Keskinen, J., Janka, K.,Niemelä, V. and Ukkonen, A., 2009. Non-Collecting Electrical Sensorfor Particle Concentration Measurement. AAQR, 9:470–477, doi:10.4209/aaqr.2009.03.0023
Paper III Rostedt, A., Arffman, A., Janka, K., Yli-Ojanperä, J. and Keskinen, J.,2014. Characterization and Response Model of the PPS-M AerosolSensor. Aerosol Sci. Technol., 48:10, 1022-1030, doi:10.1080/02786826.2014.951023
Paper IV Rostedt, A., Ntziachristos, L., Simonen, P., Rönkkö T., Samaras, Z.,Hillamo, R., Janka, K., and Keskinen, J., 2017. A new miniaturized sen-sor for ultra fast on-board soot concentration measurements. SAE Int.J. Engines 10(4):2017, doi: 10.4271/2017-01-1008.
Paper V Rostedt, A. and Keskinen, J., 2017, Flow rate independent electricalaerosol sensor. Submitted to Aerosol Sci. Technol.


Author’s contribution
The work presented in this thesis has been carried out in research projects, and thepublications included in this thesis are a result of a collaborative work. The author hashad a specific role in each publication, as summarised below:
Paper I A new modification to the electrical low-pressure impactor (ELPI), allow-ing the measurement of particle effective density, was introduced in thispublication. The author designed the integrated mobility analyser and car-ried out calibration and laboratory test measurements. The author alsoproduced the required response functions and the data processing rou-tines with the help of co-authors and wrote the first draft of the manuscript.
Paper II In this publication, a new electrical sensor for vehicle particle emissionmeasurement was introduced. The author took part in the early stages ofinstrument design, and the tested prototype instrument was designed byDr. Janka, Mr. Niemelä and Mr. Ukkonen. Mr. Ukkonen and Dr. Yli-Ojanperä carried out the characterisation measurements, and the authorperformed the data processing and the field test measurements. The au-thor also formulated the instrument response model with the help of otherco-authors and wrote the first version of the manuscript.
Paper III This publication presented a laboratory characterisation and a responsemodel for the PPS-M electrical aerosol sensor. The author designed theresponse measurement setup and carried out the laboratory responsemeasurements together with Dr. Yli-Ojanperä. Dr. Arffman carried out theCFD modelling presented in the publication. The author was responsiblefor the data processing and the response model. The author also wrotemost parts of the manuscript.
Paper IV A new and miniaturised electrical aerosol sensor, based on the previousPPS-M sensor, was introduced in this publication. The author carried outboth laboratory and engine test measurements, produced the responsemodel and wrote most parts of the manuscript.
Paper V This publication is based on the author’s idea for a new simplified aerosolsensor. The author designed the instrument prototype by modifying ex-isting instrument parts, designed the laboratory measurements and car-ried out the data processing. The response model was formulated, andthe manuscript was written together with Prof. Keskinen.


Contents
1 Introduction .......................................................................................................... 1
1.1 Aim and scope ................................................................................................ 5
2 Instrument components and theoretical background of the response ............ 7
2.1 Fundamental particle properties related to the response ................................. 8
2.2 Particle charging ............................................................................................. 9
2.3 Charger design concepts .............................................................................. 13
2.4 Particle deposition ........................................................................................ 15
2.5 Charge measurement ................................................................................... 19
3 Experimental response characterisation ......................................................... 23
3.1 Methods based on monodisperse test aerosol .............................................. 23
3.2 Method based on polydisperse test aerosol .................................................. 25
3.3 Temporal performance characterisation ........................................................ 27
4 Instrument design and performance ................................................................ 29
4.1 Real-time particle effective density measurement ......................................... 29
4.2 Exhaust emission measurement ................................................................... 33
4.3 Ultra-fast on-board emission measurement .................................................. 41
4.4 Flow independent concentration measurement ............................................. 43
5 Summary ............................................................................................................ 47
References ................................................................................................................ 49
Publications .............................................................................................................. 57


1
1 Introduction
As awareness of the adverse health effects caused by different anthropogenic emissionshas increased, the concern on the air quality of urban areas has become a major issue.There are many different components affecting the air quality. For outdoor air quality,concentrations of gaseous substances such as sulphur dioxide (SO2), nitrogen oxides(NOx) and ozone (O3) are measured and reported. For the particulate matter, valuescommonly related to air quality are PM2.5 and PM10, which correspond to the massconcentration of all particles smaller than 2.5 µm and 10 µm, respectively. Regulatoryauthorities have set limits for the key components affecting the air quality. In EuropeanUnion, the limiting values and related measurement methods are set by EU Directive2008/50/EC (EU, 2008). Apart from the official air quality measurement sites, fulfilling theregulatory requirements, there is a growing interest towards more lightweight and morewidely dispersed air quality measurement (Snyder et al., 2013, Kumar et al., 2015). Sim-plified instruments targeted for personal exposure measurement or for large area sensornetworks are becoming more popular.
Traffic-related emissions are one of the major contributors to the air quality related prob-lems in urban areas (Künzli et al., 2000). Increased concentrations of ultrafine particles,hydrocarbons and nitrogen oxides are reported from traffic congestions (see, e.g., Hu etal., 2009). For this reason, the vehicle emissions are controlled by emission regulations,which currently necessitate the use of exhaust after-treatment devices. Further, the reg-ulations require both real-word emission measurement and continuous monitoring of theoperation of the emission control devices (ICCT, 2016). This has led to development ofportable emission measurement systems (PEMS), capable of being mounted on boardthe vehicle, whereas the continuous monitoring is carried out by the on-board diagnostics(OBD) systems of the vehicles. Sensor-type air quality instruments are needed for bothof these applications.

2
For gaseous compounds related to the air quality and emissions, there are several meas-urement technologies available, as reviewed by Liu et al. (2012). Commonly used tech-nologies in sensor-type applications are based either on the light absorption or on thechemical interaction between the measured gas component and the sensor electrode(Lee and Lee 2001). Through the application of the semiconductor manufacturing tech-niques, such as micro-electromechanical structures and thick film techniques, it has beenpossible to introduce miniaturised component-like gas sensors to the market (see, e.g.,Park et al., 2009). With the current sensor technologies, it is possible to have low-costdetectors for gaseous compounds, such as, for example, CO, CO2 and NOx for ambientconcentrations (Piedrahita et al., 2014).
Compared to the gaseous compounds, the aerosol measurement is somewhat morechallenging. The complexity starts from the concentration definition, as there are severaldifferent ways for quantifying the amount of particles suspended in the air. While theconcentration is often the most important property, other properties of the aerosol, suchas for instance particle size and morphology, need to be considered. On top of all this,the properties are in a constant change due to various ongoing processes. Concentrationdecrease due to the particle losses and particle mean size growth due to the condensa-tion are examples of such processes. For this reason, fast online measurement and real-time instruments are preferable in aerosol measurement. From the air quality perspective,the particle size range below 1 µm is important, as most of the emission sources affectingthe air quality produces particles in this size range. This sets another challenge for theaerosol instrumentation, as the particle detection gets more challenging with the de-creased particle size. Indirect measurement techniques are required, which often lead toincreased data processing and decreased accuracy in the measurement. Because ofthese challenges, the simplified and lightweight aerosol instruments have not been avail-able until quite recently.
In terms of air quality, the aerosol concentration is usually expressed as mass concen-tration. While the quantity has a strong historical background (Chow 1995), there areonly few real-time instruments that can be used for direct measurement of ambient par-ticle mass concentration. From those, the tapered element oscillating microbalance(TEOM, Patashnick and Rupprecht, 1991) is perhaps the most well-known. The TEOMdetects the changing mass of the particle-collecting filter by measuring the resonancefrequency of the vibrating filter holder. More commonly, the aerosol concentration ismeasured utilising light scattering, either from single particles or from particle clouds.Optical particle counters (OPCs) count the individual particles to measure the numberconcentration of particles (Kulkarni et al., 2011). By simultaneously recording the heightsof individual scattering peaks, information on the particle size distribution is acquired.While there are high-end instruments with operational particle size ranges reaching down

3
to 0.05 µm, the use of the OPC for the air quality measurement is limited because theaffordable instruments are not sensitive for detecting small particles much below 0.5 µm.In order to extend the particle size range for the optical particle detection, condensationparticle counters (CPC's) have been developed. They also rely on measurement of thesingle-particle scattering pulses, but, apart from the OPCs, the particles are first grownby condensation before the optical measurement. Through this, the lower size limit hasbeen extended down to a few nanometres. The first commercial continuous-flow CPCentered the market in the early eighties (McMurry, 2000, Agarwal and Sem, 1980). Thecondensing material used in the CPC to grow the particle is usually either n-butanol (Bri-card et al., 1976) or water (Hering et al., 2005). By using di-ethylene glycol as the workingliquid, it is even possible to extend the lower size limit below 2 nm (Iida et al., 2009). TheCPC is a good instrument for the number concentration measurement, but continuousoperation requires periodic filling of the condensing liquid. Recent development in theoptical particle detection has brought to the market several small and affordable opticalparticle sensors. These sensors operate without particle growing and are thus only sen-sitive for the large particles. The output of such sensors is usually calibrated against amass concentration measurement. Sousana et al. (2017) and Kelly et al. (2017) evalu-ated the use of these sensors for air quality measurement.
The electrical aerosol concentration measurement relies on particle-charging and sub-sequent charge measurement. The charge on the particles is typically produced by adiffusion charger, where the aerosol particles are brought into contact with gas phaseions. The ion cloud can be bipolar — containing negative and positive ions — or unipolar,containing only one polarity. For the ion production, different methods such as ionisingradiation from radioactive sources, direct x-ray radiation, electric discharge or even ther-mal emission from flames can be used (Flagan, 1998). Although particle charging wasfirst utilised for particle mobility measurements, the development in the low-level currentmeasurement has made it possible to measure aerosol concentration with instrumentsbased on electrical detection of the charged particles. Currently, there are several differ-ent instrument designs, which are based on the diffusion charging of the aerosol particles.Those instruments range from small and lightweight concentration monitors (Marra et al.,2009, Fierz et al., 2011, Fierz et al., 2014) to the more sophisticated instruments meas-uring the particle size distribution (Keskinen et al., 1992, Tammet et al., 2002 and Biskoset al., 2005a). While the electrical instruments are generally very reliable and producerepeatable results, the measured raw data do not directly correspond to the traditionallyused concentration metrics. For converting the output to mass or number concentration,data processing is required, which in turn requires thorough understanding on the instru-ment operation.

4
Since the instruments based on the diffusion charging and electrical particle detectionare sensitive in detecting the ultrafine particles, this approach has been applied to meas-ure the concentration of the small particles. The instrument designs presented by Liuand Lee (1976) and Lehtimäki (1983) are early versions of such instruments in the liter-ature. It was later determined by Wilson et al. (2007) that the charge measured from theparticles after the diffusion charger correlates well with the lung deposited surface area(LDSA) concentration. The LDSA represents the total surface area of the particles de-positing in the lung, and it has been linked to the adverse health effects of fine particlesby Brown et al. (2001) and Oberdörster et al. (2005). This close correlation promotes theuse of diffusion charging-based instrumentation for air quality monitoring. Based on thisapproach, Fissan et al. (2007) presented one of the first instruments that targeted themeasurement of the LDSA concentration. Since then there have been several studiesutilising the diffusion charging-based instrumentation for LDSA concentration measure-ment. For example, Ntziachristos et al. (2007), Järvinen et al. (2015), Viana et al. (2015)and Kuuluvainen et al. (2016) utilised the LDSA concentration measurement for outdoorair quality, whereas Buonanno et al. (2011) and Geiss (2016) concentrated on the airquality of a working environment. More recently, since these instruments are relativelysmall and affordable, they are being utilised in air quality measurement networks, asdemonstrated by Marjovi et al. (2015). Such networks serve an important role in provid-ing supporting information on the air quality in order to complement information obtainedfrom other sources, as suggested, e.g., by Kuhlbusch et al. (2014).
Besides the concentration and the particle size, shape and density of the particles arealso important properties of the aerosol. These properties affect to the particle transportand interaction with the surrounding and are of importance for instance in the healtheffect assessment and in various industrial applications. In the ultrafine particle sizerange, the particle shape and density are often combined as the effective density of theparticles. This is because it is difficult to have a direct measurement on either of theseproperties separately. Information on the particle effective density can be obtained bycombining different particle size measurement techniques, as reviewed by Schmid et al.(2007). The conventional methods used for measuring the particle effective density re-quire the use of multiple instruments (see, e.g., Kelly and McMurry, 1992 and Ristimäkiet al., 2002). This leads to complex and expensive measurement set-ups and hencelimits the use of these methods in practical applications.

5
1.1 Aim and scope
This thesis focusses on introducing new real-time aerosol instrument designs based onthe diffusion charging and on the characterisation of these instruments. The instrumentresponse, describing the relation between the input aerosol sample and the measuredoutput, plays a key role in this work. For obtaining the response, laboratory characteri-sation measurements are needed. By combining the laboratory measurement resultswith the theoretical response functions of the instrument components, a comprehensivemodel for the instrument response can be built.
In the scope of this thesis, the instrument design and development fall under the fourmain topics:
· Development of real-time effective density measurement through modification ofthe electrical low-pressure impactor (ELPI)
· Instrument development and characterisation for measuring the particle concen-tration directly from exhaust emission
· Development and characterisation of particle concentration sensor for on-boarddiagnostics of vehicles
· Minimising the instrument response sample flow rate dependence
The first topic was discussed in Paper I, where a new add-on module for the ELPI inorder to measure the particle effective density was introduced. Papers II, III and IV fo-cussed on the measurement of the particle concentration directly from the exhaust lineof an engine or a vehicle. A new instrument design was introduced in Paper II, whichconsisted of a sensor probe installed directly to the exhaust flow. On the other hand,Paper III focussed more on the instrument response characterisation and the responsemodel of a different instrument design. Both of these instruments are targeted for anengine laboratory work or PEMS measurement. In Paper IV, a new instrument prototypefor the OBD application was presented. Unique to this design, an exceptionally good timeresolution was achieved for the instrument, which was characterised and also demon-strated in engine laboratory measurements. The fourth topic was discussed in Paper Vby introducing a new approach for the electrical aerosol sensor design, where the instru-ment response is relatively independent on the sample flow rate.

6

7
2 Instrument components and theoretical backgroundof the response
The aerosol instruments based on the diffusion charging and the charge detection re-quire only few components for the operation. The main component is the particle charger,where ions are mixed with the aerosol sample. After particle charging, excess ions areremoved from interfering the particle detection by an ion trap. The particle concentrationis then measured by detecting the charge carried by the particles with a high-sensitivityelectrometer. For charge detection, the particles can be collected into an isolated filteror an electrode from which the electric current is measured. Size selective collectionmethods can be used to measure particle size or to modify the instrument response. Itis also possible to use non-collective charge detection techniques.
The instrument response is the link between the instrument output and the input. In thecase of the electrical aerosol instruments, the response links the measured current fromthe charged particles to the particle size and concentration of the aerosol sample. Forthe aerosol instruments, the response is usually referenced to the particle number con-centration, and it is a function of the particle size. In the following, the theoretical back-ground of the instrument response and the main aspects of the instrument design affect-ing the achievable performance are discussed. The main contributor to the instrumentresponse is the charging efficiency of the charger Ech, which, for the response, can beexpressed as the product of the particle penetration through the charger Pch and theaverage number of charges the particles acquire during the charging nave, as shown inequation 1 (for reference see, e.g., Marjamäki et al., 2000).
ch ch aveE P n= (1)
While the notation is omitted in the equation, the charging efficiency is a function of theparticle diameter. After the charging, the charge on the particles is distributed; hence, anaverage number of charges per particle are required. If required, the particle charge dis-tribution can be approximated by a lognormal distribution, as demonstrated by Kaminskiet al. (2012). The response of the charger, written in equation 2, is the relation betweenthe current measured from the particles after the charging and the particle concentration.It is the product of the charging efficiency and the charge of the elementary charge e andthe volumetric sample flow rate Qs.
ch ch sR E eQ= (2)

8
Particle deposition also contributes to the instrument response by introducing unwantedparticle losses or if utilised for the charge detection. The effect of the particle losses isintroduced to the overall instrument response Ri by the particle penetration Pi, whereasthe effect of the particle-collecting component is introduced by the collection efficiencyηc. The resulting simplified instrument response equation can be written as equation 3:
i i c ch sR P E eQh= (3)
2.1 Fundamental particle properties related to the response
Particle size is the most important property of the particles that governs the behaviour ofthe aerosol particles. The particle size can be defined in several ways. Most often thediameter of an equivalent sphere is used to describe the particle size. For instance, sur-face area and volume equivalent particle diameters correspond to the diameters of thesphere having the same surface area and volume as the possibly irregularly shapedparticle. The mobility equivalent particle size, or the Stokes diameter, corresponds to thediameter of the sphere having the same density and settling velocity as the original par-ticle. The aerodynamic particle size corresponds to the diameter of a unit density spherehaving an equal aerodynamic drag. The mobility equivalent particle size db is related tothe aerodynamic particle size da by the particle effective density ρeff, as written in equa-tion 4, where the term ρ0 is the unit density 1 g/cm3.
2
20
effa
b
dd
rr
= (4)
When the particles are in the influence of a force, the particle movement is affected bythe interaction between the particle and the surrounding gas. The drag force Fd causedby the gas to the particle migrating at the velocity of vp is described by the Stokes dragforce written in equation 5:
3 g p bd
c
v dF
Cph
= (5)
The term Cc in the equation above is the slip correction factor, which extends the opera-tional range of the equation form the continuum regime to smaller particle sizes. Thefactor was introduced by Cunningham (1910), and it is used in the form presented by

9
Allen and Raabe (1982). The surrounding gas properties are introduced by the gas vis-cosity ηg. The particle mechanical mobility B is defined as the relation between the mi-gration velocity and the drag force, and it can be written as equation 6:
3c
g b
CBdph
= (6)
As the gas molecules move randomly at thermal velocity around the particles, they col-lide frequently with the particles. This constant bombardment of gas molecules causesa net particle flux in the direction against the concentration gradient, which is a phenom-enon called diffusion. The diffusion is characterised by the diffusion coefficient Dp givenby the Stokes-Einstein equation (7), where the new terms are Boltzmann constant k andgas temperature T.
pD kTB= (7)
If the particles are charged, the electric field affects particle movement. This effect ischaracterised by the particle electrical mobility Zp, which links the drift velocity caused bythe electric field to the field strength. The electrical mobility is the product of the numberof charges per particle, the charge of the elementary charge and the mechanical mobility:
pZ neB= (8)
2.2 Particle charging
Although there are different ways for producing charge on the aerosol particles, the ma-jority of the instrument designs based on electrical aerosol detection rely on chargersutilising corona discharge. Inside the charger, the aerosol particles are charged by theunipolar ions generated in the corona discharge region. Although both positive and neg-ative polarities can be used for the discharge, positive polarity is favourable due to thelower ozone production rate. A comparison of the ozone production rates of the differentdischarge polarities can be found, for example, in Boelter and Davidson (1997).
The particle-charging properties of both bipolar and unipolar chargers have been widelystudied in the literature. The reported performance parameters are often divided to in-trinsic and extrinsic charging efficiencies, as introduced by Büscher et al. (1994). Theintrinsic charging efficiency relates to the fraction of particles acquiring charge inside thecharger, but it does not take into account the electrical particle losses after the charging

10
takes place. The extrinsic charging efficiency describes the ratio of the charged particlenumber in the charger output to the total particle number in the charger inlet. While theseperformance parameters are often reported for the charger designs (see, e.g., Biskos etal., 2005b and Alonso et al., 2006), from the aerosol instrumentation perspective, themost convenient definition for the charging efficiency is the Pchnave product written inequation 1. The Pchnave product value can be defined for all particles or only for thecharged particle fraction. The product values are equal in both cases, but the ratio be-tween the Pch and nave may be different, as noted in Virtanen et al. (2001). In the following,the approximations used in the modelling of the charger response are presented. Forthose interested, the charger performance evaluation is discussed in more detail, forinstance, in Marquard et al. (2005).
A schematic view of a simplified unipolar corona charger is shown in figure 2.1, showingthe main processes related to the charger operation. The ions are produced by the co-rona discharge in the volume near the discharge electrode, marked as the ion productionzone. The generated ions are dispersed in the aerosol sample by diffusion and the elec-tric field Ec in the sample volume, and the ion dispersion is enhanced by the coulombrepulsion. The ions mix with the aerosol particles in the charging region, and, after that,the excess ions are removed from the sample by the applied electric field Et.
Figure 2.1. Schematic view of a simplified corona discharge-based aerosol charger, show-ing the main processes related to the charger operation

11
Inside the charging region, the particles acquire charge by two different charging pro-cesses: diffusion and field charging. The diffusion charging, more effective for the smallparticles, covers the charging process induced by the thermal diffusion of the ions. Whenthe ions move randomly around the particles by Brownian motion, they have a certainprobability to collide with the particle. After the time t, the particles reach a mean chargelevel nd approximated by equation 9 (see, e.g., Hinds, 1999).
20
20
2ln 1
8p p i i
d
d kT d c e N tn
e kTpe
eæ ö
= +ç ÷ç ÷è ø
, (9)
where the term e0 is the permittivity of the vacuum, dp is the particle diameter, k is theBoltzmann constant, T is the temperature, e is the charge of the elementary charge, ci isthe mean thermal velocity of the ions and Ni is the concentration of ions. Although theo-retical charging equations, such as the above, are usually valid for spherical particlesonly, the particle diameter is often substituted by mobility equivalent diameter (db). Thismay not correctly describe the charging of irregularly shaped particles (for more detailssee e.g. Shin et al. 2010). The effect of the shape is however relatively small and con-sidered insignificant in the scope of this thesis. It is also assumed that the measuredaerosol itself does not significantly affect the concentration and properties of the chargingions.
As particle size increases, field charging becomes a more effective process. In the charg-ing region, the particles are always in an electric field: either an external field or thatcaused by the charged ions. The particles influence this field near the particle surface,which affects the ion movement near the particle. This effect is called field charging andthe charge nf, the particles acquire by field charging is approximated by equation 10 (see,e.g., Hinds, 1999).
20
0
32 4
c p i if
i i
E d eZ N tne eZ N t
pe pee pe p
æ öæ öæ ö= ç ÷ç ÷ç ÷ç ÷+ +è ø è øè ø(10)
The new terms in the field charging equation are the permittivity of the particle e, theelectrical field strength Ec and the ion electrical mobility Zi. The combined effect of thecharging processes is the sum of the components nd and nf. Although equations 9 and10 provide means to approximate the particle charge after the charger, it is difficult topredict the performance of the practical charger design. This is because it is difficult toobtain accurate values for the average electric field and the ion concentration in the par-ticle-charging region. Furthermore, the charger performance is also affected by the par-ticle penetration through the charger. The penetration, in turn, is affected by the diffusion

12
losses and the charged particle losses caused by the electric fields present in the charger.Instead of the theoretical approximation, the charging efficiency is, in practice, deter-mined experimentally. A power function of equation 11 is usually used as a fit to theexperimental data, for which the best fitting parameter a and b values are to be found,for instance, by the least squares sum method.
bch pE ad= (11)
In some cases, a single power function does not provide adequate fit and a partiallydefined power function fit is required, as, for instance, in Marjamäki et al. (2002). Accord-ing to equations 9 and 10, diffusion charging is approximately proportional to the particlediameter, whereas field charging is proportional to diameter squared. Based on this, theobtainable power in the charger efficiency fit would be in the range from one to two. Thepower is, however, also affected by particle losses, which often increases the power inthe small particle size range. The charging efficiencies as a function of particle diameterfor the instruments studied in Papers I–V are collected into figure 2.2. The functionalforms of power values one and two are also plotted in the figure for comparison. Thesecorrespond to the limiting power values, based on the charging theories.
Figure 2.2. Charging efficiencies as a function of the particle diameter for the instrumentsstudied in this thesis. The charging efficiency for the ELPI used in Paper I ispresented according to Marjamäki et al. (2002). For the other instruments, thecharging efficiency is adapted from Papers II–V. Limiting power values of oneand two, based on the charging theory, shown for reference.

13
2.3 Charger design concepts
The Nit –product is the key parameter in the charger design that affects charger perfor-mance. Davison et al. (1985) studied the effect of the Nit –product value on differentcharger performance values, such as the obtained average charge number and particlelosses. The results clearly indicate that particle losses increase with increasing Nit –product, while the rate of increase in the obtained charge number begins to decline withvalues above 107 s/cm3. Intra and Tippayawong (2009) presented a thorough review onthe charger designs used in many studies and commercial instruments. The majority ofthe Nit values listed for charger designs in the review are in the order of 107 s/cm3.
Following the classification presented in Kulkarni et al. (2011), the designs fall into twomain categories: designs where the measured aerosol sample travels through the co-rona discharge region and designs where the discharge region is separated from theaerosol sample. The main difference in these two design approaches is the electric fieldstrength involved in the charging process. Three main design approaches for a coronadischarge charger are presented in figure 2.3, which shows the ion production zone (1),particle-charging zone (2) and the ion removal area (3). The design of figure 2.3a repre-sents a charger where the corona discharge takes place in the sample volume, whereasin designs b) and c) the discharge region is separated from the sample volume.
Figure 2.3. Schematic view of three different design approaches for a corona discharge aer-osol charger: a) a diode-type charger, b) a triode-type charger and c) a sheathair assisted charger. The ion production zone, the particle-charging region andthe ion removal zone are marked with numbers 1, 2 and 3, respectively. Thesample flow and sheath air flows are marked with a solid and dashed lines re-spectively.

14
The most straightforward design (figure 2.3a) consists of a corona discharge electrode,a needle or a wire placed in an aerosol flow channel. The metal surroundings of the flowchannel act as the ground electrode for the discharge. A high voltage, in the order of afew kilovolts, is connected to the discharge electrode to maintain the discharge. The highvoltage is typically controlled so that the discharge current is kept constant in the rangefrom a few nanoamperes to a few microamperes. This design represents a chargerwhere the electric field of the corona discharge affects the charging process. Such designis used, for instance, in the Electrical Low Pressure Impactor (ELPI; Keskinen et al., 1992)and in this study in Paper II and Paper V. While the high electric field strength in theparticle-charging region may lead to increased particle losses, the main advantage ofthis approach is the simplicity of the design. As this design has only two electrodes, it issometimes referred to as a “diode-type” charger.
Many charger designs aim for higher charger output by addressing the charged particlelosses caused by the strong electric field of the corona discharge. Sheath air flows canbe used for separating the aerosol sample from the discharge electrodes or the chargerwalls, as in the design presented by Cheng et al. (1997). Several designs use a gridelectrode between the discharge electrode and the ground to separate the dischargeregion from the aerosol sample flowing in the charging region (see design in figure 2.3b).Hewitt (1957) presented one of the earliest designs based on this operation principle. Aperforated grid electrode separates the two regions and the discharge takes place be-tween the needle or wire electrode connected to the high voltage and the grid electrode.A much lower electric field between the grid electrode and the ground is used to guidesome of the generated ions into the charging region, where the aerosol sample flows. Asthe charger design has three electrodes and operation resembles the vacuum tube triodefrom early electronics, this design is often called a “triode-type” charger. The lower elec-tric field in the charging region decreases the electrical particle losses, which increasesthe charging efficiency for the small particles. For larger particles, for which the electricfield enhances the charging, the charging efficiency is, however, decreased by lack ofelectric field. Although the field is always much weaker than in the diode-type charger, itis possible to control the field strength to some extent in the triode charger. This providesthe possibility to tailor the charging efficiency. On the downside, the ion transport effi-ciency from the discharge region to the charging region is significantly lower than in thediode-type charger. This leads, in addition to the otherwise more complicated power sup-ply, to a higher power demand in the high voltage generation to achieve the same ioncurrent. Many designs, such as presented by Liu and Pui (1975) and Biskos et al. (2005b),also use sheath air feed in order to prevent aerosol particles from entering the dischargeregion. While this complicates the charger design even further, it efficiently prevents thecorona discharge electrode from fouling and decreases the need for maintenance. A

15
triode-type charger is used in many commercial instruments, such as Dekati Mass Mon-itor (DMM; Lehman et al., 2004), Aerasense NanoTracker (Marra et al., 2009), TestoDisCMini (Fierz et al., 2011) and naneos Partector (Fierz et al., 2014).
An even lower external electric field in the charging region is possible by using high-velocity sheath air flow to introduce the charging ions to the aerosol sample as in thedesign in figure 2.3c. The first ion source utilising sonic velocity sheath air flow was pre-sented by Whitby (1961) for the use of neutralising powder particles. In this approach,the corona discharge takes place in clean sheath air inside a separate chamber. Theions are transported into contact with the aerosol sample by the sheath air flowing fromthe discharge region to the charging region. The operation is analogous to the triode-type charger, but in this case there is no applied electric field in the charging region.Because of the lack of electric field, the sheath air–assisted charger operates as closeto a true unipolar diffusion charger as possible. As in the triode-type charger, the smallparticle losses as well as the large particle-charging efficiency are decreased in this de-sign by the lack of electric field. This type of design is used, for instance, in TSI NSAM(Fissan et al., 2007), Choi and Kim (2007), Medved et al. (2000) and Kimoto et al. (2010).Instruments presented in Paper III and Paper IV are also based on this type of charger.
Regardless of the choice of charger design, to achieve sufficient particle charging a largeamount of charged ions is introduced to the aerosol sample. For this reason, the excessions not taking part in the particle charging need to be prevented from interfering withthe current measured from the particles. If the signal from the ions cannot be separatedfrom the signal from the charged particles, the ions need to be removed from the sample.This is typically achieved with an electrical collector, called an ion trap, consisting of atwo-electrode system, where the charged ions are collected by the applied electric field.The ion trap is usually a separate electrode system integrated into the charger, but insome charger designs the stray electric field of the corona discharge is sufficient to re-move the ions from the sample flow. While the main purpose of the ion trap is ion removal,it also can be used simultaneously for limiting the lowest detectable particle size.
2.4 Particle deposition
Apart from the optical measurement techniques, the particle concentration and sizemeasurements are commonly based on particle deposition. In theory, all depositionmechanisms could be exploited, but the intended operational size range restricts thechoice. For instance, diffusion migration can only be used for small particles, while grav-itational settling works only for large particles. For the total concentration measurement,the target is ideally to deposit particles of all sizes, and for this filters are commonly used.

16
In the electrical aerosol instruments, the particle-collecting component needs to beplaced inside a Faraday cage in order to enable measurement of the collected charge.The arrangement of a particle-collecting filter inside the Faraday cage is often called aFaraday cup electrometer (FCE). An example of an FCE design can be found, for in-stance, in Intra and Tippayawong (2015). For example, a simple instrument measuringthe total particle concentration can be realised by combining the particle charger and aFaraday cup electrometer (see, e.g., Ntziachristos et al., 2004).
The particle deposition can be expressed as the collection efficiency ηc or the particlepenetration Pi. The relation between the two is written as equation 12:
1i cP h= - (12)
While not necessarily intentionally used for particle collection, particle diffusion oftenneeds to be taken into account in the instrument response to include the effect of particlelosses due to diffusion. Even though the structure of the practical instrument can be morecomplicated, equations derived for transport efficiency through a straight tubular flowchannel are often used to model diffusion losses. Particle penetration through a straightcylindrical tube in laminar flow conditions was originally formulated by Gormely and Ken-nedy (1949). The transport efficiency is characterised by the dimensionless term ξ, whichis dependent on the particle diffusion coefficient Dp, the transport line length lt and thevolumetric sample flow rate through the line Qs:
p
s
D LQ
x p= (13)
For laminar flow conditions, the transport efficiency can be approximated with
2 43 3
3.66 22.3 57
1 2.56 1.2 0.177 0.010.819 0.0975 0.032 0.01
dPe e ex x x
x x x x
x- - -
ì - + + <ï= í+ + ³ïî
. (14)
Electrical particle deposition or migration is widely deployed in particle classification andcollection. For fine-particle classification, a differential mobility analyser (DMA; Knutsonand Whitby, 1975) is the most widely used instrument relying on electrical particle migra-tion. By combining the electrical classification and the electrical detection of particles, itis possible to achieve real-time particle size distribution measurement. Mirme et al.(1981), Tammet et al. (2002) and Biskos et al. (2005a) presented real-time instrumentsmeasuring the particle size distribution by combining electrical particle classification andelectrical particle detection. With more compact instrumentation such as, for instance,presented by Fierz et al. (2011), instead of measuring the full aerosol size distribution, a

17
median size of the distribution can be obtained by classifying the aerosol into two sizeclasses. In addition to collecting particles for detection, electrical particle collection canbe utilised to tailor instrument response for a specific purpose. This approach is used,for example, to modify the diffusion charger response closer to the LDSA concentration(Fissan et al., 2007) and to closer to number concentration (Ranjan and Dhaniyala, 2009).
The simplest electrical particle classifier is the zeroth order mobility analyser (for classi-fication and nomenclature see Tammet, 1970), which was used in Papers I, III and V.The aerosol particles enter the classification area of the analyser uniformly distributed,and a fraction of the particles is collected to the electrodes by the applied electric field.The particle penetration through the zeroth order mobility analyser depends on the limit-ing electrical mobility Z0 and the flow conditions. The term Z0 equals the minimum elec-trical mobility for which the geometry has zero penetration. The limiting electrical mobilityis specific to the geometry of the analyser; annular mobility analyser geometry can bewritten as equation 15:
0
ln
2
s
m a
o
a m
i
ss
QZ
l Vp
æ öç ÷è ø= (15)
The parameters in equation 15 are the volumetric flow rate Qs, the inner si and outer so
diameters of the flow channel, the length lma of the mobility analyser and the appliedcollection voltage Vma. For laminar flow conditions the particle collection efficiency ηma
can be expressed as equation 16:
0
pma
ZZ
h = , (16)
while in turbulent flow conditions the collection efficiency has the form of equation 17:
01P
ma
ZZeh
-
= - (17)
As seen from equations 15, 16 and 17, the particle collection characteristics of the zerothorder mobility analyser can be easily controlled by varying the applied collection voltage.
Particle inertial deposition can also be used for size measurement. Inertial separationtakes place when accelerated aerosol flow is forced to turn around an obstacle in theflow. While the small particles follow the streamlines of the flow, the large particles havinghigh enough inertia are separated from the flow and impact on the obstacle. This phe-nomenon is utilised in impactors, which are devices that collect particles larger than the

18
cut point diameter of the impactor. When multiple impactor stages are cascaded in series,each impactor stage collects particles of a certain size range. This technique has beenused to measure the particle size distribution since the first cascade impactors were de-veloped in the mid-20th century (Marple, 2004). A real-time aerodynamic size distributionmeasurement was realised in the ELPI by combining a particle charger, a cascade im-pactor and a multichannel charge measurement (Keskinen et al., 1992).
The cut point diameter d50% of the impactor determines the aerodynamic particle size, forwhich impactor collection efficiency is 50%. While in principle a theoretical value for thecut point of the impactor design could be obtained, usually values obtained from calibra-tion measurements are used in practice. For basic data reduction the cut point values ofthe used impactor stages are sufficient (Cooper and Guttrich, 1981); however, for moreadvanced use and for instrument response modelling, a fit for the measured collectionefficiency curve is needed. As it is not possible to obtain theoretical expression for thecollection efficiency curve, a fit formulated by Dzubay and Hasan (1990) is commonlyused instead. The fit, shown in equation 18, takes into account the slope of the curve,which is described by the parameter s.
12
50%1s
ia
dd
h
-é ùæ öê ú= + ç ÷ê úè øë û
(18)
The left pane of figure 2.4 shows particle penetration of the zeroth order mobility analyserused in Paper I. The measured values are shown together with curves fitted accordingto equation 14, for both singly charged particles and particles charged by the ELPIcharger. As can be expected from the equation, the particle penetration is lower for thecharged particles. The particle penetration fit for the impactor stage according to equa-tion 18 is shown on the right side in figure 2.4. This fit was used in Paper III to model thecombined effect of the inertial particle losses and the pre-cut cyclone on the instrumentresponse.

19
Figure 2.4. Particle penetration of the zeroth order mobility analyser on the left (adaptedfrom Paper I), and on the right, the penetration of a pre-cut cyclone modelled asan impactor stage in the response model presented in Paper III.
2.5 Charge measurement
Because the charge levels attainable by the aerosol particles in the aerosol charger arelow, a high-sensitivity electrometer is required for charge detection. A preamplifier stagerealised with an operational amplifier optimised for low input bias current acts as theheart of such electrometer. In this application, the key limiting parameters for the opera-tional amplifier are the input bias current and the input referred voltage and currentnoises. While the input bias current directly affects the electrometer offset reading, it alsocontributes to thermal drift. The input offset current is caused by the leakage currents inthe semiconductor pn-junctions in the input stage of the operational amplifier. While themodern operational amplifiers designed for very low input bias currents are constructedwith a metal oxide semiconductor (MOS) input stage, they still need to have protectivepn-junctions in the input pins to tolerate the electrostatic discharge (Franco, 1998). Gen-erally, with every ten-degree temperature change, the leakage current in the pn-junctionsdoubles. For this reason, the higher the input offset current at the room temperature, thehigher the thermal drift of the offset on the absolute scale.
The electrometer preamplifier circuit can be realised with resistive negative feedback ina circuit called the transconductance amplifier or with capacitive negative feedback inthe coulombmeter circuit (Keithley, 2004). The ideal circuits are shown in figure 2.5. Thetransconductance amplifier requires the use of a feedback resistor with very high re-sistance value. In the simplified circuit, shown on the left side in figure 2.5, the value of

20
the feedback resistor transfers directly to circuit gain by Ohm’s law. For instance, a 1 GΩfeedback resistor corresponds to a gain of 109 V/A. In this circuit, the thermal noise ofthe resistor, called Johnson noise, contributes significantly to the noise performance ofthe circuit. Additionally, large-valued resistors typically have significant thermal drift,which also needs to be addressed in the practical circuit. In the coulombmeter circuitshown on the right in figure 2.5, the feedback resistor is replaced by a small-valued ca-pacitor, thus eliminating the noise and thermal drift of the resistor. Since the output ofthis circuit is related to the integrated charge of the input current, the feedback capacitorneeds to be discharged repeatedly when measuring DC currents. Additionally, the leak-age current through the capacitor needs to be very low for voltages present in the circuit.Although the coulombmeter circuit seems tempting for the low noise application, thetransconductance amplifier is in practice more tolerant for the capacitances connectedto the input (Keithley, 2004). However, for the fixed operating surroundings of the aerosolinstrument, both approaches properly designed give sufficient performance.
Figure 2.5. Simplified electrometer amplifier circuits: the tranconductance amplifier onthe left and the coulombmeter circuit on the right.
While the particle charge measurement methods typically rely on particle collection, it isalso possible to construct an electrical aerosol instrument without particle collection. Bythis method, the pressure drop of the collection element, for instance a filter, is eliminated,providing the possibility to reduce power consumption by the flow system. Additionally,the need for instrument service is reduced, because of the lack of loading effects of par-ticle collecting. Lehtimäki (1983) presented an instrument that accomplished non-collec-tive electrical particle measurement. This same operation principle, called the escapingcharge technique (ECT), was used in the instruments studied in Paper II, Paper III and

21
Paper IV. In this measurement technique, the high voltage source of the corona dis-charge particle charger is isolated from the surroundings, and the charge carried awayby the particles from the corona source is measured. This approach requires an isolatedpower source with very high isolation resistance to supply the corona discharge in orderto keep the leakage currents below the measured current levels.
While the traditional filter-collection-based electrical measurement determines the totalcharge of the particles, the ECT method measures the charge particles acquire duringthe charging process. At first glance, this does not seem to be a major difference, butthe situation changes if there is a significant initial net charge on the particles. A sche-matic picture of the ECT method is presented in figure 2.6, showing the paths of thedifferent current components involved in the measurement. The primary measured cur-rent component originates from the charge the charger provides to the particles, markedas current Ipc. Some of the particles may deposit inside the instrument causing particlelosses, and if the particles carry a charge, they conduct current marked as componentIpl. A majority of the ions generated for the charging process, marked as current Ich, donot contribute to the actual charging process but are collected in the ion trap as currentIi. While not desirable, some of the ions may escape the ion trap and contribute to themeasured signal by a current component Iil. The particle initial charge, marked as currentcomponent Iic, also contributes to the measured signal, and the resulting current signalmeasured, Im, is the difference between the output current Iout and the particle initialcharge Iic. The power supply and return currents required for the charger and the ion trapsupply current are also marked on figure 3 as Ic, Ic’ and It. As stated earlier, the charger’scharging efficiency is relatively independent of the initial charge; however, the amount ofcharge transferred from the corona charger depends on the initial charge state of theparticles. When utilising the ECT measurement method, this may need to be taken intoaccount if the measured particles have significant net charge. This situation is, for in-stance, related to aerosol processes involving high temperatures, such as combustionor high-temperature nanomaterial production processes. The initial net charge levels are,however, typically quite low.

22
Figure 2.6. The current components related to ECT measurement.
Another way to accomplish non-collective charged particle detection is to use an induc-tive ring as first presented for single-particle detection by Gajewski and Szaynok (1981).Fierz et al. (2014) utilised this detection method for an aerosol instrument designed forultrafine particle concentration measurement. The design was based on a charger thatis repeatedly switched on and off. This causes the formation of clouds of charged parti-cles in the flow. When these clouds flow through a ring-shaped electrode, an electricaldisturbance is induced to the electrode. The magnitude of the disturbance is relative tothe total charge of the cloud, which in turn is related to the particle concentration andcharging efficiency. This method is also sensitive for the initial charge on the particles ifusing a conventional unipolar charger, but this shortcoming can be solved, for instance,by using a charger with alternating polarity.

23
3 Experimental response characterisation
For practical applications, the instrument’s overall response needs to be known. Ideally,a complete response model is formulated for the instrument that takes into account theeffect of each component included in the design. This response model can be used forinstrument development, instrument performance evaluation and measured data pro-cessing. While theoretical assumptions can be used for some of the components, it isdifficult to obtain an accurate theoretical estimation for charging efficiency. For this rea-son, experimental response characterisation is required for the instruments based on theelectrical detection of aerosol particles. To obtain the instrument response in the char-acterisation measurements, instrument output is compared to the concentration of thetest aerosol. The aerosol total number concentration is most often used for reference.The effect of the particle losses or the effect of the particle-collecting devices on theresponse can be obtained by measuring the particle penetration or the collection effi-ciency of the instrument. For the aerosol instruments, the response of the instrument ispresented as a function of particle size as the result from the characterisation measure-ments.
3.1 Methods based on monodisperse test aerosol
The preferred approach for aerosol instrument response measurement is to challengethe instrument to a monodisperse test aerosol of a known particle size and compare theoutput to the reference measurement. This is then repeated to cover the operational sizerange of the instrument. The main advantage in this approach is that, in the ideal case,measurement result is directly the instrument response as a function of particle size. Onthe downside, the available particle concentration is typically quite limited, which requiressufficient sensitivity from the tested instrument.
There are several ways to produce the monodisperse test aerosols (see, for instance,Berglund and Liu, 1973; Iida et al., 2014; Tavankoli et al., 2014). The choice of genera-tion method depends on the particle size range of interest. In the size range from a fewnanometres up to one micrometre, perhaps the most widely used method is to use aDMA (Knutson and Whitby, 1975) to select a narrow electrical mobility range for the testaerosol. This method has been used in Paper I, Paper III and Paper V. The measure-ment setup used in Paper III, shown in figure 3.1, represents a typical response meas-urement setup utilising the DMA. As a first step in the setup, a polydisperse primary testaerosol is generated. For this, a variety of aerosol generation methods can be used, and

24
the choice of method depends primarily on the preferred particle material. For liquids,droplet-like particles, aerosol nebulisers and atomisers or for narrower primary size dis-tribution, an evaporation-condensation generator (Liu and Lee, 1975) can be used. Asfor solid particle materials, thermal generation methods are suitable. After aerosol gen-eration, the primary aerosol is classified by the DMA to get the monodisperse test aerosol.A dilution air feed needs to be added to the classified aerosol flow after the DMA if thetotal sample flow required by the instruments exceeds the polydisperse flow of the DMA.After dilution, the sample flow needs to be thoroughly mixed before it is divided to theinstruments. A proper mixing and a good quality flow divider ensure equal concentrationsfor all flow branches. Although a dilution air feed is not always required, it is always agood practice to use a flow mixer before the flow divider. From the flow divider, one extraflow branch is used for the excess flow. Producing monodisperse test aerosol in excesshelps to maintain the flow balance of the setup.
Figure 3.1. An example of a measurement setup for the response characterisation withmonodisperse test aerosol (Paper III).
The two main problems in the DMA method arise from its operation principle. The DMAdoes not classify the particles according to their size, but their electrical mobility. Firstlythis means that all the neutral particles and also, because of the DMA construction, par-ticles of opposite polarity are lost. This limits the maximum available concentration of theclassified test aerosol. This is especially problematic for small particle sizes, since thecharging efficiency of the aerosol neutraliser used in the DMA decreases sharply withdecreasing particle size. The second problem is also related to charging probabilities. Asseen in equation 7, electrical mobility links the particle size and charge. Because theparticles entering the DMA are typically in charge equilibrium, the particles have a charge

25
distribution. For each particle size, there are certain amounts of neutral, singly, doublyetc. charged particles and the ratios depend on particle size. Based on this, for a givenparticle size there exists a certain amount of multiply charged particles in addition tosingly charged particles. The ratio between the singly charged and multiply charged par-ticles in the DMA output depends on the median size and geometric standard deviation(GSD) of the primary aerosol size distribution. For the smallest particle sizes this is nota major concern, as the probability for multiply charging is very low for small particles.However, for particles larger than approximately 30 nm, multiple charging may need tobe taken into account.
In the example setup shown in figure 3.1, the single charged aerosol reference (SCAR;Yli-Ojanperä et al., 2009) was used for the primary aerosol generation. The SCAR isbased on the condensational growth of mobility classified small seed particles, whichleads to a narrow particle size distribution and singly charged particles. While the gener-ated aerosol is not as monodisperse as with the DMA method, the distribution would besufficiently narrow for the response measurement even without the added DMA. How-ever, when combining the SCAR and the DMA in the monodisperse test aerosol gener-ation, a truly monodisperse test aerosol can be obtained.
3.2 Method based on polydisperse test aerosol
In many cases, it is not possible to produce monodisperse test aerosols in sufficientconcentrations for the response measurement. In this case, the polydisperse calibrationmethod needs to be used. In this method the tested instrument is challenged to differentpolydisperse test aerosol size distributions and the output is recorded together with thesize distribution measurement. In this approach, there are several possibilities for testaerosol generation and the size distribution measurement. However, a narrow size dis-tribution in the test aerosol and a good size resolution in the size distribution measure-ment are preferred. The polydisperse response characterisation method was used inPaper II and Paper IV. As an example, the measurement setup used in Paper IV ispresented in figure 3.2. In this setup, a modified diesel fuel–burning air heater (Högströmet al., 2012) was chosen for the aerosol generator because the characterised instrumentwas intended primarily for measuring soot-like exhaust emission particles. For the sizedistribution measurement, a scanning mobility particle sizer (SMPS; Wang and Flagan,1990) was used in the example setup. As the generated test aerosol concentration maybe very high, a dilution system is usually required for the reference instruments. In themeasurement setup shown in figure 3.2, two ejector diluters before the SMPS and anadditional third before the CPC were required to bring the test aerosol concentrationwithin the measurement range of the instruments.

26
Figure 3.2. Response measurement setup used in Paper IV, for obtaining the instrumentresponse with polydisperse test aerosol.
While it is also usually possible to obtain the total number concentration from the particlesize distribution measurement, it is a good practice to use a separate instrument for thetotal number concentration measurement. For instance, the accuracy of the SMPS in theconcentration measurement is sensitive to the flow balance of the DMA. While not sig-nificantly affecting size distribution measurement accuracy, a small imbalance in theDMA sheath flow can lead to a significant error in the total concentration measurement.When using a separate and preferably calibrated CPC parallel to the SMPS, the concen-tration measurement accuracy can be greatly improved.
The main problem in the polydisperse calibration method is that the measurement resultdoes not directly describe the instrument response as a function of the particle size. Inorder to obtain the response, a model for instrument operation is needed together with afitting routine, where the modelled instrument output is compared to the measured output.The best fitting values for the response model parameters are determined, for instance,by minimising the squares sum of the difference.

27
3.3 Temporal performance characterisation
The time resolution of an instrument can be expressed either as the time constant τ oras the rise time tr. The former corresponds to the relaxation time constant of the expo-nential decay. The latter is usually expressed as the 10–90% rise time, which corre-sponds to the time required for the signal to change from 10% to 90% of the final valuewhen challenged to a step input. For an exponentially changing signal output, these twovalues are proportional. These numbers describe the instrument time response suffi-ciently for cases in which measured signal changes are much slower than instrumenttime response. When the time scale of the signal change approaches the time constantof the instrument, or when the exact temporal nature of the signal is of interest, moredetailed information on the instrument time response is required. With the help of theinstrument’s impulse response, the instrument time response effect can be compensatedfor in the measured output by deconvolution. This applies to cases in which the signalchanges are slower than the instruments’ time response.
The instrument’s impulse response can be obtained by measuring the instrument outputduring fast signal impulses. For aerosol instruments, this could be accomplished by gen-erating a narrow burst of aerosol particles, by spark ignition (Schwyn et al., 1988) or laserablation (Ullmann et al., 2002), for instance. Since the primary particle size produced byboth of these methods is typically quite small, it might be challenging to get sufficientsignal for measurement. For this reason, it is often more practical to obtain the impulseresponse by first measuring the instrument’s step response. To produce the step re-sponse, a sharp step in the measured aerosol concentration is required; then the instru-ment impulse response can be obtained by differentiating the measured step response.
An example of the temporal performance characterisation was presented in Paper IV, inwhich instrument time resolution was evaluated by the step response measurement. Inthe measurement setup, a sharp step in aerosol concentration was obtained by introduc-ing a high velocity dilution air stream towards the sensor inlet. The used dilution air feedsetup is shown in figure 3.3, in which the dilution air feed was controlled by a fast-actingmagnetic valve. The dilution air feed rate was set high enough to ensure fast transient inthe test aerosol concentration.

28
Figure 3.3. Dilution air feed setup used in the step response measurements presented inPaper IV.

29
4 Instrument design and performance
The instrument design and performance evaluation are important steps in the instrumentdesign process. Aspects, such as the operational surroundings, the targeted applicationand the desired measurement performance needs to be taken into account. Performancecharacterisation is needed to verify the correct operation of the instrument and to findout the instrument response. In the following the key design aspects and the perfor-mance of the instruments included in this thesis are discussed.
4.1 Real-time particle effective density measurement
The particle effective density combines three different parameters describing the mor-phology of fractal-like particles: bulk density, primary particle size and fractal dimension.With the help of effective density, one of these parameters can be obtained if the twoother parameter values are known or can be approximated. For effective density meas-urement, mobility and aerodynamic particle diameters must both be measured. This canbe accomplished, for instance, by using DMA and an impactor in series (Kelly andMcMurry, 1992) or by using SMPS and ELPI in parallel (Ristimäki et al., 2002). Both ofthese methods require a rather complicated setup for the measurement.
In Paper I, a new add-on module for the Electrical Low-Pressure Impactor was intro-duced to allow real-time particle effective density measurement. The designed modulereplaces the Classic ELPI’s (Dekati ltd., Finland) upper impactor stages with a mobilityanalyser, which adds mobility size information to the ELPI’s aerodynamic size distribu-tion measurement. The mobility analyser and the impactor arrangement is shown in fig-ure 4.1. Particle effective density is obtained, with the help of equation 19, by comparingthe mobility median size dim, acquired from the mobility measurement, to the aerody-namic median size dia from the impactor measurement. All the necessary signals arerecorded in one-second time resolution, and the data processing can be done online,which enables real-time effective density measurement.
( )( )
20
2ia c ia
effim c im
d C dd C d
rr = (19)

30
Figure 4.1. Cross section of the mobility analyser and the ELPI impactor arrangement de-signed for the real-time particle effective density measurement. (Adapted fromPaper I)
The mobility median size measurement is based on measurement of the current fromthe particles collected in the mobility analyser and comparing that to the total currentmeasured. To link this measured mobility analyser current fraction to particle mobilitymedian size, the mobility analyser’s particle collection efficiency is needed. Since themobility analyser is placed after the ELPI charger, the increased charge level of the par-ticles’ effect on collection efficiency needs to be taken into account. To accomplish this,mobility analyser collection efficiency was first measured for singly charged particlesclassified by a DMA. The measured collection efficiency was compared to the theoreti-cally predicted collection efficiency to verify mobility analyser operation, then the collec-tion efficiency measurement was repeated for monodisperse particles charged by theELPI charger. From this, a fit for the particles’ effective average charge was obtained.With this information, it was possible to find a relation between the measured mobilityanalyser current fraction and the polydisperse size distribution mobility median size.
A flow chart of the data processing routine is presented in figure 4.2, showing the instru-ment components and the key parameters related to the measurement. As the aerosol

31
flows through the ELPI charger and the particles are charged, the number size distribu-tion marked as N(db) converts to the current size distribution I’(db). Both these size dis-tributions can be expressed either as the function of the mobility particle size db or as thefunction of the aerodynamic particle size da. After the charger, a fraction of the particlesis collected in the mobility analyser, and the current from the collected particle fraction ismeasured. The remaining particles, marked as current size distribution I(db), continue tothe impactor, where they are classified, and as a result, current size distribution I(da) isobtained. The charger efficiency Ech(db), the average number of charges per particlenave(db) and the mobility analyser collection efficiency ηma(db) are all functions of the par-ticle mobility diameter, whereas the impactor classifies the particles according to theiraerodynamic diameter. To obtain particle effective density, the mobility analyser’s cur-rent fraction is first converted to the mobility median diameter dim with the help of thesimulated relation between the two. This median diameter is related to the current sizedistribution I’(db). To find the corresponding aerodynamic median diameter, the mobilityanalyser collection efficiency needs to be compensated for in the impactor’s current sizedistribution. From the compensated aerodynamic current size distribution I’(da), the aer-odynamic median diameter dia is obtained, and the resulting particle effective density isobtained with the help of equation 19. Since particle effective density is required in orderto link mobility analyser collection efficiency to the impactor’s aerodynamic current dis-tribution, an iterative calculation is required. For the iteration, unit density is used for theinitial approximation; the last iteration round’s effective particle density is returned as theresult.

32
Figure 4.2. A flow chart of the data processing routine used in the particle effective densitymeasurement in Paper I.
As the added mobility analyser replaces the impactor’s upper stages, the operationalaerodynamic size range is narrower than in the original ELPI instrument. The mobilitymeasurement’s size range is limited by the particle-charging properties of the ELPIcharger. With increasing particle size, the the rate of increase in the average number ofcharges per particle is greater than the rate of the decrease in the particle mechanicalmobility; this leads to a loss of resolution in the mobility analyser measurement at largeparticle sizes. Because of these limitations, the instruments operational particle sizerange is from 30 nm up to 200 nm for mobility size distribution count median size. Fur-thermore, this method is only applicable for single modal size distributions, and an ap-proximation of the distribution GSD is needed for the data processing.
Example data from the real-time effective density measurement for different laboratorytest aerosols are presented in figure 4.3. As seen from the figure, the obtained effectivedensity values correlate well with the reference density measurement. For the liquid aer-osol particles (DOS, Santovac, Fomblin), variation in both density measurements wasvery low and the obtained values are close to the material bulk values. For the solid silver

33
particles, variation was increased in both measurement methods, and the obtained val-ues differ from the bulk density. This difference may result from the non-spherical shapeof the particles or from impurities, such as those caused by particle surface oxidation.Since the developed method is sensitive for detecting particle morphology changes, thesame operating principle was used in a simplified instrument developed for monitoring ananoparticle production process stability (Juuti et al., 2016).
Figure 4.3. Measured particle effective densities for different laboratory test aerosols. Thereal-time effective density measurement is compared to the reference densitymeasurement. (Paper I)
4.2 Exhaust emission measurement
The exhaust gas flow of an engine or a vehicle is at an elevated temperature and con-tains water from the combustion. Because of the high temperature, sample conditioningsystems are required for particle emission measurement, in order to bring the sample

34
temperature to the particle measuring instruments’ operational range. These systemsusually lower the temperature by diluting the sample, to avoid water condensation andthermophoretic particle losses. The use of sample conditioning systems adds to meas-urement setup complexity considerably.
The Electrical Tail Pipe Sensor (ETaPS, Tikkanen et al., 2007), introduced in Paper II,and the PPS-M sensor (Ntziachristos et al., 2011, Lanki et al., 2011), characterised inPaper III, are both initially designed for particle emission measurement directly from theexhaust gas flow. A schematic view of the sensor construction and of key operationalcomponents are shown in figure 4.4. While both instruments are based on the ECTmeasurement method, the designs are somewhat different. The ETaPS is based on asensor probe, which installs directly into the exhaust flow. This probe consists of a diode-type corona discharge charger surrounded by perforated walls. When placed in the ex-haust flow, a part of the flow travels through the sensor probe. The particles in the floware charged inside the probe, and the charge carried away by the particles is measured.On the other hand, the PPS-M is an instrument that connects to the exhaust line by twoflow connections, one for the sample inlet and the other for returning the sample andexcess flows to the exhaust line. By returning the flow back to the exhaust line, the pres-sure difference and the power demand required for the sample flow is minimised. Insidethe PPS-M, there is a sheath air-assisted corona discharge charger, which also suppliesthe necessary pump flow for the integrated ejector pump. The design also includes anintegrated mobility analyser acting simultaneously as an ion trap.
Figure 4.4. A schematic view of the instrument construction showing the key components ofthe ETaPS and PPS-M instruments. The ETaPS is on the left and the PPS-M ison the right (adapted from Paper III).

35
Response characterisation measurements and a response model was presented forboth sensors. For the ETaPS, the response was measured in a flow circulating meas-urement setup, using polydisperse test aerosol. This arrangement was chosen becausethe sensor’s high flow velocity range required a high volumetric flow rate. The responsewas characterised over the flow velocity range of 1 to 36 m/s. The fitted response modelwas based on the combined effect of the particle diffusion and field charging (equations9 and 10) with a volumetric flow rate approximation through the charging zone of thesensor, according to equation 20.
( )( )2min
14ETaPS duct flow d fR d R V V n n ep= - + (20)
In equation 20, the volumetric flow rate approximation through the charging region wasbased on the assumption that the flow velocity in the charging region follows the flowvelocity inside the flow duct Vflow but is decreased by the factor R. An additional term Vmin
was included to simulate particle losses inside the sensor with low flow velocities. Theremaining parameters in equation 20 are flow duct diameter dduct and the elementarycharge e. The Nit product, required by the charge number estimation, was obtained ac-cording to equation 21 by using the approximated flow velocity inside the charging region,the effective length of the charging region Leff and the estimated ion concentration Ni.
( )min
i effi
flow
N LN t
R V V=
-(21)
Additionally, an estimate for an average electrical field Eave during the particle chargingwas required for field charging. Table 4.1 shows the fitted parameter values required forthe response model. The effect of the exhaust flow velocity to the ETaPS sensor re-sponse is shown in figure 4.5, which is simulated with the response model for singlemodal lognormal size distributions with count median diameters of 0.06, 0.08 and0.10 µm.

36
Table 4.1 Fitted parameter values in the ETaPS sensor response (Paper II)
Description Symbol Value
Effective length of the charging region Leff 6.8·10-3 m
Average electric field Eave 2.07·10-5 V/m
Ion concentration Ni 1.28·1015 1/m3
Minimum flow velocity Vmin 1.6 m/s
Figure 4.5. The flow velocity dependence of the ETaPS sensor response for lognormal sizedistributions. The response of three different size distributions having count me-dian sizes of 0.06, 0.08 and 0.10 µm are shown. The geometric standard devia-tion used in the simulation was 1.8. (Adapted from Paper II)

37
In the case of the PPS-M sensor, the response was characterised by using monodis-perse test aerosol. In the measurement setup, the monodisperse particles were neutral-ised prior to the measurement and a calibrated CPC was used as the reference instru-ment. Since the PPS-M mobility analyser was integrated to the instrument, it was notpossible to separate the analyser from the instrument for the response measurement.Instead, analyser response was measured by using singly charged monodisperse parti-cles and measuring the charge collected by the mobility analyser with the chargerswitched off and comparing the measured current to the number concentration meas-ured by the reference CPC. The response model of the PPS-M was based on chargerefficiency and particle penetration through the sensor, as written in equation 22
PPS M d ma il ch sR P P P E eQ- = (22)
Charging efficiency Ech is a major contributor in the instrument response. For the re-sponse model, a power function fit of equation 23 was used to describe the effect of thecharger. Since in the PPS-M, the mobility analyser is also used as the ion trap and it isnot operated at a fixed collection voltage, the effect of changing collection voltage tocharging efficiency was included in the fit.
( ) ( )( )6 4 2 1.05, 1.05 10 7.23 10 ln 1 1.12 10ch p ma ma pE d V V d-= × - × + × (23)
In order to model particle penetration, the effects of the diffusion losses, mobility analyserpenetration and the combined effect of the pre-cut cyclone and the inertial particle losseswere taken into account. An estimation for the diffusion losses was obtained with a com-putational fluid dynamics (CFD) simulation. A transport efficiency Pd based on equation14, was fitted to the simulation results with a value of 1.79·105 s/m2 used for u0.
( ) ( )2 4
3 3
0 0 0
0 0 0 0
3.657 22.3 570
1 2.56 1.2 0.177 0.03
0.819 0.097 0.032 0.03p p p
p p p pd u D u D u D
p
u D u D u D u DP
e e e u D- - -
ì - + + <ï= í+ + ³ïî
(24)
A voltage-dependent fit for the measured mobility analyser penetration, Pma, was con-structed according to the turbulent mobility analyser penetration shown in equation 17.For practical reasons, the parameters related to the mobility analyser’s mechanical de-sign combined to a single constant K, leaving the sample and pump flow rates Qs andQp for the equation. A value of 1.37 1/m was fitted to the constant K, based on the mo-bility analyser collection efficiency measurements.

38
( ) ( )p ma
s p
Z VQ Q K
ma pP Z e-
+= (25)
Since the particles are charged before the mobility analyser, the effective average chargeaffects mobility analyser penetration. A particle average charge approximation, shown inequation 26, was constructed from the charger efficiency fit by approximating the particlepenetration through the charging zone to one. Because of the electrical detection, theaverage charge minimum value was limited to one.
( )8
7 1.05 8
1, 1.63 10
6.13 10 , 1.63 10p
ave pp p
d mn d
d d m
-
-
ì < ×ï= í× ³ ×ïî
(26)
The pre-cut cyclone’s inertial losses and penetration were modelled with the term Pil. Thefit, shown in equation 27, is based on equation 18, which is an approximation used todescribe the operation of inertial impactors.
( ) 2.067
116.36 101
il a
a
P dm
d
-= -
æ ö×+ ç ÷è ø
(27)
The components of the response model are shown in figure 4.6 for unit density particles,with a mobility analyser collection voltage of 400 V. The components included in theparticle penetration fit are shown separately on the left side, and the combined total par-ticle penetration Ptot and the charger efficiency fit are shown on the right side.

39
Figure 4.6. The components used in the response model of the PPS-M sensor. The diffusionlosses Pdl, inertial losses Pil and the mobility analyser collection efficiency, allexpressed as penetrations, are shown on the left. The charger efficiency Ech, thetotal particle penetration Ptot and the resulting instrument response RPPS-M areshown on the right.
A comparison between the characterisation measurement results and the fitted responsemodel is presented in figure 4.7. The measured data are shown as points for three dif-ferent mobility analyser collection voltages, and the response model is shown as a solidline. Despite the approximations made in the response model, the fitted model is in goodagreement with the experimental measurement results.

40
Figure 4.7. The measured response of the PPS-M sensor shown together with the fitted re-sponse model. Both are shown for different mobility analyser collection voltages(adapted from Paper III).
The obtained models for both instruments are useful in interpreting the measurementresults. Since the regulatory limits set for engines and vehicle particle emissions areexpressed as number and mass emission, it is practical to convert the measurementresults to units compatible with regulations. With the help of the models, it is possible toobtain conversion factors needed for this conversion for the approximated particle sizedistributions. A good approximation for the distributions can be obtained, since the sizedistributions in this application remains in a relatively narrow range (see, e.g., Harris andMaricq, 2001). Another approach was presented in Amanatidis et al. (2014), in which amethod using two PPS-M sensors in parallel with different mobility analyser collectionvoltages for obtaining a real-time estimation on the size distribution median size waspresented.

41
4.3 Ultra-fast on-board emission measurement
The emission regulations require the in-use monitoring of the operation of the exhaustafter treatment devices; this creates a demand for emission-related instrumentation foron-board use. The prototype instrument presented in Paper IV targets an on-board di-agnostics (OBD) sensor to measure particle emissions. The presented OBD sensor isessentially a miniaturised version of the PPS-M and is based on the same operationprinciple. In Paper IV, the response characterisation, together with vehicle and enginedynamometer test measurements, was presented. The sensor design showing the com-ponents and operational parameters is presented in figure 4.8. The prototype’s overalldimensions were 190 mm in length and 36 mm in diameter at the largest point.
Figure 4.8. Cross section of the high speed OBD sensor showing the key components andoperational parameters (Paper IV)
As a side effect of the minimisation, the sample volume inside the sensor decreasedsubstantially. This led to a faster gas exchange rate inside the sensor, which in turnenabled a faster time response for the sensor measurement. The temporal performanceof the sensor was characterised in the laboratory measurements by the step responsemeasurement. The instrument impulse response fit was constructed from the measuredstep response. Both the measured step response and the impulse response fit are shown

42
in figure 4.9. Based on these results, the time constant of the prototype sensor was 18 ms,which corresponds to a value of 40 ms for 10–90% rise time. While comparable temporalperformance was demonstrated by de la Mora et al. (2017), the obtained time resolutionexceeds that of conventional aerosol instruments significantly.
Figure 4.9. Step (left) and impulse (right) responses for the high-speed OBD sensor. (Pa-per IV)
The fast time response was also demonstrated in the engine dynamometer measure-ments presented in Paper IV. With the sensor measurement, it was possible to distin-guish the poor burning caused by a deliberately delayed fuel injection in one cylinderwhen running a six-cylinder diesel engine at 350 revolutions per minute (RPM). The ef-fect of the delayed injection is shown in figure 4.10, which shows a clear difference inthe signal waveform when comparing signals measured from the delayed injection con-ditions to the engine’s normal operation conditions. The individual power stroke emissionburst measurement required unconventional data processing compared to conventionalaerosol instrumentation. To obtain the average, the raw data was divided into sectionsand the sections were aligned together on the time axis with the help of the timing signal,which was measured from the engine. After this, an average waveform was calculatedfrom the sections to form the result, shown in figure 4.10, for both normal engine opera-tion and for delayed injection. The points of the exhaust peaks of the different cylindersare marked in the figure with the dashed vertical lines. As a result of the poor burn, anincreased signal from one cylinder and an increase in the average signal can be seen inwaveforms presented in the figure.

43
Figure 4.10. Demonstration of the high speed OBD sensor’s temporal performance. The ef-fect of the delayed injection in one cylinder compared to the engine’s normaloperation. Measured for a medium speed diesel engine running at 350 RPM with62 kW load. The exhaust peak times from the different cylinders are marked withthe vertical dashed lines. (Adapted from Paper IV)
4.4 Flow independent concentration measurement
In conventional diffusion charging–based instruments, the measured signal is dependenton the sample’s volumetric flow rate. For this reason, the instruments typically operatewith a fixed sample flow rate, which requires the means to stabilise the flow rate. Lookingat the response of the diffusion charger (equation 2), it seems that instrument responseis linear to the sample flow rate. On the other hand, based on equations 16 and 17, asimple mobility analyser’s particle collection characteristics are inversely proportional tothe sample flow rate when the collection efficiency is below one. This implies that themobility analyser’s measured current connected after the diffusion charger would be in-dependent of the sample flow rate. While the direct effect of the sample flow rate cancels

44
out from the instrument response, secondary effects on charging efficiency remains. Withincreased flow rate, the charger’s particle residence time decreases. This decreases theaverage charge on the particles nave, but at the same time, it increases the particle pen-etration through the charger.
As the particle charge also affects collection efficiency, the resulting response of thediffusion charger and the mobility analyser combination can be approximated to be pro-portional to the product of Pchnave
2. Since the effect of the varying sample flow rate affectsin opposite directions in the particle penetration and the particle average charge, a flowrate range can be found, where the response is relatively independent of the flow rate.Following this thought, normalised instrument response approximations are plotted infigure 4.11 for both conventional filter–based instrument Rf and mobility analyser-basedinstrument Rma. In these response plots, mobility analyser collection efficiency was ap-proximated according to equation 16 and charging efficiency approximation was basedon the diffusion charging (equation 9) and by modelling charger electrical particle losseswith a mobility analyser operated in turbulent flow conditions (equation 17). Based onthese very rough estimations, the instrument response flow dependence for the diffusioncharger and mobility analyser combination is reduced to approximately ±10% over thenormalised flow rate range from 0.4 to 3.
Figure 4.11. Normalised approximations on the instrument response as a function of thesample flow rate for two different diffusion charger–based instruments. The re-sponse of an instrument using a Faraday cage filter the particle detection (Rf)compared to the instrument, where particle charge is detected by a mobilityanalyser (Rma).

45
The discovery of a possible nearly flow rate–independent response led to the flow inde-pendent electrical aerosol sensor (FIAS) prototype, which was presented in Paper V. Aschematic view on the instrument construction is shown in figure 4.12. The constructedinstrument prototype consisted of a small-sized diode type corona discharge diffusioncharger, an ion trap and the mobility analyser used in Paper I. Like the other instrumentstreated in this thesis, this design was tested and characterised in laboratory measure-ments and the instrument response’s flow rate dependence was studied.
Figure 4.12. Schematic view of the FIAS instrument construction (Paper V).
The performance of the instrument and the effect of the sample flow rate on the responseare shown in figure 4.13. The left side of the figure shows the measured response fordifferent sample flow rates ranging from 3.0 to 10 lpm. The fitted response obtained fromthe response characterisation measurement results is shown for reference. The rightside shows the normalized instrument response as the function of the sample flow ratefor selected particle sizes. The shaded area in both plots represents ±15% deviation fromthe average response. As shown in the right panel, the instrument response remainswithin 15% in the tested sample flow rate range apart from the lowest particle size withthe lowest flow rate.

46
Figure 4.13. On the left side: Response of the FIAS prototype, measured for different sampleflow rates. On the right side: The flow dependence of the normalised FIAS re-sponse for selected particle sizes. (Adapted from Paper V)
Instrument sensitivity is sacrificed in this design, since only part of the particles partici-pate in the measurement. This is, however, acceptable for low-cost aerosol instrumen-tation, where flow generation and monitoring cost may be an issue. The flow rate inde-pendence and the open flow through sensor construction promotes the use of a low costfan for providing the necessary sample flow, even without flow rate monitoring. The de-tection limit of the demonstrated prototype sensor for 100 nm particles with a one-secondtime resolution was approximately 400 1/cm³, which corresponds to a 10 fA signal. Thisis sufficient for instance for practical outdoor air quality monitoring.

47
5 Summary
Corona discharge–based diffusion charger, combined with particle charge measurement,is a straightforward way to produce simple and affordable instruments to measure theconcentration of ultrafine aerosol particles. The operating principle allows real-timemeasurement with a good temporal resolution, which makes it possible to use theseinstruments even for monitoring fast concentration transients. The diffusion charging–based instruments typically offer good repeatability and reliability with a sensitivity ade-quate for most applications. For the aerosol instruments based on electrical detection ofparticles, instrument response is the link between measured aerosol concentration andthe electrical current measured as output. The response provides useful information onfor instrument development, performance evaluation and processing of the measureddata.
In order to obtain instrument response, characterisation measurements are required. Inthese measurements, the instrument is challenged to a test aerosol, and the measuredoutput is compared to the reference measurement. In a typical outcome, the measuredresponse as the function of particle size is obtained. Ideally, the test aerosol should betruly monodisperse for data processing simplicity, but polydisperse test aerosols can alsobe used in the characterisation measurements. With polydisperse test aerosols, a fittingroutine and an approximation on the functional form of the response are usually requiredfor data processing.
The market for cost-effective instruments to measure ultrafine particle concentration isgrowing. The increased interest towards the air quality measurement networks, drivenby the concern on the air quality of urban areas, increases the demand for reliable andcost-effective ultrafine particle concentration monitoring instruments. The requirementsfor portable and in-use vehicle emission measurements, which are set by regulation,further increases the demand for simplified aerosol instruments. In addition to the airquality–related aerosol measurement, many applications require more detailed infor-mation on ultrafine particles. For instance, applications involving engineered nanoparti-cles would benefit from instruments providing key information on the produced nano-material. To support simplified aerosol instrumentation development, the publications in-cluded in this thesis studied five different instruments, ranging from commercial instru-ments to early prototypes.

48
In Paper I, the presented modification to the ELPI added the possibility of real-timemeasurement of particle effective density; this was accomplished by adding a mobilityanalyser as a part of the ELPI impactor. This new instrument was tested in laboratorymeasurements, in which the resulting particle effective density values were in goodagreement with the reference method. A further development of this operating principleresulted in a sensor-type instrument for monitoring the nanoparticle synthesis processes.
Three sensor-type instruments were studied in the following three publications, whichwere targeted for particle concentration measurement directly from the exhaust flow. InPapers II and III, the instrument design targeted engine laboratory work and portableemission measurement applications. For both instruments, a response model based ontheoretical instrument response was constructed and fitted to the laboratory characteri-sation measurement results. The miniaturised instrument presented in the Paper IV sen-sor was in turn targeted for OBD applications. As a side effect of miniaturisation, thissensor had very good temporal performance. This performance was characterised in thelaboratory measurements and was demonstrated in the engine laboratory measure-ments.
Paper V presented a new approach for building a diffusion charging–based aerosol in-strument with a response that is relatively independent of the sample flow rate. Basedon the laboratory test measurements for the prototype instrument, the response re-mained within ±15% of the sample flow rate, ranging from 3.0 to 10 lpm. This new ap-proach has the potential to be a starting point for low-cost sensor development for aero-sol concentration monitoring.

49
References
Agarwal, J. K., Sem, G. J., 1980. Continuous flow, single-particle-counting condensation nucleuscounter, J. Aerosol Sci., Vol. 11, pp. 343-357, doi: 10.1016/0021-8502(80)90042-7.
Allen, M. D. and Raabe, O. G., 1982. Re-evaluation of millikan's oil drop data for the motion ofsmall particles in air. J. Aerosol Sci., 13, pp. 537 – 547, doi: 10.1016/0021-8502(82)90019-2
Alonso, M., Martin, M. I. and Alguacil, F. J., 2006. The measurement of charging efficiencies andlosses of aerosol nanoparticles in a corona charger, Journal of Electrostatics 64, pp. 203–214,doi: 10.1016/j.elstat.2005.05.008
Amanatidis, S., Maricq, M. M., Ntziachristos, L. and Samaras, Z., 2016. Measuring number, mass,and size of exhaust particles with diffusion chargers: The dual Pegasor Particle Sensor, J.Aerosol Sci. 92, pp. 1–15, doi: 10.1016/j.jaerosci.2015.10.005
Berglund, R.N., and Liu, B.Y. H., 1973. Generation of monodisperse aerosol standards. Environ.Sci. Technol., 7, pp. 147–153, doi: 10.1021/es60074a001
Biskos, G., Reavell, K. and Collings, N., 2005a. Description and Theoretical Analysis of aDifferential Mobility Spectrometer, Aerosol Sci. Technol., 39:6, 527-541, doi:10.1080/027868291004832
Biskos, G., Reavell, K. and Collings, N., 2005b. Unipolar diffusion charging of aerosol particles inthe transition regime, J. Aerosol Sci. 36, pp. 247–265, doi: 10.1016/j.jaerosci.2004.09.002
Boelter, K. J. and Davidson, J. H, 1997. Ozone Generation by Indoor, Electrostatic Air Cleaners,Aerosol Science and Technology, 27:6, 689-708, doi: 10.1080/02786829708965505
Bricard, J., Delattre, P., Madelaine, G., and Pourprix, M., 1976. Detection of Ultra-Fine Particlesby Means of a Continuous Flux Condensation Nuclei Counter. In Fine Particles, Liu, B.Y.H. ed.Academic Press, New York, 565 – 580, ISBN: 978-0124529502
Brown, D., Wilson, M., MacNee, W., Stone, V., Donaldson, K., 2001. Size-dependentproinflammatory effects of ultrafine polystyrene particles: a role for surface area and oxidativestress in the enhanced activity of ultrafines. Toxicol. Appl. Pharmacol. 175 (3), 191-199, doi:10.1006/taap.2001.9240
Buonanno, G., Morawska, L. and Stabile, L., 2011. Exposure to welding particles in automotiveplants J. Aerosol. Sci., 42, pp. 295 – 304, doi: 10.1016/j.jaerosci.2011.02.003
Büscher, P., Schmidt-Ott, A. and Wiedensohler, A, 1994. Performance of a unipolar ”square wave”diffusion charger with variable nt-product, J. Aerosol Sci., 25, pp. 651-663, doi: 10.1016/0021-8502(94)90006-X

50
Cheng, S.H., Ranade, M.B. and Gentry, J.W., 1997. Experimental Design of High VolumeElectrostatic Charger. Aerosol Sci. Technol. 26:5 pp. 433–446, doi:10.1080/02786829708965443
Choi, Y. and Kim, S. (2007). An Improved Method for Charging Submicron and Nano Particleswith Uniform Charging Performance. Aerosol Sci. Technol. 41:3 pp. 259–265,10.1080/02786820601148262
Chow, J. C., 1995. Measurement Methods to Determine Compliance with Ambient Air QualityStandards for Suspended Particles, J. Air Waste Manag. Assoc., 45:5, 320-382, doi:10.1080/10473289.1995.10467369.
Cooper, D. W., and Guttrich, G. L., 1981. A study of the cut diameter concept for interpretingparticle sizing data. Atmos. Environ., 15, pp. 1699–1707, doi: 10.1016/0004-6981(81)90156-6
Cunningham, E., 1910. On the Velocity of Steady Fall of Spherical Particles through Fluid Medium.Proc. R. Soc. Lond. A, 83, pp. 357 - 365, doi: 10.1098/rspa.1910.0024
Davison, S. W., Hwang, S. Y., Wang, J., and Gentry, J. W., 1985. Unipolar Charging of UltrafineParticles by Diffusion of Ions: Theory and Experiment. Langmuir 1985:1, pp. 150-158, doi:10.1021/la00061a027
Dzubay, T. G., and Hasan, H., 1990. Fitting Multimodal Lognormal Size Distributions to CascadeImpactor Data. Aerosol Sci. Technol., 13:2, pp. 144–150, doi: 10.1080/02786829008959432
EU, 2008. Directive 2008/50/EC of the European Parliament and the Council of 21 May 2008 onAmbient Air Quality and Cleaner Air for Europe.
Fierz, M., Houle, C., Steigmeier, P., and Burtscher, H., 2011. Design, Calibration, and FieldPerformance of a Miniature Diffusion Size Classifier. Aerosol Sci. Technol., 45:1, pp. 1–10,doi:10.1080/02786826.2010.516283
Fierz, M., Meier, D., Steigmeier, P., and Burtscher, H., 2014. Aerosol Measurement by InducedCurrents. Aerosol Sci. Technol., 48:4, pp. 350–357, doi:10.1080/02786826.2013.875981
Fissan, H., Neumann, S., Trampe, A., Pui, D., Shin, W., 2007. Rationale and principle of aninstrument measuring lung deposited nanoparticle surface area. J. Nanopart. Res. 9 (1), pp.53-59, doi: 10.1007/s11051-006-9156-8
Flagan, R. C., 1998. History of Electrical Aerosol Measurements. Aerosol Sci. Technol. 28:4, pp.301-380, doi: 10.1080/02786829808965530
Franco, S., 1998. Design with operational amplifiers and analog integrated circuits, 2nd ed.,International ed. McGraw-Hill companies Inc., USA, ISBN: 0-07-115722-0
Gajewski, J. B. and Szaynok, A., 1981. Charge Measurement of Dust Particles in Motion. J.Electrostat., 10, pp. 229 – 234, doi: 10.1016/0304-3886(81)90047-4

51
Geiss, O., Bianchi, I. and Barrero-Moreno, J., 2016. Lung-deposited surface area concentrationmeasurements in selected occupational and non-occupational environments. J. Aerosol Sci.,96, pp. 24 – 37, doi: 10.1016/j.jaerosci.2016.02.007
Gormely, P. G., and Kennedy, M., 1949. Diffusion from a Stream Flowing through a CylindricalTube. Proc. R. Irish Acad., 52, pp. 163–169
Harris, S. J. and Maricq, M. M., 2001. Signature size distributions for diesel and gasoline engineexhaust particulate matter, J. Aerosol Sci. 32, pp. 749 – 764, doi: 10.1016/S0021-8502(00)00111-7
Hering, S. V., Stolzenburg, M. R., Quant, F. R., Oberreit, D. R. and Keady, P. B., 2005. A Laminar-Flow, Water-Based Condensation Particle Counter (WCPC), Aerosol Sci. Technol., 39:7, pp.659-672, doi: 10.1080/02786820500182123
Hewitt, G. W., 1957. The Charging of Small Particles for Electrostatic Precipitation, AIEE Trans.76, pp. 300–306, doi: 10.1109/TCE.1957.6372672
Hinds, W. C., 1999. Aerosol technology: Properties, behaviour and measurement of airborneparticles, 2nd ed., Wiley, New York, ISBN: 978-0-471-19410-1
Hu, S., Fruin, S., Kozawa, K., Mara, S., Paulson, S. E. and Winer, A. M., 2009. A wide area of airpollutant impact downwind of a freeway during pre-sunrise hours. Atm. Env. 43 pp. 2541-2549,doi: 10.1016/j.atmosenv.2009.02.033
Högström, R., Karjalainen, P. Yli-Ojanperä J., Rostedt, A., Heinonen, M., Mäkelä, J. M., andKeskinen, J., 2012. Study of the PM Gas-Phase Filter Artifact Using a Setup for Mixing Diesel-Like Soot and Hydrocarbons, Aerosol Sci. Technol., 46:9, pp. 1045-1052, doi:10.1080/02786826.2012.689118
ICCT, 2016. A technical summary of Euro 6/VI vehicle emission standards. International Councilon Clean Transportation, Washington, D.C
Iida, K, Sakurai, H., Saito, K. and Ehara, K., 2014. Inkjet Aerosol Generator as MonodisperseParticle Number Standard, Aerosol Sci. Technol., 48:8, pp. 789-802, doi:0.1080/02786826.2014.930948
Iida, K., Stolzenburg, M., R. and McMurry, P. H., 2009. Effect of Working Fluid on Sub-2 nmParticle Detection with a Laminar Flow Ultrafine Condensation Particle Counter. Aerosol Sci.Technol. 43:1, pp. 81-96, doi: 10.1080/02786820802488194
Intra, P. and Tippayawong, N., 2009. Progress in Unipolar Corona Discharger Designs forAirborne Particle Charging: A Literature Review. J. Electrostat., 67(4):605–615, doi:doi:10.1016/j.elstat.2008.12.018

52
Intra, P and Tippayawong, N., 2015. Development and Evaluation of a Faraday Cup Electrometerfor Measuring and Sampling Atmospheric Ions and Charged Aerosols, Particul. Sci. Technol.,33, pp. 257 - 263, doi: 10.1080/02726351.2014.952392
Juuti, P., Arffman, A., Rostedt, A., Harra, J., Mäkelä, J. M. and Keskinen, J., 2016. Real-timeeffective density monitor (DENSMO) for aerosol nanoparticle production, Aerosol Science andTechnology, 50:5, pp. 487-496, doi: 10.1080/02786826.2016.1168511
Järvinen, A., Kuuluvainen, H., Niemi, J., Saari, S., Dal Maso, M., Pirjola, L., Hillamo, R., Janka,K., Keskinen, J., Rönkkö, T., 2015. Monitoring Urban Air Quality with a Diffusion Charger BasedElectrical Particle Sensor. Urban Climate 14, 3, pp. 441–456, doi: 10.1016/j.uclim.2014.10.002
Kaminski, H., Kuhlbusch, T., Fissan, H., Ravi, L., Horn, H.-G., Han, H.-S., Caldow, R., and Asbach,C., 2012. Mathematical Description of Experimentally Determined Charge Distributions of aUnipolar Diffusion Charger. Aerosol Sci. Technol., 46:6, pp. 708–716, doi:10.1080/02786826.2012.659360
Keithley, 2004. Low Level Measurements Handbook, 6th edition, Keithley Instruments Inc.,Cleveland, OH, USA.
Kelly, K. E., Whitaker, J., Petty, A., Widmer, C., Dybwad, A., Sleeth, D., Martin, R. and Butterfield,A., 2017. Ambient and laboratory evaluation of a low-cost particulate matter sensor, Environ.Pollution, Vol. 221, pp. 491-500, doi: 10.1016/j.envpol.2016.12.039.
Kelly, W. P. and McMurry, P. H., 1992. Measurement of Particle Density by Inertial Classificationof Differential Mobility Analyzer–Generated Monodisperse Aerosols, Aerosol Sci. Technol., 17:3,pp. 199-212, doi: 10.1080/02786829208959571
Keskinen, J., Pietarinen, K., and Lehtimäki, M. (1992). Electrical low pressure impactor. J. AerosolSci., 23, pp. 353–360, doi: 10.1016/0021-8502(92)90004-F
Kimoto, S., Saiki, K., Kanamaru, M. and Adachi, M., 2010. A Small Mixing-Type Unipolar Charger(SMUC) for Nanoparticles, Aerosol Sci. Technol., 44:10, pp. 872-880, doi:10.1080/02786826.2010.498796
Knutson, E. O. and Whitby, K. T., 1975 Aerosol classification by electric mobility: apparatus,theory, and applications. J. Aerosol Sci. 6, pp. 443-451, doi: 10.1016/0021-8502(75)90060-9
Kuhlbusch, T. A. J., Quincey, P., Fuller, G. W., Kelly, F., Mudway, I., Viana, M., Querol, X.,Alastuey, A., Katsouyanni, K., Weijers, E., Borowiak, A., Gehrig, R., Hueglin, C., Bruckmann,P., Favez, O., Sciare, J., Hoffmann, B., EspenYttri, K., Torseth, K., Sager, U., Asbach, C.,Quass, U., 2014. New Directions: The future of European urban air quality monitoring. Atm.Environ., 87, pp. 258-260, doi: 10.1016/j.atmosenv.2014.01.012
Kulkarni, P., Baron, P. A., and Willeke, K., 2011. Aerosol Measurement: Principles, Techniques,and Applications, John Wiley & Sons, Hoboken, NJ, pp. 3–13, ISBN: 978-0-470-38741-2

53
Kumar, P. Morawska, L., Martani, C., Biskos, G., Neophytou, M., Di Sabatino, S., Bell, M., Norford,L., Britter, R., 2015. The rise of low cost sensing for managing air pollution in cities. EnvironmentInternational 75, pp. 199–205. doi: 10.1016/j.envint.2014.11.019
Künzli, N., Kaiser, R., Medina, S., Studnicka, M., Chanel, O., Filliger, P., Herry, M., Horak F.,Puybonnieux-Texier, V., Quénel, P., Schneider, J., Seethaler, R., Vergnaud, J.-C. and Sommer,H., 2000. Public-health impact of outdoor and traffic-related air pollution: a Europeanassessment. Lancet 2000; 356, pp. 795–801, doi: 10.1016/S0140-6736(00)02653-2
Kuuluvainen, H., Rönkkö, T., Järvinen, A., Saari, S., Karjalainen, P., Lähde, T., Pirjola, L., Niemi,J. V., Hillamo, R. and Keskinen, J., 2016. Lung deposited surface area size distributions ofparticulate matter in different urban areas. Atm. Env. 136 (2016) pp. 105-113, doi:10.1016/j.atmosenv.2016.04.019
Lanki, T., Tikkanen, J., Janka, K., Taimisto, P., and Lehtimäki, M. (2011). An electrical sensor forlong-term monitoring of ultrafine particles in workplaces. J. Phys.: Conf. Ser., 304:012013. doi:10.1088/1742-6596/304/1/012013
Lee, D.-D. and Lee D.-S., 2001. Environmental Gas Sensors. IEEE Sensors J. Vol. 1, No. 3, pp.214-224, doi: 10.1109/jsen.2001.954834
Lehman, U., Niemelä, V., and Mohr, M., 2004. New method for time-resolved diesel engineexhaust particle mass measurement. Environ. Sci. Technol., 38, pp. 5704–5711, doi:10.1021/es035206p
Lehtimäki, M., 1983. In Modified Electrical Aerosol Detector. in Aerosols in the Mining andIndustrial Work Environments, Vol. 3, V. A. Marple, and B. Y. H. Liu, eds., Ann Arbor SciencePublishers, Ann Arbor, pp. 1135–1143, ISBN: 978-0250405336
Liu, B. Y. H. and Lee, K. W., 1975. An aerosol generator of high stability. Am. Ind. Hyg. Assoc. J.,36, pp. 861–865, doi: 10.1080/0002889758507357
Liu, B. Y. H. and Lee, K. W., 1976. Efficiency of Membrane and Nuclepore Filters forSubmicrometer Aerosols. Environ. Sci. Technol. 10(4) pp. 345 – 350, doi:10.1021/es60115a002
Liu, B.Y.H. and Pui, D.Y.H., 1975. On the Performance of the Electrical Aerosol Analyzer. J.Aerosol Sci. 6, pp. 249–264, doi: 10.1016/0021-8502(75)90093-2
Liu, X., Cheng, S., Liu, H., Hu, S., Zhang, D., and Ning, H., 2012. A Survey on Gas SensingTechnology Sensors. Sensors 2012, 12, pp. 9635-9665, doi: 10.3390/s120709635
Marra, J., Den Brink, W., Goossens, H., and Kessels, S., 2009. Nanoparticle Monitoring forExposure Assessment Nanotechnology Magazine. IEEE 3:6–13, doi:0.1109/MNANO.2009.932417

54
Marjamäki, M., Keskinen, J., Chen, D.-R., and Pui, D. Y. H., 2000. Performance evaluation ofelectrical low pressure impactor (ELPI). J. Aerosol. Sci., 31, pp. 249–261, doi: 10.1016/S0021-8502(99)00052-X
Marjamäki, M., Ntziachristos, L., Virtanen, A., Ristimäki, J., Keskinen, J., Moisio, M., Palonen, M.and Lappi, M., 2002. Electrical filter stage for the ELPI, SAE Technical paper 2002-01-0055,doi: 10.4271/2002-01-0055
Marjovi, A., Arfire, A. and Martinoli, A., 2015. High Resolution Air Pollution Maps in UrbanEnvironments Using Mobile Sensor Networks, International Conference on DistributedComputing in Sensor Systems, doi: 10.1109/DCOSS.2015.32
Marple, V. A., 2004. History of Impactors — The First 110 Years, Aerosol Sci. Technol. 38:3, pp.247-292, doi: 10.1080/02786820490424347
Marquard, A., Meyer, J., and Kasper, G., 2005. Characterization of unipolar electrical aerosolchargers — Part I: A review of charger performance criteria, J. Aerosol Sci., 37, pp. 1052-1068,doi: 10.1016/j.jaerosci.2005.09.001
McMurry, P. H., 2000. The History of Condensation Nucleus Counters, Aerosol Sci. Technol.,33:4, pp. 297-322, doi: 10.1080/02786820050121512
Medved, A., Dorman, F., Kaufman, S.L. and Pocher, A., 2000. A New Corona-Based Charger forAerosol Particles. J. Aerosol Sci. 31: s616–s617, doi: 10.1016/S0021-8502(00)90625-6
Mirme, A., Tamm, E. and Tammet, H., 1981. An Aerosol Electrogranulometer with a WideMeasuring Range. Acta et comm. Univ. Tartuensis, 588, pp. 84-92 (in Russian, with Englishabstract)
de la Mora, J. F., Perez-Lorenzo, L. J., Arranz, G., Amo-Gonzalez, M and Burtscher, H., 2017.Fast high-resolution nanoDMA measurements with a 25 ms response time electrometer,Aerosol Sci. Technol. 51, pp. 724 - 734, doi: 10.1080/02786826.2017.1296928
Ntziachristos, L., Fragkiadoulakis, P., Samaras, Z., Janka, K. And Tikkanen, J., 2011. ExhaustParticle Sensor for OBD Application, SAE Technical Paper 2011-01-0626, 2011, doi:10.4271/2011-01-0626.
Ntziachristos, L., Giechaskiel, B., Ristimäki, J. and Keskinen, J., 2004. Use of a corona chargerfor the characterisation of automotive exhaust aerosol, J. Aerosol Sci., 35, pp. 943-963, doi:10.1016/j.jaerosci.2004.02.005
Ntziachristos, L., Polidori, A., Phuleria, H., Geller, M. D. and Sioutas, C., 2007. Application of aDiffusion Charger for the Measurement of Particle Surface Concentration in DifferentEnvironments, Aerosol Sci. Technol., 41:6, pp. 571-580, doi: 10.1080/02786820701272020

55
Oberdörster, G., Oberdörster, E., Oberdörster, J., 2005. Nanotoxicology: an emerging disciplineevolving from studies of ultrafine particles. Environ. Health Perspect. 113 (7), pp. 823-839, doi:10.1289/ehp.7339
Park, C. O., Fergus, J. W., Miura, N., Park, J. and Choi, A., 2009. Solid-state electrochemical gassensors. Ionics 15, pp. 261–284 doi: 10.1007/s11581-008-0300-6
Patashnick, H. and Rupprecht, E. G., 1991. Continuous PM-10 Measurements Using the TaperedElement Oscillating Microbalance, J. Air Waste Manag. Assoc., 41:8, pp. 1079-1083, doi:10.1080/10473289.1991.10466903
Piedrahita, R., Xiang, Y., Masson, N., Ortega, J., Collier, A., Jiang, Y., Li, K., Dick, R. P., Lv, Q.,Hannigan, M. and Shang, L., 2014. The next generation of low-cost personal air quality sensorsfor quantitative exposure monitoring. Atmos. Meas. Tech., 7, pp. 3325–3336, doi: 10.5194/amt-7-3325-2014
Ranjan, M. and Dhaniyala, S., 2009. A novel electrical-mobility-based instrument for total numberconcentration measurements of ultrafine particles, J. Aerosol Sci. 40, pp. 439-450, doi:10.1016/j.jaerosci.2009.01.007
Ristimäki, J., Virtanen, A., Marjamäki, M., Rostedt, A., and Keskinen, J., 2002. On-linemeasurement of size distribution and effective density of submicron aerosol particles, J. AerosolSci., 33, pp. 1541–1557, doi: 10.1016/S0021-8502(02)00106-4
Schmid, O., Karg, E., Hagen, D. E., Whitefield, P. D., and Ferron, G. A., 2007. On the effectivedensity of non-spherical particles as derived from combined measurements of aerodynamic andmobility equivalent size. J. Aerosol Sci., 38, pp. 431–443, doi:doi:10.1016/j.jaerosci.2007.01.002
Schwyn, S., Garwin, E. and Schmidt-Ott, A., 1988. Aerosol generation by spark discharge, J.Aerosol. Sci. 19, pp. 639-642, doi: 10.1016/0021-8502(88)90215-7
Shin, W. G., Wang, J., Mertler, M., Sachweh, B., Fissan, H. and Pui, D. Y. H., 2010. The effect ofparticle morphology on unipolar diffusion charging of nanoparticle agglomerates in the transitionregime. J. Aerosol Sci. Vol. 41, pp. 975 – 986, doi: 10.1016/j.jaerosci.2010.07.004
Snyder, E. G., Watkins, T. H., Solomon, P.A, Thoma, E. D., Williams, R. W., Hagler, G. S. W.,Shelow, D., Hindin, D. A., Kilaru, V. J. and Preuss P. W., 2013. The Changing Paradigm of AirPollution Monitoring. Environ. Sci. Technol. 47, pp. 11369−11377, doi: 10.1021/es4022602
Sousana, S., Koehlerb, K., Halletta, L. and Petersa, T. M, 2017. Evaluation of consumer monitorsto measure particulate matter. J. Aerosol Sci. Vol. 107, pp. 123–133, doi:10.1016/j.jaerosci.2017.02.013
Tammet, H. F., 1970. The aspiration method for the determination of atmospheric-ion spectra,Israel Program of Scientific Translations, Jerusalem, 1970.

56
Tammet, H., Mirme, A. and Tamm, E., 2002. Electrical aerosol spectrometer of Tartu University,Atm. Res., 62, 3–4, pp. 315–324, doi: 10.1016/S0169-8095(02)00017-0
Tavakoli, F., Symonds, J. P. R. and Olfert, J. S., (2014) Generation of a Monodisperse Size-Classified Aerosol Independent of Particle Charge, Aerosol Sci. Technol., 48:3, pp. 1-4, doi:10.1080/02786826.2013.877121
Tikkanen, J., Moisio, M., Janka, K., Pietarinen, K., Keskinen, J. and Rostedt, A., 2007. Methodand a Sensor Device for Measuring Particle Emission from the Exhaust Gases of a CombustionEngine. Finnish Patent FI118278, US patent 7406855.
Ullmann, M., Friedlander, S. K. and Schmidt-Ott, A., 2002. Nanoparticle formation by laserablation, J. Nanopart. Res. 4, pp. 499–509, doi: 10.1023/A:1022840924336
Viana, M., Rivas, I., Reche, C., Fonseca, A. S., Pérez, N., Querol, X., Alastuey, A., Álvarez-Pedrerol, M. and Sunyer, J., 2015. Field comparison of portable and stationary instruments foroutdoor urban air exposure assessments Atm. Env. 123, pp. 220 – 228, doi:10.1016/j.atmosenv.2015.10.076
Virtanen, A., Marjamäki, M., Ristimäki, J. and Keskinen, J., 2001. Fine particle losses in electricallow-pressure impactor, J. Aerosol Sci. 32, pp. 389–401, doi: 10.1016/S0021-8502(00)00087-2
Whitby, K. T., 1961. Generator for Producing High Concentrations of Small Ions. Rev. Sci.Instrum., 32, pp. 1351–1355, doi: 10.1063/1.1717250
Wilson, W., Stanek, J., Han, H.-S., Johnson, T., Sakurai, H., Pui, D., Turner, J., Chen, D.-R.,Duthie, S., 2007. Use of the electrical aerosol detector as an indicator of the surface area offine particles deposited in the lung. J. Air Waste Manag. Assoc. 57(2), pp. 211-220, doi:10.1080/10473289.2007.10465321
Wang, S. C. and Flagan, R. C., 1990. Scanning Electrical Mobility Spectrometer, Aerosol Sci.Technol., 13:2, pp. 230-240, doi: 10.1080/02786829008959441
Yli-Ojanperä, J., Mäkelä, J. M., Marjamäki, M., Rostedt, A., and Keskinen, J., 2010. TowardsTraceable Particle Number Concentration Standard: Single Charged Aerosol Reference(SCAR). J. Aerosol Sci., 41, pp. 719–728, doi: 10.1016/j.jaerosci.2010.04.012

57
Publications


Paper I
Rostedt, A., Marjamäki, M., and Keskinen, J., 2009. Modification of the ELPI to MeasureMean Particle Effective Density in Real-Time. J. Aerosol Sci., 40:823–831, doi:10.1016/j.jaerosci.2009.05.002.
© Elsevier Ltd


Aerosol Science 40 (2009) 823 -- 831
Contents lists available at ScienceDirect
Aerosol Science
journal homepage: www.e lsev ier .com/ locate / jaerosc i
Technical note
Modification of the ELPI to measure mean particle effective density inreal-time
Antti Rostedt∗, Marko Marjamaki, Jorma Keskinen
Aerosol Physics Laboratory, Department of Physics, Tampere University of Technology, P.O. Box 692, FIN-33101 Tampere, Finland
A R T I C L E I N F O A B S T R A C T
Article history:Received 22 August 2008Received in revised form6 May 2009Accepted 12 May 2009
Keywords:ImpactorDensityMobility
A newmodification of electrical low pressure impactor (ELPI) for the particle effective densitymeasurement is presented. The system is capable of real-time operation and it is based onthe serial measurement of mobility and aerodynamic diameter. In the studied configuration, azeroth ordermobility analyser is installed inside of the ELPI-instrument. The system is feasiblefor single modal distributions. For several particle materials and varying size distributions,the measured average density values were within 15% of the values obtained with a referencemethod.
© 2009 Elsevier Ltd. All rights reserved.
1. Introduction
Particle effective density is an important quantity affecting themechanical dynamics of aerosol particles. Severalmethods havebeen applied to the measurement of the effective density. As reviewed by Schmid, Karg, Hagen, Whitefield, and Ferron (2007),one of the most popular methods is the combined measurement of aerodynamic and mobility equivalent diameter (e.g. Hering &Stolzenburg, 1995; Kelly &McMurry, 1992; Maricq, Podsiadlik, & Chase, 2000; Schleicher, Kunzel, & Burtscher, 1995). Usually themethods are based on having a differential mobility analyser (DMA) and an impactor in series, i.e. measuring the aerodynamicsize of the mobility classified particles. Covering a size distribution this way is relatively time consuming, as one particle sizeat a time needs to be passed through the DMA. As an alternative to the serial method is parallel size distribution measurementusing two instruments, one classifying the particles according to their mobility equivalent size and the other according to theaerodynamic size. Effective density is then acquired by using some kind of fitting procedure to the two size distributions. Parallelmeasurement methods have been applied previously to aerodynamic particles sizer (APS) and cascade impactor measurement(Brockmann & Rader, 1990). Kerminen, Makela, Hillamo, and Rantanen (1999) used scanning mobility particle sizer (SMPS;Wang & Flagan, 1990) and cascade impactor data to calculate the effective density. Ristimaki, Virtanen, Marjamaki, Rostedt, andKeskinen (2002) introduced a computational method to acquire the effective density from the parallel measurement with theelectrical low pressure impactor (ELPI; Keskinen, Pietarinen, & Lehtimaki, 1992) and SMPS on-line. Although several methods tomeasure the effective density have been published previously, none of them are fast enough to allow real-time measurement ofthe effective density. The knowledge of the changes in the effective density of the particles in real-time may be very useful whenfor example monitoring different industrial aerosol processes and diesel engine exhaust measurements.
A variant of the serial method, capable of real-time measurement of particle density was introduced by Keskinen, Moisio,Marjamaki, Virtanen, and Ristimaki (2001). The serial method has been applied to convert electrical impactor signals to massconcentration (Dekati Mass Monitor (DMM-230, Dekati Ltd.), as reported by Lehman, Niemela, and Mohr (2004). In this paper, asimple serial setup is for the first time applied to the measurement of the effective density of the particles in real-time. Here, the
∗ Corresponding author. Tel.: +358331152529.E-mail address: [email protected] (A. Rostedt).
0021-8502/$ - see front matter © 2009 Elsevier Ltd. All rights reserved.doi:10.1016/j.jaerosci.2009.05.002

824 A. Rostedt et al. / Aerosol Science 40 (2009) 823 -- 831
Fig. 1. Schematic view of the measurement setup.
serial method is implemented by introducing a zeroth order mobility analyser between the charger and the impactor of the ELPI.The mobility analyser is placed after the corona charger and it replaces the upper stages of the impactor. The design is such thatthe additional parts will easily fit inside the existing ELPI unit. This makes it possible to attach the mobility analyser as a part ofexisting equipment without any major modifications. Thus the designed setup serves also as an add-on measurement feature tothe already existing ELPI system.
2. Description of the method
2.1. Operation principle
Themeasurementmethod combines the electrical mobility measurement and the aerodynamic size classification by connect-ing a zeroth order mobility analyser in series with a cascade impactor. The electrical mobility measurement is used to obtain amobilitymedian of themeasured size distribution,whereas the aerodynamic classification gives the size distribution as a functionof aerodynamic particle size. From the measured aerodynamic size distribution we calculate the median of the distribution. Theeffective density is a parameter linkingmobility equivalent particle size to aerodynamic particle size (e.g. Kelly &McMurry, 1992;Ristimaki et al., 2002) with the following equation:
�eff = �0Cc,aerodynd2aCc,mobilityd2b
, (1)
where Cc,aerodyn and Cc,mobility are the slip correction factors corresponding for the aerodynamic and mobility particle sizes daand db, respectively. In this case we use the mobility equivalent median diameter dm and corresponding aerodynamic mediandiameter dam to estimate the effective density.
To achieve real-time response, the mobility analyser is actually located inside of the ELPI-instrument. It is installed inside theimpactor casing to replace the upper stages 8–12. This configuration makes it possible to use one of the on board electrometersof the ELPI to measure the current signal of the mobility analyser. Additionally in this configuration, it is possible to detect all ofthe collected particles as a current signal with an electrometer. Schematic view of the measurement setup is shown in Fig. 1.
As shown in the figure, themeasurement consists of three different phases; the charging of the aerosol, themobility classifica-tion and the aerodynamic classification of the charged particles. The charging of the aerosol is carried out by the standard coronacharger of the ELPI unit. The charge, which the particles acquire inside the charger, is determined by the mobility equivalentdiameter. The mobility analyser collects a part of the particles from the flow. The amount of particles collected can be measuredas a fraction of the total current that is measured from the analyser. The mobility median is determined from this fraction.After the mobility classification the measured aerosol is classified in the cascade impactor. The aerodynamic median diameter iscalculated from the measured impactor currents and the effective density is calculated with Eq. (1) using the measured mobilityand aerodynamic median diameters.
2.2. Mobility analyser
The geometry of the analyserwas chosen to be cylindrical, because of the shape of the existing ELPI impactor casing. The actualdesign of the analyser is shown in Fig. 2. The two coaxial cylinders form the zeroth order mobility analyser and the aerosol flowsthrough the analyser as a thin annular stream between the two cylinders (inner diameter 45mm and outer diameter 55mm).The collection of the particles takes place in between the measuring and voltage electrodes, which are placed at the bottom of

A. Rostedt et al. / Aerosol Science 40 (2009) 823 -- 831 825
Fig. 2. Cross section view of the mobility analyser.
the analyser. The length of the collection region is 30mm. In the upper part of the analyser, the flow channel is same as inside theactual classification region (i.e. between the electrodes) to ensure stable flow pattern in between the electrodes. The geometryis dimensioned so that the flow stays laminar. This was also verified with Computational Fluid Dynamics package of ComsolMultiphysics software.
The design of the mobility analyser is such that the onboard trap voltage source of the ELPI unit can be used as a power sourcefor the analyser. The electric field inside the analyser was also modelled and verified with Comsol Multiphysics. The range ofoperating voltage that can be used with the setup varies from 50 to 400V. The optimum voltage of the analyser depends on thesize distribution measured, the higher the median size of the distribution, the higher the optimum voltage. The operational sizerange of the setup is from 30 to 200nm.
The collection efficiency of the used geometry depends on the diameters of both inner and outer cylindersDi andDo, the lengthof the electrodes le, the applied voltage between the electrodes V and the volumetric flow rate passing through the analyser Q.The collection efficiency, �, is determined as follows (e.g. Fuchs, 1964).
� = 2�ZVle
Q ln(Do
Di
) (2)
The property of the particles, which affects to the collection efficiency, is the electrical mobility Z of particles. This depends on themobility diameter of the particles db, gas viscosity �, elementary charge e and the number of elementary charges on the particlen and can be written as (Hinds, 1999)
Z = neCc3��db
(3)
where the term Cc is the slip correction factor.
2.3. Impactor
Since themobility analyser replaces ELPI stages 8–12, only the stages 1–7 and the filter stage can be used for size classification.In this configuration impactor can be used for size classification for particles smaller than 0.62�m. In theory, size range could beadjusted for larger particles by changing the stages. However, owing to the limitations of the zeroth order mobility classificationthis is not practically feasible as will be seen later. The operation of the impactor is described by cutpoints d50% of the individualimpactor stages. A cutpoint of the impactor stage refers to an aerodynamic particle diameter from which 50% are collected bythe stage in question. In this study we use the cut diameter concept (e.g. Cooper & Guttrich, 1981) to carry out the necessary sizedistribution calculations. In this concept, it is assumed that all of the particles larger than the cutpoint are collected and all of theparticles smaller than the cutpoint pass on to the next stage.
The pressure drop of stages 8–12 is less than 1kPa (Marjamaki, Keskinen, Chen, & Pui, 2000). Since the mobility analyserhas also very small pressure drop, we can assume that replacing stages 8–12 with the mobility analyser does not affect theoperation of the stages 1–7, i.e. impactor stages 1–7 operate as in original ELPI setup. The last stage of the impactor is a filter

826 A. Rostedt et al. / Aerosol Science 40 (2009) 823 -- 831
Fig. 3. Experimental setup for the collection efficiency measurements.
stage, which collects the rest of the particles, which are smaller than the lowest cut point of the impacting stages. The operationof the filter stage differs from the other stages: For the filter stage, the upper size limit of the collected particles depends on thelower size limit of the previous stage, but the lower limit of the filter stage originates from the charger charging efficiency, i.e. itis defined by the point in the charging efficiency curve, where the measured signal becomes too low to measure (Marjamaki etal., 2002). In the presented configuration, the lower limit depends also on the collection efficiency of the mobility analyser, sinceit cannot be lower than the particle size where the mobility analyser collects 100% of the particles. In practice the lower limitof the filter stage is defined by the mobility analyser since the size corresponding to 100% collection is higher than the chargingefficiency limit. The lower limit is different for different mobility analyser voltages, because of the changing collection efficiencycurve.
3. Response of the components
The calibration setup (Fig. 3) is very similar to the one used to calibrate ELPI (Marjamaki et al., 2000). As a calibration aerosol,monodispersed dioctylsebacate (DOS) particles were used. First a narrow, but polydisperse, aerosol distribution was generatedusing evaporation–condensation generator (Liu & Lee, 1975). Generated size distributionwasmonitoredwith a scanningmobilityparticle sizer (TSI 3934). The generated narrow distribution was further classified with differential mobility analyser (TSI 3071)to generate monodisperse particles.
The collection efficiency, �, measured with the singly charged particles can be compared to the theoretical predictionscalculated with Eq. (2). The comparison between the measured collection efficiency and the theoretical collection efficiency withan analyser voltage of 400V is shown on the left side of Fig. 4. From the comparison it can be seen that the measured collectionefficiency fits perfectly to the theoretically calculated efficiency. This result confirms that the design is working as theory predictsand no corrections are needed for the calculation of the collection efficiency.
In this application, particles entering the analyserwill be charged by the ELPI charger before entering the analyser. The chargerchanges the charge distribution of the particles, which changes the electrical mobility of the particles (see Eq. (3)). This changesthe collection efficiency of the mobility analyser as a function of the particle size. For this reason collection efficiency for theparticles charged with the ELPI charger is essential knowledge when calculating the densities. As particles have a distribution ofcharges, we characterize the operation of the charger and mobility analyser using the average (arithmetic mean) value for thecharge per particle. The efficiency of the ELPI charger has been defined (Marjamaki et al., 2000) as a product of the penetration ofthe charger and average number of charges per particle. In this case we are not interested in the charging efficiency as a whole;instead we need to know the average number of charges per particles, so that we can link the measured collection efficiency ofthe mobility analyser to the particle size. The average number of charges carried by the particles after the ELPI charger can beobtained by measuring the collection efficiency of the analyser with monodisperse particles charged with the ELPI charger. Themeasurement setup is the same as presented in Fig. 3, except that now the monodispersed particles are first passed through aneutraliser before entering the ELPI charger. The neutraliser is added because the initial charge level of the aerosol can affect theoperation of the charger. The use of neutraliser is also recommended for normal measurement situations, especially if the aerosolis not expected to be in charge equilibrium.

A. Rostedt et al. / Aerosol Science 40 (2009) 823 -- 831 827
Fig. 4. On the left measured and theoretical collection efficiencies with singly charged particles � measured at analyser voltage of 400V. On the right measuredcollection efficiencies for multiply charged particles �m with two different analyser voltages. The solid line on the right is the collection efficiency calculated withfitted average number of charges per particle.
Fig. 5. Measured average charges per particle, n, generated by the ELPI charger as a function of particle mobility diameter db together with a power function fitto the data.
From the DMA we know the particle mobility size and we acquire the electrical mobility of the particles from the measuredcollection efficiency �m. From the electrical mobility and the particle size we can calculate the average number of charges perparticle with the use of Eq. (2). Results can be calculated only for the particle sizes that have a collection efficiency of less than100%. A power function, Eq. (4), was then fitted to the calculated average number of charges.
n(db) =⎧⎨⎩1, db �0.0119�m17.325d0.6440b , 0.0119<db �0.0379�m78.898d1.1076b , 0.0379�m<db
(4)
Average number of charges is limited to one, because only the charged particles are detected. The resulting average number ofcharges per particle together with the power function fit is plotted to Fig. 5. The resulting calculated collection efficiency forparticles charged by the ELPI charger together with measured point is presented on the right side in Fig. 4.
Since the charging efficiency of the ELPI charger (Marjamaki et al., 2000, 2002) and the collection efficiencies of the im-pactor stages are known (Marjamaki et al., 2000), we know the response of every component in the density measurementsetup.

828 A. Rostedt et al. / Aerosol Science 40 (2009) 823 -- 831
Fig. 6. Simulation of the current fraction of mobility analyser current from the measured total current as a function of the current median diameter dm of the sizedistribution with different GSDs at a analyser voltage of 200V.
4. Calculation of the effective density
4.1. Response to polydisperse aerosols
In the case of a polydisperse aerosol, the fraction of the mobility analyser current from the total current (Ima/Itot , see Fig. 1)corresponds to the same fraction of the charge weighted mobility size distribution of the charged aerosol. We name the chargeweighted size distribution as current distribution. A 50% current fraction would therefore correspond to the current mediandiameter of the mobility size distribution. For other measured current fractions, the current median diameter can be calculated,if the shape of the size distribution is known. In practice, this is not known and therefore we need to make approximations thatcause limitations. The method is limited to cope only with unimodal size distributions on a certain size range. The operationalsize range that can be used can be slightly varied by changing the operating voltage of the mobility analyser. With the currentsetup, the usable size range of the method is from 30 to 200nm. The upper limit of the size range is caused by the collectionefficiency of the mobility analyser. For particles larger than 200nm, collection efficiency curve is so flat (right side of Fig. 4) thatit cannot be used to measure the mobility median size reliably. The lower limit is imposed by the characteristics of the impactor.Although the size range of the ELPI impactor is down to 7nm, at sizes below 30nm the aerodynamic median of the distributioncannot be calculated reliably, since the most of the signal is on the filter stage.
In the following calculation we assume that the distribution is lognormal with a geometric standard deviation (GSD) of 1.50.The relationship between themobilitymedian diameter of the size distribution and themeasured current fraction of the analysercurrent from the total current was numerically simulated. As a first step in the simulation the number size distribution N(db)entering the systemwas generated. Theused countmediandiameter rangewas from25 to 250nmand theGSDof the distributionswas set to constant 1.50. Thenwith the help of the charging efficiency, Pn, the number size distributionwas converted to a currentsize distribution using Eq. (5) (see Ristimaki et al., 2002). The terms e and Q are the elementary charge (1.6022×10⁻¹⁹ C), andvolumetric flow rate at the inlet of the charger. Both the generated number size distribution and the resulting current distributionare functions of the particle mobility diameter.
I(db) = Pn(db)eQN(db) (5)
Next, the mobility analyser current fraction as a function of the current median mobility diameter, dm, of the size distribution iscalculated by integrating the product of the current distribution, I(db), and the fitted collection efficiency of themobility analyser,�m(db) (right side of Fig. 4)
Ima =∫
I(db)�m(db)ddb
and dividing the result with the total current Itot . The result of the calculation is shown in Fig. 6 for different collection voltages.There are also curves calculated for different GSD values with one collection voltage for comparison.

A. Rostedt et al. / Aerosol Science 40 (2009) 823 -- 831 829
Table 1Average effective densities of the tested aerosols, together with results from reference method and bulk densities of the aerosol material.
Bulk (g/cm3) Reference (g/cm3) Measured (g/cm3) Deviation from reference (%)DOS 0.91 0.87 0.95 9.0Santovac 5 1.20 1.09 1.03 −5.4Fomblin 1.90 1.72 1.51 −12.2Ag (furnace) 10.5 5.14 4.77 −7.2Ag (LFS) 10.5 6.76 6.18 −8.7
4.2. Effective density
As electrical current is the primary signal measured, it is convenient to use the current distributions, i.e. charge weightedsize distributions, in the calculations. The effective density can be calculated with the Eq. (1) from the current medians of theaerodynamic and mobility size distributions. The current median mobility size dm of current distribution is obtained from thefit shown in Fig. 6 for the measured current fraction value. The current median aerodynamic diameter is calculated from theimpactor current distribution with the aid of an iteration routine. Firstly, the diffusion losses of fine particles to the impactorstages are corrected from the raw current signals in a manner similar to that used in the normal operation of the ELPI (Moisio,1999). Then the current distribution is corrected again with the collection efficiency of the mobility analyser. As a result fromthis the obtained current distribution corresponds to the current distribution before the mobility analyser, and now the medianof this distribution corresponds to the median measured with the mobility analyser. Unfortunately, for this correction we needto know the effective density of the particles, hence we need the iteration. From the corrected impactor current distribution thecurrent median aerodynamic diameter dam is calculated. From these two median diameters new effective density is calculated.Then the iteration routine to calculate the new aerodynamic median diameter is repeated to get new effective density. Thisiteration is repeated for 10 times. As a result the effective density from the last iteration round is given.
5. Laboratory experiments
5.1. Different aerosol materials
The method was tested in the laboratory using aerosols with different densities. The test aerosol materials chosen were DOS,which was also used for calibration, Santovac 5, Fomblin and silver. From these aerosols DOS, Santovac 5 and Fomblin are liquidand silver is a solid metal. The DOS aerosol was generated with the same evaporation–condensation generator that was used inthe calibration. Santovac 5, Fomblin and silver aerosols were generated using a tube furnace. Silver particles were also generatedusing liquid flame spray (LFS) technique (Makela, Keskinen, Forsblom & Keskinen, 2004). DOS, Santovac and Fomblin producespherical liquid particles. Themedian of the generated number distribution for the oil aerosols was in the size range of 40–120nmand the GSD varied between 1.35 and 1.65. The median and GSD of the generated silver aerosols varied between 10–60nm and1.4–1.8, respectively. The bulk densities of the tested materials together with measurement results are collected to Table 1. Theresults include all of the different distributions, i.e. they include distributions with variable median sizes and geometric standarddeviations.
Themobility analyser voltagewas varied during tests according to the size of the particles. Results of the presentmethodwerecompared to the densities calculated from the parallel measurement with the ELPI and SMPS. This reference method is basedon fitting the ELPI and SMPS distributions by varying the effective density. Method is described fully in a paper by Ristimaki etal. (2002). In the parallel reference method, the same ELPI unit, in which the mobility analyser was fitted, was used to measurethe ELPI current distributions. During the reference measurements the mobility analyser voltage was set to zero and the fittingroutine was used only for the remaining eight size channels of the ELPI. The results of the comparison between the developedmethod and reference method are presented in Fig. 7 and Table 1. The error bars in the figure represent the standard deviationfor the measured density values for both methods.
For the liquid particles the measured values are quite close to the bulk values. For the solid silver particles the values for bothmethods are significantly lower than the bulk values. Density values much lower than the bulk density have been reported forsilver particles in several studies, and they have been attributed to impurities in the generator or the carrier gas (e.g. Fernandezde la Mora, de Juan, Liedtke, & Schmidt-Ott, 2003; Virtanen, Ristimaki, & Keskinen, 2004). In some of the presented distributions,the particles were probably agglomerated. Nevertheless, the agreement between the presented method and the reference isrelatively good. The error bars include the effect of differences between themeasured size distributions for eachmaterial. For theliquid aerosols the error bars are small due to homogenous spherical structure of the particles. For the silver aerosols, part of thevariation is caused by real differences in the effective density caused, e.g. by varying degree of agglomeration.
5.2. Changing aerosol size distribution
The real time response of themethodwas testedwith DOS aerosol with changingmedian diameter. The aerosol was generatedwith the same generation system as in calibration, but now the operation parameters of the generator were changed so thatthe median size of the size distribution changed. The system was first operated with a constant small median diameter and

830 A. Rostedt et al. / Aerosol Science 40 (2009) 823 -- 831
Fig. 7. Acquired densities for the reference method (x-axis) and developed method (y-axis) for DOS, Santovac, Fomblin and two different silver aerosols. Resultsshown are arithmetic mean values from the measurements. The error bars represent the standard deviation values.
Fig. 8. Density measurement for changing aerosol. The calculated density values as a function of time on the top and the calculated current median diameters onthe bottom.
then the parameters were changed slowly to increase the median size. Then at the maximum median size, the generation waskept constant for a while followed by a decrease in the median size. The ELPI with the mobility analyser was measuring all thetime saving the data with one second intervals. The resulting density values were calculated from the ELPI data and are plottedtogether with the mobility and aerodynamic medians of the current distribution to Fig. 8.
The data in the figure shows that the density measurement gives constant density for stable conditions and that there is asmall variation in the density during transitions. However the variations in the resulting density values are small. The densityvalues are calculated assuming the GSD of the distribution to be constant 1.5, and if the GSD value changes during the transitions,

A. Rostedt et al. / Aerosol Science 40 (2009) 823 -- 831 831
it could lead to a change in to the calculated density value. With SMPS measurement made during the stable conditions it can beseen that GSD varies from 1.5 with the small median diameters to 1.6 with increased median diameter.
6. Conclusions
The presented method is simple to use and can be used in real-time to measure the effective density of the particles. Thepresented setup can be installed inside the ELPI unit and therefore it can be used in a same way as a regular ELPI. Method couldbe applied for example to monitor industrial aerosol processes or engine exhaust aerosols or it could be used to increase thenumber concentration accuracy of the ELPI. Laboratory measurements show that the effective density of the particles measuredwith the developed method was in good agreement with the reference method of parallel measurement with ELPI and SMPS.
Owing to the simple measurement principle, the presented setup has limitations. It is limited to unimodal size distributions.Another limitation is that the setup can only be used to obtain one previously unknown quantity about the density of the aerosol.Inmost cases this quantity is the average effective density for the distribution. For best accuracy in effective density, the geometricstandard deviation of the particle size distributionmust be known at least approximately. Themethod could, in principle, be usedto estimate the fractal dimension if the bulk density and primary particle size of the aerosol is known. However, both theoreticalconsiderations and the limited instrument resolution (see. e.g. Virtanen et al., 2004) would limit this to fractal dimension valuesgreater than 2.
Although several approximations were needed to be able to calculate the effective density they do not significantly hinder theusability of themethod for unimodal distributions. Reliability of themethod could be improved by developing the data reductionfurther, for example the GSD of the distribution could be estimated from the measured impactor currents and taken into accountin data reduction.
Acknowledgement
Dr. Marjamaki was funded by the Academy of Finland Grant no. 109124.
References
Brockmann, J. E., & Rader, D. J. (1990). APS response to nonspherical particles and experimental determination of dynamic shape factor. Aerosol Sci. Technol., 13,162–172.
Cooper, D. W., & Guttrich, G. L. (1981). A study of the cut diameter concept for interpreting particle sizing data. Atmos. Environ., 15, 1699–1707.Fernandez de la Mora, J., de Juan, L., Liedtke, L., & Schmidt-Ott, A. (2003). Mass and size of nanometer particles by means of mobility analysis and focused
impaction. J. Aerosol Sci., 34, 79–98.Fuchs, N. A. (1964)). The mechanics of aerosols. Oxford: Pergamon Press.Hering, S. V., & Stolzenburg, M. R. (1995). On-line determination of particle size and density in the nanometer size range. Aerosol Sci. Technol., 23, 155–173.Hinds, W. C. (1999)). Aerosol technology. Properties, behaviour and measurement of airborne particles. New York: Wiley.Kelly, W. P., & McMurry, P. H. (1992). Measurement of particle density by inertial classification of differential mobility analyser-generated monodisperse aerosol.
Aerosol Sci. Technol., 17, 199–212.Kerminen, V.-M., Makela, T., Hillamo, R., & Rantanen, L. (1999). Relation between particle number and mass size distribution in the diesel car exhaust. J. Aerosol
Sci., 30(S1), S777–S778.Keskinen, J., Moisio, M., Marjamaki, M., Virtanen, A., & Ristimaki, J. (2001).Method of measuring density properties of a particle distribution. Finnish patent FI115075,
US Patent 7131343.Keskinen, J., Pietarinen, K., & Lehtimaki, M. (1992). Electrical low pressure impactor. J. Aerosol Sci., 23, 353–360.Lehman, U., Niemela, V., & Mohr, M. (2004). New method for time-resolved diesel engine exhaust particle mass measurement. Environ. Sci. Technol., 38,
5704–5711.Liu, B. Y. H., & Lee, K. W. (1975). An aerosol generator of high stability. Am. Ind. Hyg. Assoc. J., 36, 861–865.Makela, J. M., Keskinen, H., Forsblom, T., & Keskinen, J. (2004). Generation of metal and metal oxide nanoparticles by liquid flame spray process. J. Materials Sci.,
39, 2783–2788.Maricq, M. M., Podsiadlik, D. H., & Chase, R. (2000). Size distributions of motor vehicle exhaust PM: A comparison between ELPI and SMPS measurements. Aerosol
Sci. Technol., 33, 239–260.Marjamaki, M., Keskinen, J., Chen, -R., & Pui, D. Y. H. (2000). Performance evaluation of electrical low pressure impactor (ELPI). J. Aerosol. Sci., 31, 249–261.Marjamaki, M., Ntziachristos, L., Virtanen, A., Ristimaki, J., Keskinen, J., Moisio, M., et al. (2002). Electrical filter stage for the ELPI. Society of Automotive Engineers
(SAE), Technical paper series 2002-01-0055.Moisio, M. (1999). Real time size distribution measurement of combustion aerosols. Ph.D. thesis, Tampere University of Technology.Ristimaki, J., Virtanen, A., Marjamaki, M., Rostedt, A., & Keskinen, J. (2002). On-line measurement of size distribution and effective density of submicron aerosol
particles. J. Aerosol Sci., 33, 1541–1557.Schleicher, B., Kunzel, S., & Burtscher, H. (1995). In situ measurement of size and density of submicron aerosol particles. J. Appl. Phys., 78, 4416–4422.Schmid,O., Karg, E., Hagen,D. E.,Whitefield, P. D., & Ferron,G. A. (2007). On the effective density of non-spherical particles as derived fromcombinedmeasurements
of aerodynamic and mobility equivalent size. J. Aerosol Sci., 38, 431–443.Virtanen, A., Ristimaki, J., & Keskinen, J. (2004). Method for measuring effective density and fractal dimension of aerosol agglomerates. Aerosol Sci. Technol., 38,
1–10.Wang, S. C., & Flagan, R. C. (1990). Scanning electrical mobility spectrometer. Aerosol Sci. Technol., 13, 230–240.


Paper II
Rostedt, A., Marjamäki, M., Yli-Ojanperä, J., Keskinen, J., Janka, K., Niemelä,V. andUkkonen, A., 2009. Non-Collecting Electrical Sensor for Particle Concentration Meas-urement. AAQR, 9:470–477, doi: 10.4209/aaqr.2009.03.0023
© Taiwan Association for Aerosol Research


Aerosol and Air Quality Research, 9: 470-477, 2009 Copyright © Taiwan Association for Aerosol Research ISSN: 1680-8584 print / 2071-1409 online doi: 10.4209/aaqr.2009.03.0023
Non-Collecting Electrical Sensor for Particle Concentration Measurement Antti Rostedt1*, Marko Marjamäki1, Jaakko Yli-Ojanperä1, Jorma Keskinen1, Kauko Janka2, Ville Niemelä2, Ari Ukkonen2 1 Tampere University of Technology, Department of Physics, Aerosol Physics Laboratory, P.O.Box 692, FI-33101 Tampere, Finland 2 Dekati Ltd, Osuusmyllynkatu 13, FI-33100 Tampere, Finland ABSTRACT
A novel particle emission sensor based on particle charging and electrical detection is presented. The sensor charges the particles and measures the current carried by the particles exiting the sensor. The measurement is carried out without collecting the particles. Thanks to this principle, the mechanical construction of the sensor can be such that the sensor is not prone to fouling. The intended application of the sensor is the measurement of particle emission of diesel vehicles. The sensor is placed directly in to the exhaust flow of the tested vehicle, and because of that there is no need for any sampling or dilution of the exhaust gas. This together with the electrical measurement method allows rapid time response, and consequently, real time measurement of test cycles or on-road driving.
The sensor was tested in the laboratory and a theoretical model was build to predict the response of the instrument. The model can be used for converting the measured signals to the particle concentration or emission rate. Good correlation with a reference instrument was obtained in a diesel test cycle measurement. Keywords: Particle; Sensor; Diesel exhaust; Real time. INTRODUCTION
The need to measure aerosols has increased substantially in
recent years–mainly because of the undesirable effects they have on our health and the environment and the role particles play in atmospheric processes and climate change. Particle emissions and ambient and workplace particle concentrations and exposure are measured to ensure that the limits set by the legislation are met and that the public is not exposed to undesirable concentrations of aerosols. The health of the employees needs to be considered, as the number of manufacturing processes where materials pass through an aerosol phase is increasing rapidly, in areas from pigments, powders, and pharmaceuticals to optical fibers. Such applications require constant monitoring at many different locations or portable instrumentation that can be easily transferred between the locations of interest. In addition, with low cost portable instrumentation the particle emission sources could be monitored more easily and more extensively. Although the information obtained with a simple sensor type measurement can be quite limited compared to a full featured measurement set-up, there are some clear advantages. Usually most modern fine particle instruments can provide a lot of detailed information about the aerosol measured, but the cost and complexity of these devices is a major concern. Furthermore when using these devices, there is commonly need for sampling and sample conditioning systems. They not only add on to the cost and complexity, but they can also have some unwanted side effects to the measured sample. Despite its limitations a simple sensor type measurement could be very useful, when monitoring relatively well known aerosol or in particularly when monitoring changes in the aerosol content. ∗ Corresponding author. Tel.: 358-3-3115-11;
Fax: 358-3-3115-2600 E-mail address: [email protected]
In engine exhaust particle emission measurement, which is the application for the sensor presented in this study, several different measurement techniques have been used. Mohr et al. (2005) lists various particle measurement instruments for particle emissions of modern vehicles. Those utilize the most commonly used measurement techniques, including mass based, optical and electrical techniques. A common feature of the listed instruments is that they need sampling and sample conditioning before the actual measurement. Most commonly used sample conditioning includes some kind of a dilution system to dilute and to lower the sample temperature and water content. The use of a dilution system adds delay and averaging to the sample and for comparative results similar dilution system and operational parameters must be used (e.g. Mathis et al., 2004). A dilution system also slows the time response of the measurement system. This may be a significant disadvantage when rapid transient phenomena are investigated.
Simple sensor type solutions, such as opacimeter and filter smoke number (FSN), are especially well suited for engine development, inspection and maintenance related particle measurements, where often only relative quantities of the emission are required. The opacimeter (e.g. ISO 3173, SAE J1667), commonly used in inspection tests, measures extinction of light in the exhaust gas in the visible or near infrared wavelength regions and it has been commonly used in the past. The FSN is also widely used as a simple technique to measure diesel particle emission, where the particles are first collected to a filter surface and then the blackening of the filter is measured optically. Although requiring particle collection for the measurement, only simple equipment is needed. A more modern technique capable of on-line soot measurements is laser induced incandescence (LII, Quay et al., 1994). The measured soot containing flow is illuminated with a pulsed laser source and the blackbody radiation from the heated soot particles is detected. LII can be used as an imaging measurement, enabling both spatial and temporal measurement of the soot volume fraction and primary particle size of the soot as demonstrated by Will et al.

Rostedt et al., Aerosol and Air Quality Research, 9: 470-477, 2009 471
(1995). The measurement can be used to study the soot formation inside the flame region of a combustion process.
Other promising and relatively simple instruments are the photoacoustic sensor (Petzold and Niessner, 1996) and the diffusion charger (e.g. Ntziachristos et al., 2004). The photoacoustic sensor utilizes the high absorption coefficient of the soot and measures acoustic signals originating from the particles heated by pulsed light source. With the diffusion charger measurement the particles are usually charged using an unipolar corona discharge charger after which the particles are collected with a Faraday cup filter and the charge on the particles is measured as a current signal. The outcome of the diffusion charger measurement is related to the total active surface of the aerosol measured.
In general, electrical measurement methods seem promising, when aiming towards a simple sensor solution for aerosol measurement. The simplicity and ruggedness of the electrical measurement methods are the key properties. Electrical measurement methods also provide fast response times, which make it possible to use them in real time measurements of a changing aerosol. With electrical methods, the particle size or the concentration cannot be measured directly. If the measured aerosol and the properties of the sensor are known, the measured electrical signals can be converted for instance into a number or mass concentration. In emission measurement, the temporal concentration values need to be converted into temporal emission rate values (#/s, mg/s), integrated over time and divided by the produced energy or travelled distance. The current regulations for particle emissions are based on total mass (mg/km, mg/kWh). A proposal for particle number emission measurements (#/km, #/kWh) is included in future Euro V/Euro VI regulations (Regulation (EC) No 692/2008).
In this paper, an aerosol particle sensor capable for measuring particle emission of a diesel vehicle is presented and evaluated (Janka et al., 2007; Niemelä et al., 2007; Tikkanen et al., 2007). The sensor is placed directly in contact with the measured exhaust flow ensuring simple and easy to use measurement set-up. Although the presented sensor is tailored to a focused application, the same principle could easily be used for other purposes as well; in fact a similar measurement method has been previously used in monitoring the air quality in work environments (Lehtimäki, 1983). The sensor presented here is named the Electrical Tail Pipe Sensor (ETaPS) and it is commercially available from Dekati Ltd, Finland.
SENSOR DESIGN
The operation principle of this sensor is based on a non-
collective electrical measurement. The system consists of an electrically isolated corona discharge circuit and an electrometer to measure the leakage current from the discharge. In operation, the corona discharge unit, i.e. the probe, is placed inside the flow channel, so that the flow containing particles to be measured flows around and through the probe. A fraction of the particles in the flow pass through the sensor volume where they are charged by the corona discharge. While some of particles may deposit on the sensor’s surfaces, the majority exit, and thereby remove charge, from the sensor volume. Because the corona discharge circuit is electrically isolated from the surroundings, this loss of charge can be seen as a leakage current from the system and it is measured by an electrometer. Since we want only the particles to contribute to the measured signal, escaping of ions from the system must be prevented. This is done with the corona electrodes, which also form an ion trap inside the sensor probe. Particles collected inside the probe do not contribute to the measured current; only the charge carried away from the probe with particles will be measured. In this way, the passage of particles through the sensor can be recorded without additional
sampling and collection of the particles. The resulting small detection volume located directly in the exhaust stream enables fast response time.
The sensor is placed directly in contact with the measured aerosol flow to simplify the measurement set-up. As a disadvantage this exposes the sensor to a harsh environment where it must tolerate high variations in temperature and flow velocity. The aerosol concentration inside the tailpipe can be really high, of the order of 109 1/cm³ at the most. To withstand all this, the sensor must be build so that it is rugged and not prone to fouling. In addition, the electrical measurement method needs good insulators to operate correctly. Insulators need to stay clean and inside the operating temperature range of the insulating materials. For this, the use of cooling and sheath flows must be used. The total sheath air flow rate is 50 L/min, which is less than five percent of the flow rate inside the exhaust line at the most. Based on the tests done, this has negligible effect on the measurement. The designed operation limits of the presented sensor are collected to the Table 1.
The operational concentration range depends on the particle size and flow velocity inside the flow channel. This is due to velocity dependent residence time in charger. The values shown in Table 1 are calculated to cover the whole flow velocity range of 3-50 m/s and particle number median size range of 40-100 nm. For instance for constant flow velocity of 20 m/s, the concentration range is 4 × 10³-7 × 10⁸ for a lognormal size distribution with a median size of 100 nm and a GSD of 1.8.
The response time of the sensor is not practically restricted by physical properties of the charging process involved, which makes the method ideal for real time measurement. In the actual sensor the response time is electrically limited to 1 s, but even faster response times could be used if needed. A cross section view of the sensor probe together with an equivalent electrical circuit is presented in Fig. 1.
EXPERIMENTAL SET-UP
The laboratory measurements were made using a measurement setup presented in Fig. 2. The set-up consisted of a channel system, where a ducted fan circulated the air through the tested sensors and an air filter. There were two identical sensor prototypes fitted to the flow channel one after the other. The first sensor (Sensor 1) was primarily used in the tests and the second one (Sensor 2) was used just for comparison. All data presented here is measured with the first sensor. For both sensors the sheath air flow rate was set to 50 L/min. The filter in the set-up cleaned the test flow from particles. An exhaust port was needed, because the feed of the test particles and the sheath flows of the sensors led to an excess flow from the system. During the tests the flow velocity was measured with a flow sensor and it could be varied by the rotation speed of the fan in the range of 1-35 m/s. The channel size, where the sensors were fitted, was 100 mm in diameter and to reduce pressure drop in the system the diameter was 250 mm elsewhere. To ensure stable flow profile around the sensor probes, they were fitted so that there was enough free space in before and after the sensors for the flow to stabilize.
The aerosol sample for the reference measurement was taken from the flow before the sensors and it was diluted with an
Table 1. Designed operation limits of the sensor.
Parameter Range Temperature 0-400°C Flow velocity 3-50 m/s Particle concentration 105-108 1/cm³ Sheath air flow rate (total) 50 L/min

Rostedt et al., Aerosol and Air Quality Research, 9: 470-477, 2009 472
Fig. 1. Cross section view of the ETaPS sensor probe on the left. On the right the equivalent electrical circuit of the sensor.
Fig. 2. Measurement set-up for laboratory tests. The DOS aerosol used in the tests was generated with a condensation-evaporation generator. As reference measurement ELPI and SMPS systems were used. ejector diluter with a dilution ratio of 10.5. As reference instruments an Electrical Low-Pressure Impactor (ELPI, Keskinen et al., 1992) and a Scanning Mobility Particle Sizer (SMPS, Wang and Flagan 1990) were used. With these instruments the number size distribution of the test aerosol could be monitored together with the total concentration. The SMPS system was run with flow rates of 0.6 L/min of aerosol and 6 L/min of sheath air, which gave the measurement size range of 10-420 nm. The operational size range of the ELPI system was 7 nm-10 μm. The sample time of the SMPS was set to 120 s, whereas the ELPI size distribution was saved with 1 s interval. The data from the sensors was also saved with 1 s interval. All tests were performed in normal laboratory conditions and temperatures.
The test aerosol was generated from dioctyl sebacate (DOS) with an evaporation-condensation generator (e.g. Liu and Lee, 1970). With the generator, the median size of the test aerosol could be adjusted from 40 to 120 nm, while the geometric standard deviation was typically around 1.5. An example of a
normalized and averaged size distribution used in the measurements is shown in Fig. 3. The ELPI was used to monitor the stability of the test aerosol in real time during the measurements. The particle concentration in the test flow could be varied by controlling the flow rate of the generated aerosol into the test flow. The generated aerosol was fed to the system 4 m before the tested sensors. The Reynolds number in the test flow was 26000 at the minimum. This indicates a high turbulence level, ensuring a complete mixing of the test aerosol. INSTRUMENT RESPONSE
The charge level of the particles as such is not detected, only the charge particles acquire and carry away from the probe is detected. Therefore the initial charge of the particles does not affect the measurement, as long as it is well below the level acquired inside the probe. The measured current is proportional to the particle flux through the sensor and the charge that particles acquire inside the charger. For a charging process

Rostedt et al., Aerosol and Air Quality Research, 9: 470-477, 2009 473
Fig. 3. Normalized average size distribution of the linearity test.
independent of the exhaust flow velocity and particle size, the output would be a direct measure of particle emission rate (#/s). However, the change in the charging efficiency with different flow velocities causes some nonlinearity to the sensor output compared to the actual particle flux in the measured flow. In addition, the amount of charge the particles acquire while travelling through the sensor depends on particle size through the so called active surface of the particles. That dependence has been used previously to measure the surface area content of aerosols by using conventional diffusion chargers. (Ntziachristos et al., 2007).
Linearity
First of all we have to have a look on the sensor linearity to test the correct operation of the sensor. If the shape of the particle size distribution and the flow velocity do not change, the sensor output should be linear as a function of the particle concentration. To test this, the dependence of the sensor output signal on the particle concentration in the flow was measured with two flow velocities 10 m/s and 35 m/s. During the measurements only the concentration of the aerosol was varied, particle size distribution was kept constant and monitored with SMPS and ELPI. During the measurements the number median size of the aerosol distribution was 134 nm with GSD of 1.56. The measured sensor
output signal was compared to the total number and surface area concentrations measured with SMPS in Fig. 4. From the comparison it can be seen that the sensor output is linear as a function of the particle concentration and the slope of the response curve depends on the flow velocity inside the channel and probe. The slight curvature seen on the number concentration correlation (left side of Fig. 4.) is caused by a small variation on the number median size of the distribution during the measurements. The effect of the variation does not show on the surface area correlation (right side of Fig. 4), since the particle charging and the sensor correlates better to the surface area concentration than to number concentration. Based on Fig. 4, we can use the ratio of the measured signal to the particle concentration in the following data analysis. Effect of Particle Size and Flow Velocity
Because the sensor output signal originates from the charging of the particles with a corona discharge, both the properties of the particles (mainly the particle size) and their velocity through the charging region affects the measured signal. To understand the effect of these parameters, the sensor output signal needed to be studied with different particle sizes and flow velocities.
The effect of particle size could be studied using monodisperse particles, but in this case the required volumetric flow rates were so high that monodisperse particles could not be generated in sufficient concentrations for the measurement. Therefore the effect of particle size was studied with lognormal polydisperse distributions having different median diameters. The effect of particle size distribution with different flow velocities are shown in Fig. 5. In the figure, sensor output normalized with particle number concentration is plotted against the median size of the measured size distribution with different but constant flow velocities. The coordinate axis on the figure represents the response of the sensor to particle number concentration, and it has the same units as the charging efficiency of the ELPI (Keskinen et al., 1992.).
Modeling of the Response
To gain understanding on the operation of the charger, a model is built based on the measurements. To explain the measured output signal, we have to look on the charging processes involved. Because the particle size range in this application is around 100 nm, the particle charging processes involved are primarily diffusion and secondly field charging. The total number of elementary charges per particle is approximated as the sum of the charges acquired by diffusion charging and field charging, i.e.
Fig. 4. Concentration dependence: Comparison of the sensor signal and total number concentration on the left and comparison of sensor signal and the total surface area concentration.

Rostedt et al., Aerosol and Air Quality Research, 9: 470-477, 2009 474
Fig. 5. Dependence of the sensor output on the median diameter of the size distribution. The sensor output is normalized to SMPS total number concentration for comparison. The solid line is simulated sensor output with fitted charger efficiency (Eq. (4)).
e
dE
ee
kTetNecd
e
kTdpennn
peavejippfd
p2
0
2
20 0
23
8ln
2+
+=+=
tNeZe
e
tNeZ
ii
ii
00 4
114 +
(1)
where ε0 is the permittivity of vacuum 8.85 × 10⁻¹² F/m, ε is the relative permittivity of the particles 4, dp is the particle mobility diameter, k is the Boltzmann constant 1.38 × 10²³ J/K, T is the temperature of the gas 293 K, e is the charge of the elementary charge 1.602 × 10⁻¹⁹ C and ic is the average thermal velocity of the charging ions 240 m/s, Eave is the fitted average electrical field in the charging region and Zi is the mobility of the charging ions 1.5 × 10⁻⁴ m²/s. The diffusion charging of the particles depends on the particle size and the Nit product, which is a product of the ion concentration and the residence time of the particles inside the charging region. Field charging depends also on the Nit product, but it also depends on the average electrical field inside the charging region and the permittivity of the particles.
The increase in the velocity of the measured flow should also increase the current which is measured from the sensor, since the amount of particles traveling through the charging region per second increases. However the flow velocity Vflow also affects the residence time t: an increase in the flow velocity reduces the residence time and the Nit product. Therefore the increase in the measured current is not linear to the flow velocity. The residence time depends on the flow velocity inside the charging region. Since the sensor probe can be considered as a porous medium in the flow, the flow velocity inside is smaller by a factor R. This gives for the residence time the approximate form shown in the Eq. (2)
)(, minVVRVVL
t flowchch
eff −== (2)
An artificial term Vmin is added to the equation to simulate the
fact that below a certain minimum flow velocity no charged particles can exit the charger, i.e. all of the particles are collected inside the charger by electrical forces. Leff is the fitted effective length of the charging region in the flow direction. The ratio R describes the ratio of flow velocities inside and outside of the charging region. Theoretical calculation of the ratio R (“effective porosity”) gives a value of 0.29. The calculation has been performed according to the following principles and assumptions: Since the detection volume is inside of two perforated cylinders, the aerosol flows through four perforated plates – two plates prior and two after the charging region. Because of this the total pressure drop between the inlet and outlet faces of the sensor is the sum of the pressure drop of each perforated plate. Following estimations and approximations have been made: 1) The curvatures of the plates are assumed to be negligible in the streamlines following through the charging region. 2) The discharge coefficient Cd of each hole of the perforated walls is assumed to be 0.7. 3) The flow field reaches a fully developed state prior to each wall.
The resulting response of the charger, Ech, can be written as
neVVRpdE flowductch )(41
min2 −= (3)
where the diameter of the flow channel is dduct, R is the ratio of the flow velocity inside the charging region and e is the elementary charge. For practical use of the sensor, the output signal should be converted to a relevant concentration or emission value. Presented model can be used for this purpose, if the flow velocity and size distribution of the measured aerosol is known.
As seen in Fig. 5 the response of the particles increases with increasing particle size, which is expected since charging efficiency increases with increasing particle size. The response also increases with the increasing flow velocity. This is attributed to the fact that the amount of particles passing through the sensor increases increasing the charge carried away by the particles. The actual charging efficiency for individual particles decreases with increasing flow velocity, since the residence time inside the charging region decreases.
We can use the theoretical approach presented to build a fit for the response of the instrument. The fit can then be used to predict the response of the instrument for different aerosol size distributions. The output current of the sensor is the integral equation of the response of the charger and the size distribution as follows:
∫= ppflowpch dd)N(d)V,(dEsI (4)
The term N(dp) is the number concentration as a function of
particle size, Ech is the response of the charger as a function of particle size and flow velocity as derived in Eq. (3). The fit is constructed so that the parameters for the theoretical model are fitted to minimize the difference between the measured current and the current simulated from the measured size distribution using the theoretical model.
Now selected parameters from the equations of the average charge number (Eq. (1)) are fitted so that the simulated currents agree with the corresponding measured currents. Parameters used for the fitting are ion concentration, average electric field, minimum flow velocity and effective length of the charging region. The fitted parameter values are collected to Table 2. It has to be remembered that values are not thought to be physically accurate; they are just values that give the best prediction for the operation and response of the instrument. Even so, all of the fitted values are realistic and feasible for the used construction.

Rostedt et al., Aerosol and Air Quality Research, 9: 470-477, 2009 475
Table 2. Fitted parameters to particle charging model.
Description Symbol Value Effective length of the charging region Leff 6.8 × 10⁻³ mm
Average electric field Eave 2.07 × 10⁵ V/m Ion concentration Ni 1.28 × 10¹⁵ 1/m³ Minimum flow velocity Vmin 1.6 m/s
The resulting response with different flow velocities are plotted to Fig. 6. All of the measurements for this study were used to generate the fit. In Fig. 7, the simulated sensor outputs using the fit are plotted against corresponding measured values. As can be seen from the figure the fit predicts the measurements nicely, suggesting that the fit is reliable and can be used to predict results. Size dependence of the response predicted by the fit is also plotted with solid line in Fig. 5.
The fit can be used to estimate the response of the instrument for different size distributions, as plotted in Fig. 8. Only number concentration response is shown in the figure, but mass concentration and number or mass emission rate responses could be easily constructed for any given aerosol size distribution. With
Fig. 6. Fitted charging efficiency curves for the sensor with different flow velocities.
Fig. 7. Simulated sensor output as a function of the measured output. the aid of the obtained response, the current signal from the sensor can be converted to a number or mass concentration value, if the flow velocity and properties of the size distribution of the measured aerosol are known. The emission rate responses do not depend on the flow velocity of the measured flow as much as the number or mass concentration response. This makes it possible for a narrow flow velocity range to convert the sensor output to an emission rate value by using a simple conversion factor without the need of measuring the flow velocity.
TEST MEASUREMENTS WITH DIESEL EXHAUST
The designed sensor is intended to measure the particle concentration of a diesel engine exhaust. Moreover, the whole sensor is intended to be mounted so that the raw exhaust gases flow through the sensor probe. To test the sensor design, diesel exhaust measurements were made. Fig. 9 demonstrates the operation of the sensor in a real life measurement. The figure shows how the particle mass concentration inside the exhaust line changes during an engine test cycle. The measured sensor signal is first converted to a number concentration value with the aid of Eq. (4) by assuming the particle size distribution to be constant with a median size of 80 nm and a GSD of 1.75. After that the number concentration was converted to a mass concentration.
Fig. 8. Sensor response for different lognormal size distributions as a function of the flow velocity. On the left the effect of the median diameter with constant GSD of 1.80 and on the right the effect of the GSD with a constant median size of 80 nm is shown.

Rostedt et al., Aerosol and Air Quality Research, 9: 470-477, 2009 476
Fig. 9. Mass concentration of a diesel exhaust during a test cycle measured with ETaPS sensor and DMM together with a flow velocity inside the exhaust line. The effective density of the particles was assumed to obey a fractal law, with a mass fractal dimension of 2.6 (e.g. Virtanen et al., 2002). The resulting mass concentration is plotted to Fig. 9 as a function of time. Corresponding mass concentration values obtained with a Dekati Mass Monitor (DMM-230, Lehmann et al., 2004) are shown for comparison.
It can be seen from Fig. 9, that the mass concentration measured with the sensor follows the reference measurement. We can see that the emission peaks from the changes in the engine load are much sharper in the ETaPS data than what measured with the DMM. This shows the effect of slower response time of the dilution system used in the DMM measurement. ETaPS can distinguish the short concentration peaks during engine loading transients, while the diluter-DMM combination smoothes the peaks significantly. Fig. 10 shows a correlation plot, where the
Fig. 10. Mass concentration measured with the sensor as a function of reference mass concentration measured with DMM. The minimum value of the y-axis is limited to the detection limit of the sensor, caused by the data logging and selected sensor sensitivity range for the measurements.
mass concentration measured with the sensor is plotted against the reference measurement. Since the instruments have a different time responses, an additional time constant of 1.8 seconds was artificially added to the ETaPS sensor signal to have similar time responses in both instruments. The correct time alignment of the data was found by cross correlation. Finally a time constant of 10 s was added to both measurement data to add averaging and to reduce the effects of timing misalignments in the sensor and flow velocity measurements. Then the correlation between the instruments was calculated and the resulting correlation plot is shown in Fig. 10. With the diesel engine measurements the mechanical structure withstood the extreme conditions inside the exhaust line. The operation of the sensor has been successfully tested in temperatures ranging up to 400°C with a flow velocity ranging up to 50 m/s. Although the operation times of the sensor depends on the concentrations measured, with modern diesel engines having low emissions the sensor can be operated without need for cleaning.
DISCUSSION AND CONCLUSIONS
The presented sensor design allows in situ measurement of
aerosol concentration without any dilution or sampling systems. This allows faster response time and simpler measurement setup compared to traditional aerosol instrumentation. With the sensor events such as engine start ups and sudden changes of engine load can be easily monitored. The measured particles are not collected by the sensor allowing longer operation times without service.
The response of the sensor depends primarily on the particle flux through the sensor and the presented theoretical model can be used to predict the response of the instrument in different measurement conditions. If the size distribution of the measured aerosol is known, the model can also be used to convert the measured sensor signal into a concentration value. The model is useful in predicting the operation of the sensor and it can be used as an aid when the measurement principle is used in other applications. Depending on the application, the quantity that is sought after can be different. It can be for example number or mass concentration or active surface of the particles.

Rostedt et al., Aerosol and Air Quality Research, 9: 470-477, 2009 477
In the studied configuration, the response of the sensor is affected by the flow velocity in the measured exhaust flow. This is a trade off with the simplicity of the measurement set-up. This same type of measurement method can also be used with a forced constant flow system to overcome this dependence of the flow velocity. The operational concentration range of the sensor is 104-108 1/cm³ with a flow velocity range of 3-50 m/s. The operation of the designed sensor was tested successfully in the conditions of the exhaust line of a running diesel engine.
The calibration measurements presented here were made at room temperature. In order to increase the accuracy in diesel exhaust measurements, the effect of the elevated temperature of the exhaust gases must be included into the developed model. In the exhaust gas measurements, although the effect of temperature was not taken into account, the correlation in the mass concentration of the sensor to the reference measurement was good. ACKNOWLEDGEMENTS
The vehicle test measurements were done during New York State Energy Research and Development Authority (NYSERDA) programme "Evaluation of On-Board Real-Time Particulate Emissions Measurement Technologies". William "Butch" Crews from Southern Research Institute and Jill Hendren and the test cell personnel from Environmental Canada are acknowledged for their help during the measurements.
Dr. Marjamäki was funded by the Academy of Finland grant number 109124.
REFERENCES Janka, K., Niemelä, V., Lamminen, E., Keskinen, J., Rostedt, A.
and Lemmetty, M. (2007). Design and Performance Evaluation of a New Non-Collective Electrical Aerosol Sensor. European Aerosol Conference 2007, Salzburg, Abstract T02A037.
Keskinen, J., Pietarinen, K. and Lehtimäki, M. (1992). Electrical Low Pressure Impactor. J. Aerosol Sci. 23: 353-360.
Lehman, U., Niemelä, V. and Mohr, M. (2004). New Method for for Time-Resolved Diesel Engine Exhaust Particle Mass Measurement. Environ. Sci. Technol. 38: 5704-5711.
Lehtimäki, M. (1983). In Modified Electrical Aerosol Detector. Aerosols in the Mining and Industrial Work Environments, Vol. 3, Marple, V.A. and Liu, B.Y.H. (Eds.), Ann Arbor Science Publishers, Ann Arbor, p. 1135-1143.
Liu, B.Y.H. and Lee, K.W. (1975). An Aerosol Generator of High Stability. Am. Ind. Hyg. Assoc. J. 36: 861-865.
Mathis, U., Ristimäki, R., Mohr, M., Keskinen, J., Ntziachristos, L., Samaras, Z. and Mikkanen, P. (2004). Sampling Conditions for the Measurement of Nucleation Mode Particles in the Exhaust of a Diesel Vehicle. Aerosol Sci. Technol. 38: 1149-1160.
Mohr, M., Lehmann, U. and Rütter, J. (2005). Comparison of Mass-Based and Non-Mass-Based Particle Measurement Systems for Ultra-Low Emission from Automotive Sources. Environ. Sci. Technol. 39: 2229-2238.
Niemelä, V., Janka, K., Isherwood, H., Keskinen, J. and Rostedt, A. (Ed.). Non-collective Electrical Aerosol Sensor. Proc. 5th Asian Aerosol Conference, Kaohsiung, Taiwan, 2007.
Ntziachristos, L., Giechaskiel, B., Ristimäki, J. and Keskinen, J. (2004). Use of a Corona Charger for the Characterisation of Automotive Exhaust Aerosol. J. Aerosol Sci. 35: 943-963.
Ntziachristos, L., Polidori, A., Phuleria, H., Geller, M.D. and Sioutas, C. (2007). Application of a Diffusion Charger for the Measurement of Particle Surface Concentration in Different Environments. Aerosol Sci. Technol. 41: 571-580
Petzold, A. and Niessner, R. (1996). Photoacoustic Soot Sensor for In-Situ Bblack Carbon Monitoring. Appl. Phys. B. 63: 191-197.
Quay, B., Lee, T.W., Ni, T. and Santoro, R.J. (1994). Spatially Resolved Measurements of Soot Volume Fraction Using Laser-Induced Incandescence. Combust. Flame. 97: 384-392.
Regulation (EC) No 692/2008 of the European Parliament and of the Council of 18 July 2008.
Tikkanen, J., Moisio, M., Janka, K., Pietarinen, K., Keskinen, J. and Rostedt, A. (2007). Method and a Sensor Device for Measuring Particle Emission from the Exhaust Gases of a Combustion Engine. Finnish Patent FI118278, US patent 7406855.
Virtanen, A., Ristimäki, J., Marjamäki, M., Vaaraslahti, K., Keskinen, J. and Lappi, M. (2002). Effective Density of Diesel Exhaust Particles as a Function of Size. SAE Paper No. 2002-01-0056.
Wang, S.C., Flagan, R.C. (1990). Scanning Electrical Mobility Spectrometer. Aerosol Sci. Technol. 13: 230-240.
Will, S., Schraml, S. and Leipertz, A. (1995) Two-Dimensional Soot-Particle Sizing by Time-Resolved Laser-Induced Incandescence. Opt. Lett. 20: 2342-2344.
Received for review, March 24, 2009 Accepted, July 7, 2009

Paper III
Rostedt, A., Arffman, A., Janka, K., Yli-Ojanperä, J. and Keskinen, J., 2014. Characteri-zation and Response Model of the PPS-M Aerosol Sensor. Aerosol Sci. Technol., 48:10,1022-1030, doi: 10.1080/02786826.2014.951023
© American Association for Aerosol Research


Characterization and Response Model of the PPS-MAerosol Sensor
Antti Rostedt,1 Anssi Arffman,1 Kauko Janka,2 Jaakko Yli-Ojanper€a,1 and Jorma Keskinen11Aerosol Physics Laboratory, Department of Physics, Tampere University of Technology,
Tampere, Finland2Pegasor Oy, Tampere, Finland
The Pegasor PPS-M sensor is an electrical aerosol sensorbased on diffusion charging and current measurement withoutparticle collection. In this study, the role and effect of eachcomponent in the instrument is discussed shortly and the resultsfrom a thorough calibration measurements are presented. Acomprehensive response model for the operation of the PPS-Msensor was developed based on the calibration results andcomputational fluid dynamics (CFD) modeling results. Theobtained response model, covering the effects of the particlecharger, the mobility analyzer, and both diffusion and inertiallosses, was tested in the laboratory measurements withpolydisperse test aerosols, where a good correlation between themodel and the measured results was found.
INTRODUCTION
The concern about the health effects of the exposure to fine
particles has led to an increasing request for aerosol measure-
ment and monitoring. Aerosol concentration measurement
may be realized for various particle properties, such as particle
number, mass, surface area, and volume (Kulkarni et al.
2011). Real time aerosol concentration instruments are usually
based on the electrical or optical detection techniques. The
optical instruments typically utilize light scattering or absorp-
tion of particles, while the electrical instruments are most com-
monly based on charging of the particles and subsequent
measurement of the charge carried by the particles as an elec-
trical current.
Particle charging is usually accomplished by unipolar diffu-
sion chargers based on corona discharge, as reviewed, e.g., by
Marquard et al. (2006) and Intra and Tippayawong (2009).
Because of the simplicity, one of the most straightforward
ways to produce an electrical aerosol detector is to combine
unipolar diffusion charger with a faraday cup electrometer.
The measured quantity is electrical current, which is related to
the particle number concentration and particle size.
Ntziachristos et al. (2004) demonstrated such instrument for
the real time monitoring of active surface area of particles emit-
ted by a diesel engine. Fissan et al. (2007) introduced a similar
instrument with a varying charging efficiency for the monitor-
ing of the lung deposited particle surface area. Recent develop-
ment of these diffusion charger-based instruments has focused
on minimizing the size of the instruments to produce handheld
instruments. The AeraSense Nanotracker (Marra et al. 2009)
and Matter Aerosol DiSCmini (Fierz et al. 2011) are good
examples of such instruments, the latter being even able to pro-
vide information on the average particle size of the measured
aerosol. To make the instrument even smaller, micro-electro-
mechanical (MEMS) techniques have been used by Lee et al.
(2011).
All of the electrical instruments mentioned above are based
on the collection of the particles after charging. Lehtim€aki(1983) demonstrated electrical aerosol instrument without par-
ticle collection, based on measuring the charge escaping the
charger with the charged particles. The idea has also been
applied by Rostedt et al. (2009b). Recently, Fierz et al. (2014)
described a non-collecting instrument based on induced cur-
rent measurement.
The Pegasor PPS-M (Pegasor Oy, Tampere, Finland) sensor
treated in this article is based on the escaping charge principle.
The basic principle of the sensor has been presented by Lanki
et al. (2011). Application of the sensor to engine exhaust
measurements has been described by Ntziachristos et al.
(2011, 2013). In this article, we present the first detailed cali-
bration of the instrument, and a comprehensive model for the
response of the instrument as a function of particle size
together with laboratory test measurements.
SENSOR COMPONENTS AND OVERALL RESPONSE
The operation of the PPS-M sensor is based on electrical
charging and detection of the charged aerosol particles. The
design combines a sheath air-assisted corona charger with an
Received 17 April 2014; accepted 7 July 2014.Address correspondence to Antti Rostedt, Aerosol Physics Labo-
ratory, Department of Physics, Tampere University of Technology,P.O. Box 692, Tampere FI-33101, Finland. E-mail: [email protected]
1022
Aerosol Science and Technology, 48:1022–1030, 2014
Copyright � American Association for Aerosol Research
ISSN: 0278-6826 print / 1521-7388 online
DOI: 10.1080/02786826.2014.951023

ejector pump (Tikkanen 2009). A schematic view of the sensor
(on the left side) and the actual sensor (on the right side) is
shown in Figure 1. The instrument design consists of the fol-
lowing main components: a pre-cut cyclone to prevent the sen-
sor from fouling, an ion source to provide charge to the
particles, an ejector pump to provide the sample flow, an ion
trap to remove the excess ions and to act as a mobility analyzer
for the particles, and an electrometer to measure the charge on
the particles.
Charging and Electrical System
The charger and ejector combination is designed so that the
flow coming out from the ion production area is mixed with
the sample and used as a pump flow in the ejector pump. In the
charging region, the particles are charged by diffusion charg-
ing. The design of the flow-assisted ion source resembles the
design presented already by Whitby (1961). This arrangement
has the advantage of keeping the discharge electrode in a clean
air flow. The volume of the charging region is rather small,
resulting in a relatively low residence time for the charging
process.
An ion trap is applied to prevent the charging ions from
escaping the instrument and contributing to the charge mea-
surement. In the present design, the trap geometry is annular
and the applied electrical field can be varied directly from the
user interface. By changing the electrical field, the cut point of
the ion trap can be changed. The trap is dimensioned so that it
is also able to collect a part of the particles, if the collection
voltage is set high enough. This makes the trap to act as a sim-
ple zeroth-order mobility analyzer, which gives the possibility
to estimate the average particle size of the measured aerosol.
For this, the shape of the size distribution must be either
known or assumed. This technique has earlier been used for
particle density measurement by Rostedt et al. (2009a).
The electrical current measurement is realized without col-
lecting the particles, by measuring the net current leaving the
instrument. As a consequence, the response of the instrument
depends on the initial charge state of the input aerosol and any
ion leakage out from the instrument. Because of this escaping
current measurement technique, the power sources for the
corona charger and ion trap are isolated from the ground. Since
the current is measured with a high sensitivity electrometer
between the isolated virtual ground and the ground potential,
both a low noise level and a high isolation resistance are
required for the isolation. The electrometer is realized using
an operational amplifier with a capacitive feedback circuit.
Because of the electrometer design, the voltage difference
between the two measurement points is well below 1 mV
(Keithley Instruments Inc. 2004). For the practical use of the
sensor, the sampling rate of the electrometer and the low pass
filtering of the measured signal can be altered to suit the appli-
cation in question.
Flow System
Computational fluid dynamics (CFD) simulation was used
for optimizing the flow system of the sensor design. It was pri-
marily used during the design process to estimate the ejector
performance and the turbulent flow patterns inside the sensor.
The CFD simulations also provided information on the diffu-
sion losses within the whole sensor. The flow fields inside the
sensor were modeled using Ansys Fluent 14.0. For the three-
dimensional simulations, SST-k-v turbulence transfer model
was employed, and the computation grid consisted of 2.3 mil-
lion cells. Boundary conditions at the flow boundaries were
pressure inlets and pressure outlets.
The design of the ejector pump was optimized for minimiz-
ing the pressurized air consumption, while still providing
enough pressure difference to provide an adequate sample
FIG. 1. Schematic view of the sensor components on the left and picture of the sensor on the right.
CHARACTERIZATION AND RESPONSE MODEL OF THE PPS-M 1023

flow in a practical measurement setup. The needed pressure
difference was minimized by returning the ejector outlet to the
same pressure with the sample. Practically, this means that in
the sensor there is two connections for the sample flow; one
delivering the sample into the sensor and the other returning
the sample, pump flow, and needed sheath air flows to the
same pressure where the sample is taken.
The CFD modeling indicated the flow to be turbulent in the
mobility analyzer region. The turbulence leads to less steep
collection efficiency curves, which limits the size resolution of
the analyzer. However, this is considered acceptable since the
information from the mobility analyzer is only used for esti-
mating the median size for the measured size distribution.
Sensor Response
All the sensor components contribute to the sensor response
and from a calibration point of view the combined overall
response would be enough. However, in the current design the
operation of the sensor can be altered by the user by varying
the mobility analyzer collection voltage. For this reason, more
thorough understanding on the response is required. The char-
ger charging efficiency Ech and the mobility analyzer penetra-
tion Pma are the main contributors to the overall response,
while the effect of the non-electrical components, such as iner-
tial and diffusion losses, plays a smaller role. The combined
sensor response R is a function of the particle size dp and the
mobility analyzer voltage Vma. It has the form of Equation (1),
where the diffusion and inertial losses are expressed as pene-
trations Pd and Pi, respectively:
R dp;Vma
� �DEch dp;Vma
� �Pma dp;Vma
� �Pd dp
� �Pi dp� �
[1]
Because of the complicated flow path and the integrated
nature of the sensor design, it was not possible to measure the
effect of each component individually. The term Pd describing
the diffusion losses was obtained from the CFD simulations,
while the effects of the remaining components were calculated
from the calibration results.
EXPERIMENTAL
The objective of the calibration measurements was to find
out the sensor response to particle number concentration as a
function of the particle mobility size together with the particle
collection characteristics of the mobility analyzer. The calibra-
tion measurements were started by first verifying the operation
of the integrated electrometer. For this, a reference electric
current source, providing currents from 100 fA to 40 pA, was
used. To ensure the correct current levels, the source was
first calibrated using a Keithley 6430 Remote SourceMeter
(Keithley Instruments Inc., Cleveland, OH, USA).
Sensor Response
In the response calibration, the Single Charged Aerosol Ref-
erence (SCAR; Yli-Ojanper€a et al. 2010) was used as an
aerosol generator. The main advantage of the SCAR is that it
produces a nearly monodisperse aerosol sample with particles
containing only one elemental charge each. The generated
aerosol was then classified by a differential mobility analyzer
(DMA model 3071A, TSI Inc., Shoreview, MN, USA). As a
result a truly monodispersed aerosol was obtained for the cali-
bration measurements. The DMA was used with recirculating
sheath air flow with the flow rate range of 3 to 10 lpm, while the
sample flow was varied from 1 to 2 lpm. With these flow rate
values, the particle size range for the monodisperse calibration
aerosol was 20–920 nm. Although the used sheath air to sample
flow rate ratios were not optimal for the best size resolution of
the DMA, the flow rates were chosen in order to cover a wide
particle size range and to maximize the particle output after the
classification. The flow rate of the recirculated DMA sheath
flow was monitored and controlled by a custom made flow con-
troller unit calibrated with an air flow calibrator (Gillian
FIG. 2. The measurement setup used in the calibration. The SCAR was used as an aerosol source, the DMA for size classification and the CPC acted as the
reference instrument.
1024 A. ROSTEDT ET AL.

Gilibrator-2, Sensidyne, LP, St. Petersburg, FL, USA). The
whole measurement setup is shown in Figure 2.
In order to minimize the effect of the initial charge of the
particles to the sensor response, the aerosol was neutralized
using an 85Kr aerosol neutralizer (Model 3077, TSI Inc.,
Shoreview, MN, USA). To ensure proper operation of the neu-
tralizer, a small feed of pressurized air, 0.3 lpm, was intro-
duced to the sample flow before the neutralizer. This was
needed since the SCAR device produces the particles in a
nitrogen atmosphere. After the neutralizer, the excess ions
were removed by a small electrostatic precipitator (ESP).
Because the total volumetric flow rate needed for the instru-
ments was higher than the output of the classifying DMA, the
sample was diluted by a second flow of pressurized air. Both
dilution air flows were controlled with mass flow controllers
(Alicat Scientific Inc., Tucson, AZ, USA) and the second dilu-
tion air flow was set to a level, which ensured a small excess
flow from the sample line. After the dilution, a static mixer
(Kenics 37-06-110, Chemineer, Dayton, OH, USA) was added
to ensure proper mixing of the produced aerosol and dilution
air. The sample was then divided with a flow divider (Model
3708, TSI Inc., Shoreview, MN, USA) into three parts: one for
the sensor, one for a reference Condensation Particle Counter
(CPC Model 3772, TSI Inc., Shoreview, MN, USA), and one
for an excess flow. In order to ensure good accuracy in the
number concentration measurement, the detection efficiency
of the CPC used as a reference was calibrated with the method
described in Yli-Ojanper€a et al. (2012).During the measurements, the pressure difference between
the sensor inlet and outlet flows was monitored to ensure the
correct sample flow into the sensor. During the measurements,
the differential pressure was 165 Pa, sensor inlet being in a
slightly lower pressure. This underpressure is low compared to
the maximum pressure difference of 4.7 kPa, which the sen-
sors ejector pump can supply with zero sample flow. The volu-
metric sample flow rate measured at the calibration conditions,
i.e., with the same pressure difference, was 6.40 lpm and for
the ejector pump flow a value of 3.63 lpm was measured after
the calibration. For the measurements, the electronics was set
up for 1 Hz sample rate with 3 s digital first-order low pass fil-
ter. With these settings, the short-term noise level of the mea-
suring electronics was around §1 fA. The instrument and
sample gas temperature was 296 § 3 K.
Mobility Analyzer
The measurement setup also provided the possibility to cal-
ibrate the mobility analyzer of the sensor with the help of the
singly charged particles. For the mobility analyzer calibration,
the measurement setup was almost the same described above,
only the aerosol neutralizer and the ESP were removed from
the setup. Additionally, the charger inside the sensor was
turned off. In this measurement, the singly charged particles
were collected by the mobility analyzer inside the sensor,
resulting in a current measured by the sensor electrometer.
The polarity of the current was inverted compared to the nor-
mal operation, since instead of escaping out from the sensor
the particles were collected inside the sensor. The desired
quantity from the measurement was the fraction of particles
collected by the mobility analyzer. The measured quantities
were the current caused by the collected particles and the num-
ber concentration at the sensor inlet. This means that the cur-
rent measured by the sensor needed to be converted to a
particle number. For this, the charge state of the particles must
be known. By using the SCAR as an aerosol source, all the
particles are known to have a single elementary charge with
the uncertainty of 0.16% (H€ogstr€om et al. 2011).
RESULTS
To find out a model for the sensor response, the effect of
each sensor component needs to be studied individually. For
the diffusion losses, the results from the CFD simulations were
used. For the effects of the other components, the parameters
of the model were fitted to the calibration results. The flow sys-
tem performance was also verified by measuring the sample
flow rate and the maximum pressure the ejector can produce.
These values were compared to the values obtained by CFD
simulation. SI units were used for the parameters of the model,
except for the charging efficiency and the overall response.
Those are expressed in units of fAcm3 for convenience.
Flow System Performance and Diffusion Losses
The nominal sample inlet flow was measured with minimal
pressure difference between the sample inlet and outlet. To
find out the maximum underpressure for the ejector with zero
sample flow, a differential pressure meter was connected to
the sample inlet. For the measurement, a nominal supply air
pressure of 0.15 MPa was used. The measured result together
with the corresponding results from the CFD simulations are
collected to Table 1. Although there are some differences, the
agreement between the measured values and the simulation
results is good.
Diffusion losses inside the sensor were simulated in Euler-
ian fashion. Aerosol was fed to the sensor as a component of
TABLE 1
Parameters of the ejector flow system. CFD simulation results
compared to the measured values
Parameter CFD Measured
Pump flow pressure (MPa) 0.15 0.15
Pump flow rate (lpm) 3.2 3.63
Ejector maximum underpressure (kPa) 4.3 4.7
Nominal sample flow rate (lpm) 6.9 6.70
Cyclone cut point (mm) »2.0 —
CHARACTERIZATION AND RESPONSE MODEL OF THE PPS-M 1025

the gas mixture. The boundary condition for aerosol concen-
tration at the wall boundaries was zero in order to calculate the
diffusion flux of particles to the sensor walls. Laminar diffu-
sion coefficient was then adjusted to match the different size
particles (Stokes–Einstein relation was used for the diffusion
coefficient; Hinds 1999). Turbulence enhances the diffusion
inside the sensor, and this was taken into account by using the
effective diffusion coefficient for the aerosol mixture compo-
nent. The effective diffusion coefficient is a sum of the laminar
and turbulent diffusion coefficients, where the turbulent coeffi-
cient is computed from the turbulent transfer model (SST-k-v)
according to the Fluent standard formulation (ANSYS 2011).
The computation grid was tetrahedral, and adapted several
times until the results were unaffected by further improve-
ments. The dimensionless wall coordinate yC was in the range
0.1–3 in the final grid. Next, a functional form of diffusion
losses was fitted to the CFD results. Despite the fact that the
flow inside the sensor is mostly turbulent, it was found that the
transport efficiency for laminar flow through a cylindrical tube
gives the best fit for the modeled diffusion losses. According
to Gormely and Kennedy (1949), the transport efficiency has
the form of Equation (2), which is a function of the particle
(laminar) diffusion coefficient Dp multiplied by a fitted param-
eter m0 D 1.79 £ 105 s/m2. The parameter m0 value corre-
sponds to diffusion losses of a 6 m long tube in laminar flow
conditions with the sample inlet flow rate. The unit for the dif-
fusion coefficient is m2/s.
Pd.Dp/D1¡ 2:56.m0Dp/
2=3 C 1:2m0Dp C 0:177.m0Dp/4=3
m0Dp < 0:03
0:819e¡ 3:657m0Dp C 0:097e¡ 22:3m0Dp C 0:032e¡ 57m0Dp
m0Dp � 0:03
8>>><>>>:
[2]
Mobility Analyzer
The collection of charged particles in the cylindrical mobil-
ity analyzer in the case of turbulent plug flow is obtained using
the equation derived by Deutsch in the 1920s. The penetration
efficiency of the particles can consequently be written as
Pma.dp;Vma/D e¡ neCc
3phgdpZ0.Vma/ [3]
The term in the exponent is the collection efficiency of the
same geometry in laminar flow conditions, which can be
expressed as the ratio of the particle electrical mobility to the
limiting electrical mobility Z0. The electrical mobility is a
function of the particle size dp. The other terms needed are the
number of charges per particle n, the elementary charge e, the
slip correction factor Cc, and the gas viscosity hg. The limiting
electrical mobility is the minimum electrical mobility that
would cause 100% collection efficiency for laminar flow con-
ditions. It is a value specific to the geometry and can be
obtained from the dimensions of the analyzer with the help of
the Equation (4). The dimensions needed are the inner and
outer diameters, si D 0.022 m and so D 0.030 m, length le D0.032 m of the analyzer, the volumetric flow rate inside the
analyzer Qtot, and the applied voltage Vma. The flow rate Qtot
is a sum of the volumetric flow rates of the sample flow Qs and
the ejector pump flow Qp in the conditions of the mobility ana-
lyzer. As seen from Equation (4), the limiting electrical mobil-
ity in the laminar flow conditions is directly proportional to
the total flow rate and inversely proportional to the applied
voltage. All the remaining terms can be combined to a single
constant K:
Z0 Vmað ÞDQtotln
so
si
� �2pVmale
) Z0 D .Qs CQp/K
Vma
[4]
The diffusion losses also contribute to the mobility analyzer
penetration efficiency and the effect was taken into account.
The fit for the PmaPd product, drawn in Figure 3, is obtained
using Equations (2)–(4) with the value K D 1.37 m¡1 for the
constant. This value gives the best fit to the measured data,
although it differs slightly from the value calculated from the
mechanical dimensions Kteor D 1.54 m¡1. As seen in Figure 3,
the penetration efficiency is over 90% for particles larger than
100 nm with all mobility analyzer collection voltages.
Charging Efficiency and Average Number of Charges
The sensor response was obtained from the ratio of the cur-
rent measured with the sensor to the number concentration
measured by the CPC. The response decreases as the mobility
analyzer voltage is increased, since increasing part of the small
FIG. 3. Ion trap acting as a mobility analyzer: particle penetration efficiencies
with different trap voltages. Open symbols are the penetration efficiencies
measured with singly charged particles and the solid line is the penetration
according to the fitted model.
1026 A. ROSTEDT ET AL.

particles is collected by the mobility analyzer. For the sensor
response, a model for the charging efficiency of the charger
Ech is needed. Typically, in unipolar diffusion chargers, the
charging efficiency is approximated by a power function
described by Equation (5), where the parameters a and b are
obtained by fitting to calibration measurements (Kulkarni
et al. 2011).
Ech dp� �D adbp [5]
Because of the ion leakage, it is not possible to have a cali-
bration measurement for the charging efficiency without the
effect of the mobility analyzer. This issue was solved by plot-
ting the sensor responses measured for different mobility ana-
lyzer voltages as a function of the applied voltage for different
particle sizes. Then the responses were extrapolated with a
cubic Hermite spline to zero voltage, resulting in an estimate
for the maximum charging efficiency without the effect of the
mobility analyzer. The plot on the left-hand side of Figure 4
shows an example of the extrapolation. In the plot, the open
markers show the measured sensor responses as a function of
the mobility analyzer voltage for selected particle sizes and
the closed markers show the extrapolated values for zero trap
voltage. The extrapolated values for different particle sizes are
collected to the plot on the right-hand side of Figure 4 as a
function of the particle size. For the extrapolation, only cali-
bration results from particle sizes below 350 nm were used in
order to exclude the effect of the inertial losses. From the
extrapolated data, the values for the parameters a and b in
Equation (5) were obtained.
The main component in the charger efficiency is the prod-
uct of the particle penetration through the charger and the
average number of elementary charges the particles acquire
during charging. Usually the value of the product is enough
for the use of the diffusion charger (Marjam€aki et al. 2000),but in this case the average number of charges per particle is
separately needed in order to calculate the collection effi-
ciency of the mobility analyzer. The number of charges could
in principle be obtained by measuring separately the particle
charge (via electrical mobility) after the charger or the particle
penetration (of charged particles) through the charger. Since
thorough measurement of either would be laborious, the fol-
lowing approximation is used instead. The results in Figure 3
presenting the penetration efficiencies measured with charger
off for singly charged particles at different trap voltage set-
tings indicate that a constant value of 100% could be used as a
first approximation for the penetration with charger off. This
is because the experimental penetration efficiencies are nearly
100% at large particle sizes. To check that the approximation
applies also for the charger on case, the penetration was exper-
imentally determined using 100 nm monodisperse particles
for the charger on and charger off case. The penetration
through the charger for on and off cases was found to be equal
and high, over 95%. Based on this, it was assumed that the par-
ticle losses inside the charger are negligible, excluding the
separately calculated effects of the electrical collection within
the trap, the diffusion losses, and the inertial losses. The aver-
age number of elementary charges per particle was then esti-
mated to be equal to the charging efficiency divided by the
flow rate and the elementary charge. This somewhat underes-
timates the number of elementary charges of the charged par-
ticles, but is expected to be reasonable when limited to a
minimum value of one. The resulting functional form is shown
in Equation (6), where particle diameter is in meters:
nAVE.dp/D 1; dp < 1:63�10¡ 8 m
6:13�107d1:05p ; dp � 1:63�10¡ 8 m
([6]
It turned out that the mobility analyzer collection voltage
affects the sensor response more than can be explained by the
mobility analyzer collection efficiency. The fact that the dif-
ference was seen throughout the measured size range suggests
FIG. 4. Left: measured sensor responses (open symbols) as a function of the applied trap voltage together with the extrapolated responses (closed symbols).
Right: the extrapolated sensor response points with zero trap voltage (closed symbols) with the power function fit (line) as a function of the particle size.
CHARACTERIZATION AND RESPONSE MODEL OF THE PPS-M 1027
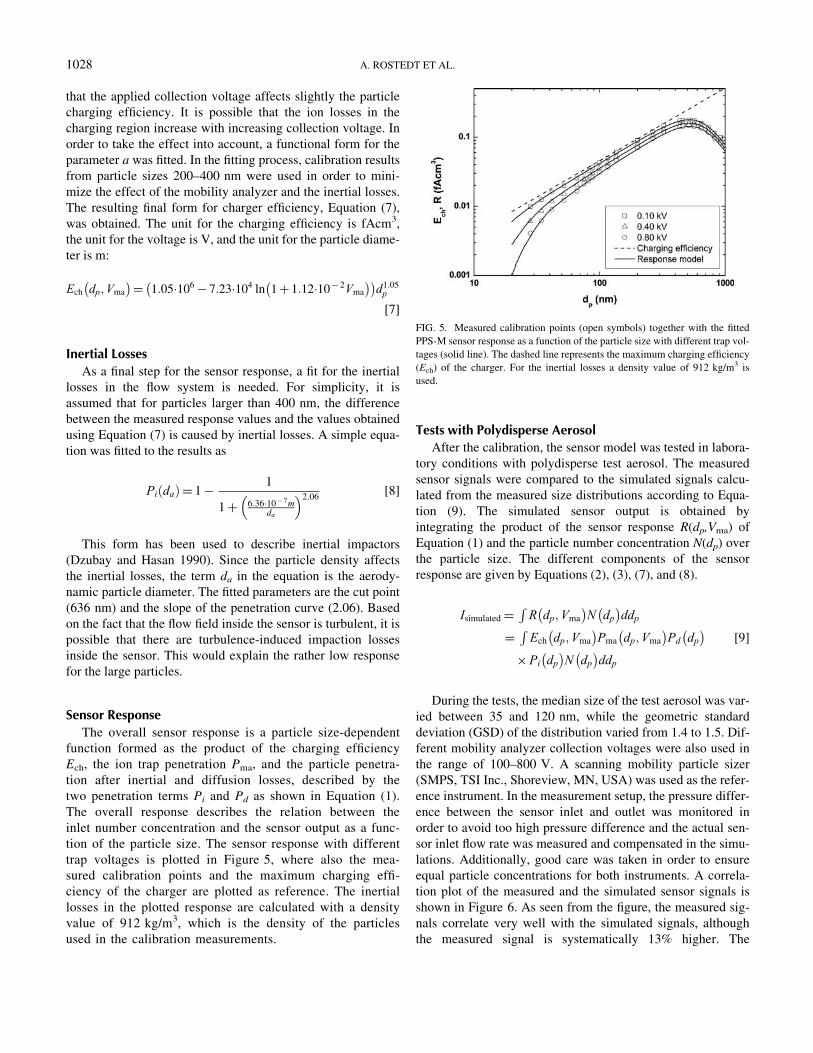
that the applied collection voltage affects slightly the particle
charging efficiency. It is possible that the ion losses in the
charging region increase with increasing collection voltage. In
order to take the effect into account, a functional form for the
parameter a was fitted. In the fitting process, calibration results
from particle sizes 200–400 nm were used in order to mini-
mize the effect of the mobility analyzer and the inertial losses.
The resulting final form for charger efficiency, Equation (7),
was obtained. The unit for the charging efficiency is fAcm3,
the unit for the voltage is V, and the unit for the particle diame-
ter is m:
Ech dp;Vma
� �D 1:05�106 ¡ 7:23�104 ln 1C 1:12�10¡ 2Vma
� �� �d1:05p
[7]
Inertial Losses
As a final step for the sensor response, a fit for the inertial
losses in the flow system is needed. For simplicity, it is
assumed that for particles larger than 400 nm, the difference
between the measured response values and the values obtained
using Equation (7) is caused by inertial losses. A simple equa-
tion was fitted to the results as
Pi dað ÞD 1¡ 1
1C 6:36�10¡ 7mda
� �2:06[8]
This form has been used to describe inertial impactors
(Dzubay and Hasan 1990). Since the particle density affects
the inertial losses, the term da in the equation is the aerody-
namic particle diameter. The fitted parameters are the cut point
(636 nm) and the slope of the penetration curve (2.06). Based
on the fact that the flow field inside the sensor is turbulent, it is
possible that there are turbulence-induced impaction losses
inside the sensor. This would explain the rather low response
for the large particles.
Sensor Response
The overall sensor response is a particle size-dependent
function formed as the product of the charging efficiency
Ech, the ion trap penetration Pma, and the particle penetra-
tion after inertial and diffusion losses, described by the
two penetration terms Pi and Pd as shown in Equation (1).
The overall response describes the relation between the
inlet number concentration and the sensor output as a func-
tion of the particle size. The sensor response with different
trap voltages is plotted in Figure 5, where also the mea-
sured calibration points and the maximum charging effi-
ciency of the charger are plotted as reference. The inertial
losses in the plotted response are calculated with a density
value of 912 kg/m3, which is the density of the particles
used in the calibration measurements.
Tests with Polydisperse Aerosol
After the calibration, the sensor model was tested in labora-
tory conditions with polydisperse test aerosol. The measured
sensor signals were compared to the simulated signals calcu-
lated from the measured size distributions according to Equa-
tion (9). The simulated sensor output is obtained by
integrating the product of the sensor response R(dp,Vma) of
Equation (1) and the particle number concentration N(dp) over
the particle size. The different components of the sensor
response are given by Equations (2), (3), (7), and (8).
Isimulated DRR dp;Vma
� �N dp� �
ddp
D REch dp;Vma
� �Pma dp;Vma
� �Pd dp
� �£Pi dp
� �N dp� �
ddp
[9]
During the tests, the median size of the test aerosol was var-
ied between 35 and 120 nm, while the geometric standard
deviation (GSD) of the distribution varied from 1.4 to 1.5. Dif-
ferent mobility analyzer collection voltages were also used in
the range of 100–800 V. A scanning mobility particle sizer
(SMPS, TSI Inc., Shoreview, MN, USA) was used as the refer-
ence instrument. In the measurement setup, the pressure differ-
ence between the sensor inlet and outlet was monitored in
order to avoid too high pressure difference and the actual sen-
sor inlet flow rate was measured and compensated in the simu-
lations. Additionally, good care was taken in order to ensure
equal particle concentrations for both instruments. A correla-
tion plot of the measured and the simulated sensor signals is
shown in Figure 6. As seen from the figure, the measured sig-
nals correlate very well with the simulated signals, although
the measured signal is systematically 13% higher. The
FIG. 5. Measured calibration points (open symbols) together with the fitted
PPS-M sensor response as a function of the particle size with different trap vol-
tages (solid line). The dashed line represents the maximum charging efficiency
(Ech) of the charger. For the inertial losses a density value of 912 kg/m3 is
used.
1028 A. ROSTEDT ET AL.

difference between the measured and simulated values is most
likely caused by the combined effect of the detection effi-
ciency of the SMPS and the decreased concentration measure-
ment accuracy caused by flow unbalance within the SMPS
DMA. Instead of the sheath air recirculation used in the cali-
bration measurements, the DMA flow rates were measured
separately with the integrated mass flow meters that are cali-
brated on an annual basis. While this ensures good accuracy
for the DMA total flow rate and consequently good accuracy
on the particle size measurement, it does not ensure a good
balance of the sample and monodisperse flows. This possible
unbalance leads to a decreased accuracy for the particle con-
centration measurement.
CONCLUSIONS
In this article, calibration results together with a compre-
hensive model for the response of the PPS-M sensor were pre-
sented. The sensor was calibrated with monodisperse test
aerosol, produced with the single charged aerosol reference
(SCAR) by using calibrated condensation particle counter
(CPC) as the reference instrument. The used calibration setup
provided the possibility to have a calibration also for the sen-
sors integrated mobility analyzer. CFD modeling results, used
primarily to aid the sensor design, were used as a starting point
for the sensor response model. The model covers the effects of
the charging efficiency of the charger together with the aver-
age number of elementary charges it produces to the particles,
the collection efficiency of the mobility analyzer, and both dif-
fusion and inertial losses for the particles. The obtained model
fits very well to the calibration data. Although the mobility
analyzer is not ideal for mobility classification, the mobility
analyzer part of the model is in good agreement with both the
measured collection efficiencies and the expected collection
efficiency based on the mechanical dimensions. The overall
response model was also tested in the laboratory measure-
ments with polydisperse test aerosols and the results were in
good agreement with the model.
In applications, where the particle size distribution stays
relatively stable and a good approximation can be made for
the distribution, it is possible to calculate conversion factors
with the help of the model. These factors can be used in con-
verting the sensor output to number, surface area, or mass con-
centration. The accuracy of the conversion depends on the
accuracy of the size distribution approximation. The model
brings also more insight on the instrument performance for the
data analysis.
FUNDING
This work was conducted within the Measurement, Moni-
toring and Environmental Assessment (MMEA) research pro-
gram of CLEEN Ltd., supported by Tekes.
REFERENCESANSYS Inc. (2011). ANSYS Fluent Theory Guide, 14th release. ANSYS Inc.,
Canonsburg, PA.
Dzubay, T. G., and Hasan, H. (1990). Fitting Multimodal Lognormal Size Dis-
tributions to Cascade Impactor Data. Aerosol Sci. Technol., 13(2):
144–150.
Fierz, M., Houle, C., Steigmeier, P., and Burtscher, H. (2011). Design, Calibra-
tion, and Field Performance of a Miniature Diffusion Size Classifier.
Aerosol Sci. Technol., 45(1):1–10.
Fierz, M., Meier, D., Steigmeier, P., and Burtscher, H. (2014). Aerosol Mea-
surement by Induced Currents. Aerosol Sci. Technol., 48:350–357.
Fissan, H., Neumann, S., Trampe, A., Pui, D., and Shin, W. (2007). Rationale
and Principle of an Instrument Measuring Lung Deposited Nanoparticle
Surface Area. J. Nanopart. Res., 9:53–59.
Gormely, P. G., and Kennedy, M. (1949). Diffusion from a Steam Flowing
through a Cylindrical Tube. Proc. R. Irish Acad., 52:163–169.
Hinds, W. C. (1999). Aerosol Technology. Properties, Behaviour and Mea-
surement of Airborne Particles. Wiley, New York.
H€ogstr€om, R., Yli-Ojanper€a, J., Rostedt, A., Iisakka, I., M€akel€a, J. M.,
Heinonen, M., et al. (2011). Validating the Single Charged Aerosol Refer-
ence (SCAR) as a Traceable Particle Number Concentration Standard for
10 nm to 500 nm Aerosol Particles.Metrologia, 48:426–435.
Intra, P., and Tippayawong, N. (2009). Progress in Unipolar Corona
Discharger Designs for Airborne Particle Charging: A Literature Review.
J. Electrostat., 67(4):605–615.
Keithley Instruments Inc. (2004). Low Level Measurement Handbook, 6th ed.,
Keithley Instruments Inc., Cleveland, OH.
Kulkarni, P., Baron, P. A., and Willeke, K. (2011). Introduction to Aerosol
Characterization, in Aerosol Measurement: Principles, Techniques, and
Applications, P. A. Baron, P. Kulkarni, and K. Willeke, eds., John Wiley
& Sons, Hoboken, NJ, pp. 3–13.
Lanki, T., Tikkanen, J., Janka, K., Taimisto, P., and Lehtim€aki, M. (2011). An
electrical sensor for long-term monitoring of ultrafine particles in work-
places. J. Phys.: Conf. Ser., 304:012013. Available at http://iopscience.
iop.org/1742-6596/304/1/012013
Lee, S. G., Hyun, J., Park, D., Hwang, J., and Kim, Y. J. (2011). Application
and Performance Test of a Micro-Machined Unipolar Charger for Real-
Time Measurements of Exhaust Particles from a Diesel Engine Vehicle.
J. Aerosol Sci., 42:747–758.
FIG. 6. Correlation plot of the measured and simulated sensor signals in the
polydisperse test aerosol measurements.
CHARACTERIZATION AND RESPONSE MODEL OF THE PPS-M 1029

Lehtim€aki, M. (1983). In Modified Electrical Aerosol Detector. in Aerosols in
the Mining and Industrial Work Environments, Vol. 3, V. A. Marple, and
B. Y. H. Liu, eds., Ann Arbor Science Publishers, Ann Arbor,
pp. 1135–1143.
Marjam€aki, M., Keskinen, J., Chen, -R., and Pui, D. Y. H. (2000). Performance
Evaluation of Electrical Low Pressure Impactor (ELPI). J. Aerosol Sci.,
31:249–261.
Marquard, A., Meyer, J., and Kasper, G. (2006). Characterization of Unipolar
Electrical Aerosol Chargers-Part II: Application of Comparison Criteria
to Various Types of Nanoaerosol Charging Devices. J. Aerosol Sci., 37
(9):1069–1080.
Marra, J., Den Brink, W., Goossens, H., and Kessels, S. (2009). Nanoparticle
Monitoring for Exposure Assessment Nanotechnology Magazine. IEEE
3:6–13.
Ntziachristos, L., Amanatidis, S., Samaras, Z., Janka, K., and Tikkanen, J.
(2013). Application of the Pegasor Particle Sensor for the Measurement
of Mass and Particle Number Emissions. SAE Int. J. Fuels Lubr., 6(2):
521–531.
Ntziachristos, L., Fragkiadoulakis, P., Samaras, Z, Janka, K., and Tikkanen, J.
(2011). Exhaust Particle Sensor for OBD Application. SAE Technical
Paper 2011-01-0626.
Ntziachristos, L., Giechaskiel, B., Ristim€aki, J., and Keskinen, J. (2004). Use
of a Corona Charger for the Characterisation of Automotive Exhaust
Aerosol. J. Aerosol Sci., 35(8):943–963.
Rostedt, A., Marjam€aki, M., and Keskinen, J. (2009a). Modification of the
ELPI to Measure Mean Particle Effective Density in Real-Time. J. Aero-
sol Sci., 40:823–831.
Rostedt, A., Marjam€aki, M., Yli-Ojanper€a, J., Keskinen, J., Janka, K., Niemel€a,
V., et al. (2009b). Non-Collecting Electrical Sensor for Particle Concen-
tration Measurement. AAQR, 9:470–477.
Tikkanen, J. (2009). Particle Measurement Process and Apparatus. Patent pub-
lication no WO 2009/109688.
Whitby, K. T. (1961). Generator for Producing High Concentrations of Small
Ions. Rev. Sci. Instrum., 32(12):1351–1355.
Yli-Ojanper€a, J., M€akel€a, J. M., Marjam€aki, M., Rostedt, A., and Keskinen,
J. (2010). Towards Traceable Particle Number Concentration Standard:
Single Charged Aerosol Reference (SCAR). J. Aerosol Sci., 41:
719–728.
Yli-Ojanper€a, J., Sakurai, H., Iida, K., M€akel€a, J. M., Ehara, K., and Keskinen,
J. (2012). Comparison of Three Particle Number Concentration Calibra-
tion Standards Through Calibration of a Single CPC in a Wide Particle
Size Range. Aerosol Sci. Technol., 46:1163–1173.
1030 A. ROSTEDT ET AL.


Paper IV
Rostedt, A., Ntziachristos, L., Simonen, P., Rönkkö T., Samaras, Z., Hillamo, R.,Janka, K., and Keskinen, J., 2017. A new miniaturized sensor for ultra fast on-board sootconcentration measurements. SAE Int. J. Engines 10(4):2017, doi: 10.4271/2017-01-1008.
Reprinted with permission Copyright © 2017 SAE International. Further distribution ofthis material is not permitted without prior permission from SAE


INTRODUCTIONMeeting stringent particulate matter (PM) and particle number (PN) emission limits for diesel light-duty and heavy-duty vehicles necessitates the use of a diesel particle filter (DPF) in the exhaust line. As a consequence, on board monitoring of the DPF performance is required first to make sure that the DPF operates correctly and, second, to confirm that emission limits are not violated under real-world operation. The latter is performed by on-board diagnostic (OBD) sensors which make sure that specific OBD threshold limits (OTL) are not exceeded.
Currently three different operation principles are implemented in commercial DPF performance monitoring sensors. The first technique relies on particle deposition and resistance measurement [1, 2]. The particles are deposited onto a collection surface, where electrodes are separated by an electrically insulating material. The deposited conductive particles gradually change the surface conductivity. By
measuring the resistance between the electrodes it is possible to assess the amount of soot deposited to the surface, which is then linked to the soot concentration in the exhaust line. In principle, this method is based on an integral measurement of particle concentration over a period of time, and requires periodic regeneration of the deposition surface for a new deposition cycle to begin. The frequency of those regenerations is a measure of particle concentration. Therefore, the response time of these sensors is from several seconds to minutes, depending on the particle concentration.
The second family of sensors comprises those measuring the amount of deposited soot into the DPF filter. This can be estimated by either measuring the pressure difference over the filter or by measuring microwave transmittance through the DPF [3].
The third measurement technique involves electrical particle detection. For this, the charge of particles following combustion can be utilized, such as in the PMTrac sensor [4, 5], where the naturally
A New Miniaturized Sensor for Ultra-Fast On-Board Soot Concentration Measurements
Antti Rostedt, Leonidas D. Ntziachristos, Pauli Simonen, and Topi RönkköTampere University of Technology
Zissis C. SamarasAristotle University of Thessaloniki
Risto HillamoFinnish Meteorological Institute
Kauko JankaPegasor Oy
Jorma KeskinenTampere University of Technology
ABSTRACTIn this article we present a design of a new miniaturized sensor with the capacity to measure exhaust particle concentrations on board vehicles and engines. The sensor is characterized by ultra-fast response time, high sensitivity, and a wide dynamic range. In addition, the physical dimensions of the sensor enable its placement along the exhaust line. The concentration response and temporal performance of a prototype sensor are discussed and characterized with aerosol laboratory test measurements. The sensor performance was also tested with actual engine exhaust in both chassis and engine dynamometer measurements. These measurements demonstrate that the sensor has the potential to meet and even exceed any requirements around the world in terms of on-board diagnostic (OBD) sensitivity and frequency of monitoring. Further to potential OBD applications, this has the capacity to be used as an engine and combustion diagnostics sensor, for example to detect misfiring, cylinder combustion variability, exhaust gas recirculation flowrate, etc.
CITATION: Rostedt, A., Ntziachristos, L., Simonen, P., Rönkkö, T. et al., "A New Miniaturized Sensor for Ultra-Fast On-Board Soot Concentration Measurements," SAE Int. J. Engines 10(4):2017, doi:10.4271/2017-01-1008.
Published 03/28/2017Copyright © 2017 SAE International
doi:10.4271/2017-01-1008saeeng.saejournals.org
Downloaded from SAE International by Antti Rostedt, Monday, March 27, 2017

charged exhaust particles are collected inside the sensor by an electric field and an amplified electric current proportional to the particle concentration is measured.
The electrical methods described above rely on the conductivity of the emitted particles, hence on particle properties. Therefore, electrical detection methods appear to be in need of engine specific calibration to accurately detect PM or PN OTL exceedances. Moreover, the sensitivity of electrical resistance and DPF soot loading estimation sensors is not enough to enable reduction of current OTL levels, to bring them in line with corresponding emission limits.
On the other hand, many of the widely-used aerosol measurement instruments rely on the diffusion charging of particles by ions generated in a corona discharge. For the measurement of exhaust gas particle concentrations, a simplified electrical instrument based on the diffusion charging was first demonstrated by Ntziachristos et al. [6]. The instrument consisted of a particle charger and a Faraday cup aerosol electrometer. In the years since, that same concept has been used in several rather simple aerosol instruments such as NSAM [7] and DiSCmini [8].
In diffusion charging instruments, the charge acquired by the aerosol during the charging process is not only dependent on the particle number concentration but also on the particle size and this has an effect on the instrument response. However, in typical exhaust aerosol of either diesel or gasoline vehicles, the mean particle size typically remains within a narrow size range. While the particle morphology is known to have a small effect [9], the charging is relatively independent on the particle material [10]. Based on this weak material dependence, this detection method is equally suitable for both conductive soot particles and non-conductive ash particles. However, in order to overcome the morphology effect, the instrument response needs to be determined for exhaust-like aerosol. Diffusion charger based instruments typically offer good correlation and good signal repeatability for a stable size distribution, which also make them a promising approach as an OBD particle sensor.
In this study, a new miniaturized sensor based on particle diffusion charging is presented, with the potential to be used as an OBD sensor or as a general combustion diagnostics sensor. The design of the new sensor is based on the Pegasor PPS-M [11], which have been used for exhaust particle emission measurements [e.g. 12, 13].
OPERATING PRINCIPLE AND SENSOR DESIGNThe operating principle and sensor construction is similar to the Pegasor PPS-M sensor, but in a much more compact form. The unit is now designed so, that the sensor probe, measuring 16 mm in diameter and 40 mm in length, can be positioned directly into the exhaust line. The necessary electronics are integrated to the sensor head, and a CAN serial bus is provided for the data output. Both the sensor probe
and the integrated electronics are placed inside a static shielding to avoid electromagnetic interference. The overall dimensions of the sensor are 190 mm length and 36 mm diameter at the largest point. M18×1.5 thread is provided for the connection to the exhaust line. The sample flow rate of the tested prototype sensor was 3.5 lpm, while the required pressurized air supply was 8 slpm with 1.5 bar overpressure compared to the exhaust line. The current measurement range of the electrometer is ±2.5 nA.
A schematic of the cross section of the prototype sensor is presented in Figure 1, showing the key components and operational parameters of the design. The operation is based on diffusion charging of the aerosol particles and subsequent charge detection. Like the PPS-M sensor, the new sensor utilizes the escaping current measurement method, where the particles need not be actually collected. The charge detection is realized by measuring the charge that the particles carry away from the electrically floating corona discharge. In order to avoid charger fouling, the corona discharge electrodes are protected by a clean sheath air flow and the ions produced are brought into contact with the sample by a high velocity air stream from the discharge region. The same air stream is used also as a pump flow providing the sample flow for the sensor.
Figure 1. The sensor prototype pictured on the left together with the cross section on the right showing the main components and operational parameters of the sensor design.
Particle charging takes place in the charging region positioned right after the critical orifice separating the discharge region and the sample volume. The sample enters the charging region through the sampling port followed by a sharp bend in the flow channel. The purpose of the bend is to act as a pre-cut impactor preventing the large particles from entering the sensor and clogging the sample flow path. After the charging region the sample flows through the ejector pump. An ion trap is positioned downstream of the ejector pump to remove the excess ions before the sample exits the sensor through the
Rostedt et al / SAE Int. J. Engines / Volume 10, Issue 4 (October 2017)
Downloaded from SAE International by Antti Rostedt, Monday, March 27, 2017

sample exhaust port. The ion trap is dimensioned so that the cut point is approximately 5 nm, in order to have minimal particle losses. As in the PPS-M sensor design, the sample inlet and exhaust ports are positioned on the same side of the sensor probe to minimize the pressure difference between the inlet and outlet ports. Although the inlet and exhaust ports are relatively close to each other, the sample recirculation is effectively prevented by the high flow velocity of the exhaust flow.
SENSOR RESPONSE AND SENSITIVITYThe sensor output signal is an electrical current produced by the charged particles as they exit the sensor. The sensor response relates this output to the number concentration of the aerosol particles in the sample flow. The operation is based on diffusion charging of the particles, and hence the response is proportional to the charging efficiency. Since the charging efficiency is dependent on particle size, the sensor response is also a function of it. The charging efficiency depends on the Nit-magnitude, which is the product of the ion number concentration (Ni) and the particle residence time (t) in the charging region. While the charging efficiency could be approximated from the Nit -product, the ion properties, and the particle size, it is however often approximated to follow a power function of the particle size, shown in equation 1. The parameters a and b in equation 1 are typically determined by calibration, where the charger output signal is compared to the aerosol concentration when using monodisperse aerosol in the laboratory.
(1)
For the prototype sensor it was not possible to produce monodisperse calibration aerosol in sufficient concentrations for the high volumetric flow rate needed for the calibration. Instead, the sensor output was measured with different polydisperse aerosol size distributions as an input. Then, a fitting routine was used in order to find out the parameter values for the charging efficiency. The response measurement setup is shown in Figure 2. The measured test aerosols were produced by a modified diesel fuel burning heater [14]. The size distribution was controlled by varying the fuel feed and the air flow into the burner. The number-weighted geometric median of the size distribution was varied between 35 nm and 210 nm, while the geometric standard deviation range was 1.6 - 1.8. A scanning mobility particle sizer (SMPS, TSI Inc.), consisting of a model 3071 differential mobility analyzer (DMA, TSI Inc.) and a model 3775 condensation particle counter (CPC, TSI Inc.), was used to measure the size distribution. The total number concentration was measured with a model A20 CPC (Airmodus Oy). In total three ejector dilutors were used for dilution. Two in series, in front of the SMPS, and a third one in series upstream of the CPC. The total dilution ratio for the SMPS measurement was 90:1, and 900:1 for the CPC measurement. Since the particle size distribution was measured after dilution, the measured distributions were monitored not to contain nucleation mode particles.
Figure 2. The setup used for the prototype sensor response measurement.
For data processing, the measured total number concentrations were first corrected with the dilution ratio to obtain the total number concentration in the sample line. The measured number size distributions were then normalized to the measured total number concentration of the test aerosol. In order to obtain the values for eq. 1 parameters, the measured sensor signal was compared to a simulated sensor output calculated from the corrected number size distributions using the response function shown in eq. 1. The best fitting values for parameters a and b in the response function were obtained by using a minimum square sum fitting routine. The resulting sensor response is shown in eq. 2 and plotted on Figure 3 together with a correlation plot between the measured and simulated sensor outputs. The measured sensor response points in Figure 3A are plotted as the function of the median diameter of the size distribution weighted with the sensor response.
(2)
A.
Figure 3.
Rostedt et al / SAE Int. J. Engines / Volume 10, Issue 4 (October 2017)
Downloaded from SAE International by Antti Rostedt, Monday, March 27, 2017

B.
Figure 3 (cont.). (A) Fitted sensor response as a function of the particle size. The measured response points are plotted as a function of the median size of the size distribution weighted with the fitted response function, and (B) correlation plot between the simulated and measured sensor responses.
The correlation plot in Figure 3B shows a good correlation between the measured and simulated responses, implying that the fitted response adequately describes the sensor behavior in the measured size range. While the overall fit between the response model and the measured data points is very good, it can however be seen that the model starts to slightly deviate from the measurement at large particle sizes. In particular, the simulated signal appears to be larger than the measured one. This could be caused for instance by inertial particle losses in the sensor. However, there is relatively high measurement uncertainty in these larger particle sizes, since these approach the SMPS upper size limit. The fitted response however fits rather well in the size range from 40 - 200 nm, which is relevant for typical exhaust particles. The fitted power of 1.03 is in line with corresponding values reported for other electrical aerosol instruments, where diffusion charging is the major charging mechanism [15].
If required by the application, the sensor output can be converted to mass or number emission with the help of the response fit. The needed conversion factors can be obtained in a similar way as presented earlier for the PPS-M sensor [9]. According to the response model for a size distribution, with a count median size of 50 nm and a geometric standard deviation 1.7, the PN measurement range of the prototype sensor is approximately from 104 to 109 1/cm3, with a sampling interval of 1 s. In terms of raw exhaust conditions, for a passenger car producing exhaust volume in the order of 1 Nm3/km, the sensor is able to detect concentrations down to 1010 part./km, i.e. more than one order of magnitude lower than current PN emission limits of 6×10¹¹ part./km. In terms of mass, and assuming a typical lognormal size distribution as before and a particle density profile for diesel vehicles [16], this would correspond to a soot mass of less than 3 µg/km, i.e. several times lower than any PM limits around the world.
TEMPORAL RESOLUTIONAs already mentioned, the diffusion charging process is dependent on the Nit-product. Unipolar diffusion chargers are typically designed so that the particles reach saturation charge level. According to Davison et al. [17] this is accomplished at Nit-product values above 107 s/cm3. In the sensor design the ion current produced by the corona and entering the charging region is in the order of hundred nano-amperes, which would correspond to an ion production rate in the order of 1012 ion/s. If the ions lifetime is assumed to be 1 ms, and the charging region volume is approximately 0.5 cm3, the ion concentration would be above 109 ion/cm3. These numbers suggest, that the saturation charge level for the particles would be reached within 10 ms. Another factor affecting the temporal resolution is the gas exchange rate in the sensor. The total sample volume inside the prototype sensor is approximately 1.0 cm3. The flow rate inside the sensor sample volume is a sum of the sample flow rate 3.5 lpm and pump flow rate 1 lpm, which equals 4.5 lpm in total. Combining the sample volume and the flow rate leads to a sample residence time of 13 ms inside the sensor, which sets a theoretical lower limit for the response time.
In practice, the electronic noise of the high sensitivity electrometer sets also limitations for the sensor time resolution. The higher the sampling rate and the shorter the integration time the more noise is present in the measured current signal and a higher signal is required for the measurement. To overcome this problem, the integration time of the sensor electrometer can be selected according to the measurement needs. With the highest sampling rate of 100 Hz, the noise level is approximately 1 pA, and a with 1 Hz sample rate the noise level drops down to 100 fA.
The temporal performance of the sensor was tested with laboratory measurements using the calibration measurement setup. A step response in the sample concentration was induced by directing a high velocity particle free air stream directly into the sampling port of the sensor. The airstream was controlled by a fast acting magnetic valve and the flow velocity was adjusted high enough in order to achieve a rapid change in the sample concentration. The first test was performed without particles in the sample to confirm that the fast high velocity air injection did not cause interferences to the sensor operation. The sensor output measured during particle concentration transients was then recorded with 100 Hz sampling frequency and the status information from the magnetic valve was recorded with 800 Hz sample rate. In the data processing the measured step responses were aligned together using the measured valve status signal. Approximately 100 repetitions were averaged to form an average step response, shown in Figure 4A together with a fitted step response. A time constant τ value of 18 ms, gave the best fit to the measured data, which corresponds to a value of 40 ms for a 10 - 90% rise time. The impulse response fit, shown in Figure 4B, was composed from the measured step response data and the fitted step response.
Rostedt et al / SAE Int. J. Engines / Volume 10, Issue 4 (October 2017)
Downloaded from SAE International by Antti Rostedt, Monday, March 27, 2017

A.
B.
Figure 4. (A) Step response of the prototype sensor as an average of 100 repetitions of rapid concentration drop; a fitted step response with a time constant of 18 ms shown for reference. (B) Fitted impulse response of the prototype sensor.
PERFORMANCE WITH REAL EXHAUST AEROSOLIn order to test its performance in real exhaust aerosol, the prototype sensor was fitted at the tailpipe of a light duty vehicle. This mounting point does not represent the targeted mounting point of the sensor in actual applications, but was chosen for practical reasons. The tailpipe was connected to a transfer line leading the exhaust to a Constant Volume Sampler. This guaranteed no backflow of ambient air in the tailpipe. Total particle number concentration measurement was realized with a CPC (Model 3776, TSI Inc., with 2.5 nm cut point) measuring diluted exhaust sample. The dilution system used consisted of a perforated tube diluter as the first stage dilution, with dilution ratio of approximately 12:1, and an ejector diluter as the secondary dilution stage. The CPC sample was further diluted with a dilution ratio of 42:1. The tested vehicle was Volkswagen Polo 1.2 TSI, equipped with a stoichiometric gasoline direct injection (GDI) engine. The test cycle was the NEDC (New European Driving Cycle), starting with a pre-warmed engine. In the measurement results, shown in Figure 5, the raw signal from the sensor measurement and the total number concentration of particles larger than 3 nm are
plotted over the test cycle. In the measurement an averaging time of 1 s was used for the prototype sensor signal to match the CPC time resolution. A correlation plot of the signals is shown in Figure 6.
Figure 5. Sensor signal and particle total number concentration measured over the NEDC.
Figure 6. Second-by-second sensor signal and total particle number correlation over the NEDC.
Even though the sensor response is affected by the changes in the size distribution, the raw sensor signal correlates very well to the measured total particle number concentration as shown in Figures 5 and 6. The largest difference between the signals is seen at the beginning of the cycle during a period of 75 to 100 s. At this point there is a distinct signal seen from the sensor, while the measured total number concentration was essentially zero. The same difference was observed also in other repetitions; however, the sensor signal amplitude during this time frame varied between the runs. At this point in the NEDC test cycle there is a deceleration from 32 km/h. Since the sensor was mounted at the end of the tailpipe, where the exhaust gas temperature is much lower than for what the sensor is designed for, it is possible that this behavior is caused by water condensation on the electrical insulators, thus causing an artifact measurement, before it evaporates again.
Rostedt et al / SAE Int. J. Engines / Volume 10, Issue 4 (October 2017)
Downloaded from SAE International by Antti Rostedt, Monday, March 27, 2017

APPLICATION TO COMBUSTION DIAGNOSTICSThe fast response characteristics of the sensor prototype were also tested in the engine dynamometer measurements with a six-cylinder, 1000 kW medium speed diesel engine used in locomotives. The sensor was fitted in the exhaust gas recirculation (EGR) line for practical reasons, and the EGR valve position was adjusted so that the concentration measured by the sensor was within the measurement range. Since the EGR line is positioned before the turbocharger the sensor was operating at an elevated exhaust line pressure, reaching 3 bar overpressure and over 500°C temperature at maximum load point. The sensor air supply pressure was kept 1.5 bar above the exhaust manifold pressure to ensure proper operation of the integrated ejector pump. The outer part of the sensor was cooled with pressurized air, to prevent excessive heating of the electronics.
The in-cylinder pressure was measured from one cylinder in order to have reference engine timing information for the data alignment. The pressure signal was measured at 800 Hz sample rate, while the sensor output was recorded at 100 Hz sample rate. During data processing several time frames containing data from 20 engine revolutions were aligned together with the help of the timing signal. The signals acquired in different frames were then averaged. An example of the measured signal from an engine load point of 750 RPM and 513 kW is shown in Figure 7. The same figure also shows the measured signal at the same load point with the sensor charger switched off. This was recorded in order to test whether the pressure pulses, the high temperature or the charge produced by combustion would disturb the measurement. As seen from the figure, the signal level in the charger-off measurement is close to zero, indicating that the impact of external disturbances to the measured values is low.
The signals are plotted as a function of engine crank angle, showing a time span of ten engine revolutions. While the time resolution of the sensor is not good enough to detect all temporal details caused by the individual power strokes, a clearly periodic waveform is seen with six distinct particle concentration peaks every two engine revolutions. The peak nearest to the 0° crank angle is significantly lower than the others, which may be resulting for instance from the distance between this particular cylinder and the sampling point or the pressure waves inside the EGR line. Unfortunately, there is no independent measurement to rule out all possible interferences or to compare the signal time-dependence or absolute values with. The result should be treated as a demonstration of the repeatability and resolution of the sensor in detecting individual combustion events and the related exhaust pulses.
In order to test the sensor’s ability to distinguish particle emissions from different cylinders, the fuel injection was delayed in one of the cylinders when the engine was run at the lowest load point of 350 RPM/62 kW. The measurement results are shown in Figure 8. A clear change in the measured signal waveform can be seen indicating higher particle emissions from the delayed injection cylinder due to the poor burning of the fuel. Moreover, different particle exhaust levels for the subsequent combustion cylinders, compared to the reference levels, are observed as the engine is adjusted to match the same output power as in the reference case.
Figure 7. Measured prototype sensor signal (Charger on) from load point 750 RPM/513 kW. Shown also for reference the measured with the sensor charger off at the same load point.
Figure 8. Measured signals from both normal engine operation and delayed fuel injection in one cylinder during load point 350 RPM/62 kW.
CONCLUSIONSThe design of a new particle sensor prototype was presented. The sensor is based on diffusion charging and electrical detection of exhaust particles and is intended for on board measurement of soot emissions from engines and vehicles. The study determined the sensor sensitivity and its response to exhaust particles and presented measurement results in real exhaust aerosol.
A fit for the sensor response was obtained from the laboratory tests. The obtained response with particle size roughly scales with a power of one and this brings it in good agreement with other diffusion charging based instruments. Using pulse signals, a response time of 18 ms was determined, which is in the same range of the theoretical value estimated from the sensor dimensions and operation principle. Moreover, its sensitivity in terms of PN and PM emissions of passenger cars is in the order of 1010 part./km and 3 µg/km, respectively. Such performance is by far better than the characteristics of currently used OBD sensors for DPF monitoring.
Rostedt et al / SAE Int. J. Engines / Volume 10, Issue 4 (October 2017)
Downloaded from SAE International by Antti Rostedt, Monday, March 27, 2017

The sensor performance was validated with transient vehicle chassis tests and steady-state engine dynamometer measurements. A very good correlation between the sensor signal and the measured total number concentration was observed on the chassis dynamometer measurements. Tests on the engine operating at low speed demonstrated that the sensor was able to distinguish particle emission peaks originating from individual combustion events in the different engine cylinders. This demonstrates the potential of the sensor to even be used as a combustion diagnostic.
The prototype sensor still requires further development for practical OBD applications. For instance, the pressurized air line is a major concern for practical implementation, and one key issue is the minimization of both required pump and sheath air flows. Furthermore, the current prototype is dimensioned for 1.5 bar overpressure, which is quite high and needs to be decreased. Additionally, the sensor real world performance needs to be further studied, as do the long term operation capability and stability. However, the presented concept seems promising for an on board particle emission sensor.
REFERENCES1. Hauser, G., "Smoke Particulate Sensors for OBD and High
Precision Measuring," SAE Technical Paper 2006-01-3549, 2006, doi:10.4271/2006-01-3549.
2. Ochs, T., Schittenhelm, H., Genssle, A., and Kamp, B., "Particulate Matter Sensor for On Board Diagnostics (OBD) of Diesel Particulate Filters (DPF)," SAE Int. J. Fuels Lubr. 3(1):61-69, 2010, doi: 10.4271/2010-01-0307.
3. Fischerauer, G., Förster, M. and Moos, R. (2010) Sensing the soot load in automotive diesel particulate filters by microwave methods, Meas. Sci. Technol. 21 (2010) 035108.
4. Steppan, J., Henderson, B., Johnson, K., Yusuf Khan, M. et al., "Comparison of an On-Board, Real-Time Electronic PM Sensor with Laboratory Instruments Using a 2009 Heavy-Duty Diesel Vehicle," SAE Technical Paper 2011-01-0627, 2011, doi:10.4271/2011-01-0627.
5. Bilby, D, Kubinski, D, J., Maricq, M. M. (2016) Current amplification in an electrostatic trap by soot dendrite growth and fragmentation: Application to soot sensors. J. Aerosol Sci. 98:41-58, doi: 10.1016/j.jaerosci.2016.03.003.
6. Ntziachristos, L., Giechaskiel, B., Ristimäki, J. and Keskinen, J. (2004) Use of a corona charger for the characterisation of automotive exhaust aerosol, Journal of Aerosol Science, 35 (8), pp. 943-963, doi: 10.1016/j.jaerosci.2004.02.005.
7. Fissan, H., Neumann, S., Trampe, A., Pui, D., and Shin, W. (2007). Rationale and Principle of an Instrument Measuring Lung Deposited Nanoparticle Surface Area. J. Nanopart. Res., 9:53-59, doi: 10.1007/s11051-006-9156-8.
8. Fierz, M., Houle, C., Steigmeier, P., and Burtscher, H. (2011). Design, Calibration, and Field Performance of a Miniature Diffusion Size Classifier. Aerosol Sci. Technol., 45(1):1-10, doi: 10.1080/02786826.2010.516283
9. Shin, W. G., Wang, J., Mertler, M., Sachweh, B., Fissan, H. and Pui, D. Y. H. (2010). The effect of particle morphology on unipolar diffusion charging of nanoparticle agglomerates in the transition regime, Journal of Aerosol Science, 41, pp. 975-986, doi: 10.1016/j.jaerosci.2010.07.004
10. Shin, W. G., Qi, C., Wang, J., Fissan, H. and Pui, D. Y. H. (2009). The effect of dielectric constant of materials on unipolar diffusion charging of nanoparticles, Journal of Aerosol Science, 40, pp. 463 - 468, doi: 10.1016/j.jaerosci.2009.01.003.
11. Ntziachristos, L., Fragkiadoulakis, P., Samaras, Z., Janka, K. et al., "Exhaust Particle Sensor for OBD Application," SAE Technical Paper 2011-01-0626, 2011, doi:10.4271/2011-01-0626.
12. Ntziachristos, L., Amanatidis, S., Samaras, Z., Janka, K. et al., "Application of the Pegasor Particle Sensor for the Measurement of Mass and Particle Number Emissions," SAE Int. J. Fuels Lubr. 6(2):521-531, 2013, doi:10.4271/2013-01-1561.
13. Amanatidis, S., Maricq, M. M., Ntziachristos, L., Samaras, Z., (2015). Measuring number, mass, and size of exhaust particles with diffusion chargers: The dual Pegasor Particle Sensor, Journal of Aerosol Science, 92, pp. 1-15,doi: 10.1016/j.jaerosci.2015.10.005.
14. Högström, R., Karjalainen, P. Yli-Ojanperä J., Rostedt, A., Heinonen, M., Mäkelä, J. M., and Keskinen, J. (2012) Study of the PM Gas-Phase Filter Artifact Using a Setup for Mixing Diesel-Like Soot and Hydrocarbons, Aerosol Sci. Technol., 46:9, 1045-1052, doi: 10.1080/02786826.2012.689118
15. Kulkarni, P., Baron, P.A. and Willeke, K. (2011) Introduction to aerosol characterization, in Aerosol measurement: principles, techniques, and applications, edited by Baron, P.A., Kulkarni, P., and Willeke, K. John Wiley & Sons, Hoboken, N.J. 3-13, doi: 10.1002/9781118001684.
16. Maricq, M.M., & Xu, N. (2004). The effective density and fractal dimension of soot particles from premixed flames and motor vehicle exhaust. Journal of Aerosol Science, 35, 1251-1274.
17. Davison, S. W., Hwang, S. Y., Wang, J., and Gentry, J. W. (1985) Unipolar Charging of Ultrafine Particles by Diffusion of Ions: Theory and Experiment. Langmuir 1985:1, 150-158, doi: 10.1021/la00061a027.
CONTACT INFORMATIONAntti RostedtAerosol Physics LaboratoryDepartment of PhysicsTampere University of TechnologyP.O. Box 69233101 Tampere, [email protected]
ACKNOWLEDGMENTSThis work was conducted within the Measurement, Monitoring and Environmental Assessment (MMEA) research program of CLEEN Ltd., supported by Tekes - the Finnish Funding Agency for Innovation.
DEFINITIONS/ABBREVIATIONSCPC - Condensation particle counter
DPF - Diesel particulate filter
DMA - Differential mobility analyzer
EGR - Exhaust gas recirculation
NEDC - New European driving cycle
OBD - On-board diagnostics
OTL - On-board diagnostics threshold limit
PM - Particulate matter
PN - Particle number
SMPS - Scanning mobility particle sizer
All rights reserved. No part of this publication may be reproduced, stored in a retrieval system, or transmitted, in any form or by any means, electronic, mechanical, photocopying, recording, or otherwise, without the prior written permission of SAE International.
Positions and opinions advanced in this paper are those of the author(s) and not necessarily those of SAE International. The author is solely responsible for the content of the paper.
Rostedt et al / SAE Int. J. Engines / Volume 10, Issue 4 (October 2017)
Downloaded from SAE International by Antti Rostedt, Monday, March 27, 2017

ISBN 978-952-15-4084-4 ISSN 1459-2045
Tampereen teknillinen yliopisto PL 52733101 Tampere
Tampere University of TechnologyP.O.B. 527FI-33101 Tampere, Finland