digest - statsmauritius.govmu.orgstatsmauritius.govmu.org/english/publications/documents/regular...
TRANSCRIPT
Vol. 32
REPUBLIC OF MAURITIUS
Ministry of Finance and Economic Development
STATISTICS MAURITIUS
DIGEST
OF
ROAD TRANSPORT
AND
ROAD ACCIDENT STATISTICS
2016
November 2017 (Price Rs 75)
DIGEST
OF
ROAD TRANSPORT
AND
ROAD ACCIDENT STATISTICS
2016
Digest of Road Transport and Road Accident Statistics - 2016
FOREWORD
This is the thirty-second issue of the Digest of Road Transport and Road
Accident Statistics published by Statistics Mauritius.
It presents statistics on road transport compiled from the register of the
National Transport Authority. It also covers road traffic accident statistics derived
from returns provided by police stations and insurance companies.
All figures relate to the Island of Mauritius and are the latest available.
Some of them are provisional and are therefore subject to revision in later issues.
It is hoped that the data presented in this report will be of valuable help to
planners, policy-makers and the public in general.
This digest has been prepared with the collaboration of the National
Transport Authority, the Traffic Management and Road Safety Unit of the Ministry
of Public Infrastructure and Land Transport, the Police Department and insurance
companies. Their assistance is gratefully acknowledged.
Y. Cassimally
Ag. Director of Statistics
Statistics Mauritius
Ministry of Finance and Economic Development
PORT LOUIS .
November 2017

Contact person:
Mr. A. Bundhoo, Statistician or
Mr. A. Poreema, Senior Statistical Officer
National Transport Authority
MSI Building, Les Cassis
Tel: (230) 202-2831 Fax: (230) 212-9399
Traffic Branch Police Road Safety Unit
Line Barracks, P. Louis
Tel: (230) 203-1205 Fax: (230) 208-6077
E-mail: [email protected]
Website: http://statsmauritius.govmu.org
CONTENTS Page
Definition and Explanatory Notes 5 - 7
Abbreviations and Symbols 8
Road Transport and Road Traffic Accident Statistics, 2016 - An overview 9
Main Road Transport and Road Accident Indicators, 2015 - 2016 11
PART 1 - VEHICLE STATISTICS
Table 1.1 - Road network as at end of year, 2012 - 2016 15
1.2 - Vehicles registered, 2007 - 2016 17
1.3 - New vehicles registered, 2012 - 2016 18
1.4 - Imported second-hand and re-registered vehicles, 2012 - 2016 19
1.5 - Vehicles off the road, 2012 - 2016 20
1.6 - Age composition of cars, dual purpose vehicles and double cab pickup,
2015 - 2016
21
1.7 - Age composition of operational bus fleet, 2015 - 2016 22
1.8 - Bus operational statistics, 2012 - 2016 23
1.9 - Evolution of bus fares (adults), 2002 - 2016 24
1.10 - Receipts from the activities of the National Transport Authority,
2012 - 2016
25
1.11 - Driving licences issued during the year by type of licence, 2007 - 2016 26
1.12 - Imports of vehicles and spare parts by country of origin, 2015 - 2016 27 - 35
PART 2 - ROAD TRAFFIC ACCIDENT STATISTICS
Table 2.1 - Road traffic accidents and casualties, 2007 - 2016 39
2.2 - Road traffic accidents, motor-vehicles involved and casualties,
2012 - 2016
41
2.3 - Number of casualties by degree of casualty and casualty rate, 2012- 2016 41
2.4 - Casualty accidents, pedestrian and rider (auto/moto cycle) casualties by police
district, 2015- 2016
42
2.5 - Pedestrian and total casualties by police district and semester, 2016 43
2.6 - Distribution of casualty accidents by day of the week and time, 2016 44
2.7 - Number of accidents by severity of accident, 2012 - 2016 46
2.8 - Number of casualty accidents involved in ''hit and run cases'', by semester,
2015 - 2016
46
2.9 - Number of casualty accidents by severity of accident and police district,
2015- 2016
47
- 2 -
Page
Table 2.10 - Number of casualty accidents by severity of accident and weather
conditions, 2015 - 2016
48
2.11 - Number of casualty accidents by severity of accident and light conditions,
2015 - 2016
49
2.12 - Number of casualty accidents by type of road, severity of accident and
collision type, 2016
50
2.13 - Number of casualty accidents by severity of accident and type of road,
2015 - 2016
51
2.14 - Number of casualty accidents by degree of casualties and junction type,
2016
52
2.15 - Number of vehicles involved in casualty accidents by type, 2015 - 2016 53
2.16 - Number of motor-vehicles involved in casualty accidents by type of
vehicle and nature of damage, 2016
54
2.17 - Number of drivers and riders involved in casualty accidents by age group
and sex, 2016
55
2.18 - Number of drivers/riders involved in casualty accidents by driving
experience and sex, 2016
56
2.19 - Number of casualties by class of road users, 2015 - 2016 57
2.20 - Number of casualties by degree of casualty and class of road users,
2015 - 2016
58
2.21 - Number of casualties by class of road users, age-group and sex, 2016 59
2.22 - Number of pedestrian casualties by age-group, 2015 - 2016 60
2.23 - Number of fatalities by class of road users, age-group and sex, 2016 61
2.24 - Fatalities by category of road users, 2015 -2016 62
2.25 - Number of fatalities by police district and by class of road users,
2015 - 2016
63
PART 3 - PETROLEUM PRODUCTS
Table 3.1 - Evolution of price and sales of gasolene and gas oil, 2013 - 2016 67
3.2 - Imports of motor-spirit and gas oil by country of origin, 2015 - 2016 68
3.3 - Imports of lubricating oils and greases by country of origin, 2015 - 2016 69
CONTENTS ( cont'd )
- 3 -
ILLUSTRATIONS Page
Figure 1.1 - Stock of registered vehicles, 2007 - 2016 16
1.2 - Age composition of cars, dual purpose vehicles and double cab
pickup as at 31st December, 2015 - 2016
21
1.3 - Age composition of operational bus fleet, as at 31st December,
2015 - 2016
22
2.1 - Number of vehicles registered and road accidents, 2007 - 2016 40
2.2 - Number of casualty accidents by day of week, 2016 45
2.3 - Number of casualty accidents by time of day, 2016 45
2.4 - Vehicles involved in casualty accidents by type of vehicle,
2016
53
2.5 - Casualties by class of road users, 2016 57
2.6 - Fatalities by category of road users, 2015 - 2016 62
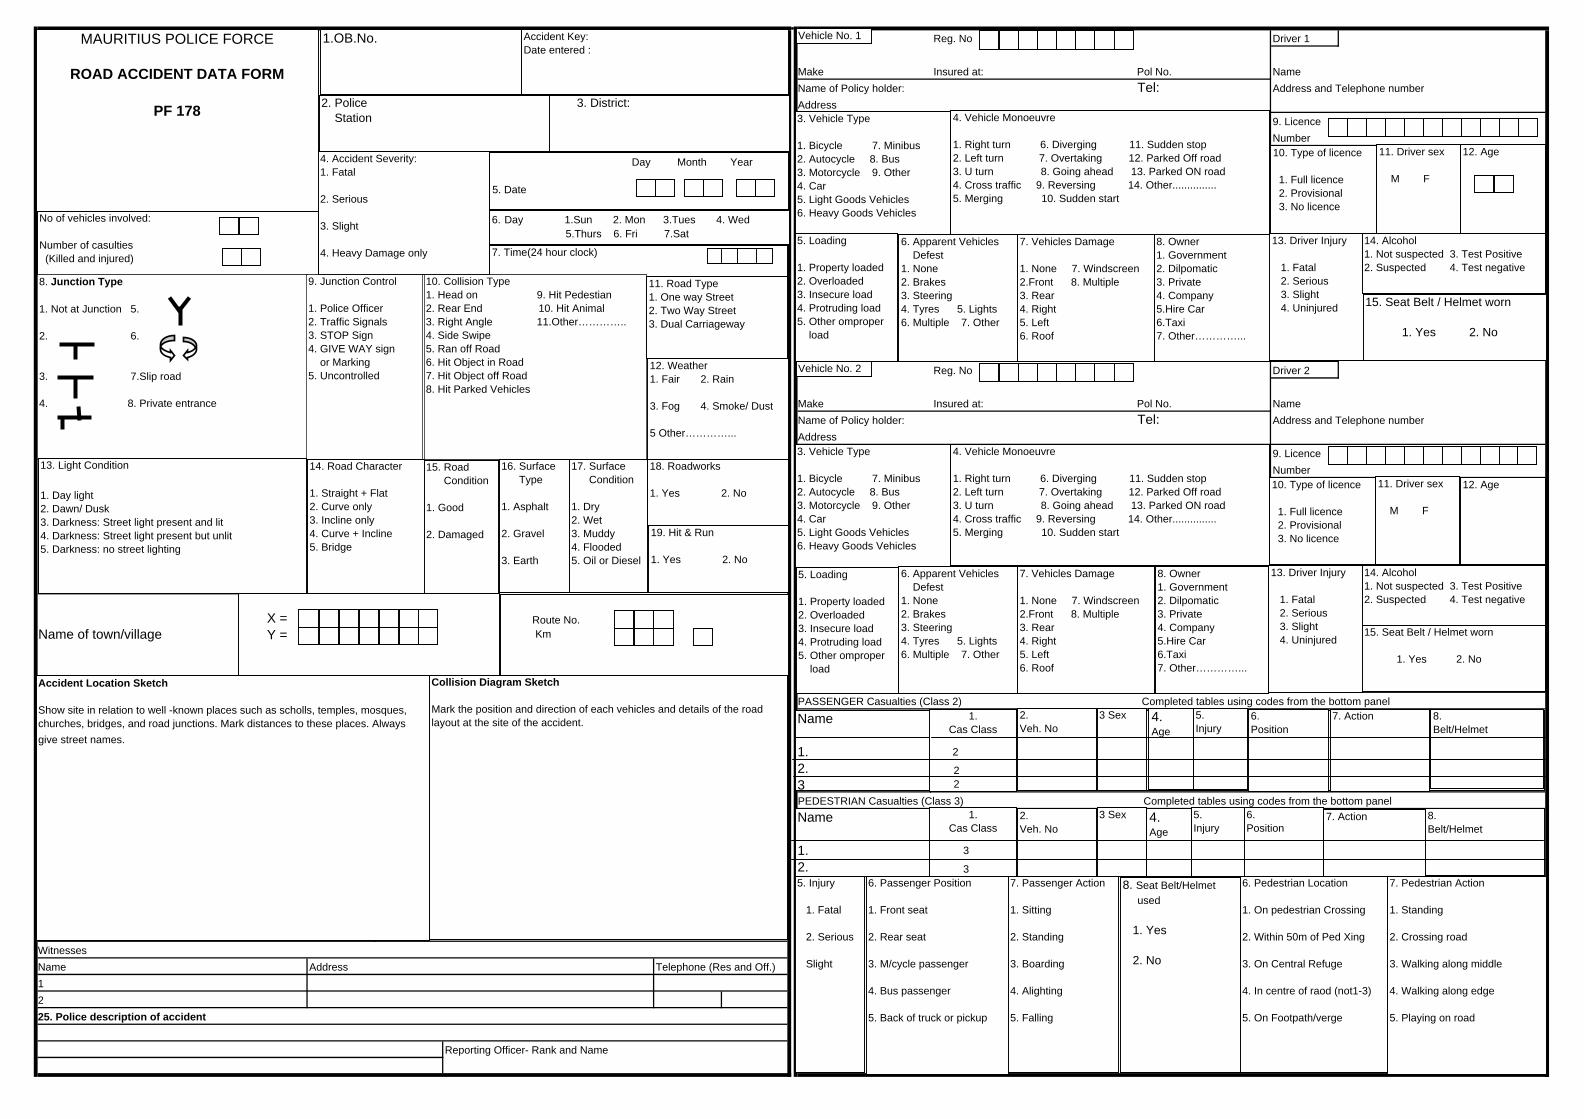
Appendix Police Form (PF 178)
- 5 -
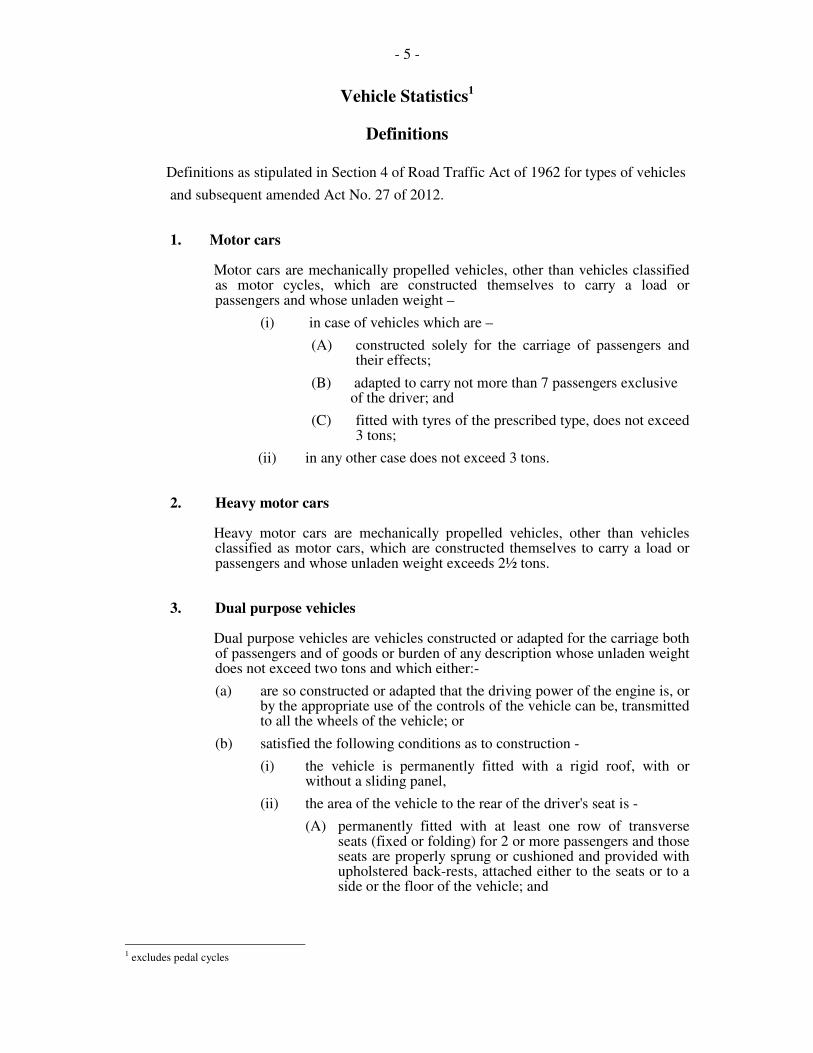
Vehicle Statistics1
Definitions
Definitions as stipulated in Section 4 of Road Traffic Act of 1962 for types of vehicles
and subsequent amended Act No. 27 of 2012.
1. Motor cars
Motor cars are mechanically propelled vehicles, other than vehicles classified as motor cycles, which are constructed themselves to carry a load or passengers and whose unladen weight –
(i) in case of vehicles which are –
(A) constructed solely for the carriage of passengers and their effects;
(B) adapted to carry not more than 7 passengers exclusive of the driver; and
(C) fitted with tyres of the prescribed type, does not exceed 3 tons;
(ii) in any other case does not exceed 3 tons.
2. Heavy motor cars
Heavy motor cars are mechanically propelled vehicles, other than vehicles classified as motor cars, which are constructed themselves to carry a load or passengers and whose unladen weight exceeds 2½ tons.
3. Dual purpose vehicles
Dual purpose vehicles are vehicles constructed or adapted for the carriage both of passengers and of goods or burden of any description whose unladen weight does not exceed two tons and which either:-
(a) are so constructed or adapted that the driving power of the engine is, or by the appropriate use of the controls of the vehicle can be, transmitted to all the wheels of the vehicle; or
(b) satisfied the following conditions as to construction -
(i) the vehicle is permanently fitted with a rigid roof, with or without a sliding panel,
(ii) the area of the vehicle to the rear of the driver's seat is -
(A) permanently fitted with at least one row of transverse seats (fixed or folding) for 2 or more passengers and those seats are properly sprung or cushioned and provided with upholstered back-rests, attached either to the seats or to a side or the floor of the vehicle; and
1 excludes pedal cycles
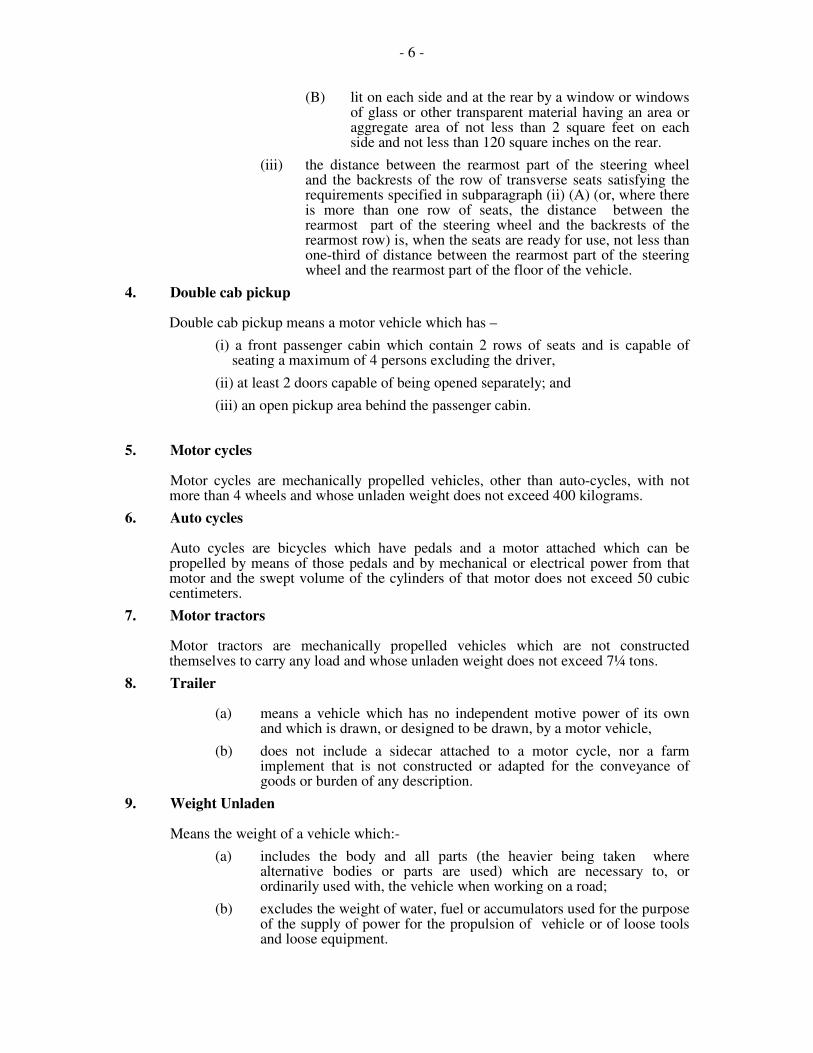
- 6 -
(B) lit on each side and at the rear by a window or windows of glass or other transparent material having an area or aggregate area of not less than 2 square feet on each side and not less than 120 square inches on the rear.
(iii) the distance between the rearmost part of the steering wheel and the backrests of the row of transverse seats satisfying the requirements specified in subparagraph (ii) (A) (or, where there is more than one row of seats, the distance between the rearmost part of the steering wheel and the backrests of the rearmost row) is, when the seats are ready for use, not less than one-third of distance between the rearmost part of the steering wheel and the rearmost part of the floor of the vehicle.
4. Double cab pickup
Double cab pickup means a motor vehicle which has –
(i) a front passenger cabin which contain 2 rows of seats and is capable of seating a maximum of 4 persons excluding the driver,
(ii) at least 2 doors capable of being opened separately; and
(iii) an open pickup area behind the passenger cabin.
5. Motor cycles
Motor cycles are mechanically propelled vehicles, other than auto-cycles, with not more than 4 wheels and whose unladen weight does not exceed 400 kilograms.
6. Auto cycles
Auto cycles are bicycles which have pedals and a motor attached which can be propelled by means of those pedals and by mechanical or electrical power from that motor and the swept volume of the cylinders of that motor does not exceed 50 cubic centimeters.
7. Motor tractors
Motor tractors are mechanically propelled vehicles which are not constructed themselves to carry any load and whose unladen weight does not exceed 7¼ tons.
8. Trailer
(a) means a vehicle which has no independent motive power of its own and which is drawn, or designed to be drawn, by a motor vehicle,
(b) does not include a sidecar attached to a motor cycle, nor a farm implement that is not constructed or adapted for the conveyance of goods or burden of any description.
9. Weight Unladen
Means the weight of a vehicle which:-
(a) includes the body and all parts (the heavier being taken where alternative bodies or parts are used) which are necessary to, or ordinarily used with, the vehicle when working on a road;
(b) excludes the weight of water, fuel or accumulators used for the purpose of the supply of power for the propulsion of vehicle or of loose tools and loose equipment.
- 7 -
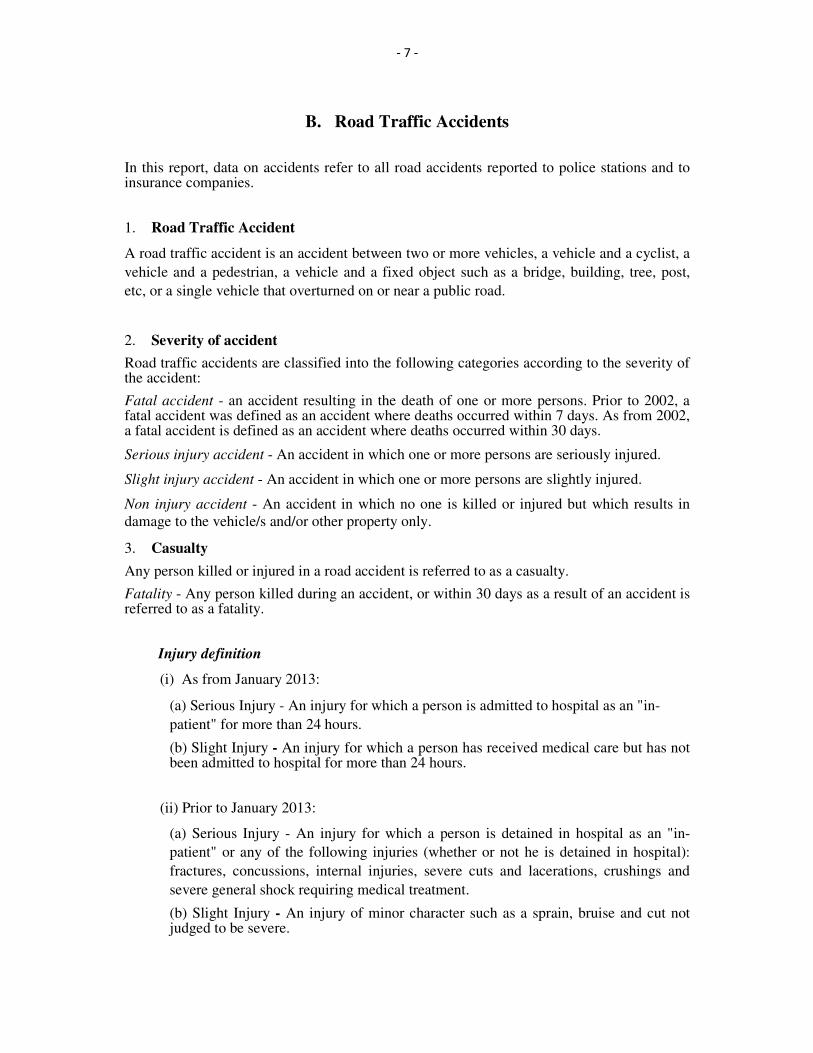
B. Road Traffic Accidents
In this report, data on accidents refer to all road accidents reported to police stations and to insurance companies.
1. Road Traffic Accident
A road traffic accident is an accident between two or more vehicles, a vehicle and a cyclist, a
vehicle and a pedestrian, a vehicle and a fixed object such as a bridge, building, tree, post,
etc, or a single vehicle that overturned on or near a public road.
2. Severity of accident
Road traffic accidents are classified into the following categories according to the severity of the accident:
Fatal accident - an accident resulting in the death of one or more persons. Prior to 2002, a fatal accident was defined as an accident where deaths occurred within 7 days. As from 2002, a fatal accident is defined as an accident where deaths occurred within 30 days.
Serious injury accident - An accident in which one or more persons are seriously injured.
Slight injury accident - An accident in which one or more persons are slightly injured.
Non injury accident - An accident in which no one is killed or injured but which results in
damage to the vehicle/s and/or other property only.
3. Casualty
Any person killed or injured in a road accident is referred to as a casualty.
Fatality - Any person killed during an accident, or within 30 days as a result of an accident is referred to as a fatality.
Injury definition
(i) As from January 2013:
(a) Serious Injury - An injury for which a person is admitted to hospital as an "in-
patient" for more than 24 hours.
(b) Slight Injury - An injury for which a person has received medical care but has not been admitted to hospital for more than 24 hours.
(ii) Prior to January 2013:
(a) Serious Injury - An injury for which a person is detained in hospital as an "in-
patient" or any of the following injuries (whether or not he is detained in hospital):
fractures, concussions, internal injuries, severe cuts and lacerations, crushings and
severe general shock requiring medical treatment.
(b) Slight Injury - An injury of minor character such as a sprain, bruise and cut not judged to be severe.
- 8 -
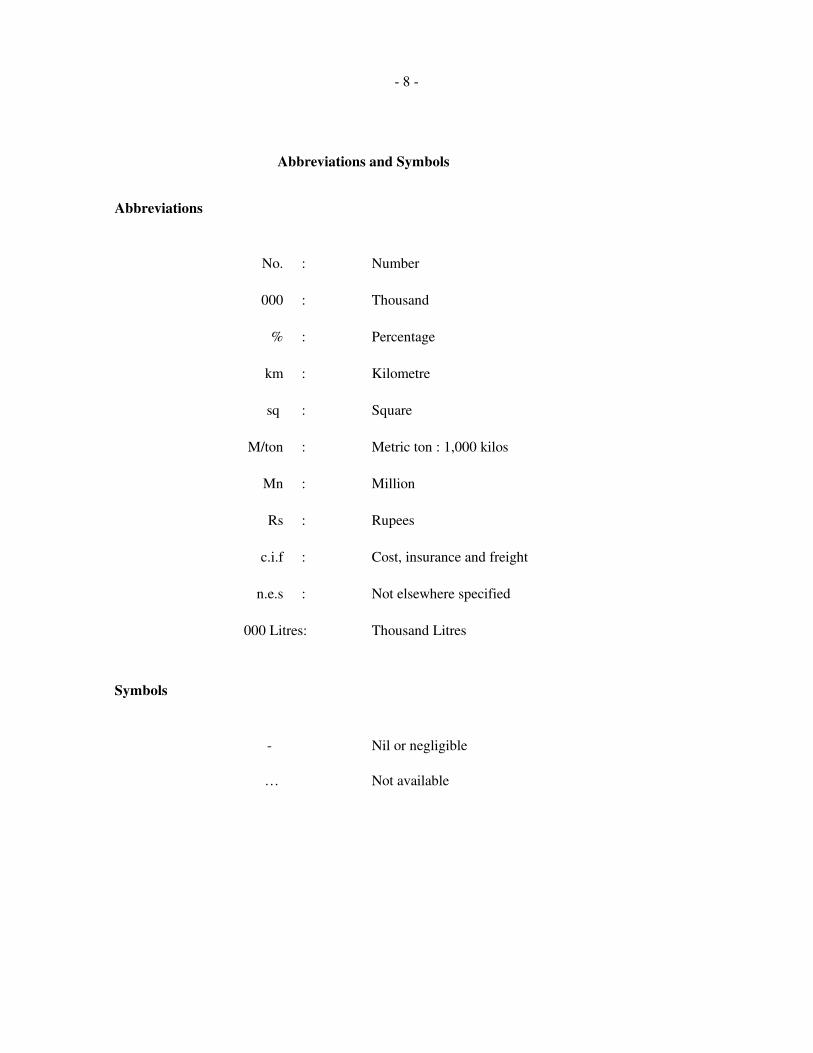
Abbreviations
No. : Number
000 : Thousand
% : Percentage
km : Kilometre
sq : Square
M/ton : Metric ton : 1,000 kilos
Mn : Million
Rs : Rupees
c.i.f : Cost, insurance and freight
n.e.s : Not elsewhere specified
000 Litres: Thousand Litres
Symbols
- Nil or negligible
… Not available
Abbreviations and Symbols
- 9 -
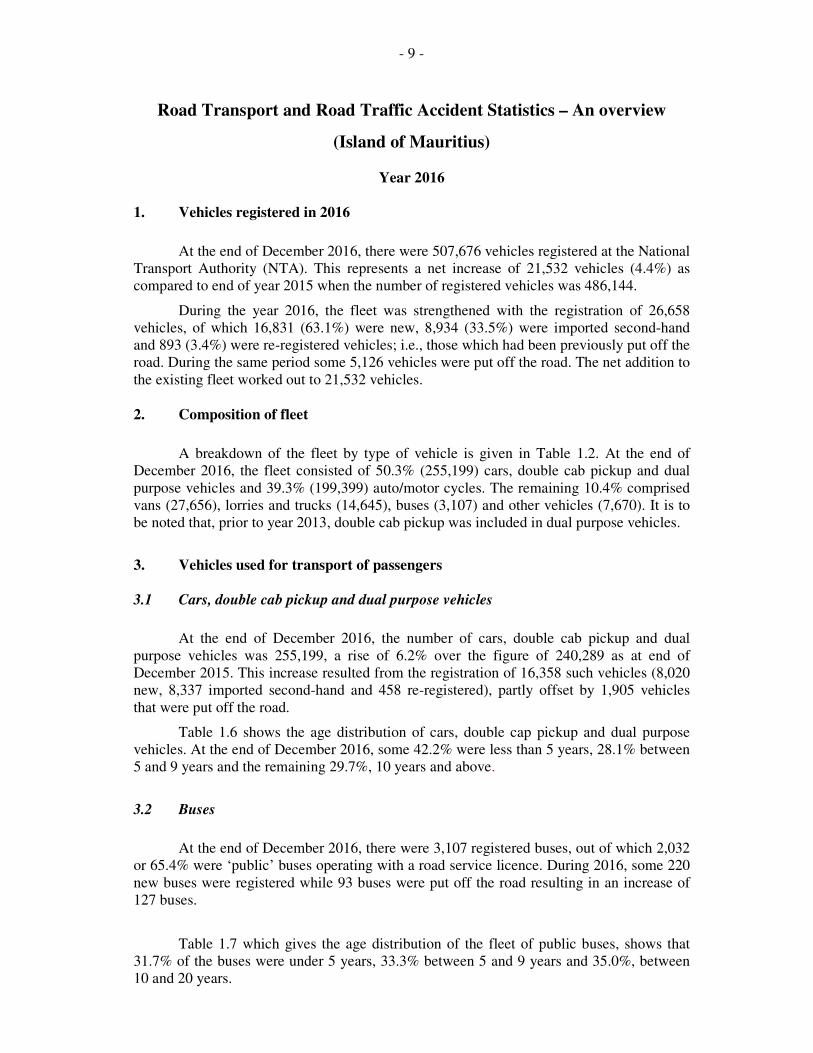
Road Transport and Road Traffic Accident Statistics – An overview
(Island of Mauritius)
Year 2016
1. Vehicles registered in 2016
At the end of December 2016, there were 507,676 vehicles registered at the National
Transport Authority (NTA). This represents a net increase of 21,532 vehicles (4.4%) as
compared to end of year 2015 when the number of registered vehicles was 486,144.
During the year 2016, the fleet was strengthened with the registration of 26,658
vehicles, of which 16,831 (63.1%) were new, 8,934 (33.5%) were imported second-hand
and 893 (3.4%) were re-registered vehicles; i.e., those which had been previously put off the
road. During the same period some 5,126 vehicles were put off the road. The net addition to
the existing fleet worked out to 21,532 vehicles.
2. Composition of fleet
A breakdown of the fleet by type of vehicle is given in Table 1.2. At the end of
December 2016, the fleet consisted of 50.3% (255,199) cars, double cab pickup and dual
purpose vehicles and 39.3% (199,399) auto/motor cycles. The remaining 10.4% comprised
vans (27,656), lorries and trucks (14,645), buses (3,107) and other vehicles (7,670). It is to
be noted that, prior to year 2013, double cab pickup was included in dual purpose vehicles.
3. Vehicles used for transport of passengers
3.1 Cars, double cab pickup and dual purpose vehicles
At the end of December 2016, the number of cars, double cab pickup and dual
purpose vehicles was 255,199, a rise of 6.2% over the figure of 240,289 as at end of
December 2015. This increase resulted from the registration of 16,358 such vehicles (8,020
new, 8,337 imported second-hand and 458 re-registered), partly offset by 1,905 vehicles
that were put off the road.
Table 1.6 shows the age distribution of cars, double cap pickup and dual purpose
vehicles. At the end of December 2016, some 42.2% were less than 5 years, 28.1% between
5 and 9 years and the remaining 29.7%, 10 years and above.
3.2 Buses
At the end of December 2016, there were 3,107 registered buses, out of which 2,032
or 65.4% were ‘public’ buses operating with a road service licence. During 2016, some 220
new buses were registered while 93 buses were put off the road resulting in an increase of
127 buses.
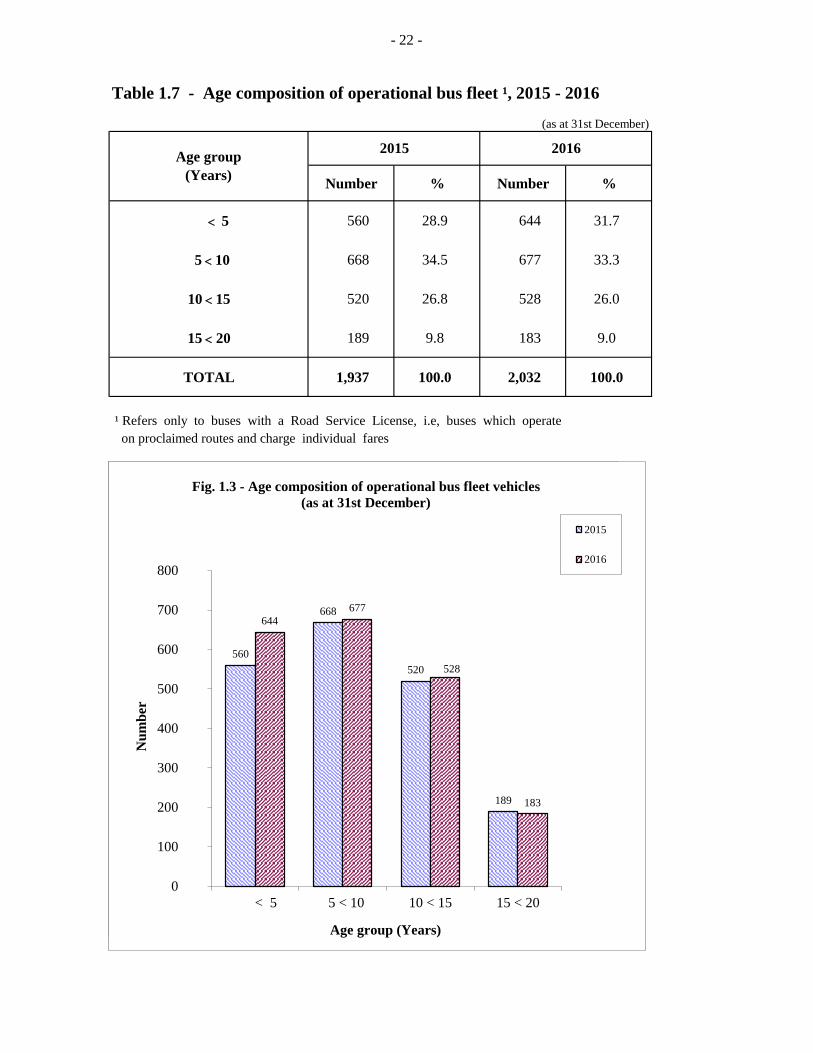
Table 1.7 which gives the age distribution of the fleet of public buses, shows that
31.7% of the buses were under 5 years, 33.3% between 5 and 9 years and 35.0%, between
10 and 20 years.

- 10 -
4. Motor cycles and auto cycles
At the end of 2016, there were 199,399 motor cycles and auto cycles. This
represents a net increase of 5,711 (+2.9%) against 193,688 at the end of 2015.
5. Road traffic accidents
The number of road accidents registered during the year 2016 was 29,277 against
28,476 in the preceding year, showing an increase of 2.8%. Among these accidents, the
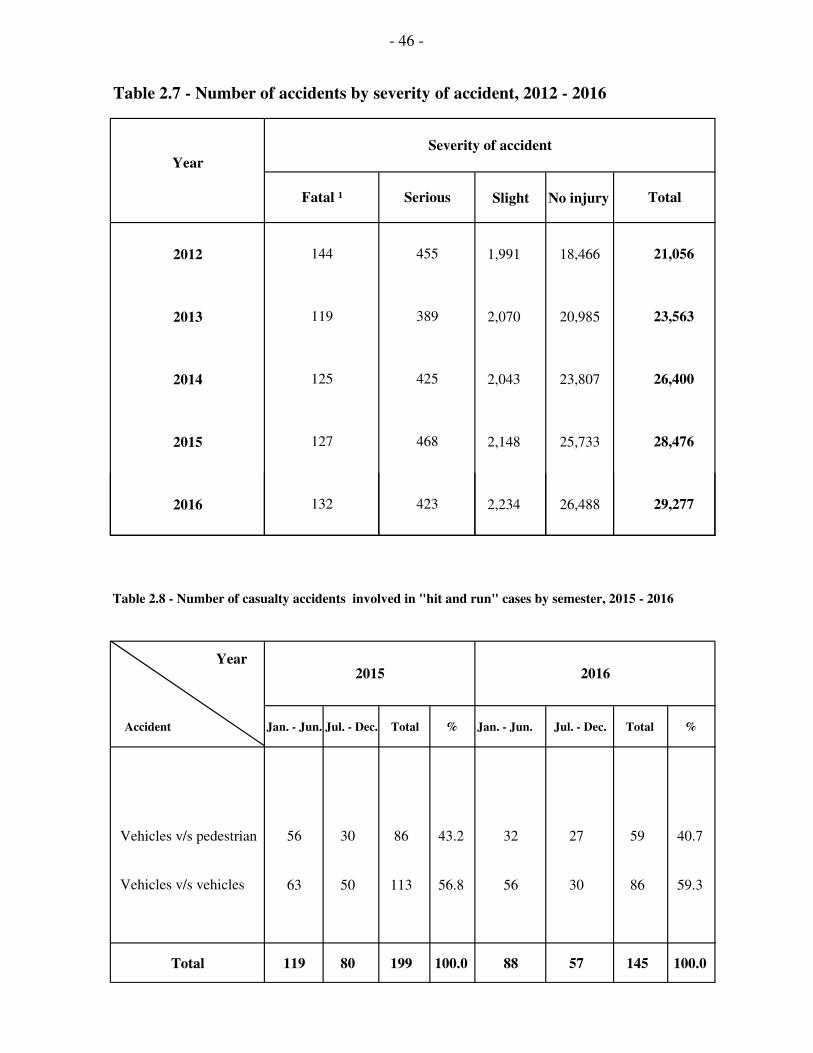
majority, 26,488 (90.5%) were non-injury, 132 fatal, 423 caused serious injuries and 2,234
slight injuries (Table 2.7).
Compared to 2015, accidents causing casualties went up by 1.7% and non-injury
accidents by 2.9%. Fatal accidents rose by 3.9%, slight injury accidents by 4.0% while
serious injury accidents decreased by 9.6%.
The accident rate, expressed as the number of accidents per 100,000 mid-year
population, increased from 2,333 in 2015 to 2,397 in 2016 and the number of accidents per
1,000 mid-year registered motor vehicles decreased from 60 in 2015 to 59 in 2016 (Table 2.1).
6. Vehicles involved in road accidents
During the year 2016, the total number of vehicles (both motor and non-motor)
involved in road accidents was 57,496 (+3.1%) against 55,787 in the previous year. The
number of motor vehicles involved in accidents resulting in casualties was 4,359 in 2016
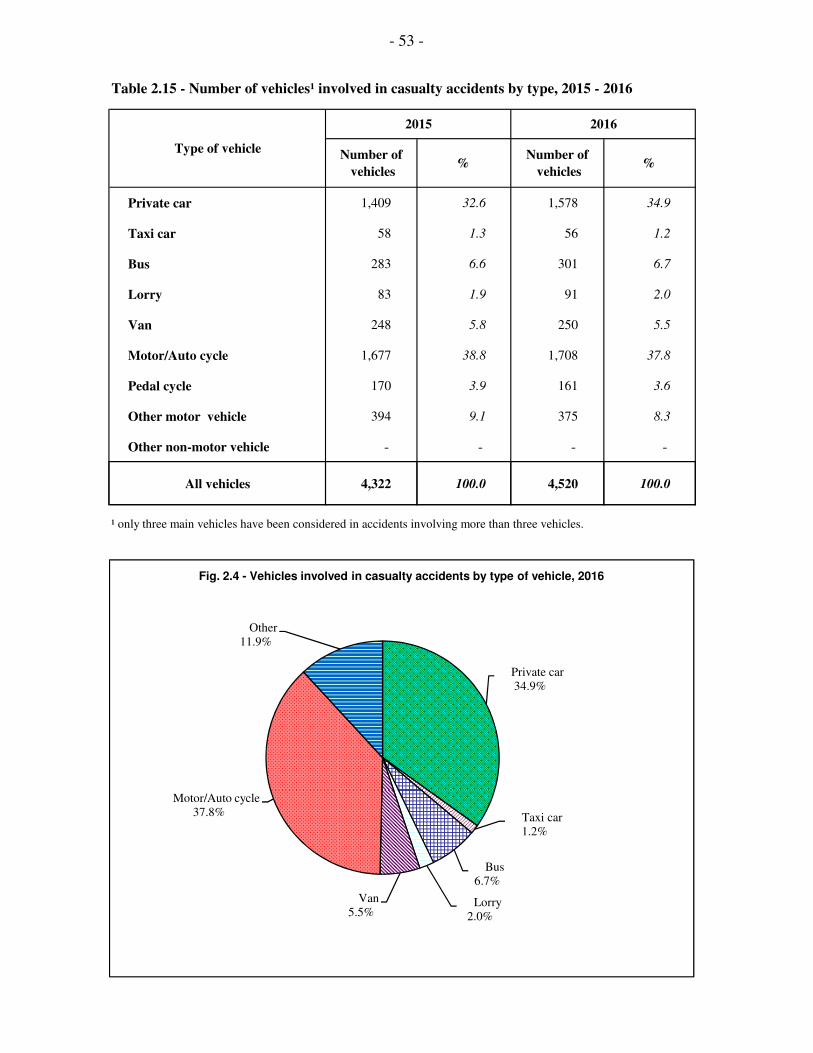
against 4,152 in 2015. Table 2.15 shows that 34.9% of the vehicles were private cars,
another 37.8% were motor/auto cycles, 6.7% were buses and 5.5% were vans.
7. Casualties
The number of casualties (fatalities and persons injured as a result of road accidents)
increased by 3.8% from 3,722 in 2015 to 3,862 in 2016. Among the casualties, 144 were
fatal, 512 seriously injured and the remaining 3,206 slightly injured.
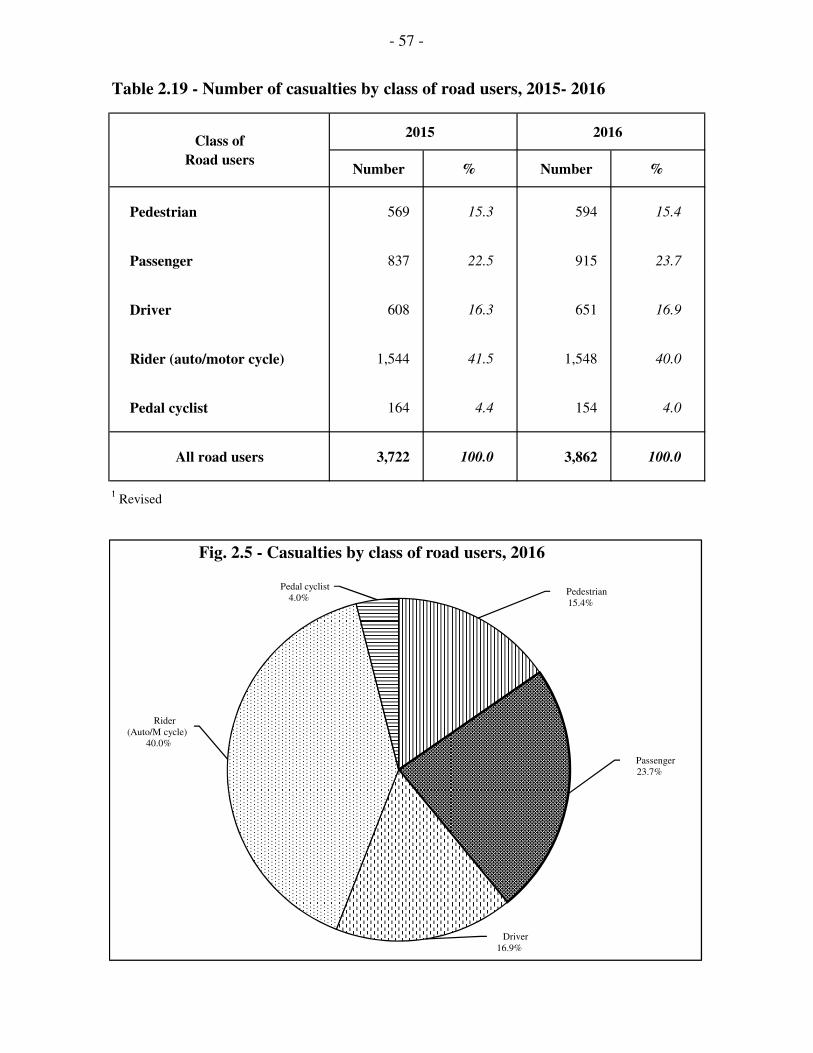
Table 2.19 reveals that, among the casualties in 2016, some 23.7% were passengers, 40.0%
riders of auto/motor cycles, 16.9% drivers, 15.4% pedestrians and 4.0% pedal cyclists.
Compared to 2015, the number of persons who died as a result of road accidents in
2016 went up by 3.6%. The fatality rate, expressed as the number of persons who died as a
result of road accidents per 100,000 mid-year population, was 11.8, compared to 11.4 in
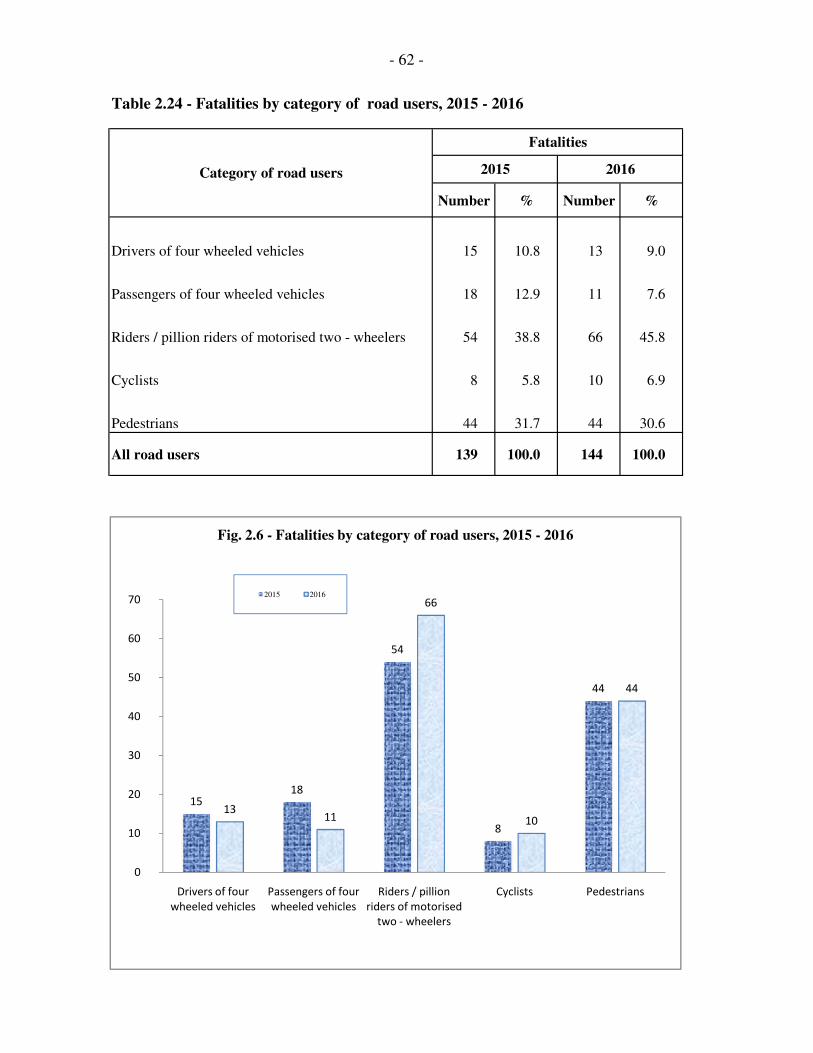
2015. Out of the144 persons killed in road accidents during year 2016, the most vulnerable
category of road users were riders/pillion riders of motorised two-wheelers (66), followed
by pedestrians (44) (Table 2.24).
8. Hit and run cases of accidents causing casualties
In 2016, there were 145 "hit and run" cases causing casualties compared to 199 in
2015. Out of these 145 cases, 59.3% (86) involved vehicles only while the other 40.7% (59)
involved both vehicles and pedestrians (Table 2.8).
- 11 -
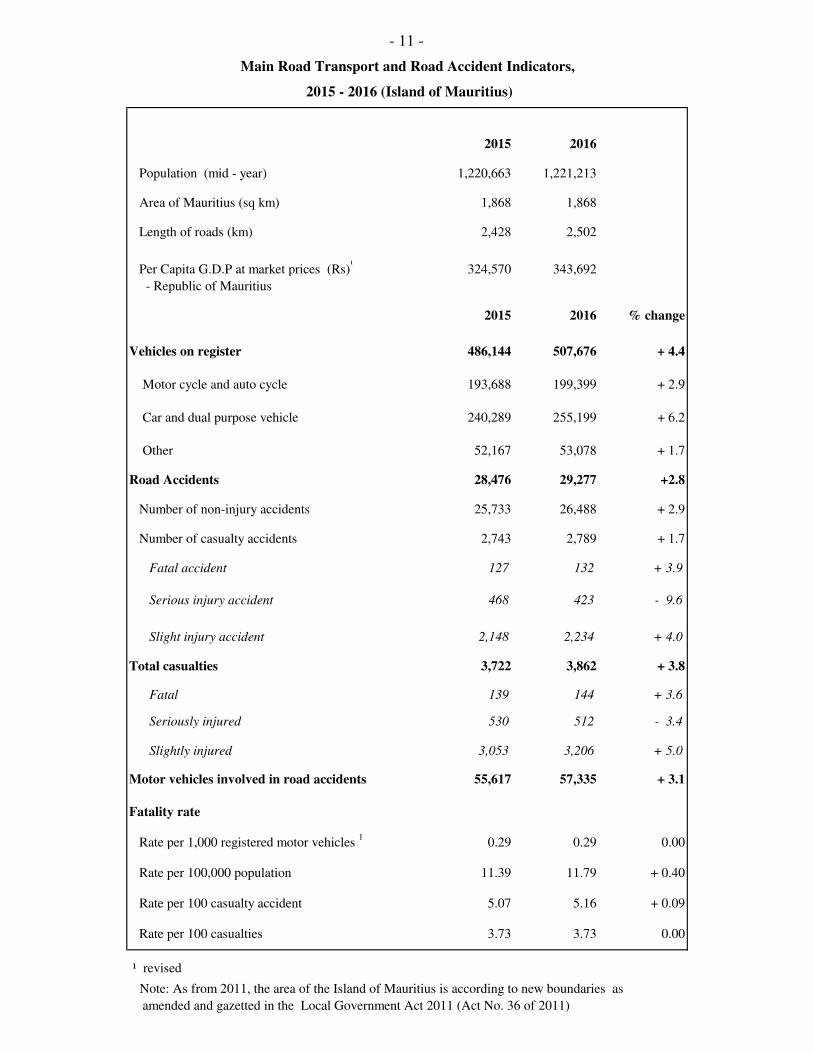
2015 2016
Population (mid - year) 1,220,663 1,221,213
Area of Mauritius (sq km) 1,868 1,868
Length of roads (km) 2,428 2,502
Per Capita G.D.P at market prices (Rs)¹
324,570 343,692
- Republic of Mauritius
2015 2016 % change
Vehicles on register 486,144 507,676 + 4.4
Motor cycle and auto cycle 193,688 199,399 + 2.9
Car and dual purpose vehicle 240,289 255,199 + 6.2
Other 52,167 53,078 + 1.7
Road Accidents 28,476 29,277 +2.8
Number of non-injury accidents 25,733 26,488 + 2.9
Number of casualty accidents 2,743 2,789 + 1.7
Fatal accident 127 132 + 3.9
Serious injury accident 468 423 - 9.6
Slight injury accident 2,148 2,234 + 4.0
Total casualties 3,722 3,862 + 3.8
Fatal 139 144 + 3.6
Seriously injured 530 512 - 3.4
Slightly injured 3,053 3,206 + 5.0
Motor vehicles involved in road accidents 55,617 57,335 + 3.1
Fatality rate
Rate per 1,000 registered motor vehicles 1
0.29 0.29 0.00
Rate per 100,000 population 11.39 11.79 + 0.40
Rate per 100 casualty accident 5.07 5.16 + 0.09
Rate per 100 casualties 3.73 3.73 0.00
¹ revised
Note: As from 2011, the area of the Island of Mauritius is according to new boundaries as
amended and gazetted in the Local Government Act 2011 (Act No. 36 of 2011)
2015 - 2016 (Island of Mauritius)
Main Road Transport and Road Accident Indicators,
PART PART PART PART IIII
VEHICLES
STATISTICS
Table 1.1 - Road network as at end of year, 2012 - 2016
MotorwaysMain
roads
Secondary
roads
Other
roadsTotal
2012 86 1,068 608 408 2,170 98 1.16 194
% of roads
paved
Density¹ of
total
network in
km per sq km
Number of
vehicles per km
of road
Year
Length of roads (km)
-
2013 99 1,131 625 420 2,275 98 1.22 195
2014 99 1,131 673 453 2,356 98 1.26 197
2015 99 1,131 716 482 2,428 98 1.30 200
2016 100 1,137 756 509 2,502 98 1.34 203
¹ density of total network in km per sq. km is the ratio of the total number of km of roads to the area of Mauritius (1,868 sq. km)
Note: As from 2011, the area of Island of Mauritius is according to new boundaries as amended and gazetted in the Local Government Act 2011
(Act No. 36 of 2011)
-15 -
350,000
450,000
550,000
Fig. 1.1 - Stock of registered vehicles, 2007 - 2016
Other Motor/autocycle Car, dual purpose vehicle and double cab pickup
Type of vehicle 2007 2008 2009 2010 2011 2012 2013 2014 2015 2016
Car, dual purpose vehicle and
double cab pickup1 144,405 155,528 165,036 175,634 185,357 197,849 211,586 225,522 240,289 255,199
Motor cycle and autocycle 142,606 147,988 152,935 159,329 165,706 173,508 180,785 187,851 193,688 199,399
Other 47,134 47,890 48,549 49,152 49,856 50,569 51,124 51,679 52,167 53,078
Total 334,145 351,406 366,520 384,115 400,919 421,926 443,495 465,052 486,144 507,676
1 New category of vehicle defined in Road Traffic Act as amended by Act No. 27 of 2012.
Prior to the year 2013 'double cab pickup' was included in 'dual purpose vehicle'
-50,000
50,000
150,000
250,000
2007 2008 2009 2010 2011 2012 2013 2014 2015 2016
-16 -

Table 1.2 - Vehicles¹ registered , 2007 - 2016
Number
Type of vehicle 2007 2008 2009 2010 2011 2012 2013 2014 2015 2016
Car 99,770 109,507 117,890 127,363 136,225 147,733 160,701 173,954 188,299 202,696
(of which taxi car) (6,885) (6,941) (6,921) (6,924) (6,907) (6,905) (6,915) (6,911) (6,907) (6,905)
Dual purpose vehicle 44,635 46,021 47,146 48,271 49,132 50,116 49,730 49,503 49,301 48,961
Double cab pickup 2 - - - - - - 1,155 2,065 2,689 3,542
Heavy motor car 1,223 1,290 1,275 1,249 1,230 1,244 1,250 1,271 1,284 1,316
Motor cycle 36,969 40,804 44,222 48,655 53,410 59,637 65,827 72,067 77,603 82,746
Auto cycle 105,637 107,184 108,713 110,674 112,296 113,871 114,958 115,784 116,085 116,653
-17 - Auto cycle 105,637 107,184 108,713 110,674 112,296 113,871 114,958 115,784 116,085 116,653
Lorry and truck 12,536 12,726 12,950 13,186 13,539 13,902 14,061 14,243 14,372 14,645
Van 24,934 25,334 25,622 25,914 26,090 26,293 26,624 26,890 27,229 27,656
Bus 2,753 2,762 2,803 2,845 2,912 2,957 2,963 3,006 2,980 3,107
Tractor and dumper 3,025 3,045 3,102 3,119 3,173 3,202 3,226 3,254 3,244 3,251
Prime mover 452 505 558 596 650 689 715 734 774 817
Trailer 1,795 1,809 1,823 1,821 1,834 1,845 1,846 1,842 1,850 1,853
Road roller 96 96 97 98 99 101 102 103 103 105
Other 320 323 319 324 329 336 337 336 331 328
TOTAL 334,145 351,406 366,520 384,115 400,919 421,926 443,495 465,052 486,144 507,676
¹ Excluding pedal cycles, but including government vehicles.
2
New category of vehicle defined in Road Traffic Act as amended by Act No. 27 of 2012.
Prior to the year 2013 'double cab pickup' was included in 'dual purpose vehicle'
-

- 18 -
Table 1.3 - New vehicles¹ registered, 2012 - 2016Number
Type of vehicle 2012 2013 2014 2015 2016
Car 7,207 6,651 7,181 6,678 6,928
Dual purpose vehicle 1,341 74 - 1 -
Double cab pickup 2
- 1,079 1,161 970 1,092
Heavy motor car 28 25 45 29 37
Motor cycle 6,517 6,481 6,608 5,923 5,619
Auto cycle 2,942 2,444 2,194 1,658 1,929
Lorry and truck 334 209 264 236 315 Lorry and truck 334 209 264 236 315
Van 362 452 454 470 593
Bus 151 91 163 56 220
Tractor and dumper 57 59 57 21 27
Prime mover 15 11 15 33 28
Trailer 55 24 21 31 37
Road roller 1 - 1 - 2
Other 3
11 7 6 2 4
Total 19,021 17,607 18,170 16,108 16,831
1 Includes government vehicles
2
New category of vehicle defined in Road Traffic Act as amended by Act No. 27 of 2012.
Prior to the year 2013 'double cab pickup' was included in 'dual purpose vehicle'
3 Includes, inter alia, tanker lorries, excavators and industrial tractors
Table 1.4 - Imported Second-hand and re-registered vehicles, 2012 - 2016Number
Type of vehicle
Imp
ort
ed s
econ
d -
han
d v
ehic
les
Re-
regis
tere
d
veh
icle
s ¹
Total
Imp
ort
ed s
econ
d -
han
d v
ehic
les
Re-
regis
tere
d
veh
icle
s ¹
Total
Imp
ort
ed s
econ
d -
han
d v
ehic
les
Re-
regis
tere
d
veh
icle
s ¹
Total
Imp
ort
ed s
econ
d -
han
d v
ehic
les
Re-
regis
tere
d
veh
icle
s ¹
Total
Imp
ort
ed s
econ
d -
han
d v
ehic
les
Re-
regis
tere
d
veh
icle
s ¹
Total
Car 5,012 409 5,421 7,109 350 7,459 6,886 324 7,210 8,479 350 8,829 8,304 397 8,701
Dual purpose vehicle 90 156 246 76 47 123 14 16 30 22 7 29 23 2 25
Double cab pickup 2 - - - 22 63 85 14 58 72 10 53 63 10 59 69
Heavy motor car - 13 13 7 5 12 3 5 8 5 6 11 17 4 21
20162015201420132012
-19
Motor cycle 46 367 413 66 346 412 59 305 364 53 317 370 36 304 340
Auto cycle 7 1 8 4 3 7 1 5 6 4 2 6 - - -
Lorry and truck 193 64 257 109 65 174 64 44 108 54 52 106 143 49 192
Van 207 106 313 297 71 368 287 60 347 361 52 413 334 60 394
Bus - - - - - - - - - - 1 1 - - -
Tractor and dumper 13 11 24 6 8 14 7 7 14 1 6 7 9 7 16
Prime mover 42 - 42 30 2 32 23 5 28 21 5 26 33 2 35
Trailer 21 18 39 36 19 55 28 14 42 30 13 43 25 7 32
Road roller - 1 1 - 1 1 - - - - - - - - -
Other 3
2 1 3 2 - 2 - 1 1 1 - 1 - 2 2
Total 5,633 1,147 6,780 7,764 980 8,744 7,386 844 8,230 9,041 864 9,905 8,934 893 9,827
¹ Refers to re-registration of vehicles previously put off the road excludes government vehicles which are not liable to re-registration
2
New category of vehicle defined in Road Traffic Act as amended by Act No. 27 of 2012.
Prior to the year 2013 'double cab pickup' was included in 'dual purpose vehicle'
3 Includes, inter alia, tanker lorries, excavators and industrial tractors
19 -
- 20 -
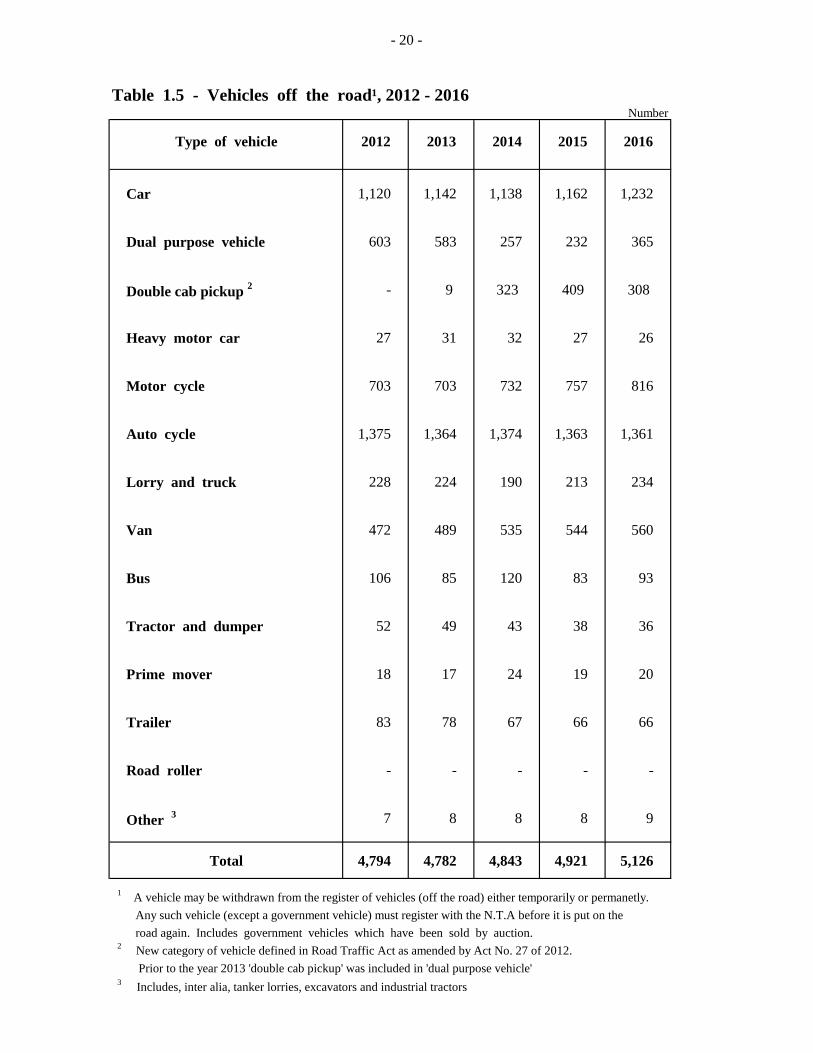
Table 1.5 - Vehicles off the road¹, 2012 - 2016Number
Type of vehicle 2012 2013 2014 2015 2016
Car 1,120 1,142 1,138 1,162 1,232
Dual purpose vehicle 603 583 257 232 365
Double cab pickup 2 - 9 323 409 308
Heavy motor car 27 31 32 27 26
Motor cycle 703 703 732 757 816
Auto cycle 1,375 1,364 1,374 1,363 1,361
Lorry and truck 228 224 190 213 234
Van 472 489 535 544 560
Bus 106 85 120 83 93
Tractor and dumper 52 49 43 38 36
Prime mover 18 17 24 19 20
Trailer 83 78 67 66 66
Road roller - - - - -
Other 3 7 8 8 8 9
Total 4,794 4,782 4,843 4,921 5,126
2
New category of vehicle defined in Road Traffic Act as amended by Act No. 27 of 2012.
Prior to the year 2013 'double cab pickup' was included in 'dual purpose vehicle'
3 Includes, inter alia, tanker lorries, excavators and industrial tractors
road again. Includes government vehicles which have been sold by auction.
1 A vehicle may be withdrawn from the register of vehicles (off the road) either temporarily or permanetly.
Any such vehicle (except a government vehicle) must register with the N.T.A before it is put on the

- 21 -
Age group 2015 2016
(Years) Number % Number %
< 5 104,313 43.4 107,691 42.2
5 < 10 62,715 26.1 71,830 28.1
10 < 15 29,607 12.3 30,315 11.9
15 43,654 18.2 45,363 17.8
TOTAL 240,289 100.0 255,199 100.0
¹ New category of vehicle defined in Road Traffic Act as amended by Act No. 27 of 2012.
Prior to the year 2013 'double cab pickup' was included in 'dual purpose vehicle'
( as at 31st December )
Table 1.6 - Age composition of cars, dual purpose vehicles and double cab pickup ¹ ,
2015 - 2016
104,313
62,715
29,607
43,654
107,691
71,830
30,315
45,363
0
20,000
40,000
60,000
80,000
100,000
120,000
< 5 5 < 10 10 < 15 15
Nu
mb
er
Age - group (years)
Fig. 1.2 - Age composition of cars, dual purpose vehicles and double
cab pickup1(as at 31st December)
2015 2016
- 22 -
Table 1.7 - Age composition of operational bus fleet ¹, 2015 - 2016
Number % Number %
< 5 560 28.9 644 31.7
5 < 10 668 34.5 677 33.3
10 < 15 520 26.8 528 26.0
15 < 20 189 9.8 183 9.0
TOTAL 1,937 100.0 2,032 100.0
¹ Refers only to buses with a Road Service License, i.e, buses which operate
on proclaimed routes and charge individual fares
Age group
(Years)
(as at 31st December)
2015 2016
442
585 574
229
496 485
605
283
0
100
200
300
400
500
600
700
< 5 5 < 10 10 < 15 15 < 18
Nu
mb
er
Age group (Years)
Fig. 1.3 - Age composition of operational bus fleet vehicles
(as at 31 st December)
2003 2004
560
668
520
189
644
677
528
183
0
100
200
300
400
500
600
700
800
< 5 5 < 10 10 < 15 15 < 20
Nu
mb
er
Age group (Years)
Fig. 1.3 - Age composition of operational bus fleet vehicles
(as at 31st December)
2015
2016
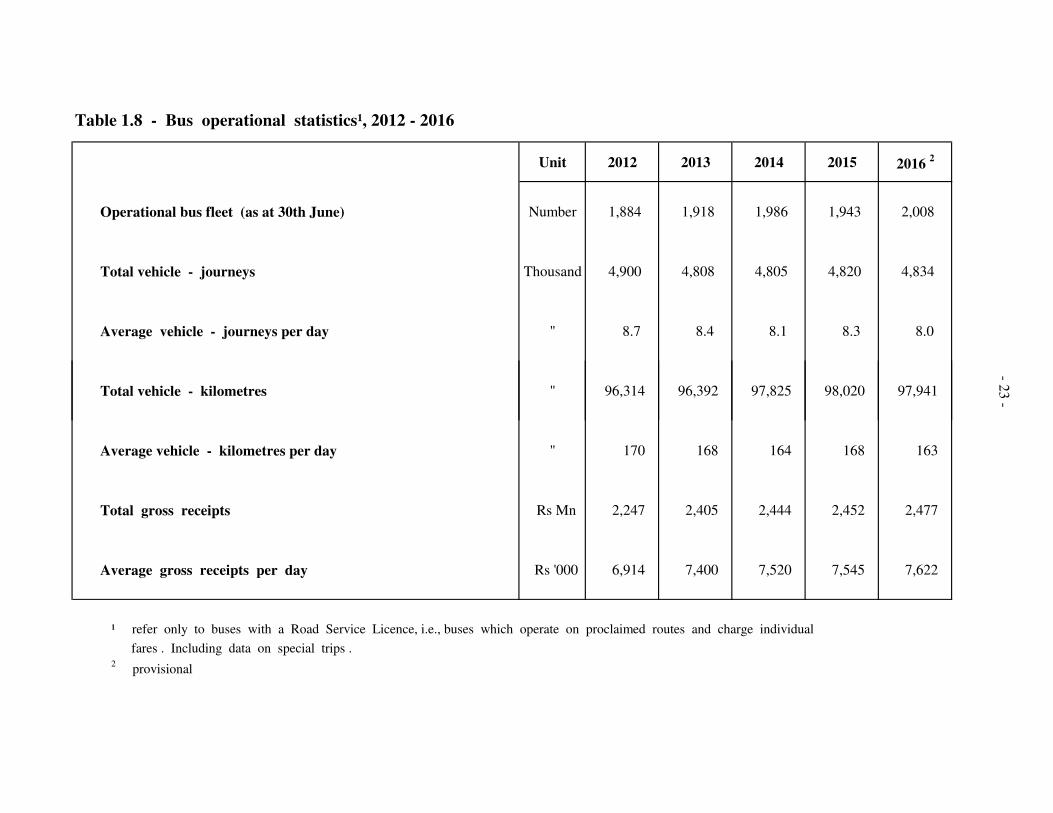
Table 1.8 - Bus operational statistics¹, 2012 - 2016
Unit 2012 2013 2014 2015 2016 2
Operational bus fleet (as at 30th June) Number 1,884 1,918 1,986 1,943 2,008
Total vehicle - journeys Thousand 4,900 4,808 4,805 4,820 4,834
Average vehicle - journeys per day " 8.7 8.4 8.1 8.3 8.0
-
Total vehicle - kilometres " 96,314 96,392 97,825 98,020 97,941
Average vehicle - kilometres per day " 170 168 164 168 163
Total gross receipts Rs Mn 2,247 2,405 2,444 2,452 2,477
Average gross receipts per day Rs '000 6,914 7,400 7,520 7,545 7,622
¹ refer only to buses with a Road Service Licence, i.e., buses which operate on proclaimed routes and charge individual
fares . Including data on special trips .
2 provisional
-23 -
- 24 -
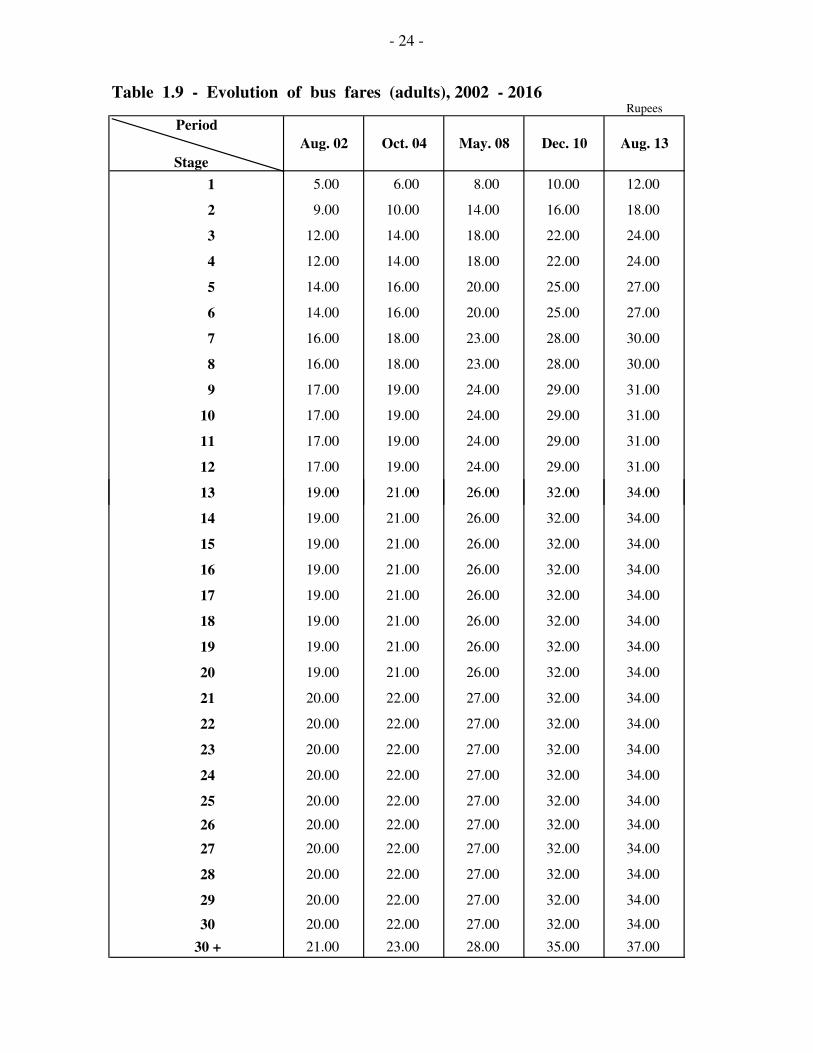
Table 1.9 - Evolution of bus fares (adults), 2002 - 2016Rupees
Period
Aug. 02 Oct. 04 May. 08 Dec. 10 Aug. 13
Stage
1 5.00 6.00 8.00 10.00 12.00
2 9.00 10.00 14.00 16.00 18.00
3 12.00 14.00 18.00 22.00 24.00
4 12.00 14.00 18.00 22.00 24.00
5 14.00 16.00 20.00 25.00 27.00
6 14.00 16.00 20.00 25.00 27.00
7 16.00 18.00 23.00 28.00 30.00
8 16.00 18.00 23.00 28.00 30.00
9 17.00 19.00 24.00 29.00 31.00
10 17.00 19.00 24.00 29.00 31.00
11 17.00 19.00 24.00 29.00 31.00
12 17.00 19.00 24.00 29.00 31.00
13 19.00 21.00 26.00 32.00 34.00 13 19.00 21.00 26.00 32.00 34.00
14 19.00 21.00 26.00 32.00 34.00
15 19.00 21.00 26.00 32.00 34.00
16 19.00 21.00 26.00 32.00 34.00
17 19.00 21.00 26.00 32.00 34.00
18 19.00 21.00 26.00 32.00 34.00
19 19.00 21.00 26.00 32.00 34.00
20 19.00 21.00 26.00 32.00 34.00
21 20.00 22.00 27.00 32.00 34.00
22 20.00 22.00 27.00 32.00 34.00
23 20.00 22.00 27.00 32.00 34.00
24 20.00 22.00 27.00 32.00 34.00
25 20.00 22.00 27.00 32.00 34.00
26 20.00 22.00 27.00 32.00 34.00
27 20.00 22.00 27.00 32.00 34.00
28 20.00 22.00 27.00 32.00 34.00
29 20.00 22.00 27.00 32.00 34.00
30 20.00 22.00 27.00 32.00 34.00
30 + 21.00 23.00 28.00 35.00 37.00
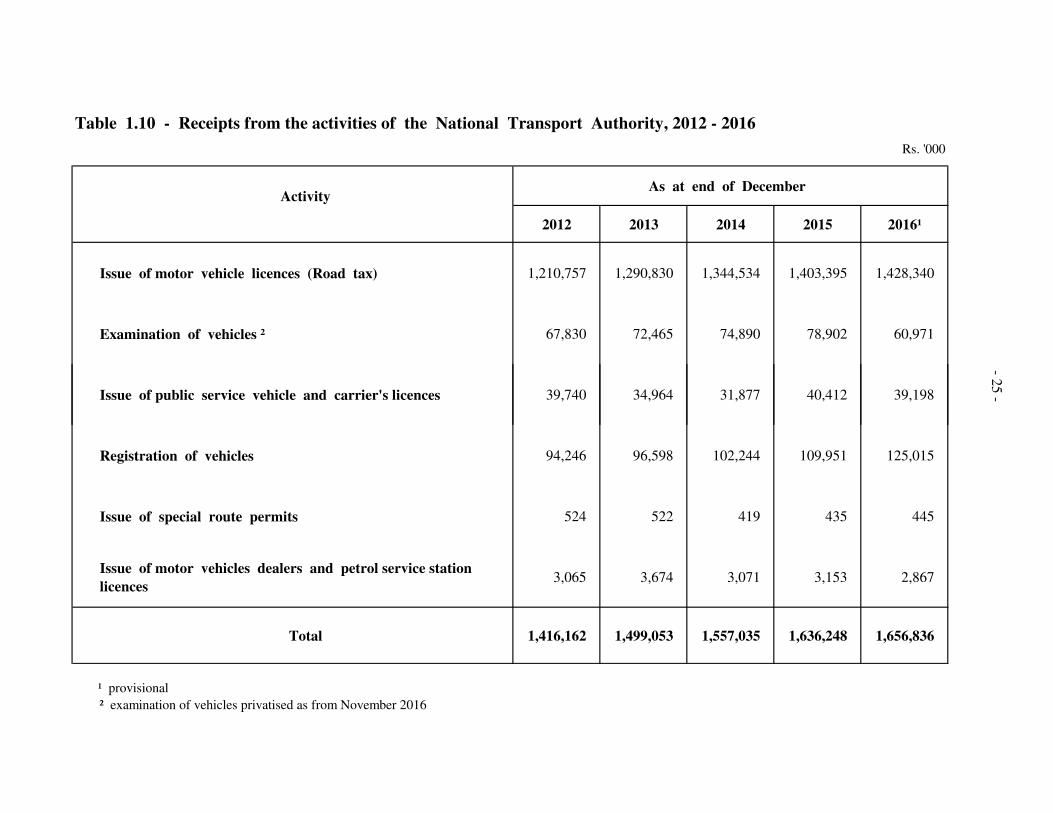
Table 1.10 - Receipts from the activities of the National Transport Authority, 2012 - 2016
Rs. '000
ActivityAs at end of December
2012 2013 2014 2015 2016¹
Issue of motor vehicle licences (Road tax) 1,210,757 1,290,830 1,344,534 1,403,395 1,428,340
Examination of vehicles ² 67,830 72,465 74,890 78,902 60,971
-25 Issue of public service vehicle and carrier's licences 39,740 34,964 31,877 40,412 39,198
Registration of vehicles 94,246 96,598 102,244 109,951 125,015
Issue of special route permits 524 522 419 435 445
Issue of motor vehicles dealers and petrol service station
licences3,065 3,674 3,071 3,153 2,867
Total 1,416,162 1,499,053 1,557,035 1,636,248 1,656,836
¹ provisional
² examination of vehicles privatised as from November 2016
25 -
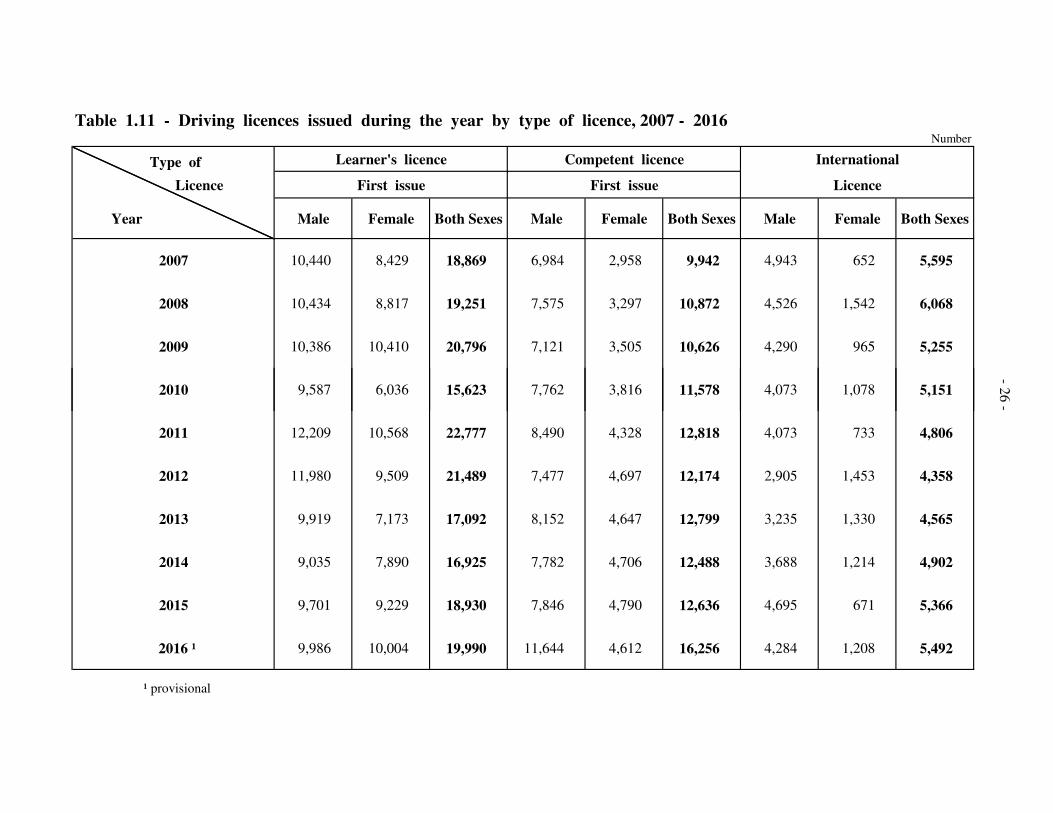
Table 1.11 - Driving licences issued during the year by type of licence, 2007 - 2016Number
Type of Learner's licence Competent licence International
Licence First issue First issue Licence
Year Male Female Both Sexes Male Female Both Sexes Male Female Both Sexes
2007 10,440 8,429 18,869 6,984 2,958 9,942 4,943 652 5,595
2008 10,434 8,817 19,251 7,575 3,297 10,872 4,526 1,542 6,068
2009 10,386 10,410 20,796 7,121 3,505 10,626 4,290 965 5,255
2010 9,587 6,036 15,623 7,762 3,816 11,578 4,073 1,078 5,151
-
2010 9,587 6,036 15,623 7,762 3,816 11,578 4,073 1,078 5,151
2011 12,209 10,568 22,777 8,490 4,328 12,818 4,073 733 4,806
2012 11,980 9,509 21,489 7,477 4,697 12,174 2,905 1,453 4,358
2013 9,919 7,173 17,092 8,152 4,647 12,799 3,235 1,330 4,565
2014 9,035 7,890 16,925 7,782 4,706 12,488 3,688 1,214 4,902
2015 9,701 9,229 18,930 7,846 4,790 12,636 4,695 671 5,366
2016 ¹ 9,986 10,004 19,990 11,644 4,612 16,256 4,284 1,208 5,492
¹ provisional
-26 -
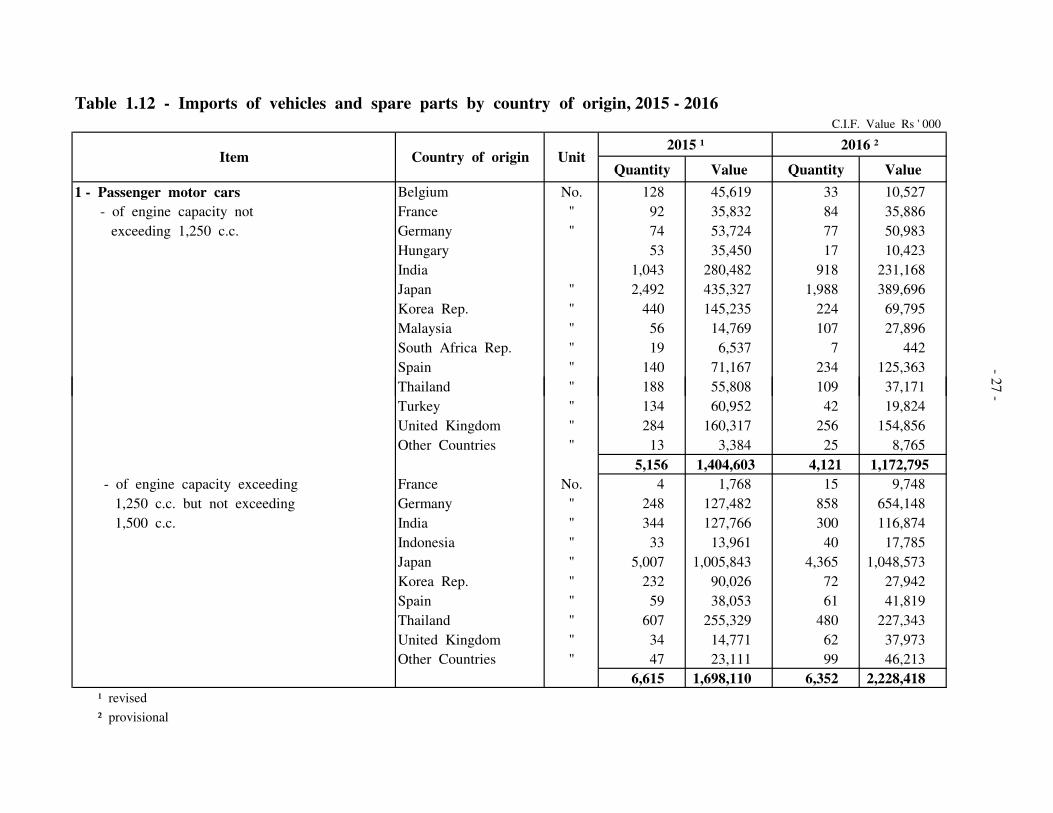
Table 1.12 - Imports of vehicles and spare parts by country of origin, 2015 - 2016 C.I.F. Value Rs ' 000
2015 ¹ 2016 ²
Quantity Value Quantity Value
1 - Passenger motor cars Belgium No. 128 45,619 33 10,527
- of engine capacity not France " 92 35,832 84 35,886
exceeding 1,250 c.c. Germany " 74 53,724 77 50,983
Hungary 53 35,450 17 10,423
India 1,043 280,482 918 231,168
Japan " 2,492 435,327 1,988 389,696
Korea Rep. " 440 145,235 224 69,795
Malaysia " 56 14,769 107 27,896
South Africa Rep. " 19 6,537 7 442
Spain " 140 71,167 234 125,363
Thailand " 188 55,808 109 37,171
Item Country of origin Unit
-27 Thailand " 188 55,808 109 37,171
Turkey " 134 60,952 42 19,824
United Kingdom " 284 160,317 256 154,856
Other Countries " 13 3,384 25 8,765
5,156 1,404,603 4,121 1,172,795
- of engine capacity exceeding France No. 4 1,768 15 9,748
1,250 c.c. but not exceeding Germany " 248 127,482 858 654,148
1,500 c.c. India " 344 127,766 300 116,874
Indonesia " 33 13,961 40 17,785
Japan " 5,007 1,005,843 4,365 1,048,573
Korea Rep. " 232 90,026 72 27,942
Spain " 59 38,053 61 41,819
Thailand " 607 255,329 480 227,343
United Kingdom " 34 14,771 62 37,973
Other Countries " 47 23,111 99 46,213
6,615 1,698,110 6,352 2,228,418
¹ revised
² provisional
27 -
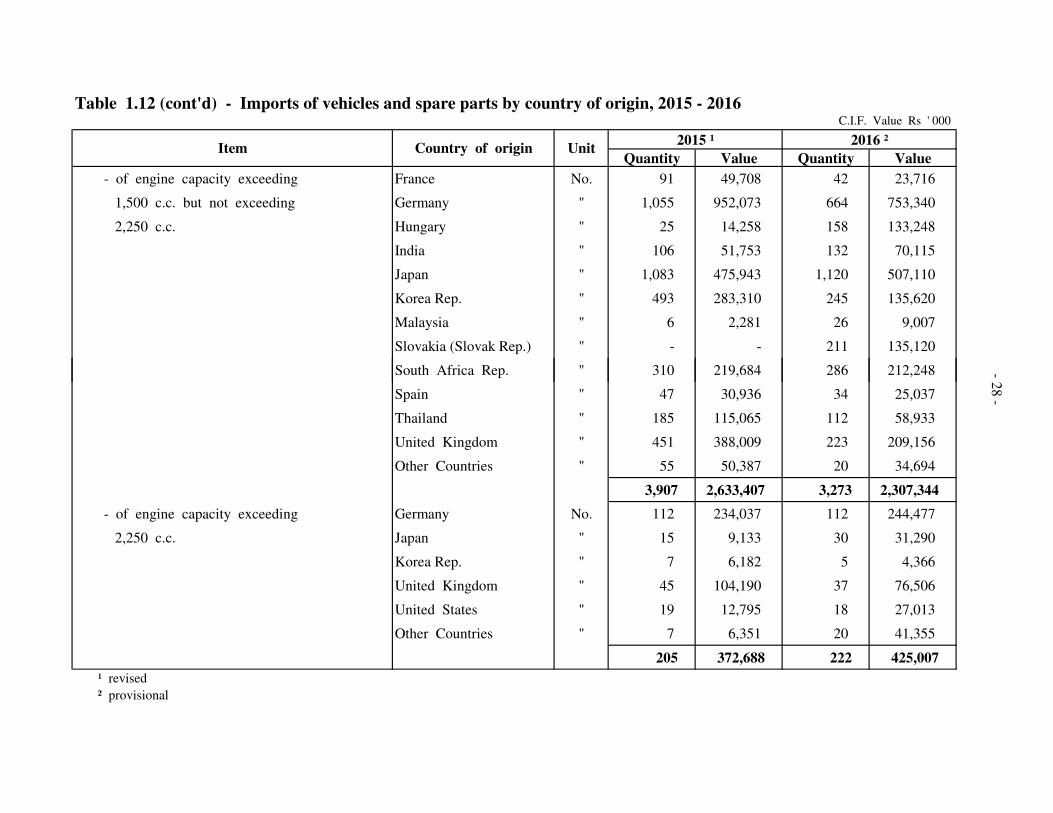
Table 1.12 (cont'd) - Imports of vehicles and spare parts by country of origin, 2015 - 2016C.I.F. Value Rs ' 000
2015 ¹ 2016 ²
Quantity Value Quantity Value
- of engine capacity exceeding France No. 91 49,708 42 23,716
1,500 c.c. but not exceeding Germany " 1,055 952,073 664 753,340
2,250 c.c. Hungary " 25 14,258 158 133,248
India " 106 51,753 132 70,115
Japan " 1,083 475,943 1,120 507,110
Korea Rep. " 493 283,310 245 135,620
Malaysia " 6 2,281 26 9,007
Slovakia (Slovak Rep.) " - - 211 135,120
South Africa Rep. " 310 219,684 286 212,248
Item Country of origin Unit
-
Spain " 47 30,936 34 25,037
Thailand " 185 115,065 112 58,933
United Kingdom " 451 388,009 223 209,156
Other Countries " 55 50,387 20 34,694
3,907 2,633,407 3,273 2,307,344
- of engine capacity exceeding Germany No. 112 234,037 112 244,477
2,250 c.c. Japan " 15 9,133 30 31,290
Korea Rep. " 7 6,182 5 4,366
United Kingdom " 45 104,190 37 76,506
United States " 19 12,795 18 27,013
Other Countries " 7 6,351 20 41,355
205 372,688 222 425,007
¹ revised
² provisional
28 -
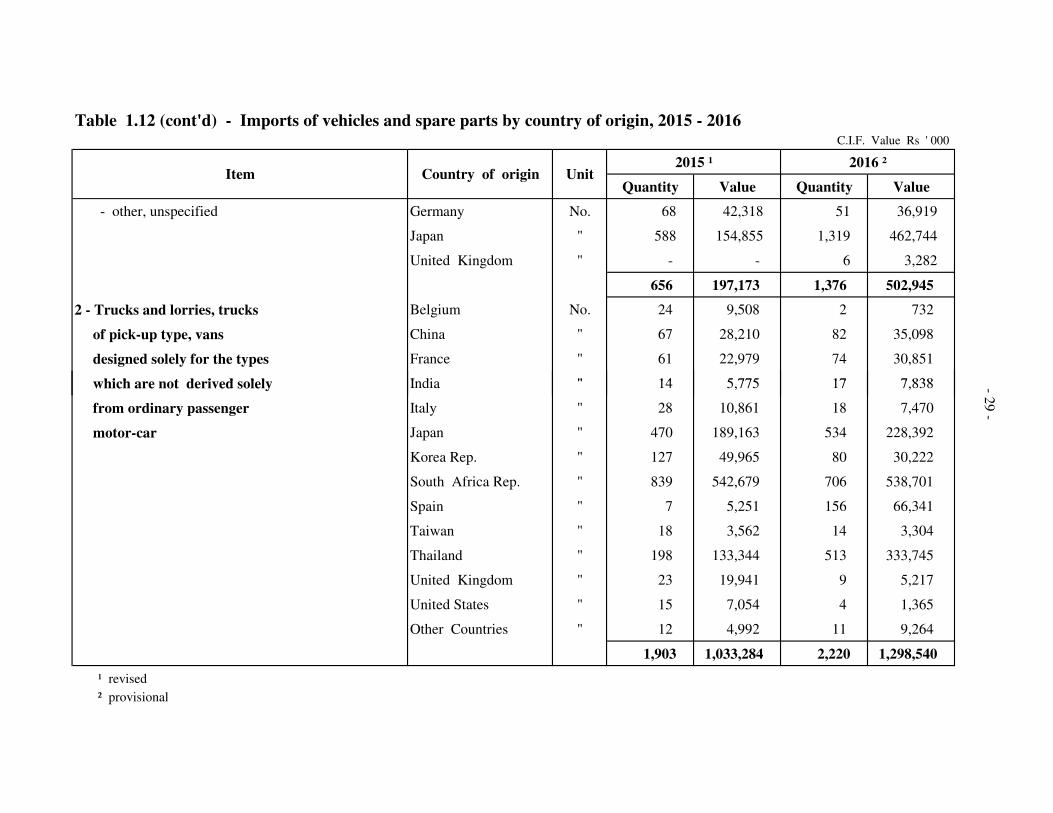
Table 1.12 (cont'd) - Imports of vehicles and spare parts by country of origin, 2015 - 2016C.I.F. Value Rs ' 000
2015 ¹ 2016 ²
Quantity Value Quantity Value
- other, unspecified Germany No. 68 42,318 51 36,919
Japan " 588 154,855 1,319 462,744
United Kingdom " - - 6 3,282
656 197,173 1,376 502,945
2 - Trucks and lorries, trucks Belgium No. 24 9,508 2 732
of pick-up type, vans China " 67 28,210 82 35,098
designed solely for the types France " 61 22,979 74 30,851
which are not derived solely India " 14 5,775 17 7,838
Item Country of origin Unit
which are not derived solely India " 14 5,775 17 7,838
from ordinary passenger Italy " 28 10,861 18 7,470
motor-car Japan " 470 189,163 534 228,392
Korea Rep. " 127 49,965 80 30,222
South Africa Rep. " 839 542,679 706 538,701
Spain " 7 5,251 156 66,341
Taiwan " 18 3,562 14 3,304
Thailand " 198 133,344 513 333,745
United Kingdom " 23 19,941 9 5,217
United States " 15 7,054 4 1,365
Other Countries " 12 4,992 11 9,264
1,903 1,033,284 2,220 1,298,540
¹ revised
² provisional
-29 -
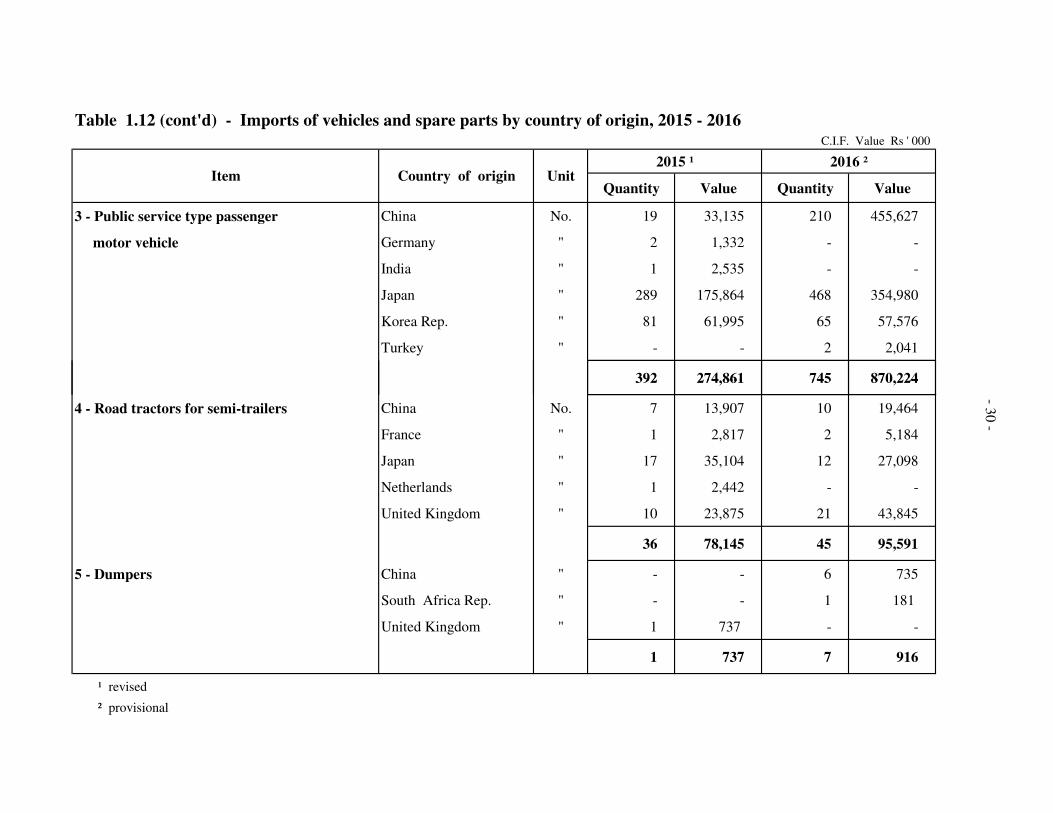
Table 1.12 (cont'd) - Imports of vehicles and spare parts by country of origin, 2015 - 2016C.I.F. Value Rs ' 000
2015 ¹ 2016 ²
Quantity Value Quantity Value
3 - Public service type passenger China No. 19 33,135 210 455,627
motor vehicle Germany " 2 1,332 - -
India " 1 2,535 - -
Japan " 289 175,864 468 354,980
Korea Rep. " 81 61,995 65 57,576
Turkey " - - 2 2,041
392 274,861 745 870,224
Item Country of origin Unit
392 274,861 745 870,224
4 - Road tractors for semi-trailers China No. 7 13,907 10 19,464
France " 1 2,817 2 5,184
Japan " 17 35,104 12 27,098
Netherlands " 1 2,442 - -
United Kingdom " 10 23,875 21 43,845
36 78,145 45 95,591
5 - Dumpers China " - - 6 735
South Africa Rep. " - - 1 181
United Kingdom " 1 737 - -
1 737 7 916
¹ revised
² provisional
-30 -
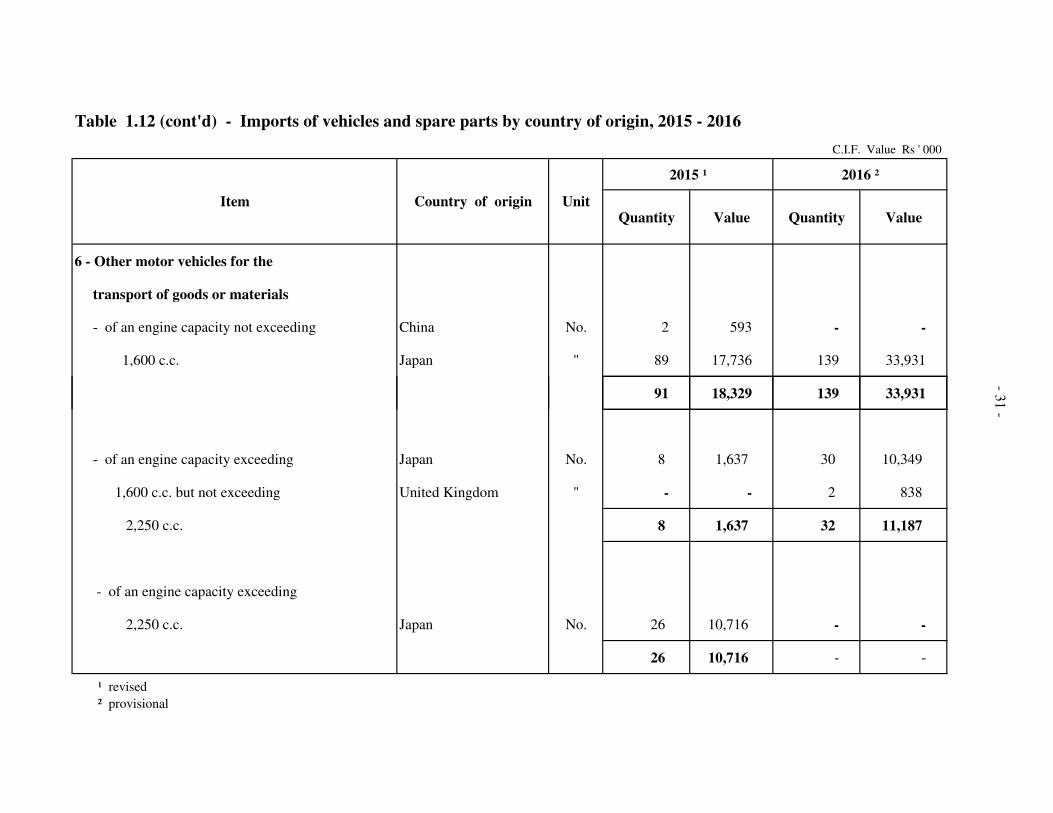
Table 1.12 (cont'd) - Imports of vehicles and spare parts by country of origin, 2015 - 2016
C.I.F. Value Rs ' 000
2015 ¹ 2016 ²
Quantity Value Quantity Value
6 - Other motor vehicles for the
transport of goods or materials
- of an engine capacity not exceeding China No. 2 593 - -
1,600 c.c. Japan " 89 17,736 139 33,931
Item Country of origin Unit
91 18,329 139 33,931
- of an engine capacity exceeding Japan No. 8 1,637 30 10,349
1,600 c.c. but not exceeding United Kingdom " - - 2 838
2,250 c.c. 8 1,637 32 11,187
- of an engine capacity exceeding
2,250 c.c. Japan No. 26 10,716 - -
26 10,716 - -
¹ revised
² provisional
-31 -
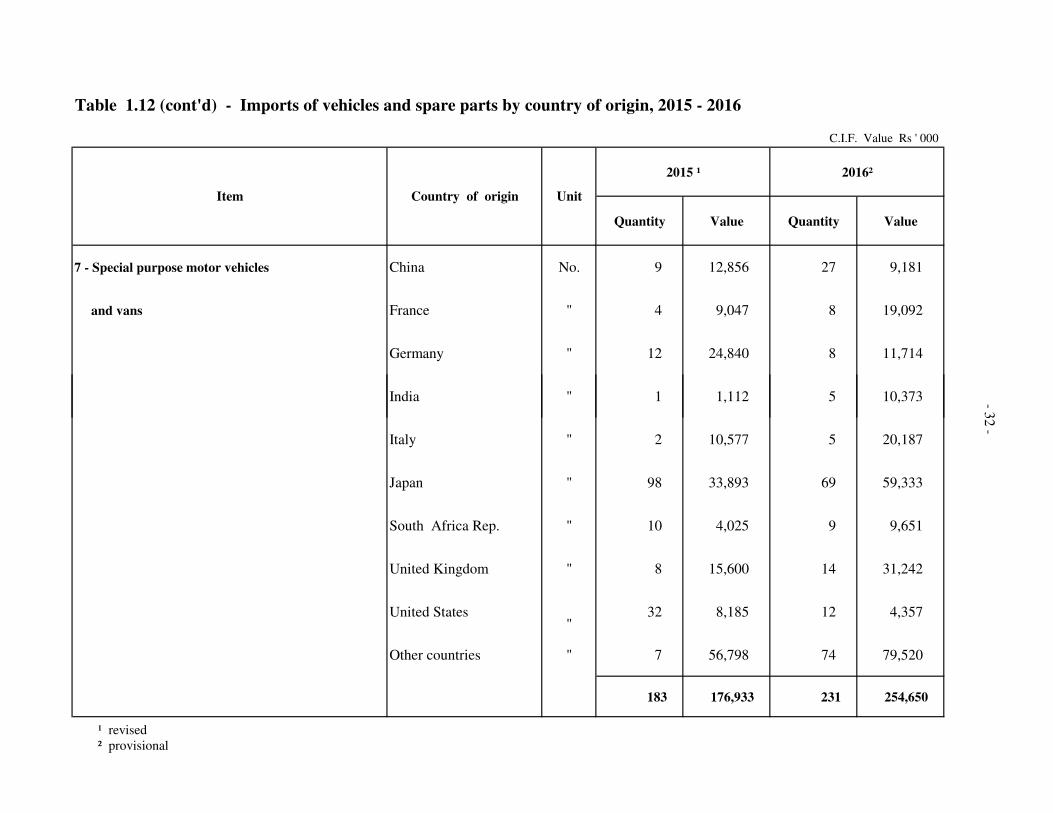
Table 1.12 (cont'd) - Imports of vehicles and spare parts by country of origin, 2015 - 2016
C.I.F. Value Rs ' 000
2015 ¹ 2016²
Quantity Value Quantity Value
7 - Special purpose motor vehicles China No. 9 12,856 27 9,181
and vans France " 4 9,047 8 19,092
Germany " 12 24,840 8 11,714
Item Country of origin Unit
India " 1 1,112 5 10,373
Italy " 2 10,577 5 20,187
Japan " 98 33,893 69 59,333
South Africa Rep. " 10 4,025 9 9,651
United Kingdom " 8 15,600 14 31,242
United States"
32 8,185 12 4,357
Other countries " 7 56,798 74 79,520
183 176,933 231 254,650
¹ revised
² provisional
-32
-
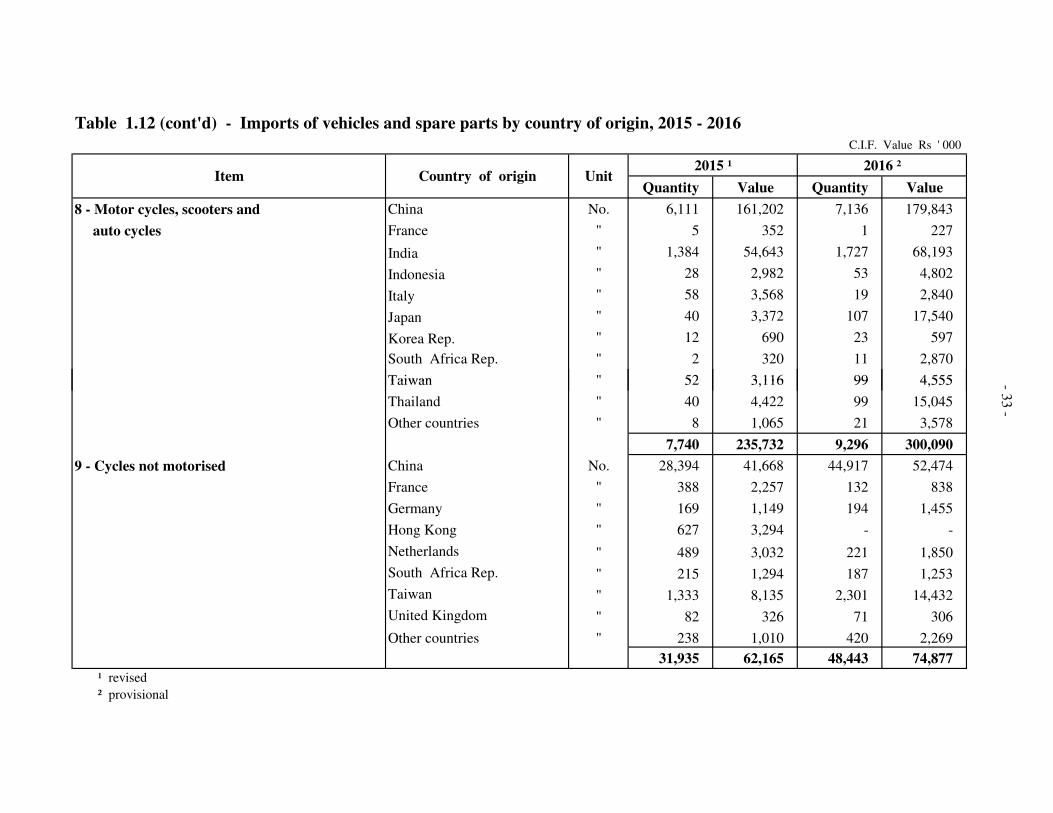
Table 1.12 (cont'd) - Imports of vehicles and spare parts by country of origin, 2015 - 2016
C.I.F. Value Rs ' 000
2015 ¹ 2016 ²
Quantity Value Quantity Value
8 - Motor cycles, scooters and China No. 6,111 161,202 7,136 179,843
auto cycles France " 5 352 1 227
India " 1,384 54,643 1,727 68,193
Indonesia " 28 2,982 53 4,802
Italy " 58 3,568 19 2,840
Japan " 40 3,372 107 17,540
Korea Rep. " 12 690 23 597
South Africa Rep. " 2 320 11 2,870
Taiwan " 52 3,116 99 4,555
Item Country of origin Unit
Taiwan " 52 3,116 99 4,555
Thailand " 40 4,422 99 15,045
Other countries " 8 1,065 21 3,578
7,740 235,732 9,296 300,090
9 - Cycles not motorised China No. 28,394 41,668 44,917 52,474
France " 388 2,257 132 838
Germany " 169 1,149 194 1,455
Hong Kong " 627 3,294 - -
Netherlands " 489 3,032 221 1,850
South Africa Rep. " 215 1,294 187 1,253
Taiwan " 1,333 8,135 2,301 14,432
United Kingdom " 82 326 71 306
Other countries " 238 1,010 420 2,269
31,935 62,165 48,443 74,877
¹ revised
² provisional
-33 -
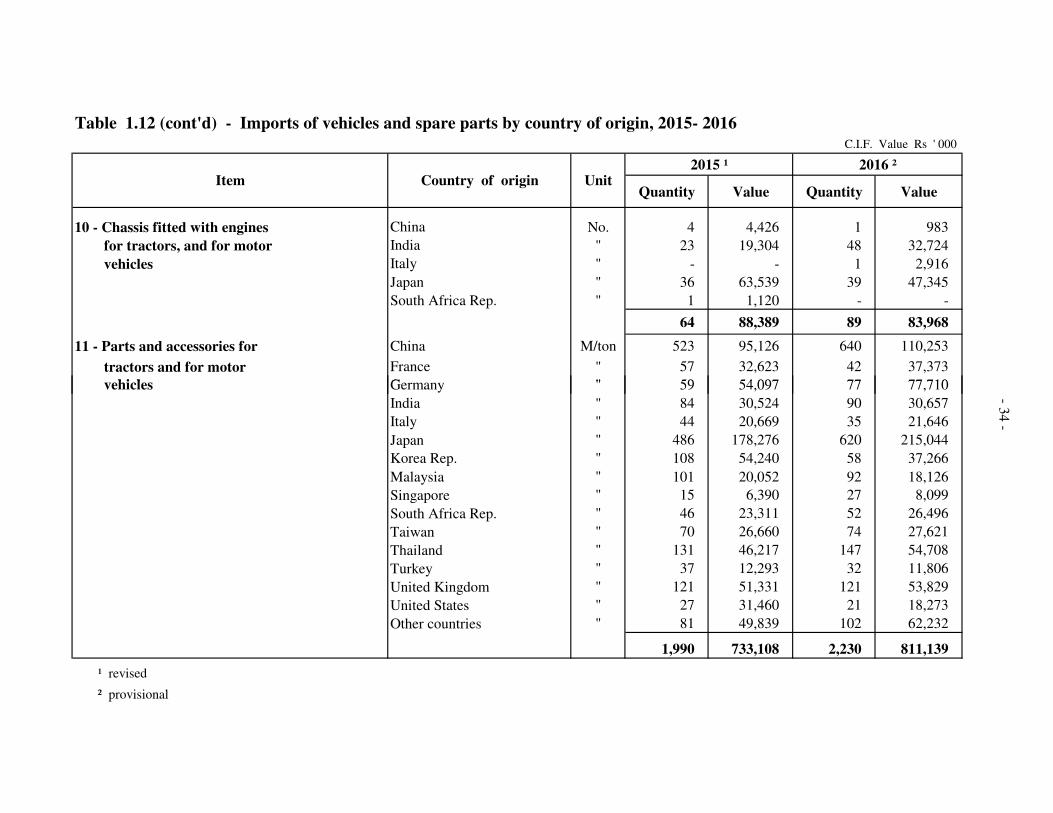
Table 1.12 (cont'd) - Imports of vehicles and spare parts by country of origin, 2015- 2016
C.I.F. Value Rs ' 000
2015 ¹ 2016 ²
Quantity Value Quantity Value
10 - Chassis fitted with engines China No. 4 4,426 1 983
for tractors, and for motor India " 23 19,304 48 32,724
vehicles Italy " - - 1 2,916
Japan " 36 63,539 39 47,345
South Africa Rep. " 1 1,120 - -
64 88,389 89 83,968
11 - Parts and accessories for China M/ton 523 95,126 640 110,253
tractors and for motor France " 57 32,623 42 37,373
vehicles Germany " 59 54,097 77 77,710
Item Country of origin Unit
vehicles Germany " 59 54,097 77 77,710
India " 84 30,524 90 30,657
Italy " 44 20,669 35 21,646
Japan " 486 178,276 620 215,044
Korea Rep. " 108 54,240 58 37,266
Malaysia " 101 20,052 92 18,126
Singapore " 15 6,390 27 8,099
South Africa Rep. " 46 23,311 52 26,496
Taiwan " 70 26,660 74 27,621
Thailand " 131 46,217 147 54,708
Turkey " 37 12,293 32 11,806
United Kingdom " 121 51,331 121 53,829
United States " 27 31,460 21 18,273
Other countries " 81 49,839 102 62,232
1,990 733,108 2,230 811,139
¹ revised
² provisional
-34 -
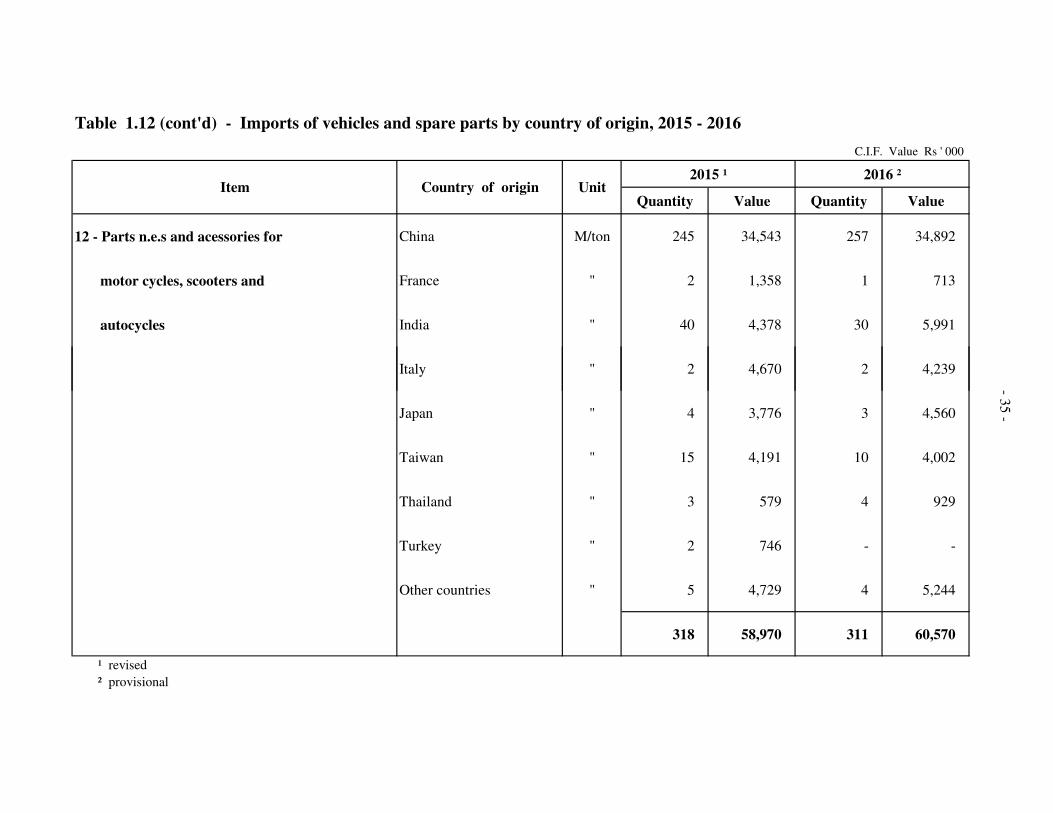
Table 1.12 (cont'd) - Imports of vehicles and spare parts by country of origin, 2015 - 2016
C.I.F. Value Rs ' 000
2015 ¹ 2016 ²
Quantity Value Quantity Value
12 - Parts n.e.s and acessories for China M/ton 245 34,543 257 34,892
motor cycles, scooters and France " 2 1,358 1 713
autocycles India " 40 4,378 30 5,991
Italy " 2 4,670 2 4,239
Item Country of origin Unit
Japan " 4 3,776 3 4,560
Taiwan " 15 4,191 10 4,002
Thailand " 3 579 4 929
Turkey " 2 746 - -
Other countries " 5 4,729 4 5,244
318 58,970 311 60,570
¹ revised
² provisional
-35 -
PART PART PART PART IIIIIIII
ROADOADOADOAD
ACCIDENTSCCIDENTSCCIDENTSCCIDENTS
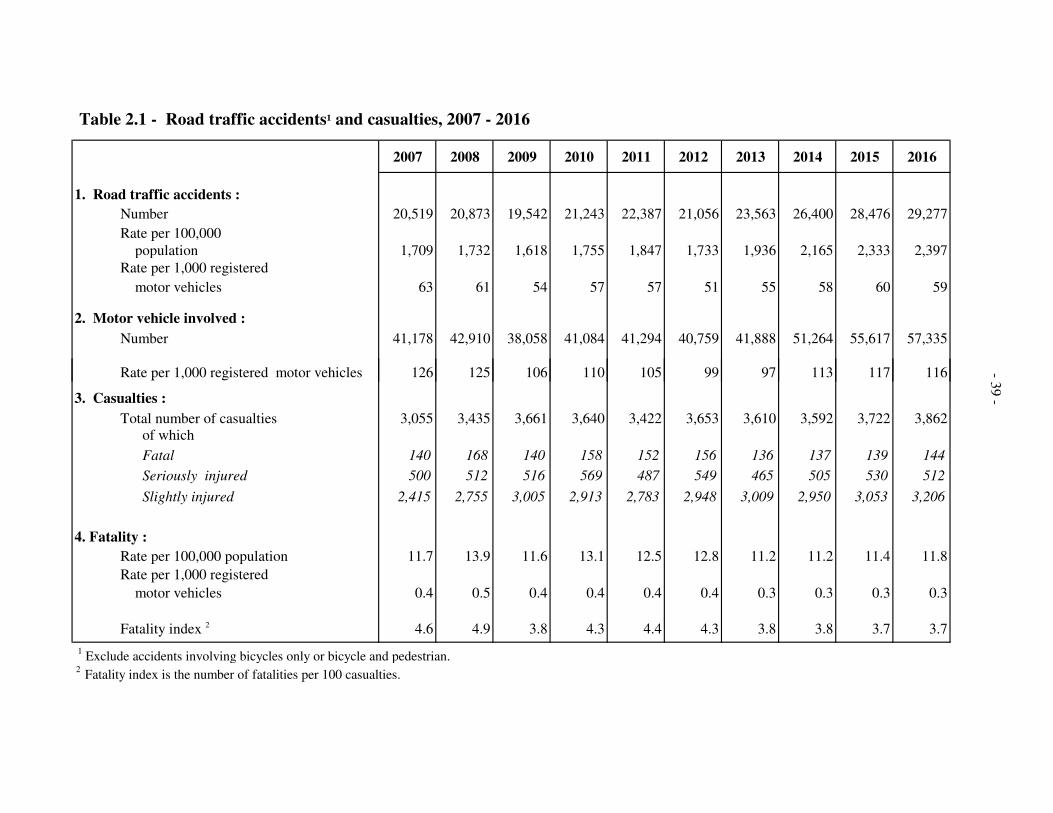
Table 2.1 - Road traffic accidents¹ and casualties, 2007 - 2016
2007 2008 2009 2010 2011 2012 2013 2014 2015 2016
1. Road traffic accidents :
Number 20,519 20,873 19,542 21,243 22,387 21,056 23,563 26,400 28,476 29,277
Rate per 100,000
population 1,709 1,732 1,618 1,755 1,847 1,733 1,936 2,165 2,333 2,397
Rate per 1,000 registered
motor vehicles 63 61 54 57 57 51 55 58 60 59
2. Motor vehicle involved :
Number 41,178 42,910 38,058 41,084 41,294 40,759 41,888 51,264 55,617 57,335
Rate per 1,000 registered motor vehicles 126 125 106 110 105 99 97 113 117 116 -Rate per 1,000 registered motor vehicles 126 125 106 110 105 99 97 113 117 116
3. Casualties :
Total number of casualties 3,055 3,435 3,661 3,640 3,422 3,653 3,610 3,592 3,722 3,862 of which
Fatal 140 168 140 158 152 156 136 137 139 144
Seriously injured 500 512 516 569 487 549 465 505 530 512
Slightly injured 2,415 2,755 3,005 2,913 2,783 2,948 3,009 2,950 3,053 3,206
4. Fatality :
Rate per 100,000 population 11.7 13.9 11.6 13.1 12.5 12.8 11.2 11.2 11.4 11.8
Rate per 1,000 registered
motor vehicles 0.4 0.5 0.4 0.4 0.4 0.4 0.3 0.3 0.3 0.3
Fatality index 2 4.6 4.9 3.8 4.3 4.4 4.3 3.8 3.8 3.7 3.7
1 Exclude accidents involving bicycles only or bicycle and pedestrian.
2 Fatality index is the number of fatalities per 100 casualties.
39 -
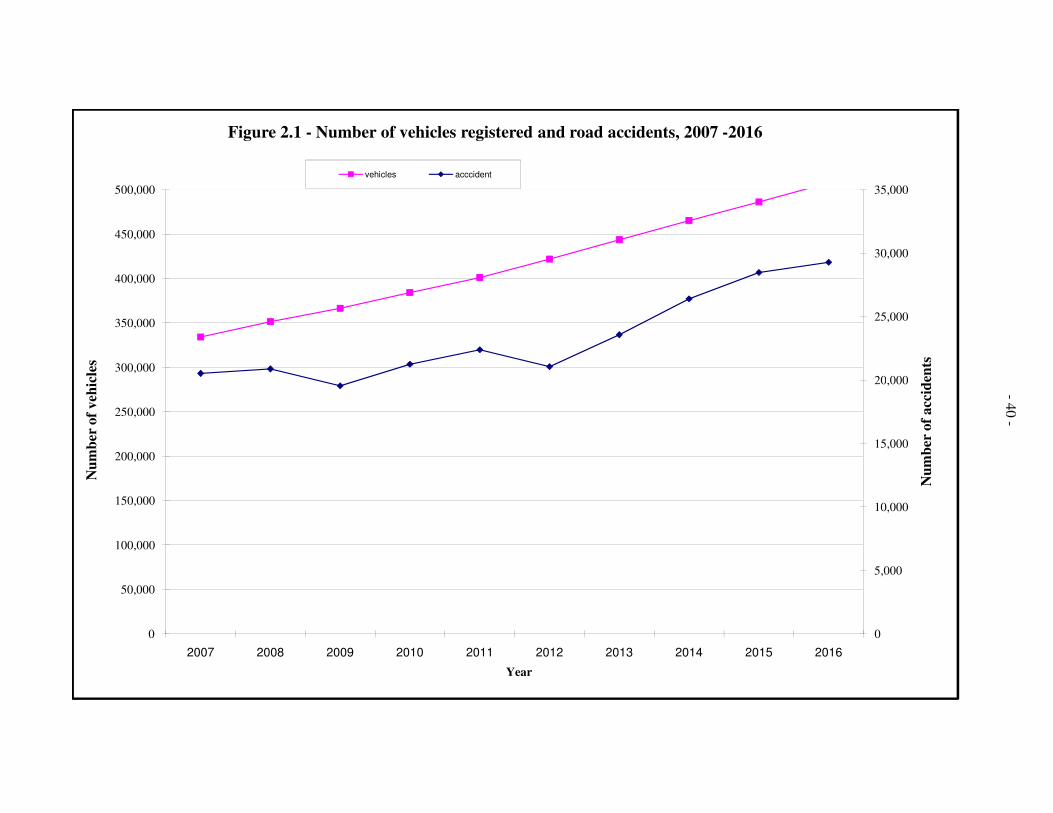
vehicles acccident
2007 334,154 20,519
2008 351,406 20,873
2009 366,520 19,542
2010 384,115 21,243
2011 400,919 22,387
2012 421,926 21,056
2013 443,495 23,563
2014 465,052 26,400
2015 486,144 28,476
2016 507,676 29,277
20,000
25,000
30,000
35,000
300,000
350,000
400,000
450,000
500,000
Nu
mb
er o
f acc
iden
ts
Nu
mb
er o
f veh
icle
s
Figure 2.1 - Number of vehicles registered and road accidents, 2007 -2016
vehicles acccident
-40 -
0
5,000
10,000
15,000
20,000
0
50,000
100,000
150,000
200,000
250,000
2007 2008 2009 2010 2011 2012 2013 2014 2015 2016
Nu
mb
er o
f acc
iden
ts
Nu
mb
er o
f veh
icle
s
Year
- 41 -
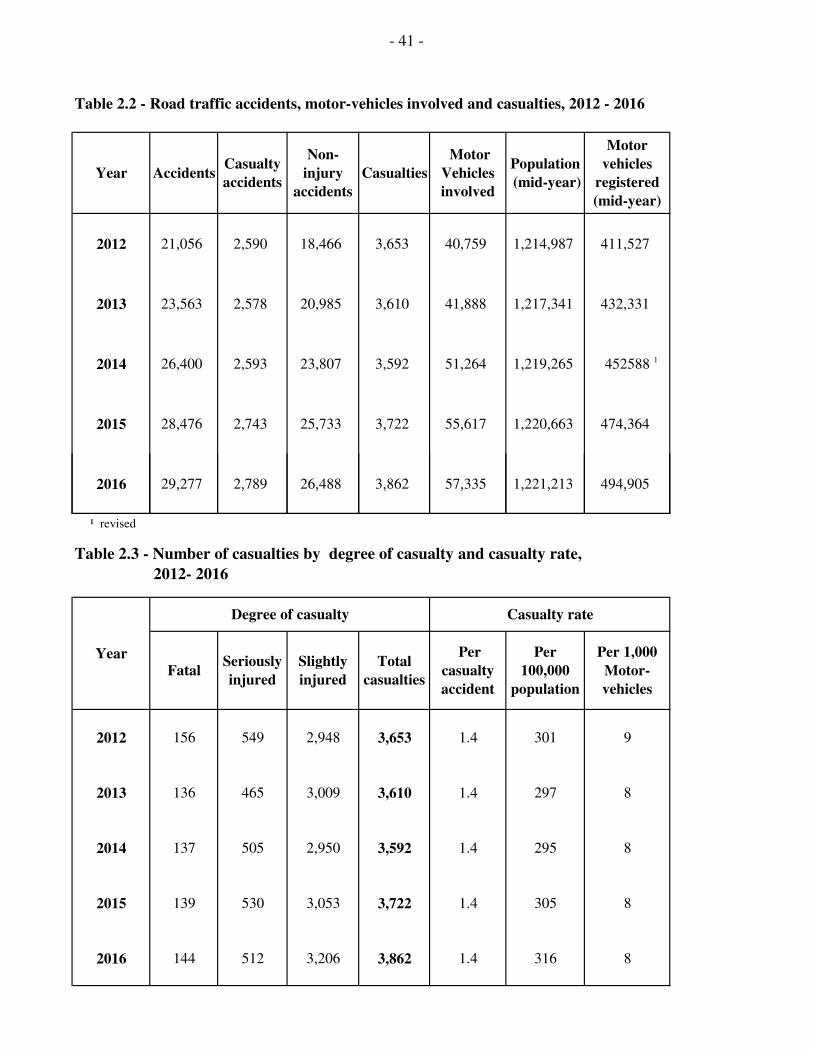
Table 2.2 - Road traffic accidents, motor-vehicles involved and casualties, 2012 - 2016
2012 21,056 2,590 18,466 3,653 40,759 1,214,987 411,527
2013 23,563 2,578 20,985 3,610 41,888 1,217,341 432,331
2014 26,400 2,593 23,807 3,592 51,264 1,219,265 452588 1
2015 28,476 2,743 25,733 3,722 55,617 1,220,663 474,364
2016 29,277 2,789 26,488 3,862 57,335 1,221,213 494,905
Year Casualties
Motor
vehicles
registered
(mid-year)
Population
(mid-year)
Casualty
accidents
Non-
injury
accidents
Motor
Vehicles
involved
Accidents
2016 29,277 2,789 26,488 3,862 57,335 1,221,213 494,905
¹ revised
Table 2.3 - Number of casualties by degree of casualty and casualty rate,
2012- 2016
2012 156 549 2,948 3,653 1.4 301 9
2013 136 465 3,009 3,610 1.4 297 8
2014 137 505 2,950 3,592 1.4 295 8
2015 139 530 3,053 3,722 1.4 305 8
2016 144 512 3,206 3,862 1.4 316 8
Per
100,000
population
Casualty rate
Year
FatalSeriously
injured
Slightly
injured
Total
casualties
Per
casualty
accident
Per 1,000
Motor-
vehicles
Degree of casualty
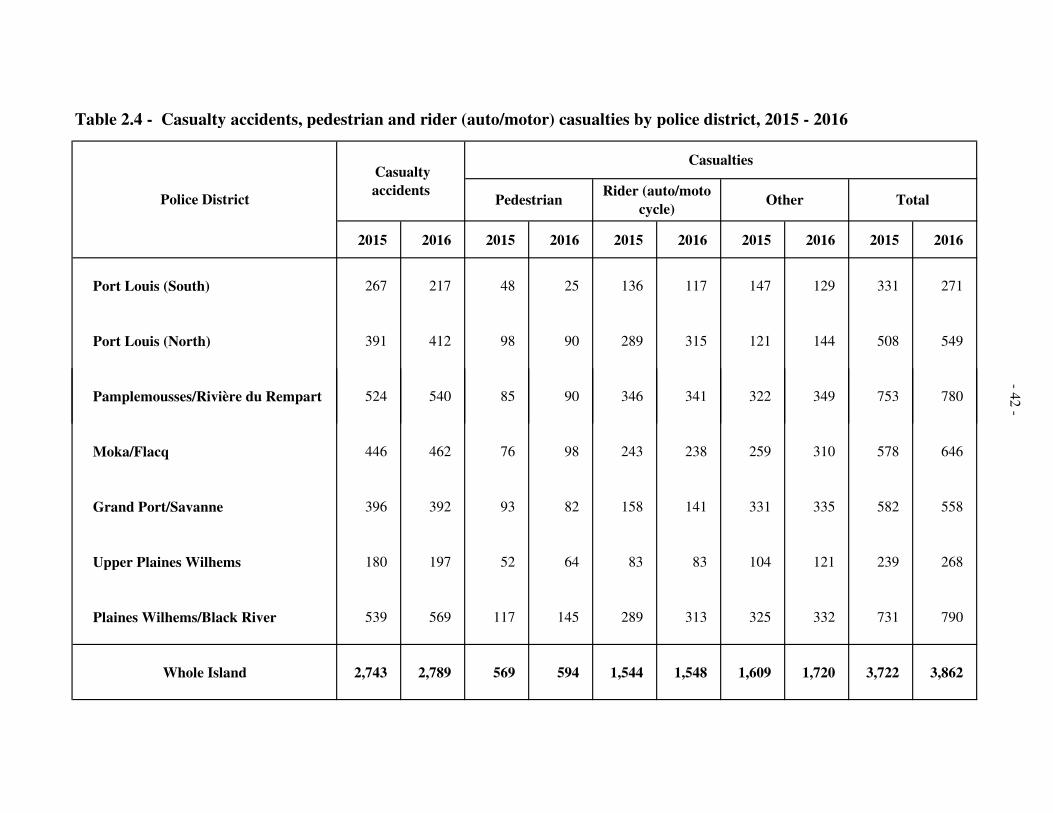
Table 2.4 - Casualty accidents, pedestrian and rider (auto/motor) casualties by police district, 2015 - 2016
2015 2016 2015 2016 2015 2016 2015 2016 2015 2016
Port Louis (South) 267 217 48 25 136 117 147 129 331 271
Port Louis (North) 391 412 98 90 289 315 121 144 508 549
Police District
Casualties
PedestrianRider (auto/moto
cycle)Other Total
Casualty
accidents
Pamplemousses/Rivière du Rempart 524 540 85 90 346 341 322 349 753 780
Moka/Flacq 446 462 76 98 243 238 259 310 578 646
Grand Port/Savanne 396 392 93 82 158 141 331 335 582 558
Upper Plaines Wilhems 180 197 52 64 83 83 104 121 239 268
Plaines Wilhems/Black River 539 569 117 145 289 313 325 332 731 790
Whole Island 2,743 2,789 569 594 1,544 1,548 1,609 1,720 3,722 3,862
-42 -
-42 -
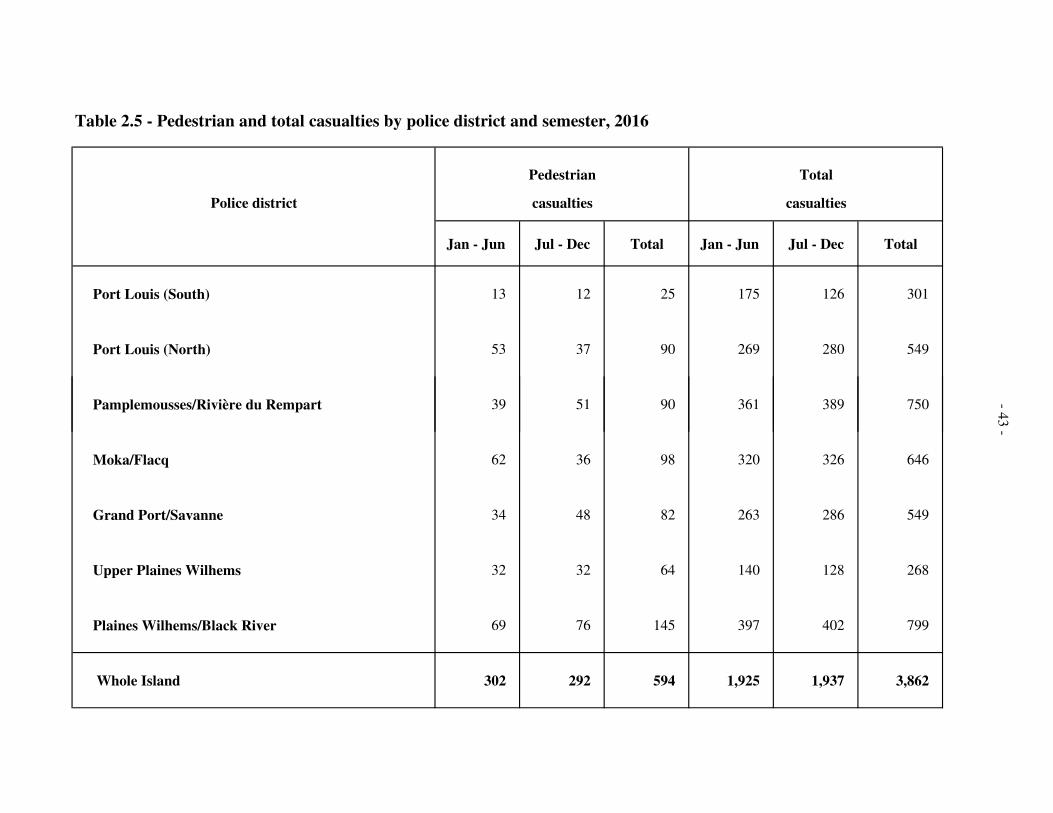
Table 2.5 - Pedestrian and total casualties by police district and semester, 2016
Pedestrian Total
Police district casualties casualties
Jan - Jun Jul - Dec Total Jan - Jun Jul - Dec Total
Port Louis (South) 13 12 25 175 126 301
Port Louis (North) 53 37 90 269 280 549
Pamplemousses/Rivière du Rempart 39 51 90 361 389 750
Moka/Flacq 62 36 98 320 326 646
Grand Port/Savanne 34 48 82 263 286 549
Upper Plaines Wilhems 32 32 64 140 128 268
Plaines Wilhems/Black River 69 76 145 397 402 799
Whole Island 302 292 594 1,925 1,937 3,862
-43 -
Table 2.6 - Distribution of casualty accidents by day of week and time, 2016
Day
Monday Tuesday Wednesday Thursday Friday Saturday Sunday Total
Time (Hour)
0 - 1 6 2 9 4 5 4 17 47
1 - 2 4 1 7 1 4 5 8 30
2 - 3 3 2 - 2 5 4 5 21
3 - 4 2 2 4 1 - 3 7 19
4 - 5 - 1 - - - 3 5 9
5 - 6 4 5 6 5 4 7 11 42
6 - 7 8 18 18 15 15 16 11 101
7 - 8 31 28 30 27 22 18 13 169
8 - 9 12 26 26 27 21 17 12 141 8 - 9 12 26 26 27 21 17 12 141
9 - 10 11 21 21 22 22 14 16 127
10 - 11 23 19 15 11 28 14 12 122
11 - 12 17 17 20 20 16 25 22 137
12 - 13 20 19 16 28 22 26 17 148
13 - 14 23 22 20 21 13 21 21 141
14 - 15 34 26 30 24 29 25 19 187
15 - 16 28 19 27 21 28 31 12 166
16 - 17 32 30 26 27 31 33 24 203
17 - 18 40 22 30 35 20 31 29 207
18 - 19 26 27 19 33 24 31 32 192
19 - 20 25 23 18 22 23 28 37 176
20 - 21 19 18 16 15 19 15 20 122
21 - 22 13 14 7 11 16 25 28 114
22 - 23 8 8 10 9 21 23 12 91
23 - 24 10 5 8 1 19 22 12 77
Total 399 375 383 382 407 441 402 2,789
-44 -
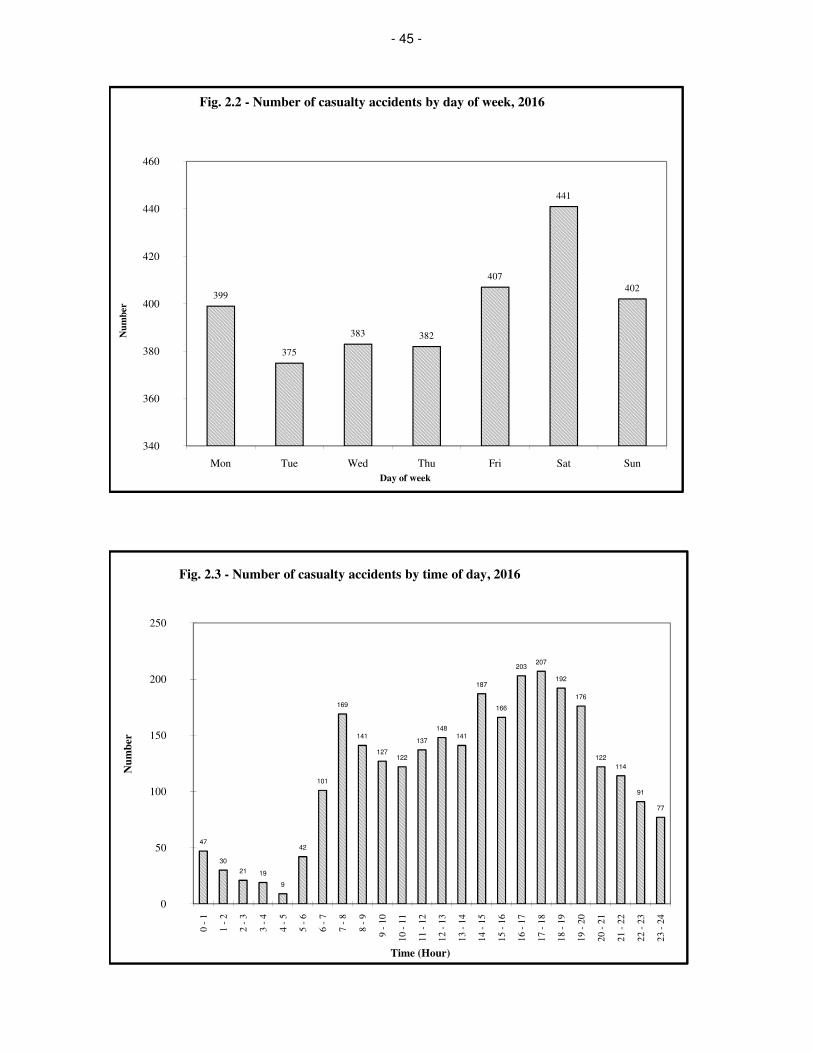
- 45 -
399
375
383 382
407
441
402
340
360
380
400
420
440
460
Mon Tue Wed Thu Fri Sat Sun
Nu
mb
er
Day of week
Fig. 2.2 - Number of casualty accidents by day of week, 2016
47
30
21 19
9
42
101
169
141
127122
137
148
141
187
166
203207
192
176
122
114
91
77
0
50
100
150
200
250
0 -
1
1 -
2
2 -
3
3 -
4
4 -
5
5 -
6
6 -
7
7 -
8
8 -
9
9 -
10
10
-1
1
11
-1
2
12
-1
3
13
-1
4
14
-1
5
15
-1
6
16
-1
7
17
-1
8
18
-1
9
19
-2
0
20
-2
1
21
-2
2
22
-2
3
23
-2
4
Nu
mb
er
Time (Hour)
Fig. 2.3 - Number of casualty accidents by time of day, 2016
- 46 -
Table 2.7 - Number of accidents by severity of accident, 2012 - 2016
Year
Slight No injury
2012 1,991 18,466
2013 2,070 20,985
2014 2,043 23,807
2015 2,148 25,733
144
125
455
389
Serious
26,400
28,476 127
425
468
Severity of accident
Total
21,056
23,563
Fatal ¹
119
2016 2,234 26,488
Table 2.8 - Number of casualty accidents involved in "hit and run" cases by semester, 2015 - 2016
Year
Accident Jan. - Jun. Jul. - Dec. Total % Jan. - Jun. Jul. - Dec. Total %
56 30 86 43.2 32 27 59 40.7
Vehicles v/s vehicles 63 50 113 56.8 56 30 86 59.3
Total 119 80 199 100.0 88 57 145 100.0
Vehicles v/s pedestrian
2015
132
2016
29,277 423
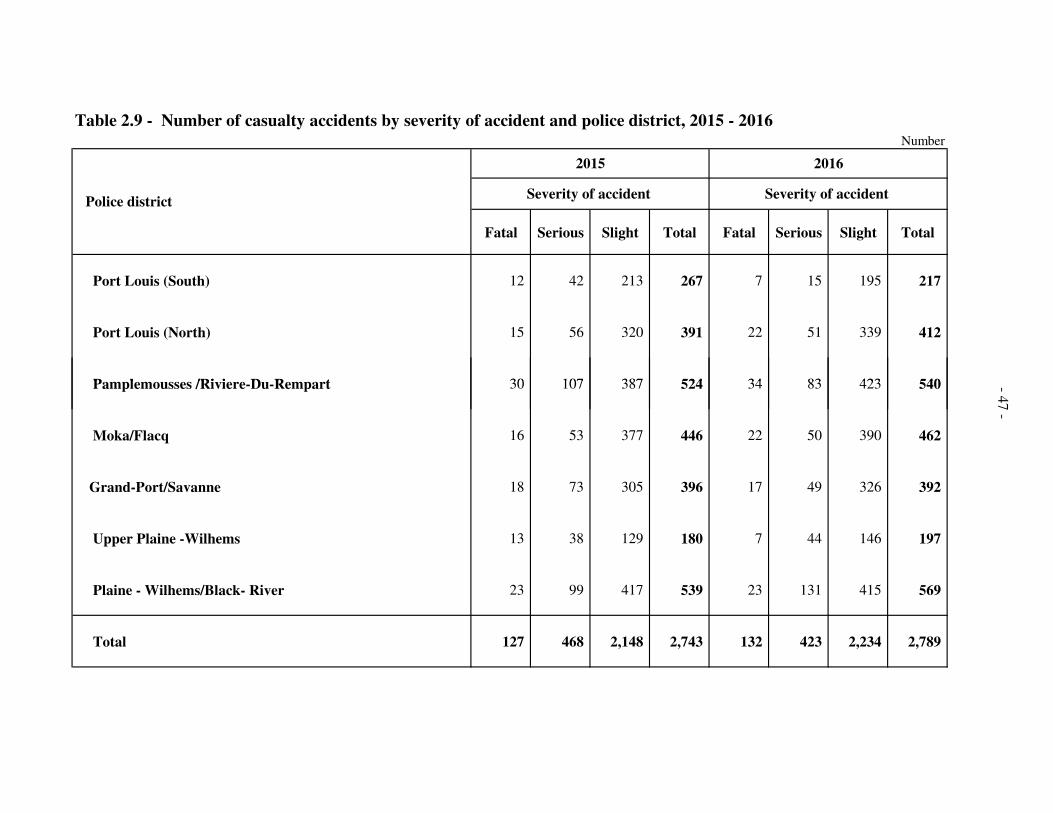
Table 2.9 - Number of casualty accidents by severity of accident and police district, 2015 - 2016Number
Fatal Serious Slight Total Fatal Serious Slight Total
Port Louis (South) 12 42 213 267 7 15 195 217
Port Louis (North) 15 56 320 391 22 51 339 412
Pamplemousses /Riviere-Du-Rempart 30 107 387 524 34 83 423 540
2015 2016
Severity of accident Severity of accident Police district
Pamplemousses /Riviere-Du-Rempart 30 107 387 524 34 83 423 540
Moka/Flacq 16 53 377 446 22 50 390 462
Grand-Port/Savanne 18 73 305 396 17 49 326 392
Upper Plaine -Wilhems 13 38 129 180 7 44 146 197
Plaine - Wilhems/Black- River 23 99 417 539 23 131 415 569
Total 127 468 2,148 2,743 132 423 2,234 2,789
-47 -
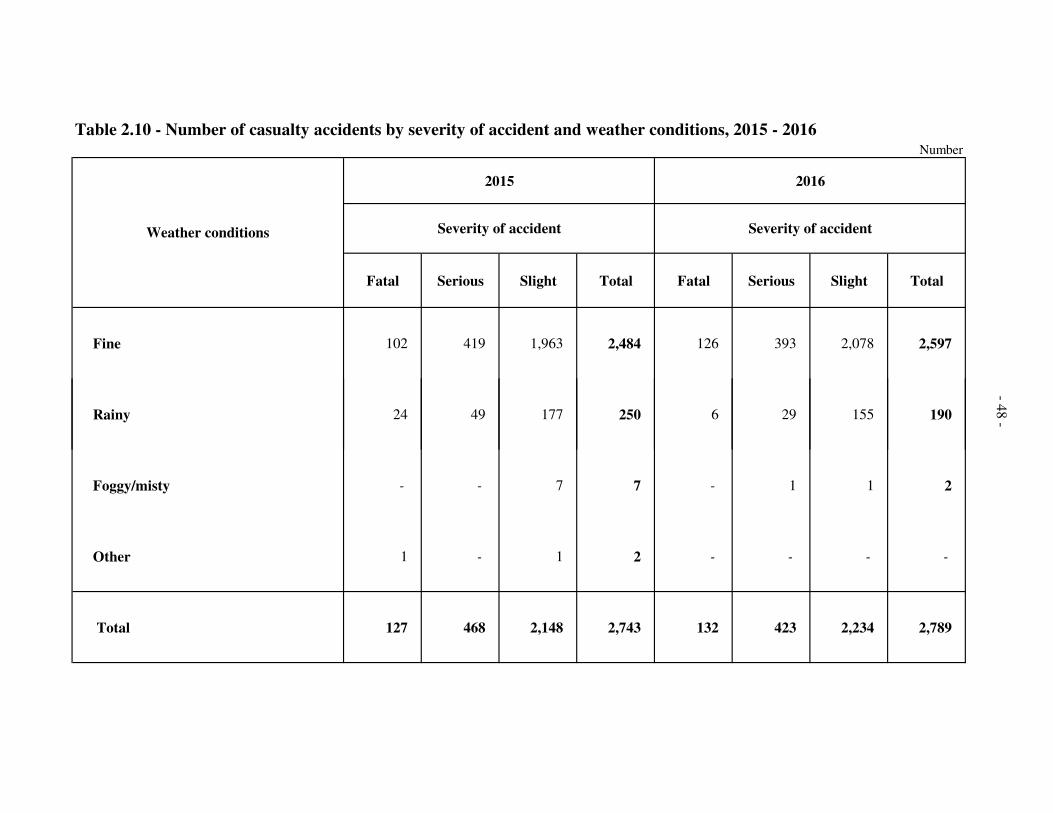
Table 2.10 - Number of casualty accidents by severity of accident and weather conditions, 2015 - 2016Number
2015 2016
Fatal Serious Slight Total Fatal Serious Slight Total
Fine 102 419 1,963 2,484 126 393 2,078 2,597
Severity of accident Severity of accidentWeather conditions
Rainy 24 49 177 250 6 29 155 190
Foggy/misty - - 7 7 - 1 1 2
Other 1 - 1 2 - - - -
Total 127 468 2,148 2,743 132 423 2,234 2,789
-48 -
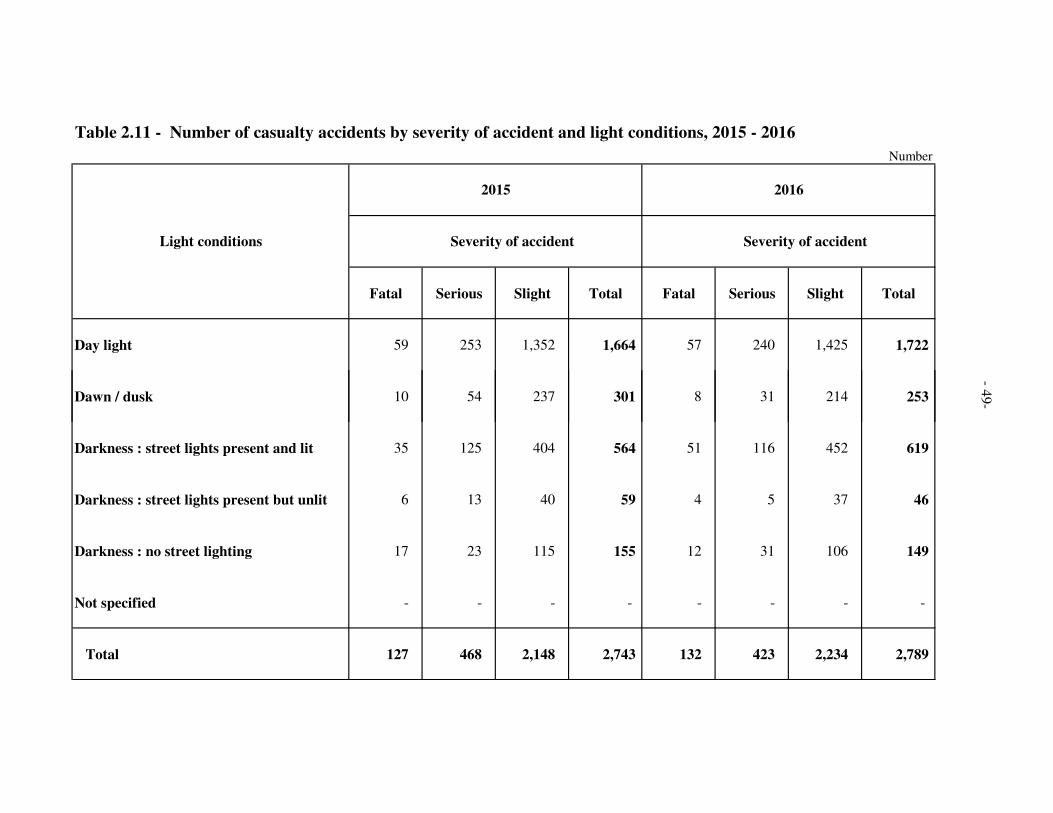
Table 2.11 - Number of casualty accidents by severity of accident and light conditions, 2015 - 2016
Number
Fatal Serious Slight Total Fatal Serious Slight Total
Day light 59 253 1,352 1,664 57 240 1,425 1,722
Light conditions
2015 2016
Severity of accident Severity of accident
Dawn / dusk 10 54 237 301 8 31 214 253
Darkness : street lights present and lit 35 125 404 564 51 116 452 619
Darkness : street lights present but unlit 6 13 40 59 4 5 37 46
Darkness : no street lighting 17 23 115 155 12 31 106 149
Not specified - - - - - - - -
Total 127 468 2,148 2,743 132 423 2,234 2,789
-49-
Table 2.12 - Number of casualty accidents by type of road, severity of accident and collision type, 2016Number
Type of road
One Way
Street
Two Way
Street
Dual
Carriage
way
One Way
Street
Two Way
Street
Dual
Carriage
way
One Way
Street
Two Way
Street
Dual
Carriage
way
Head On 1 52 5 5 132 3 63 538 38 837
Rear End - 4 - 1 33 2 31 162 18 251
Right Angle - - 1 5 30 3 12 139 1 191
Collision typeTotal
Fatal Serious Slight
Right Angle - - 1 5 30 3 12 139 1 191
Side Swipe 2 - 1 1 23 5 25 132 18 207
Ran Off Road - 4 1 - 15 2 6 101 14 143
Hit Object in Road - 1 1 1 6 1 1 22 5 38
Hit Object off Road - 9 - 1 26 - 3 112 9 160
Hit Parked Vehicle - 1 - 1 2 1 1 23 1 30
Hit Pedestrian 2 36 2 7 69 5 37 373 12 543
Hit Animal - - - - 5 1 3 60 4 73
Other - 8 1 3 30 4 23 218 29 316
Total 5 115 12 25 371 27 205 1,880 149 2,789
-50 -
-50 -
-50 -
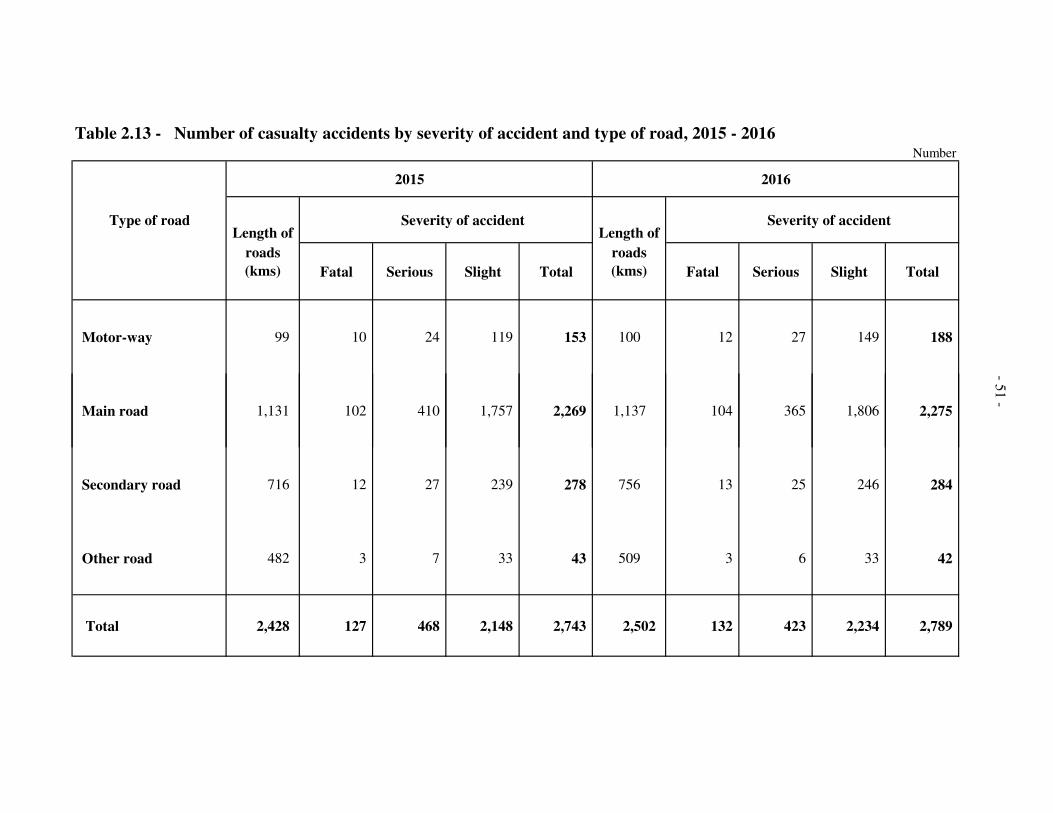
Table 2.13 - Number of casualty accidents by severity of accident and type of road, 2015 - 2016Number
2015 2016
Type of roadLength of
Severity of accident Length of
Severity of accident
roads
(kms) Fatal Serious Slight Total
roads
(kms) Fatal Serious Slight Total
Motor-way 99 10 24 119 153 100 12 27 149 188
-
Main road 1,131 102 410 1,757 2,269 1,137 104 365 1,806 2,275
Secondary road 716 12 27 239 278 756 13 25 246 284
Other road 482 3 7 33 43 509 3 6 33 42
Total 2,428 127 468 2,148 2,743 2,502 132 423 2,234 2,789
51 -
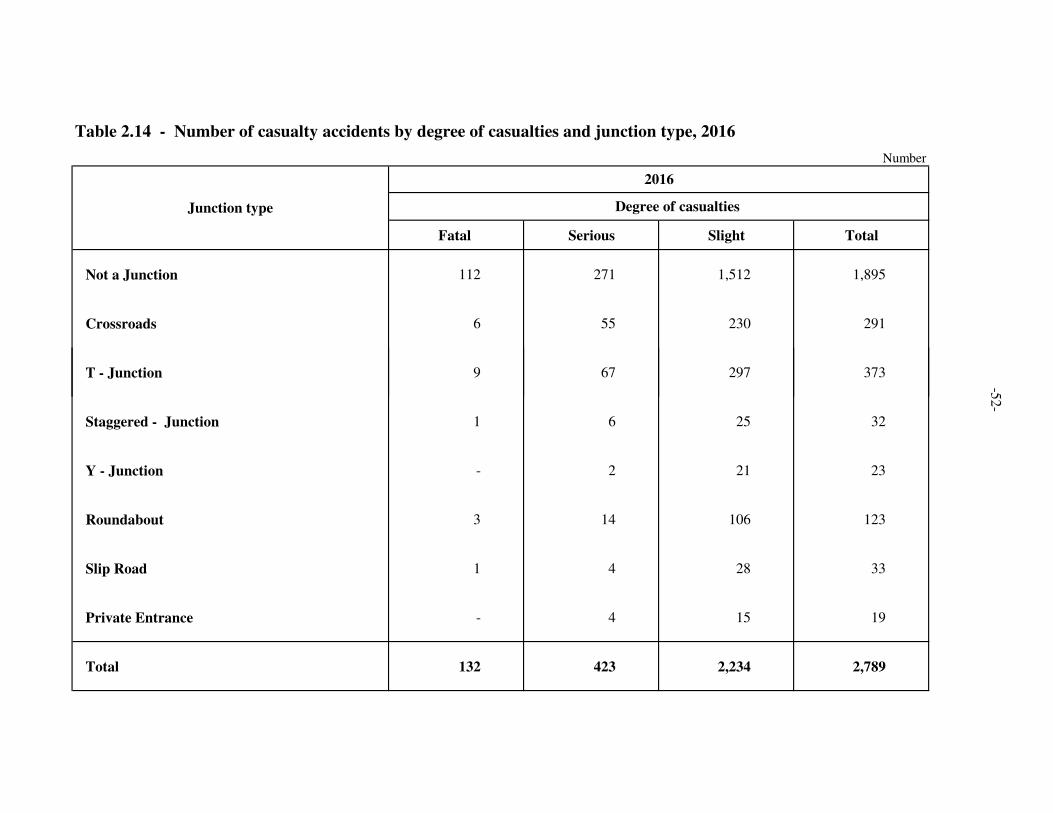
Table 2.14 - Number of casualty accidents by degree of casualties and junction type, 2016
Number
Fatal Serious Slight Total
Not a Junction 112 271 1,512 1,895
Crossroads 6 55 230 291
T - Junction 9 67 297 373
Junction type
2016
Degree of casualties
T - Junction 9 67 297 373
Staggered - Junction 1 6 25 32
Y - Junction - 2 21 23
Roundabout 3 14 106 123
Slip Road 1 4 28 33
Private Entrance - 4 15 19
Total 132 423 2,234 2,789
-52-
- 53 -
Table 2.15 - Number of vehicles¹ involved in casualty accidents by type, 2015 - 2016
Private car 1,409 32.6 1,578 34.9
Taxi car 58 1.3 56 1.2
Bus 283 6.6 301 6.7
Lorry 83 1.9 91 2.0
Van 248 5.8 250 5.5
Motor/Auto cycle 1,677 38.8 1,708 37.8
Pedal cycle 170 3.9 161 3.6
Other motor vehicle 394 9.1 375 8.3
Other non-motor vehicle - - - -
All vehicles 4,322 100.0 4,520 100.0
Type of vehicle% %
Number of
vehicles
Number of
vehicles
2015 2016
All vehicles 4,322 100.0 4,520 100.0
¹ only three main vehicles have been considered in accidents involving more than three vehicles.
Private car 1,578
Taxi car 56
Bus 301
Lorry 91
Van 250
Motor/Auto cycle 1,708
Other 536
Private car
34.9%
Taxi car
1.2%
Bus
6.7%
Lorry
2.0%
Van
5.5%
Motor/Auto cycle
37.8%
Other
11.9%
Fig. 2.4 - Vehicles involved in casualty accidents by type of vehicle, 2016
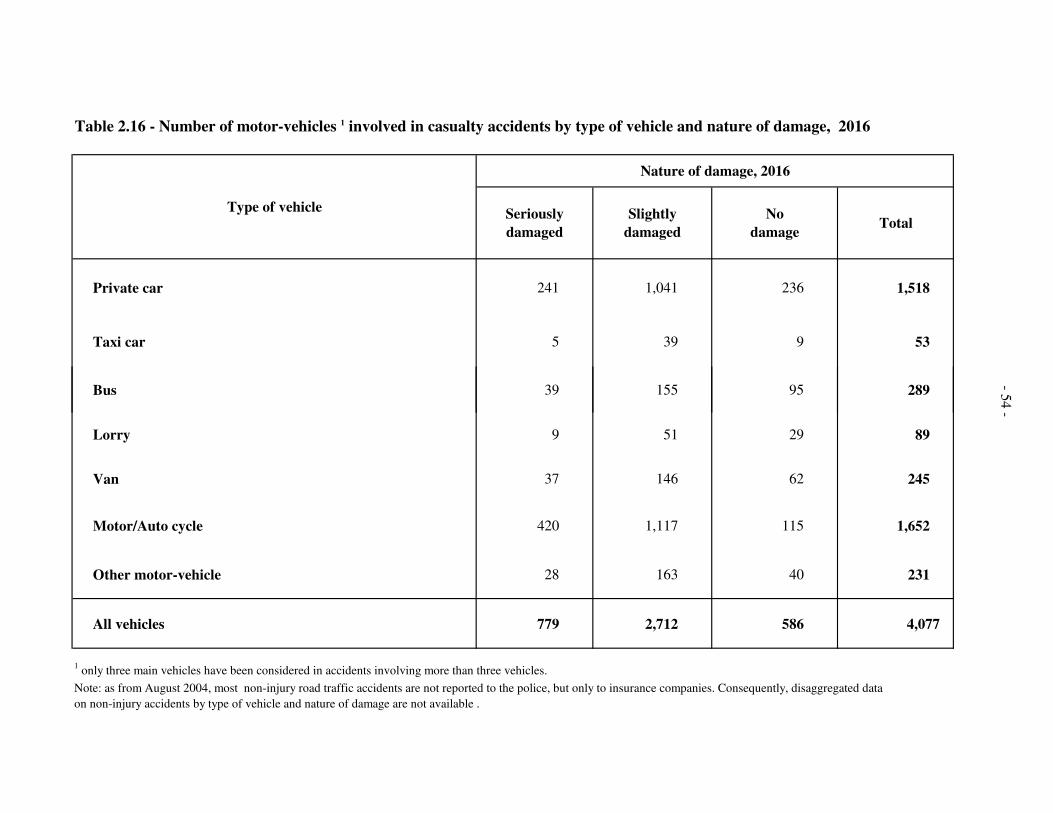
Table 2.16 - Number of motor-vehicles 1 involved in casualty accidents by type of vehicle and nature of damage, 2016
Private car 241 1,041 236 1,518
Taxi car 5 39 9 53
TotalType of vehicle
Nature of damage, 2016
Seriously
damaged
Slightly
damaged
No
damage
Bus 39 155 95 289
Lorry 9 51 29 89
Van 37 146 62 245
Motor/Auto cycle 420 1,117 115 1,652
Other motor-vehicle 28 163 40 231
All vehicles 779 2,712 586 4,077
1 only three main vehicles have been considered in accidents involving more than three vehicles.
Note: as from August 2004, most non-injury road traffic accidents are not reported to the police, but only to insurance companies. Consequently, disaggregated data
on non-injury accidents by type of vehicle and nature of damage are not available .
-54 -
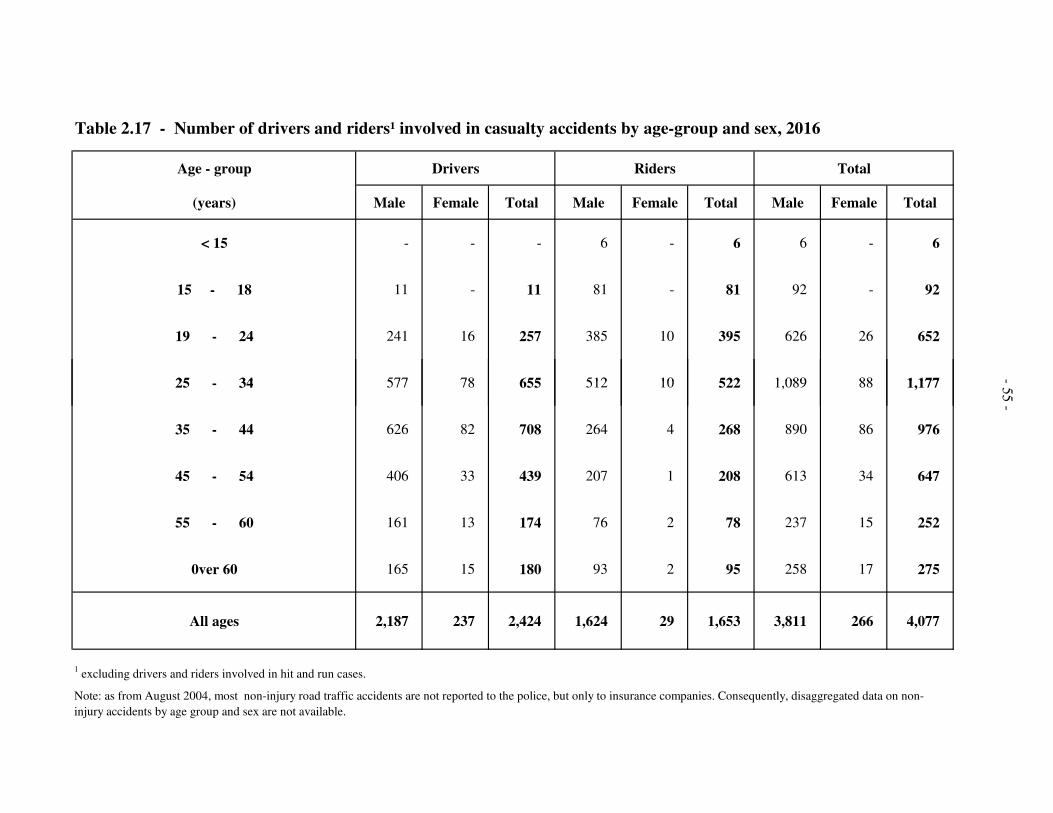
Age - group Drivers Riders Total
(years) Male Female Total Male Female Total Male Female Total
< 15 - - - 6 - 6 6 - 6
15 - 18 11 - 11 81 - 81 92 - 92
19 - 24 241 16 257 385 10 395 626 26 652
25 - 34 577 78 655 512 10 522 1,089 88 1,177
Table 2.17 - Number of drivers and riders¹ involved in casualty accidents by age-group and sex, 2016
-
25 - 34 577 78 655 512 10 522 1,089 88 1,177
35 - 44 626 82 708 264 4 268 890 86 976
45 - 54 406 33 439 207 1 208 613 34 647
55 - 60 161 13 174 76 2 78 237 15 252
0ver 60 165 15 180 93 2 95 258 17 275
All ages 2,187 237 2,424 1,624 29 1,653 3,811 266 4,077
1 excluding drivers and riders involved in hit and run cases.
Note: as from August 2004, most non-injury road traffic accidents are not reported to the police, but only to insurance companies. Consequently, disaggregated data on non-
injury accidents by age group and sex are not available.
-55 -
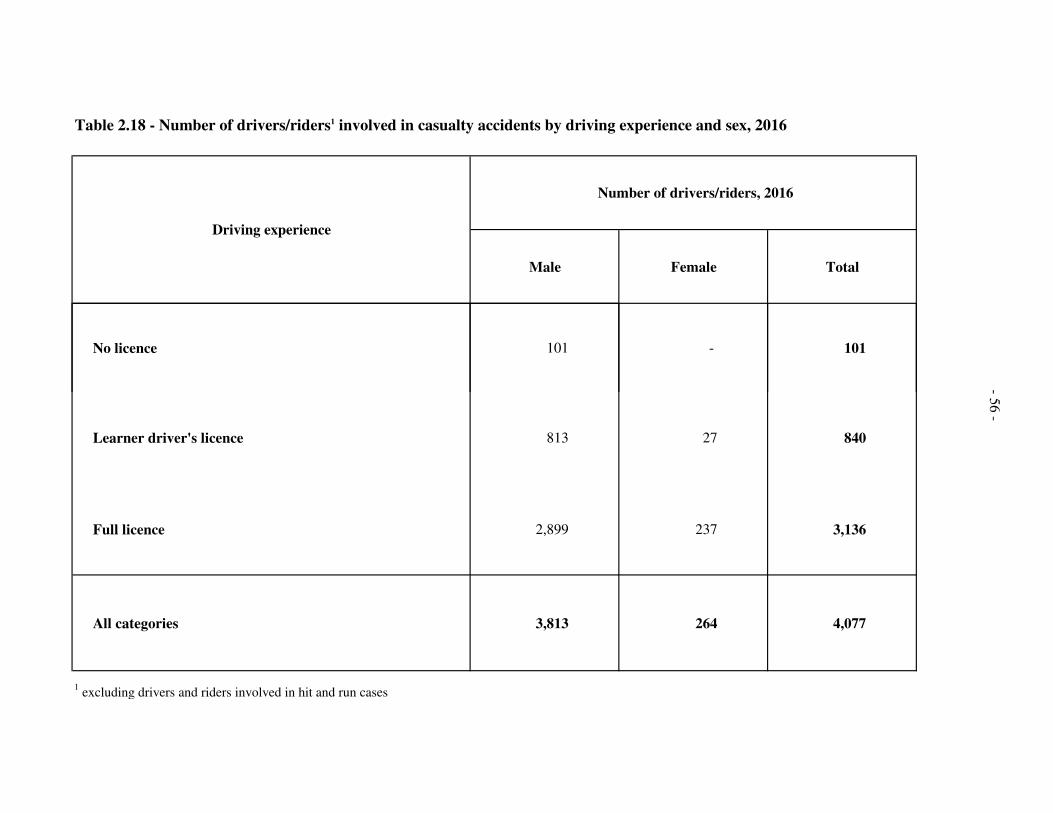
Table 2.18 - Number of drivers/riders1 involved in casualty accidents by driving experience and sex, 2016
Male Female Total
No licence 101 - 101
Driving experience
Number of drivers/riders, 2016
Learner driver's licence 813 27 840
Full licence 2,899 237 3,136
All categories 3,813 264 4,077
1 excluding drivers and riders involved in hit and run cases
-56 -
- 57 -
Table 2.19 - Number of casualties by class of road users, 2015- 2016
Class of2015 2016
Road users Number % Number %
Pedestrian 569 15.3 594 15.4
Passenger 837 22.5 915 23.7
Driver 608 16.3 651 16.9
Rider (auto/motor cycle) 1,544 41.5 1,548 40.0
Pedal cyclist 164 4.4 154 4.0
All road users 3,722 100.0 3,862 100.0
1 Revised
1 Revised
Pedestrian
15.4%
Passenger
23.7%
Driver
16.9%
Rider
(Auto/M cycle)
40.0%
Pedal cyclist
4.0%
Fig. 2.5 - Casualties by class of road users, 2016
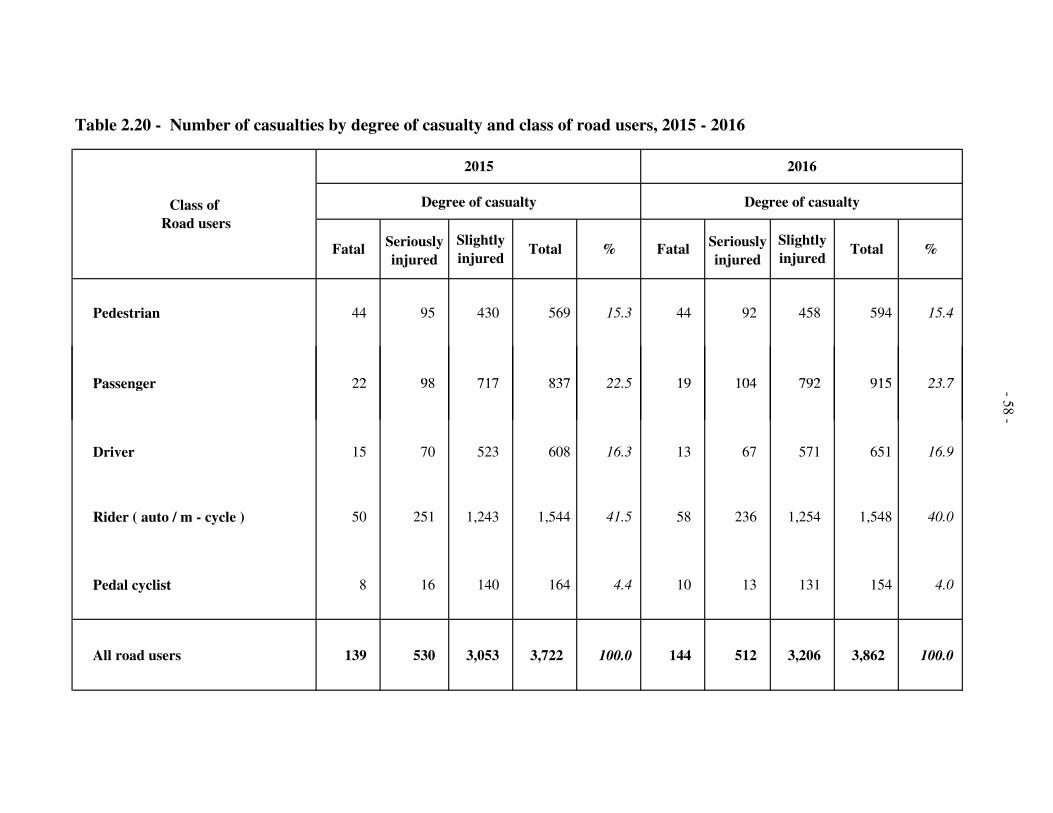
Table 2.20 - Number of casualties by degree of casualty and class of road users, 2015 - 2016
Degree of casualty Degree of casualty
Pedestrian 44 95 430 569 15.3 44 92 458 594 15.4
Passenger 22 98 717 837 22.5 19 104 792 915 23.7
FatalSeriously
injured
Slightly
injuredTotal %
2015 2016
Class of
Road users
FatalSeriously
injured
Slightly
injuredTotal %
Passenger 22 98 717 837 22.5 19 104 792 915 23.7
Driver 15 70 523 608 16.3 13 67 571 651 16.9
Rider ( auto / m - cycle ) 50 251 1,243 1,544 41.5 58 236 1,254 1,548 40.0
Pedal cyclist 8 16 140 164 4.4 10 13 131 154 4.0
All road users 139 530 3,053 3,722 100.0 144 512 3,206 3,862 100.0
-58 -
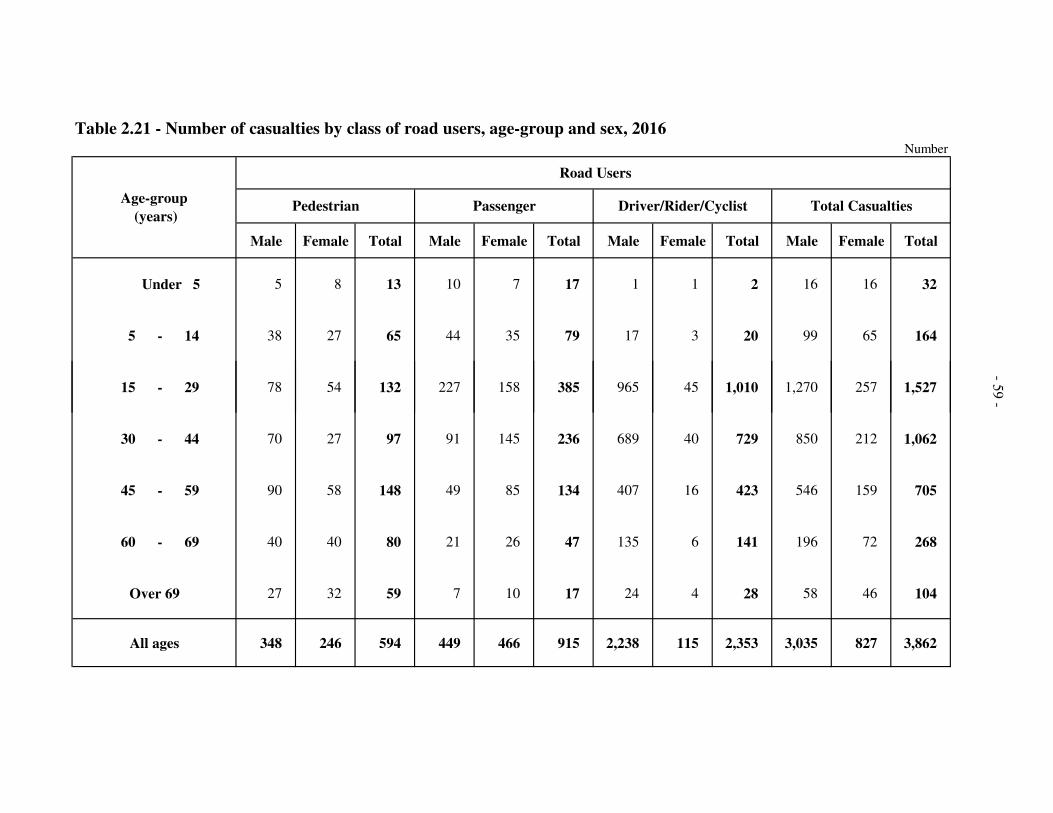
Table 2.21 - Number of casualties by class of road users, age-group and sex, 2016Number
Male Female Total Male Female Total Male Female Total Male Female Total
Under 5 5 8 13 10 7 17 1 1 2 16 16 32
5 - 14 38 27 65 44 35 79 17 3 20 99 65 164
15 - 29 78 54 132 227 158 385 965 45 1,010 1,270 257 1,527
Age-group
(years)
Road Users
Pedestrian Passenger Driver/Rider/Cyclist Total Casualties
-
15 - 29 78 54 132 227 158 385 965 45 1,010 1,270 257 1,527
30 - 44 70 27 97 91 145 236 689 40 729 850 212 1,062
45 - 59 90 58 148 49 85 134 407 16 423 546 159 705
60 - 69 40 40 80 21 26 47 135 6 141 196 72 268
Over 69 27 32 59 7 10 17 24 4 28 58 46 104
All ages 348 246 594 449 466 915 2,238 115 2,353 3,035 827 3,862
-59 -
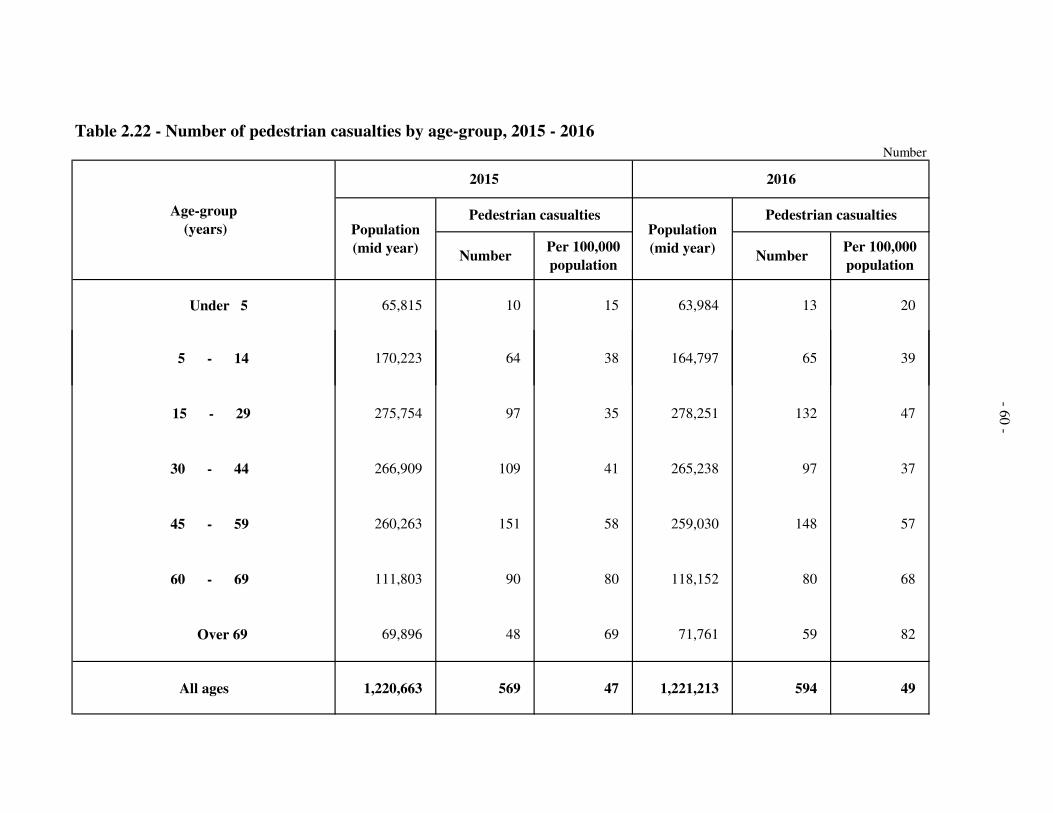
Table 2.22 - Number of pedestrian casualties by age-group, 2015 - 2016
Number
Under 5 65,815 10 15 63,984 13 20
5 - 14 170,223 64 38 164,797 65 39
Age-group
(years) Population
(mid year)Number
Per 100,000
population
Pedestrian casualties
2015
Population
(mid year)Number
Per 100,000
population
Pedestrian casualties
2016
15 - 29 275,754 97 35 278,251 132 47
30 - 44 266,909 109 41 265,238 97 37
45 - 59 260,263 151 58 259,030 148 57
60 - 69 111,803 90 80 118,152 80 68
Over 69 69,896 48 69 71,761 59 82
All ages 1,220,663 569 47 1,221,213 594 49
-60 -
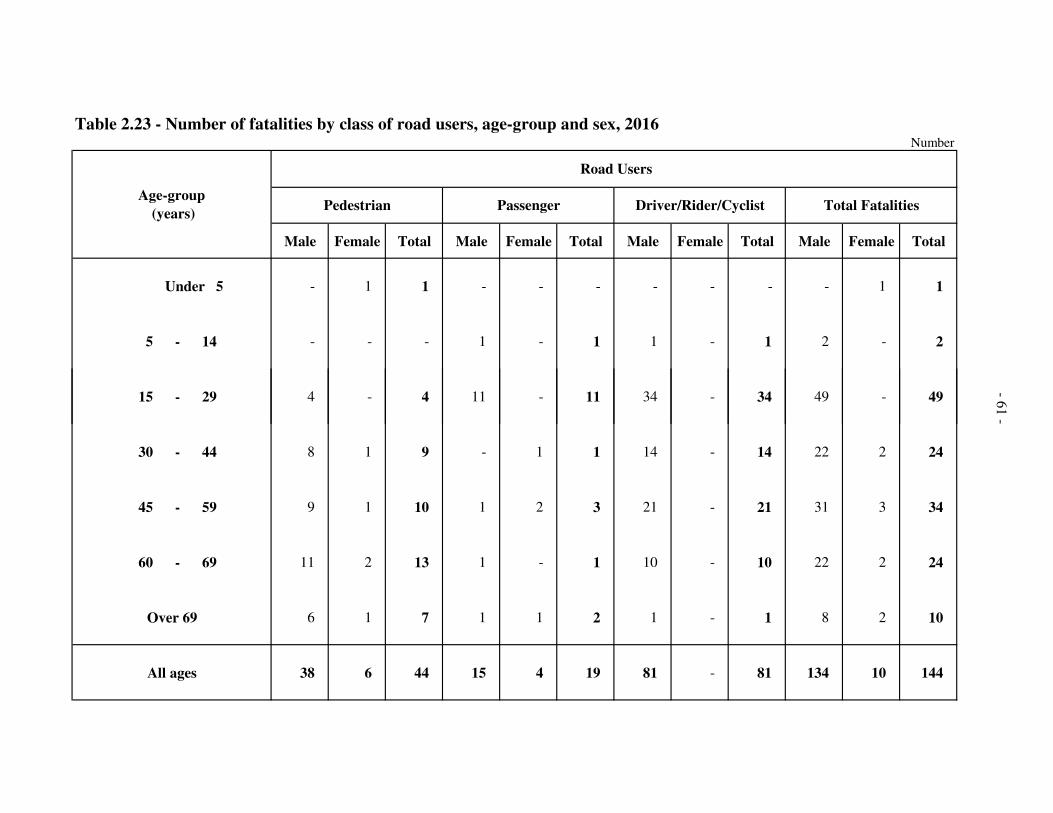
Table 2.23 - Number of fatalities by class of road users, age-group and sex, 2016Number
Male Female Total Male Female Total Male Female Total Male Female Total
Under 5 - 1 1 - - - - - - - 1 1
5 - 14 - - - 1 - 1 1 - 1 2 - 2
Age-group
(years)
Road Users
Pedestrian Passenger Driver/Rider/Cyclist Total Fatalities
15 - 29 4 - 4 11 - 11 34 - 34 49 - 49
30 - 44 8 1 9 - 1 1 14 - 14 22 2 24
45 - 59 9 1 10 1 2 3 21 - 21 31 3 34
60 - 69 11 2 13 1 - 1 10 - 10 22 2 24
Over 69 6 1 7 1 1 2 1 - 1 8 2 10
All ages 38 6 44 15 4 19 81 - 81 134 10 144
-61 -
- 62 -
Table 2.24 - Fatalities by category of road users, 2015 - 2016
Number % Number %
Drivers of four wheeled vehicles 15 10.8 13 9.0
Passengers of four wheeled vehicles 18 12.9 11 7.6
Riders / pillion riders of motorised two - wheelers 54 38.8 66 45.8
Cyclists 8 5.8 10 6.9
Pedestrians 44 31.7 44 30.6
All road users 139 100.0 144 100.0
2015 2016
Fatalities
Category of road users
15 18
54
8
44
13 11
66
10
44
0
10
20
30
40
50
60
70
Drivers of four
wheeled vehicles
Passengers of four
wheeled vehicles
Riders / pillion
riders of motorised
two - wheelers
Cyclists Pedestrians
Fig. 2.6 - Fatalities by category of road users, 2015 - 2016
2015 2016
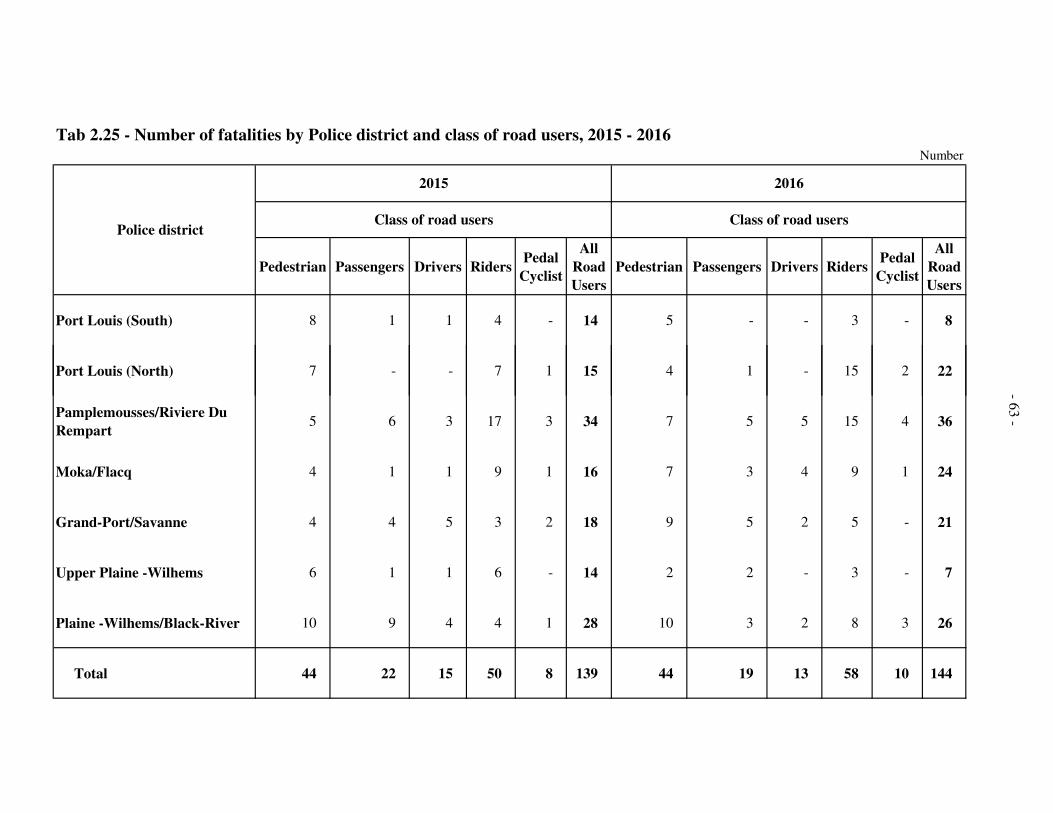
Tab 2.25 - Number of fatalities by Police district and class of road users, 2015 - 2016
Number
Pedestrian Passengers Drivers RidersPedal
Cyclist
All
Road
Users
Pedestrian Passengers Drivers RidersPedal
Cyclist
All
Road
Users
Port Louis (South) 8 1 1 4 - 14 5 - - 3 - 8
Port Louis (North) 7 - - 7 1 15 4 1 - 15 2 22
Police district
2015 2016
Class of road users Class of road users
Pamplemousses/Riviere Du
Rempart 5 6 3 17 3 34 7 5 5 15 4 36
Moka/Flacq 4 1 1 9 1 16 7 3 4 9 1 24
Grand-Port/Savanne 4 4 5 3 2 18 9 5 2 5 - 21
Upper Plaine -Wilhems 6 1 1 6 - 14 2 2 - 3 - 7
Plaine -Wilhems/Black-River 10 9 4 4 1 28 10 3 2 8 3 26
Total 44 22 15 50 8 139 44 19 13 58 10 144
-63 -
PARTPARTPARTPART IIIIIIIIIIII
PETROLEUMETROLEUMETROLEUMETROLEUM
PRODUCTSRODUCTSRODUCTSRODUCTS
- 67 -
Table 3.1 - Evolution of price and sales of gasolene and gas oil, 2013 - 2016
1-Mar-2013 52.25 43.95
12-Apr-2013 52.25 43.95
5-Jul-2013 52.25 43.95
8-Aug-2013 52.25 43.95
4-Oct-2013 52.25 43.95
31-Oct-2013 52.25 43.95
6-Dec-2013 52.25 43.95
13-Jan-2014 52.25 43.95
14-Feb-2014 52.25 43.95
2-May-2014 52.25 43.95
6-Jun-2014 52.25 43.95
4-Jul-2014 52.25 43.95
22-Aug-2014 50.15 41.90
10-Oct-2014 50.15 41.90
7-Nov-2014 50.15 41.90
21-Nov-2014 47.90 39.45
6-Dec-2014 45.95 37.80
17-Jan-2015 45.95 37.80
25-Apr-2015 45.95 37.80
6-Jun-2015 45.95 37.80
13-Aug-2015 45.95 37.80
5-Sep-2015 45.95 35.50
14-Nov-2015 41.35 32.75
4-Feb-2016 38.85 29.50
3-Jun-2016 38.85 29.50
6-Aug-2016 38.85 29.50
3-Sep-2016 38.85 29.50
5-Nov-2016 38.85 29.50
2-Dec-2016 38.85 29.50
2016 229,794 223,376
2014 191,245 220,783
2015 205,758 222,430
2013 179,834
Year
Gasolene Gas oil
Price
(Rs/Litre)
Sales
(000 Litre)
Price
(Rs/Litre)
Sales
(000 Litre)
219,731

Table 3.2 - Imports of motor spirit and gas oil by country of origin , 2015 - 2016
2015 2016 1
Quantity
( '000 Litres)
Value
(C.I.F, Rs '000)
Quantity
( '000 Litres)
Value
(C.I.F, Rs '000)
Motor spirit (Gasolene) France - - 15 256
India 211,331 3,388,246 231,259 3,066,404
211,331 3,388,246 231,274 3,066,660
Gas oil Bahrain 7,034 151,350 32,174 523,757
Item Country of origin
Gas oil Bahrain 7,034 151,350 32,174 523,757
China - - 3,728 51,695
India 367,313 5,707,529 328,331 4,135,579
Saudi Arabia - - 27,479 404,251
Singapore 6,431 144,810 2,203 29,850
South Africa Rep. 3,031 67,435 7,421 100,575
United Arab Emirates - - 7,261 103,362
Other countries 1 27 3 80
383,810 6,071,151 408,600 5,349,149
1 Provisional
-68 -
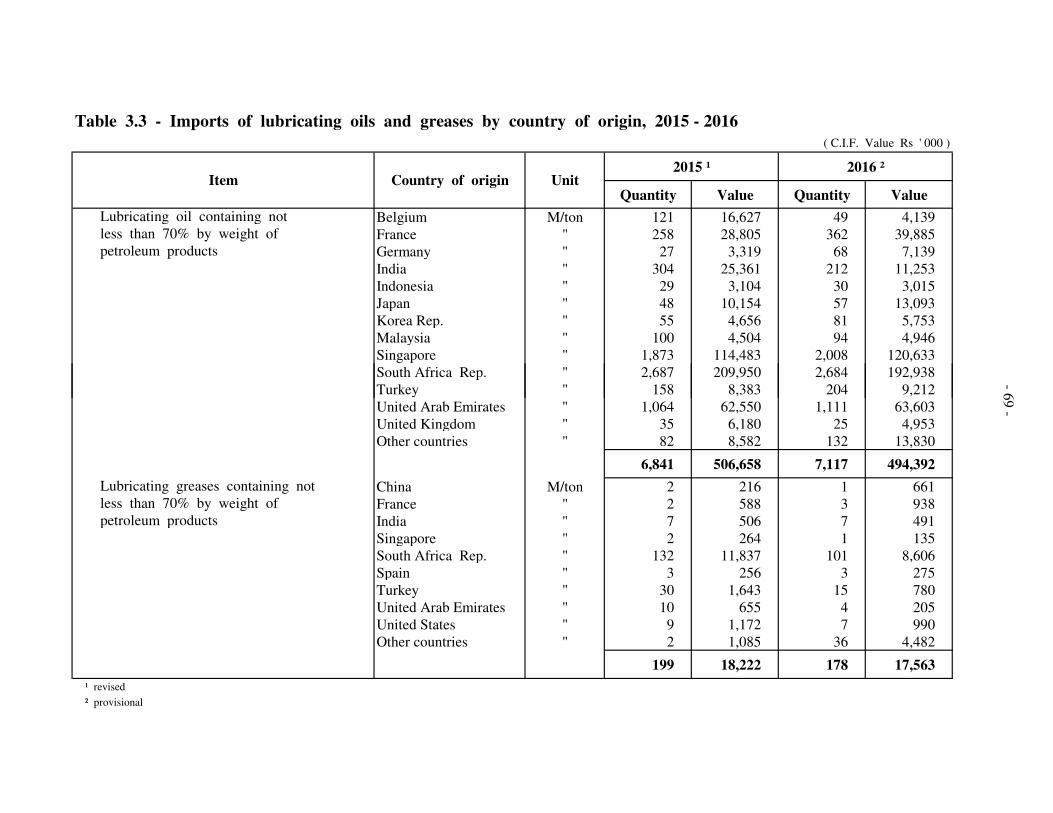
Table 3.3 - Imports of lubricating oils and greases by country of origin, 2015 - 2016
( C.I.F. Value Rs ' 000 )
2015 ¹ 2016 ²
Quantity Value Quantity Value
Lubricating oil containing not Belgium M/ton 121 16,627 49 4,139 less than 70% by weight of France " 258 28,805 362 39,885 petroleum products Germany " 27 3,319 68 7,139
India " 304 25,361 212 11,253
Indonesia " 29 3,104 30 3,015
Japan " 48 10,154 57 13,093
Korea Rep. " 55 4,656 81 5,753
Malaysia " 100 4,504 94 4,946
Singapore " 1,873 114,483 2,008 120,633
South Africa Rep. " 2,687 209,950 2,684 192,938
Turkey " 158 8,383 204 9,212
Item Country of origin Unit
South Africa Rep. " 2,687 209,950 2,684 192,938
Turkey " 158 8,383 204 9,212
United Arab Emirates " 1,064 62,550 1,111 63,603
United Kingdom " 35 6,180 25 4,953
Other countries " 82 8,582 132 13,830
6,841 506,658 7,117 494,392
Lubricating greases containing not China M/ton 2 216 1 661 less than 70% by weight of France " 2 588 3 938 petroleum products India " 7 506 7 491
Singapore " 2 264 1 135
South Africa Rep. " 132 11,837 101 8,606
Spain " 3 256 3 275
Turkey " 30 1,643 15 780
United Arab Emirates " 10 655 4 205
United States " 9 1,172 7 990
Other countries " 2 1,085 36 4,482
199 18,222 178 17,563
¹ revised
² provisional
-69 -
0 Reg. No Driver 1
Make Insured at: Pol No. NameName of Policy holder: Tel: Address and Telephone numberAddress
9. LicenceNumber
Reg. No Driver 2
Make Insured at: Pol No. Name Name of Policy holder: Tel: Address and Telephone number
Address9. LicenceNumber
Accident Location SketchPASSENGER Casualties (Class 2) Completed tables using codes from the bottom panel
PEDESTRIAN Casualties (Class 3) Completed tables using codes from the bottom panel
WitnessesName Address Telephone (Res and Off.)1225. Police description of accident
Reporting Officer- Rank and Name
Name of town/village
MAURITIUS POLICE FORCE
ROAD ACCIDENT DATA FORM
PF 178
1.OB.No. Accident Key:Date entered :
2. Police 3. District: Station
4. Accident Severity:1. Fatal
2. Serious
3. Slight
4. Heavy Damage only
Day Month Year
5. Date
6. Day 1.Sun 2. Mon 3.Tues 4. Wed 5.Thurs 6. Fri 7.Sat
7. Time(24 hour clock)
No of vehicles involved:
Number of casulties (Killed and injured)
8. Junction Type
1. Not at Junction 5.
2. 6.
3. 7.Slip road
4. 8. Private entrance
9. Junction Control
1. Police Officer2. Traffic Signals3. STOP Sign4. GIVE WAY sign or Marking5. Uncontrolled
10. Collision Type1. Head on 9. Hit Pedestian2. Rear End 10. Hit Animal3. Right Angle 11.Other…………..4. Side Swipe5. Ran off Road6. Hit Object in Road7. Hit Object off Road8. Hit Parked Vehicles
11. Road Type1. One way Street2. Two Way Street3. Dual Carriageway
12. Weather1. Fair 2. Rain
3. Fog 4. Smoke/ Dust
5 Other…………...
13. Light Condition
1. Day light2. Dawn/ Dusk3. Darkness: Street light present and lit4. Darkness: Street light present but unlit5. Darkness: no street lighting
14. Road Character
1. Straight + Flat2. Curve only3. Incline only4. Curve + Incline5. Bridge
16. Surface Type
1. Asphalt
2. Gravel
3. Earth
15. Road Condition
1. Good
2. Damaged
17. Surface Condition
1. Dry2. Wet3. Muddy4. Flooded5. Oil or Diesel
18. Roadworks
1. Yes 2. No
19. Hit & Run
1. Yes 2. No
X = Y =
Route No. Km
Accident Location Sketch
Show site in relation to well -known places such as scholls, temples, mosques, churches, bridges, and road junctions. Mark distances to these places. Always give street names.
Collision Diagram Sketch
Mark the position and direction of each vehicles and details of the road layout at the site of the accident.
Vehicle No. 1
3. Vehicle Type
1. Bicycle 7. Minibus2. Autocycle 8. Bus3. Motorcycle 9. Other4. Car5. Light Goods Vehicles6. Heavy Goods Vehicles
4. Vehicle Monoeuvre
1. Right turn 6. Diverging 11. Sudden stop2. Left turn 7. Overtaking 12. Parked Off road 3. U turn 8. Going ahead 13. Parked ON road4. Cross traffic 9. Reversing 14. Other...............5. Merging 10. Sudden start
10. Type of licence
1. Full licence 2. Provisional 3. No licence
11. Driver sex
M F
12. Age
5. Loading
1. Property loaded2. Overloaded3. Insecure load4. Protruding load5. Other omproper load
6. Apparent Vehicles Defest1. None2. Brakes3. Steering4. Tyres 5. Lights6. Multiple 7. Other
7. Vehicles Damage
1. None 7. Windscreen2.Front 8. Multiple3. Rear4. Right5. Left6. Roof
8. Owner1. Government2. Dilpomatic3. Private4. Company5.Hire Car6.Taxi7. Other…………...
13. Driver Injury
1. Fatal 2. Serious 3. Slight 4. Uninjured
14. Alcohol1. Not suspected 3. Test Positive2. Suspected 4. Test negative
15. Seat Belt / Helmet worn
1. Yes 2. No
Vehicle No. 2
3. Vehicle Type
1. Bicycle 7. Minibus2. Autocycle 8. Bus3. Motorcycle 9. Other4. Car5. Light Goods Vehicles6. Heavy Goods Vehicles
4. Vehicle Monoeuvre
1. Right turn 6. Diverging 11. Sudden stop2. Left turn 7. Overtaking 12. Parked Off road 3. U turn 8. Going ahead 13. Parked ON road4. Cross traffic 9. Reversing 14. Other...............5. Merging 10. Sudden start
10. Type of licence
1. Full licence 2. Provisional 3. No licence
11. Driver sex
M F
12. Age
5. Loading
1. Property loaded2. Overloaded3. Insecure load4. Protruding load5. Other omproper load
6. Apparent Vehicles Defest1. None2. Brakes3. Steering4. Tyres 5. Lights6. Multiple 7. Other
7. Vehicles Damage
1. None 7. Windscreen2.Front 8. Multiple3. Rear4. Right5. Left6. Roof
8. Owner1. Government2. Dilpomatic3. Private4. Company5.Hire Car6.Taxi7. Other…………...
13. Driver Injury
1. Fatal 2. Serious 3. Slight 4. Uninjured
14. Alcohol1. Not suspected 3. Test Positive2. Suspected 4. Test negative
15. Seat Belt / Helmet worn
1. Yes 2. No
Name
1.2.3
1.Cas Class
22
2
2. Veh. No
3 Sex 4.Age
5.Injury
6.Position
8. Belt/Helmet
7. Action
Name
1.2.
1.Cas Class
2. Veh. No
3 Sex 4.Age
5.Injury
6.Position
7. Action 8. Belt/Helmet
3
35. Injury
1. Fatal
2. Serious
Slight
6. Passenger Position
1. Front seat
2. Rear seat
3. M/cycle passenger
4. Bus passenger
5. Back of truck or pickup
7. Passenger Action
1. Sitting
2. Standing
3. Boarding
4. Alighting
5. Falling
8. Seat Belt/Helmet used
1. Yes
2. No
6. Pedestrian Location
1. On pedestrian Crossing
2. Within 50m of Ped Xing
3. On Central Refuge
4. In centre of raod (not1-3)
5. On Footpath/verge
7. Pedestrian Action
1. Standing
2. Crossing road
3. Walking along middle
4. Walking along edge
5. Playing on road