digital accountability: quantifying online ad...
TRANSCRIPT
Digital Accountability:Quantifying Online Ad Impact
Andrew Assad, Microsoft AdvertisingDavid Martin, Nielsen

Is online a good branding medium?Anecdotal evidence says yes…
Coke’s Happiness Machine:• Started online only• Promoted with one tweet and
one Facebook posting• Original budget of ~$60,000
USD
Result:• 3 million US views on YouTube• 1 million BR views on YouTube• Online creative translated into
successful TV spots
St. John’s University, USA
Rio De Janeiro, Brazil
2

Canadian consumers say no…They view online as direct response vehicle
3
What Would Make Online Ads More Influential to You?
1%
1%
4%
5%
11%
18%
29%
Honesty, Health Info
Less Clutter, Less Ads
Relevant to My Wants, Needs
Locally Targeted
Better Ad Creative Content
No Influence On Me, Don't Like Them
Discounts, Coupons, Pricing
Source: Nielsen survey of 1,200 Canadian consumers 13+

Brand advertisers say no…TV and print still get majority of brand spend
Total Ad Spend By Major Media TypeDaily Time Spent by Major Media Type
Source: Forrester TechnographicsZenithOptimedia, IAB Canada 4

The data say yes…Online campaigns studied drove up buying rate and penetration
PENETRATIONHow many buyers?
XTOTAL SALES
BUYING RATEHow much are they buying?
=Of all measured campaign results:
58% had greater impact on penetration
39% had greater impact on buying rate
Furthermore, there is little correlation between CTR and ROIOnline Click-Through vs. Offline ROI
R2 = 0.005
-200%0%
200%400%600%800%
1000%1200%
0.00% 0.05% 0.10% 0.15% 0.20% 0.25% 0.30%
Online Click-Through Rate
Offl
ine
RO
I
5Source: Nielsen SalesEffect

So why isn’t online getting more ad dollars?
Barriers to growth:
• Low economies of scale in Canada• Apprehensive client mentality• US spillover stifles local development• Conservative business culture• English and French consideration• Traditional broadcast media• Hard-to-prove ROI• Creative diffusion, context
6
“Too many ads makes other ads seem less important.
Instead of flooding a screen with many adds, have one ad
at a time.”--Male, 23, Ontario
“…the context they are displayed in should be
more consistent with the products.”
--Female, 54, British Columbia
“Very few on-line ads focus on Canadian
consumers let alone those in my specific
area...”--Female, 59, Ontario
Source: Nielsen survey of 1,200 Canadian consumers 13+IDC Canada, Wunderman Canada, Microsoft Advertising Canada

We need to establish a chain of digital accountability
7
REACH RESONANCE REACTION
Did the ad campaign hit the right target?
Did the ad and message stick with consumers?
Did the ad positively impact consideration and sales?

Reach:Post-Buy Reporting

Why should we care?Many Canadian consumers spend more time online than on TV
9
TV and Internet Consumption by Canadian
Consumers
72%TV Time >
Internet Time
28%Internet Time >= TV Time
Average Monthly Spend on Groceries
$339
$329
Internet Time >= TVTime
TV Time > InternetTime
Plan to Spend More on Groceries in Next Year
12%
10%
Internet Time >= TVTime
TV Time > InternetTime
Source: Nielsen survey of 1,200 Canadian consumers 13+
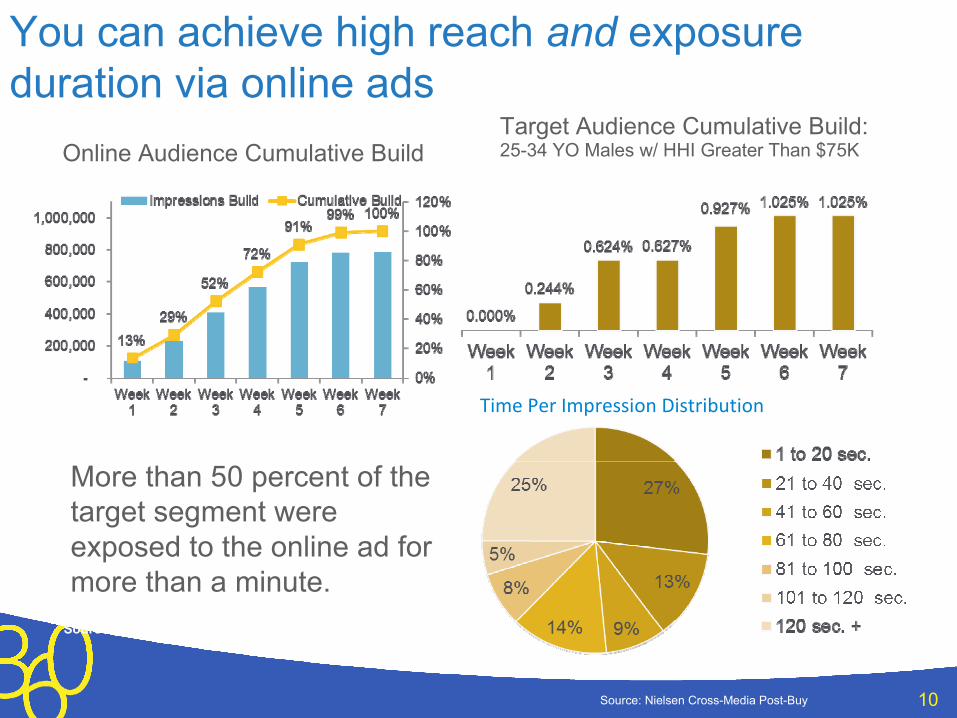
You can achieve high reach and exposure duration via online ads
Source: Nielsen Post Buy Report
Target Audience Cumulative Build: 25-34 YO Males w/ HHI Greater Than $75K
Time Per Impression Distribution
Online Audience Cumulative Build
More than 50 percent of the target segment were exposed to the online ad for more than a minute.
Source: Nielsen Cross-Media Post-Buy 10

Online also delivers the distinct audience of light TV viewers
• TV dominates the reach metrics for the campaign.
• Clearly, campaign spending is very heavy on TV.
• However, it is possible to reach an entirely distinct segment of consumers on the Internet; those who have had no TV exposure.
11Source: Nielsen Cross-Media Post-Buy

Online can also be more efficient than TV in delivery of target segments
Cost to Reach Desired Audience Online, Indexed to TV
100
76 71 70 64
020406080
100120
TV 18 - 34 18 - 34, HHIncome$100k+
18 - 34, HDTV& videocapablelaptop
18 - 34,boradband &video capable
laptop
12Source: Nielsen Cross-Media Post-Buy

Resonance:Ad Effectiveness Surveys

14
Why is attitudinal data important?Digital plays an especially important role in research
Source: Nielsen survey of 1,200 Canadian consumers 13+Microsoft Advertising Canada
Methods Used to Research Grocery Purchases in Canada
51%45% 41%
20%
5%0%
10%20%30%40%50%60%70%
Review printcirculars
Research inphysical stores
Research online ona computer
Ask a friend orfamily member
Research on asmartphone

By itself, online shows important variation on effectiveness measures
Source: Nielsen IAG 15
Brand Recall by Ad Size23%
20%17%17%
11%13%
5%
13%
7%
0%
5%
10%
15%
20%
25%
Device Campaign 1 Sale Campaign Device Campaign 2
SkyscraperRectangleLeaderboard

Coupled with TV, online exposure boosts branding effects across media
Source: Nielsen IAG TV & Internet: P13+, 11/8/07 - 6/3/08; Primetime Only; Based on time period(s) for advertisers where impressions were also being delivered on Network website for same brand
16
Brand and Message Recall
10%
4%
16%
8%
0%
5%
10%
15%
20%
Brand Recall Message Recall
TV Only ExposedTV + Online Exposed
Source: Nielsen IAG

Social adds another layer of complexityReaching highly social consumers is critical
Source: Nielsen survey of 1,200 Canadian consumers 13+ 17
Number of Facebook Friends, Canadian Consumers
8%
21%
6%
35%
0%
5%
10%
15%
20%
25%
30%
35%
40%
0 to 49 50 to 99 100 to 199 200 to 299 300 to 399 400 to 499 500 ormore
Will Spend More Next YearFacebook is More Influential in Shopping
Number of Facebook Friends
Perc
enta
ge o
f Peo
ple

Engagement Ad
Engagement Ad + Social Context
Organic Impression
The mechanics of “earned” mediaTypical Facebook Page:
18

Social media ads are more effective the closer they get to one’s network
Percentage Difference from Control Group
10%
4%2%
16%
8% 8%
30%
13%
8%
0%
5%
10%
15%
20%
25%
30%
35%
Ad Recall Awareness Purchase Intent
Homepage ad exposureHomepage ad + social advocacyHomepage ad + organic impression
19Source: Nielsen BrandEffectFacebook

Reaction:Online-to-Offline ROI Analyses

What return can I realistically expect?People who research online spend more
21
Amount Spent on Groceries Per MonthBy Research Activities
$283
$343
$352
$358
$363
$200 $250 $300 $350 $400
I typically do not research grocery storepurchases
Ask a friend or family member
Research in physical stores, including thestore where I make the purchase
Research online on a computer
Research by reviewing print circulars
Source: Nielsen survey of 1,200 Canadian consumers 13+

Single-match test/control can measure offline ROI of online campaigns
Campaign Start
Campaign End
Test Cell:Households exposed to the campaign
Test Cell:Households exposed to the campaign
Control CellHouseholds NOT exposed to campaign, but similar on demos and past purchases
Control CellHouseholds NOT exposed to campaign, but similar on demos and past purchases
22
Test/Control Construction
Source: Nielsen SalesEffect

The returns on online investment are real
Over 200 digital campaigns measured, averaging…
• Average increase in sales = 32%• Average short term incremental retail
sales = $1.1m
• Average ROI = 157%• Average increase in penetration =
18%
• Average increase in buying rate = 14%
• Campaigns with sub zero ROI = 13%
Source: Nielsen SalesEffect 23

ROI can differ between CPG product types
Existing BrandsAverage ROI = 164%
Average Penetration▲ = 18%
Average Buy Rate▲ = 13%
Line ExtensionsAverage ROI = 135%
Average Penetration▲ = 21%
Average Buy Rate▲ = 19%
Source: Nielsen SalesEffect 24

Messaging also drives differences in ROI, branding works, but promotions still drive higher ROI
Equity-only Campaigns
Average ROI = 143%
Campaigns with Promotions
Average ROI = 335%
Source: Nielsen SalesEffect 25
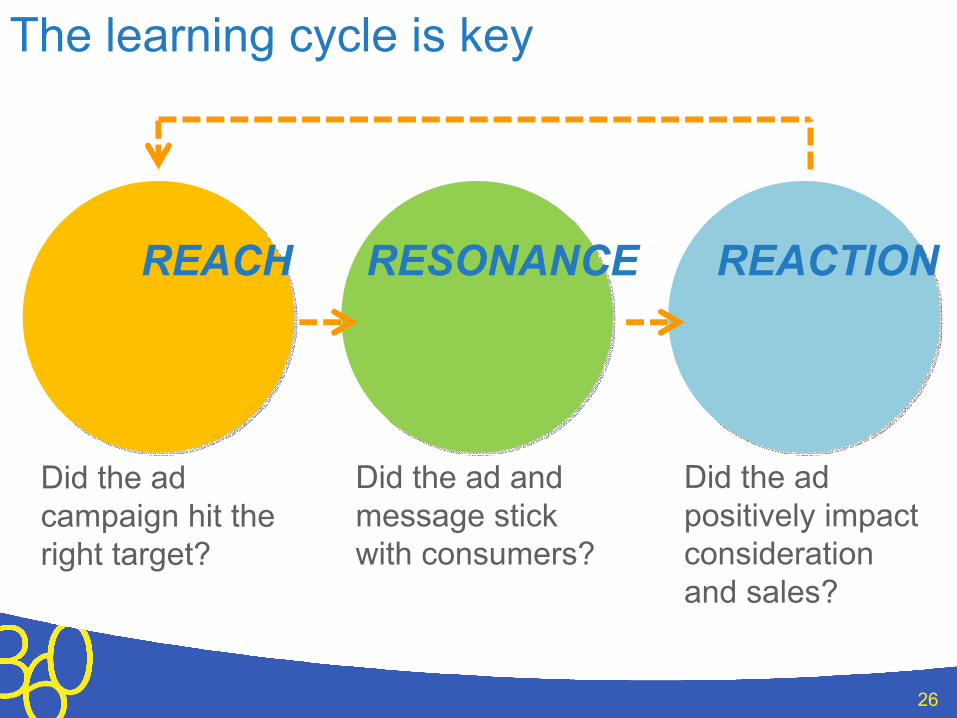
The learning cycle is key
26
REACH RESONANCE REACTION
Did the ad campaign hit the right target?
Did the ad and message stick with consumers?
Did the ad positively impact consideration and sales?

Limitations:Measurement Challenges

Challenges we need to overcome
28
• Panels can limit measurement of small campaigns
• Many Canadian campaigns are too small to justify spending on research
• Stated intent versus actual behavior can vary wildly between product categories
• Advertisers are still trying to figure out the absolute value of “fans” and earned media

Thank you!