digital disconnect
DESCRIPTION
Ellen Helsper. Digital disconnect. Predictors and Solutions for Digital Disengagement. Back and Forth…Back and Forth. Rich get richer?. Digital Vulnerability/Inclusion. Social Vulnerability/Inclusion. Engagement Entertainment Information Communication Participation Creativity. - PowerPoint PPT PresentationTRANSCRIPT
DIGITAL DISCONNECTPredictors and Solutions for Digital Disengagement
Ellen Helsper

BACK AND FORTH…BACK AND FORTH
Rich get richer?
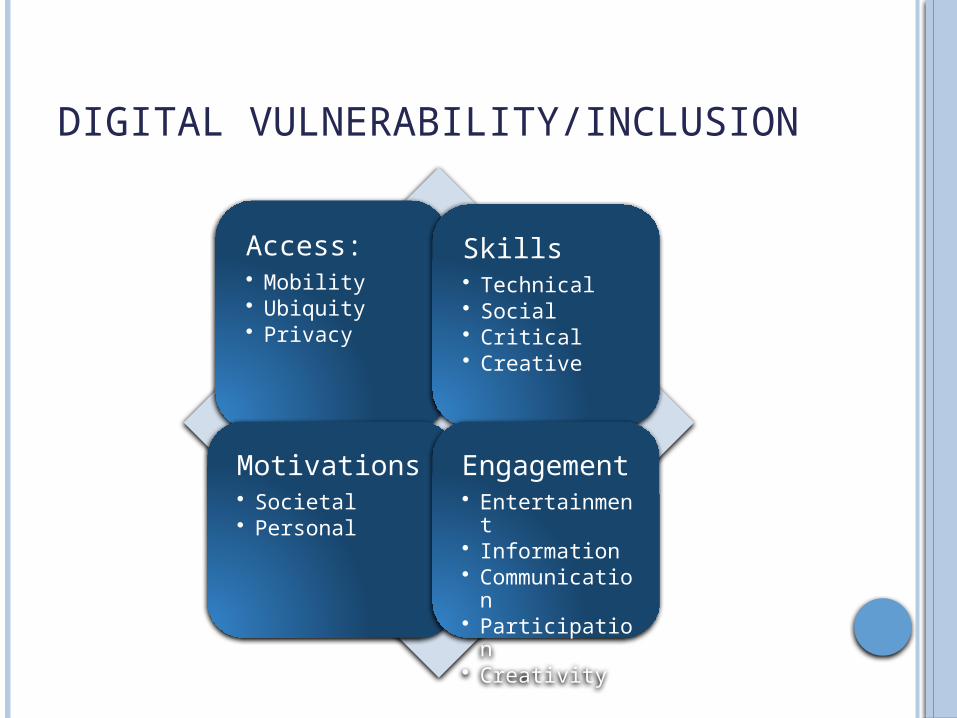
Access:• Mobility• Ubiquity• Privacy
Skills• Technical• Social• Critical• Creative
Motivations• Societal• Personal
Engagement• Entertainment• Information• Communicatio
n• Participation• Creativity
DIGITAL VULNERABILITY/INCLUSION
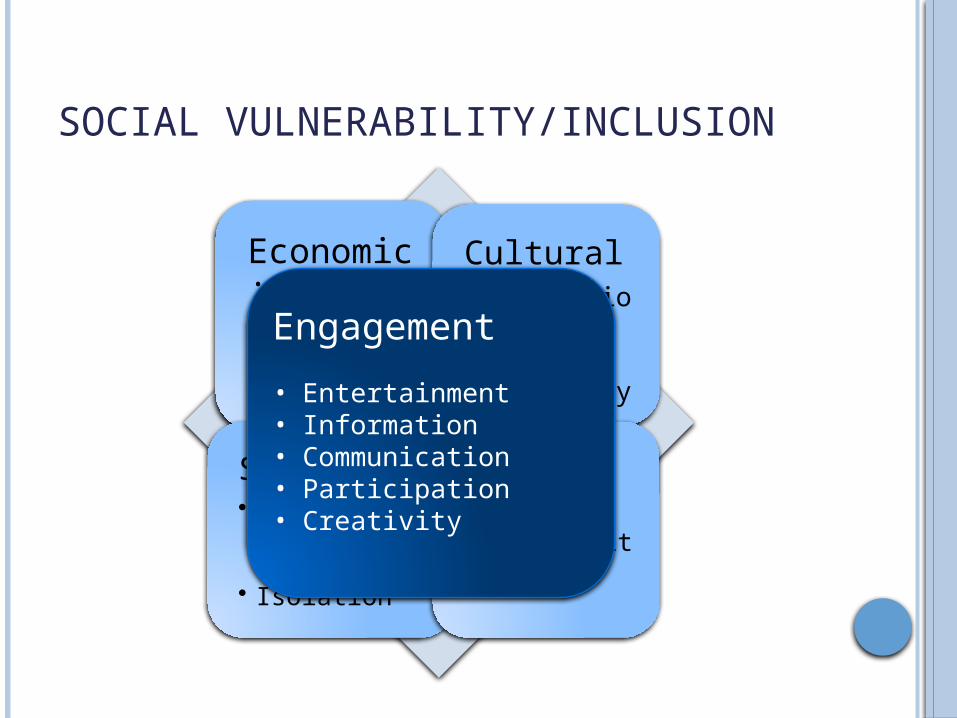
SOCIAL VULNERABILITY/INCLUSION
Economic :• Education• Income• Occupation
Cultural• Generation• Gender• Ethnicity
Social• Civic
participation• Isolation
Personal• Health• Personality
Engagement• Entertainment• Information• Communication• Participation• Creativity

COMPOUND DISADVANTAGE2007, R2 = 0.89
2003, R2 = 0.94
2005, R2 = 0.91
2009, R2 = 0.94
Deep exclusion Deep Inclusion --- Level of social inclusion ---
--- Le
vel o
f dig
ital i
nclu
sion
---
Deep
exc
lusio
n
Deep
Incl
usio
n
Source: OxIS 2003, 2005, 2007, 2009

SPECIFIC VULNERABLE GROUPS: ACCESS INEQUALITY
2003 2005 2007 2009-20%
0%
20%
40%
60%
80%
100%
44%
60%
38%
61%
30%
3%
Age
#REF!
Educa-tion
In-come
#REF!
Gender
Diffe
renc
e in
hom
e ac
cess
in p
erce
ntag
e po
ints
Urban: No significant differenceEthnicity: No significant difference at the moment

SPECIFIC VULNERABLE GROUPS: ACCESS LEVELS
2005 2007 20090%
10%
20%
30%
40%
50%
60%
70%
80%
90%
100%
87%
28%
53%
91%
35%
97%
High SESLow SESSecondaryUniversityLow incomeHigh income
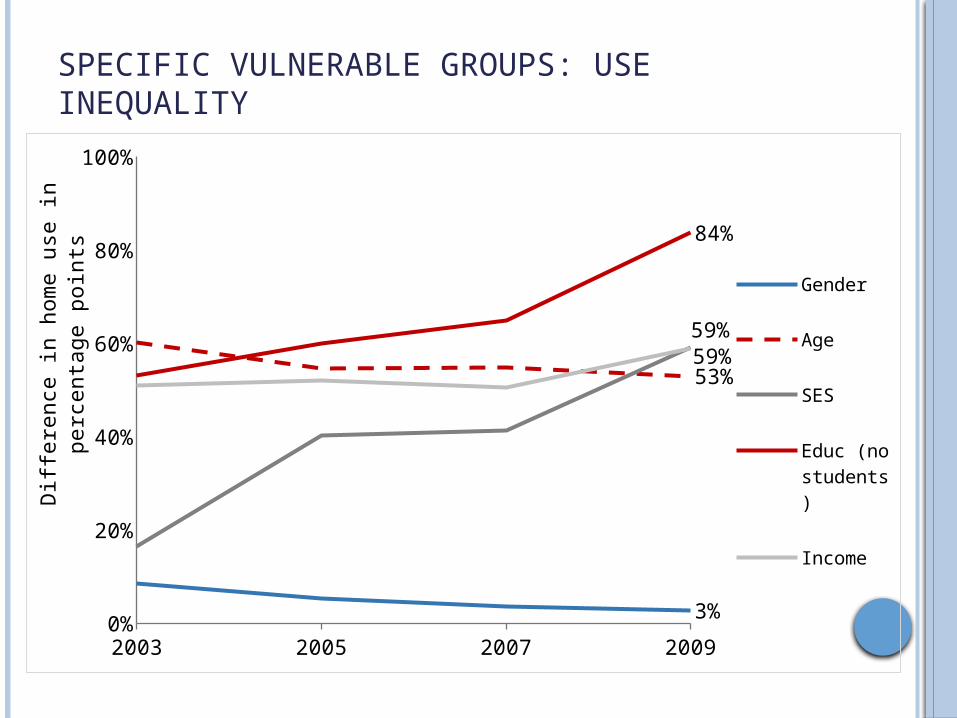
SPECIFIC VULNERABLE GROUPS: USE INEQUALITY
2003 2005 2007 20090%
20%
40%
60%
80%
100%
3%
53%59%
84%
59%Gender
Age
SES
Educ (no students)
Income
Diffe
renc
e in
hom
e us
e in
per
cent
age
poin
ts
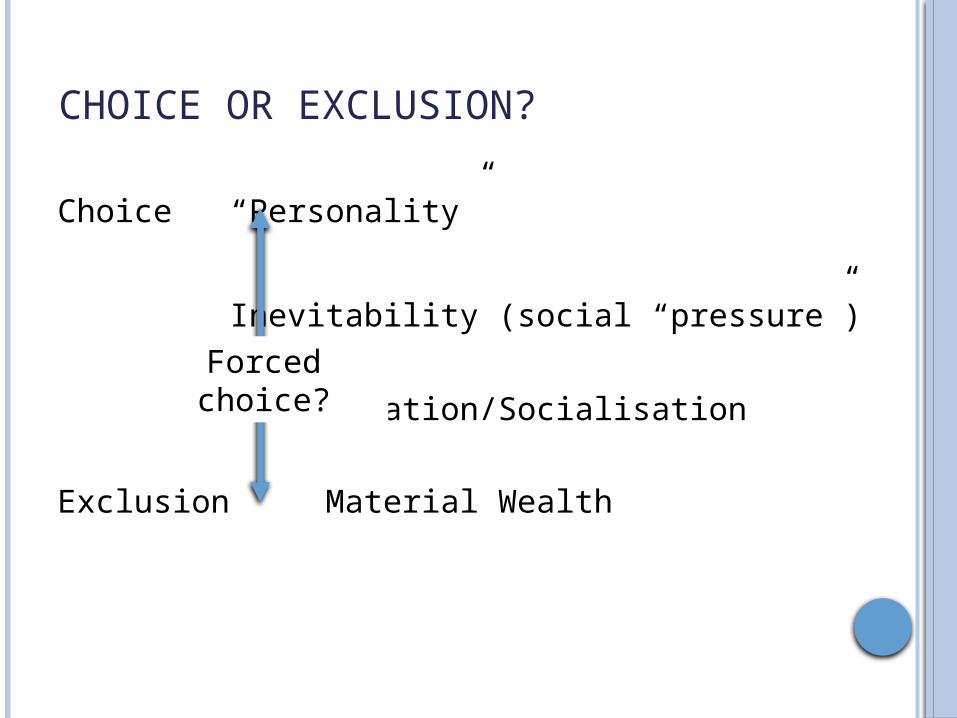
CHOICE OR EXCLUSION?
Choice “Personality”
Inevitability (social “pressure”)
Acculturation/Socialisation
Exclusion Material Wealth
Forced choice?
RELATIVITY AND CONTEXTUALITY OF EXCLUSIONRelativityRelative deprivation can be as important if not more so than absolute deprivation. For some key clusters digitally excluded people may suffer from higher levels of disadvantage in the context of their community than other with the same levels of ‘objective’ digital exclusion. (National Audit Office report, 2009)
Proxy useOne third of non-users in the UK rely “..on family or friends to use the Internet on their behalf, which means they belong to networks of people able to do this for them” (Helsper & Godoy, 2011)

REASONS FOR NON-USE OVER TIME
2005 2007 20090%
20%
40%
60%
80%
100%
42%
50%51%63%
45% 48%44%
64%
High Costs No Access No Skills No Interest
% o
f Ex-
and
Non
-Use
rs w
ho sa
y th
is fa
ctor
was
im
port
ant f
or st
oppi
ng to
use
/not
usi
ng th
e In
-te
rnet
Base: Non and Ex-users of the internet: 2005 N=876; 2007 N=773; 2009 N=612.

REASONS FOR NON-USE OVER TIME
Base: Non-users
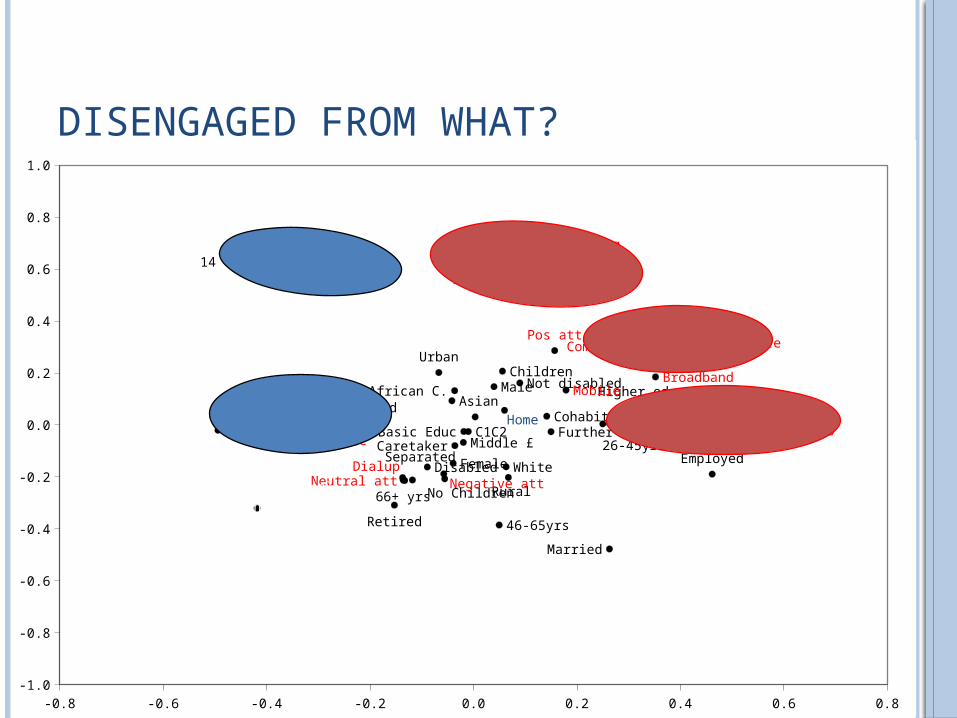
DISENGAGED FROM WHAT?
-0.8 -0.6 -0.4 -0.2 0.0 0.2 0.4 0.6 0.8-1.0
-0.8
-0.6
-0.4
-0.2
0.0
0.2
0.4
0.6
0.8
1.0
C1C2Secondary educ
Further educ
Higher educ
DE Basic Educ
AB
14 to 25yrs
26-45yrs
46-65yrs
66+ yrs
Female
Male
Urban
Rural
Low £
Middle £Higher £
Children
No Children
Disabled
Not disabled
Student
Employed
Retired
Unemployed
Caretaker
AsianAfrican C.
White
Single
Married
Cohabit
Separated
MobileBroadband
Dialup
ElsewhereHome Home & Elsewhere
Negative attNeutral att
Pos att
Info
Learning
Gaming
LeisureCommunication
Individual networking
Social Networking
Buying
Investing
PoliticsCivic
No political
No Info
No Gaming
No Learning No Leisure
No Communication
No Individual networking
No Social Networking
No Investing
No Politics
No civic

ENGAGEMENT LADDER (YOUNG ADULTS)
Num
ber o
f Int
erne
t use
rs
ShoppingEntertainment
Travel
Topicalities
TrainingFact Checking
Perso
n to Pers
on
Network
Finance
Egov
ernm
ent
Socia
l Netw
ork
Diary
Civic Participation0
50
100
150
200
250
1 2 3 4 5 6 7 8 9 10 11 12Number of activities that undertakes in total

LESSONS LEARNED
IPTS

EXAMPLES OF (RESEARCH) PRACTICE Case I The socially isolated Case II NEETs Case III Ethnic Minorities Case IV Travellers/Gypsies Case V Disabled individuals

CASE III ETHNIC MINORITIES“I don't think minorities in general go for that...meeting people online. Because I don't think they're that open minded, generally.” (African Caribbean teenager)
Scho
ol w
ork
Vide
os
Dow
nloa
...
New
s
Emai
l
Chat
Gam
es
Vitru
al w
...
Web
cam
Post
ing
...
Blog
Crea
ted
a...
0%
20%
40%
60%
80%
100%
82% 81%
49%54%
64%
32%
47%
23%
36% 36%
14%24%
85%76%
43%48%
61%
23%
44%
15%
31% 30%
11%17%
Discriminated Not discriminated
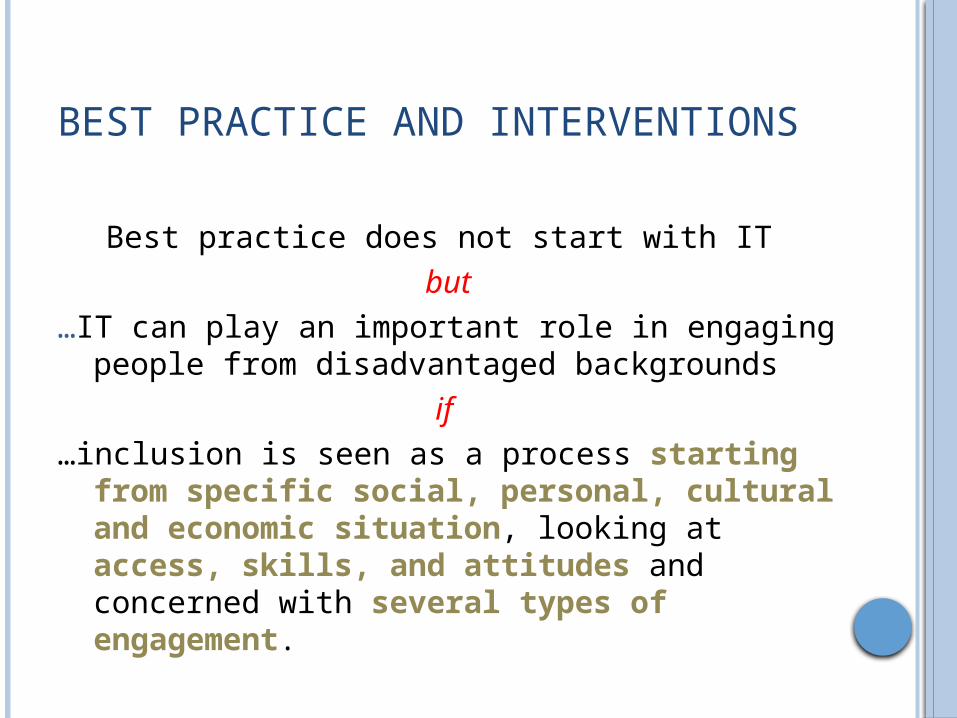
BEST PRACTICE AND INTERVENTIONS
Best practice does not start with IT but
…IT can play an important role in engaging people from disadvantaged backgrounds
if …inclusion is seen as a process starting from
specific social, personal, cultural and economic situation, looking at access, skills, and attitudes and concerned with several types of engagement.

FOOD FOR THOUGHTEvaluation of ‘success’ with the most vulnerable in society often requires a normative solution:
What do we consider to be inclusion? Is it up to the different groups to decide what
inclusion means to them?
Pull
Push