digital imaging for bridge deflection measurement of a...
TRANSCRIPT

Digital Imaging for Bridge Deflection Measurement of a Steel Girder Composite Bridge 1
2
Corresponding Author: 3
Erin Santini-Bell, Ph.D., P.E. 4
Department of Civil Engineering 5
University of New Hampshire 6
Durham, NH 03824 7
Phone: (603) 862-3850 8
Email: [email protected] 9
10
Philip A. Brogan 11
Former Graduate Research Assistant 12
Department of Civil Engineering 13
University of New Hampshire 14
Durham, NH 03824 15
16
Paul J. Lefebvre 17
Former Graduate Research Assistant 18
Department of Civil Engineering 19
University of New Hampshire 20
Durham, NH 03824 21
22
Jason Peddle 23
Graduate Research Assistant 24
Department of Civil Engineering 25
University of New Hampshire 26
Durham, NH 03824 27
28
Brian Brenner, P.E. 29
Vice President 30
Fay, Spofford & Thorndike, INC 31
5 Burlington Wood 32
Burlington, MA 33
34
Masoud Sanayei, Ph.D. 35
Department of Civil and Environmental Engineering 36
Tufts University 37
308 Anderson Hall 38
Medford, MA 02155 39
40
August 1, 2010 41
42
Word count: 3,356 words (12 figures, 0 tables) 43
Adjusted word count: including figures and tables: 6,356 44
with footnotes & endnotes:6,983 45
46
Keywords: Structural Health Monitoring, load testing, full-scale bridge, non-destructive testing, 47
deflection measurement, digital image correlation 48
49

Abstract 1
Bridge managers have historically relied on visual inspection reports and field observation, 2
including photographs, to assess bridge health. The inclusion of instrumentation including strain 3
gauges, tiltmeters, linear variable differential transformers (LVDT), and accelerometers along 4
with a structural model can enhance bridge management. This combination of instrumentation 5
and modeling is commonly classified as structural health monitoring (SHM). Traditional SHM 6
measurements are reference-independent, such as strain gauges and tiltmeters. These sensors can 7
be easily installed during the initial construction of new bridge but installation is significantly 8
more difficult once the bridge is in service. The collection of global deflections of a bridge, a 9
reference-dependent measurement, is even more difficult to collect as the connection between 10
the bridge structure and a fixed reference is geometrically challenging. A measurement technique 11
that alleviates both of these issues is digital image correlation. 12
Through recent advances in digital photography and the computational capability of personal 13
computers, digital image correlation (DIC) is a non-contact measurement technique that can be 14
cost-effectively deployed to collect global deflection measurements of a bridge structure. DIC 15
uses multiple digital cameras to photograph a target object to provide structural response 16
information. This project incorporates a DIC system and LVDT sensors into the bridge 17
instrumentation, testing and modeling program for a concrete deck-steel girder composite bridge 18
in Barre, Massachusetts. This paper presents a collaborative research project partially funded by 19
the CAREER, Major Research Instrumentation and the Partnerships for Innovation Programs at 20
the National Science Foundation to develop a framework for bridge condition assessment 21
integrating instrumentation and structural modeling for bridge decision-making and 22
management. 23

INTRODUCTION 1
An high profile bridge failures or near failures in the past several decades has highlighted the 2
deteriorating condition of bridge infrastructure in America and the need for additional and 3
advanced management and monitoring techniques. According to the American Society of Civil 4
Engineers (ASCE) infrastructure report card, America’s bridges have consistently received a 5
rating of “C” for the past ten years (ASCE, 2010). Meanwhile, construction costs have inflated 6
by at least 50 percent and neither federal nor state transportation budgets have been able to keep 7
pace with the increasing expenses (AASHTO, 2008A). 8
Traditionally, bridge health has been monitored by visual inspections according to the 9
National Bridge Inspection Standards (NBIS) and load rating. Load ratings are calculated based 10
on the results of inspection condition ratings (AASHTO, 2008B). Load ratings are a more 11
objective measure of bridge health, but are still calculated based on the results of subjective 12
observations collected via visual inspections. An “initial inspection” is conducted immediately 13
following construction completion to establish a baseline for future inspections. After this, 14
“routine inspections” take place at least every two years, with “special inspections” to investigate 15
any anomalies in the structure. Although these inspections are standardized for each state, the 16
inspection process is subjective, with each inspector using his own judgment and personal 17
expertise to assess the condition of each bridge component (Phares et. al. 2001). 18
This ambiguity, along with the collective deterioration of bridge infrastructure, has lead to 19
the realization that a more long-term, objective approach needs to be applied to bridge 20
management. This realization has initiated advancements and increased interest in structural 21
health monitoring (SHM). The International Society for Structural Health Monitoring of 22
Intelligent Infrastructure (ISHMII) defines SHM as “a type of system that provides information 23
on demand about any significant change or damage occurring in the structure” (ISHMII, 2010). 24
SHM typically includes data collection through sensor based instrumentation, post-processing 25
the collected responses with respect to predicted responses from both hand calculations and 26
structural modeling and then monitoring of any changes to the structure. 27
Structural Health Monitoring 28
The goal of a SHM system is to employ sensing instruments to provide information 29
pertaining to the condition of the structure (Chang 2003). Recent advancements in technology 30
have made bridge structure instrumentation very popular (Santini-Bell and Sipple, 2009, Riad et 31
al , 2006 and Wang, 2008). The Federal Highway Administration (FHWA) envisions sensing and 32
measurement capabilities fully integrated into the design, construction and operation of the 33
bridge of the future (ISHMII, 2006). For structural evaluation of bridges, various types of sensor 34
information, such as strain distribution, vibration and natural frequencies, and deflection 35
measurements are used to generate data that provides information relating to the health and load 36
carrying capacity. The collected data is used with a structural model of the bridge to determine 37
the bridge performance parameters by solving an inverse problem (Santini-Bell et al 2007). 38
In current practice, these test methods generally require mounting transducers, such as strain 39
gauges, on the underside of the structure on the bending members. For bridges over water, the 40
problem of sensor system installation is further compounded. Static testing is typically 41
conducted using truck with a known load that is traveling across the bridge along a marked path 42
while stopping at predetermined locations to induce the maximum response. New non contact 43
measurement techniques facilitate the inclusion of deflection measurements for SHM. For 44

example, Benmokrane et al (2006) measured global bridge deflection with a theodolite to 1
supplement internal temperature and fiber-optic strain gauges on the Morristown Bridge in 2
Vermont. 3
BRIDGE DEFLECTION MEASUREMENTS 4
Traditional deflection measurement methods such as linear variable differential transformers 5
(LVDT), string potentiometers and GPS are difficult to implement in the field for the majority of 6
bridges. The geography and environment of most bridges limit access to crucial bridge elements 7
for deflection measurements. Because of rapid advancements in the resolution and maximum 8
frame rate of digital imaging equipment recently, digital image correlation techniques (Lee and 9
Shinozuka, 2006A and Wahdeh et. al., 2003) permit the determination of the transformation 10
between equivalent features in two or more images. DIC is suitable for global linear 11
transformations as well as regional non-linear distortion. Optical techniques offer the potential to 12
acquire bridge performance data without the need for installation of sensors, targets, or other 13
devices on the bridge, and without the need to disrupt traffic during measurements. Such optical 14
measurements can, in conjunction with the crossing of a design load, produce whole bridge 15
deflection curves from one or both sides of the structure. 16
Increasingly sophisticated non-contact measurement techniques do exist, such as 17
interferometric radar (Mayer et al 2010) and laser-based instrumentation (Fuchs et al, 2004). 18
Both systems can be set up under the bridge, limiting the traffic impact and have the capability to 19
accurately capture bridge response. These systems can measure bridge response from longer 20
distances and at more locations than DIC. Therefore, they are more appropriate for longer span 21
and bridges over water. The objective of this work is to assess the utility and cost effective 22
digital imaging systems and the practical limits of the deflection measurement application to 23
bridge testing. The collected structural deflections of the bridge collected via DIC are then 24
compared to a structural model that has been calibrated with strain data collected from a 25
controlled load test 26
Digital Image Correlation 27
Video monitoring and digital imaging has been used since the 1980’s for traffic management 28
(Rodriguez and Garcia, 2010). Recent works have integrated the video information with 29
structural health monitoring of highway bridges (Fraser et al 2010, Catbas et al, 2004). These 30
platforms were developed to be able to use ambient traffic data as a source for dynamic 31
excitation. This project will expand on this work, specifically the image analysis, for adaptation 32
to bridge management. 33
Those in the material science field also use digital image correlation extensively to determine 34
material properties and behavior. Mechanical engineers have been using DIC for many years to 35
analyze the stresses and strains in machine parts (McLaughlin et al, 2009). These analyses are 36
usually conducted in two dimensions, where a flat plane is stretched and stresses and strains are 37
measured along that plane. DIC has also been used in limited civil engineering applications for 38
bridge testing (Lee and Shinozuek, 2006B and Gamache and Santini-Bell, 2009). 39
Required hardware for the entire process is as follows: one or more high-resolution digital 40
cameras; a tripod; a portable computer with a suitable video card, processor, and large memory 41
bank; a calibration target; and a target with a sufficient texture. The software for both image 42

capture (Vic-Snap) and post-processing (VIC-3D) used for this project was provided by 1
Correlated Solutions Inc. (CSI) of Columbus, South Carolina. 2
Bridge testing adds challenges to DIC that would not normally be encountered in the 3
laboratory such as environmental effects. A significant increase in temperature, solar glare or 4
wind can cause the camera tripod to expand or shift, altering the focus of the cameras and 5
causing an apparent movement of the target object. In fact, the greatest challenge to DIC in 6
general is maintaining the position of the cameras. Change in solar glare can also impact the 7
image capture by creating glare across the lenses. The geography and soil conditions of the test 8
site also limits placement of the cameras with respect to maintaining camera position throughout 9
the data capture. These challenges can be address by using DIC in night testing where artificial 10
lighting is used and the temperature change during the test is minimal. 11
Accurate post-processing of digital imaging for structural response depends on the ability to 12
identify the intensity and location of each image pixels from the first image to the last. The 13
differential position of each individual pixel can be identified provided that the configuration of 14
the cameras, including the relative distance between cameras and relative angle of the cameras in 15
all directions was successfully calibrated. Any digital image post-processing is dependent upon a 16
robust calibration and differential in pixel intensity. 17
DIC Limitations 18
Value of data collected via DIC is directly related to the resolution of the camera, material 19
texture, light, and distance to the target area. Depending on the focal lens and proximity of the 20
camera to the target area, camera shake from passing vehicles or in some cases pedestrian can 21
significantly impact the collected images (Gamache and Santini-Bell, 2009). The goal of this 22
project is to assess the effectiveness of DIC to supplement SHM instrumentation plans for bridge 23
management. 24
CASE STUDY: VERNON AVENUE BRIDGE IN BARRE, MASSACHUSETTS 25
The Vernon Avenue Bridge (VAB) was constructed during the summer of 2009 and opened 26
to traffic in September 2009. This bridge was constructed by E.T.&L. Corporation for the 27
Massachusetts Highway Administration for the Town of Barre, Massachusetts. This bridge is a 28
150-foot (45.7 km) three-span continuous bridge. It is comprised of a concrete deck supported 29
by six weathering steel girders, as shown in Figure 1. This three-span continuous bridge spans 30
the Ware River, which flows at a maximum depth of approximately 10 feet (3.05m). The eight 31
inch (20.3 cm) concrete deck was cast-in-place (CIP) during a single continuous pour. VAB was 32
instrumented during fabrication and erection as part of a collaborative research project funded by 33
the National Science Foundation (Santini-Bell et al, 2010). 34
The instrumentation plan includes 100 strain gauges, 16 accelerometers, 24 tiltmeters as well 35
as temperature sensors on the girders and in the concrete deck. On September 3, 2009, a static 36
load test was performed prior to the bridge being opened to the traveling public. DIC was 37
included in this load test to supplement the instrumentation with deflection measurements. The 38
collected strain measurements were used to calibrate a structural model of the VAB. The DIC-39
collected deflection measurements were then compared with the predicted deflection from this 40
calibrated structural model (Lefebvre, 2010). Prior to erection, the web of the exterior girder on 41
the east side of the VAB was speckled with white magnets to increase pixel intensity for DIC 42
testing, as shown in Figure 2. 43

1
FIGURE 1 Vernon Ave Bridge in Barre, Massachuetts. 2
3
FIGURE 2 East Exterior Girder of the Vernon Avenue Bridge with speckle pattern during 4
erection. 5
Strain sensors and thermistors are distributed along the length of each girder on both sides of 6
the web with the exception of the exterior girders, which only have instrumentation in the 7
interior face. All sensors were connected to 20 iSite data loggers provided by Geocomp, 8
Incorporated for data acquisition. By design, all sensors installed in the bridge were calibrated to 9
a ±0.002% accuracy. All data acquisition modules were clustered on the south abutment for 1
access to a power supply and communication lines. 2
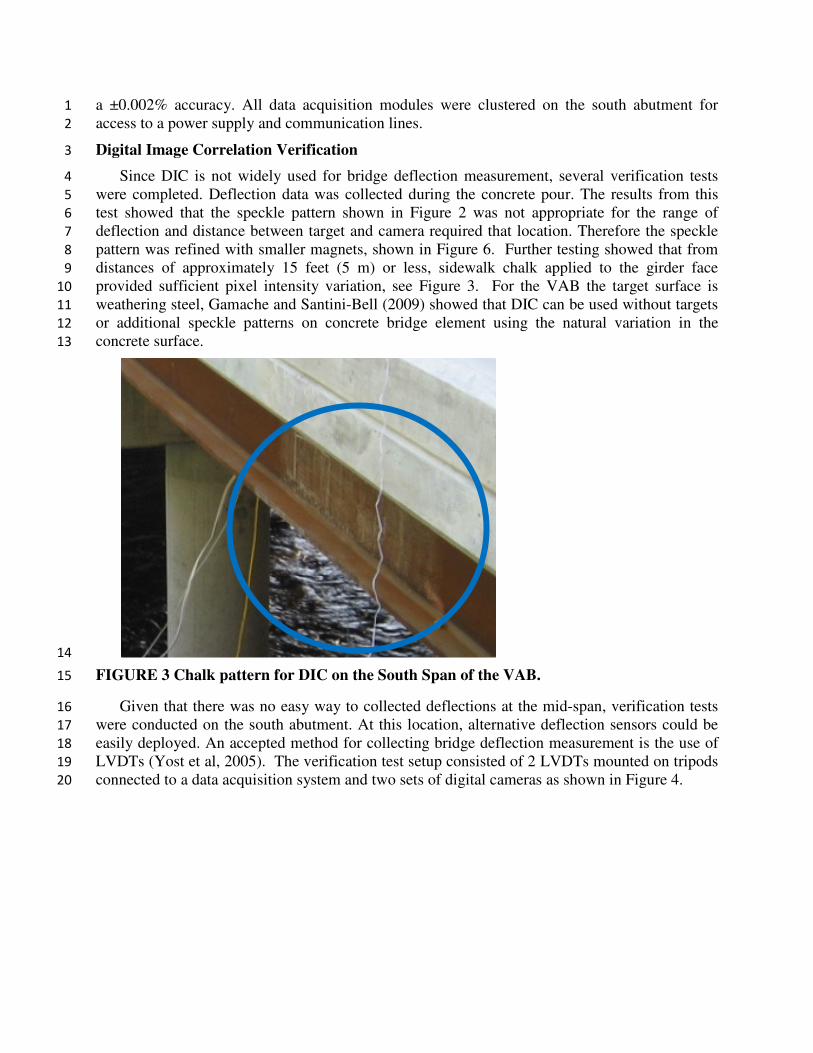
Digital Image Correlation Verification 3
Since DIC is not widely used for bridge deflection measurement, several verification tests 4
were completed. Deflection data was collected during the concrete pour. The results from this 5
test showed that the speckle pattern shown in Figure 2 was not appropriate for the range of 6
deflection and distance between target and camera required that location. Therefore the speckle 7
pattern was refined with smaller magnets, shown in Figure 6. Further testing showed that from 8
distances of approximately 15 feet (5 m) or less, sidewalk chalk applied to the girder face 9
provided sufficient pixel intensity variation, see Figure 3. For the VAB the target surface is 10
weathering steel, Gamache and Santini-Bell (2009) showed that DIC can be used without targets 11
or additional speckle patterns on concrete bridge element using the natural variation in the 12
concrete surface. 13
14
FIGURE 3 Chalk pattern for DIC on the South Span of the VAB. 15
Given that there was no easy way to collected deflections at the mid-span, verification tests 16
were conducted on the south abutment. At this location, alternative deflection sensors could be 17
easily deployed. An accepted method for collecting bridge deflection measurement is the use of 18
LVDTs (Yost et al, 2005). The verification test setup consisted of 2 LVDTs mounted on tripods 19
connected to a data acquisition system and two sets of digital cameras as shown in Figure 4. 20

1
FIGURE 4 LVDT and DIC Verification Setup for VAB. 2
Using ambient traffic excitation, bridge deflections were captured using both the LVDTs and 3
DIC at the same locations. Sampling rates of the LVDT and DIC were 60 Hz and 1 Hz, 4
respectively. Figure 5 shows correlation of captured data for three minutes during a typical 5
weekday afternoon at the VAB. These results support the use of DIC for bridge deflection 6
measurements. The placement of the camera with respect to each other and target also play a 7
large role in the veracity of the collected information. These parameters were studied in the 8
laboratory at the University of New Hampshire. These laboratory experiments showed the DIC 9
was most reliability when a 90-degree angle was maintained between the camera set-up and the 10
target. This configuration can be difficult to achieve during a bridge test. This information is 11
used to evaluate measurement collected with configurations possible given the bridge site 12
geometry. 13

1
FIGURE 5 Comparison of deflection measurement collected via LVDT and DIC for the 2
Vernon Ave. Bridge. 3
Static Load Test 4
The September 3, 2009 load test used a 72-kip (320 kN) dump truck driving across the bridge 5
several times at various locations and speeds. Two different types of pseudo-static tests were 6
conducted, a crawl speed and stop location. In the crawl speed tests, the truck simply drove 7
across the bridge at low speed, approximately 4 mph. In the stop location tests, the truck stop for 8
30-seconds as each of the 14 stations along the length of the bridge, marked on Figure 5. For 9
each test type, the truck followed three different lanes down the length of the bridge: one on the 10
west side, one in the center, and one on the east side with 14 stations or stop locations, as shown 11
in Figure 5. 12
For each test, 200 Hz data acquisition was initiated when the truck was at station #0 and 13
continued unti lthe truck was past station #14, as marked on Figure 6. During the stop location 14
test, the truck stopped for approximately 10 seconds at each station before traveling to the next 15
one to allow any dynamic excitation to dissipate. After 10 seconds at the final stop (#14), the 16
truck rolled forward until the rear axles were clear of the bridge. In addition, to the installed 17
instrumention, two DIC set ups were used to collect deflection at the mid-span (station #8) and 18
south span (approximately station #4). 19
-0.008
-0.006
-0.004
-0.002
0
0.002
0.004
0 30 60 90 120 150 180
Dis
pla
cem
ent
(in
)
Time (s)
LVDT - Digital Image Correlation Verification for the Vernon
Ave Bridge
Beam 2 LVDT
Low Speed DIC

Mid-Span DIC 1
The cameras were mounted on separate tripods about t10-feet (3.04 m) apart to allow enough 2
separation distance to get data in all three directions. The camera set up was located 3
approximately 50-feet (15.2 m) from and 10-12 feet (3.04- 3.66 m) below the face of the girder. 4
Although the girder was in the shadow of the concrete deck above, the ambient light was 5
sufficient to acquire data without lamps being used. There are two speckle patterns on the center 6
span of the bridge. The smaller pattern was used for given the level of deflection expected and 7
the distance of the cameras from the target area, as shown in Figure 7. 8
FIGURE 6 Plan View of the VAB with Load Test Paths.

1
FIGURE 7 Mid-Span DIC Setup on the VAB. 2
South Span DIC 3
The measurement location at the south span was over dry land, therefore the cameras very 4
setup approximately 10 feet (3.04 m) from the target along the same horizontal line of sight. The 5
cameras were set up on the same tripod about 18 inches (45.7 cm) apart, still allowing for three-6
dimensional data acquisition, see Figure 8. Given the close proximity of the DIC set up, chalk 7
was used for the speckle pattern. The white chalk provided a high-contract pattern on the 8
weathering steel surface. 9
10
FIGURE 8 DIC Setup at the South Span of the VAB 11

Digital Image Correlation Results 1
As part of the project, a structural model was created in SAP2000®, see Figure 9. This model 2
was calibrated with respect to the collected strain data (Lefebvre, 2010). The model updates for 3
the calibration included using concrete material properties from test cylinders collected during 4
the deck pour, linear springs to represent the neoprene bearing pad boundary conditions, the 5
inclusion of the safety curb on the east side of the bridge and the inclusion of reinforcing steel in 6
the concrete deck. Each one of these updated were based on engineering judgment and 7
observations made during the bridge construction. 8
9
FIGURE 9 Structural Model of the VAB created in SAP2000. 10
The collected deflection measurements were evaluated with respect to the predicted 11
deflection from the structural model. Given that both DIC set ups were located on the east side 12
of the bridge, only the results from the western-most load path, Path 1, are included in this paper, 13
see Figure 10. The structural model was calibrated using strain data crawl speed tests from all 14
three truck load lanes. 15
16
17
FIGURE 10 SAP2000 Structural Model of the VAB with Truck Load 18
Deflection measurements are reported directly on the SAP2000® GUI, which made for a 19
quick comparison of modeled to measured data. The comparison between DIC deflections and 20

modeled deflections show a reasonable correlation. The comparison also improves with the 1
updated model. Figure 11 and Figure 12 give a comparison between collected vertical 2
deflections collected during the Lane 1 truck stop test using DIC and both the original and final 3
updated model for the mid-span and south span respectively. Each truck stop test took 4
approximately six minutes (360 seconds) including 45 seconds of ambient data prior to the truck 5
driving onto the bridge. This time is shown on the x-axis for Figures 11 and 12. In the collected 6
data, the “plateaus” of data in the time domain are visible, evidence of the truck stops. There is a 7
single deflection value for each truck stop from the structural models, original and updated. 8
9
FIGURE 11 Comparison of Vertical Deflections near midspan of west exterior girder for 10
truck in Lane 1 11
12
13
FIGURE 12 Comparison of Vertical Deflections in south span of west exterior girder for 14
truck in Lane 1 15
-0.25
-0.2
-0.15
-0.1
-0.05
0
0.05
0 50 100 150 200 250 300 350
De
fle
cti
on
(in
)
Time (s)
Vertical Deflection of Vernon Ave Bridge near MidspanTruck in West Lane
DIC Data
Original Model
Updated Model
-0.05
-0.04
-0.03
-0.02
-0.01
0
0.01
0.02
0.03
0.04
0 50 100 150 200 250 300 350
De
fle
ctio
n (
in)
Time (s)
Vertical Deflection of Vernon Ave Bridge at South SpanTruck in West Lane
DIC Data
Original Model
Updated Model

Remarks 1
These collected results are encouraging. The DIC system is clearly able to collected data that 2
is reflective of the predicted bridge behavior. The accuracy of this collected is far less than the 3
accuracy of DIC when used in a controlled laboratory setting. Additional field applications of 4
this DIC system are planned for the VAB as well as multiple bridges in the Northeast United 5
States during summer 2010. 6
CONCLUSIONS 7
Digital image correlation has many benefits that make it an attractive choice for a method 8
of non-contact structural health monitoring. DIC requires a relatively short period of time for 9
setup and break down and can easily be operated by a crew of two without any special 10
equipment. Another advantage is that DIC can be used without the interruption of traffic. As 11
methods are improved upon DIC deflection data may be used for the calibration of computer 12
models. Deflection data is a measure of the global response of the bridge. Therefore the 13
information collected is highly valuable in the structural model calibration process. This type of 14
global measurement limits the local behavior concerns that are associated with other traditional 15
SHM measurements such as strain. 16
Structural modeling can be combined with SHM for many purposes, including 17
instrumentation placement, data quality assessment, design verification, bridge assessment and 18
management, and load rating. Load ratings based on calibrated structural models can 19
significantly mitigate the level of subjectivity that exists in conventional load ratings (Yost et. al, 20
2005). Global measurements of bridge performance, such as deflection, can be used to calibrate 21
a structural model and create a structural baseline model. This structural baseline model can be 22
used as a signature to capture changes in the bridge structural performance. The ease of 23
application of DIC makes this technology very attractive for the periodic noncontact capture of 24
bridge performance. 25
26
ACKNOWLEDGEMENTS 27
This research was partially supported by the CAREER program at the NSF (Grant 28
#0644683), the Partnerships for Innovation program at the NSF (Grant #0650258), the Major 29
Research Instrumentation Program (Grant #0821517). The authors would like to thank the 30
Geocomp Corporation for their efforts installing the instrumentation system, the Massachusetts 31
Highway Department for allowing us to work on this project, and the Massachusetts Department 32
of Transportation for their continued support with the instrumentation system and load testing. 33
REFERENCES 34
AASHTO. (2008A). Bridging the Gap-Restoring and Rebuilding the Nation's Bridges. 35
Washington, D.C., American Association of State Highway and Transportation Officials. 36
AASHTO. (2008B). Maunal for Bridge Evaluation. Washington: AASHTO ASCE. (2010). 37
Report Card for America's Infrastructure. http://www.infrastructurereportcard.org/. Accessed 38
April 22, 2010. 39
ASCE. (2010). Report Card for America's Infrastructure., 40
http://www.infrastructurereportcard.org/ Accessed: April 22, 2010. 41

Benmokrane, B., El-Salakawy, E., El-Ragaby, A., & Lackey, T. (2006). Designing and Testing 1
of Concrete Bridge Decks Reinforced with Glass FRP Bars. ASCE Journal of Bridge 2
Engineering, 217-229. 3
Catbas, F. N., Brown, D. L., and Aktan, A. E. (2004). “Parameter estimation for multiple-input 4
multiple-output modal analysis of large structures.” Journal of Engineering Mechanics, 5
130(8), 921–930. 6
Chang, F.K. (2003). “Structural Health Monitoring 2003: From Diagnostics & Prognostics to 7
Structural Health Management, Proc. 4th International Workshop on Structural Health 8
Monitoring, DEStech, Stanford, CA. 9
Fraser, M. , Elgamal, A., He. X. and Conte. J.P. (2010). “Sensor Network for Structural Health 10
Monitoring o a Highway Bridge,” Journal of Computing in Civil Engineering, ASCE 24(4) 11
11-24. 12
Fuchs, P. A., Washer, G. A., Chase, S. B., & Moore, M. (2004). Laser-Based Instrumentation for 13
Bridge Load Testing. Journal of Performance of Constructed Facilities, ASCE Nov 213-219. 14
Gamache, R., and Santini-Bell, E. (2009). Non-intrusive Digital Optical Means to Develop 15
Bridge Performance Information. Non-Destructive Testing in Civil Engineering . 16
ISHMII (2006). “Structural Health Monitoring seen as essential for FHWA vision.” International 17
Society for Structural Health Monitoring of Intelligent Infrastructure. 18
http://www.ishmii.org/News/forFHWAvision. 19
ISHMII (2010). International Society for Structural Health Monitoring of Intelligent 20
Infrastructure . Retrieved March 31, 2010, from Definitions: 21
http://www.ishmii.org/Literature/SHMGlossaryDefinitions.html 22
Lee, J.J. and Shinozuka, M. (2006A). “A vision-based system for remote sensing of bridge 23
displacement,” NDT & E International, Elsevier, 39(2006), 425-431. 24
Lee, J. J., & Shinozuka, M. (2006B). “Real-Time Displacement Measurement of a Flexible 25
Bridge Using Digital Image Processing Techniques”. Experimental Mechanics (46), 105-114. 26
Mayer, L., Yanev, B., Olson, L., D., and Smyth, A. W. (2010). “Monitoring of the Manhatten 27
Bridge for Vertical and Torsional Performance with GPS and Interferometric Radar System”. 28
Proceedings of the 2010 Transportation Research Board Annual Meeting. Washington, D.C. 29
McLaughlin, K., Kasikci, T., Tsukrov, I., and Kinsey, B. L. (2009) “Investigation of Stress 30
Concentration Factor in Analytical Stress Based Forming Limit Criterion”, accepted to the 31
2009 International Manufacturing Science and Engineering Conference, West Lafayette, IN, 32
Oct. 4-7. 33
Phares, B. M., Rolander, D. D., Graybeal, B. A., & Washer, G. A. (2001). Reliability of Visual 34
Inspection. Public Roads , 64 (5). 35
Riad, M. Y., Shourky, S.N. and William, G.W. (2006). “Remote Health Monitoring and Modeling 36
of Star City Bridge, West Virginia.” Proc. of 2006 Transportation Research Board, No. P06-37
2843. 38
Rodriguez, T. and Garcia, N. (2010). “An adaptive real-time monitoring system.” Machine 39
Vision and Applications, 21:555-576 40

Santini-Bell, E., Sanayei, M. Javdekar, C.N. and Slavsky, E. (2007). “Multi-Response Parameter 1
Estimation for Finite Element Model Updating Using Non-Destructive Test Data.” 2
Journal of Structural Engineering, ASCE 133(4):1068-1079. 3
Santini-Bell, E. M. and Sipple, J.D. (2009). “Special Topics Studies for Baseline Structural 4
Modeling for Condition Assessment of In-Service Bridge,” Safety and Reliability of Bridge 5
Structures, ed. Khaled M. Mahmoud, CRC Press, pp. 273-289. 6
Santini-Bell, E.M., Sipple, J.D., Lefebvre, P., Phelps, J.E., Brenner, B. and Sanayei, M., (2010). 7
“Instrumentation, Modeling and Monitoring of a Concrete Bridge from Construction through 8
Service,” Proceedings of the 2010 TRB Annual Meeting, Washington, D.C. 2010 9
Wahdeh, A. M., Caffrey, J.P., Masri, S. F. (2003). “A vision-based approach for the direct 10
measurement of displacements in vibrating systems”, Smart Material Structures, 2003(12), 11
7850794. 12
Wang, M. L. (2008). Long term Health Monitoring of Post-Tensioning Box Girder Bridges. 13
International Journal of Smart Structures and Systems , 711-726 14
Yost, J.R., Schulz, J.L., and Commander, B.C., (2005) “Using NDT Data for Finite Element 15
Model Calibration and Load Rating of Bridges.” Proceedings of the 2005 Structures 16
Congress and the 2005 Forensic Engineering Symposium, Vol. 171, pp. 3. 17