digital mapping in support of recovery planning for the ... · digital mapping in support of...
TRANSCRIPT

1
Digital Mapping in Support of Recovery Planning for the Northern Jaguar1
Eric W. Sanderson* and Kim Fisher Global Conservation Programs Wildlife Conservation Society 2300 Southern Blvd Bronx NY 10460 USA Contact info for Eric Sanderson* Phone: 718-220-6825 Email: [email protected] Summary All project objectives and outcomes, as outlined below, were accomplished on schedule, including development of a database of relevant jaguar observations from historic times forward to the present, a geographic information system (GIS) database of spatial data appropriate for mapping the jaguar’s range and considering questions of its conservation and recovery, and a simple habitat model based on a modification of the Hatten et al. 2005 model for Arizona. We also worked with the team to develop a spatially explicit system of subunits within the team’s definition of an analysis unit that cross the US / Mexico border; these subunits correspond to units described in a jaguar meta-population model also developed by the recovery team. Accompanying this report, please find a data package consisting of a DVD containing GIS files and a Microsoft Access database described below. Project Objectives and Outcomes The overall objective of this project is to assist the U.S. Fish and Wildlife Service (USFWS) in digital mapping aspects of recovery planning for the northern jaguar. Through the modified cooperative agreement, the Wildlife Conservation Society (WCS) agreed to:
1. Circulate a questionnaire in advance of the January 2011 Northern Jaguar Population Viability Analysis (PVA) Workshop to elicit needed feedback from Team members and collect information from the existing scientific literature or use data available from the Delphi survey conducted by USFWS.
2. Work with the Team to develop the following georeferenced spatial data layers (hereafter GIS layers) in a customized geographic information system (GIS) database with appropriate FGDC metadata documentation. Additional information will be drawn from literature sources referenced in the recent summaries of jaguar sightings relevant to the northern jaguar population and contained in a cross-referenced relational database format (e.g. Microsoft Access):
a) Recent attributed jaguar sightings, developed from existing sources and recovery team members
b) Historical attributed jaguar sightings, developed from existing sources and recovery team
members
c) The spatial extent of jaguar range recently occupied as synthesized by recovery team members
1 Final report under agreement F11AC00036 (and modification #0001) between the U.S. Fish and Wildlife Service and the
Wildlife Conservation Society. Report revised July 12, 2011.

2
d) The spatial extent of recent self-sustaining jaguar populations as synthesized by recovery
team members. These extents were revised based on additional data identified by recovery team and USFWS between the PVA and PHVA workshops such that the entire study area as an analysis unit for the Team was described.
e) A base map of topography, watercourses, land cover, populated places, roads, administrative units, the border pedestrian fence, border vehicle fence, and other publicly available datasets that depict variables in support of population viability and habitat analysis. It is expected there may be some variation in data quality/resolution across the international border and between states. The recovery team will determine parameters of the aforementioned variables.
f) Simple habitat models (developed at the workshops based on queries and weighted combinations of geographic layers) using information from deliverables 1-5 and the variable parameters determined by the recovery team. In addition, prepare habitat models based on cross-boundary uniform datasets using a modification of the Hatten et al. 2005 method.
2. Present draft GIS layers at the January 2011 PVA (population viability analysis) workshop for feedback from the Team.
3. Present revised GIS layers at the March 2011 Population and Habitat Viability Assessment (PHVA)
workshop for feedback from the Team.
4. Submit final GIS layers to the Arizona Ecological Services Office of the U.S. Fish and Wildlife Service by April 30, 211. All GIS work will be done using ESRI’s ArcGIS package. GIS layers will be presented as shapefiles and/or as a personal geodatabases.
Objective 1: Data Collection from the Recovery Team Members WCS digitized the Delphi results from the team members and prepared maps presented at the PVA workshop showing the team the individual results and how they overlaid. The recovery team then worked through several versions of an “analysis” unit of the jaguar over the course of the two workshops and in the intervening period between workshops, which WCS digitized and revised according to instructions from the team, including a system of subunits. The final version of the analysis unit with subdivision is provided in the data package and corresponds to subunits of the meta-population model developed by the Conservation Breeding Specialist Group (CBSG) under a separate agreement and reported elsewhere. We also worked with the recovery team to develop maps for an upcoming call for proposal about jaguar monitoring along the US border. Objective 2: Develop Digital Mapping Layers to Support Recovery Team Objectives 2a/2b: Jaguar event database For the United States and the northern states of Mexico, we compiled a database of jaguar observations using a record / event framework. An event refers to the experience of a person observing a jaguar. Events happen at a given place, at a given time, and vary in kind. Kinds of events include mortalities (when a person kills a jaguar), sightings (when a person observes a jaguar), observations of scat or sign attributed to a jaguar, or no observations (when a qualified person looks for a jaguar but does not see one.) Events result in a memory on behalf of the observer(s) and may also result in physical evidence (like a skull, skin or photograph.) Events are also commonly recorded, resulting in a record. A record is a written, graphical or verbal account of a jaguar event. Written records occur in newspapers, books, scientific journals, and ideally can be cited and rest in the public domain. Graphical records include photographs, paintings, or other human created representations of a jaguar (like a

3
figurine of a jaguar). Verbal records are accounts of the event, either by someone with first hand experience, or someone who heard the story from someone else. The presence of jaguars in the study region over time has generated a rich and interwoven literature that traces back to the first written records of Coronado in 1540. Cultural references and fossil records are also part of the history of jaguar in the region, and some of those records stretch back to the Pleistocene, more than 10,000 years before present. Each document in this literature comprises a history. A “history” is defined as a discovery, collection and analysis of information about past events. Historiography is the study of the history and methodology of the discipline of history. Although most of the writers about jaguars in the study region would not identify themselves as historians, in fact they have been practicing history – discovering, collecting and analyzing information about past events, in this case, events regarding jaguars. Many of these histories of the jaguars have been written not only for fact-finding purposes, but also to make an argument about the presence of jaguars in this region, and in particular, within the United States. These arguments are critical to the considerations of the USFWS recovery team. Although there is considerable variation in emphasis, there seem to be two competing theories about the historical presence of the jaguar in the United States:
“The Theory of the Wandering Jaguar” - This theory purports that jaguars have never been part of the fauna of the United States, but rather represent jaguars dispersing out of Mexico, following the chain of sky islands into Arizona and New Mexico. Writers point to the disproportionate number of males rather than females observed, inferences about the quality of habitat, and the relatively speaking small number of observations over time. Some writers also dispute some events as not representing natural jaguar populations, but are rather the result of jaguars introduced by people for purposes of hunting (Rabinowitz 1999). “The Theory of the Dispossessed Jaguar” – This theory suggests that jaguars were part of the fauna of the United States but were expelled through a concerted program of hunting by livestock interests and by government control, especially during the twentieth century. Ironically some of the best documented events of jaguars in the United States are mortalities caused by government hunters (Brown 1983).
Complicating interpretation of these two theories are the restrictions various writers use in documenting their histories. Some writers choose arbitrary spatial extents (e.g. the Southwest US or Arizona), others choose arbitrary temporal extents (e.g. observations only since 1900.) In part these choices are driven by practical considerations about how much material to include and what can be legibly be summarized on a written page, however in making these summaries of events, writers intentionally or unintentionally may shade the records to support their particular theory. This observation is not meant to impugn the writers, but of course one of the roles of the expert is to interpret the observations and to help the amateur or the person with less time come to some conclusions, however for the purposes of the jaguar recovery team, it seemed important to open up this historical treasure trove and to make it all available, in the words of all the writers, for the team to base its discussions on. To this end, in support of the recovery team, the Wildlife Conservation Society created a relational database in Microsoft Access of jaguar events, summarizing as many records as we could practically handle during the grant period. This database is included in the data package. As the recovery team conversations ranged over a wide geography in Mexico and the United States, we did not bind our investigations with any a priori definitions of historical time period or geographic extent (beyond a southern limit, eventually determined by the team to include Sinaloa state in Mexico. We continued this line eastward across Mexico at approximately latitude 107 deg N). Within this database we compiled records, including the exact text of the descriptions of the jaguar event, and recording the exact text of the date and place descriptions. We also tracked citations between histories (described as “references” in the relational database structures.) If one reference cited another, we documented that citation and then followed that reference back to its source. In this way we sought to the extent possible, within the

4
amount of effort, available to document the “original” records, as close as possible to the events, without filtering or interpretation. As of this report , the database includes 1,045 records describing 430 distinct events compiled from 52 references (which then cite another 255 references). These 52 references are provided in Appendix 1. Note that an event is defined by the unique combination of place, time and kind of event; in some cases, multiple events may refer to the same jaguar (e.g. Macho B was observed several times over a period of several years; each observation would be cataloged as an individual event.) In general however, most events are scattered enough in time and space, it is unlikely the same jaguar is being counted twice. Note that some individuals and organizations who supplied records for the database asked that these records not be forwarded to US Fish and Wildlife Service, so these records have been deleted from the submitted database. Although the database represents an extensive investigation of these jaguar records, the database cannot be described as exhaustive. Further investigation would likely uncover additional events and certainly additional records. The database is structured around three main tables within a Microsoft Access database: events, records, and events x records. The event table lists all the distinct events, as described above, the records table includes the data from individual records, including the full textual descriptions, and the event x records, shows which records belong to which events. Each event is given a unique numeric id (EventID), and each record also has a unique numeric id (RecordID); events are also given textual names for easy reference comprised of the observer’s name, year of the event, and place name (e.g. Harris 1939 Ramanote Canyon AZ). A form has been constructed which organizes the data by event, so that the user can read easily all the records associated with each event. ThisThese data was also used to generate large printouts of events and records for the PVA and PHVA workshops with the recovery team. Events are also coded by decade, event type, state, what was observed (jaguar or something else), and evidence type. Subtables provide these details within the Access database. We also produced GIS shapefiles of the events keyed by EventID for 333 of the jaguar events. Locating points in space representing events is difficult and inexact because the great majority of events do not include exact geographic coordinates. Some events were undeemed unmappable because the locality descriptions were too coarse or inexact. Most mapped event localities are described according to place names (e.g. Chiricahua Mountains, near Kimble TX). We placed points in the centers of specific geographic features to the extent we could ascertain using the data layers described below, the ESRI Basemaps (which are available through the ArcGIS software), and Google Earth and Google Maps. Cartographically we felt it best to show the ambiguity of location by encircling each point with a red circle based on the diameter of a male jaguar home range. We explored trying to map the polygons for mountain ranges (based on analysis of the terrain roughness data), but were not able to pursue this problem far enough to implement it across the entire dataset. The placement of points has implications for the habitat model described below. One inescapable conclusion that emerges from the study of the jaguar events completed so far is that the jaguar’s distribution the United States has changed dramatically over time. These changes have consequences in establishing a reference condition toward which to conserve and restore the jaguar under the terms of the Endangered Species Act. This conclusion was presented to the recovery team for discussion at the March 2011 PHVA meeting. In turn these decisions about what describes the “historical range of the jaguar” create the frame or context for how range-wide conservation of the jaguar is defined (for a previous treatment of this question see Sanderson et al. 2002). Understanding the ecological context of a species range – its extent and ecosystem variation – is considered essential to the conservation planning process (Redford et al. 2011; IUCN/SSC 2008). Objective 2c. Synthesis of jaguar range The recovery team did not complete a synthesis of the jaguar range during the term of this agreement, except in terms of the analysis unit described under Objective 1. Questions regarding what range to plan across depend on questions of what time period is an appropriate reference for USFWS planning efforts. This point was made at the March 2011 PHVA meeting. If and when the recovery team and USFWS make a decision regarding this point, the

5
data developed through this agreement can be used to make a map indicating the recovery team’s best judgment of the jaguar range. Objective 2d. Synthesis of self-sustaining populations As described under objective 1, we created a GIS layer describing the analysis unit and subunits, which were then subjected to population viability analysis by the CBSG team. Objective 2e. Development of data layers for habitat mapping We downloaded, synthesized and developed a large GIS database to support recovery team efforts. All data layers were projected to a common geographic coordinate system, documented with FGDC metadata, symbolized, and used to generate maps for the PVA and PHVA workshops. We also digitized maps provided by USFWS describing the extent of the border fence, compiling as complete as possible version of the fence as these data provided. All of these data are all included in the data package and are listed below.
Ob-jective
Theme Dataset Source Notes Used in habitat analysis (2f)
Files/ directories
2e Jaguar BorderCats Working Group occurrence points and conservation unit polygons
Kurt Menke ([email protected])
After data reconciliation efforts, decided not to use.
\bordercats
Range-wide priority setting for jaguar
Wildlife Conservation Society; Sanderson et al. 2002; Zeller et al. 2007
2006 data based on revision of 1999 dataset
\RWPS
2e Political
US states and counties
US Census (http://www.census.gov/geo/www/cob/st2000.html and http://www.census.gov/geo/www/cob/co2000.html)
Borders edited to match those of Mexican muncipios/states (from ESRI data). I elected to edit the US borders rather than Mexican because the US borders are generalized (http://www.census.gov/geo/www/cob/scale.html) and the Mexican borders most closely match the Rio Grande.
\uscensus
Mexican states and muncipios
ESRI data disc packaged with ArcGIS. 2006.
\esri

6
US-Mexico border (line)
Derived from US Census and ESRI data
All other border-related data (including fence segments) based on this line.
\uscensus
2e Protected areas
CBI Protected Areas 1.1 - AZ, CA, NM, TX
http://app.databasin.org/app/pages/galleryPage.jsp?id=4b2e6723283241bd84c42a649d2ec073#tabId=datasetsTab&sortField=createDate&ascending=false
PADUS 1.1 (CBI edition). US only.
\PAs\CBI
CEC terrestrial protected areas 2008
http://www.cec.org/Page.asp?PageID=122&ContentID=1327&SiteNodeID=499&BL_ExpandID=
\PAs\CEC_NA_PA_GEO_07_08
WDPA Protected Areas 2010 - MX
http://www.wdpa.org/AnnualRelease.aspx
Mexico only. \WDPA2010
GAP stewardship http://fws-nmcfwru.nmsu.edu/swregap/Stewardship/Default.htm
No data for CA, TX, or Mexican states.
\GAP\stewardship
2e Elev-ation
ASTER DEM (30m) https://wist.echo.nasa.gov/wist-bin/api/ims.cgi?mode=MAINSRCH&JS=1 "ASTER GDEM is a product of METI and NASA."
ASTERcat2 raster catalog reflects raw downloaded tiles extents. dem_aea1k is tiles mosaicked, then resampled to 1k cellsize. V2 reflects addition of southern tiles to cover expanded AOI.
X
\DEM\v2
2e Hydro-graphy
NHD (USGS) hydrography - AZ, CA, NM, TX
ftp://nhdftp.usgs.gov/DataSets/Staged/States/FileGDB/HighResolution
US side only. \usgs\NHD
HydroSHEDS http://gisdata.usgs.gov/website/HydroSHEDS/viewer.php
Cross-border. X
\usgs\hydroSHEDS
INEGI rivers and lakes
http://www.inegi.org.mx/geo/contenidos/recnat/hidrologia/InfoEscala.aspx
Mexico only. \INEGI
2e Eco-region
WWF ecoregions http://www.worldwildlife.org/science/data/item63
X
\ecoregions\wwf

7
s 73.html
TNC ecoregions http://conserveonline.org/workspaces/ecoregional.shapefile/
\ecoregions\tnc
Brown and Lowe 1980 Biotic Communities of the Southwest
US Forest Service General Technical Report RM-78
Doesn't cover entire area of interest.
\landcover\Brown_and_Lowe_TNC
2e Land-cover
GAP land cover http://earth.gis.usu.edu/swgap/landcover.html
No data for CA, TX, or Mexican states.
\GAP\landcover
VCF tree cover (MODIS)
https://lpdaac.usgs.gov/lpdaac/products/modis_products_table/vegetation_conversion_continuous_fields/yearly_l3_global_500m/mod44b
Cross-border; best observed landcover correlation with observations.
X
\VCF\treecover
GLC2000 (EC Joint Commission GEM) land cover
http://bioval.jrc.ec.europa.eu/products/glc2000/products.php
\landcover\GEM
INEGI land cover and vegetation density
http://www.inegi.org.mx/geo/contenidos/recnat/usosuelo/inf_e1m.aspx
\INEGI
2e Habitat
USFWS Critical Habitat designations
http://criticalhabitat.fws.gov/
\fws
Multi-species wildland block linkage corridors
http://corridordesign.org/linkages/arizona
Specific AZ corridors only.
\corridordesign.org
2e Prey SWReGAP species distributions: white-tailed deer, peccary, wapiti, white-nosed coati
http://fws-nmcfwru.nmsu.edu/swregap/
Workshop participants: not useful.
\GAP
2e Human WCS Human Influence Index
http://sedac.ciesin.columbia.edu/wildareas/
Human influence index (HII) -- non-normalized scores
X
\WCS
Population density CIESIN Gridded Population of the World http://sedac.ciesin.columbia.edu/gpw
\population_density
Objective 2f. Development of simple habitat maps for the northern jaguar We used a subset of the data layers described under objective 2e. to produce several iterations of a simple habitat map following a modification of the Hatten et al. 2005 method. Iteration of the model were developed in concert with the recovery team. This model is only advisory; US Fish and Wildlife Service stated that they will produce the
8
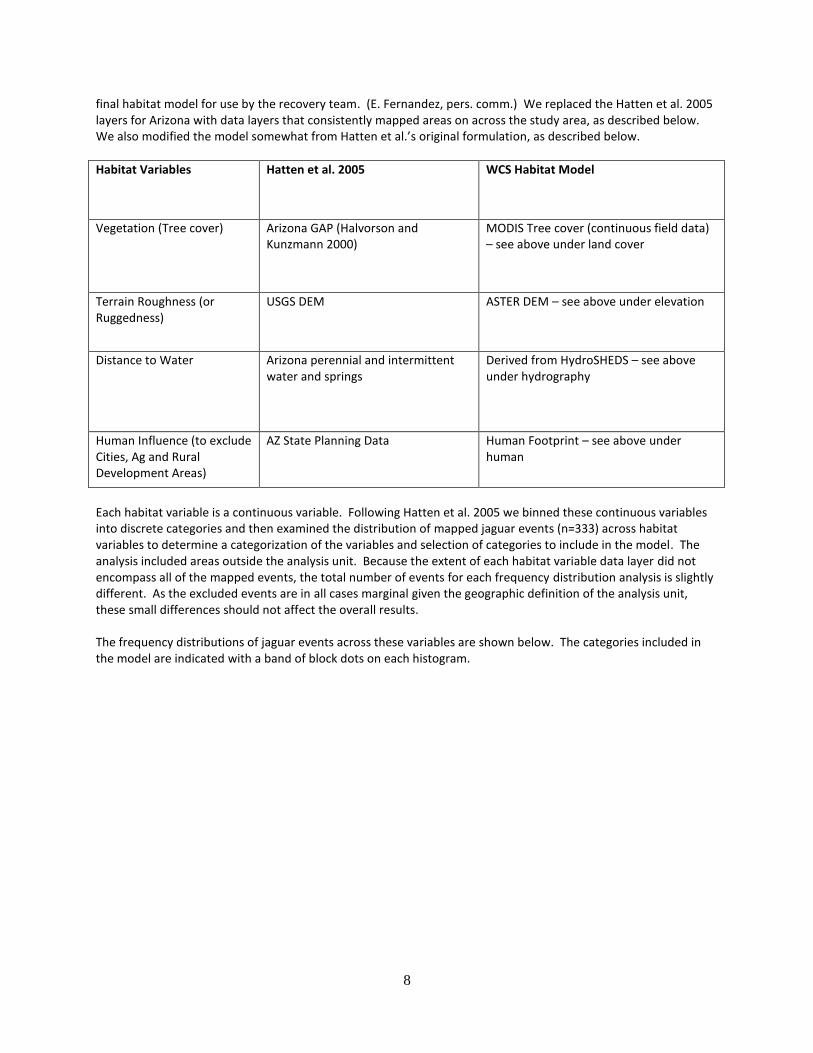
final habitat model for use by the recovery team. (E. Fernandez, pers. comm.) We replaced the Hatten et al. 2005 layers for Arizona with data layers that consistently mapped areas on across the study area, as described below. We also modified the model somewhat from Hatten et al.’s original formulation, as described below.
Habitat Variables Hatten et al. 2005 WCS Habitat Model
Vegetation (Tree cover) Arizona GAP (Halvorson and Kunzmann 2000)
MODIS Tree cover (continuous field data) – see above under land cover
Terrain Roughness (or Ruggedness)
USGS DEM ASTER DEM – see above under elevation
Distance to Water Arizona perennial and intermittent water and springs
Derived from HydroSHEDS – see above under hydrography
Human Influence (to exclude Cities, Ag and Rural Development Areas)
AZ State Planning Data Human Footprint – see above under human
Each habitat variable is a continuous variable. Following Hatten et al. 2005 we binned these continuous variables into discrete categories and then examined the distribution of mapped jaguar events (n=333) across habitat variables to determine a categorization of the variables and selection of categories to include in the model. The analysis included areas outside the analysis unit. Because the extent of each habitat variable data layer did not encompass all of the mapped events, the total number of events for each frequency distribution analysis is slightly different. As the excluded events are in all cases marginal given the geographic definition of the analysis unit, these small differences should not affect the overall results. The frequency distributions of jaguar events across these variables are shown below. The categories included in the model are indicated with a band of block dots on each histogram.

9

10

11
We presented and discussed these frequency distributions with the recovery team. Using the GIS, we then reclassified each layer into a binary map, as follows:
Variable 1 0
Tree cover 3-60% tree cover < 3% or > 60% tree cover
Ruggedness intermediate, moderate, and high ruggedness
Level, nearly level, and extreme ruggedness
Distance from Water <10 km of water > 10 km from water
Human influence HII < 30 HII >= 30
From these discussions we developed the following potential habitat model: Jaguar Potential Habitat Model (values range from 0 – 5.0) =
([3-60% tree cover] + [intermediate, moderate, and high ruggedness]) (0-2) *
[Within 10km of water] (0-1) *
[HII < 30] (0-1) *
[Potential habitat type weight] (0.1-2.5) Note that the tree cover and ruggedness variable are included additively reflecting the recovery team’s uncertainty about the appropriate categorization for these variables. Although jaguars are generally thought to use primarily areas with moderate tree cover within the study region, they could potentially use lower or higher cover areas, as indicated by the analysis; tree cover is not biologically required per se. Similarly jaguar are generally found within areas of intermediate to moderate ruggedness, but could be found in less rugged or more rugged areas. It is not clear whether the preference for topographic ruggedness is a response to human pressure, prey distributions or some other aspect of jaguar ecology. Including the variables like these with uncertain relationships to species biology means that areas classed as 0 for these variables may still be included in the model. In contrast, other variables, like distance to water and human influence, were considered essential to jaguars and therefore to the model; therefore they are included multiplicatively. Areas more than 10 km from water and with a human influence score of 30 or more were excluded from the model by assigning those areas a zero. Jaguars are thought to need freshwater sources for drinking and to avoid areas with too much human pressure (though exceptions to both these overall patterns are noted.) We also weighted the model according to potential habitat type, to represent the recovery team’s sense of the suitability of different habitat types in terms of prey and cover. The potential habitat types were defined by the ecoregions that overlap the analysis unit. The recovery team examined the density of jaguars observed in some of these ecoregions and relative abundance based on their experience in others to advise on the generation of these weights. In general these weights reflect increasing habitat value in southern parts of the analysis unit relative to ecoregions in the northern part of the unit and abundance related to tropical forest types, shrubland and grassland habitats.
Potential habitat type Relative weight
Jalisco dry forest 2.5
Sinaloan dry forest 2

12
Northern Mesoamerican Pacific mangroves 1.5
Sonoran-Sinaloan transition subtropical dry forest ("thornscrub") 1
Trans-Mexican Volcanic Belt pine-oak forests 0.25
Sierra Madre Occidental pine-oak forests 0.25
Arizona Mountains forests 0.25
Chihuahuan desert 0.1
Sonoran desert 0.1
The resulting map looks shows darker red colors indicating higher suitability values, and lighter colors indicating lower suitability.
Finally we rescaled the jaguar suitability map to represent carrying capacity for jaguar by placing seven known density estimates for jaguars in their study areas, calculating the average suitability in those study areas, and then creating a regression between the habitat suitability scores and the density estimates. We summarized densities from seven studies and compared them to corresponding average habitat suitability within the study areas as follows:

13
Study Average habitat
suitability Density
(jaguars/100 km2) Source
Jalisco-Sinaloa I 3.0 2.8 Núñez-Pérez 2011
Jalisco-Sinaloa II 1.4 6.0 R. Núñez (pers. comm.)
Jalisco-Sinaloa III 2.6 5.3 R. Núñez (pers. comm.)
Jalisco-Sinaloa IV 2.3 2.5 Coronel-Arellano et al. In press
Sonora I 0.6 1.4 Gutierrez-Gonzalez et al. In press
Sonora II 1.3 1.2 Lopez-Gonzalez and Moreno Arzate 2011. Lopez Gonzalez et al. In press
Arizona I 0.1 0.2 McCain and Childs 2008
Recovery team members provided density estimates for the first six studies in Mexico; the McCain and Childs estimate is based on their reported study area size and the number of individual jaguars seen during that study. The regression equation indicates that for any habitat cell, the relationship of potential density to habitat suitability is
Potential density = 1.56 * Habitat Suitability Score Note that the model is calculated to force the y-intercept of the regression through zero, since zero habitat suitability should be associated with potentially no jaguars. The regression equation was not analyzed for significance or linearity, but in general higher densities are associated with higher suitability values, though there is considerable variability. Clearly it would be desirable to have more density measurements to establish this relationship with more certainty.
From this regression equation we estimated potential jaguar carrying capacities for each of the analysis unit sub-units, corresponding to the metapopulation model developed by Dr. Phil Miller of CBSG. Since densities were based on number of adult animals, the potential carrying capacity should also be considered for adult animals (of both sexes.) However the predicted carrying capacities might be higher if the areas where the density studies were conducted were not at carrying capacity themselves. In any case these estimates should be used cautiously as

14
they include uncertainties associated with the habitat suitability model and variation in density with respect to the habitat model. Further details may be available in the CBSG report on the population viability model.
Population subunit Estimated number of potential jaguars (i.e. carrying capacity)
MX Sinaloa Sub-Population 1410
MX North Sinaloa Connector Area 1198
MX Sonora Sub-Population 1670
MX Northern Sonora Connector Area 135
US South of I-10 Highway 27
US North of I-10 Highway* 74
Total 4513
*Note: This subunit has been removed from the current definition of the Northern Jaguar Recovery Unit, but remains an entity in the population viability analysis presented elsewhere. In summary, the following data layers/datasets were generated during the course of this project.
Objective Dataset Source Notes Used in habitat analysis (2f)
Files/directories
1 Jaguar monitoring RFP areas and lines
Recovery team discussions
Amended to ensure non-overlap with Tohono O'odham nation
X
\RecoveryTeam\monitoring.mdb
1 Expert-opinion range polygons for pre-1973, 1973-1997, post-1997, and recovery
Digitized and organized from Delphi questionnaire respondents
\delphi\jaguars_delphi.mdb
1/2c/2d Population subunits for analysis
Recovery team discussions
X
\RecoveryTeam\popn_subunits\pop_subunits8.shp

15
2a/2b Jaguar events database
See text. See Appendix 1 for sources.
Localities plotted against ESRI BaseMap and Google Earth data, with as much precision as locality description enables. Only points related to distinct place name locality were mapped
X
Attributes: \jaguar-records\jaguar.observations.latest.mdb Locations: \jaguar-records\events_25feb2011.shp
2a/2b Jaguar home ranges
Derived from jaguar events
Buffered from jaguar event points for ~120 km2 areas, then clipped to land. Not used in analysis; meant to cartographically compensate for ambiguity of point locations.
\jaguar-records\events_25feb2011_buffer_clip.shp
2c Revised Jaguar Conservation Units (JCUs)
Recovery team discussions; based on population subunits
X
\RecoveryTeam\rJCU_3.shp
2e US-MX border fence segments
Scanned Border Patrol maps from different sources, via Erin Fernandez , USFWS
Revisions by Department of Homeland Security (DHS) ongoing
\borderpatrol\US_MX_borderfence.mdb Preliminary DHS revisions: \borderpatrol\FWS_BorderFence.mdb
2e Terrain Ruggedness Index (TRI)
http://www.blm.gov/nstc/ecosysmod/surfland.html
Used AML written by Jacek Blaszczynski 06/1999 on 1k ASTER DEM to match method of Hatten et al. (2005) described in Riley et al. (1999) Other ruggedness candidates: SARI, Terrain Ruggedness Position (maximum), Roughness
X
\DEM\ruggedness
2f Jaguar northern range habitat suitability
see text
X
\PHVA\habitat_latest\habitat8

16
2f Predicted potential Jaguar density
see text Suitability to density relationship derived from slope of regression of habitat suitability values on seven density estimates within analysis unit
X
\density_studies\latest_density\denshab8aea
Objective 3. Presentation at the PVA workshop Dr. Eric Sanderson and Kim Fisher from WCS attended and presented at the PVA workshop in January 2011. Objective 4: Presentation at the PHVA workshop Dr. Eric Sanderson and Kim Fisher from WCS attended and presented at the PHVA workshop in March 2011. Objective 5: Final Report and Data Package This report and the attached data package conclude this activity. Any questions can be directed to Dr. Eric Sanderson using the contact information at the top of this report. References Brown, D. E. 1983. On the status of the jaguar in the Southwest. The Southwestern Naturalist 28:459–460.
Coronel-Arellano, H. Nalleli E. Lara-Díaz, Claudia N. Moreno-Arzate y Carlos A. López-González. In press. Density of jaguar (Panthera onca) in the Meseta de Cacaxtla, Sinaloa, México. Western North American Naturalist.
Hatten, J.R., Averill-Murray, A., and van Pelt, W.E. 2005. A spatial model of potential jaguar habitat in Arizona.
Journal of Wildlife Management 69(3): 1024-1033.
IUCN/SSC. 2008. Strategic Planning for Species Conservation: A Handbook. Version 1.0. Gland, Switzerland: IUCN Species Survival Commission. 104pp.
Gutiérrez-González, Carmina E., Gómez-Ramírez, Miguel Á. y López-González, Carlos A. In press. Jaguar (Panthera onca) density in arid lands of North America using an open population model. Oryx.
López González, C. A. y E. Moreno Arzate. 2011. Densidad de jaguar y abundancia de sus presas en Rosario de
Tesopaco, Sonora. Reporte preparado para la CONANP-UNAM. 8 pp. López González, C. A., E. Moreno Arzate, y G. Carreón Arroyo. In press. Densidad de jaguar y abundancia de sus
presas en Rosario de Tesopaco, Sonora. In: Censo Nacional del Jaguar y sus presas: Sitios y perspectivas de conservación a diversas escalas. Cuauhtémoc Chávez, Heliot Zarza, y Gerardo Ceballos (Eds). Universidad Nacional Autonoma de Mexico-TELCEL.
McCain, E.B. and J.L. Childs. 2008. Evidence of resident jaguars (Panthera onca) in the southwestern United States
and the implications for conservation. Journal of Mammalogy, 89(1):1-10. Rabinowitz, A. R. 1999. The present status of jaguars (Panthera onca) in the southwestern United States. The
Southwestern Naturalist 44:96–100.
Redford, K., G. Amato, J. Baille, P. Beldomenico, E.L. Bennett, N. Clum, R. Cook, G. Fonseca, S. Hedges, S. Launay, S. Lieberman, G. M. Mace, A. Murayama, A. Putnam, J.G. Robinson, H. Rosenbaum, E.W. Sanderson, S.N. Stuart,

17
P. Thomas, and J. Thorbjarnarson. 2011. What does it mean to successfully conserve a (vertebrate) species? Bioscience 61(6): 39-48.
Riley, S. J., S. D. DeGloria, and R. Elliot. 1999. A Terrain Ruggedness Index That Quantifies Topographic Heterogeneity. Intermountain Journal of Sciences 5:23-27.
Núñez-Pérez, R. 2011. Estimating jaguar population density using camera-traps: a comparison with radio-telemetry estimates. Journal of Zoology TBD: 1-7 (published on-line May 13, 2011). DOI: 10.1111/j.1469-7998.2011.00812.x
Sanderson, E.W., Redford, K.H., Chetkiewicz, C-L.B., Medellin, R.A., Rabinowitz, A.R., Robinson, J.G., and Taber, A.B. 2002. Planning to save a species: the jaguar as madel. Conservation Biology 16(1): 58-72.
Zeller, K. 2007. Updated jaguars in the new millennium dataset. Wildlife Conservation Society, Bronx, NY / Panthera Foundation, New York.

18
Appendix 1 Northern jaguar event record references reviewed, with number of records Anon 1911. A Jaguar in Texas. Field and Stream (January 7, 1911) [1 record]
Arizona Game and Fish Department. 2009. Arizona Game and Fish collars first wild jaguar in United States | Arizona Wildlife News. Retrieved February 26, 2011, from http://www.azgfd.net/wildlife/conservation-news/arizona-game-and-fish-collars-first-wild-jaguar [1 record]
Arizona Game and Fish Department. 2010. Timeline of Macho B events. Retrieved February 21, 2011, from http://www.azgfd.gov/w_c/jaguar/TimeLine.shtml. [1 record]
Armstrong, D. M., J. K. Jones Jr, and E. C. Birney. 1972. Mammals from the Mexican state of Sinaloa. III. Carnivora and Artiodactyla. Journal of Mammalogy 53:48–61. [4 records]
Audubon, J. J., and J. Bachman. 1854. The viviparous quadrupeds of North America. V.G. Audubon, New York. [10 records]
Bailey, V. 1905. Biological survey of Texas: Life zones, with characteristic species of mammals, birds, reptiles and plants. North American Fauna 25:1-222. [11 records]
Bailey, V. 1931. Mammals of New Mexico. United States Department of Agriculture, Bureau of Biological Survey, Washington D.C. [15 records]
Baird, S. 1857. Part I. General report upon the zoology of the several Pacific Railroad Routes. A.O.P. Nicholson, Printer, Washington D.C. [2 records]
Baird, S. 1859. Mammals of the boundary. Page 62 in Report on the U.S. Mexican Boundary Survey, under order of Lieut. Col. W.H. Emory, Washington, D.C. [9 records]
Bangs, S. F. 1899. The land mammals of peninsular Florida and the coast region of Georgia. Pages 157-235 in Proceedings of the Boston Society of Natural History. Boston Society of Natural History, Boston, MA. [1 record]
Barber, C. 1902. Notes on little-known New Mexican mammals and species apparently not recorded from the territory. Proceedings of the Biological Society of Washington 15:191-193. [2 records]
Bordercats Working Group Database. 2007. Curated by Kurt Menke, Bird’s Eye GIS. [186 records]
Brickell, J., J. Lawson, J. B. Grimes. 1737. The natural history of North Carolina. Publisher, Dublin. [4 records]
Brown, D. E. 1983. On the status of the jaguar in the Southwest. The Southwestern Naturalist 28:459–460. [10 records]
Brown, D. E., and C. Lopez-Gonzalez. 2001. Borderland Jaguars: Tigres de la Frontera. Second printing. University of Utah Press. [251 records]
Burt, W. H. 1938. Faunal relationships and geographic distribution of mammals in Sonora, Mexico. Museum of Zoology, University of Michigan, Ann Arbor, MI. [13 records]
Cahalane, V. H. 1939. Mammals of the Chiricahua Mountains, Cochise County, Arizona. Journal of Mammalogy 20:418–440. [4 records]
Cory, C. B. 1896. Hunting and fishing in Florida: including a key to the water birds known to occur in the State. Estes & Lauriat. [1 record]
Daggett, P. M., and D. R. Henning. 1974. The jaguar in North America. American Antiquity 39:465–469. [28 records]
Dinets, V., and P. Polechla. 2004. Black jaguar in northern Mexico. Retrieved February 26, 2011, from http://dinets.travel.ru/blackjaguar.htm. [2 records]
Ditto, L. 1996. Letter (November 27, 1996) [7 records]

19
Elias, C.R. 2011. Pers. comm. [1 record]
Findley, J. S., A. Harris, D. Wilson, and C. Jones. 1975. The natural history of New Mexican mammals. University of New Mexico Press, Albuquerque, NM. [8 records]
Girmendonk, A. L. 1994. Ocelot, Jaguar and Jaguarundi sighting reports: Arizona and Sonora, Mexico. Technical Report, Arizona Game and Fish Department, Phoenix, AZ. [82 records]
Gray, J. 1857. Notice of a new species of jaguar from Mazatlan, living in the gardens of the Zoological Society. Proceedings of the Zoological Society of London:278. [1 record]
Halloran, A. 1946. The carnivores of the San Andres Mountains, New Mexico. Journal of Mammalogy 27:154-161. [3 records]
Harlan, R. 1825. Fauna americana: being a description of the mammiferous animals inhabitating North America. A. Finley, New York?. [1 record]
Hill, J. 1942. Notes on mammals of northeastern New Mexico. Journal of Mammalogy 23:75-82. [2 records]
Hock, R. 1955. Southwestern exotic felids. American Midland Naturalist 53:324-328. [30 records]
Lange, K. I. 1960. The jaguar in Arizona. Transactions of the Kansas Academy of Science (1903) 63:96–101. [57 records]
Leopold, A. 1949. A Sand County Almanac. Oxford University Press, New York. [1 record]
McCain, E. B., and J. L. Childs. 2008. Evidence of resident jaguars (Panthera onca) in the southwestern United States and the implications for conservation. Journal of Mammalogy 89:1–10. [10 records]
Merriam, C. 1919. Is the jaguar entitled to a place in the California fauna? Journal of Mammalogy 1:38-40. [7 records]
Moore, R. 2009. The Nature Report: jaguars in Tamaulipas. Action 4 News. July 1, 2009. Retrieved February 21, 2011, from http://www.valleycentral.com/news/news_story.aspx?id=319685. [1 record]
Navarro-Serment, C. J., C. A. Lopez-Gonzalez, and J. Gallo-Reynoso. 2005. Occurrence of Jaguar (Panthera onca) in Sinaloa, Mexico. The Southwestern Naturalist 50:102-106. [39 records]
New Mexico Department of Game and Fish. 2010. Reports of Jaguar (Panthera onca) in New Mexico, with Evaluations of their Reliability. Santa Fe, New Mexico. [29 records]
Nowak, R. M. 1975. A possible occurrence of the jaguar in Louisiana. Southwestern Naturalist 17:430-432. [7 records]
Pavlik, S. 2003. Rohonas and spotted lions: the historical and cultural occurrence of the jaguar, Panthera onca, among the native tribes of the American Southwest. Wicazo Sa Review 18:157-175. [51 records]
Rabinowitz, A. R. 1999. The present status of jaguars (Panthera onca) in the southwestern United States. The Southwestern Naturalist 44:96–100. [1 record]
Roemer, F. 1849. Texas [or Travels in Texas]. Bonn, Germany. [2 records]
Rosas-Rosas, O. C. 2006. Ecological status and conservation of jaguars (Panthera onca) in northeastern Sonora, Mexico. New Mexico State University, Las Cruces, NM. [5 records]
Rundel, P. W., G. M. Rizzardini, and F. M. Jaksic. 1998. Landscape disturbance and biodiversity in Mediterranean-type ecosystems. Springer, New York. [3 records]
Sage, R. B. 1846. Scenes in the Rocky Mountains: and in Oregon, California, New Mexico, Texas, and the Grand Prairies : or, Notes by the way, during an excursion of three years, with a description of the countries passed through, including their geography. Carey & Hart, Philadelphia, PA. [1 record]

20
Sanderson, E. W., K. H. Redford, Chetkiewicz, Cheryl-Lesley B., Medellin, Rodrigo A., Rabinowitz, Alan R., Robinson, John G., and Taber, Andrew B. 2002. Planning to save a species: the jaguar as a model. Conservation Biology 16:58-72. [9 records]
Schufeldt, R. 1929. The mountain lion, ocelots, lynxes and their kin. American Forestry 27:629-636, 659. [9 records]
Seton, E. T. 1920. The jaguar in Colorado. Journal of Mammalogy 1:241. [1 record]
Seton, E. T. 1929. Lives of game animals. Doubleday & Company, Inc., Garden City, NY. [43 records]
Strong, W. D. 1926. Indian records of California carnivores. Journal of Mammalogy 7:59-60. [3 records]
U.S. Department of Interior Office of Inspector General. 2010. Investigative report: Macho B. Page 9. Department of Interior, Washington, D.C. [1 record]
U.S. Department of the Interior Fish and Wildlife Services. 1997. Endangered and threatened wildlife and plants; final rule to extend endangered status for the jaguar in the United States. Federal Register, Washington D.C. [63 records]
Villordo-Galván, J. A., O. C. Rosas-Rosas, F. Clemente-Sánchez, J. F. Martínez-Montoya, L. A. Tarango-Arámbula, G. Mendoza-Martínez, M. D. Sánchez-Hermosillo, and L. C. Bender. 2010. The Jaguar (Panthera onca) in San Luis Potosí, Mexico. The Southwestern Naturalist [6 records]
Whipple, A., T. Ewand, and W. Turner. 1856. Report upon the Indian tribes. Ex. Doc 91, U.S. Congress 33, 3d session, U.S. Congress, Washington D.C. [1 record]
Young, S. 1953 (February 11, 1953) Letter [1 record]
Zeller, K. 2007. Updated jaguars in the new millennium dataset. Wildlife Conservation Society, Bronx, NY / Panthera Foundation, New York. [21 records]