digital simulation of suction process with delayed entry technique and compression process in...
TRANSCRIPT

International Journal of Innovative Research in Advanced Engineering (IJIRAE) ISSN: 2349-2163 Volume 1 Issue 6 (July 2014) http://ijirae.com
____________________________________________________________________________________________________ © 2014, IJIRAE- All Rights Reserved Page - 127
Digital Simulation of Suction Process with Delayed Entry Technique and Compression Process in Hydrogen Fuelled
Engine with the Differential Approach using Real Gas Equation
Vikas J. Patel Dr.S.A.Channiwala, D.J.Mashruwala & K.S.Pandya Sarvajanik College of Engineering & Tech., Surat Sardar Vallabhbhai National Institute of Technology, Surat
ABSTRACT -- The rapidly increasing world wide demand for energy and the progressive depletion of fossil fuels has led to an intensive research for alternative fuels which can be produced on a renewable basis. Hydrogen in the form of energy will almost certainly be one of the most important energy components of the early next century. Hydrogen is a clean burning and easily transportable fuel. Most of the pollution problems posed by fossil fuels at present would practically disappear with Hydrogen since steam is the main product of its combustion. This Paper deals with the modeling of Suction and Compression Processes for Hydrogen Fuelled S.I.Engine and also describes the safe and backfire free Delayed entry Technique. A four stroke, Multicylinder, Naturally aspirated, Spark ignition engine, water cooled engine has been used to carrying out of investigations of Suction Process. The Hydrogen is entered in the cylinder with the help of Delayed Entry Valve. This work discusses the insight of suction process because during this process only air and Hydrogen enters in to cylinder, which after combustion provides power. Simulation is the process of designing a model of a real system and conduction experiment with it, for the purpose of understanding the behavior of the design. The advent of computers and the possibilities of performing numerical experiments may provide new way of designing S.I.Engine. In fact stronger interaction between Engine Modelers, Designers and Experimenters may results in improved engine design in the not-to-distant future. A computer Programme is developed for analysis of suction and Compression processes. The parameter considered in computation includes engine speed, compression ratio, ignition timing, fuel-air ratio and heat transfer. The results of computational exercise are discussed in the paper.
KEYWORDS: Computer simulation, Mathematical model, Suction Process, Delayed Entry Technique, Hydrogen Fuel
INTRODUCTION
Internal Combustion Engines are those engines in which combustion of fuels takes place inside the engine and hence the chemical energy is converted in to thermal energy, which is further converted into mechanical work. The present acute shortage of conventional fuels has necessitated the need for alternate fuel research. Hydrogen, which can be produced from natural gas or water, is proved to be a practical and potential alternate fuel for the I.C. Engine. The replacement of hydrocarbons by Hydrogen in automotive vehicles is expected to results in a considerable reduction in environmental pollution, since the harmful emission of unburned hydrocarbons and oxides of nitrogen are either avoided or minimized. With Hydrogen as a fuel, the engine exhaust is free from carbon monoxide and hydrocarbon emission, except very small quantities, which may be due to the combustion of lubricating oil. Further it does not contain sulfur, lead compounds or smoke and is virtually odorless. When Hydrogen-air combustion takes place in an I.C. engine cylinder, the only product of combustion are water vapour and oxides of nitrogen and the engine will be pollution free.It has been proved that the higher thermal efficiency of Hydrogen engine can offset the higher production cost. With only minor modifications, the conventional diesel cycle engine can be operated efficiently using Hydrogen as fuel with atmospheric air supplying the necessary oxygen.
PROPERTIES OF HYDROGEN
Table 1. Shows that main combustion properties of Hydrogen provide its use as an IC engine fuel. A low fuel conversion rate is problem with gaseous-fueled engines run with high amounts of excess air. The low quenching distance of Hydrogen offers improvement in this matter. Hydrogen flames can easily penetrate into difficult chamber zones and reach the unburnt mixtures than that of fossil fuels. Optimized Hydrogen engines can be run at higher compression ratio than that with unleaded gasoline. It makes Hydrogen powered engines 15-25 % more efficient than gasoline engines.
TABLE 1: PROPERTIES OF HYDROGEN
Description Hydrogen Laminar flame speed 1.96 m/sec Theoretical flame Temperature 2140 oC Minimum ignition energy 0.02 MJ Quenching distance 0.6 mm Normalized flame emmisivity 1 Normal Boiling Point 20.27 K Auto ignition temperature 858 K Burning velocity 265 to 325 cm/sec

International Journal of Innovative Research in Advanced Engineering (IJIRAE) ISSN: 2349-2163 Volume 1 Issue 6 (July 2014) http://ijirae.com
____________________________________________________________________________________________________ © 2014, IJIRAE- All Rights Reserved Page - 128
PROPERTIES OF HYDROGEN AT VARIOUS EQUIVALENCE RATIOS
The various properties of hydrogen (specific heat, thermal conductivity, kinematic viscosity, density, prandtl no.) have been calculated at various equivalence ratios at different temperatures. Graphs of these properties have been plotted. STOICHIOMETRIC EQUATION
Hydrogen: for ( = 1) 2kg + ½(32+3.7628)kg H2O +3.76/2 (N2) .76/2)28 Total mass of reactants = 70.64 kg Total mass of products = 70.64 kg
FOR REACTANTS: Mass fraction of H2 ,XH2 =0.02831 Mass fraction of O2 , XO2 =0.2265 Mass fraction of N2 , XN2 =0.7452 For reactants, Cp = (XH2 CpH2 + XO2 CpO2 + XN2 CpN2)/( XH2+ XO2+ XN2 ) Cp =(0. 02831 CpH2 + 0.2265 CpO2 + 0.7452 CpN2)/1 Now by putting the values of Cp we get the Cp of reactants
FOR PRODUCTS : Mass fraction of H2O = X H2O =0.2548 Mass fraction of N2 = XN2 = 0.7452 For products Cp = 0.2548(Cp) H2O + 0.7452(Cp) N2
THERMAL CONDUCTIVITY (K)(W/M-K) For reactants , (k)R = X H2 k H2 + X O2 k O2 + X N2 k N2 = 0.02831 kH2 + 0.2265 k02 + 0.7452 kN2
For products , (k)P = X H2O k H2O + X N2 k N2 = 0.2548 kH2O + 0.7452 kN
DENSITY:()(KG/M3)
For reactants, = (XH2 H2 + XO2 O2 + XN2 N2)/( XH2+ XO2+ XN2 ) = (0.02831H2 + 0.2265 O2 + 0.7452 N2)/(1) For products, = (XH2O H2O + XN2 N2)/( XH2O+ XN2 ) = (0.2548 H2O + 0.7452 N2)/( 1 )
MOLECULAR WEIGHT OF REACTANTS Meq = mass fraction of H2 MH2+ mass fraction of O2 MO2 + mass fraction of N2 MN2 =0.02831 2 + 0.226532 + 0.7452 28 Meq = 28.17022 kg/kg of mole Req = R / Meq = 8.3143103/28.17022 Req =295.145 J/kg-K For products, Meq = 0.254818 + 0.7452 28 = 25.452 kg/kg-mole ---- Req = R / Meq = 326.66588 J/kg-K

International Journal of Innovative Research in Advanced Engineering (IJIRAE) ISSN: 2349-2163 Volume 1 Issue 6 (July 2014) http://ijirae.com
____________________________________________________________________________________________________ © 2014, IJIRAE- All Rights Reserved Page - 129
PROPERTIES OF REACTANTS: PROPERTIES OF PRODUCTS:
LITERATURE SHOWCASE Beauties of Hydrogen were recognized as early as in 1820. In 1820, W.Cecil [1] read a paper before Cambridge
philosophical society on “The Application of Hydrogen gas to produce a motive power in Machinery ”. Then after an elapse of century,. Ricardo [1] published in the “Report of the Empire Motor Fuel Committee” a very
instructive paper on experiments carried out with Hydrogen and air used as a promoter with Petrol and Kerosene. He noticed that with a rich mixture pained by backfire, Ennen [2] in Germany, in 1933 dealt successfully with the backfire problem by injecting Hydrogen directly in to the cylinder, but the knocking persisted. King[3] made valuable contribution on the subject of pre-ignition and combustion knock in Hydrogen engine. He found that any particulate matter provides hot spot for pre-ignition and the combustion knock is an inherent property of near stoichiometric Hydrogen-air mixture due to the extremely high flame velocity.
The major conclusions derived from the available literature are as follows: (i). Any existing engine can be converted to Hydrogen fuelled engine with minor modifications.
DENSITY FOR REACTANTS (EQ. RATIO 0.2-7.0)
PHI=0.2
PHI=4.0
PHI-7.0
70.28
0.78
1.28
1.78
2.28
-200 -100 0 100 200 300 400 500 600 700 800 900
TEMP(C)
DEN
SITY
(kg/
m3)
PRANDTL NUMBER FOR REACTANTS (EQ. RATIO 0.2-7.0)
PHI=0.2PHI=4.0PHI=7.0
0.70.710.720.730.740.750.76
-200 -100 0 100 200 300 400 500 600 700 800 900
TEMP(C)
PRA
ND
TL N
UM
BER
SPECIFIC HEAT CAPACITY FOR REACTANTS (EQ.RATIO 0.2-7)
PHI=0.2PHI=1
PHI=2
PHI=4
PHI=7
1
1.5
2
2.5
3
3.5
-200 -100 0 100 200 300 400 500 600 700 800 900
TEMP(C)
SPEC
IFIC
HEA
T C
APA
CIT
Y(K
J/kg
C)
KINEMATIC VISCOSITY FOR REACTANTS (EQ. RATIO 0.2 - 7.0)
PHI=0.2PHI=1PHI=2PHI=4
PHI=7
0
50
100
150
200
250
300
-200 -100 0 100 200 300 400 500 600 700 800 900
TEMP(C)
KIN
EWM
ATI
C V
ISC
OSI
TY
* 1
0-6
(m2/
sec)
THERMAL CONDUCTIVITY FOR REACTANTS (EQ. RATIO 0.2- 7.0)
PHI=0.2PHI=1.0PHI=2.0PHI=4.0
PHI=7.0
00.020.040.060.080.1
0.120.14
-200 -100 0 100 200 300 400 500 600 700 800 900
TEMP(C)
THER
MA
L C
ON
DU
CTI
VITY
(W/m
C)
KINEMATIC VISCOSITY FOR PRODUCT
0
50
100
150
200
250
0 200 400 600 800 1000 1200
Temperature(C)
Kin
emat
ic v
isco
sity
(m2/
s)
prandtl number of products
0.6
0.65
0.7
0.75
0.8
0.85
0 200 400 600 800 1000 1200
temp (c)
pran
dtl n
umbe
r
Specific heat for product
0.5
1
1.5
2
2.5
3
3.5
0 100 200 300 400 500 600 700 800 900 1000 1100
Temperature(C)
Spec
ific
Hea
t(kj/k
g k)

International Journal of Innovative Research in Advanced Engineering (IJIRAE) ISSN: 2349-2163 Volume 1 Issue 6 (July 2014) http://ijirae.com
____________________________________________________________________________________________________ © 2014, IJIRAE- All Rights Reserved Page - 130
(ii). The part load & thermal efficiencies of H2 fuelled engine are higher than gasoline air engine. (iii). Hydrogen induction technique is easier to adopt as compared to Hydrogen injection technique. (iv). Emission levels of H2 - air engine are far less than that of gasoline – air engine if equivalence ratio is not exceeded 0.6
in H2 - air engine (i.e. Lean operation) (v). Equivalence ratio more than 0.6 results in back fire problems. If H2 – air engine has to be operated in the range of 0.6
to 1.0-equivalence ratio, we have to go for EGR or water induction or delay entry technique to achieve backfire free operation and lower NOx emission.
(vi). The reported optimum spark advance for H2 – air engine lies in between 7o to 12o BDC. (vii). The optimum compression ratio lies in between 8 to 12 for H2 – air engine.
AIM OF THE PRESENT WORK The aim of the present work is to model suction and Compression Processes in Hydrogen fueled Engine and by that improve fuel economy and govern power capacity of the engine. And also to describe the safe and backfire free H2 fuelled engine using Delayed Entry Technique. DEVELOPMENT OF MATHAMATICAL MODEL Internal combustion engines are the main power plants of the transportation systems and are responsible for a substantial fraction of fuel consumption. The scarcity of oil resources and the ever increasing standards on air pollution and emissions have dictated a need for improved, more efficient and less polluting internal combustion engine. Improvements on engine design have been achieved by traditional methods based on extensive experience. The advent of computers and the possibilities of performing numerical experiments may provide a new way of designing I.C. Engines. In fact, a stronger interaction between engine modelers, Designers and experimenters may result in improved engine designs in the not-to-distant future. The modeling of reciprocating or rotary engine is a multidisciplinary subject that involves chemical thermodynamics, fluid mechanics, turbulence, heat transfer, combustion and numerical methods. LITERATURE RIVIEW OF THE MODEL Recent development of S.I. engines, aiming to the higher power, better fuel economy, lower air pollution and better drivability have much increased the importance of computer simulation in engine research and development. In the various papers reviewed below, the following major areas should be noted: 1. Model for gas flow in the inlet and exhaust systems. 2. Model for flow through the valves. 3. Model for heat transfer Model for the gas flow in the inlet system The application of one-dimensional non-steady compressible flow equations to the intake and exhaust system of a reciprocating internal combustion engine has been well known. There are several methods which enable the equations to be solved. The characteristics theory reduces the set of equations into a set of simultaneous ordinary differential equations and the solution of these equations gives the wave and gas path line characteristics. Riemann originally formulated this theory in 1885. De Haller[17] used a graphical method to solve the set of simultaneous differential equations for the gas flow in an engine exhaust system. Later, Jenny[18] extended the graphical solution to include pipe wall heat transfer, friction, entropy gradient and gradual pipe cross-sectional area change. This type of graphical solutions has been extensively used in the calculation of gas flow in the reciprocating I.C. engines. With the availability of high speed digital computer, Benson, Garg and Woollatt[11] proposed a numerical scheme to solve the non-steady flow equations with the method of characteristics (MOC).The pressure losses have been calculated considering differential approach with the help of pressure wave theory. The pressure drop can be calculated by the equation given below.
ddtCC
dPf ssf32
International Journal of Innovative Research in Advanced Engineering (IJIRAE) ISSN: 2349-2163 Volume 1 Issue 6 (July 2014) http://ijirae.com
____________________________________________________________________________________________________ © 2014, IJIRAE- All Rights Reserved Page - 131
Where 25.0
0791.0
ef R
C
dCR ss
e
s
Ldt
99.0
11
00
PPas
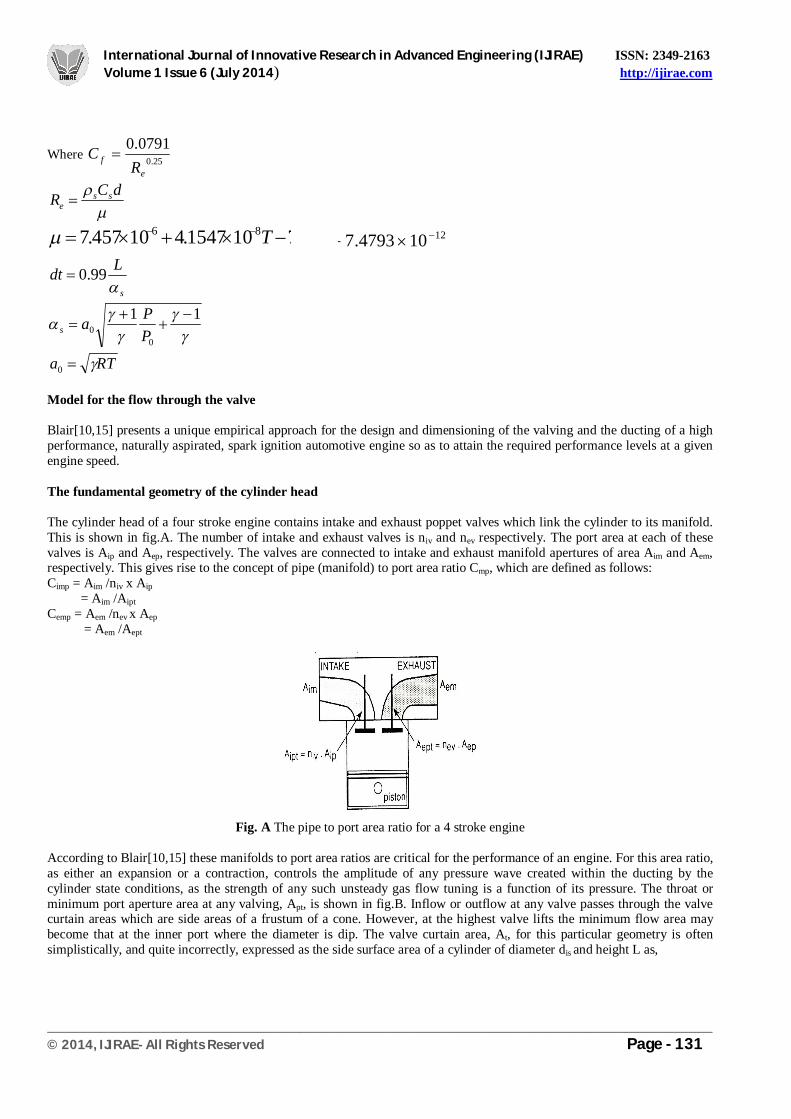
RTa 0 Model for the flow through the valve Blair[10,15] presents a unique empirical approach for the design and dimensioning of the valving and the ducting of a high performance, naturally aspirated, spark ignition automotive engine so as to attain the required performance levels at a given engine speed. The fundamental geometry of the cylinder head The cylinder head of a four stroke engine contains intake and exhaust poppet valves which link the cylinder to its manifold. This is shown in fig.A. The number of intake and exhaust valves is niv and nev respectively. The port area at each of these valves is Aip and Aep, respectively. The valves are connected to intake and exhaust manifold apertures of area Aim and Aem, respectively. This gives rise to the concept of pipe (manifold) to port area ratio Cmp, which are defined as follows: Cimp = Aim /niv x Aip = Aim /Aipt Cemp = Aem /nev x Aep = Aem /Aept
Fig. A The pipe to port area ratio for a 4 stroke engine
According to Blair[10,15] these manifolds to port area ratios are critical for the performance of an engine. For this area ratio, as either an expansion or a contraction, controls the amplitude of any pressure wave created within the ducting by the cylinder state conditions, as the strength of any such unsteady gas flow tuning is a function of its pressure. The throat or minimum port aperture area at any valving, Apt, is shown in fig.B. Inflow or outflow at any valve passes through the valve curtain areas which are side areas of a frustum of a cone. However, at the highest valve lifts the minimum flow area may become that at the inner port where the diameter is dip. The valve curtain area, At, for this particular geometry is often simplistically, and quite incorrectly, expressed as the side surface area of a cylinder of diameter dis and height L as,
86 7101547.410457.7 T 12104793.7

International Journal of Innovative Research in Advanced Engineering (IJIRAE) ISSN: 2349-2163 Volume 1 Issue 6 (July 2014) http://ijirae.com
____________________________________________________________________________________________________ © 2014, IJIRAE- All Rights Reserved Page - 132
At = π dis L
Fig. B Valve curtain areas at low and high valve lifts
It is vital to calculate correctly the geometrical throat area of the restriction At. In fig.B, the valve curtain area at the throat, when the valve lift is L,is that which is represented by the frustrum of a cone defined by the side length dimension x, the valve seat angle, Φ, the inner or outer seat diameters, i.e. dis and dos, and the radius, r, which depends on the amount of valve lift L. The side surface area of a frustum of a cone, i.e. As, is, As = π[(dmajor + dminor)/2] *x Where x is the sloping side and dminor and dmajor are its top and bottom diameters. This area As is the maximum geometrical gas flow area through the seat of any one valve for flow to, or from, the port where that area is Aipt or Aept. The dimension x through which the gas flows has two values which are shown in fig.B. On the left, the lift is sufficiently small that the value x is at right angle to the valve seat and, on the right, the valve lift has lifted beyond a lift limit Llim where the value x is no longer normal to the valve seat at angle Φ. By simple geometry, this limiting value of lift is given by, Llim = (dos - dis)/2sinΦcosΦ = (dos - dis)/sin2Φ For the first stage of poppet valve lift Where, L ≤ Llim Then the valve curtain area At is given from the value of x as, X = LcosΦ r = dis/2 + xsinΦ in which case, At = πLcosΦ(dis+LsinΦcosΦ) For the second stage of poppet valve lift where, L>Llim Then the valve curtain area At is given from the value of x as, X = {{L-[(dos-dis)/2 ]tanΦ}2 + [(dos-dis)/2]2}1/2 Whence,
22
2tan
22
isosisosisos
tdddd
Ldd
A
If the seat angle is 45°, which is conventional, then tanΦ is unity and the above equation simplifies somewhat.
Model for heat transfer
For considering heat transfer, Woschni’s[22] equation was used by Shashikantha[24], which is based on the similarity law of steady turbulent heat transfer. The formula is, hc= 0.820 D-0.2 p0.8 wmv
0.8 T-0.53 (kw/m2K). According to Patterson [12], of the several expressions in the literature, two are of special interest. Nusselt [21] was among the first to formulate an expression for the heat transfer coefficient in an I.C.Engine. His expression based on experimental observation, included radiation as well as convective effects, & it is;

International Journal of Innovative Research in Advanced Engineering (IJIRAE) ISSN: 2349-2163 Volume 1 Issue 6 (July 2014) http://ijirae.com
____________________________________________________________________________________________________ © 2014, IJIRAE- All Rights Reserved Page - 133
hc= 0.99 (P2T)1/3 (1+1.24w) + 0.362 [ {(T/100)4 - (Tw/ 100)4 } / {T-Tw }] Where h in kcal/ m2hrK.
According to Anand[22] the expression for the heat transfer coefficient in an I. C. Engine is expressed as
447.0
100100Re w
cTT
TTC
Bah
w
This expression is widely used for I. C. Engines. Many books on I. C. engines have referred this expression and we have also selected the same reference. Model for Specific properties
According to Blair[10,15], enthalpy, internal energy and specific heat at constant pressure are the function of temperature. They are controlled by the simple formula.
h = K0 + K1T + 2*K2*T2 + 3*K3*T3 KJ/kgK. The differential form can be derived by simply differentiation of the equation with respect to temperature. The differential form is given below. Model for Coefficient of discharge A fundamental experimental study was conducted by Blair[10,15] to visualize the effect of size of the engine ducting on the discharge coefficient of the cylinder porting aperture. It was found to have no significant influence. The general applicability of this conclusion in design and simulation study is debated. A study of the discharge coefficients of restrictions or throttles within engine ducting was carried out and the ensuing map was determined to be significantly dissimilar in profile to that of all published data on engine porting or valving. Cd = -23.543 + 60.686 P – 51.04 P2 + 14.387P3 ( 1 < P < 1.4 ) Cd = 0.838 ( P >=1.4 ) Where P = pressure ratio.
With the all the properties of hydrogen, we must know the practical aspect while dealing with the hydrogen. This aspect has been described in detail further in this paper.
Model for cylinder volume
The figure shows the schematic diagram of the piston-cylinder arrangement of I. C. engines. The volume of the cylinder is changing continuously with the crank rotation. The volume inside the cylinder can be calculated from the geometry and the generalized equation derived by Blair is given below. The differential of volume and the piston speed can be calculated as below.
kKgKJTKTKKC p
2321 32
33
2210 32)( TKTKTRKKU
2321 94 TKTKRK
dTdU c
sin4
2222 rlrlBVV c cosr

International Journal of Innovative Research in Advanced Engineering (IJIRAE) ISSN: 2349-2163 Volume 1 Issue 6 (July 2014) http://ijirae.com
____________________________________________________________________________________________________ © 2014, IJIRAE- All Rights Reserved Page - 134
Model of Wall temperature The temperature of wall can be found from the empirical formulas obtained by the authors for conventional engines. Twall = (423 - 0.388 * θ)
Calculation of Pressure Losses in Intake System of an Engine The pressure losses have been calculated considering differential approach with the help of pressure wave theory. The pressure drop can be calculated by the equation given below.
ddtCC
dPf ssf32
Where 25.0
0791.0
ef R
C
dCR ss
e
21286 104793.7101547.410457.7 TT
s
Ldt
99.0
11
00
PPas
RTa 0 Here we need the velocity of the flowing fluid, which can be calculated from the mass entered in to the cylinder. Hence it falls in the iterative loop. As the mass entering into the cylinder keeps on changing with the each degree of crank rotation the pressure drop will change with each degree of crank rotation. Thus with each degree of crank rotation there will be change in the intake condition.
STARTING OF SUCTION PROCESS
On the starting of suction valve will be closed, so there will not be any flow of air. Thus pressure drop will not occur due to the friction. Hence at the starting of suction process the pressure in the pipeline will be equal to atmospheric pressure. At the starting of suction process we will assume that at the end of exhaust process, pressure will be 1.05 bars and the temperature will be 553 Kelvin. Also the error involved in these assumptions will be nullified due to the iterations of whole cycle. Thus, we know the condition outside and inside the cylinder. So we are able to start the simulation.First Valve lift of inlet valves are measured at every 5° of interval, with the help of Dial gauge and angle measurement device(pro-circle).These data are interpolated at every 2° crank interval using MATLAB for simulation.
VALVE LIFT
-202468
10
-2 24 50 76 102
128
154
180
206
232
DEGREE
mm
Now Injecting Hydrogen into the engine cylinder is an inherently difficult task and considerable engine modification is required to convert existing l engine to use Hydrogen. The present method consists of inducting of Hydrogen along with air in to engine cylinder to use Hydrogen with the help of delayed entry valve. This method has the virtue of simplicity and flexibility since exiting engine is easily converted to work on this principle.

International Journal of Innovative Research in Advanced Engineering (IJIRAE) ISSN: 2349-2163 Volume 1 Issue 6 (July 2014) http://ijirae.com
____________________________________________________________________________________________________ © 2014, IJIRAE- All Rights Reserved Page - 135
SIMULATION OF THE SUCTION PROCESS
The hydrogen from delay entry valve is being discharged from delayed entry valve. Air is sucked from atmospheric pressure. Both air and hydrogen is passed through pipelines. During the flow due to friction the pressure drop occurs. The pressure drop due to friction can be calculated from the method described in previous title. Both hydrogen and air get mixed at the intake valve. At this stage the cylinder pressure is greater than the intake valve pressure, so exhaust gas will go into the intake valve also. After the TDC the pressure will drop below the intake valve pressure. So gas will flow from intake valve to cylinder. First the exhaust gas will return in the cylinder than the fresh charge will enter the cylinder. The volume of cylinder can be calculated by formula given below. The dV/d can also be getting from below
equation. cossin4
2222 rrlrlBVV c
222
22
sin2
2sinsin
4 rl
rrBddV
MASS CALCULATION
Now In general, AVm Now we can calculate the density and the speed from the pressure wave theory given by Blair. According to him,
5202
GXs
22025 ri XXaGV So we have,
dtVA
ddm
valve
The different terms are given below. Pi1 =pressure at inlet. Pi2 = pressure at outlet. A1 = inlet area. A2 = outlet area. Ar = A2 / A1. T1 = inlet temperature. T2 = outlet temperature.
2
117 G ,
125
G
17
0
11G
PPiXi
,
17
0
22G
PPiXi
Ar
ArXiXiArXr
1
21 211
Ar
ArXiXiXr
112 21
2
Xs = Xi + Xr -1.
21
101 Xs
TT , 22
202 Xs
TT
0202 RTa ,02
002 RT
P
TEMPERATURE AND PRESSURE VARIATIONS So, now we know the mass entered and left from the cylinder. Now we have to consider real gas equation. There are many real gas equations but one which fits in our temperature range is Redlich Kwong real gas equation. This is given by,
International Journal of Innovative Research in Advanced Engineering (IJIRAE) ISSN: 2349-2163 Volume 1 Issue 6 (July 2014) http://ijirae.com
____________________________________________________________________________________________________ © 2014, IJIRAE- All Rights Reserved Page - 136
bVVTa
bVRTP
mmm
But as we have to consider the differential approach, the differential form of the same equation is,
22111111 C
ddT
TC
ddV
VC
ddm
mddp
p
Where,
22222
3
222223
21
bmMVmbVMmambVMVMTRm
mbVMmbVMammbVMMVTRC
2222223
22223
22
bmMVmbVMammbVMVMTRm
mbVMmbVMammbVMmbVMVMTRC Temperature can be calculated by energy conservation method, i.e. by
equation below.
newcylin
cylcylcylininin
CpMMCpMTCpMT
Td
)(
10006.128 msl C
BSPdp , 2
377.010
bSn
dp pt
The new value of Cp will be the function of new T. thus this equation will be in iteration. Thus we are able to calculate new temperature so from the differential equation we will get the new pressure. Now the gasses have to move the piston and the pressure on rear side of the piston is atmospheric. So the movement of the piston will be on the cost of pressure. The pressure drop according to Ganeshan[8] is given by,
100
394.033.12 182.00888.042.0
Vp
atm rcrcBLPPdP This temperature and pressure will be again put into the
equation to do the iteration. The whole loop will continue up to the whole suction process. Thus we will get the pressure and temperature at the end of the suction process. Also mass of air and hydrogen entered will be known. Here we made the assumption that the starting of the suction, there will not be any unburnt mass i.e. there will be only H2O and N2. But on simulating the combustion process due to the inability of 100% combustion some unburnt mass will be there. This will be taken into the account on iteration. The result that we got has been plotted on graph. SIMULATION OF COMPRESSION PROCESS In four- stroke combustion engine compression process is of fundamental importance and requires great understanding of the micro processes taking place. An effort is made to analyze the compression process and evaluated the properties of the mixture so as to compare the variations of properties at each stage. In compression process, the mass inducted during the previous process of suction is enclosed in the volume of the cylinders. This air-fuel charge mixture is to be compressed by action of the piston moving from the outer dead center to the inner dead center. Work is supplied to the system in the compression but recovered in later process of combustion and expansion As a result of work done on the mixture the internal energy of the mixture is increased. The pressure and temperature of the mixture increase slowly at first, than steadily due to the progressive work of compressing the mixture. Consequently the specific heat capacity of the mixture also increases due to the temperature change. At the end of compression at 356º crank angle the introduction of electric spark inside the cylinder takes place. Compression is continued up to that. Simulation of the compression process is treated in this work up to 344º of crank movement. Homogeneity: It is assumed that the charged is mixed homogenously with the residual gases like water vapor and other
constituents.

International Journal of Innovative Research in Advanced Engineering (IJIRAE) ISSN: 2349-2163 Volume 1 Issue 6 (July 2014) http://ijirae.com
____________________________________________________________________________________________________ © 2014, IJIRAE- All Rights Reserved Page - 137
Range: The process of effective compression starts at 234º of crank rotation and completes at 356º of crank angle. The beginning of compression is governed by the establishment of the pressure in the cylinder, which occurs at 234º of crank angle. The end of compression is governed by the initiation of effective combustion.
STARTING OF COMPRESSION PROCESS
The approach is very simple suggested by Richard stone. It is merely the some modification of first law of thermodynamics. As we all know that first law of thermodynamics is
dQ = dU + dW Now in the compression process, there will be no mass change nor do the heat generation involve. Thus in the compression process, the heat transfer will be only the heat loss from the walls. The heat loss from the wall can be found from the simple equation given below.
dQ = hc * A * (T4 – Tw4) Here the ‘A’ i.e. the area term can be found from the simple geometry. The heat transfer coefficient can be found from the approaches suggested in the literature review. We have in our case have taken the equation given by Anand[22]. The reason behind the selection is that many books on simulation on I. C. Engines have suggested it to use. The temperature of the wall can be found from the equation given by Dr. S. A. Channiwala[4].. It is the equation of crank rotation. Thus the dQ term is only the function of temperature. Now the second term is dU i.e. the internal energy difference. Now as it is mentioned earlier, the internal energy is the function of temperature only. Now the last term is the work done term expressed as below
122
12 VVPPdW
Now as we all know that the pressure is the function of temperature and volume. We know the volume of the cylinder at the each degree of crank rotations. Thus the only unknown variable is the temperature. Thus the all term in the first law of thermodynamic can be expressed in the two basic variable i.e. temperature and volume. And as we know the volume at each degree of the crank rotation, we left with the only variable and that is temperature. Now to find the temperature from the modified equation it is almost impossible to express in single side variable. Thus to find the temperature we used bisection method to find the root of the equation. Now we have to consider real gas equation. There are many real gas equations but one which fits in our temperature range is Redlich Kwong real gas equation. This is given by,
bVVTa
bVRTP
mmm
But as we have to consider the differential approach, the differential form of the same equation is,
22111111 C
ddT
TC
ddV
VC
ddm
mddp
p
22222
3
222223
21
bmMVmbVMmambVMVMTRm
mbVMmbVMammbVMMVTRC
2222223
22223
22
bmMVmbVMammbVMVMTRm
mbVMmbVMammbVMmbVMVMTRC Thus we are able to find pressure and temperature. These values
will be again put in to the starting of the loop and after the iterative method we will get the pressure and temperature. The whole loop is to work over whole cycle.
RESULTS & DISCUSSION OF THE MODEL RESULTS OF SUCTION ROCESS P R E S SU R E
0
0.5
1
1.5
-2 26 54 82 110
138
166
194
222
D E G R E E

International Journal of Innovative Research in Advanced Engineering (IJIRAE) ISSN: 2349-2163 Volume 1 Issue 6 (July 2014) http://ijirae.com
____________________________________________________________________________________________________ © 2014, IJIRAE- All Rights Reserved Page - 138
TEMPERATURE
0100200300400500600
-2 26 54 82 110
138
166
194
222
DEGREE
KEL
VIN
V O L U M E
0.00E+00
1.00E-042.00E-04
3.00E-04
-2 28 58 88 118
148
178
208
D E G R E E
VALVE LIFT
-202468
10
-2 24 50 76 102
128
154
180
206
232
DEGREE
mm
CUMULATIVE MASS
0.00E+002.50E-055.00E-057.50E-051.00E-041.25E-041.50E-04
-2 24 50 76 102
128
154
180
206
232
DEGREE
KG
The nature of P-theta curve is quite interesting. Initially a strong decrease in cylinder pressure is observed. his happens due to starvation of mass flow due to restricted valve intake area during the initially stage of valve lift. However, thereafter a gradual pressure building is observed due to increased availability of mass flow with higher range. The temperature obviously will reduce with increased availability of mass flow with increasing crank angle. The m-θ curve clearly shows gradual rise in mass flow during initial valve lift and thereby explain the trend of P-θ curve too. Thus, the basic results of suction process are as per logical trend observed in actual I.C. engines and this validates the model used in present case.
Results of the Compression Process
TEMPERATURE
300320340360380400420
236
250
264
278
292
306
320
334
348
DEGREE
KEL
VIN
VOLUME
00.000050.0001
0.000150.0002
0.000250.0003
236
248
260
272
284
296
308
320
332
344
DEGREE
mm
3

International Journal of Innovative Research in Advanced Engineering (IJIRAE) ISSN: 2349-2163 Volume 1 Issue 6 (July 2014) http://ijirae.com
____________________________________________________________________________________________________ © 2014, IJIRAE- All Rights Reserved Page - 139
PRESSURE
02468
10
236
250
264
278
292
306
320
334
348
DEGREE
BAR
It is seen from P-θ curve that initially there is a gradual rise in pressure, this happens because the charge gets trapped within the sealed cylinder, experiences compression. Compression process starts at 236° crank angle when the cylinder pressure equals to the atmospheric pressure. As the pressure inside the sealed cylinder increases, the temperature will also increase in the same manner. The nature of T-θ curve is similar to P-θ curve. The temperature soars to 396.875 K at the end of compression process. During compression process, heat loss due to fuel vaporization is also considered. It is seen from the calculation that it is worth to employ vaporization loss to the convective heat loss. CONCLUSION
From the results of simulation, it concludes that the trend of pressure and temperature with increasing crank angle is quite logical to the actual S.I. engine.
During suction process, pressure falls to 0.67 bars at 58 ˚atdc. Initial fall of pressure in the suction stroke is also observed by Blair and Lumley. According to Winterbone and pearson[13,14], if the wave action theory is included in the intake system, it utilizes the ramming effect of the traveling compression wave in the inlet system, that will improve the trend of pressure curve.
The calculation of pressure losses in the intake system of an engine carried out as per ASHRE, gives 89% volumetric efficiency, comparable to the real engine. According to Zhao and Winterbone [13, 14] the use of loss coefficients improves the evaluation of the pressures and mass flow in the manifold.
The authors feel that the Delayed Entry Technique is designed for the backfire free operation will become an essential feature of future H2 fuelled engines. It is also felt that this valve can be used on any gas engine for utmost safe operation.
SCOPE FOR THE FUTURE WORK The simulation code written in C++ should be written in a software code such as Microsoft™ Quick Basic for the Macintosh, Microsoft Visual Basic for the PC or True Basic- a cross platform language for either the PC or Macintosh. These three software code permits a highly visual data input procedure, with the cylinders or the valves or the ducting of the engine appearing as moving entities on the computer screen. It shows the variations of pressure, Volume & Gas flow rate that takes place during the engine cycle in a pictorial form. It allows the viewers imagine the unimaginable. It forms such pictorial information that a designer conceives of future improvements. Wave action model should be adopted to calculate the unsteady flow in the manifold pipes. The coefficient of discharge, that is assumed constant, should be evaluated. Other than two zone combustion model, one may look for multi zone model which can give more accurate results.. REFERNCES 1. Billings R.E.& Lynchr.E. “History Of Hydrogen Fuelled Internal Combustion Engines”, Billing Research Publication
No. 73001, 1973 2. Ennen R.A. & Cambell W.H. “Hydrogen: Commertial fuel for I.C.Engine and other purpose”, Journal of Institute of fuel
(London), Vol. 6,No. 29, pp. 227-290,1933 3. King R.O., Hayes S.V., Allan A.B., Anderson R.W.P. & Walker “The Hydrogen Engine: Combustion knock and related
flame velocity, Trans. Engg. Inst. Of Canada,Vol. 2, pp. 442-454, 1957 4. Channiwala S.A. Dissertation Report On “Hydrogen As IC Engine Fuel”, M.Tech. Thesis, Submitted IIT Bombay, 1980 5. Carl A., Kukkonen & Mordecai Shelef " Hydrogen as an Alternative Automative Fuel: 1993 Update," SAE Paper N.
940766 6. J.B.Heywood “Fundamental Of Internal Combustion Engine” Macgraw Hill International Edition, Volume I, 1986 7. Benson Ronald S “Thermodynamics and Gas Dynamics of Internal Combustion Engine”, Oxford University Press Vol. II
1986

International Journal of Innovative Research in Advanced Engineering (IJIRAE) ISSN: 2349-2163 Volume 1 Issue 6 (July 2014) http://ijirae.com
____________________________________________________________________________________________________ © 2014, IJIRAE- All Rights Reserved Page - 140
8. Ganeshan V. “Computer Simulation of S.I.Engine Process, Mcgrow Hill Book Company Hyderabad, 1988 9. Ramos, J.I., “Internal combustion engine modeling”, Hemisphere publishing corporation, 1989 10. Blair, G. P., “Design and simulation of four-stroke engines”, SAE Publication, 1999. 11. Benson, R. S., Garg, R. D. and Wallatt, D., “A numerical solution of unsteady flow problems”, Int. J. Mech. Sci., vol. 6,
No. 1, 1964. 12. Patterson, D. J., “A comprehensive cycle analysis and digital computer simulation for spark ignited engines”, Ph.D.
Thesis, submitted at University of Michigan, 1962. 13. Winterbone, D. E. and Pearson, R. J., “Design techniques for engine manifolds, Wave action methods for an I.C.
engines”, professional Engineering Publishing Ltd., 1999. 14. Witerbone, D. E. and Zhao, Y., “Numerical simulation of intake and exhaust flows in a high speed multi-cylinder petrol
engine using the Lax-Wendroff method”, I Mech E, C 430/038, 1991. 15. Bingham, J. F. and Blair, G. P., “an improved branched pipe model for multi-cylinder automotive engine calculations”,
Proc. I. Mech. E., vol. 199, No. D1, 1985. 16. Flamang, P. and Sierenes, R., “Experimental and theoretical analysis of the flow in exhaust pipe junctions”, I. Mech. E.,
C 382/082, 1989. 17. Haller, D., “The application of a graphical method to dynamic problems in gases”, Sulzer Technical Review, vol. 27, No.
1, 1945. 18. Jenny, E., “Unidimensional transient flow with consideration of friction, heat transfer and change of section”, The
Brown Bovery Review, Nov. 1950 19. Lumley, J. L., “Engines, An Introduction”, Cambridge University press, 1999. 20. Woschni, G., “A universally applicable equation for the instantaneous heat transfer coefficient in the Internal combustion
engine”, SAE 670931, 1967. 21. Nusselt, W., “VDI-Forsch., 1923. 22. Anand, W. J. D., “Heat transfer in the cylinders of reciprocating Internal combustion engines”, Proc. I. Mech. E., vol.
177, 1963. 23. “ASHRAE Handbook Fundamentals”, SI edition. , 1993 24. Shashikantha, Klose, W. and Parikh, P. P., “Producer-gas engine and dedicated Natural gas engine-Computer simulation
for performance optimization”, SAE, 1998.