digital vending machine control - university of...
TRANSCRIPT

i
UNIVERSITY OF NAIROBI
DIGITAL VENDING MACHINE CONTROLLER
PROJECT NO. PRJ043
BY:
BEATRICE MUTHONI MAINA
REG: F17/8248/2004
SUPEREVISOR: PROF. ELIJAH MWANGI
EXAMINER: MR. C. OMBURA
This project report is submitted in partial fulfillment of the requirement for the award of the degree of:
Bachelor of Science in Electrical and Electronic Engineering of the University
of Nairobi
20th May 2009
Department of Electrical and Information Engineering

ii
UNIVERSITY OF NAIROBI
DIGITAL VENDING MACHINE CONTROLLER
PROJECT NO. PRJ043
BY:
BEATRICE MUTHONI MAINA
REG: F17/8248/2004
SUPEREVISOR: PROF. ELIJAH MWANGI
EXAMINER: MR. C. OMBURA
This project report is submitted in partial fulfillment of the requirement for the award of the degree of:
Bachelor of Science in Electrical and Electronic Engineering of the University
of Nairobi
20th May 2009
Department of Electrical and Information Engineering

iii
DEDICATION This project is dedicated to my dear parents MR. AND MRS. JOHN MAINA who
have constantly supported me throughout my academic life and to my three sisters
Sylvia, Linda and Joy, you are all a blessing.
iv
ACKNOWLEDGMENTS I owe my gratitude to all those who assisted in making this project report possible.
Special mention is given to Prof. Elijah Mwangi, my supervisor, for his constant
encouragement, useful and constructive advice and timeless effort in supervising
this report.
I would like to also thank my dear friends and classmates Mr. B. Simiyu, Miss
Alexia Njambi and Miss Jane Mwelu for your friendship, encouragement and
moral support.
I also wish to thank my father, Mr. John Maina and my sister Miss Sylvia Wanjiru
for proofreading this report.
Most of all I wish to thank the Almighty God for giving me strength, energy and
opportunity to do this report.
v
ABSTRACT The design of a logic circuit that can be used in digital vending machine is
presented in this report. The digital vending machine controller accepts tokens as
payments and dispenses one of the two items on offer as well as change.
The controller is designed using the Algorithm State Machine approach. This has
the advantage of partitioning the design into a data processor part and a controller
part which produces a modular flow that is easy to implement. In order to reduce
the number of inputs a restriction is placed on the types of tokens that can be
accepted by the machine.
The machine is implemented with SSI and MSI logic components and simulated
using the Electronic Workbench Version 5.1 software. The acceptance of a token
is simulated as a digital pulse and the transaction is registered by the use of LEDs.
The results obtained are analyzed using an in-built logic analyzer.
The results that have been obtained through the simulator are in agreement with
the expected behaviour of the vending machine.
vi
TABLE OF CONTENTS
Dedication…………………………………………………………….….iii
Acknowledgment……………………………………………………...…iv
Abstract………………………………………………………………….. v
CHAPTER 1: INTRODUCTION
1.1 Objective………………………………………………………...……1
1.2 Finite State Machines (FSM)……………………………………...….1
1.3 Integrated Circuits……………………………………………...……..3
1.4 Sequential Circuits………………………………………………...….4
1.5 Synchronous Sequential Circuits…………………………………......5
1.5.1 Moore Machine……………………………………………...….5
1.5.2 Mealy Machine……………………………………………...….6
CHAPTER 2: ALGORITHMIC STATE MACHINES (ASM)
2.1 Introduction…………………………………………………………...7
2.1.1 Comparison between ASM chart and State Diagram…………..8
2.2 The Algorithm State Machine chart………………………………... ..8
2.2.1 The State Box…………………………………………………..9
2.2.2 The Decision Box………………………………………….......9
2.2.3 The Condition Box……………………………………………10
2.3 Certain Rules of ASM chart………………………………………....11
2.4 Parallel vs. Serial Representation……………………………..….....11
2.5 Timing Consideration…………………………………………..…...12
CHAPTER 3: IMPLEMENTATION
3.1 Introduction……………………………………………………….…13
3.2 Problem Specification…………………………………….…………13
3.2.1 Coin Acceptor Block………………………………………..…14
vii
3.2.2 Coin Changer Block………………………………….……..…15
3.2.3 Item Release Block………………………………….………...15
3.3 System Development……………………………………………......16
3.3.1 Definition of states for Coca Soda Select……………...….......17
3.3.2 Reduction of states for Coca Soda Select…………….……….17
3.3.3 State Assignment……………………………………………...18
3.3.4 Definition of states for Mineral Water Select……………..…..18
3.3.5 Reduction of states for Mineral Water Select……………....…18
3.3.6 State Assignment…………………………………………...…19
3.3.7 The State Diagram………………………………………...…..19
3.3.8 The ASM Chart………………………………………………..22
3.3.9 The State Table………………………………………………..25
3.4 Design with Multiplexers…………………………………………....25
CHAPTER 4: RESULTS AND DISCUSSIONS
4.1 Introduction..…………..……………………………………..…..….29
4.2 Expected Controller Response………………………………….…...29
4.2.1 Case 1 for Mineral Water Select…………………………...….29
4.2.2 Case 2 for Cola Soda Select…………………………….……..30
4.3 Results……………………………………………………………….30
4.3.1 Waveforms Representing Mineral Water Select……………....30
4.3.2 Waveforms Representing Cola Soda Select………………..…30
4.4 Discussion………………………………………………………..….30
CHAPTER 5: CONCLUSIONS AND RECOMMENDATIONS
5.1 Conclusions………...………………………………………….…….33
5.2 Recommendations for further work…………………………...…….33
REFERENCES…………...…………………………………….....……34
viii
LIST OF FIGURES
Fig 1.1 Finite State Machine Model…………………………………...…2
Fig 1.2 Block Diagram of Sequential Circuit…………………...………..4
Fig 1.3 Moore type machine……………………………………...………6
Fig 1.4 Mealy type machine………………………………………………6
Fig 2.1 Control and Datapath Interaction…………………...……………7
Fig 2.2 State Box……………………...………………………………… 9
Fig 2.3 Decision Box…………………………………...……………….10
Fig 2.4 Condition Box…………………………………………………...10
Fig 2.5 Diagram illustrating valid and invalid cases………………...…..11
Fig 2.6 Diagram illustrating parallel and serial form………………..…..12
Fig 3.1 Block diagram of Vending Machine Mechanism……………….13
Fig 3.2 The Coin Acceptor Block……………………………………….14
Fig 3.3 The Coin Changer Block…………………………………….….15
Fig 3.4 The Item Release Block…………………………………………16
Fig 3.5 State Diagram of Cola Soda…………………………………….20
Fig 3.6 State Diagram of Mineral Water……………………………..…21
Fig 3.7 ASM chart of Cola Soda and Mineral Water………………..….24
Fig 3.8 Controller Circuit………………………………………………..28
Fig 4.1 Waveforms Representing Mineral Water Select………………..31
Fig 4.2 Waveforms Representing Cola Soda Select…………………….32
LIST OF TABLES
Table 3.1 State assignment for Cola Soda Select…………………….…18
Table 3.2 State assignment for Mineral Water Select……………...……19
Table 3.3 State table for Cola Soda Select…………………...………….26
Table 3.4 State table for Mineral Water Select……………….…………27
1
CHAPTER 1 INTRODUCTION 1.1 Objective The objective of the project is to design a vending machine controller using the
algorithm state machine methodology and the use of small-scale integration (SSI)
and medium-scale integration (MSI) logic modules. The machine accepts tokens
as payment and dispenses an item as well as change.
1.2 Finite State Machine (FSM) Finite State Machines (FSM), also known as Finite State Automation (FSA), at
their simplest, are models of the behaviour of a system or a complex object, with a
limited number of defined conditions or modes, where mode transitions change
with circumstances.
Finite state machines consist of 4 main elements:
• states which define behaviour and may produce actions
• state transitions which are movement from one state to another
• rules or conditions which must be met to allow a state transition
• input events which are either externally or internally generated, which may
possibly trigger rules and lead to state transitions
A finite state machine must have an initial state which provides a starting point,
and a current state which remembers the product of the last state transition.
Received input events act as triggers, which cause an evaluation of some kind of
the rules that govern the transitions from the current state to other states. The best
way to visualize a FSM is to think of it as a flow chart or a directed graph of
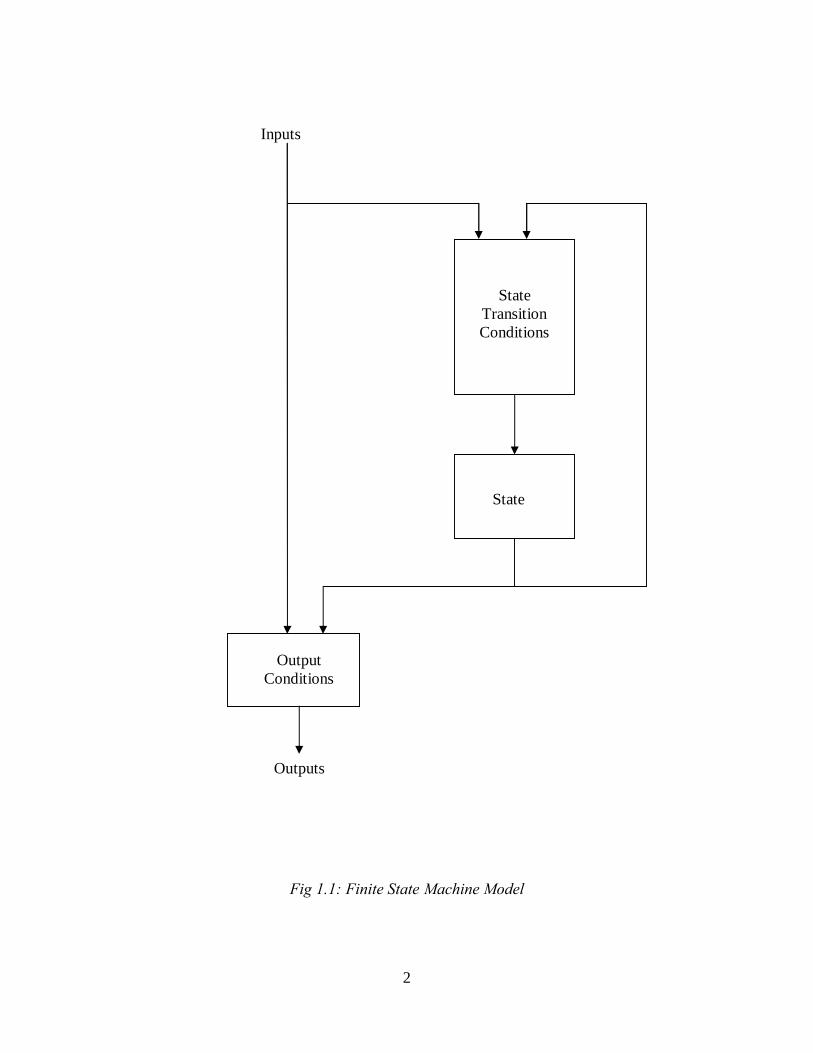
states. A digital vending machine is an example of a finite state machine. The
model of a finite state machine is shown in Fig 1.1;
2
Fig 1.1: Finite State Machine Model
State
Transition Conditions
State
Inputs
Output Conditions
Outputs
3
An FSM can be represented using a state transition diagram. A state transition
diagram is a directed graph consisting of nodes to represent states, and the directed
lines to represent state transition. Each node is represented with a value of the state
it represents and each line is labelled by the input values that cause the transition
represented by a line. State diagrams do not capture the algorithms and the timings
associated with the transition of the output function.
This is a limitation of a sequential circuit using finite state machines methodology,
as they do not expressly present the timing information and the algorithms that
compute the transition or the output function. This culminates in the algorithmic
state diagram, or the ASM chart which is a special flow chart developed
specifically to define digital hardware algorithm.
1.3 Integrated Circuits Digital ICs are often categorized according to their circuit complexity as measured
by the number of logic gates in a single package. The differentiation between
those chips that have a few internal gates and those having hundreds of thousands
of gates is made by a customary reference to a package as being either small-,
medium-, large-, or very large-scale integration device.
Small-scale integration (SSI) devices contain several independent gates in a
single package. The inputs and outputs of the gates are connected directly to the
pins in the package. The number of gates is usually fewer than 10 and is limited by
the number of pins available in the IC.
Medium-scale integration (MSI) devices have a complexity of
approximately 10 to 1,000 gates in single package. They usually perform specific
elementary digital operations.
Large-scale integration (LSI) devices contain thousands of gates in a single
package. They include digital systems such as processors, memory chips and
programmable logic devices.

4
Very large-scale integration (VLSI) devices contain hundreds of thousands of
gates within a single package. Examples are large memory arrays and
microprocessor chips.
1.4 Sequential Circuits Most systems encountered in practice include storage elements, which require that
the system be described in terms of sequential logic. A block diagram of a
sequential circuit is shown in Fig 1.2. It consists of a combinational circuit to
which storage elements are connected to form a feedback path.
Fig 1.2: Block Diagram of Sequential Circuit
The storage elements are devices capable of storing binary information. The
sequential circuit receives binary information from external inputs. These inputs,
together with the present state of the storage elements, determine the binary value
of the outputs. There are two main types of sequential circuits and their
classification depends on the timing of their signals. A synchronous sequential
circuit is a system whose behaviour can be defined from the knowledge of its
Outputs Inputs
Combinational Circuit
Memory Elements

5
signals at discrete instants of time. The other type is the asynchronous sequential
circuit. Its behaviour depends upon the input signals at any instant of time and the
order in which the inputs change.
The basic building block of synchronous sequential logic systems is a flip-flop
which is also a binary storage device capable of storing one bit of information.
1.5 Synchronous Sequential Circuits A synchronous sequential circuit is also referred to as a state machine and the
main advantage of synchronous logic is its simplicity. A logic diagram is referred
to as clocked sequential circuit if it includes flip-flops with clock inputs.
There are two types of synchronous sequential circuit models;
• Moore machine
• Mealy machine
1.5.1 Moore machine In a Moore machine the outputs depend only on the present state as shown in
Fig.1.3. A combinational logic block maps the inputs and the current state into the
necessary flip-flops to store the appropriate next state just like Mealy machine.
However, the outputs are computed by a combinational logic block whose inputs
are only the flip-flops state outputs. The outputs change synchronously with the
state transition triggered by the active clock edge.

6
Fig 1.3: Moore type machine
1.5.2 Mealy machine In a mealy machine, the outputs are a function of the present state and the value of
the inputs as shown in Fig. 1.4. Accordingly, the inputs may change
asynchronously in response to any change in the inputs.
Fig 1.4: Mealy type machine
Combinational
Logic
Memory Elements
Outputs Z X
Inputs
Y
Combinational
Logic
Memory elements
X Inputs
Combinational Logic
Y
Present State
Z
Outputs

7
CHAPTER 2 ALGORITHMIC STATE MACHINES (ASM) 2.1 Introduction Binary information stored in a digital system can be classified as either data or
control information. The Algorithm State Machine methodology partitions a
design into a datapath and control logic. The interaction between the control and
datapath is shown in Fig 2.1.
Fig 2.1: Control and Datapath Interaction
Output Data
Input Data
Control Logic
Datapath
Commands
External Data
8
Complex design problems such as traffic lights control need a structured approach
for visualizing the sequential operations. This is due to the voluminous actions that
are required in such situations. This structural approach is similar to an
algorithmic approach in handling the arithmetic problems such as addition,
subtraction, multiplication or division of numbers.
In the algorithmic approach, we have a well defined procedure which breaks the
total operation into a sequence of small steps which generate the results
irrespective of the number of times the sequence is generated. Similarly, if the
sequential problems which are repetitive in nature and when described verbally
have a massive description can be broken down into small steps(states) and can be
visualized in the form of a flow-chart that has been developed specifically to
define digital hardware algorithm called the Algorithm State Machine chart (ASM
chart.
The ASM chart describes the sequence of events as well as the timing relationship
between the states of a sequential controller and the events that occur while going
from one state to the next.
2.1.1 Comparison between ASM chart and State Diagram
• ASM charts are slightly longer than the state diagram
• State diagrams are compact but difficult to read, that is, sequential
operations can be easily described using ASM charts as compared to state
diagrams
• Due to its structural approach, the construction of ASM chart for complex
systems will be easier than drawing a state diagram.
2.2 The Algorithmic State Machine Chart The chart is composed of three basic elements:
• The State Box
• The Decision Box
• The Condition Box
9
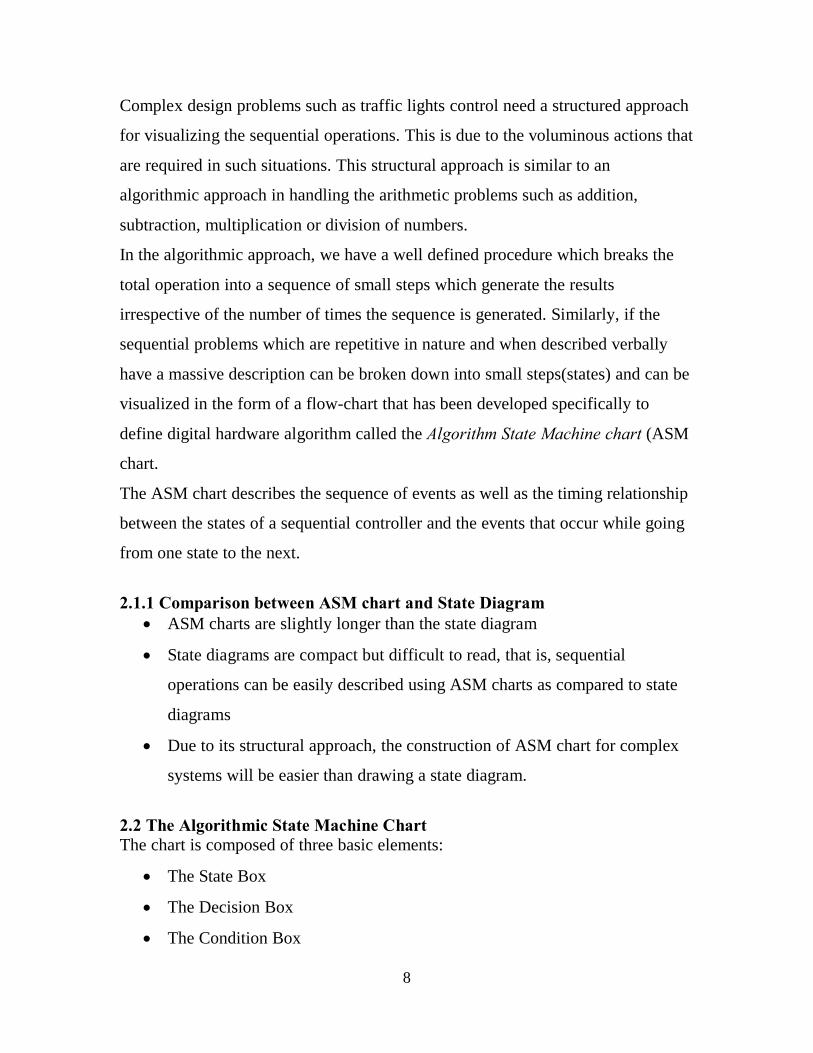
2.2.1 The State Box
The state of the system is indicated by the state box. The shape of the state box is a
rectangle as shown in Fig 2.2 within which are written register operations or
outputs signal names that control generates while being in this state. The state is
given by a symbolic name, which is placed the upper left corner. Each state box
contains only one entry and one exit path.
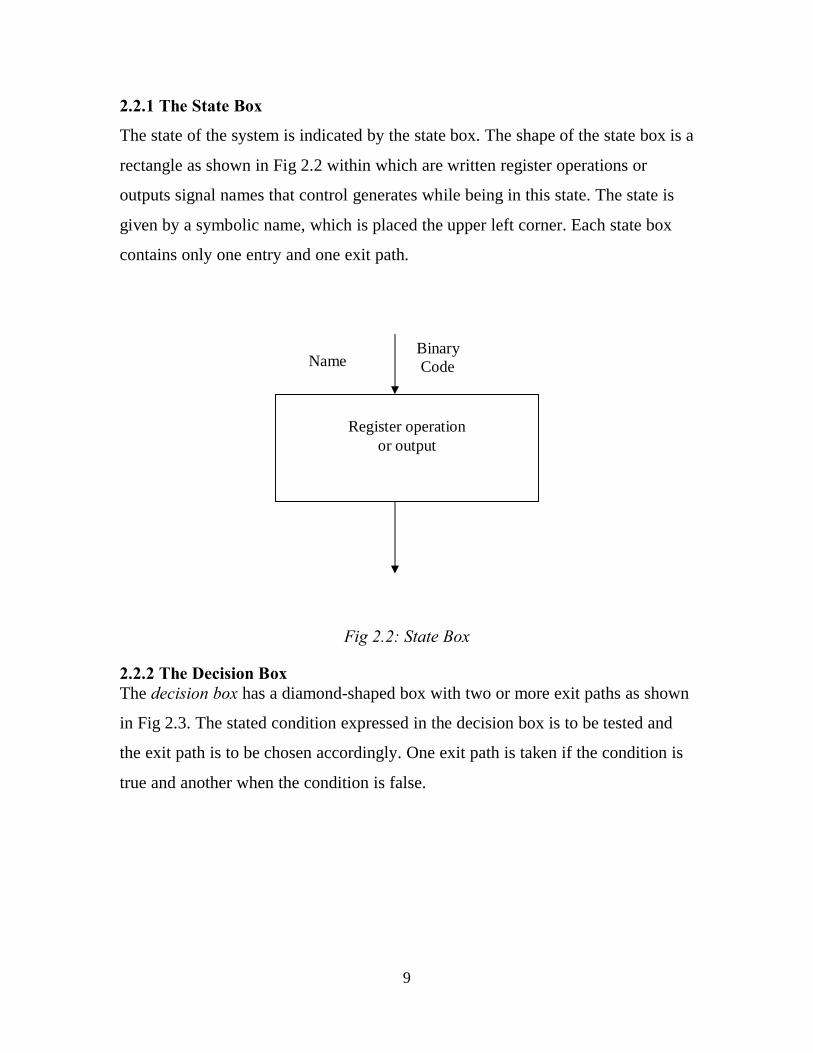
Fig 2.2: State Box 2.2.2 The Decision Box The decision box has a diamond-shaped box with two or more exit paths as shown
in Fig 2.3. The stated condition expressed in the decision box is to be tested and
the exit path is to be chosen accordingly. One exit path is taken if the condition is
true and another when the condition is false.
Register operation
or output
Name Binary Code
10
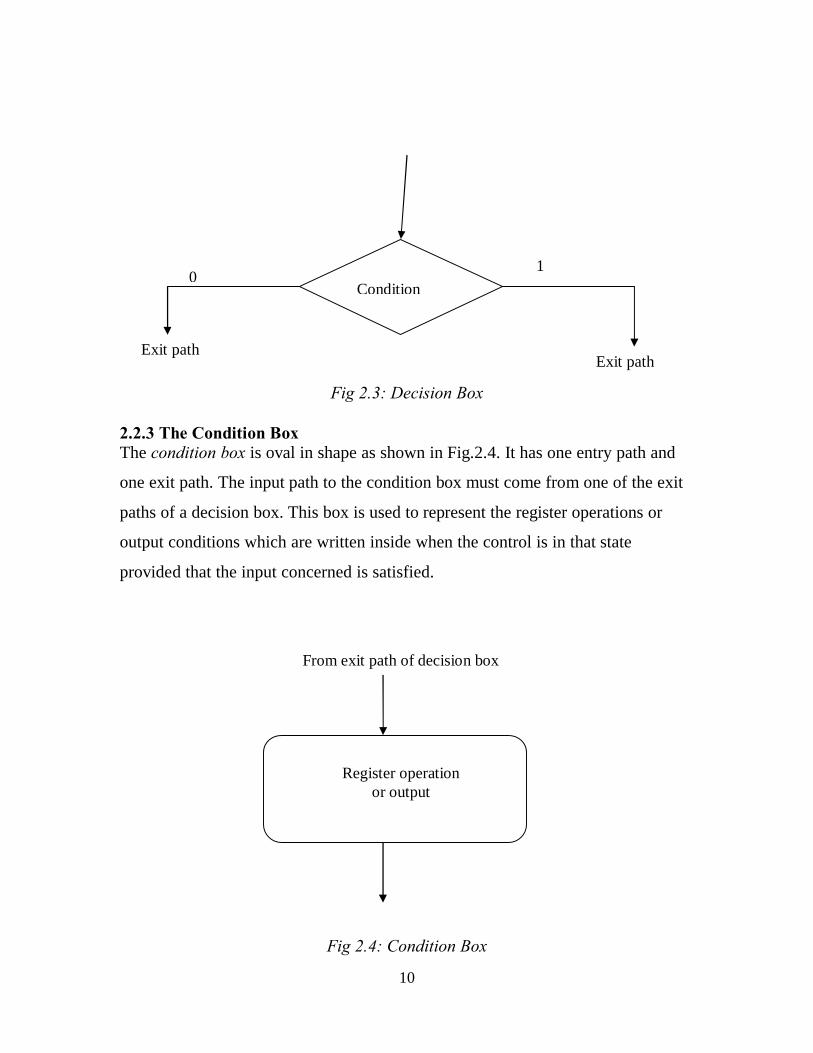
Fig 2.3: Decision Box
2.2.3 The Condition Box The condition box is oval in shape as shown in Fig.2.4. It has one entry path and
one exit path. The input path to the condition box must come from one of the exit
paths of a decision box. This box is used to represent the register operations or
output conditions which are written inside when the control is in that state
provided that the input concerned is satisfied.
Fig 2.4: Condition Box
Register operation or output
From exit path of decision box
Exit path Exit path
1 0
Condition

11
2.3 ASM chart rules
The drawing of ASM charts must follow certain necessary rules:
• The entrance paths to an ASM block lead to only one state box
• Of 'N' possible exit paths, for each possible valid input combination, only
one exit path can be followed, that is there is only one valid next state.
• No feedback internal to a state box is allowed.
Fig 2.5 indicates valid and invalid cases.
Incorrect Correct
Fig: 2.5: Diagram illustrating valid and invalid cases
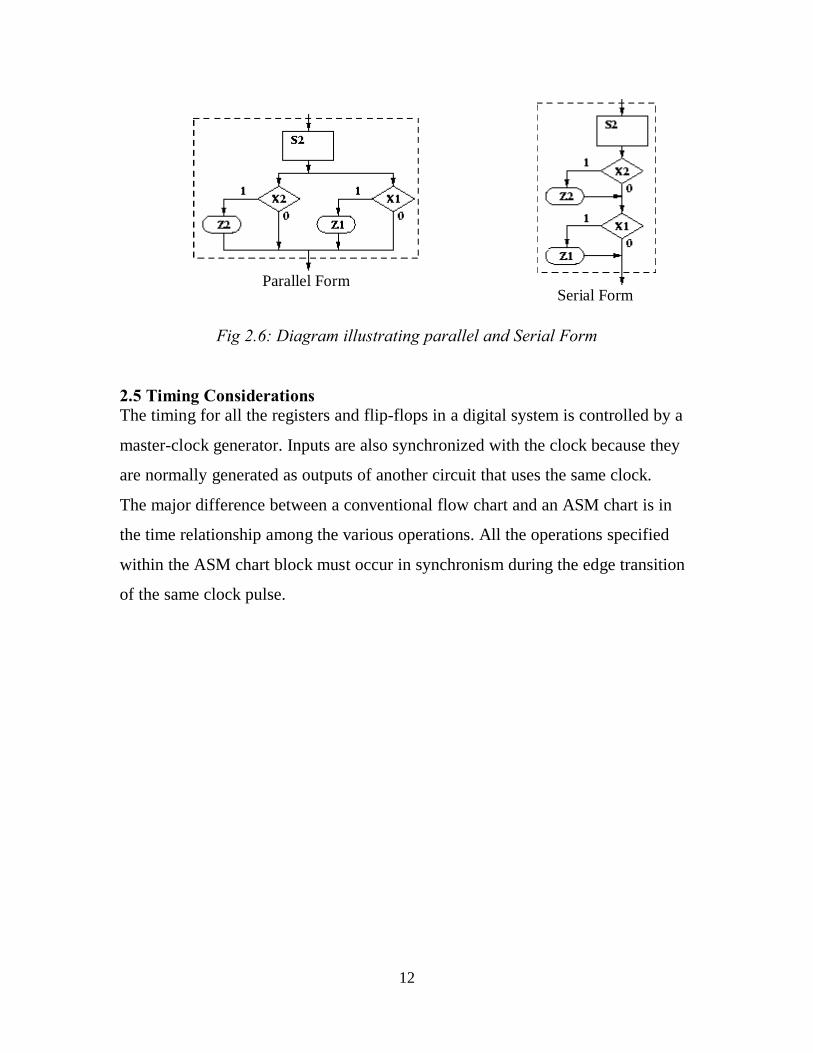
2.4 Parallel vs. Serial Representation
We can bend the rules; several internal paths can be active, provided that they lead
to a single exit path. Regardless of parallel or serial form, all tests are performed
concurrently. Usually we have a preference for the serial form. The following
two examples in Fig 2.6 are equivalent.
12
Parallel Form
Serial Form
Fig 2.6: Diagram illustrating parallel and Serial Form
2.5 Timing Considerations The timing for all the registers and flip-flops in a digital system is controlled by a
master-clock generator. Inputs are also synchronized with the clock because they
are normally generated as outputs of another circuit that uses the same clock.
The major difference between a conventional flow chart and an ASM chart is in
the time relationship among the various operations. All the operations specified
within the ASM chart block must occur in synchronism during the edge transition
of the same clock pulse.

13
CHAPTER 3 IMPLEMENTATION 3.1 Introduction The project involved the design of a vending machine controller that can accept
coins as payment tokens and dispense the required item and also give out change.
The design employs the algorithmic state machine (ASM) approach. The systems
controller is a sequential machine designed to interpret system level control input
sequences and in turn generate level output sequences.
3.2 Problem specification When each coin has been inserted, the controller records the coin value then
facilitates the issuance of proper change if necessary and releases the selected item
otherwise it would return all the inserted coins when less than the required amount
are inserted and there is a delay. The vending machine accepts only Kshs.10 and
Kshs.20 coins.
The block diagram of the vending machine mechanism is shown in Fig. 3.1. Each
block has its features and functions.
Fig3.1: Block Diagram of Vending Machine Mechanism
Vending Machine
Controller And output
Select
Coin Acceptor
Coin Changer
Mineral Water
Release
Cola Soda
Release
14
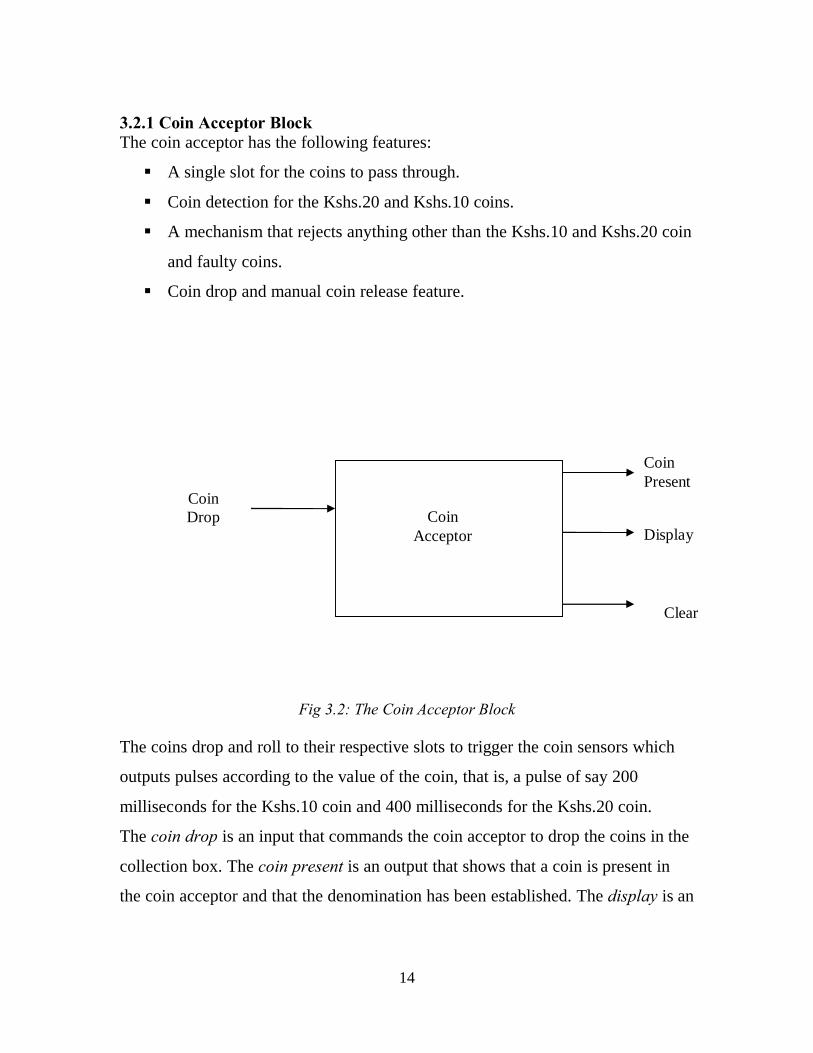
3.2.1 Coin Acceptor Block The coin acceptor has the following features:
§ A single slot for the coins to pass through.
§ Coin detection for the Kshs.20 and Kshs.10 coins.
§ A mechanism that rejects anything other than the Kshs.10 and Kshs.20 coin
and faulty coins.
§ Coin drop and manual coin release feature.
Fig 3.2: The Coin Acceptor Block
The coins drop and roll to their respective slots to trigger the coin sensors which
outputs pulses according to the value of the coin, that is, a pulse of say 200
milliseconds for the Kshs.10 coin and 400 milliseconds for the Kshs.20 coin.
The coin drop is an input that commands the coin acceptor to drop the coins in the
collection box. The coin present is an output that shows that a coin is present in
the coin acceptor and that the denomination has been established. The display is an
Coin Present
Display
Coin Drop
Clear
Coin
Acceptor

15
output that signifies the denomination of the coin present. The clear is an input
that will go to 5V for the duration of the depression of the coin release.
3.2.2 Coin Changer Block It shall have the following features:
§ An electromechanical coin ejection system
§ Automatic load of 200 Kshs.10 coins reserve
The eject coin is an input that is pulse triggered. The ready is an output status that
indicates that it will eject Kshs.10
Fig 3.3: The Coin Changer Block
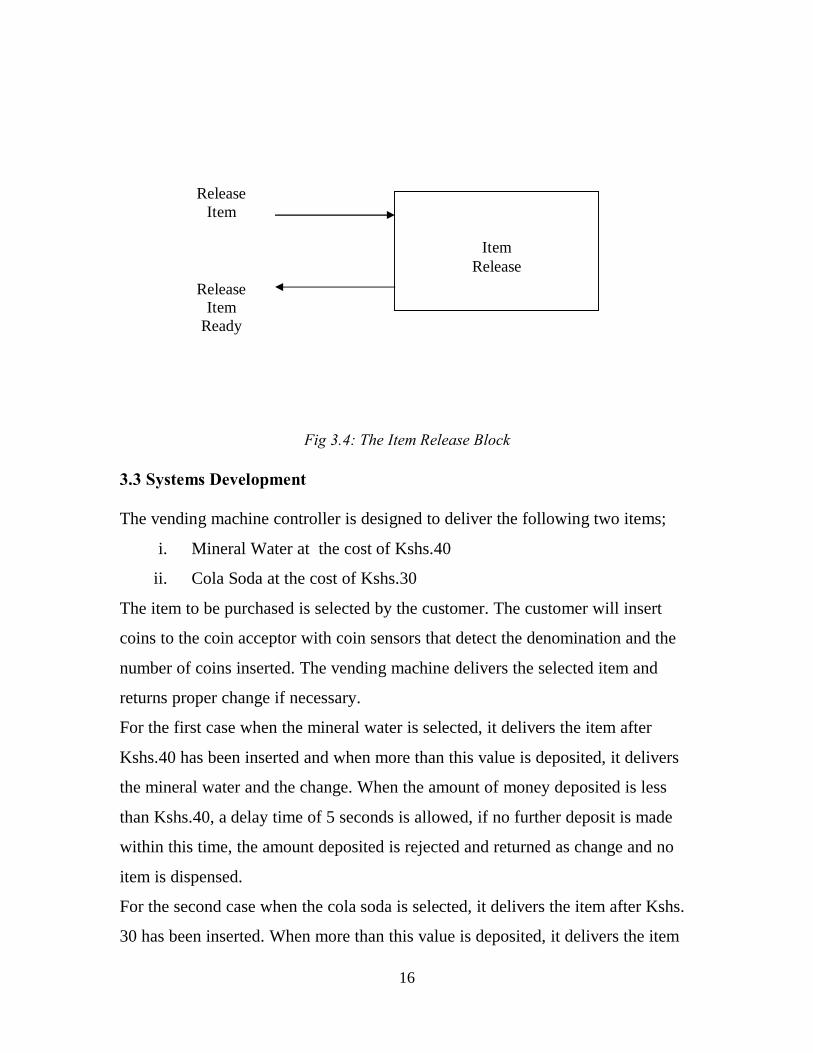
3.2.3 Item Release Block It shall have the following features:
§ An item release input that is pulse triggered.
§ A ready output status that indicates that it will release the selected item
Coin
Changer
Eject Coin
Changer Ready
16
Fig 3.4: The Item Release Block
3.3 Systems Development The vending machine controller is designed to deliver the following two items;
i. Mineral Water at the cost of Kshs.40
ii. Cola Soda at the cost of Kshs.30
The item to be purchased is selected by the customer. The customer will insert
coins to the coin acceptor with coin sensors that detect the denomination and the
number of coins inserted. The vending machine delivers the selected item and
returns proper change if necessary.
For the first case when the mineral water is selected, it delivers the item after
Kshs.40 has been inserted and when more than this value is deposited, it delivers
the mineral water and the change. When the amount of money deposited is less
than Kshs.40, a delay time of 5 seconds is allowed, if no further deposit is made
within this time, the amount deposited is rejected and returned as change and no
item is dispensed.
For the second case when the cola soda is selected, it delivers the item after Kshs.
30 has been inserted. When more than this value is deposited, it delivers the item
Item
Release
Release Item
Release Item
Ready

17
and the change. However, if less than the Kshs.30 is inserted and a delay of 5
seconds is allowed and no more deposit is made, the amount deposited is returned
as change and no item is dispensed.
3.3.1 Definition of States for Cola Soda For the mineral water which costs Kshs.30, the states after each deposition are,
• S0 state equivalent to Kshs.0
• S1 state equivalent to Kshs.10
• S2 state equivalent to Kshs.20
• S3 state equivalent to Kshs.30
• S4 state equivalent to Kshs.40
3.3.2 Reduction of States for Cola Soda Select The item will be dispensed only if Kshs. 30 or more is deposited. This is in states
S3 and S4.The controller will be reset at these states to serve the next customer,
for the reset purposes the coin receiver should contain no money, hence the
controller should be at state S0. Hence, when the cola soda is released it is time to
reset the controller. The states S3 and S4 are equivalent to S0 but the output is
different in each case.
The states are reduced and the distinct states are obtained as follows;
• S0 which is equivalent to states S3 and S4
• S1 state that is equivalent to Kshs.10
• S2 state that is equivalent to Kshs.20
The possible outputs are cola soda dispensed or cola soda dispensed with change.

18
3.3.3 State Assignment Table 3.1: State assignment for cola soda
STATE SYMBOL
BINARY CODE
S0 00 S1 01 S2 10
3.3.4 Definition of states for Mineral Water
• S0 state equivalent to kshs.0
• S1 state equivalent to Kshs.10
• S2 state equivalent to Kshs.20
• S3 state equivalent to Kshs.30
• S4 state equivalent to Kshs.40
• S5 state equivalent to Kshs.50
3.3.5 Reduction of States for the Mineral Water The item will be dispensed only if Kshs.40 or more is deposited. This is in state S4
and S5, the controller is reset at these states to serve the same customer. Hence
states S4 and S5 are equivalent to S0, but the output is different in each case.
The states are reduced and the distinct states are obtained as follows:
• S0 which is equivalent to states S4 and S5
• S1 state equivalent to Kshs.10
• S2 state equivalent to Kshs.20
• S3 state equivalent to Kshs30
The possible outputs are mineral water dispensed or mineral water dispensed with
proper change.

19
3.3.6 State Assignment Table 3.2: State Assignment for mineral water
STATE SYMBOL
BINARY CODE
S0 00 S1 01 S2 10 S3 11
3.3.7 The State Diagram The inputs which are tokens and the outputs which are either item and proper
change can be represented in the state diagram. When the amount deposited is less
than the cost of the item, the machine rejects the item if a delay of 5econds is
realized. Hence delay forms part of the inputs.
The control inputs are represented as follows:
• A to represent Kshs.10
• B to represent Kshs.20
• D to represent the 5 second delay
The outputs are represented as follows:
• X for dispensing or no dispensing of the item
• Y for change or no change of Kshs.10
• Z for change or no change of Kshs.20
The logic values of the external inputs and external output are shown beside the
transition arrows in the state diagram. The directed lines from one state to another
indicate the inputs and the outputs which are path conditions and the transfer
functions respectively.
The state diagrams for the cola soda and mineral water are shown in Fig.3.5 and
Fig.3.6 respectively.
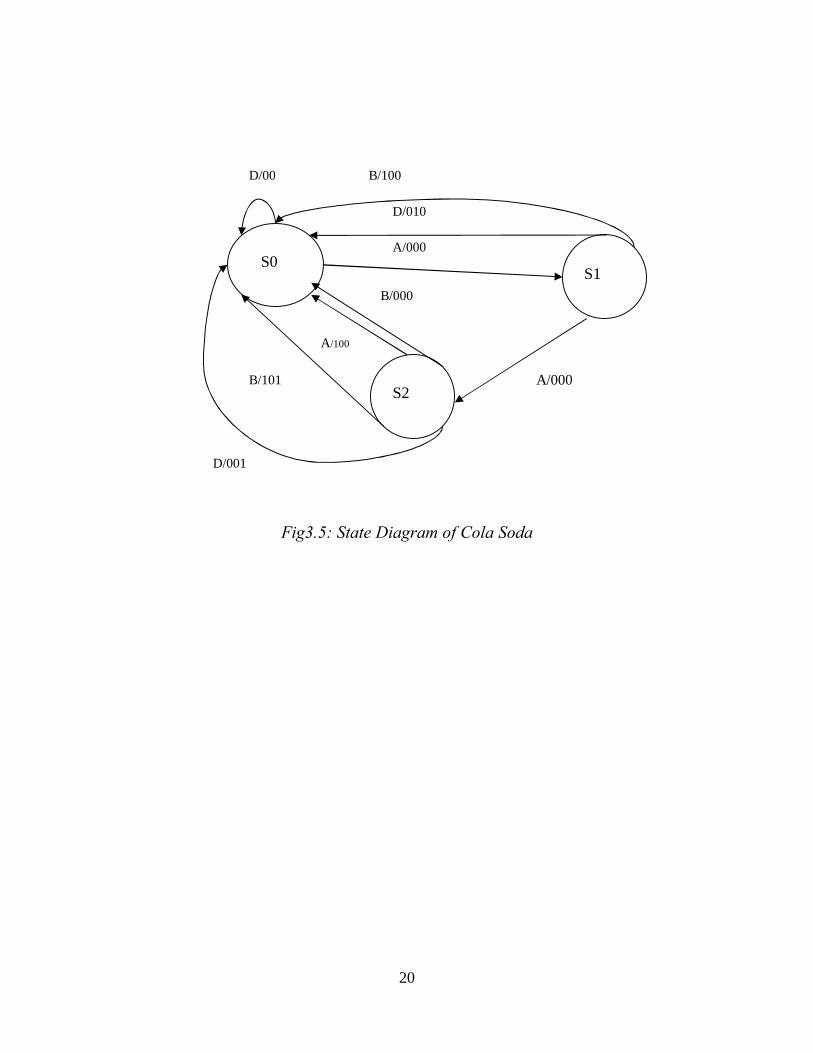
20
Fig3.5: State Diagram of Cola Soda
A/100
B/000
A/000
B/100
B/101
D/001
D/010
S0
S2
S1
A/000
D/00

21
Fig 3.6: State Diagram of Mineral Water
S3
A/100
B/110
D/011
S1
S0
S2
D/010
A/000
B/100
D/001
B/000
D/000
A/000
B/000
A/000

22
3.3.8 The Algorithmic State Machine (ASM) Chart The ASM chart is a type of flow chart describing the sequential operations of a
digital system. It is composed of the state box, the condition box and the decision
box. The ASM chart is very similar to the state transition diagram with each state
box representing a state. The control logic is determined by the decision boxes and
the required transitions. The requirements for the design of the data path are
specified inside the conditional boxes. At the first state,S0 when the controller is
reset, the customer will either choose the cola soda or the mineral water. Each
decision box represents the three possible controller inputs and the exit paths
depend on whether the condition is true or false. The condition boxes represent the
three possible outputs of the controller. The ASM chart of the cola soda and the
mineral water are shown in Fig. 3.7.
State S0 represents the reset state of the controller. When the cola soda, which
costs Kshs. 30, is selected there are three conditions which will be tested, that is,
the delay (D), the Kshs.10 input (A) and the Kshs. 20(B) input. When there is a
delay at this state, no item or change will be dispensed hence the controller resets.
If there is a Kshs 10 input (represented by A), the controller will move to the
second state, that is S1, but if there is A Kshs.20 input(represented by B) the
controller moves to the third state,S2.
At the second state S1, the same three input conditions A, B and D are tested. At
this state, if there is a Kshs 10 input(represented by A) the controller will move to
the third state S2.If there is a Kshs 20 input the controller will dispense the item
and reset because the required amount of Kshs.30 has been input. If there is a
delay at this state Kshs. 10 change is dispensed and the controller resets.
At the third state S2, the three inputs conditions A, B and D are tested. At this
state, if there is Kshs 10 input (represented by A) the item will be dispensed and
controller reset because the required amount of Kshs.30 has been input. If there is
a Kshs.20 input (represented by B) the item and change of Kshs 10 will be

23
dispensed because an amount of Kshs.40 has been input. If there is a delay at this
state change of Kshs. 20 will be dispensed and the machine reset.
When the mineral water, which costs Kshs. 40, is selected there are three
conditions which will be tested, that is, the delay (D), the Kshs.10 input (A) and
the Kshs 20 input (B). When there is a delay at this first state S0, no item will be
dispensed and no change will be dispensed hence the controller resets. If there is a
Kshs 10 input (represented by A), the controller will move to the second state, that
is S1, but if there is a Kshs.20 input (represented by B) the controller moves to the
third state, S2.
At the second state S1, the same three input conditions A, B and D are tested. At
this state, if there is a Kshs 10 input(represented by A) the controller will move to
the third state S2.If there is Kshs. 20 input the controller moves to the fourth
state,S3. If there is a delay at this state Kshs. 10 change is dispensed and the
controller resets.
At the third state S2, the inputs conditions A, B and D are tested. If there is a Kshs.
10 input (represented by A), the controller will move to the fourth state, S3. If
there is a Kshs 20 input (represented by B), the item will be dispensed and the
controller reset because the required amount of Kshs. 40 has been input. If there is
a delay at this state Kshs. 20 change is dispensed and the controller resets.
At the fourth state S3, if there is a Kshs. 10 input, the item will be dispensed and
the controller reset because the required amount of Kshs. 40 has been input. If
there is a Kshs. 20 input, the item and change of Kshs 10 will be dispensed and the
machine will be reset. If there is a delay at this state, Kshs 30 change is dispensed
and the controller resets.

24
Fig 3.7: ASM chart of cola soda and water
25
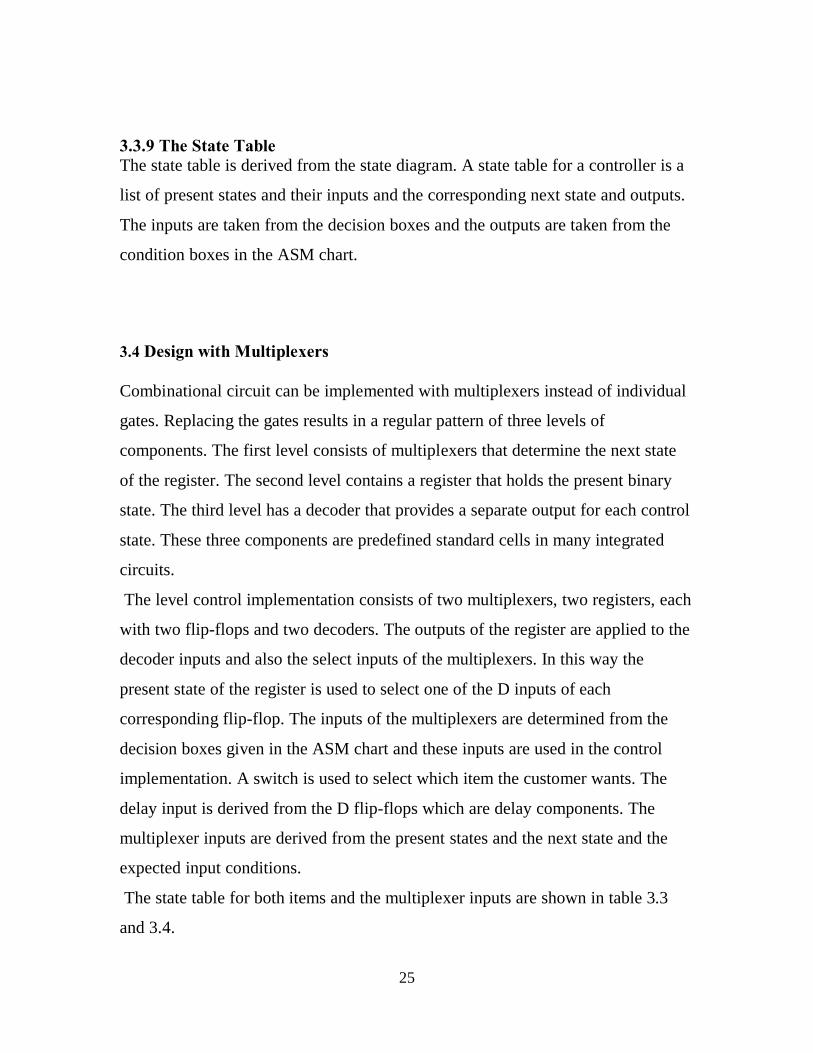
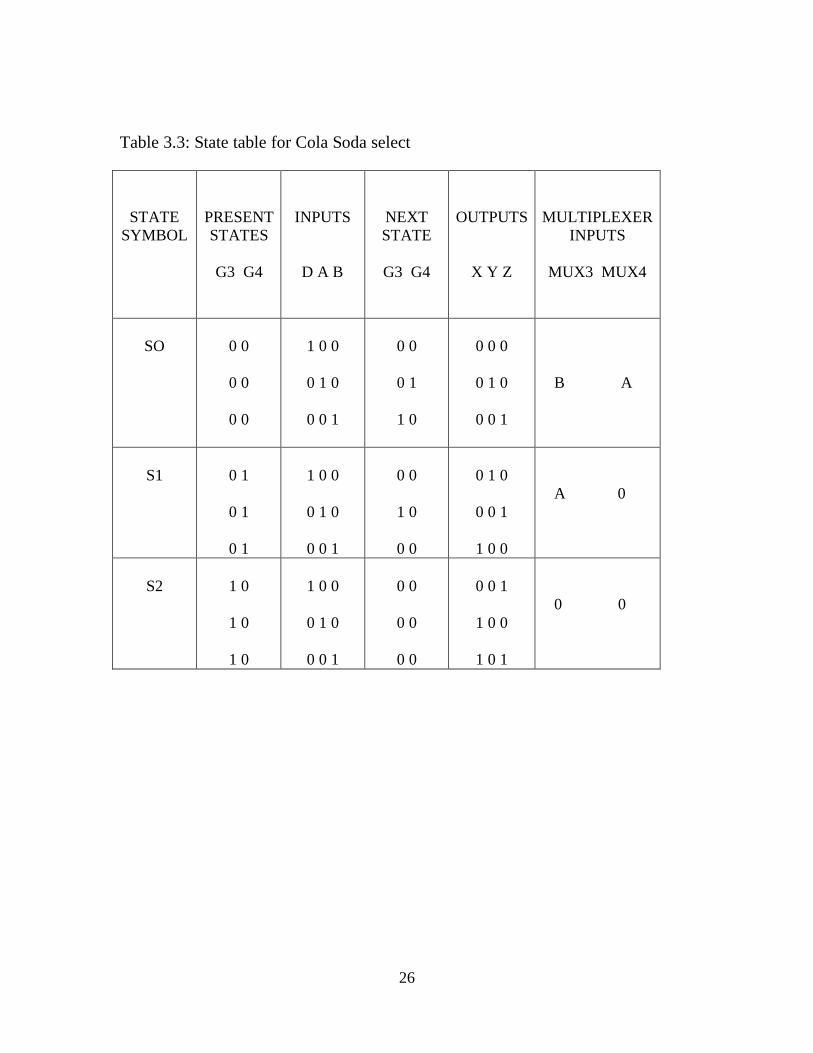
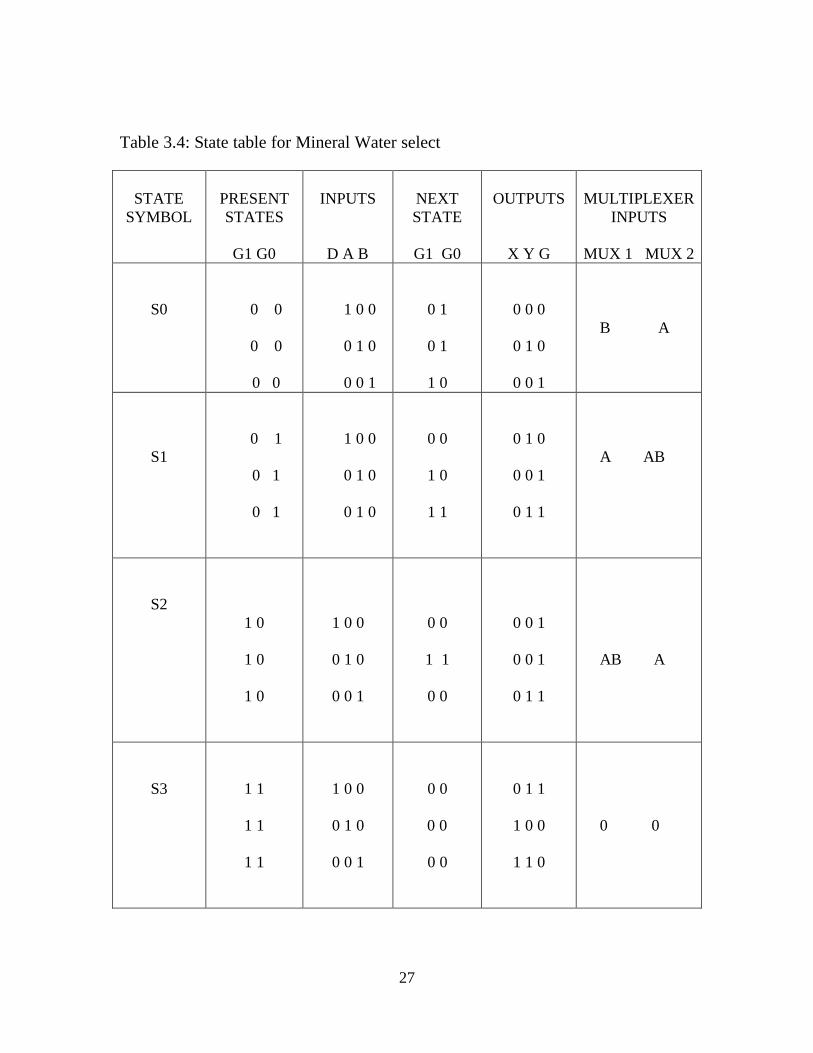
3.3.9 The State Table The state table is derived from the state diagram. A state table for a controller is a
list of present states and their inputs and the corresponding next state and outputs.
The inputs are taken from the decision boxes and the outputs are taken from the
condition boxes in the ASM chart.
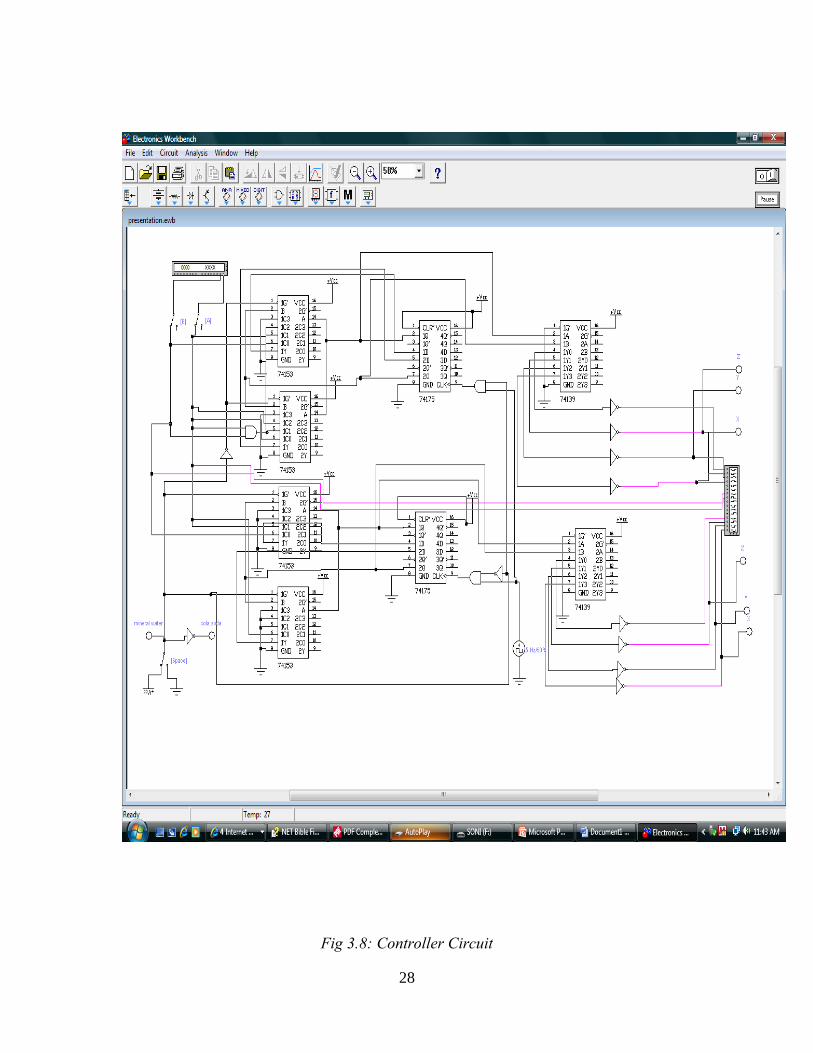
3.4 Design with Multiplexers Combinational circuit can be implemented with multiplexers instead of individual
gates. Replacing the gates results in a regular pattern of three levels of
components. The first level consists of multiplexers that determine the next state
of the register. The second level contains a register that holds the present binary
state. The third level has a decoder that provides a separate output for each control
state. These three components are predefined standard cells in many integrated
circuits.
The level control implementation consists of two multiplexers, two registers, each
with two flip-flops and two decoders. The outputs of the register are applied to the
decoder inputs and also the select inputs of the multiplexers. In this way the
present state of the register is used to select one of the D inputs of each
corresponding flip-flop. The inputs of the multiplexers are determined from the
decision boxes given in the ASM chart and these inputs are used in the control
implementation. A switch is used to select which item the customer wants. The
delay input is derived from the D flip-flops which are delay components. The
multiplexer inputs are derived from the present states and the next state and the
expected input conditions.
The state table for both items and the multiplexer inputs are shown in table 3.3
and 3.4.
26
Table 3.3: State table for Cola Soda select
STATE SYMBOL
PRESENT STATES
G3 G4
INPUTS
D A B
NEXT STATE
G3 G4
OUTPUTS
X Y Z
MULTIPLEXER
INPUTS
MUX3 MUX4
SO
0 0
0 0
0 0
1 0 0
0 1 0
0 0 1
0 0
0 1
1 0
0 0 0
0 1 0
0 0 1
B A
S1
0 1
0 1
0 1
1 0 0
0 1 0
0 0 1
0 0
1 0
0 0
0 1 0
0 0 1
1 0 0
A 0
S2
1 0
1 0
1 0
1 0 0
0 1 0
0 0 1
0 0
0 0
0 0
0 0 1
1 0 0
1 0 1
0 0
27
Table 3.4: State table for Mineral Water select
STATE
SYMBOL
PRESENT STATES
G1 G0
INPUTS
D A B
NEXT STATE
G1 G0
OUTPUTS
X Y G
MULTIPLEXER
INPUTS
MUX 1 MUX 2
S0
0 0
0 0
0 0
1 0 0
0 1 0
0 0 1
0 1
0 1
1 0
0 0 0
0 1 0
0 0 1
B A
S1
0 1
0 1
0 1
1 0 0
0 1 0
0 1 0
0 0
1 0
1 1
0 1 0
0 0 1
0 1 1
A AB
S2
1 0
1 0
1 0
1 0 0
0 1 0
0 0 1
0 0
1 1
0 0
0 0 1
0 0 1
0 1 1
AB A
S3
1 1
1 1
1 1
1 0 0
0 1 0
0 0 1
0 0
0 0
0 0
0 1 1
1 0 0
1 1 0
0 0
28
Fig 3.8: Controller Circuit

29
CHAPTER 4 RESULTS AND DISCUSSIONS 4.1 Introduction The simulation software used to obtain the results was the Electronics Workbench
Version 5.1.The results obtained have been discussed in this chapter.
The inputs of the controller are connected through the word generator. The word
generator is used to send digital words or pattern of bits in the circuits to test them.
It can drive a digital circuit by producing streams of 16-bit words. Each word in
the scroll window has an address expressed as a 4-character hexadecimal number.
The probes are used as logic displays for the inputs, the item to be selected and
the outputs. The logic analyzer is used to display the waveforms during simulation
for analysis. A clock of 5 hertz frequency and 50% duty cycle has been used.
4.2 Expected Controller Response The controller system receives coins and displays outputs accordingly. The input
signals were square pulses respective to the amount of money inserted, that is, the
Kshs. 20 coin is represented by a pulse of 400 milliseconds and the Kshs. 10 coin
is represented by a pulse of 200milliseconds.
4.2.1 Case 1 for Mineral Water Select The item costs Kshs 40 and when the total sum equals to the required amount, a
pulse is generated that dispenses the item and resets the controller. The item was
dispensed when one pulse representing Kshs 20 and two pulses representing Kshs
10 are generated.
When less this amount is generated, the controller generates a pulse which
represents that change has been dispensed.

30
4.2.2 Case 2 for Cola Soda Select When the total sum equals to the required sum, that is Kshs 30 or more, a pulse is
generated that dispenses the item, dispenses change if necessary and resets the
controller.
In summary the time delay causes the coins that are input to be rejected if it is less than the amount needed to release the item. 4.3 Results 4.3.1 Waveforms Representing Mineral Water Select The waveforms show that the item is dispensed only after the required amount is
input, that is, a pulse that dispenses the item is generated when one pulse
representing Kshs. 20 and two pulses representing Kshs. 10 are generated. In the
case where less this amount is input, the controller dispenses the required change
and resets. The waveforms are shown in Fig. 4.1.
4.3.2 Waveforms representing Cola Soda Select The waveforms show that a pulse that dispensed the item was generated when the
amount input was Kshs. 30 or more. In the case where less the required amount is
input, the controller dispenses the required change and resets. The waveforms are
shown in Fig 4.2.
4.4 Discussion The behaviour of the controller agrees with the expected theoretical results. For
example, when the cola soda was selected, the item is dispensed only after an
amount of Kshs. 30 or more is input and when less this amount is input, the
required change is dispensed. Similarly, when the mineral water is selected the
item is dispensed only after an amount of Kshs. 40 is input and when less this
amount is input, necessary change is given.

31
Fig 4.1: Waveforms representing Mineral Water select

32
Fig 4.2: Waveforms representing Cola-Soda Select
33
CHAPTER 5 CONCLUSION AND RECOMMENDATIONS 5.1 Conclusions The algorithmic state machine methodology is used in the design of the vending
machine controller and it proves to be important because sequential operations are
easily described due to its structural approach. The method therefore was simple,
clear and easy to use.
The main aim of the control logic which uses multiplexers, registers and decoders,
being to design a circuit that implements the desired control sequence in simple
manner, therefore the design proves effective.
The results obtained agree with the theoretical expectations.
However in an actual circuit results would be affected by noise because many
digital circuits are quite sensitive to errors occurring from noise. A noise spike can
reverse the polarity of a digital pulse and therefore create logic change transitions
when they should not occur. This can cause triggering and synchronization
problems in the circuit. Noise spikes whether stray glitches or frequent
occurrences most often get into the circuit through the power supply. A good
power line filter or a surge suppressor often will clear up noise related problems.
Internal circuit filtering is also helpful.
5.2 Recommendations for further work A digital vending machine controller design problem can be better solved by a
micro-processor based controller. This is useful when the number of items that can
be dispensed is large or when the dispensed item has to be measured, say in
volume, for example coffee machine dispenser. However using the micro-
processor-based controller may not offer the best option based on lower cost
considerations.
The major requirements however are efficiency and practicability of the controller.

34
REFERENCES
1. M. MORRIS MANO, DIGITAL DESIGN
THIRD EDITION, PRENTICE –HALL INC, 2002
2. MARK ZWOLINSKI, DIGITAL DESIGN SYSTEM WITH VHDL
PRENTICE-HALL INC, 2003
3. http:// www.mwn.snu.ac.kr/nschoi/courses/201/course-
materials/8.CHO8.rev.ppt
4. http:// masters.donntu.edu.ua/2005/fvti/borovlev/library/fsm_design.pdf
5. http:// www.cimat.mv?~scr?dsd-08-l/fsm3.pdf
6. http:// www.coe.uncc.edu?/~sjkuyath?ETEE3183/vending machine.pdf
7. http:// www.tamu.edu/classes/klbutler/lect14.pdf
8. http://www.cis.uoguelph.ca/~sawada/2910/notes?fsm-1*2.pdf
9. http://www.cs.tct.ie/Suhaib.Fahmy/files/lecture.8.pdf

35