eindhoven university of technology master digital vending · eindhoven university of technology ......
TRANSCRIPT
Eindhoven University of Technology
MASTER
Digital vending
Smits, S.P.
Award date:2015
DisclaimerThis document contains a student thesis (bachelor's or master's), as authored by a student at Eindhoven University of Technology. Studenttheses are made available in the TU/e repository upon obtaining the required degree. The grade received is not published on the documentas presented in the repository. The required complexity or quality of research of student theses may vary by program, and the requiredminimum study period may vary in duration.
General rightsCopyright and moral rights for the publications made accessible in the public portal are retained by the authors and/or other copyright ownersand it is a condition of accessing publications that users recognise and abide by the legal requirements associated with these rights.
• Users may download and print one copy of any publication from the public portal for the purpose of private study or research. • You may not further distribute the material or use it for any profit-making activity or commercial gain
Take down policyIf you believe that this document breaches copyright please contact us providing details, and we will remove access to the work immediatelyand investigate your claim.
Download date: 15. Jun. 2018

EINDHOVEN UNIVERSITY OF TECHNOLOGY Industrial Engineering & Innovation Sciences
Eindhoven, 14-11-2014
Digital Vending – Master Thesis
By
S.P. (Sebastiaan) Smits (0628270)
Supervisors Prof. Dr. A. J. van Weele TU/E, ITEM Dr. Ir. I.T.P. Vanderfeesten TU/E, ITEM Jochem Snels Maas International BV
Digital Vending – Final Report 14-11-2014 2
TUE. School of Industrial Engineering. Series Master Thesis Innovation Management Subject headings: telemetry, Big Data, database marketing, business intelligence, analytics, Internet of Things, data modeling, data architecture

Digital Vending – Final Report 14-11-2014 3
Abstract Technological development is growing fast in the vending machine industry, but is still slowly adopted by most companies. Telemetry and digital communication solutions are considered to be important technologies to be embedded nowadays, as they enable vending machine companies and operators to facilitate operations more efficient, and open doors to new business opportunities and business models, embracing up-sell opportunities and offering an entirely new consumer experience by interacting with the end-consumer. This Thesis gives answer to the implementation questions, business opportunities and knowledge gaps in literature regarding telemetry in the vending machine industry.

Digital Vending – Final Report 14-11-2014 4
Management Summary
Introduction
Technological development is growing fast in the vending machine industry, but is still slowly adopted by most companies. Telemetry and digital communication solutions are considered to be important technologies to be embedded nowadays, as they enable vending machine companies and operators to facilitate operations more efficient. This can result in massive savings on operations by eliminating inefficient routes and over servicing machines. Telemetry and digital communication technologies also open doors to new business opportunities and business models, embracing up-sell opportunities and offering an entirely new consumer experience by interacting with the end-consumer. In the past two decades, Maas Internationals’ (MI) focus lied on short-term success and cost reductions. In 2013, MI decided that telemetry was one the next steps to success, embracing MI’s goal to shift from a technocratic focus towards a consumer-oriented focus. However, there was no clear strategy attached or project management created. This problem statement drawn in this research outlined a lack of knowledge on the potential benefits of telemetry and accordingly its implementation. The problem has direct and indirect consequences for MI as an organization on strategic level. Extracted from this problem statement, a main research question is formulated.
“How should telemetry and other digital communication technologies be implemented and what business opportunities could be captured and implemented
through the adoption of those for Maas Internationals vending machines and service concepts?”
Although existing literature addresses specific and profound knowledge on business intelligence (BI), Big Data and database marketing, academic literature on bringing them together, especially analytical BI and interactive marketing, is weak. The integration of both analytical BI and interactive marketing has not been studied as best, as developments in digital communication technologies that enable opportunities for interactive marketing, are very recent. In this gap in literature lies an opportunity for researchers to make a strong contribution to business theory and practice. Integrating two disparate functions in organizations, namely marketing and information services (IS), has become a critical business concern due to the increasing use of information technology (IT) to find and open new markets, deliver improved services to customers, and streamline internal marketing processes (Nakata et al., 2011).
Research methodology
An extensive literature review on the topics telemetry, business intelligence, Big Data, Internet of Things and database marketing was used to construct a conceptual research model. This research has a design-focused business problem-solving format, meaning much effort is put into the design of the solution and into the

Digital Vending – Final Report 14-11-2014 5
accompanying implementation process. For the examination of the conceptual research model, five internal semi-structured in-depth interviews were conducted at MI and two external semi-structured in-depth interviews were conducted at The Valley and BrandLoyalty. Next, fifteen semi-structured interviews were conducted for the formation of MI’s future telemetry solution regarding a customer value proposition, definition of both data and functional requirements, formation of business opportunities and a business case.
Research model
Following the findings of all internal and external semi-structured interviews, the conceptual research model was examined and adjusted accordingly. Figure A shows the final research model, which can also be considered as the functional requirements of MI’s future telemetry solution. Based on the findings in this Thesis, the final research model can be used by organizations when implementing a technology drawn from the integration of analytical BI and interactive marketing. All data and organizational factors are assumed to strengthen this integration and projects drawn from this integration.
Conclusions
The implementation of telemetry inside MI is build up from two parts: (1) the data requirements of MI’s future telemetry solution drawn from the customer value proposition and based on the prioritized benefits and (2) the functional
Figure A Final research model
Digital Vending – Final Report 14-11-2014 6
requirements covering all necessary data and organizational promoters drawn from the research model. Next, five business opportunities drawn from the implementation of telemetry are identified and described in this Thesis. Four of those focus on Business-to-Business (B2B) and one on Business-to-Consumer (B2C). The B2B business opportunities are: (1) the creation of a customer marketing platform, (2) advertising opportunities through vending machine screens, (3) the offering of multiple telemetry packages and (4) the sales of data. The B2C business opportunity withholds: (5) the creation of a mobile consumer App. To support decision-making at MI on the financial aspects of implementing telemetry, a business case is drawn. A worst and best case scenario is drawn including the net present value (NPV), internal rate of return (IRR) and discounted payback period (DPP). The worst case scenario gives a NPV of € 3.316.100, an IRR of 26% and a DPP of 2,5 years. The best case scenario gives a NPV of € 8.837.957, an IRR of 49% and a DPP of 1,5 years. Based on the NPV’s of both worst and best case scenarios, implementing telemetry seems highly profitable. Though, MI should not only judge telemetry on its financial benefits, but also on its power to be a key enabler in optimizing MI’s operations and inventory management, and open doors to new business opportunities that can be monetized both on the short- and long-term.
Theoretical implications
Several theoretical implications can be taken into account when examining this research. First of all, this research contributes to literature in a way that it provides a research model integrating analytical business intelligence and interactive marketing. Second, this research contributes to literature by examining not only technological or data influencers, but also organizational influencers. Third, this research contributes to literature as it is the first research performed about the implementation of telemetry in the vending industry.
Practical implications
Several practical implications can be defined based upon this research. As this Thesis is considered as a design-focused business problem-solving project, it is closely linked to the current practical situation at MI. The most important practical implications are: (1) the assumption of equipping 100% of the vending machines installed base with telemetry when calculating the business case, (2) the uncertainty regarding the introduction of NFC chips in mobile phones and debit cards, (3) the high mobile payment transaction costs, (4) taken into account human capital when rescheduling operator routes, (5) the governance of collected data and finally (6) MI’s working culture that has to adapt to a different type of decision-making.

Digital Vending – Final Report 14-11-2014 7
Reflection
When reflecting the telemetry design to the existing situation at MI, there can be concluded that MI has two out of three data and organizational promoters, included in the research model, present after finishing this Thesis. To successfully implement telemetry the presence of data “scientists” and the cooperation between IT and marketing is of vital importance. When reflecting the telemetry design to the existing situation at MI, there should be noted that it is important to start with implementing only the prioritized benefits (primarily on technology and operational level), and add more functionality once the telemetry design actually works. Seen the influence telemetry can have on MI’s daily activities, it is important to minimalize the risk and start with a limited number of customers and gain experience with the implementation process. If successfully implemented, MI can expand to more customers.

Digital Vending – Final Report 14-11-2014 8
Table of Contents
Digital Vending – Final Report 14-11-2014 9
1 Introduction This chapter gives an introduction of the project context, the problem context and accordingly its research plan. Paragraph 1.1 outlines the project context of this master Thesis. The problem definition is described in paragraph 1.2 and from this; a problem statement is drawn and stated in paragraph 1.3. Next, all research questions are outlined in paragraph 1.4 while the research methodology is explained in paragraph 1.5.
1.1 Project Context
Maas International is the Dutch market leader in specialized vending machines for hot and cold drinks. Headquartered at Son, the Netherlands, it develops, sells and operates vending machines for large and medium sized businesses in the Benelux, Germany, UK and Denmark. With over 1.100 full-time employees and 50.000 vending machines, Maas International services 1.5 million consumers every day. The foundation of the company was established in 1889 in a small cigar factory. The arrival of the cigarette deployed wholesale activities in the Tabaco industry. Starting with cigarette vending machines in the sixties, they later added hot and cold drinks vending machines. Until this day, Maas International generates an annual sales revenue exceeding € 145 million. The Maas organization consists of two divisions: Maas International Europe BV and the wholly owned subsidiary Spengler GmbH in Germany. Maas International Europe BV is responsible for sales and operations whereas the latter focuses on R&D and in-house development of the vending machines. Maas International’s business model is focused around sales per click and ingredient sales, whereby Maas international (hereafter “MI”) in most cases is responsible for full service operating of the vending machines. Alternatively, agreements can be made through which the vending machines are sold and actually owned by the customer. In the latter situation, MI delivers ingredients and technical services at the customer’s request. Customers can choose from a range of ingredients, including different coffee A-brands (such as Lavazza, Segafredo) or private label. Besides vending machines, MI also opened several Micaffès; espresso bars offering hot and cold drinks and snacks. Lastly, MI recently started a new micro market self-service concept offering several A-brands, named Mi Express. Technological development is growing fast in the vending machine industry, but is still slowly adopted by most companies. Telemetry and digital communication solutions are considered to be important technologies to be embedded nowadays, as they enable vending machine companies and operators to facilitate operations more efficient. This can result in massive savings on operations by eliminating inefficient routes and over servicing machines. Telemetry and digital communication technologies also open doors to new business opportunities and business models,

Digital Vending – Final Report 14-11-2014 10
embracing up-sell opportunities and offering an entirely new consumer experience by interacting with the end-consumer.
1.2 Problem definition
In extensive consultation with Maas International, several problems and sub-problems were discussed in order to define a problem definition. As Van Aken et al. (2007) stated; a problem refers to a state-of-affairs that is directly related to an unsatisfactory performance. In order to get more insights in MI as an organization and identify underlying problems and sub-problems, nine intensive interviews were conducted. Also, according desk research and relevant literature was studied while forming the problem definition. Appendix A shows all the interviewed stakeholders for the problem definition, lightened by the color green. More information about this data analysis tool is given in paragraph 1.5.3. Table 1.1 shows a quick overview of the resources used drawn from Appendix A. To get an overview of all collected information and to identify all cause-and-effect
related weaknesses, an Ishikawa Diagram is drawn on the topics machine, market, process, business intelligence and personnel (Appendix B). From this, a problem statement is extracted. Machine The costs of ownership of the vending machines are increasing, while margins are decreasing as more players enter the market. Together with MI’s relatively small volume, it prevents the company of developing new vending machines every three years adapted to market changes and customer needs. The vending machines that are currently operating are outdated, lacking up-to-date design and offering limited payment solutions and opportunities for displaying content. Furthermore, service errors need to be called or emailed through by the customer. Finally, risk of theft is applying as MI’s employees collect money by hand when servicing the machines. Market In recent years, retailing innovations accelerated the globalization of retailing and globalization by retailers (Reinartz et al., 2011). In comparison, the vending industry stagnated and slowly adopted new technologies. While the retail industry focused more on customer needs and market demands, the vending industry primarily focused on improving back-end efficiencies such as vending management software (VMS), data exchange (DEX), telemetry, pre-kitting, pick-to-light, and dynamic scheduling (Patel, 2012). Vending operating companies in the USA are already shifting towards a more consumer-aimed focus; adopting technologies that enable
Table 1.1 Resources used for problem definition
Digital Vending – Final Report 14-11-2014 11
vending machines to interact with the end-consumer (MEI, 2012). MI however, held a service-oriented focus, unburdening its customers by providing service and listening to their needs. This while the market changed to a more consumer-oriented focus including new market demands and consumer needs. Process At this moment, work plans of operating routes are calculated by an algorithm based on prior experience and historical revenue data. A work plan is a planning made by a planning operator of MI and includes the servicing route of vending machines for an operator. These work plans do not include the amount of inventory that is needed per vending machine. There is no real-time insight in how much inventory a vending machine exactly has or needs. This lack of insights results in operators over servicing vending machines, which means they have to walk twice to their truck for inventory, or return with remaining stock. This also has a negative effect on the depreciation of ingredients as snacks and soda, as to much inventory is purchased. In 1990, MI changed the vending industry market by replacing coffee serving personnel with vending machines. Since then, the company withholds a technocratic and service-oriented focus without coming up with new innovative solutions. Nowadays, this forces MI (the only company in its market with in-house manufacturing) to buy more advanced and consumer focused machines from third parties, instead of developing them internally. There can be concluded that MI failed to give ear to increasingly important and changing consumer needs and market demands. Furthermore, during interviews with all-important stakeholders, it became clear that MI is currently reforming its organizational structure; a new CEO and COO are introduced, a marketing department is formed from scratch and cooperation with all interim managers is ended. These processes all disrupt the telemetry project. All stakeholders agree by stating telemetry is the next step to success, as this and other digital technologies enable communication with the end-consumer in order to increase revenues and explore new business opportunities. It also embraces its goal to shifts towards a consumer-oriented focus. However, there seems to be no clear strategy attached that outlines a higher purpose or goal. In the past two decades, the focus lied on short-term success and cost reductions. Business Intelligence In 2004, MI successfully integrated an operational connectivity system based on PDA’s. Until this day, operators transfer inventory data uploaded from vending machines to the back-office of MI. Although MI is eager to implement telemetry, it is still not clear if the current IT infrastructure can carry any type of telemetry solution. Besides that, MI’s current SAP system is old and difficult to adjust. Changing the price of a product or the product itself takes three months of throughput time. Requesting sales data from a vending machine takes several days to retrieve. Furthermore, the BI of MI doesn’t include the capacity of collecting consumer insights.
Digital Vending – Final Report 14-11-2014 12
Personnel If MI implements any kind of telemetry solution and data needs to be analyzed for further actions, it will need to have internal competences capable of managing these data processes. As Davenport et al. (2012) outlined, this type of data solution needs professionals (or data “scientists”) who know how to interact with the data itself, namely obtaining, extracting, manipulating and structuring it. They need to have creative IT skills and need to work closely with other processes within an organization and communicating effectively with decision-makers. Besides knowing how to handle the data, MI has a lack of understanding in how to use analytics to improve business. Furthermore, there seems to be no action plans or objectives attached to implementing telemetry. This is not an unfamiliar phenomenon. According to O’Regan et al. (2011), most firms do not have a clear strategy how data collected from different touch-points can be used for launching (personalized) marketing strategies. The lack of internal competences and objectives for implementing telemetry results in missing business opportunities.
1.3 Problem Statement
According to van Aken et al. (2007), the main problem in a business-problem solving (BPS) project refers to an unsatisfactory performance or state-of-affairs that can be solved within a reasonable amount of time, spending a reasonable amount of resources, which in this case is the lack of knowledge on the potential benefits of telemetry and its according implementation. The problem has direct and indirect consequences for MI as an organization on strategic level. Summarized, the problem statement outlines as follows:
“Over the years MI became less innovative, resulting in a lack of knowledge on the potential benefits of telemetry and accordingly its implementation.”
1.4 Research Questions
Based upon the assignment, the following research question and (5) sub-questions can be formulated. The main research question states:
“How should telemetry and other digital communication technologies be
implemented and what business opportunities could be captured and implemented through the adoption of those for Maas Internationals vending machines and service
concepts?”
1. What is the role and importance of telemetry and other digital technologies
for the vending machine industry and other industries?
2. What business opportunities can be expected from telemetry and other
digital technologies and how would these affect Maas’ current business and
innovation model?
3. What customer benefits can be expected from these new technologies?

Digital Vending – Final Report 14-11-2014 13
4. How should telemetry and other digital technologies be implemented?
5. How could these benefits and business opportunities translate into a sound
business case for Maas International?
1.5 Research Methodology
This research will have a design-focused business problem-solving format, meaning much effort is put into the design of the solution and into the accompanying implementation process. A research framework can be formed to give a quick overview of the overall scope and structure of the project (figure 1.1). As being outlined in this chapter, the problem definition will be defined. Next, chapter 2 describes an extensive literature review about all related topics. Chapter 3 will describe MI’s future customer value proposition for telemetry and accordingly a market benchmark. From here, all data requirements will be defined in chapter 4, whereas all functional requirements will be examined in chapter 5 based on the internal and external in-depth interviews. These combined will form the basis of MI’s future telemetry solution and design. Next, chapter 6 will outline all business opportunities drawn from the implementation of telemetry, where chapter 7 outlines a solid business case to give the board of director’s assistance in decision-making. Chapter 8 concludes this Thesis by given answer to all research questions and discuss theoretical and practical implications, limitations and a short reflection on the current situation at MI.
Figure 1.1 Research Framework

Digital Vending – Final Report 14-11-2014 14
1.5.1 Data collection
Qualitative data collection methods are those that are oriented at the discovery of qualities of things, that is, the properties of objects, phenomena, situations, people, meanings and events (Van Aken et al., 2007). Performing qualitative research means that the emphasis will not be on counting and calculating on the basis of the observation units, but on comparing and interpreting these results (Verschuren & Doorewaard, 2010). Before collecting the data, the unit of analysis has to be determined. The unit of analysis is the type of object that is the focus of interest and is strongly related to the problem statement (Van Aken et al., 2007). As outlined in paragraph 1.3, the problem statement consists of a lack of knowledge on the potential benefits of telemetry and its according implementation. In this BPS and design-oriented thesis, the unit of analysis is considered as the whole subject of research. Therefore the unit of analysis is the whole business process of implementing telemetry and exploring new business opportunities from it plus examining the conceptual research model. As of the diversion of data resources and to receive a more detailed view on both aspects, the unit of analysis is divided into two units, namely unit of analysis A and B.
Unit of analysis A outlines the whole business process of implementing telemetry and exploring new business opportunities from it.
Unit of analysis B outlines the examination of the conceptual research model. Different qualitative methods can be used for the collection of qualitative data. As Van Aken et al. (2007) state, in practically all BPS projects, interviewing is one of the main methods of data collection. It provides in-depth information about people’s opinions, attitudes, expectations, motivations, knowledge, and experience (Cooper & Schindler, 2003). The goal of any qualitative research interview is to see the research topic from the perspective of the interviewee, and to understand how and why he or she comes to have this particular perspective (King, 1994). The interviews conducted in this Thesis are from semi-structured kind, meaning it withholds three characteristics: (1) the interviewer and interviewee engage in a formal interview, (2) a list of relevant questions and topics form the interview guideline and (3) in despite of the predetermined topics and questions, the interviewer is still able to deviate from this guideline when necessary. To successfully conduct every interview and to receive all information needed regarding unit of analysis A and B, respectively interview guides A and B are formulated and shown in Appendix C and D. Interview guide A is formed and used to successfully conduct all interviews (15 in total) regarding the formation of the problem definition, customer value proposition, UML data model, business opportunities and business case. Interview guide B is formed and used to successfully conduct all in-depth interviews (7 in total) both internally and externally regarding the examination of the conceptual research model. Both interview guides include a short introduction, a research objective, an interview protocol and an interview analysis.

Digital Vending – Final Report 14-11-2014 15
In this Thesis, data is collected from different type of resources, namely internal and external semis-structured in-depth interviews, desk research and literature. Desk research covered the collection and analysis of non-scientific documents including company websites, company reports, market trend documents and related industry reports. All important literature is covered in chapter 2.
1.5.2 In-depth interview
If the unit of analysis is chosen, specific cases of that type of object are selected for examination. Guion et al. (2001) define an in-depth interview as a useful qualitative data collection technique that can be used for a variety of purposes, including needs assessment, program refinement, issue identification, and strategic planning. In-depth interviews are most appropriate for situations in which you want to ask open-ended questions that elicit depth of information from relatively few people (Guion et al., 2001). This research project chooses a comparative approach, where findings from several interrelated interviews are compared. A case selection strategy is followed in which the dependent variable shows a maximum contrast. Verschuren & Doorewaard (2010) outline that this appears to be an efficient strategy if there is intended to find out which factors play a part in a certain dependent variable. The dependent variable is this research project is defined by the integration of analytical BI and interactive marketing, as showed in the conceptual research model in paragraph 2.8. In this Thesis, a case is defined as a company carrying the dependent variable and containing a nominal value (either unsuccessful or successful). As this BPS project is concerned with explaining insufficient performance and to investigate differences and commonalities, unsuccessful and successful cases are selected strategically. The problem statement outlines that MI encounters problems with the implementation of telemetry and accordingly the adopting of business opportunities drawn from it. Therefore, MI is considered as an unsuccessful case. Considered as successful cases are companies The Valley and BrandLoyalty, where multiple projects that were founded on the integration of BI and marketing were finished successful. A case is considered successful when a company launches multiple projects drawn from the disciplines BI and marketing, with relatively few implementation barriers and high return on investment (ROI). Therefore, for the examination of the conceptual research model, five internal in-depth interviews were conducted at MI and two external in-depth interviews (7 in total) were conducted at The Valley and BrandLoyalty. Another external company that has been used for this research, but which is not labelled as a case study, is Sweebr (Sweebr, 2014). Several brainstorm sessions with Sweebr provided ideas and information about business opportunities drawn from the implementation of telemetry. Sweebr is a company specialized in developing online payment solution software for retailers, and also a potential IT partner for implementing telemetry inside MI. Appendix T shows a brief company description of companies The Valley, BrandLoyalty and Sweebr.

Digital Vending – Final Report 14-11-2014 16
A possible disadvantage of the case study is the external validity; the fewer cases studied but which is often needed for achieving in depth knowledge, the more difficult it is to apply the results to a broader population of interest or to similar cases (Verschuren & Doorewaard, 2010). External validity refers to the generalizability of research results and conclusions to other people, organizations, countries, and situations (Van Aken et al., 2007). However, as this research is both practice and design-oriented, including statements about one organisation in particular, the external validity is increased by investigating two more external organisations. Also, multiple data resources are used throughout the research. On the other hand, the internal validity, which concerns conclusions about the relationship between phenomena according to Van Aken et al. (2007), can be established when there are good reasons to assume that those relationships are adequate. A research project’s reliability is defined by the ability of repeating the research by another researcher, with a different research instrument, with different respondents or in another situation, while still yielding the same results (Van Aken et al., 2007). The research reliability is increased by including an interview protocol.
1.5.3 Data analysis
In order to arrive at descriptions and explanations about the problem statement, the gathered data needs to be analysed. As data is collected from different type of resources (internal/external interviews, desk research, literature) and used to examine different topics throughout the Thesis, a matrix is drawn to quickly scan what resource stresses which topic. The complete matrix is shown in Appendix A. The matrix shows what per resource “item” (1) what interview guide is used (A/B), (2) what resource code it has, (3) to what field of interest the resource belongs to and (4) to what topic the data drawn from the item is used for. For example, information from internal resource “item” Marvin van Dijken is collected with interview guide A+B and is used to define the problem definition, to construct the customer value proposition (CVP), to examine the conceptual research model and to calculate the business case. However, no information from him is used to construct the UML data model. Another example; external resource “item” Brand Loyalty is only used to examine the conceptual research model. Throughout the Thesis, resources are abbreviated to resources codes and presented beforehand, when their usage is addressed. As Van Aken et al. (2007) outline, results from the data resources can be transcribed to text and analysed on findings. This analysis, with the conceptual research model as input, focusses on the presence of the researched topics, the presence of the proposed relations in the conceptual research model and any mentions of new variables and relations. After removing irrelevant information from the transcripts and according findings, the data is used to examine the research model and give answer to the research questions.
Digital Vending – Final Report 14-11-2014 17
1.6 Project Planning
As can be seen in Appendix E, the research project will take approximately 7 months, starting in April 2014 and scheduled to finish in November 2014. During the project, the planning can be changed as new insights can arise. After finishing the research proposal, a literature review will be conducted. When finished, the findings of this literature review will be communicated to MI. Afterwards, data will be collected and analyzed. The concept report will be ready late October. Finally, completing and improving the report and presentation will take two more additional weeks before finishing up late November. The research will mostly take place at MI office in Son, The Netherlands. However, regular meetings will be scheduled at Eindhoven University of Technology and some interviews will be performed at external company locations.
1.7 Conclusion
After carefully defining the problem statement, research questions are formed together with a research methodology. Data is collected through desk research, literature and semi-structured (in-depth) interviews. The gathered data is analyzed by transcribing it into valuable findings, whereas the data matrix shows which data is used for what part. In a time frame of approximately 7 months, answers will be given to all research questions, the conceptual research model will be examined and a solid business case will be constructed.

Digital Vending – Final Report 14-11-2014 18
2 Literature Review This chapter outlines an extensive summary on the most important existing literature on The Internet of Things, BI & Architecture, BI & Big Data and BI & Business, in context of both operational and marketing related topics, and tends to answer the following research questions:
1. What is the role and importance of telemetry and other digital technologies
for the vending machine industry and other industries?
2. What business opportunities can be expected from telemetry and other
digital technologies and how would these affect Maas’ current business and
innovation model?
3. What customer benefits can be expected from these new technologies?
4. How should telemetry and other digital technologies be implemented?
5. How could these benefits and business opportunities translate into a sound
business case for Maas International?
Besides answering the research questions, this review is also used to find a “gap” in
literature and construct a research model from the various theoretical perspectives.
Paragraph 2.1 outlines the review approach whereas paragraph 2.2 describes the role of telemetry for the vending industry. Next, paragraph 2.3 covers the Internet of Things (IoT) and its interface with telemetry. Paragraph 2.4 describes all important literature on BI & Architecture, paragraph 2.5 on BI & Big Data and paragraph 2.6 on BI & Business. The conceptual research model drawn from the literature is given in paragraph 2.7. Finally, a brief conclusion on the literature review is given by answering the research questions in paragraph 2.8.
2.1 Review approach
The majority of relevant articles were found through structured keyword search through the scholarly databases ABI/Inform, Google Scholar and JSTOR. The focus lied on the most recent literature, covering only articles within the time period of 1992-2014. Appendix F shows the number of publications per year. The following keywords and combination of keywords were used during the search: “internet of things”, “big data”, “database marketing”, “digital communication technologies”, “business intelligence”, “telemetry”, “customer engagement”, “customer value proposition”, “data architecture”, “use case”, “CRM”. Within the search results, the focus lied on articles that were most cited. These search criteria led to a total of 135 potential useful articles. To prevent the missing of other relevant articles, the references and authors were used to perform backward and forward searches. This resulted in a total of 157 potential relevant articles. Relevant articles were separated from less relevant articles by looking at the number of citations and references. After all articles were skimmed for their content,

Digital Vending – Final Report 14-11-2014 19
86 articles were used for this literature review. From those 86 articles, 54 were published later than 2009 and form the basis of this literature study.
2.2 Vending industry
The vending industry in Europe represents a total machine fieldbase of 3.77 million machines, with a total turnover of € 11.3 billion (European Vending Association, 2014). While research from EVA (2014) shows that vending in certain countries across Europe stagnates or even declines as a result of the recession, it still leaves room for growth. Nowadays, vending operating companies are not only looking for ways to make their operations more efficient, but also pay more attention to user experiences and the front side of vending. Telemetry and other digital communications technologies can enable both. The roots of the word “telemetry” are classic Greek: “tele” means “distance”, whereas “meter” means “to measure”. In short, telemetry measures over a distance (Simpson, 1999). Intel (2011) defines telemetry as a wireless connection between devices to enable communication and measure and monitor it from distance, whereas Mackenna (2002) outlined telemetry as an essential key component in information technology to react to market changes and satisfy customers. The growth of the Internet of Things and Big Data solutions opens doors to new business opportunities, if used wisely. In general, telemetry can be used within a vending operating company like MI for two reasons: operational benefits and marketing benefits. On the operational side, telemetry can be implemented by equipping vending machines with wireless modems that enable communication to the back-office in order to transmit sales, inventory and service data. This way, operator-routes can be scheduled more efficient, procurement can be managed more accurate, less depreciation of ingredients occurs and service errors can be prevented or solved from distance (Musso, 2010). According to Vagabond (2013), a company selling telemetry equipment and software to vending operators, telemetry can reduce labor requirements by 25% by ensuring vending machines are visited only when they need to be. Furthermore, it eliminates theft by providing transparent cash accountability. On the marketing side, the implementation of telemetry through wireless modems can enable interaction with the end-consumer by sending (personalized) messages to mobile devices or the screens integrated in the vending machine. If a vending machine is connected to the cloud and customers are willing to share their personal information, personal data can be captured and used for marketing (Musso, 2010). Vagabond (2013) state that using telemetry increases revenue by 10% by matching product selections more accurately with the particular tastes of the vending machine’s consumer base. Also, making vending machines interactive by connecting them to the cloud can increase consumer loyalty, consumer engagement, consumer lifetime value and trust (Hongcharu, 2011; Kumar, 2008). Other benefits are the offering of nutritional information and enabling cashless payments (Patel, 2012), adjusting product prices to seasonal/specific circumstances and acquiring consumer and customer feedback (Touchrate, 2014), advertising possibilities and cloud-software updates (Air Vend, 2014).

Digital Vending – Final Report 14-11-2014 20
2.2.1 Trends & Opportunities
First Research (2014) highlights several trends and opportunities in the vending industry, namely: (1) integrated cashless payment systems offering improved speed and convenience and including contact-free transactions (tap and go), (2) embracing technology that helps vending operators to improve their operating efficiency and customer satisfaction. Technologies as telemetry enable companies to capture sales information and process purchases electronically, (3) developing a strong customer relationship through route drivers, well-stocked vending machines, and servicing malfunctioning machines rapidly. An annual report on the vending industry in the USA over the year 2012 published by Automatic Merchandiser (2012) reported that vending operators named technology as one of the top factors contributing to growth, along with the improving economy. Although a relatively large part of its vending products include cold beverages and snacks, the USA vending industry is a good indicator of market trends and developments. Vending operators reported investing in systems that allow an operation to run with higher profits and lower operating costs, installing more diverse payment options and launching micro markets. As can be seen in figure 2.1 over the last four years, a major increase in technology upgrades takes place in the addition of wireless remote monitoring (read: telemetry), as well as the % of machines equipped with cashless readers.
Figure 2.1 Technology upgrades in USA vending industry
The increase in cashless payment acceptance is a result of higher product price points, increased acceptance of debit and credit in retail for smaller purchases, generation X and Y joining the workforce to become vending consumers and the growing research about how the systems increase sales. According to Automatic Merchandiser (2012), one of the larger cashless suppliers recently reported that after 12 months of having a cashless reader installed, sales per vending machine increased an average of 28%, including a 17% increase in cash sales. Technology additions continued in 2012 with more touchscreen vending machines and video

Digital Vending – Final Report 14-11-2014 21
screen retrofits. Many operators reported liking that these video screens could also be used to display nutritional information.
2.2.2 Other industries
Telemetry is used widely in other industries (chemistry, healthcare, mobile, utility, IT, retail, sports and logistics) for several purposes. From timely acquiring inventory and forecast data and responding to order commitments for automatic replenishment requests at Eastman Chemical Company (Yen et al, 2004), to the wireless and real-time monitoring of patient health data (such as heart rate and blood pressure) by implanting medical devices and body sensors (De Backer & Van, 2005). Other examples of telemetry being used in industries are: the mobile industry; where consumer data usage patterns are measured (Yang, 2012) indicating where/what/who/when certain activities on mobile devices are performed (Strategy Analytics, 2014), the utility industry; where electric metering of businesses and homes are managed and serviced from distance (PR Newswire, 2000), the hospitality industry; where relevant information based on the users location is delivered to (mobile) devices of restaurant visitors waiting to order (Ozok & Wei, 2010), the IT industry; where telemetry is used to identify and prioritize issues that cause the most software installation errors and better understand how the customer uses the software product in the real world to most effectively impact their experience (Symantec, 2014), the retail industry; where telemetry delivers actionable statistics on how and when people walk through and past certain retail locations in real-time (MacTelemetry, 2014), the sports industry; where using telemetry in Formula 1 creates value for both parties (sports team and media) as it allows the sports team to receive deep real-time information about what’s going on in the car and how the driver is performing. For the media, telemetry creates deeper storytelling during the race and a more immersive user experience for the fans (Formula One, 2014) and the logistic industry; where trucks are equipped with wireless sensors and GPS, so the headquarter can track truck positions, prevent engine failures and optimize delivery routes (Chen et al., 2014). As outlined above, telemetry is used in different industries to create insights and value for both parties, mostly the user as an organization and the customer/consumer. In general, data insights through telemetry generate operational benefits for the user whereas the customer or consumer experiences a better service or deeper product engagement.
2.2.3 Review guideline
When looking at MI as a vending operating organization, three different stages of implementing telemetry are taken into account. The first phase is named the “control” phase, as data is being gathered from vending machines and transferred to the back office of MI. The second phase is called the “improvisation” phase, where 2-way communication is realized from the vending machines to the back-office and vice versa. Finally, the third phase is named “interaction”, as interaction with the consumer is achieved through the machines and other devices.

Digital Vending – Final Report 14-11-2014 22
Stone & Woodcock (2014) emphasizes the importance of business intelligence (BI) having integrated data from many source systems into a data warehouse and the creation of data models to support that integration. They introduced the Customer Framework representing the modern architecture of marketing BI (Appendix G). As seen in Appendix G, the gathered data is translated through different phases before it gives insights for decision-making. Three phases can be considered during the process, namely BI & Architecture (paragraph 2.4), BI & Big Data (paragraph 2.5) and BI & Business (paragraph 2.6). These three phases match the abovementioned stages of (1) control, (2) improvisation and (3) interaction (shown in figure 2.2) and will form the guideline through this extensive literature review. In general, the focus of this thesis will lie more heavily on the first two phases, as MI does not have a solid telemetry solution up and running.
Figure 2.2 Literature review guideline
2.3 Internet of Things
Paragraph 2.3 outlines all important literature regarding organizational focused IoT strategies, IoT applications and IoT benefits. At this moment, we all rely on sophisticated architectures in which intelligent devices are seamlessly integrated into the “cloud” creating a whole new and innovative market for new services for sensing and reacting to the physical world (vending, healthcare, life sciences, transportation, logistics, utilities, agricultural, entertainment, sports, retail, hospitality, environmental, energy-related etc.) and the Web-based service industry will leverage the Future Internet in providing a new service experience to the users (Skarzauskiene & Kalinauskas, 2012). This cloud refers to the Internet of Things (IoT); a world where physical objects and beings, as well as virtual data and environments, all interact with each other in the same space and time (Santucci, 2010). The explosion of data coming from these intelligent devices and other digital sources such as e-mail marketing, online content, social networks, and internet and mobile ads are additions to marketers challenging to convert data into actionable insights (Lariviere et al., 2013). Telemetry as both an information technology and IoT technology can be defined as an essential key component in order to react to market changes and satisfy customers (Mackenna, 2002). Current expectations are that 50 billion devices are connected to the Internet by 2020 (Ericsson, 2011). There are other definitions of the Internet of Things. Yan &

Digital Vending – Final Report 14-11-2014 23
Wen (2011) define the IoT as a technological phenomenon originating from innovative developments and concepts in information and communication technology associated with: (1) Ubiquitous Communication/Connectivity, (2) Pervasive Computing and Ambient Intelligence. More explicitly, Chui et al. (2010) define the IoT as sensors and actuators that are embedded in physical objects that provide data through wired and wireless networks. Xu (2012) outlines four major components of the IoT system, namely information network infrastructure, connected things with embedded sensors, information processing capabilities and the applications. Chen et al. (2014) define the IoT as an enormous amount of networking sensors that are embedded into various devices and machines in the real world. These sensors deployed in different fields may collect various kinds of data, such as environmental data, geographical data, astronomical data, and logistic data. Mobile equipment’s, transportation facilities, public facilities, home appliances and also vending machines could all be data acquisition equipment’s in the IoT, as shown in Appendix H.
2.3.1 IoT strategy
In order to grasp an IoT opportunity, like implementing telemetry into a vending operating company, firms need to make the correct strategic decision, as it withholds the mechanism that is used to align a firm’s strategy with its competitive goal and environment (Ward & Duray, 2000). This opportunity to make the right strategic decision is also determined by the preferences of decision makers (Rui & Yip, 2008). Li et al. (2012) constructed a theoretical framework (figure 2.3) that can effectively explain how firms can correctly choose their IoT strategy and strengthen relative supporting capabilities through efficient information sharing within and across industries under different IoT contexts. By combining IoT industrial driving forces with manager’s strategic intents, four IoT strategies are formulated.
Figure 2.3 theoretical framework for IoT strategy (Li et al., 2012)
Li et al. (2012) argue that IoT as business context is promoted by industrial driving forces of both technology push and market pull. Technology push is viewed as a new invention being pushed through the development of related technologies. Market

Digital Vending – Final Report 14-11-2014 24
pull is defined as an innovative force being developed by firms in response to an identified and/or potential market need. When looking at the manager’s strategic intent in the IoT context, Li et al. (2012) state that its a strategically important intent whether or not the CEO or the top management team wants to be a leader or a follower in the IoT business. Leading or following determines which strategy to choose: get-ahead strategy or catch-up strategy. The get-ahead strategy in a IoT context is seen as a set of plans and actions that are designed and implemented by firms earlier than other competitors, to obtain first-mover competitive advantages in IoT business (Frynas et al., 2006). The catch-up strategy in a IoT context is commonly understood as a set of plans and actions that are designed by firms to develop IoT business through following and learning from the industrial leaders’ movements. Within a catch-up strategy, the focus lies on efficiency and quality in order to survive and develop, and even overtake the leader’s position (Pfohl & Buse, 2000).
2.3.2 IoT applications
According to Vermesan et al. (2011) the development of technologies such as nano-electronics, communications, sensors, smart phones, embedded systems, cloud computing and software technologies will be essential to support important future IoT product innovations affecting the different industrial sectors shown in Appendix H. Systems and network infrastructure (Future Internet) are becoming critical due to the fast growth and advanced nature of communication services as well as the integration with healthcare systems, transport, energy efficient buildings, smart grid, smart cities, and electric vehicles initiatives. Furthermore, Vermesan et al. (2011) sees the creation of smart environments/spaces and self-aware things (smart transport, products, cities, buildings, rural areas, energy, health, living, etc.) for climate, food, energy, mobility, digital society and health applications. The IoT can benefit many different types of companies. Appendix I outlines two examples drawn by Chen et al. (2014) of IoT applications where improvisation leads to added value. Once a decision has been made on what strategy to follow in an IoT business context, and what kind of IoT application there need to be developed, incoming data can be converted into actionable insights, whereas marketers can formulate and implement marketing plans. Using database technology for supporting marketing activities is called database marketing (Guarda et al., 2012). However, a solid data architecture needs to be present (paragraph 2.4), the right expertise and management is needed (paragraph 2.5) and business opportunities need to be exploited to the full potential (paragraph 2.6).
2.3.3 Conclusion
It can be concluded that the IoT can be defined as an essential key component for data-oriented organizations in order to react to market changes and satisfy

Digital Vending – Final Report 14-11-2014 25
customers. However, it is important to choose the right IoT strategy in order to react to those market changes.
2.4 BI & Architecture
Paragraph 2.4 outlines the most important literature regarding analytical BI, its relation with data architecture and accordingly its implementation. Nowadays, companies are in a continuous struggle to differentiate themselves from relentless competitors, as markets become saturated with new innovations all the time. The importance of information in organization management and information technology enables companies and institutions to make decisions with more knowledge and to establish high efficiency for the organization (Damirchi & Shafai, 2011). Furthermore, increased volume and velocity of data means that organizations will need to develop continuous processes for gathering, analysing and interpreting data (Davenport et al., 2012). To process all incoming data, an organization needs to have a solid structure of business intelligence (BI). Stone & Woodcock (2014) defined BI as a combination of technologies, architectures, people, processes and methodologies that transform raw data into useful business information. Key activities are reporting, online analytical processing, analytics, data and text mining. Wang & Wang (2008) outline business intelligence as various software solutions, including technologies and methodologies needed to acquire the right information necessary for the business decision-making with the major purpose of enhancing the overall business performance on a marketplace. The creation of applications to process customer data is often highlighted as important. Kursan & Mihic (2010) define business intelligence as the integration of applications that serve the primary source of data, which can be extracted and with the help of BI tools, turned into valuable information (analytics) that companies base their decisions upon. It all starts with creating a data architecture capable of handling all incoming data, gathered from various sources and managed within a data warehouse. A data warehouse is defined by Golfarelli & Rizzi (2009) as a normalized operational database that stores detailed, integrated, clean and consistent data extracted from data sources and properly processed by means of ETL (extract, transform and load) tools. In a next phase (Data scientists or Improvisation), data warehouses are information depositories specialized in supporting decision-making. Inmon (1992) defines a data warehouse as a subject-oriented, integrated, time-varying, non-volatile collection of data that is used primarily in organizational decision-making. As more and more data comes from unstructured sources as social media, mobile devices and the Internet, organizations need to adapt their BI using advanced analytics services or tools. However, before data is processed in a data warehouse, a conceptual model is needed that provides an overview of all collected information. Paragraph 2.4.1 will describe what it takes to create such a conceptual model.

Digital Vending – Final Report 14-11-2014 26
2.4.1 Data modeling
Unified Modeling Language (UML) is the most commonly used visual modeling language to express object-oriented design systems. Since its introduction in 1997, the Unified Modeling Language (UML) has been widely adopted and supported by the majority of major modeling tool vendors (Selic, 2006; Lange et al., 2006). Arlow & Neustadt (2004) define UML as a general-purpose visual modeling language for systems that is made up of various diagrams and other notational symbols. UML models are used to systematically represent a software architecture and are modified and refined in the development process of object-oriented systems (Mowbray, 1999). Object-oriented system development (OOSD) is composed of the following macro processes: (a) Object-oriented analysis (OOA); determining the system requirements, identifying the classes and their relationships, and determining how the users of the systems will interact with the system, (b) Object-oriented design (OOD); designing the classes identified during the analysis stage and the user interface, and (c) Implementation; Use Case tools, object-oriented programming languages such as Java, to actually build the system (Bahrami, 1999). To understand an object-oriented system and to define its requirements needed to build a conceptual model describing all essential information, Use Cases are created. According to Dobing & Parsons (2000) a Use Case is a description of a sequence of actions constituting a complete task or transaction in an application. It is a requirement analysis and modelling tool that describes what a system does (or should do), rather than how the system works (or should work). Booch (2000) describes a Use Case as a summary of scenarios for a single task or goal. An actor is the individual or thing that initiates the process involved in performing a task. A Use Case diagram describes what a system does from the perspective of the external user. An example of a Use Case diagram is shown in Appendix J. Cockburn (2001) defined two different levels of use cases, namely Business Use Case and System Use Case. Business Use Case indicates that the Use Case puts the emphasis on the operation of the business rather than the operation of a computer system, whereas a System Use Case indicates that the Use Case puts the emphasis on the computer or mechanical system rather than the operation of a business. After the conceptual data model is finished, it can be used and implemented into a database or data warehouse of an organization. Considering telemetry and other digital communication technologies as object-oriented technologies to be implemented, it is important to address existing implementation matters. Ushakov (1998) and Hardgrave (1999) found similar success factors in the adoption of object-oriented technology, namely:
The presence of a strong and formally approved support from top level management.
The first attempt to use object-oriented technology should be on a small project scale.

Digital Vending – Final Report 14-11-2014 27
The project team should be composed of experienced, trained and knowledgeable collaborating members that include technology and tool experts.
There should be guidelines and standards.
The focus should be on requirements analysis and system architecture with Use Case driven requirements specifications.
The need of good project management.
2.4.2 Conclusion
To transform raw data into useful business information, it is important to create a data architecture capable of handling all incoming data gathered from various sources. This can be done by constructing a UML data model with according Use Cases. Finally, in order to adopt an object-oriented technology, several success factors must be taken into account.
2.5 BI & Big Data
Paragraph 2.5 outlines all important literature regarding Big Data, its benefits, its implementation, its management and the organizational needs. In every industry, in every part of the world, companies’ wonder if they make full value out of the massive amounts of information their organization has and gathers. Over the past 20 years, data has increased in a large scale in various fields; in 2011, more data was generated during 2 days than the accumulated amount of data generated from the origin of civilization until 2003 (Gantz & Reinsel, 2011). The rapid growth of cloud computing and the IoT further promote the sharp growth of data (Chen et al., 2014). Organizations talk about “Big Data” as a new term to unleash new organizational capabilities and value. McKinsey & Company (2011) announces Big Data as the next frontier for innovation, competition, and productivity. It’s no longer adequate to know what happened to customers or devices and why it happened. Organizations want to know what is happening now, what is likely to happen next and what actions should be taken to get the optimal results. “Big Data” brings all that. The behavior of credit card companies offers a fine example of the dynamic that Big Data can bring. In the past, marketing groups at credit card companies created models to select the most likely customer prospects from a large data warehouse. The process of data extraction, preparation and analysis took weeks to prepare and weeks more to execute. However, in their interest of acting quicker, they found a faster way to meet their requirements. They were able to create a ‘ready-to-market’ database and system that allows a marketer to analyze, select and issue offers in a single day. By frequently monitoring website and call-center activities through real-time analytics, they were able to make personalized offers in milliseconds, and optimize the offers over time by tracking responses (Davenport et al., 2012).
2.5.1 Big Data
Dadashzadeh (2013) defines Big Data as the tools and techniques needed to access, organize, and glean discoveries from huge volumes of digital data. This definition is
Digital Vending – Final Report 14-11-2014 28
similar to that of Manyika et al. (2011), who define Big Data as advances in information technology that allows users to capture, communicate, aggregate, store and analyze enormous pools of data. Gantz & Rietsel (2011) defined Big Data technologies as a new generation of technologies and architectures, designed to economically extract value from very large volumes of a wide variety of data, by enabling the high-velocity capture, discovery, and/or analysis. Industries that are creating and using Big Data are those that have recently begun digitization of their data content include: entertainment, healthcare, life sciences, video surveillance, transportation, logistics, retail, utilities, and telecommunications (Chui et al., 2010). Manyika et al. (2011) names five major contributions Big Data can make to businesses: 1) transparency creation, 2) performance improvement, 3) population segmentation, 4) decision making support, and 5) innovative business models, products, and services. Creating transparency on data within an organization enables more shared knowledge between departments, which can lead to shorter time to market and improved quality. Second, Big Data also improves performance, as managers can analyze causes of variability. Third, data can tell the organization specific details on different customer groups enabling the production of custom tailored products and services. Analyzing data can also contribute to minimizing risks and finding new insights in order to improve the decision making process. Finally, new products, services and business models can arise from analyzing Big Data. According to Davenport et al. (2012), companies can take advantage of Big Data to use real-time information from sensors, radio frequency identification and other identifying devices to understand their business environments at a more granular level, to create new products and services, and to respond to changes in usage patterns as they occur. McKinsey & Company (2011) researched how Big Data created value in several industries in the US, namely healthcare, public sector administration, retail and global manufacturing. They found that Big Data gives a full play to the economic function, improves the productivity and competitiveness of enterprises and public sectors, and create huge benefits for consumers.
2.5.2 Big Data vs. Data warehousing
Davenport et al. (2012) define the difference between traditional IT architectures like data warehousing and Big Data environments. Traditional IT architecture is accustomed to having applications (or services) as “black boxes” that perform tasks without exposing internal data and procedures. However, Big Data environments must make sense of new data, whereas IT applications need to measure and report transparently on a wide variety of dimensions, including customer interactions, product usage, service actions and other dynamic measures. Davenport et al. (2012) outlines that as Big Data evolves, the architecture need to develop an information ecosystem where a network of internal and external services are continuously sharing information, optimizing decisions, communicating results and generating new insights for businesses. In other words, data warehousing is an architecture whereas Big Data is a technology (Inmon, 2013). As a matter of fact, an organization
Digital Vending – Final Report 14-11-2014 29
can both have a data warehouse and a Big Data solution, or either one of them. Big Data make use of real-time analytics, whereas all available enterprise data and resources can be used anytime.
2.5.3 Problems with Big Data
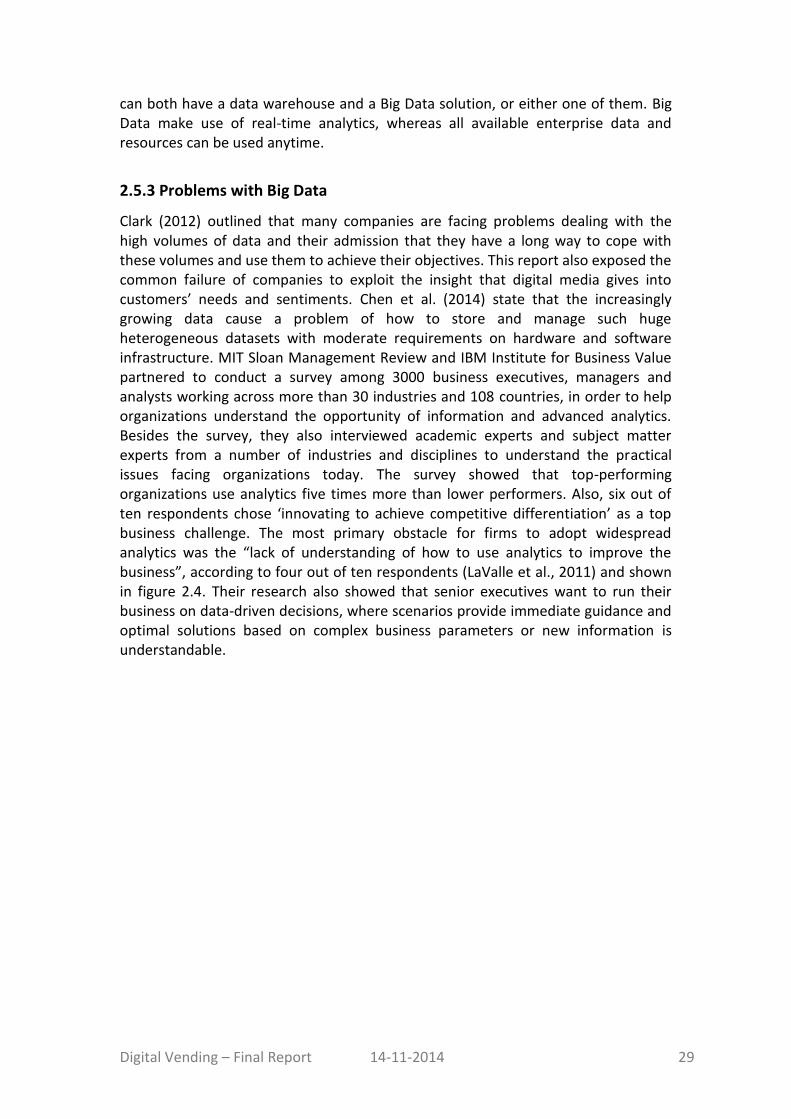
Clark (2012) outlined that many companies are facing problems dealing with the high volumes of data and their admission that they have a long way to cope with these volumes and use them to achieve their objectives. This report also exposed the common failure of companies to exploit the insight that digital media gives into customers’ needs and sentiments. Chen et al. (2014) state that the increasingly growing data cause a problem of how to store and manage such huge heterogeneous datasets with moderate requirements on hardware and software infrastructure. MIT Sloan Management Review and IBM Institute for Business Value partnered to conduct a survey among 3000 business executives, managers and analysts working across more than 30 industries and 108 countries, in order to help organizations understand the opportunity of information and advanced analytics. Besides the survey, they also interviewed academic experts and subject matter experts from a number of industries and disciplines to understand the practical issues facing organizations today. The survey showed that top-performing organizations use analytics five times more than lower performers. Also, six out of ten respondents chose ‘innovating to achieve competitive differentiation’ as a top business challenge. The most primary obstacle for firms to adopt widespread analytics was the “lack of understanding of how to use analytics to improve the business”, according to four out of ten respondents (LaValle et al., 2011) and shown in figure 2.4. Their research also showed that senior executives want to run their business on data-driven decisions, where scenarios provide immediate guidance and optimal solutions based on complex business parameters or new information is understandable.
Digital Vending – Final Report 14-11-2014 30
Figure 2.4 Survey results on impediments to become more data driven (c)
According to Verhoef et al. (2010), establishing an IT infrastructure that enables collection, storage and analysis of very large amounts of data is another challenge for ensuring analytic capability. For companies that adopt analytics, it’s important to know how thoroughly their organizations are in making decisions based on those analytics. LaValle et al. (2011) drew three levels of analytics capability of an organization, namely Aspirational, Experienced and Transformed. In short, firms withholding the Aspirational capability level are the furthest away from achieving their desired analytical goals, and often have few of the necessary building blocks to collect, understand or act on analytic insights. Organizations containing the Experienced capability level are looking beyond cost reduction and are developing better ways to collect, understand and act on analytics effectively. Transformed organizations have substantial experience using analytics across a broad range of functions and use analytics as a competitive differentiator. Appendix K shows a more detailed view on all three profiles of analytical capability levels. As can be seen in Appendix K2, LaValle et al. (2011) outlined what organizations used analytics for per capability level. Traditionally, aspirational organizations used analytics for financial management, operations, and sales and marketing. Experienced companies used analytics for all of the above-mentioned reasons, and added strategy development, customer service and product development. Finally, transformed companies used analytics for all functions, with an emerged interest in

Digital Vending – Final Report 14-11-2014 31
customer experience while building on customer service and marketing capabilities. This suggests a pattern within organizations where success in one area stimulates analytical adoption in other areas.
2.5.4 Implementing analytics-driven management
As LaValle et al. (2011) outlined, ineffective data governance or concerns with data quality were not considered as a major obstacle. The barriers that organizations face are managerial and cultural rather than related to technology and data. LaValle et al. (2011) named five recommendations for organizations to successfully implementing analytics-driven management and rapidly creating value. The recommendations are listed below. A more detailed description on every recommendation is outlined in Appendix L.
Focus on the biggest and highest-value opportunities.
Within each opportunity, start with questions, not data.
Embed insights to drive actions and deliver value.
Keep existing capabilities while adding new ones.
Use an information agenda to plan for the future.
2.5.5 Data scientists
In order to support the organization’s analytical capabilities, analytical professionals are needed. According to Davenport et al. (2012), an organization handling Big Data not only needs data analysts, but also data “scientists”. These professionals know how to interact with the data itself, namely obtaining, extracting, manipulating and structuring it. They need to have creative IT skills and need to work closely with other processes within an organization and communicating effectively with decision-makers. This goes beyond the set of skills a traditional data analyst needed to have. Nakata et al. (2011) stated that the work fields of both marketers and IT specialists should overlap and no longer operate apart. Sexton (2012) outlines a similar view on an employee’s necessary skills when dealing with Big Data, and go even further. They state that companies should consider fact-based decision making as a part of their culture by hiring employees with analytical and business skills, and share data within the organization. This view is in line with Kumar et al. (2010a, 2010b) who outlines that fact-based decision making requires a data culture aimed at generating insights through continuous experimentation and learning and a significant investment in information technology with the goal of collecting, sharing and merging data, ideally in real-time. Finally, Purcell (2013) emphasizes the role of senior management, stating executives need to become familiar with the big data methodologies, adopting the technology appropriate for their business, and ensuring that employees develop skill with the technology.

Digital Vending – Final Report 14-11-2014 32
2.5.6 Conclusion
Big Data technologies are a new generation of technologies and architectures, designed to economically extract value from very large volumes of a wide variety of data. Big Data brings multiple contributions to an organization, although there exists several barriers to successful analytical-driven management. It is important to hold the right expertise as an organization to fully benefit from the potential Big Data can give.
2.6 BI & Business
The focus shifts nowadays to a consumer-oriented world, where the customer demand faster customer service, and expect that organizations know them and provide appropriate services and recommendations for products quickly. As Peppers & Rogers (1993) state that by understanding individual-level behavior, organizations are able to refine and customize marketing tactics to increasingly fine segments or even to individual customers, summarizing the promise of customer relationship management (CRM). Stone & Woodcock (2014) define a single customer view (SCV) as the company’s knowledge about each customer, ideally fully summarized and documented in a single data record which is accessible to all those making decisions about and managing the customer. According to the latter, companies investing in a SCV strategy were seeing significant benefits by using a Big Data approach involving data integration and sophisticated analytics to generate customer insight, primarily to improve customer segmentation and to target marketing campaigns more effectively. Until recently, most large customer relationship management (CRM) systems depended on two separate database domains: the operational database maintained the day-to-day, high-volume transactional data, whereas the analytical database took the data needed to perform specific customer analyses and stored it separately (Peterson et al., 2010). Real-time analytics, provided by Big Data technologies, bring advances in speed, cost, and sophistication of storage and memory technology (Acker et al., 2011). As shown in Appendix M, real-time CRM combines both analytical and operational CRM. Acker et al. (2011) defines three significant benefits over traditional data warehousing, namely performance improvements, customer value creation and lower costs. Performance improvements are gained as users can interact with and query data in memory. Also, response time and calculation performance are dramatically improved. Second, customer value creation is achieved as in-memory analytics provide a self-service access for users into customer data. These insights can contribute to for example: up-selling and cross-selling or service request handling. Third, cost reductions are realized, as more data can be stored in one place, reducing total cost of ownership and operations of storage infrastructure (Acker et al., 2011).
Digital Vending – Final Report 14-11-2014 33
2.6.1 Value creation
The role of an organization is very important when it comes to value creation for the customer. Gronroos (2000) state that firms should be seen as value facilitators, providing different kinds of resources to customer consumption, and value-generating processes. A firm should use its interactions with customers in influencing the value creation processes. Hulten (2009) outlines value of service, as a brand image, emerges when interactions occur through the customer’s sensory experiences in the value-generating processes. This image is based on how customers perceive and experience service and the process in reality. Saarijärvi et al. (2013) state about firm differentiation that the focus shifts from goods to a more holistic perspective on customers’ value creation, which consists of goods and information that helps customers in their everyday activities. Finally, Kumar et al. (2013) outlined that the goal of services marketing is to foster a mutually beneficial relationship between a firm and its customer(s) and if possible, also society. In short, creating value for all parties involved. A product or service can be of significant value to a customer, but if the supplier or seller of that product doesn’t demonstrate and document that claim, a customer manager will likely dismiss it as marketing puffery. Therefore, a well-constructed customer value proposition should be created. Customer value propositions force companies to rigorously focus on what their offerings are really worth to their customers (Anderson et al., 2006).
2.6.2 Database marketing
In order to meet customers’ needs and to fully exploit the information gathered from those customers, database marketing (DBM) can be executed by organizations. According to Guarda et al. (2012), DBM is primarily focused on the development of databases of consumer characteristics, including identification data, data relating to purchase history, demographics, and psychographics, and other useful information that enable the organization to build a foundation for the establishment of strategies targeted to an ever more specific to the development of new products, as is the case, communication, pricing, promotions. Hedgcock (1998) defines DBM as a part of a system where marketing activities are interrelated, and a continuous interaction exists between the remaining elements of the system and customers, promoting the improvement of the service. As Acker et al. (2011) outlines, companies nowadays can create an entirely new level of customer experience by using in-memory technology, enabling users to gain access to the data they need to provide online self-service, real-time customer segmentation and dynamic pricing. Closely linked to DBM is data-driven service marketing. According to Kumar et al. (2013), data-driven service marketing refers to the use of data to inform and optimize the ways through which marketing activities are carried out. Appendix M2 shows an example, drawn from Booz & Company (2012), of industries that benefit from real-time analytics. Benefits are gained on optimization, operations, CRM and BI. Batra (1995) refers to the effects of DBM as follows: “it allows marketers to know more about various types of costumer and prospects, and to grade prospects by

Digital Vending – Final Report 14-11-2014 34
determining if a customer is willing to buy goods or services; it enables the organizations to reach customers with the right product and the right offer at the right time; it allows marketers to continually incorporate new information and results back into the database.” From here, future strategies and executions can be developed from the collective results of previous efforts. Vavra (1993) states that the objective of DBM is to create an electronic link between the organization and the consumer. A well designed database can be very useful in implementing the activities of customer retention: enabling the marketer to identify the most important customers, to target promotions and offers of products and/or services which are appropriate to your profile; allowing a clear monitoring of changes in terms of buying patterns; enabling marketers to interact in a more personalized way with customers; assisting in the establishment of programs to reward the most loyal customers, with the aim of strengthening their loyalty; being a good indicator for the development of new products from the characteristics of clients of the organization. Webber (2013) described that interactive marketing and its associated analytics, particularly real-time high performance analytics, are opening up new marketing opportunities, leading to improved marketing return on investment. As Stone & Woodcock (2014) outlined, this interactivity is not only in marketing, sales and service, but is deeply connected with its staff and suppliers, enabling information once locked into one channel or department to be shared across a company. This interactivity with the consumer in all channels can be achieved through multiple touch-points, developed by people, processes and system capabilities of an organization. Similar to interactive marketing is the definition of instantaneous marketing, defined by Hongcharu (2011) as the ways customers and marketers connect with each other in real time or almost real time to respond to the needs of customers using customer databases and feedback through digital communications technologies. Instantaneous marketing gives both sides opportunities to deliver timely information resulting in a long time relationship between the two parties.
2.6.3 Conclusion
Interactive marketing and its associated analytics can generate customer insights, and open up new marketing opportunities. Being able to interact with the end-consumer enables organizations to reach them with the right product and the right offer, at the right time. However, database marketing should be well integrated in an organization, sharing information where needed.
2.7 Research Model
Although all the above mentioned literature addresses specific and profound knowledge on BI, Big Data (management) and database marketing, academic literature on bringing them together, especially analytical BI and interactive marketing, is weak. The integration of both analytical BI and interactive marketing has not been studied as best, as developments in digital communication technologies that enable opportunities for interactive marketing, are very recent. In this gap in literature lies an opportunity for researchers to make a strong

Digital Vending – Final Report 14-11-2014 35
contribution to business theory and practice. Integrating two disparate functions in organizations, namely marketing and information services (IS), has become a critical business concern due to the increasing use of information technology (IT) to find and open new markets, deliver improved services to customers, and streamline internal marketing processes (Nakata et al., 2011). Figure 2.5 shows the conceptual research model based on this extensive literature review. It is also shown in Appendix O.
Figure 2.5 Conceptual research model
Several promoters were discovered and outlined in the literature review that strengthens the integration between analytical BI and interactive marketing. On the left side of the conceptual research model, the promoters are categorized in Data promoters and Organizational promoters. As described in the literature review data promoters are: (1) the need for a data architecture being able to continuously sharing information, optimizing decisions, communicating results and generating new insights for businesses, (2) the need for “data scientists”, being able to interact with the data itself; obtaining, extracting, manipulating and structuring data and (3) the need for top management to become familiar with real-time analytical methodologies are considered to be data promoters to strengthen the integration between analytical BI and interactive marketing. Besides data promoters, the following organizational promoters were considered: (1) the presence of a data
Digital Vending – Final Report 14-11-2014 36
culture aimed at generating insights through continuous experimentation and learning, (2) the presence of a strong and formally approved support from top level management, (3) the alignment of analytical objectives and strategies with the overall organizations’ objectives and strategies and (4) cooperation and sharing of information between IT and marketing within an organization. On the other side, the opposite of the promoters are the barriers that withhold the opposites and lessen the integration of analytical BI and interactive marketing. Data barriers are (1) a limited data architecture not able to provide the specifications and technologies needed to strengthen the integration, (2) the absence of “data scientists” and (3) no top management knowledge on analytical tools. The organizational barriers include having (1) a culture where routine and experience are decisive in decision-making, (2) the absence of top management support, (3) no alignment of analytical objectives and strategies with the overall organizations’ objectives and strategies and (4) no cooperation or sharing information between IT and marketing within an organization.
2.8 Conclusion
Now all relevant literature is described in the previous chapters, conclusions can be drawn on all topics and answers can be given on the research questions. Furthermore, the conclusions shortly reflect how MI can benefit from existing knowledge drawn from the literature. What is the role and importance of telemetry and other digital technologies for the vending machine industry and other industries? The vending industry stagnated over the years and slowly adopted new technologies. While for example the retail industry focused more on customer needs and market demands, the vending industry primarily focused on improving back-end efficiencies such as vending management software (VMS), data exchange (DEX), telemetry, pre-kitting, pick-to-light, and dynamic scheduling. However, vending operating companies are now not only looking for ways to make their operations more efficient, but also pay more attention to user experiences and the front side of vending. Vending operating companies in the USA are already shifting towards a more consumer-aimed focus; adopting technologies that enable vending machines to interact with the end-consumer. In short, telemetry and other digital communication technologies enable the following benefits on (1) the operational side in the vending machine industry: more efficient operator route planning, reduced labor costs, online software updates, just-in-time service and inventory management, transparent and accurate invoicing. And (2) on the marketing side: real-time price adjustments, acquiring real-time customer feedback, advertising opportunities, collection of (personal) data suitable for marketing purposes, cashless payments and interaction with the customer and consumer through the vending machines.
Digital Vending – Final Report 14-11-2014 37
Other industries that benefit from telemetry and other digital communication technologies are chemistry, healthcare, mobile, utility, IT, retail, sports and logistics. In general, telemetry is used in those industries to create insights and value for both parties, mostly the user as an organization and the customer/consumer. In general, data insights through telemetry generate operational benefits for the user whereas the customer or consumer experiences a better service or deeper product engagement. What business opportunities can be expected from telemetry and other digital technologies and how would these affect Maas’ current business and innovation model? Maas International’s business model is primarily focused around sales per click and ingredient sales, whereby MI in most cases is responsible for full service operating of the vending machines. Summarized, telemetry and other digital communication technologies enables the following business opportunities: advertising through vending machines, collection of data to sell to companies, collection of data to use for marketing tactics and the creation of multiple wireless connected touch-points (home, work, retail, micro markets etc.) to increase revenue. First, advertisements or corporate content can be displayed through vending machines screens. Second, the collection of personal data through mobile Apps and Big Data solutions can be sold to companies. This data includes personal information like buying patterns, product preferences, demographics etc. and can be of great value to certain companies. Third, the collecting of personal data can also be used to refine and customize marketing tactics to increasingly fine segments or even to individual customers. These marketing tactics could include price adjustments, (personal) promotions and loyalty programs (mobile applications). Fourth, connecting all vending machines to the cloud enables a vending operating organization to serve their customers through multiple touch-points (work, home, retail, micro markets) and accordingly increase revenue by offering personal promotions and loyalty programs. What customer benefits can be expected from these new technologies? The customer benefits from telemetry and other digital communication technologies can be divided into technological, operational and sales & marketing benefits. An IoT technology like telemetry can benefit many different types of companies. Here, the client is considered to be a customer from a vending operating company, whereas the consumer is considered to be the end-consumer. The following benefits are considered and described below: Technological benefits One of the technological benefits is the understanding of an organizations’ business environment at a more granular level, being able to create new products and services, and respond to changes in usage patterns as they occur. In the end, this will create more value for the end-consumer. Also, the detection of component failure or

Digital Vending – Final Report 14-11-2014 38
service errors in an early stage prevents the customer of notifying the vending company. Finally, the addition of video screens to vending machines creates opportunities for the customer to show either advertisements or corporate content to its employees. Operational benefits Benefits on the operational side can be gained through increased comfort and lower costs as service errors or component failures no longer need to be notified by the customer itself, but are automatically received by the operator. Second, efficient route planning creates maximal satisfaction at the customer and prevents any long-time vacant vending machines. Third, vending machines can be updated simultaneously online concerning software updates, price changes, product information etc. Fourth, invoicing can be done accurately and without any deviation. This will also increase trust and customer loyalty as business is done transparent. Sales & marketing benefits Using telemetry and other digital communication technologies as an organization can create an entirely new level of consumer experience, offering personalized products, promotions or even pricing. It enables organizations to reach consumers with the right product and the right offer at the right time. More transparency can be given on product information and consumer consumption in order to meet a consumer’s need. Furthermore, personalized offers over multiple touch-points (work, micro markets, retail, home), increase the total added value for both the consumer and the customer. How should telemetry and other digital technologies be implemented? The implementation of telemetry and other digital communication technologies can be summarized in two parts, namely business intelligence and management. Business Intelligence In order to grasp an IoT opportunity like telemetry, an organization need to make the correct strategic decision (get-ahead or catch-up), as it withholds the mechanism that is used to align a firm’s strategy with its competitive goal and environment. An analytical BI tool like telemetry should be part of a broader BI and firm strategy, taken into account its overall business value and underlying technology architecture. In other words, align analytical objectives with the general strategic business direction. Increased volume and velocity of data means that organizations will need to develop continuous processes for gathering, analyzing and interpreting data. When adopting an object-oriented technology like telemetry, organizations need to take the following implementation matters into account: (1) the focus should be on requirements analysis and system architecture with Use Case driven requirements specifications, (2) create a conceptual model drawn from the Use Case diagrams using Unique Modelling Language (UML), (3) the first attempt to use object-oriented technology should be on small project scale. As the amount of data evolves, the

Digital Vending – Final Report 14-11-2014 39
architecture need to develop an information ecosystem where a network of internal and external services are continuously sharing information, optimizing decisions, communicating results and generating new insights for businesses. Management Several success factors are outlined for implementing analytics-driven management: (1) executives need to become familiar with real-time analytical methodologies, adopting the technology appropriate for their business, and ensuring that employees develop skill with the technology, (2) the presence of a strong and formally approved support from top level management, (3) focus on the biggest and highest-value opportunities, (4) embed insights to drive actions and deliver value, (5) start with questions, not data, (6) the need of good project management, (7) keep existing capabilities while adding new ones, (8) use an information agenda. Organizations considering a fact-based decision culture, should create a data culture aimed at generating insights through continuous experimentation and learning and a significant investment in information technology with the goal of collecting, sharing and merging data, ideally in real-time. They need to acquire “data scientists”, being able to interact with the data itself; obtaining, extracting, manipulating and structuring it. They also need to have creative IT skills going beyond the traditional set of skills a data analyst needs. In fact, the whole project team should consist of experienced, trained and knowledgeable collaborating members. How could these benefits and business opportunities translate into a sound business case for Maas International? This research question will be answered after data is gathered and analyzed. In short, a sound business case is realized by combining existing literature with insights from practice to create future telemetry solutions and designs. Drawn from this, a solid implementation plan is created and formulated for MI.

Digital Vending – Final Report 14-11-2014 40
3 Customer Value Proposition This chapter outlines the customer value proposition for MI’s future telemetry solution. The benefits drawn from a telemetry solution are categorized in technological, operational, sales & marketing and consumer benefits, and will be described respectively in paragraph 3.1 till 3.4. Next, paragraph will outline which benefits are prioritized to be used as the basis for MI’s future telemetry solution. Paragraph 3.6 will conclude chapter 3. Appendix A shows all resources used for the construction of the CVP and market analysis, lightened up with the color yellow. Table 3.1, to the right, is drawn from Appendix A and gives a quick overview of the resources used abbreviated by resources codes.
TTable 3.1 Use of resources for CVP and market analysis
The customer benefits from telemetry cover different kinds of area’s and are therefore divided into technological, operational, sales & marketing and consumer benefits. Hence, the customer is considered to be a client from a vending operating company, whereas the consumer is considered to be the end-consumer. In all four categories, practical examples are described to enlighten the value of every single benefit. All benefits are numbered by a code and will be described briefly in every paragraph. The codes will be used throughout the Thesis to quickly name certain benefits when they are used as input for other purposes.
3.1 Technological benefits
Table 3.2 shows an overview of the most important technological benefits based on interviews with internal and external resources, plus additional desk research and literature. Technological benefits of telemetry withhold all benefits with respect to the vending machines’ hardware and software. One of the technological benefits is the understanding of an organizations’ business environment at a more granular level, being able to improve the vending machine quality (T1) by adjusting to consumer usage patterns as they occur. Button positions or screen displays can be changed accordingly. Also, the detection of component failure or service errors in an early stage prevents the customer of notifying the vending company. This will decrease the amount of downtime per vending machine (T2) and increase customer satisfaction. For example, vending machine B

Digital Vending – Final Report 14-11-2014 41
automatically sends a service error notification to operator A. Next, vending machines will be monitored for reliability and performance (T3) to adjust vending machine locations or replace continuously failing components. For example, vending machine A does not perform according to its sales expectations and is relocated to another location.
Table 3.2 Technological benefits
Equipping vending machines with general-purpose processors being capable of easily supporting new technologies and features in software, as opposed to hardware-focused fixed-function platforms, increases its future opportunities (T4). New innovations such as voice recognition or digital signage are easier to implement on software focused solutions. Audio possibilities (T5) can increase the customer experience by broadcasting music match the customer segment. For example, musical classics from the eighties should be broadcasted where the average employee age is above 40 years old. The same accounts for video screen opportunities (T6). The addition of video screens to vending machines creates opportunities for the customer to show advertisements, news/weather and traffic headlines or corporate content.
3.2 Operational benefits
The operational benefits shown in Table 3.3 withhold the all benefits telemetry gives that improve a vending operating company in its operations, specifically route planning and inventory management. One of the benefits is taking care of service errors from distance (OP1), as service errors or component failures are automatically received by the operator. Another benefit is the increase of customer satisfaction (OP2), by making operator route planning more efficient. Efficient route planning can prevent any out-of-stock vending machines and disappointing reactions from employees who are unable to purchase their favourite products. Next, through real-time insights inventory management (OP3) can be executed much more efficient. Efficient inventory management includes decreasing the amount of purchasing and indirectly less storage and depreciation costs.

Digital Vending – Final Report 14-11-2014 42
Table 3.3 Operational benefits
With telemetry, vending machines can also be updated simultaneously online with software updates (OP4). Software updates can be performed all at once and remotely overnight, instead of one by one only when an operator visits the vending machine. Invoicing can be done accurate and without any deviation, which will also increase trust and customer loyalty as business is done transparent (OP5). For example, weekly sales reports can be sent to the customer, or the customer can view real-time sales data through a web-based dashboard. Finally, product price adjustments (OP6) can be made from distance, opening doors for promotions and discounts. For example, cold drink prices can be dropped when warm weather forces consumers to drink more. Or almost out-of-date products can be offered at a low price as the loss of product margin is less expensive than to throw away the products.
3.3 Sales & Marketing benefits
The sales & marketing benefits shown in Table 3.4 withhold all benefits drawn from a telemetry solution that open doors to new business opportunities and business models and embracing up-sell opportunities. First of all, being able to have real-time insights into all on-going sales activity from a vending machine allows MI to consult with their customers on adjusting the product mix so it meets their employees’ needs (SM1 & SM2). Products that do not meet their sales expectations can be removed, and new products and services can be introduced based on products that meet their sales expectations. Also, sales analysis can be quickly drawn not only per product, but also per customer, region or type of business (SM3). This enables MI to be flexible with regards to unsatisfactory performing vending machines or new market trends, but also add value to MI’s customer service; MI can advise its customers to introduce other or new type of products based on sales analysis (SM4). For example, the creation of custom made products or services could withhold special gift codes or company offerings and promotions, both increasing the customer experience of the customer and MI.
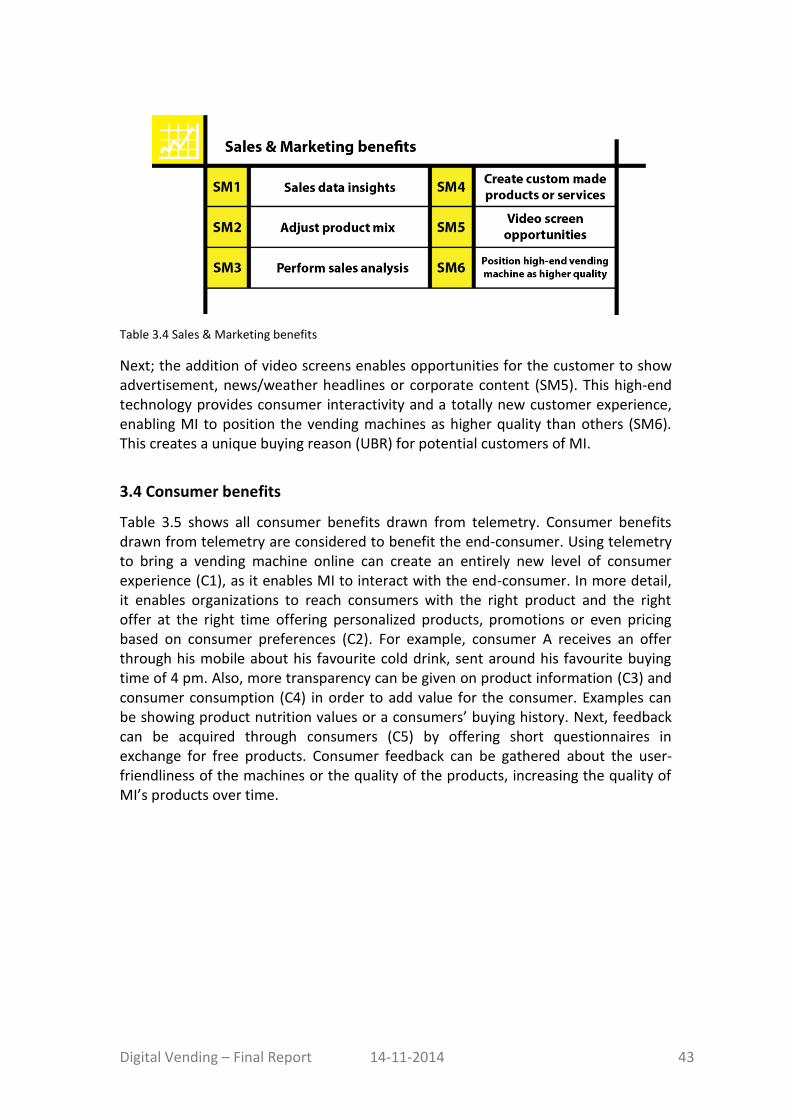
Digital Vending – Final Report 14-11-2014 43
Table 3.4 Sales & Marketing benefits
Next; the addition of video screens enables opportunities for the customer to show advertisement, news/weather headlines or corporate content (SM5). This high-end technology provides consumer interactivity and a totally new customer experience, enabling MI to position the vending machines as higher quality than others (SM6). This creates a unique buying reason (UBR) for potential customers of MI.
3.4 Consumer benefits
Table 3.5 shows all consumer benefits drawn from telemetry. Consumer benefits drawn from telemetry are considered to benefit the end-consumer. Using telemetry to bring a vending machine online can create an entirely new level of consumer experience (C1), as it enables MI to interact with the end-consumer. In more detail, it enables organizations to reach consumers with the right product and the right offer at the right time offering personalized products, promotions or even pricing based on consumer preferences (C2). For example, consumer A receives an offer through his mobile about his favourite cold drink, sent around his favourite buying time of 4 pm. Also, more transparency can be given on product information (C3) and consumer consumption (C4) in order to add value for the consumer. Examples can be showing product nutrition values or a consumers’ buying history. Next, feedback can be acquired through consumers (C5) by offering short questionnaires in exchange for free products. Consumer feedback can be gathered about the user-friendliness of the machines or the quality of the products, increasing the quality of MI’s products over time.
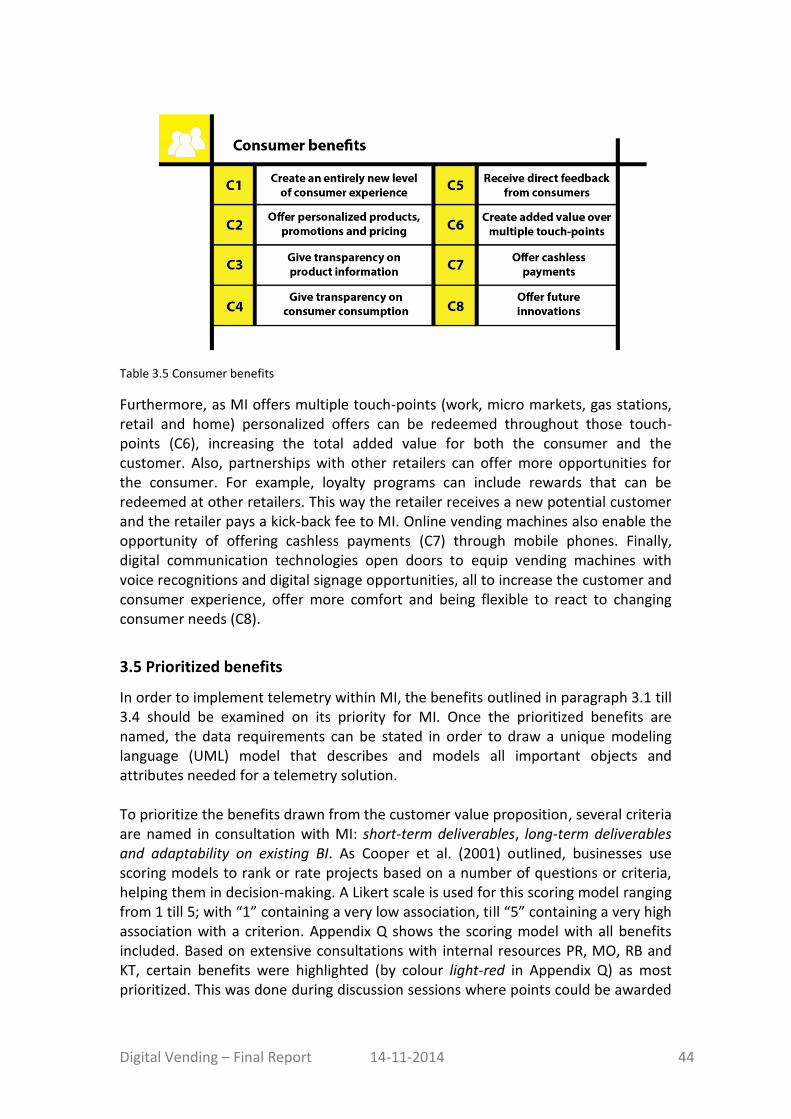
Digital Vending – Final Report 14-11-2014 44
Table 3.5 Consumer benefits
Furthermore, as MI offers multiple touch-points (work, micro markets, gas stations, retail and home) personalized offers can be redeemed throughout those touch-points (C6), increasing the total added value for both the consumer and the customer. Also, partnerships with other retailers can offer more opportunities for the consumer. For example, loyalty programs can include rewards that can be redeemed at other retailers. This way the retailer receives a new potential customer and the retailer pays a kick-back fee to MI. Online vending machines also enable the opportunity of offering cashless payments (C7) through mobile phones. Finally, digital communication technologies open doors to equip vending machines with voice recognitions and digital signage opportunities, all to increase the customer and consumer experience, offer more comfort and being flexible to react to changing consumer needs (C8).
3.5 Prioritized benefits
In order to implement telemetry within MI, the benefits outlined in paragraph 3.1 till 3.4 should be examined on its priority for MI. Once the prioritized benefits are named, the data requirements can be stated in order to draw a unique modeling language (UML) model that describes and models all important objects and attributes needed for a telemetry solution. To prioritize the benefits drawn from the customer value proposition, several criteria are named in consultation with MI: short-term deliverables, long-term deliverables and adaptability on existing BI. As Cooper et al. (2001) outlined, businesses use scoring models to rank or rate projects based on a number of questions or criteria, helping them in decision-making. A Likert scale is used for this scoring model ranging from 1 till 5; with “1” containing a very low association, till “5” containing a very high association with a criterion. Appendix Q shows the scoring model with all benefits included. Based on extensive consultations with internal resources PR, MO, RB and KT, certain benefits were highlighted (by colour light-red in Appendix Q) as most prioritized. This was done during discussion sessions where points could be awarded

Digital Vending – Final Report 14-11-2014 45
by the internal resources per benefit. In the end, all points were averaged and noted in Appendix Q to define all prioritized benefits. The average total sum of the awarded points per benefit is shown in the most right column in Appendix Q. There can be concluded that operational benefits have the highest priority and technological benefits the second highest. Consumer benefits and sales & marketing benefits follow shortly after by respectively the third and fourth category priority. Table 3.6 shows all prioritized benefits outlined per category. When taking a closer look into the most single prioritized benefits on technological level, T2 and T3 score the highest. On a operational level, OP1, OP3, OP5 and OP6 score the highest. Next, on a consumer level, C7 scores the highest. Finally, on sales & marketing, SM1, SM2 and SM3 contain the highest individual scores. In short, the benefits stated in Table 3.6 all score especially high on short-term deliverables and adaptability to the existing BI of MI. This makes them more attractive to focus on and success on technological and operational level enables the sales & marketing and consumer benefits to accrue more quickly. Keeping in mind the phase of implementation of telemetry where MI lies in, the focus will lie for a large part on the abovementioned technological and operational benefits, and for a smaller part on the consumer and sales & marketing benefits.
3.6 Conclusion
This chapter outlines a customer value proposition regarding the benefits of telemetry on the categories technology, operations, sales & marketing and consumer. Next, in consultation with MI, the benefits are prioritized based on the criteria short-term deliverables, long-term deliverables and adaptability on existing BI. In short, benefits T2, T3, OP1, OP3, OP5 and OP6 are highlighted as most prioritized on a technological and operational level. Benefits SM1, SM2, SM3 and C7 are highlighted as most prioritized on a sales & marketing and consumer level. Next, Chapter 4 will describe what data requirements are needed in order to implement all prioritized benefits into a unique modeling language (UML) data model.
Table 3.6 Prioritized Benefits

Digital Vending – Final Report 14-11-2014 46
4 Data requirements This chapter will describe what data requirements are needed to fully exploit the prioritized benefits to construct a unique modelling language (UML) data model. The UML data model is described in paragraph 4.1. Next, a brief market analysis is performed in paragraph 4.2. From this market analysis, a market benchmark is drawn and outlined in paragraph 4.3. The market benchmark is used to reflect MI’s future telemetry solution upon; this is described in paragraph 4.4. The chapter will be concluded in paragraph 4.5.
4.1 UML data model
For the formation of the unique modeling language (UML) data model, several resources were used (Table 4.1). No external resources are used. To draw an information model on all prioritized benefits, it’s necessary to define all the data requirements from those benefits. The requirements describe the tasks which the system should be able to execute and the information needed to execute these (Eshuis et al., 2009). Next, a UML model is formed by combining all requirements visualised by one or more class diagrams, containing all relevant concepts and relationships between all concepts. The prioritized benefits drawn from the customer value proposition from Chapter 3 will form the fundament of defining the data requirements. As Eshuis et al. (2009) state, a UML data model can be prepared based on three areas, namely:
Identification of relevant object classes
Identification of relevant relationships between these object classes
Addition of relevant constraints Object classes are defined as information objects that correspond with real-world objects and carry certain properties, named attributes. For example: every operator (object class) is identified by an operator number (attribute). Next, a constraint refines a model element by expressing a condition or a restriction to which the model element must conform (IBM, 2014). The preparations of the identification areas mentioned above are shown in Appendix R1. Appendix R2 outlines a summary description of every object class to give an impression of the loaded information. Appendix R3 shows a table with all object classes and their according attributes. Finally, Appendix R4 shows an overview of all identified relationships. The final UML data model is shown in Figure 4.1 and Appendix S. As can be seen in Figure 4.1, technological benefits are highlighted by
Table 4.1 Resources used for UML data model

Digital Vending – Final Report 14-11-2014 47
the color dark-green, operational benefits by green and sales & marketing benefits by light-green; indicating to what type of benefit they add value.
As can be seen in Figure 4.1, consumer benefit C7 and technological benefit T2 are not shown in the UML data model, as C7 (offer cashless payments) is an additional plug-in or integrated solution once the vending machine is online and independent of telemetry and T2 (decrease downtime of vending machines) can be characterised as an indirect benefit of OP1. All other prioritized benefits are included in the UML data model. The prioritized benefits used in the UML data model are showed in Table 4.2, as they form the base of the UML data model and can be used as a guideline while reading. Some assumptions are made while constructing the UML data model. First of all, the end-consumer is assumed to be part of the “customer” object class. Every
Table 4.2 Prioritized benefits used in UML data model
Figure 4.1 Final UML data model

Digital Vending – Final Report 14-11-2014 48
customer has guests or employees, being end-consumers, who purchase at their vending machines. Second, when a sales manager changes a product price, it is assumed that all product prices change at the same time. In the future, it should be possible to change product prices at individual vending machines. Third, the object classes Product, Vending machine, Snack, Drink and Ingredient are all assumed to provide necessary information for the realisation of all benefits, and are therefore not specified to a certain type of benefit.
4.1.1 Technological benefits
The prioritized technological benefit T3 withholds the monitoring of vending machines on reliability and performance. The object class Performance is highlighted dark-green and light-green, as a vending machine can be monitored on the technological aspects of reliability and performance (T3) and the sales & marketing aspects of performance (SM1,3). The technological aspects include the attributes that register the total amount of down-time and the event of opening vending machine doors. The last attribute is registered to check if operators actually visit the vending machine. The sales & marketing aspects of performance indicate the number of purchases done by a customer. A purchase withholds a product number, type and price, plus the purchase number, date and quantity. As for the constraints, a vending machine has only one performance, and performance belongs to one vending machine. Next, the sales & marketing performance can include zero or more purchases, and a purchase only belongs to one performance.
4.1.2 Operational benefits
The prioritized operational benefits OP1, OP3, OP5 and OP6 are also included in the UML data model, covering the largest part of all object classes. First of all, benefit OP1, taking care of service errors from distance, covers the object classes Vending machine, Service error, Operator and Service engineer. Once a service error occurs including the service error number, date, type and operator number, the assigned operator automatically receives a service error notification. The operator can prepare his visit when receiving service error type information, and bring the required spare parts for example. The service error number, date and type are identified to store and track service errors, whereas the operator or service engineer number are stored to ensure traceability. Once certain service errors occur more often and include the same service error type, failing components can be replaced for example to prevent the service error from happening again. When the operator is not available or capable of fixing the service error, a service engineer automatically receives a service error notification including the service error number, date and type. As for the constraints, a vending machine belongs to one service error, and vice versa. A service error has zero “operator” when the operator is not available or capable, and the service error is taken care of by one service engineer. On the other hand, an operator can have has zero or more service errors to take care of. Next, a service engineer only belongs to one service error, but zero or one service engineer can fix a service error.

Digital Vending – Final Report 14-11-2014 49
Second, benefit OP3, efficient inventory management, is covered by the object classes Vending machine, Inventory VM and Operator, whereas the object classes Ingredient, Purchase and Product provide necessary additional information. The Inventory VM object class includes the inventory levels of all products within the vending machine. For example product A has 16 items left. As can be seen in figure 4.1, the Product, Snack, Drink and Ingredient object classes all include an inventory number (ProdInvNo, SnackInvNo, DrinkInvNo and IngrInvNo) to identify the amount of inventory still left in the vending machine. This way, an operator can check beforehand how much inventory is still in the vending machine and thus how much is needed for refill before loading his truck in the morning, or even before entering the building. Once a product is purchased, object class Inventory VM receives information from object class Product and indirectly from object class Purchase about the product number, type, price and inventory number as well as the purchase number, date and quantity. Once a purchase occurs, inventory levels adapt simultaneously in Inventory VM. Next, not only refilling the vending machines is done more efficient, but also the order process. Once object class Inventory VM notes a product or ingredient gets below its inventory threshold (ProductAThreshold and IngredientAThreshold), the responsible operator receives an automatic notification with an order request. Hot drinks (coffee for example) are measured differently than cold drinks and snacks. As the current installed base of vending machines does not include sensors to measure ingredients levels, the inventory levels of hot drink products and thus ingredients are measured differently. They are measured by the amount of hot drinks purchases or “clicks”. As every hot drink has a certain average weight, ingredients inventory levels can be calculated. For example 1000 grams of coffee beans exist of 125 cups of coffee, averaging 8 gram per “click”. When 15 hot drinks are purchased, 15 x 8 = 120 grams of coffee beans are used. The remaining ingredient inventory number (IngrInvNo) has a value of 1000-120=880 gram. Once a purchase occurs, object class Product receives information from either object class Snack including the snack number, type, price, weight, expiration date and inventory number or object class Drink including the drink number, type, price, weight, expiration date and inventory number. Here noted that object class Drink also receives information from object class Ingredient once a hot drink product is purchased. When looking at the constraints, the inventory belongs to one vending machine, and one vending machine has only one inventory. Next, the inventory can contain multiple products, but a product can only belong to one vending machine. Furthermore, an operator refills zero or one inventory, and zero or multiple operators can refill an inventory. As for the ingredients, an inventory contains zero or more ingredients, and an ingredient belongs to one inventory. Third, the benefit OP5, accurate invoicing, is covered by object classes Invoice and Purchase and additional information is needed from object class Customer. Accurate invoicing occurs when a purchase is registered and saved containing all information needed: the product number, type and price plus the purchase number, date and

Digital Vending – Final Report 14-11-2014 50
quantity. This information is saved at object class Invoice, which registers a unique invoice number, date and customer number for every customer. Every customer invoice contains all purchased products for a certain period (including ingredients), and can be viewed by the customer through an online dashboard. As for the constraints, a purchase belongs to one specific customer invoice, and an invoice contains zero or more purchases. A customer can do zero or more purchases, but a purchase belongs to only one customer. Finally, an invoice belongs to one customer and vice versa. Fourth, the benefit OP6, remotely changing product prices, is covered by object class Sales manager whereas object class Product is used for additional information. The object class Sales manager is highlighted both green and light-green as it takes care of both OP6 and SM2. The operational benefit of adjusting prices remotely is taken into account in the relationship Product – Sales manager. Every sales manager is identified by a sales manager number. A sales manager can adjust product prices by remotely changing the values of attribute ProdPrice and thus attributes SnackPrice and DrinkPrice. As for the constraints, a sales manager belongs to zero or more products, as he can be responsible for zero or multiple products. The other way around, one or more sales managers can control a product. Hence, every product price needs to be controlled.
4.1.3 Sales & Marketing benefits
The sales & marketing benefits consist of SM1, SM2 and SM3. First of all, SM1, sales data insights, is covered by the object classes Vending machine, Performance and Purchase, whereas object class Product provides additional information. The sales Performance of a Vending machine can be monitored by analysing the Purchases. The object class Performance receives the purchase number, date and quantity acquired from object class Purchase, which receives the product information from object class Product, containing the product number, date and price. A sales manager can view sales data insights on a vending machine when all purchase numbers, dates and quantities are known and registered. A purchase belongs to one specific performance of a vending machine, and a sales performance has zero or more purchases. As also mentioned in paragraph 4.2.1, a vending machine has one performance, and a performance belongs to one vending machine, whether it is sales or operational beneficial. Second, benefit SM3, performing sales analysis, is done the same way. As sales data insights identifies badly performing vending machines, sales or operationally-wise, performing sales analysis gives the opportunity to segment customers based on their type of vending machine, type of company or consumption behaviour. Here said, it is closely related to sales data insights. Like benefit SM1, object classes Vending machine, Performance and Purchase cover SM3. Sales analysis can be performed per for example type of vending machine when purchase information is gathered containing the purchase number, date and quantity. Through attribute VmType, sales analysis can be divided into different kind of vending machine types.

Digital Vending – Final Report 14-11-2014 51
Third, benefit SM2, adjust the vending machines’ product mix, covers object class Sales manager whereas object class Product provides additional information. Sales manager can adjust the product mix based on the analysis of sales data; and thus based on the analysis per vending machine of attributes purchase number, date and quantity. A sales manager, identified by a sales manager number and presumably assigned to certain products, can remove and/or add products by adding a product including a product number, type, price, weight, expiration date and inventory number. A sales manager can remove or add zero or more products, and a product always belongs to one or more sales managers.
4.2 Market
A market benchmark needs to be defined to reflect MI’s telemetry solution upon. Telemetry solutions from vending operating competitors in the Netherlands are chosen for examination, as it is in MI’s interest to have a clear view on other market offerings to improve their relationships with existing customers and offer unique buying reasons at new customers. The most important vending operating competitors in the Netherlands are Douwe Egberts, Abos and Selecta. Douwe Egberts offers a telemetry solution named “DE Connectivity” (DE, 2014), whereas Abos.eu named her telemetry solution Connect.Me. Selecta cooperates with a Russian manufacturer of telemetry solutions named Unicum (Unicum, 2014). At this moment, MI is experimenting in The Netherlands with Vendon as a telemetry solution provider at ING Group. Therefore Vendon is chosen as MI’s comparison to other market offerings. To compare all vending telemetry solutions with each other and eventually outline a market benchmark, several features are named based on existing market telemetry solutions and covering the categories from the customer value proposition; technological, operational and sales & marketing, whereas consumer benefits are integrated in sales & marketing benefits. Benchmarking is defined in this Thesis as the process of comparing one’s business processes and performance metrics to industry bests. In this case a telemetry solution that will function as the market benchmark for other telemetry solutions. Costs are not taken into account as telemetry solutions are custom-made solutions and costs also depend on the adaptability to an organizations’ existing data architecture. A comparison matrix is composed in Appendix P. The benefits drawn from the customer value proposition are used as input plus additional information was drawn from company websites (DE, 2014; Abos.eu, 2014; Unicum, 2014; Vendon, 2014) and documents. As can be seen in Appendix P, all telemetry solutions provide the operational necessities to make an organizations’ inventory management more efficient, optimize its route planning, enable 2-way communication, remotely change settings, update software and gain access through a web-interface. This also counts for the technology category, where all solutions carry vending machine performance checks and audits, do not require any software installation and include the same
Digital Vending – Final Report 14-11-2014 52
technological hardware. All four solutions consist of a GPRS modem and a SIM card containing a certain amount of data. The modem is placed inside the vending machine and connects with 3/4G, local area network or wireless intranet. More differences in features can be seen in the offering of online and/or mobile payment solutions. Vendon and Connect.Me do not support the real-time monitoring of cashless cards payments, whereas Connect.Me and Unicum do not provide any mobile payment solutions. DE Connectivity offers both the real-time monitoring of cashless cards and mobile payments. DE Connectivity uses the mobile application MyOrder (MyOrder, 2014) to enable mobile payments. Vendon realizes mobile payments through SMS. In the third category, sales & marketing, all solutions provide real-time online monitoring as well as the possibility to conduct sales analysis. Monitoring consumer behavior per video is not provided by any of the telemetry solutions. Furthermore, narrowcasting opportunities for showing advertisements or corporate content on vending machine screens is supported by Connect.Me and DE Connectivity, whereas the creation of loyalty programs for consumers is only supported by Unicum and DE Connectivity. Unicum goes even further by offering the only solution that tracks individual consumer consumption.
4.3 Benchmark
A market benchmark is drawn based on the market analysis. Besides reflecting MI’s future telemetry solution upon a market benchmark, it helps MI in finding the right IT vendor to provide the necessary telemetry hard- and software. There can be concluded that all four telemetry solutions provide all necessary operational and technological features. Differences exist in the offering of payment solutions and sales & marketing features. Connect.Me does not offer any real-time cashless or mobile payment solutions, whereas DE Connectivity offers both. Furthermore, all four solutions offer real-time online monitoring per vending machine and the capability to perform sales analysis. When going into more specific sales & marketing features, the solutions still leave space for improvement as none of them offer video monitoring of consumer behavior, only two solutions offers narrowcasting opportunities (Connect.Me and DE Connectivity) and only two solutions offer the possibility of creating loyalty programs and the possibility to track individual consumer consumption (Unicum and DE Connectivity). Vendon does not offer any sales & marketing features directed at the consumer. As of this analysis, DE Connectivity is chosen as market benchmark and highlighted in Appendix P by its yellow color, as it includes all necessary and innovative benefits aimed at the consumer and prepared for long-term profitability.
4.4 Reflection
The market benchmark offered by Douwe Egberts can be compared with MI’s telemetry solution including all prioritized benefits. Generally telemetry solution DE Connectivity and MI’s future telemetry solution include the same technological,
Digital Vending – Final Report 14-11-2014 53
operational and sales & marketing features. Differences lie in DE Connectivity offering both benefits OP4 (online software updates) and C2 (offer personalized products, promotions and pricing or loyalty programs), whereas MI’s future telemetry solution is not. Both OP4 and C2 are possible on the mid- and/or long-term, but were not prioritized as most important during the consultation sessions with MI. Benefit C7 (offer cashless payments) is not implemented in the UML data model, but will be integrated in all vending machines once the telemetry solution is working properly.
4.5 Conclusion
The prioritized benefits are used to define all relevant data requirements, object classes, the relationships between those object classes and their corresponding identified constraints. This results in a UML data model visually how all object classes are related regarding a sufficient future telemetry design for MI. When comparing MI’s future telemetry solution with market benchmark DE Connectivity, they generally overlap. Differences exist in DE Connectivity offering the benefits OP4 and C2, whereas MI’s future telemetry solution is not (yet).

Digital Vending – Final Report 14-11-2014 54
5 Functional requirements This chapter will outline the findings of in-depth interviews A, B and C with regard to the examination of the conceptual research model. The eventual included factors of the final research model are considered to be the functional requirements for MI’s future telemetry solution. The methodology of interpreting the findings is explained in paragraph 5.1. Next, paragraph 5.2 till 5.4 will outline the findings from in-depth interviews A (MI), in-depth interview B (The Valley) and in-depth interview C (BrandLoyalty). Based on these findings, the conceptual research model will be adjusted into the final research model in paragraph 5.5. Finally, paragraph 5.6 concludes this chapter.
5.1 Findings
Besides the data requirements outlined in chapter 4, functional requirements are also determined to strengthen MI’s future telemetry solution. For the examination of the conceptual research model, several internal resources and external resources were used (Table 5.1). The external resources exist of companies The Valley and BrandLoyalty. Appendix T shows a detailed profile on both companies. In short, both companies work on a daily basis on the interface of analytical BI and interactive marketing and implement project internally and externally drawn from this interface. The description and findings regarding the conceptual research model are outlined in paragraph 5.2 for the internal resources and in paragraph 5.3 and 5.4 for the external resources. Table 5.2 shows an overview of all internal and external interviewed participants and all data and organizational promoters drawn from the conceptual research model. Throughout five semi-structured in-depth interviews at MI, one at The Valley and one at BrandLoyalty, open questions were asked about the internal or external integration of analytical BI and interactive marketing and accordingly the internal and external implementation processes of projects that were drawn from this integration. In this Thesis, internal projects are viewed as projects initiated by company A and implemented inside the same company A, whereas external projects are viewed as projects initiated by company A and implemented inside company B. As described in paragraph 1.5.2, MI is considered as an unsuccessful case regarding the implementation of a project drawn from the integration of analytical BI and interactive marketing (hereafter: integration ABI-MI), whereas companies The Valley and Brand Loyalty are considered as successful cases.
Table 5.1 Resources used for conceptual research model

Digital Vending – Final Report 14-11-2014 55
Table 5.2 Findings conceptual research model
As also shown in the legend of Table 5.2, a green colour marks the fact that the interviewee mentioned and confirmed the data/organizational factor as a promoter or barrier for the ABI-IM integration. As promoters are the opposite of the barriers, a confirmation for a certain promoter automatically leads to a confirmation for the opposite barrier. For example, JS mentioned and confirmed the need for top management support in the organizational integration of analytical BI and interactive marketing and it’s according internal and external projects drawn from this integration. A yellow colour marks that the factor is mentioned, but not confirmed. For example, MvD mentioned the factor top management knowledge on analytical tools, but did not confirm it as a necessity on the ABI-IM integration. Lastly, a red colour means that the factor is not mentioned at all by the interviewee. Hereby noted, all questions were open questions and did not point towards a confirmation of certain factors, leaving room for new promoters or barriers to be mentioned. Two additional factors were identified during the interviews. One data and one organizational factor, namely: (1) defining the functionalities of a project or technology drawn from the ABI-MI integration before implementation and considered as a data promoter defining what data is gathered and why it is gathered. And (2) the presence of good project management including project objectives and strategies, sufficient resources, cooperation between all disciplines, gateway reviews, assigning priority to the project and a project planning, considered as an organizational promoter of the ABI-IM integration. The conclusion of what factors are assumed to strengthen the ABI-MI integration based on all internal and external resources, and how this will adjust the conceptual research model, will be described in paragraph 5.5. First, in-depth interviews A (MI), in-depth interview B (The Valley) and in-depth interview C (BrandLoyalty) will outline a short conclusion on what factors strengthen the ABI-MI integration based on the findings drawn from that individual in-depth interview.

Digital Vending – Final Report 14-11-2014 56
5.2 In-depth interviews A – Maas International
Five important internal stakeholders were interviewed according to interview guide B (Appendix D) regarding the examination of the conceptual research model. Together they cover the most important organizational disciplines considering the implementation of projects, internally or externally, that are drawn from the ABI-MI integration. The disciplines are marketing (resource code; JS), sales (MvD), R&D (JB), quality management (MO) and IT (RB). For MI, the most recent internal project reflecting this base, considers the implementation of telemetry.
5.2.1 Findings data & organizational factors
The findings are outlined per factor combined with a brief description, starting with the three data factors, then the four organizational factors and finally two additional factors. Appropriate data infrastructure As seen in Table 5.2, all five interviewed participants mentioned and confirmed the need for an appropriate data architecture being able to continuously share information, optimize decisions, communicate results and generate new insights for businesses. In general, they all highlighted the importance of a solid BI and data infrastructure as the foundation for interactive marketing. When asked about the flexibility and adaptability regarding new wireless data collection technologies to be implemented, the overall conclusion was that no big roadblocks were mentioned, as there are always custom made links to be created between several systems. Data scientists All five interviewed participants mentioned and confirmed the need for “data scientists” or data experts, being able to interact with the data itself and include more creative IT skills than a traditional data analyst. Highlighted was the emphasis of using this creative IT skill to translate raw data into useful business information, based upon functionalities defined by the same data experts. Top management knowledge on analytical tools The need for top management to become familiar with real-time analytical methodologies as a data factor and promoter to the ABI-IM integration, was mentioned but not confirmed by three out of five participants (JS, MvD and JB). The two other participants (RB and MO) did not mention this factor at all. It was stated by JS, MvD and JB that top management needs to have a clear view on the prospects and benefits of certain real-time analytical tools. However, they do not need to have detailed knowledge about the usability, adaptability and technology. Data culture Not any participant mentioned the presence of a data culture where fact-based decisions are part of the culture and the focus lies on generating insights based on continuous experimentation, sharing and merging of data, as a factor influencing the ABI-IM integration.

Digital Vending – Final Report 14-11-2014 57
Top management support All five participants mentioned and confirmed the presence of a strong and formally approved support from top management as an (organizational) promoter of the ABI-MI integration. More specifically, top management support should include and/or enable: good project management, beneficial funding, skilled personnel and commitment throughout the organization. Alignment of analytical strategy with organizational strategy Three out of five participants (JS, MvD and MO) mentioned and confirmed the need to align analytical objectives and strategies with overall organizational objectives and strategies. However, the other two participants (RB and JB) did not mention this organizational factor to influence the ABI-MI integration. Highlighted is the importance to form project objectives and strategies on the long-term, likewise to organizational strategies and objectives. Cooperation between IT & Marketing Cooperation and sharing of information between IT and marketing as an organizational factor is mentioned and confirmed by all five participants. There can be concluded that this cooperation and communication is most effective when: good project management is enabled and other related disciplines (finance, sales, operations etc.) are being involved throughout the project from start to finish.
5.2.2 Findings additional factors
Definition of functionalities Five out of five participants mentioned and confirmed the need to define functionalities first on a project drawn from the ABI-IM integration. As MI is considered as an unsuccessful case regarding the implementation of telemetry, all participants stated that it was unclear what to do with the data once it was gathered. No clear functionalities were defined beforehand, resulting in a lack of understanding on how to use the analytical BI to improve business or perform marketing. Good project management The need for good project management was also mentioned and confirmed by five out of five participants. All of them highlighted the absence of this factor as one of the reasons the project did not succeed in the first place. This factor is considered as an organizational barrier to the ABI-MI integration if absent, and an organizational promoter if present.
5.2.3 Conclusion
There can be assumed from the findings of in-depth interviews A that the following data factors strengthen the ABI-MI integration: appropriate data infrastructure, data scientists and additional data factor definition of functionalities. These factors were mentioned and confirmed as a data promoter by all interviewees, as shown in Table 5.2. Next, there can be assumed that data factor top management knowledge on
Digital Vending – Final Report 14-11-2014 58
analytical tools does not strengthen the ABI-MI integration, as it was mentioned and oppositely confirmed by three out of five participants and not mentioned at all by the other two. The assumption is made as it seems from the findings that this factor is not important or influential enough. As for the organizational factors, there can be assumed that the following factors strengthen the ABI-MI integration: top management support, cooperation between IT & marketing and additional organizational factor good project management. All three factors were mentioned and confirmed by all interviewees. Organizational factors data culture and alignment of analytical strategy with organizational strategy are assumed to be not influential enough to strengthen the ABI-MI integration as they respectively were mentioned and confirmed by none out of five and three out of five participants.
5.3 In-depth interview B – The Valley
The Valley is a company, based in Amsterdam, The Netherlands, specialised in the development, maintenance, launching and optimization of cross channel marketing communication. Some of their clients include multinationals like ABN-AMRO, Air France-KLM, Porsche, Nike, Philips and Tommy Hilfiger. The Valley developed an eCRM database marketing platform called Nominow (pronounce: Know-me-now), where consumer profiles can be built and used for 1-on-1 marketing purposes. Nominow uses cross channel tools as e-mails, websites, Apps and social media to send personalised content based on the collected data, to increase the conversion-rate at their client (The Valley, 2014). Tommy Hilfiger (Tommy Hilfiger Europe, 2014) for example, is using the Nominow database marketing tool since 2010, introducing the The Hilfiger Club loyalty program for their customers. The loyalty program increased the conversion rate with 48% (The Valley, 2014). The interview was taken from Philip Kok, CEO of The Valley.
5.3.1 Findings data & organizational factors
The findings are outlined per factor combined with a brief description per company, starting with the three data factors, then the four organizational factors and finally two additional factors. Appropriate data infrastructure TV mentioned and confirmed the need for an appropriate data architecture being able to continuously share information, optimize decisions, communicate results and generate new insights for businesses. TV noticed that adequate analytical BI is the base for performing personalized marketing. Data scientists The need for “data scientists” or data experts, being able to interact with the data itself and include more creative IT skills than a traditional data analyst, was mentioned and confirmed by TV. In more detail, an information architect to handle

Digital Vending – Final Report 14-11-2014 59
and prioritize all incoming data, a developer to create custom made connections with other data infrastructures from customers and data analysts who can interact with the data and perform marketing from it. Top management knowledge on analytical tools TV did not mention the need for top management knowledge on analytical tools as a data promoter of the ABI-MI integration. However, TV did mention this factor to be present at the management team, one level below top management. Through good project management, projects drawn from the ABI-MI integration requires specific knowledge on the analytical BI tools needed to convince top management of its support. Data culture The presence of a data culture was not mentioned by TV. In comparison, making marketing decisions based on data forms the backbone of the company, but this was not cited in any cultural way. Top management support TV mentioned and confirmed a strong and formally approved support from top management as an (organizational) promoter of the ABI-MI integration. Top management should provide the necessary budgets and resources for successfully executing projects drawn from the ABI-MI integration. TV also mentioned that companies who include the digitalisation of their core business as their first priority, are more eager to provide support than those who don’t. Alignment of analytical strategy with organizational strategy The need to align analytical goals and strategies with overall organizational goals and strategies as an organizational factor on the ABI-MI integration was mentioned and confirmed. To be successful, TV declared, the capturing, testing and interaction with data to perform marketing, forms the primary focus throughout the whole organisation. It does not matter what project is considered, whether it regards the database marketing platform Nominow or an online advertising campaign. Cooperation between IT & Marketing The cooperation and sharing of information between IT and marketing as an organizational factor is mentioned and confirmed by TV as it explains that in order to perform successful marketing from data, information architects need to work hand in hand with modern data analysts.
5.3.2 Findings additional factors
Definition of functionalities TV also mentioned and confirmed the need to define all functionalities of a certain project drawn from the ABI-MI integration. TV declares that collecting data is not enough and states that technology is only the start and a means to perform marketing. There needs to be a strong belief of where data is used for before collecting it.

Digital Vending – Final Report 14-11-2014 60
Good project management The need for good project management is also mentioned and confirmed by TV. The management team has the task to create a project planning and a solid business case to convince top management to give approval on the project. After approval, top management provides necessary budgets and resources whereas top management executes its project planning, forms the project team and defines goals and functionalities. All this is considered as good project management.
5.3.3 Conclusion
From the findings of in-depth interview B, there can be assumed that the following data factors strengthen the ABI-MI integration: appropriate data infrastructure, data scientists and additional data factor definition of functionalities. All three factors were mentioned and confirmed as a data promoter by TV, as shown in Table 5.2. Data factor top management knowledge on analytical tools is assumed to be not important or influential enough and thus not strengthen the ABI-MI integration, as it was not mentioned and confirmed. Organizational factors top management support, alignment of analytical strategy with organizational strategy, cooperation between IT & marketing and additional factor good project management are assumed to be promoters to the ABI-MI integration, as they were all mentioned and confirmed by TV. Organizational factor data culture was not mentioned and confirmed and is therefore assumed to be no promoter for the ABI-MI integration.
5.4 In-depth interview C – BrandLoyalty
In-depth interview C is performed at company BrandLoyalty, which is specialized in turning casual consumers into loyal shoppers by creating data-driven loyalty programs designed to generate immediate changes in consumer behaviour. BrandLoyalty, one of the largest and most successful data-driven loyalty marketers in Europe, is based in ‘s-Hertogenbosch, Netherlands. Large retailers as Delhaize, Coop and Spar are clients of BrandLoyalty (hereafter: BL). In November 2013 Alliance Data Systems Corperation (Dallas, USA), a leading provider of loyalty and marketing solutions derived from transaction-rich data, bought a 60% ownership in BL (Alliance Data, 2013). BL’s project realisation can be described as follows: BL writes and designs a data-driven loyalty program for a large retailer. This loyalty program can be accessed by the end-consumer of the client through a mobile App, and gifts can be redeemed at the client of BL. BL purchases all the gifts for the loyalty program, for example ten million sets of knifes, and after the loyalty program is finished, the client pays for every gift which is redeemed. All gift that are not redeemed, return to BL. This way, BL takes the risk of a failing program (BrandLoyalty, 2014).

Digital Vending – Final Report 14-11-2014 61
5.4.1 Findings data & organizational factors
The findings are outlined per factor combined with a brief description, starting with the three data factors, then the four organizational factors and finally two additional factors. Appropriate data infrastructure BL mentioned and confirmed the need for an appropriate data architecture being able to continuously share information, optimize decisions, communicate results and generate new insights for businesses. BL noticed that this infrastructure does not have to be complex, but mainly functional. Data scientists BL also mentioned and confirmed the need for data experts, being able to interact with the data itself. More specific, BL highlighted this as extremely important. Turning data into valuable information is seen as one of the biggest challenges by BL. Top management knowledge on analytical tools BL did not mention the need for top management knowledge on analytical tools as a data promoter of the ABI-MI integration. Data culture Although BL core business is to create data-driven loyalty programs and makes project approval decisions based on forecasts and historic sales data, the presence of a data culture was not mentioned by BL. Top management support BL mentioned and confirmed a strong and formally approved support from top management as an organizational promoter of the ABI-MI integration. BL works with “no cure, no pay”, meaning all remaining gifts that are not redeemed at the end of the loyalty programs, return to BL. This way, top management needs to make sufficient budgets available and support the project to minimize risk. Alignment of analytical strategy with organizational strategy The need to align analytical goals and strategies with overall organizational goals and strategies as an organizational factor on the ABI-MI integration was not mentioned. Cooperation between IT & Marketing BL mentioned and confirmed cooperation between IT & marketing as an organizational factor. In fact, BL combines the following disciplines at the start of every new project: sales & marketing, operations/IT and sourcing. This way, there can be defined what data there needs to be collected, at what cost and to what reward.

Digital Vending – Final Report 14-11-2014 62
5.4.2 Findings additional factors
Definition of functionalities Like TV, BL mentioned and confirmed the need to define all functionalities in the early stages of project definition. BL states it is very important to have a clear view on what kind of data there should be collected, and for what reason. Again, BL states having skilled data experts who are able to interact with the data, is highly important. Good project management The need for good project management is also, like TV, mentioned and confirmed by BL. As BL carries all the risk in their loyalty programs, a decent forecast based on all functionalities is needed combined with a proper project planning. After approval of top management, budgets and resources can be assigned.
5.4.3 Conclusion
From the findings of in-depth interview C, there can be assumed that the following data factors strengthen the ABI-MI integration: appropriate data infrastructure, data scientists and additional data factor definition of functionalities. All three factors were mentioned and confirmed as a data promoter by BL, as shown in Table 5.2. Data factor top management knowledge on analytical tools is assumed to be not influential enough to strengthen the ABI-MI integration, as it was not mentioned and confirmed. Organizational factors top management support, cooperation between IT & marketing, and additional factor good project management are assumed to be promoters to the ABI-MI integration, as they were all mentioned and confirmed by BL. Organizational factor alignment of analytical strategy with organizational strategy and data culture were not mentioned and confirmed and are therefore assumed to be no promoter or barrier for the ABI-MI integration.
5.5 Final Research Model
Since all findings from in-depth interviews A, B and C are described in the previous paragraphs, overall conclusions can be drawn. Data factors appropriate data infrastructure, data scientists and additional data factor definition of functionalities are assumed to strengthen the ABI-MI integration, based on these findings. Data factor top management knowledge on analytical tools is assumed to be not influential enough and not strengthen the ABI-MI integration as it was not mentioned by four out of seven recourses and oppositely confirmed by the other three. Next, the factors top management support, cooperation between IT & marketing, and additional factor good project management are assumed to strengthen the ABI-MI integration on an organizational level. Organizational factor data culture was not mentioned by any of the resources and it therefore assumed to be not influential
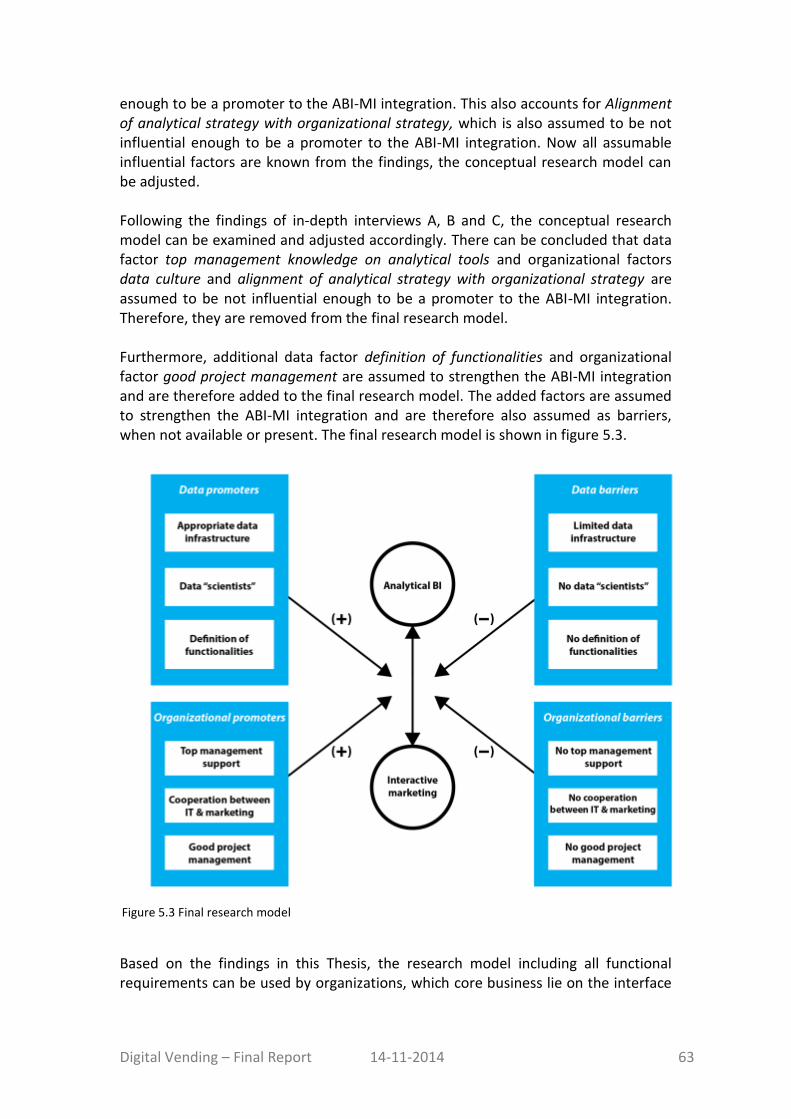
Digital Vending – Final Report 14-11-2014 63
enough to be a promoter to the ABI-MI integration. This also accounts for Alignment of analytical strategy with organizational strategy, which is also assumed to be not influential enough to be a promoter to the ABI-MI integration. Now all assumable influential factors are known from the findings, the conceptual research model can be adjusted. Following the findings of in-depth interviews A, B and C, the conceptual research model can be examined and adjusted accordingly. There can be concluded that data factor top management knowledge on analytical tools and organizational factors data culture and alignment of analytical strategy with organizational strategy are assumed to be not influential enough to be a promoter to the ABI-MI integration. Therefore, they are removed from the final research model. Furthermore, additional data factor definition of functionalities and organizational factor good project management are assumed to strengthen the ABI-MI integration and are therefore added to the final research model. The added factors are assumed to strengthen the ABI-MI integration and are therefore also assumed as barriers, when not available or present. The final research model is shown in figure 5.3.
Based on the findings in this Thesis, the research model including all functional requirements can be used by organizations, which core business lie on the interface
Figure 5.3 Final research model

Digital Vending – Final Report 14-11-2014 64
of analytical BI and interactive marketing. All data and organizational factors are assumed to strengthen this integration and projects drawn from this integration.
5.6 Conclusion
Based on the findings on in-depth interviews A, B and C, the conceptual research model was adjusted. Data factors top management knowledge on analytical tools and organizational factors data culture and alignment of analytical strategy with organizational strategy were removed, whereas factors definition of functionalities and good project management were added to the final research model. The final research model can be used by organizations when implementing a technology drawn from the integration of analytical BI and interactive marketing. All data and organizational factors can be considered as functional requirements and are assumed to strengthen this integration and projects drawn from this integration.

Digital Vending – Final Report 14-11-2014 65
6 Business Opportunities This chapter will outline the business opportunities drawn from MI’s future telemetry solution and implementation. Five business opportunities were formulated and defined, whereas four business opportunities are Business-to-Business (B2B) focused and one is Business-to-Consumer (B2C) focused. Paragraph 6.1 till 6.4 will outline the B2B business opportunities. Next, paragraph 6.5 will outline the B2C business opportunity. Finally, paragraph 6.6 concludes this chapter. Table 6.1 shows all resources used for the creation and description of the business opportunities drawn from the implementation of telemetry. The external resources exist of companies: Sweebr, The Valley and BrandLoyalty. Appendix T outlines all three company profiles briefly. Sweebr is specialized in developing online payment solution software for retailers, and also a potential IT partner for implementing telemetry inside MI. Brainstorm sessions with all three companies provided ideas and information about business opportunities drawn from the implementation of telemetry. Furthermore, internal resource JS, extended desk research and finally related literature formed the base of the formulation of business opportunities. Drawn from the literature and described in paragraph 2.8, four business opportunities were outlined: (1) advertising through vending machine screens, (2) collection of data to sell to companies, (3) collection of data to use for marketing purposes and (4) the creation of multiple wireless connected touch-points to increase revenue. Since, extensive research into the exploration and definition of those identified business opportunities is performed. This resulted in the formulation of five business opportunities that can be drawn from the implementation of telemetry at MI. Four of those business opportunities are focused on Business-to-Business (B2B) and will be outlined first. One of the business opportunities is focused on Business-to-Consumer (B2C), and will be outlined lastly. While formulating those business opportunities, there was constantly checked if the business opportunity created value for MI, for MI’s customer and for the end-consumer. This triangle of shared value forms the basis of long-term success. One of MI’s recently formed mission statements is to reach 1.000.000 unique clicks per day and to comprehend a paid consumption rate of 25% per year in 2020. This means MI has to come up with new business opportunities to increase the yearly turnover. The business opportunities outlined in this Thesis should benefit to that mission statement.
Table 6.1 Resources used for Business Opportunities
Digital Vending – Final Report 14-11-2014 66
6.1 Customer marketing platform
The first B2B business opportunity forms the creation of a customer marketing platform. Once MI’s installed base of vending machines is equipped with telemetry, real-time customer data can be collected and analysed. Through a web-based dashboard, developed internally or acquired externally, MI can perform sales analysis on its customers based on location, type of company etc. By analysing all incoming data, product mixes can be adjusted, vending machine locations can be changed and custom made promotions can be communicated based on a company profile. Within seconds, real-time sales data can be shown of a certain product from a certain vending machine, at a certain company, on a certain company floor. The creation of a customer marketing platform is the first step in interacting with the end-consumer, and is therefore considered as a business opportunity.
6.2 Advertising
Many type of advertising can be shown through vending machine screens. MI realises 500.000 unique clicks per day, and through telemetry, it can remotely adjust advertisements at vending machines at specific companies and matching the advertisements’ customer target group. Besides commercial advertising, narrowcasting can also offer traffic, news and/or weather headlines, social media plug-ins, corporate content and music to provide consumer experiences. This enables a huge commercial value for external parties to show advertising. Two fields of activities can be defined when exploiting this B2B business opportunity: (1) operational activities: solve service errors, upload images/videos, develop a manageable advertising platform maintenance etc., and (2) sales activities: “lease” or sell digital advertising space to companies. To support decision-making on this business opportunity, three different business models can be defined:
1) Outsource operations & sales: MI finds a partner who will “hire” the advertising space for a certain amount per month. The partner is responsible for both the operational activities and the sales activities. All risk lies with the partner.
2) Outsource sales: MI finds a partner specialized in narrowcasting sales and rent or sell advertising space to the partner, but MI stays responsible for operational activities.
3) Performing both operations & sales: MI operates without a partner and will be responsible for both sales income and operational support.

Digital Vending – Final Report 14-11-2014 67
Table 6.2 shows a rough indicating of calculated potential earnings and risk for MI. Here said, the advice would be to choose business model 1 or 2, as MI should see advertising as an additional way of income, without risking to many costs or concerns. To conclude, several remarks can be made: MI should explore how many vending machines of the current installed base include a vending screen appropriate for advertising and what the investment costs are of preparing a vending machine for advertising. Furthermore, the connection fees for telemetry only include approximately 2 megabytes per month; uploading images and videos will increase the monthly required data. Finally, MI should exploit her current customer base to its maximum potential and identify potential advertising groups. The customer base includes for example universities, banks and hospitals. This will increase the value of MI’s market advertising offering.
Table 6.2 Earnings and risk indication
To conclude, another advertising opportunity occurs once MI can interact with end-consumers by for example, a mobile App. An example could be: retailer HEMA (HEMA, 2014) offers a free cake once a consumer completed his or her reward-card with 10 cappuccinos. The consumer will receive a code, which can be redeemed online to order a cake. A kick-back fee can be asked by MI from HEMA for every consumer redeeming his or her code. This way, MI cooperates with large retail companies to offer more value to the consumer, MI and the retail partner.
6.3 Telemetry packages
In every new tender, telemetry is a condition that is highly wanted by customers. Real-time consumption insights, customer related promotions, consumer loyalty programs and also taking care of service errors from distance to decrease down-time can be of added value to both consumer and customer. The third B2B business opportunity is to offer customers the option of different telemetry packages, providing more features per package as the package gets more exclusive and accordingly, expensive. Consumer-focused features can convince consumers to convince their employer (the customer) to purchase a telemetry package offering these same features. By creating a free mobile App that is free to download and locking certain features such as

Digital Vending – Final Report 14-11-2014 68
loyalty programs or show product nutrition information, which can be “bought” by the customer, attractiveness and exclusivity is created. Table 6.3 shows an example of how telemetry packages could be offered.
Table 6.3 Telemetry packages
As one of MI’s recently formed mission statements is to realise that 100% of all vending machines are online in 2020, it’s important to offer telemetry as attractive as possible to customer. The Silver package therefore includes only the basics of a telemetry solution as a relatively low price. The Gold and Platinum packages offer consumer benefits, though at a higher price. Here noted, more consumer benefits can be added based on the customers’ company profile. This way, on the long-term, the packages optimize over time, ideally ending up in five or ten different packages, to fulfil the market and customer demands and needs at best.
6.4 Sales of data
The last B2B business opportunity withholds selling the data that is collected by data-driven marketing tools as a mobile App: once data can be collected from individual persons or targeted consumer groups, it can be examined on its “behaviour”; meaning data can be useful for other purposes than what it is primarily collected for. For example, Dutch company AFAS Personal offers a mobile App where consumers can automatically upload their bank transactions to check how much they pay for groceries, clothing or utilities. Next, AFAS analyses this data and sent personalized promotions or offers of cheaper utility companies. For MI this could mean that the 500.000 unique clicks per day have more significant value other than just giving insights in daily consumption. For example, health institutions would be interested in

Digital Vending – Final Report 14-11-2014 69
knowing how much coffee an average person drinks between the age of 15 and 25. Another example for MI could be to analyse what brands are preferred by individual consumers based on their consumption. For a brand like Lays, it could be interesting to know who their most loyal customers are over time. In short, several companies can benefit from the enormous amount of data that is collected once individual consumption can be tracked. This data can be analysed on its “behaviour” and sold to the right companies.
6.5 Mobile consumer App
The only B2C business opportunity described in this Thesis withholds developing a mobile application (App) aimed at the end-consumer including loyalty programs, product nutrition information, personal promotions, personal purchase history and vending machine finder. MI should outsource the development of the App, but maintain ownership. The App can add value when used at multiple-touchpoints where MI vending machines can be found (work, home, retail, gas station etc.). The App is free to download to make it accessible and attractive. Once downloaded, consumers fill in all their personal information and their nickname instead of their name to avoid privacy concerns. Next, consumers give permission to MI to save their information to offer them personal promotions and discounts. Table 6.4 shows an overview of all features which could be included in the App. According to research conducted by Responsys (2014) in the US, out of 1200 surveyed consumers, 71% of the people between 18 and 34 years of age downloaded an App of one of their favourite brands. Looking further, 70% of all consumers found it very valuable to receive push notifications of one of their favourite brands. Between the ages 18-34, this is even 76%. The most important reasons why people download an App of their favourite brand are as follows: 50% wants to have access to special or exclusive offers, 38% wants to review and manage a loyalty account and 34% wants to receive timely notifications about flash sales and product availability. These statistics increase the attractiveness of creating a mobile consumer App. Several examples of similar one-on-one data-driven marketing programs are known. As stated in paragraph 5.3, The Hilfiger Club loyalty program increased the conversion rate with 48% (Hilfiger Europe, 2014). Another example is the successful Starbucks App, including a loyalty program where consumers earn rewards and redeem them for free drinks and food (Starbucks, 2014). Users can also pay with the App, leave digital tips for employees and find Starbucks stores. According to Forbes
Table 6.4 App features

Digital Vending – Final Report 14-11-2014 70
(2013), 11% of Starbucks’ total sales volume in Q3 of the year 2013 came through its own mobile wallet. BrandLoyalty (BrandLoyalty, 2014) claims that the transformation of casual consumers into loyal shoppers by created loyalty programs and engaging the consumer, increases average sales turnover with 3-7%. This turnover increase is driven by an increased spend from existing consumers, especially primary consumers. These examples all support the profitability of this business opportunity.
6.6 Conclusion
The four identified business opportunities drawn from the literature and described in paragraph 2.8, are reformulated and improved into four B2B business opportunities and one B2C business opportunity. The four B2B business opportunities are (1) creating a customer marketing platform, (2) advertising through vending machine screens, (3) offering telemetry packages to customers and (4) sales of gathered data. The only B2C business opportunity described in this Thesis withholds (5) the creation of a mobile consumer App. Although MI’s focus will lie on short-term deliverables, business opportunities customer marketing platform, advertising and telemetry packages can be executed and realized relatively quick.

Digital Vending – Final Report 14-11-2014 71
7 Business Case This chapter will describe the business case regarding the implementation of telemetry at MI. Paragraph 7.1 will describe all financial statements and criteria used in the calculations. Next, paragraph 7.2 till 7.4 outline the financial savings on respectively technology, operations and inventory management. Paragraph 7.5 outlines the profit impact of sales increase, whereas paragraph 7.6 describes the cash-flow statement. Finally, paragraph 7.7 will conclude this chapter. To calculate the business case, several internal resources were used, as seen in Table 7.1. Besides internal resources, only desk research is used including assumptions from related market reports and documents. Before calculating all savings, paragraph 7.1 shows al financial criteria used to calculate the business case. This Thesis chose a Cash-flow approach to determine the net present value (NPV), internal rate of return (IRR) and Discounted Payback Period (DPP) of implementing telemetry at MI over a period of 5 years. The NPV represents the present value of an investment’s expected cash inflows minus the costs of acquiring the investment. The IRR is the interest rate at which the net present value of all cash flows from an investment equal zero. Finally, the DPP gives the number of years it takes to break even from undertaking the initial investment. If calculations are too specific, the reader will be referred to Appendix U, whereas Appendix U2 shows the complete financial overview. Another financial method could be to calculate the absorption costs of implementing telemetry at MI. As MI offers a Unique Buying Reason (UBR) to customers, MI can decide to pass on the telemetry investment costs to their customers, by increasing the sales price. However, the absorption costs are calculated on a high number of parameters, which makes it too complex for this research. For a Cash-flow statement, the incoming cash-flows, outgoing cash-flows and investment costs need to be determined. In short, the incoming cash-flows consist of savings made on technology, operations, inventory management and an increase on sales. The outgoing cash-flows are yearly costs made by telemetry and include provider connection fees, telemetry software license costs and personnel. The investments costs consist of telemetry hardware, route planning software and implementation costs. The incoming and outgoing cash-flows and investment costs will be explained in detail later. Both a worst and best case scenario are calculated to give more detailed information and support on decision-making.
Table 7.1 Resources used for business case

Digital Vending – Final Report 14-11-2014 72
7.1 Financial statements & criteria
This paragraph outlines all financial statements are criteria that are used to calculate the business case. First, all general financial statements are given. Afterwards, the financial criteria are given on technology, operations, inventory management and sales. The financial statements are given below:
Calculations are made per type of vending machine (hot drinks, cold drinks and snacks) to give more insights into the range of savings and to support decision-making.
All financial indicators are drawn and checked by MI’s financial department.
The length of the calculated business case is 5 years.
An interest rate of 8% is used for the NPV, IRR and DPP calculation.
All calculated costs and savings are estimates, due to the complexity of the case and the time frame of this research.
There is assumed 100% of the calculated installed base regarding hot drinks, cold drinks and snacks vending machines, can be equipped with telemetry.
7.1.1 Installed base
First of all, MI’s current installed base of vending machines can be divided into three categories, namely: (1) vending machines which are not operated by MI and include free consumptions, (2) vending machines which are operated by MI and include free consumptions, and (3) vending machines which are operated by MI and include paid consumptions. Table 7.2 shows an overview of the amount of vending machines per category, and subsequently per type of vending machine (hot drinks, cold drinks or snacks). Calculations are made per type of vending machine (hot drinks, cold drinks and snacks) to give more insights into the range of savings and to support decision-making.
Table 7.2 Current installed base of VM’s
Here said, as savings can be made for a large part on operations, inventory management and sales, type 1 (non-operating & free consumptions) is not taken into account in this business case. This means only type 2 and type 3 are taken into account and used throughout the business case.
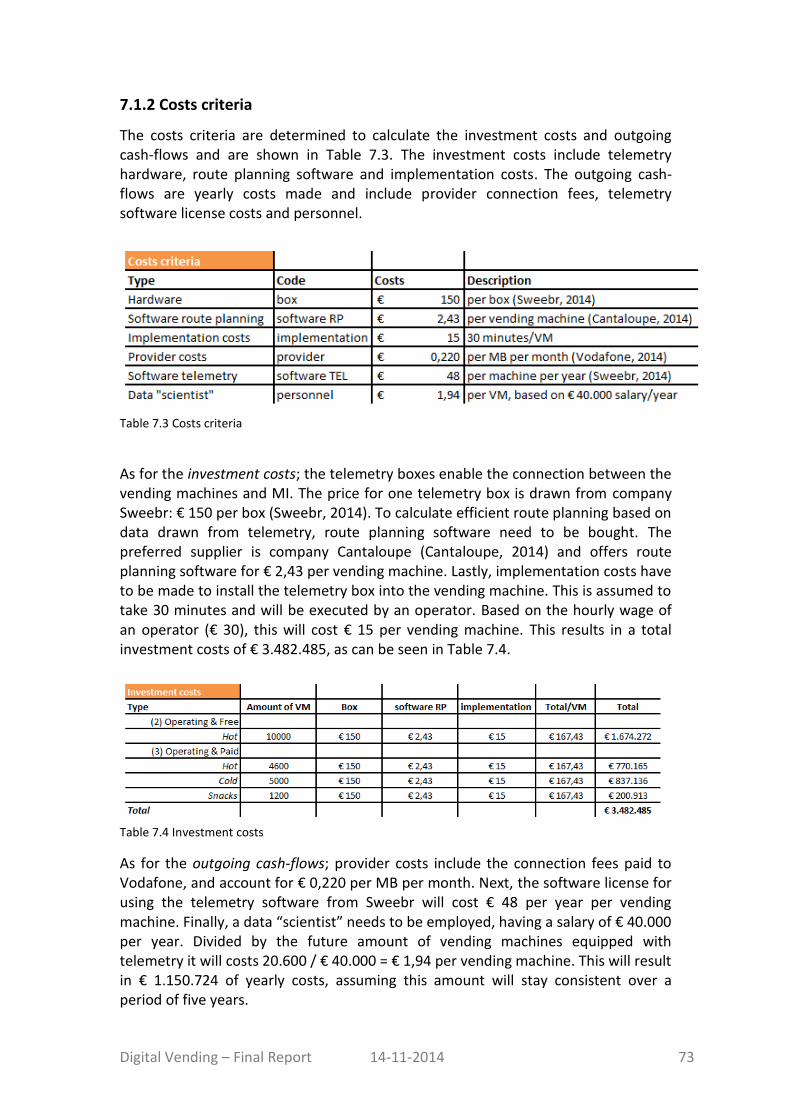
Digital Vending – Final Report 14-11-2014 73
7.1.2 Costs criteria
The costs criteria are determined to calculate the investment costs and outgoing cash-flows and are shown in Table 7.3. The investment costs include telemetry hardware, route planning software and implementation costs. The outgoing cash-flows are yearly costs made and include provider connection fees, telemetry software license costs and personnel.
Table 7.3 Costs criteria
As for the investment costs; the telemetry boxes enable the connection between the vending machines and MI. The price for one telemetry box is drawn from company Sweebr: € 150 per box (Sweebr, 2014). To calculate efficient route planning based on data drawn from telemetry, route planning software need to be bought. The preferred supplier is company Cantaloupe (Cantaloupe, 2014) and offers route planning software for € 2,43 per vending machine. Lastly, implementation costs have to be made to install the telemetry box into the vending machine. This is assumed to take 30 minutes and will be executed by an operator. Based on the hourly wage of an operator (€ 30), this will cost € 15 per vending machine. This results in a total investment costs of € 3.482.485, as can be seen in Table 7.4.
Table 7.4 Investment costs
As for the outgoing cash-flows; provider costs include the connection fees paid to Vodafone, and account for € 0,220 per MB per month. Next, the software license for using the telemetry software from Sweebr will cost € 48 per year per vending machine. Finally, a data “scientist” needs to be employed, having a salary of € 40.000 per year. Divided by the future amount of vending machines equipped with telemetry it will costs 20.600 / € 40.000 = € 1,94 per vending machine. This will result in € 1.150.724 of yearly costs, assuming this amount will stay consistent over a period of five years.

Digital Vending – Final Report 14-11-2014 74
Table 7.5 Costs per year
7.1.3 Profit impact criteria
As outlined before, by implementing telemetry, savings can be made on technology, operations, inventory management and an increase on sales. A worst and best case scenario is calculated, whereas both scenarios withhold different values for the “savings” parameters. Table 7.6 and 7.7 show all worst and best case values and
subsequently profit impact per vending machine. All values and calculations will now be explained per category; technology, operations, inventory management and sales.
Table 7.7 Best case scenario savings criteria
7.2 Technological savings
As for technology; the detection of component failure in an early stage or automatic service errors can prevent the customer from notifying MI. Now, MI has 3 full time employees for handling customer support, including calls from customers notifying MI of vending machine service errors. There is assumed that 33% of customers service calls can be decreased by telemetry, meaning 1 full time employee is needed less. Based on the yearly salary of one customer support employee, savings are made of € 40.000 per year.
7.3 Operational savings
At an operational level, telemetry can enable financial benefits on making route planning more efficient; and thus decreasing the number of total vending machine
Table 7.6 Worst case scenario savings criteria

Digital Vending – Final Report 14-11-2014 75
visits and the time spend per visit. A few remarks can be made about the calculation of savings of efficient route planning. Here said, hot drinks (coffee) vending machines need regular cleaning moments once per three days; meaning they need to be visited anyway. Cold drinks and snacks vending machines don’t need those cleaning moments and are therefore more suited for operational financial benefits from telemetry. As can be seen in detail in Appendix U, based on the yearly salary of one full time operator and the number of total full time operators inside MI, an average fixed cost price of € 10 per visit is calculated and confirmed by MI. From here, the total costs per vending machine (hereafter: VM) per year are calculated, resulting in € 1.112 for hot drinks VM’s, € 147 for cold drinks VM’s and € 516 for snacks VM’s (Table 7.8).
Table 7.8 Operational savings criteria
As Table 7.6 and 7.7 show, in worst case scenario 3% and in best case scenario 5% savings can be made on the total operational costs per hot drinks VM per year. For cold drinks VM’s and snacks VM’s this is 15% worst case and 20% best case. A 3% savings for hot drinks VM’s from a total costs per year of € 1.112 per hot drinks VM per year, gives a saving or profit impact of € 33,40 per hot drinks VM per year. However, MI states that only 10% of hot drinks VM’s visit savings can be monetized, and therefore only € 3,34 per hot drinks VM per year can be saved. For cold drinks and snacks VM’s, 25% of visit savings can be monetized. When multiplying these savings with the total amount of hot drinks VM’s (type 2 and 3), the total savings per hot drinks VM per year will be € 48.713 for the worst case scenario and € 81.188 for the best case scenario, as shown in Table 7.8 and 7.9.
Table 7.8 Worst case scenario savings/earnings per year
Table 7.9 Best case scenario savings/earnings per year
The operational savings percentages of 3% and 5% on hot drinks VM’s are checked and confirmed as there is no proven market standard. The cold drinks and snacks VM’s savings percentages of 15% and 20%, are based on market reports from US vending operators (MEI, 2008; MEI, 2012).

Digital Vending – Final Report 14-11-2014 76
7.4 Inventory Management savings
Telemetry enables MI to manage inventory management more efficient; meaning it will decrease the amount of purchasing and indirectly the storage costs. As Appendix U shows in more detail, the total purchasing costs per VM per year is calculated based on the total amount of clicks/purchases per year and the average purchasing price per product.
Table 7.10 Inventory Management savings criteria
Next, a worst and best case savings percentage on purchasing and storage costs is calculated based on reports made by MEI (2008), claiming telemetry can decrease the returned inventory per truck per week with 25-40%. As Appendix U shows in more detail, a worst case percentage of 4% and a best case percentage of 6% savings are calculated and confirmed by MI. As Table 7.8 and 7.9 show, this results in yearly inventory management savings of € 870.800 for hot drinks VM’s, € 259.200 for cold drinks VM’s and € 110.000 for snacks VM’s in worst case scenario and € 1.306.200, € 388.800 and € 165.000 in best case scenario.
7.5 Sales profit impact
The financial benefits of sales & marketing are only indirectly measurable and include inter alia: product price adjustments, improvement of sales pitch by including telemetry, adjusting the product mix based on sales analysis and the offering of loyalty programs and promotions. A remark can be made about the amount of hot drinks VM’s that are paid; only 4600 hot drinks VM’s that are part of type 3 (operating & paid) are used to calculate a sales increase. Reports from US vending operating companies indicate an average of 5-10% total sales increase coming from those indirect benefits (MEI, 2008; MEI, 2012). After extensive consultation with MI, there was decided to choose 5% for hot drinks VM’s and 10% for cold drinks and snacks VM’s as worst case sales increase. A 7% and 15% sales increase is chosen as best case scenario. As shown in Table 7.11, the gross profit per VM per year is € 845 for a hot drinks VM, € 1.650 for a cold drinks VM and € 2.400 for a snacks VM. Appendix U shows how this is calculated based on the total revenue per VM per year. MI states it wants to increase revenues over paid consumptions with 10% every year. This is integrated in the calculations and cash-flow statement. As shown in Table 7.8 and 7.9, telemetry enables a profit impact/sales increase of € 194.400 for hot drinks VM’s, € 742.500 for cold drinks VM’s and € 288.000 for snacks VM’s in worst case scenario, and a profit impact/sales increase of € 272.160, € 742.500 and € 432.000 in best case scenario.

Digital Vending – Final Report 14-11-2014 77
Table 7.11 “Savings” criteria on sales
7.6 Cash-flow statement
Since all incoming and outgoing cash-flows and investments costs are known, a cash-flow statement can be drawn and accordingly the net present value (NPV), internal rate of return (IRR) and discounted payback period (DPP). The worst case case-flow statement is shown in Table 7.12, the best case cash-flow statement in Table 7.13.
Table 7.12 Worst case cash-flow statement
Table 7.13 Best case cash-flow statement
As shown above, the total incoming cash-flow starts in year 1 with € 2.604.490 in worst case and € 3.866.934 in best case scenario. The outgoing cash-flows remain consistent over the years and are € 1.150.724 for both worst and best case scenario. This results in a positive cash-flow in year 1 of € 1.453.766 in worst case and €
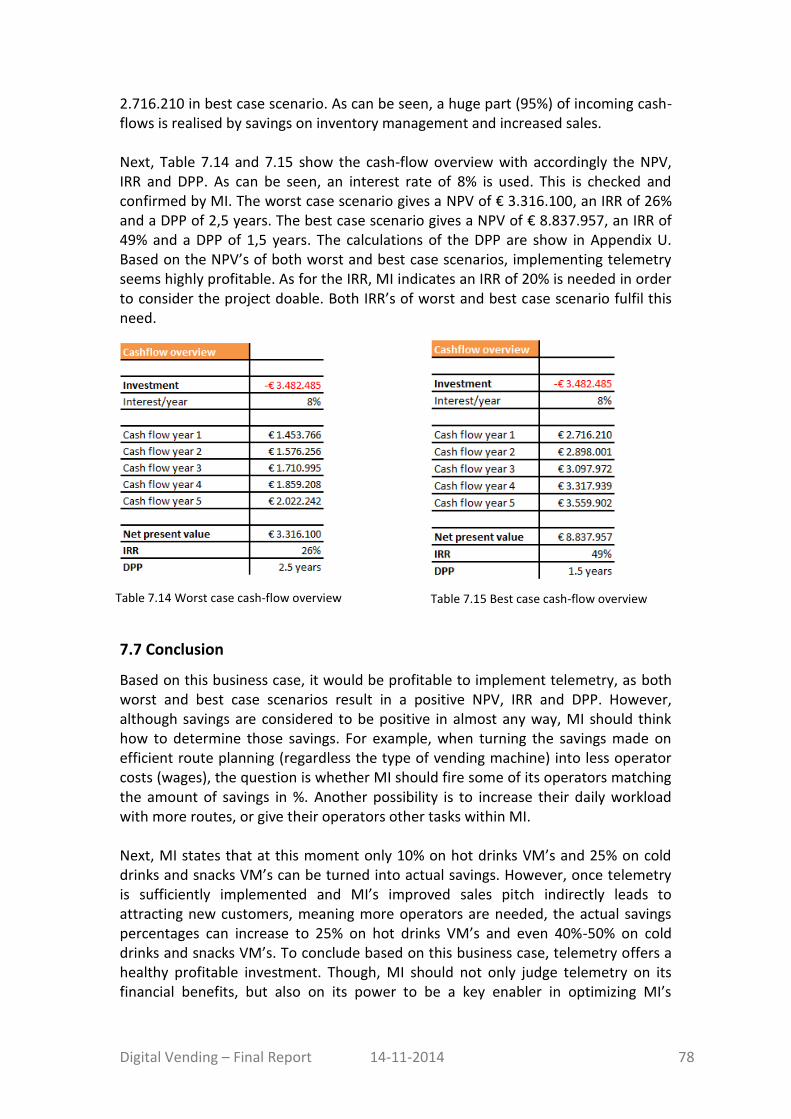
Digital Vending – Final Report 14-11-2014 78
2.716.210 in best case scenario. As can be seen, a huge part (95%) of incoming cash-flows is realised by savings on inventory management and increased sales. Next, Table 7.14 and 7.15 show the cash-flow overview with accordingly the NPV, IRR and DPP. As can be seen, an interest rate of 8% is used. This is checked and confirmed by MI. The worst case scenario gives a NPV of € 3.316.100, an IRR of 26% and a DPP of 2,5 years. The best case scenario gives a NPV of € 8.837.957, an IRR of 49% and a DPP of 1,5 years. The calculations of the DPP are show in Appendix U. Based on the NPV’s of both worst and best case scenarios, implementing telemetry seems highly profitable. As for the IRR, MI indicates an IRR of 20% is needed in order to consider the project doable. Both IRR’s of worst and best case scenario fulfil this need.
7.7 Conclusion
Based on this business case, it would be profitable to implement telemetry, as both worst and best case scenarios result in a positive NPV, IRR and DPP. However, although savings are considered to be positive in almost any way, MI should think how to determine those savings. For example, when turning the savings made on efficient route planning (regardless the type of vending machine) into less operator costs (wages), the question is whether MI should fire some of its operators matching the amount of savings in %. Another possibility is to increase their daily workload with more routes, or give their operators other tasks within MI. Next, MI states that at this moment only 10% on hot drinks VM’s and 25% on cold drinks and snacks VM’s can be turned into actual savings. However, once telemetry is sufficiently implemented and MI’s improved sales pitch indirectly leads to attracting new customers, meaning more operators are needed, the actual savings percentages can increase to 25% on hot drinks VM’s and even 40%-50% on cold drinks and snacks VM’s. To conclude based on this business case, telemetry offers a healthy profitable investment. Though, MI should not only judge telemetry on its financial benefits, but also on its power to be a key enabler in optimizing MI’s
Table 7.15 Best case cash-flow overview Table 7.14 Worst case cash-flow overview

Digital Vending – Final Report 14-11-2014 79
operations and inventory management, and open doors to new business opportunities that can be monetized both on the short- and long-term.

Digital Vending – Final Report 14-11-2014 80
8 Conclusion This chapter gives answer to all sub-research questions in paragraph 8.1 and the main research question in paragraph 8.2. Next, it will reflect this research’ findings on MI’s current situation in paragraph 8.3. All theoretical and practical implications are described in paragraph 8.4 and 8.5. Finally, an overview of all research limitations will be given in paragraph 8.6.
8.1 Conclusion
Based upon the problem statement outlined in paragraph 1.3, a main research question and five sub-research questions were stated. Since all data is gathered and analysed throughout the previous chapters, answers can be given. All research questions are listed below with all corresponding insights and findings. (1) What is the role and importance of telemetry and other digital technologies for
the vending machine industry and other industries?
The vending industry stagnated over the years and slowly adopted new technologies. While for example the retail industry focused more on customer needs and market demands, the vending industry primarily focused on improving back-end efficiencies such as vending management software (VMS), data exchange (DEX), telemetry, pre-kitting, pick-to-light, and dynamic scheduling. However, vending operating companies are now not only looking for ways to make their operations more efficient, but also pay more attention to user experiences and the front side of vending. Vending operating companies in the USA are already shifting towards a more consumer-oriented focus; telemetry is seen as one of the key elements in online vending and open doors to data-driven marketing solutions to interact with the end-consumer. This Thesis gives insights in both area’s; (1) a telemetry solution based on several data requirements and drawn from a customer value proposition, being able to exploit the benefits on the operational side, namely efficient route planning and efficient inventory management. And (2) offering multiple business opportunities aimed at the direction in which the vending industry is moving; interaction with the end-consumer and perform data-driven one-on-one marketing. Other industries that benefit from telemetry and other digital communication technologies are chemistry, healthcare, mobile, utility, IT, retail, sports and logistics. In general, telemetry is used in those industries to create insights and value for both parties, mostly the user as an organization and the customer/consumer. In general, data insights through telemetry generate operational benefits for the user whereas the customer or consumer experiences a better service and a deeper product engagement.

Digital Vending – Final Report 14-11-2014 81
(2) What business opportunities can be expected from telemetry and other digital
technologies and how would these affect Maas’ current business and innovation
model?
Five business opportunities are identified and described in this Thesis. Four of those focus on Business-to-Business (B2B) and one on Business-to-Consumer (B2C). The B2B business opportunities are: (1) the creation of a customer marketing platform, (2) advertising opportunities through vending machine screens, (3) the offering of multiple telemetry packages and (4) the sales of data. The B2C business opportunity withholds: (5) the creation of a mobile consumer App.
Customer marketing platform Once MI’s installed base of vending machines is equipped with telemetry, real-time customer data can be collected and analysed. Through a web-based dashboard, developed internally or acquired externally, MI can segment its customers based on sales analysis, location, type of company etc. By analysing all incoming data, product mixes can be adjusted, vending machine locations can be changed and custom made promotions can be communicated based on a company profile. Within seconds, real-time sales data can be shown of a certain product from a certain vending machine, at a certain company, on a certain company floor. The creation of a customer marketing platform is the first step in interacting with the end-consumer. Advertising Many type of advertising can be shown through vending machine screens. MI realises 500.000 unique clicks per day, and through telemetry, it can remotely adjust advertisements at vending machines at specific companies and matching the advertisements’ customer target group. Besides commercial advertising, narrowcasting can also offer traffic, news and/or weather headlines, social media plug-ins, corporate content and music to provide consumer experiences. This enables a huge commercial value for external parties to show advertising. Two fields of activities can be defined when exploiting this B2B business opportunity: (1) operational activities: solve service errors, upload images/videos, develop a manageable advertising platform maintenance etc., and (2) sales activities: “lease” or sell digital advertising space to companies. The advice would be to outsource both or either one of these activities, as MI should see advertising as an additional way of income, without risking to many costs or concerns. Mobile consumer App The third business opportunity is developing a mobile application (App) aimed at the end-consumer including loyalty programs, product nutrition information, cashless payment methods, option to suggest new products, option to give feedback, personal promotions, personal purchase history and vending machine finder. According to research conducted by Responsys (2014) in the US, out of 1200 surveyed consumers, 70% of all consumers found it very valuable to receive push notifications through their mobile of one of their favourite brands. Between the ages 18-34, this is even 76%. The most important reasons why people download an App of their favourite brand are as follows: 50% wants to have access to special or

Digital Vending – Final Report 14-11-2014 82
exclusive offers, 38% wants to review and manage a loyalty account and 34% wants to receive timely notifications about flash sales and product availability. MI should outsource the development of the App, but maintain ownership. Users fill in all their personal information and their nickname instead of their name to avoid privacy concerns. Next, users give permission to MI to save their information to offer them personal promotions and/or discounts. The App is free to download to make it accessible and attractive. Good examples are the Starbucks App and the Tommy Hilfiger App, both with proven track records on increased conversion. Telemetry packages In every new tender, telemetry is a condition that is mostly wanted by customers. Real-time consumption insights, customer related promotions, consumer loyalty programs and also taking care of service errors from distance to decrease down-time can be of added value to both consumer and customer. The next business opportunity is offering customers the option of different telemetry packages, providing more features per package as the package gets more exclusive and accordingly, more expensive. Customer-focused features could be taking care of service errors by MI and a web-based dashboard giving insights on performance, reliability and consumptions. Consumer-focused features will convince consumers to convince their employer to purchase a telemetry package offering these same features. By creating a free mobile App that can be downloaded by everyone and locking certain features such as loyalty programs or show product nutrition information, which can be “bought” by the customer, attractiveness and exclusivity is created. Other consumer-focused features of the mobile App could be: find the nearest vending machine and cashless payment methods. Three different packages can be made, starting with a basic telemetry package only providing the caretaking of service errors by MI, up to the most expanded package, offering all customer and consumer benefits. On the long-term, the packages can optimize over time, ideally ending up in five or ten different packages, to fulfil the market and customer demands and needs at best. Sales of data The last business opportunity withholds selling the data that is collected by data-driven marketing tools as a mobile App: once data can be collected from individual persons or targeted consumer groups, it can be examined on its “behaviour”; meaning data can be useful for other purposes than what it is primarily collected for. For MI this could mean that the 500.000 unique clicks per day have more significant value other than just giving insights in daily consumption. For example, health institutions would be interested in knowing how much coffee an average person drinks between the age of 15 and 25. Another example for MI could be to analyse what brands are preferred by individual consumers based on their consumption. For a brand like Lays, it could be interesting to know who their most loyal customers are over time. In short, several companies can benefit from the enormous amount of data that is collected once individual consumption can be tracked. This data can be analysed on its “behaviour” and sold to the right companies.

Digital Vending – Final Report 14-11-2014 83
(3) What customer benefits can be expected from these new technologies?
The customer benefits from telemetry cover different kinds of area’s and are therefore divided into technological, operational, sales & marketing and consumer benefits. Hence, the customer is considered to be a client from a vending operating company, whereas the consumer is considered to be the end-consumer. All benefits are found based on interviews with internal and external resources, additional desk research and related literature. Next, all benefits are numbered by a code and will be described briefly in every paragraph. The codes are used throughout the Thesis to quickly name certain benefits when they are used as input for other purposes. Technological benefits One of the technological benefits is the understanding of an organizations’ business environment at a more granular level, being able to improve the vending machine quality (T1) by adjusting to consumer usage patterns as they occur. Button positions or screen displays can be changed accordingly. Also, the detection of component failure or service errors in an early stage prevents the customer of notifying the vending company. This will decrease the amount of downtime per vending machine (T2) and increase customer satisfaction. Next, vending machines will be monitored for reliability and performance (T3) to adjust vending machine locations or replace continuously failing components. Equipping vending machines with general-purpose processors being capable of easily supporting new technologies and features in software, as opposed to hardware-focused fixed-function platforms, increases its future opportunities (T4). New innovations such as voice recognition or digital signage are easier to implement on software focused solutions. Audio possibilities (T5) can increase the customer experience by broadcasting music match the customer segment. The same accounts for video screen opportunities (T6). The addition of video screens to vending machines creates opportunities for the customer to show advertisements, news/weather and traffic headlines or corporate content. Operational benefits The operational benefits withhold all benefits telemetry gives that improve a vending operating company in its operations, specifically route planning and inventory management. One of the benefits is taking care of service errors from distance (OP1), as service errors or component failures are automatically received by the operator. Another benefit is the increase of customer satisfaction (OP2), by making operator route planning more efficient. Efficient route planning can prevent any out-of-stock vending machines and disappointing reactions from employees who are unable to purchase their favourite products. Next, through real-time insights inventory management (OP3) can be executed much more efficient. Efficient inventory management includes decreasing the amount of purchasing and indirectly less storage and depreciation costs.

Digital Vending – Final Report 14-11-2014 84
With telemetry, vending machines can also be updated simultaneously online with software updates (OP4). Software updates can be performed all at once and remotely overnight, instead of one by one only when an operator visits the vending machine. Invoicing can be done accurate and without any deviation, which will also increase trust and customer loyalty as business is done transparent (OP5). For example, weekly sales reports can be sent to the customer, or the customer can view real-time sales data through a web-based dashboard. Finally, product price adjustments (OP6) can be made from distance, opening doors for promotions and discounts. Sales & Marketing benefits The sales & marketing benefits withhold all benefits drawn from a telemetry solution that open doors to new business opportunities and business models and embracing up-sell opportunities. First of all, being able to have real-time insights into all on-going sales activity from a vending machine allows MI to consult with their customers on adjusting the product mix so it meets their employees’ needs (SM1 & SM2). Products that do not meet their sales expectations can be removed, and new products and services can be introduced based on products that meet their sales expectations. Also, sales analysis can be quickly drawn not only per product, but also per customer, region or type of business (SM3). This enables MI to be flexible with regards to unsatisfactory performing vending machines or new market trends, but also add value to MI’s customer service; MI can advise its customers to introduce other or new type of products based on sales analysis (SM4). For example, the creation of custom made products or services could withhold special gift codes or company offerings and promotions, both increasing the customer experience of the customer and MI. Next; the addition of video screens enables opportunities for the customer to show advertisement, news/weather headlines or corporate content (SM5). This high-end technology provides consumer interactivity and a totally new customer experience, enabling MI to position the vending machines as higher quality than others (SM6). This creates a unique buying reason (UBR) for potential customers of MI. Consumer benefits Consumer benefits drawn from telemetry are considered to benefit the end-consumer. Using telemetry to bring a vending machine online can create an entirely new level of consumer experience (C1), as it enables MI to interact with the end-consumer. In more detail, it enables organizations to reach consumers with the right product and the right offer at the right time offering personalized products, promotions or even pricing based on consumer preferences (C2). For example, consumer A receives an offer through his mobile about his favourite cold drink, sent around his favourite buying time of 4 pm. Also, more transparency can be given on product information (C3) and consumer consumption (C4) in order to add value for the consumer. Next, feedback can be acquired through consumers (C5) by offering short questionnaires in exchange for free products. Consumer feedback can be gathered about the user-friendliness of the machines or the quality of the products, increasing the quality of MI’s products over time.
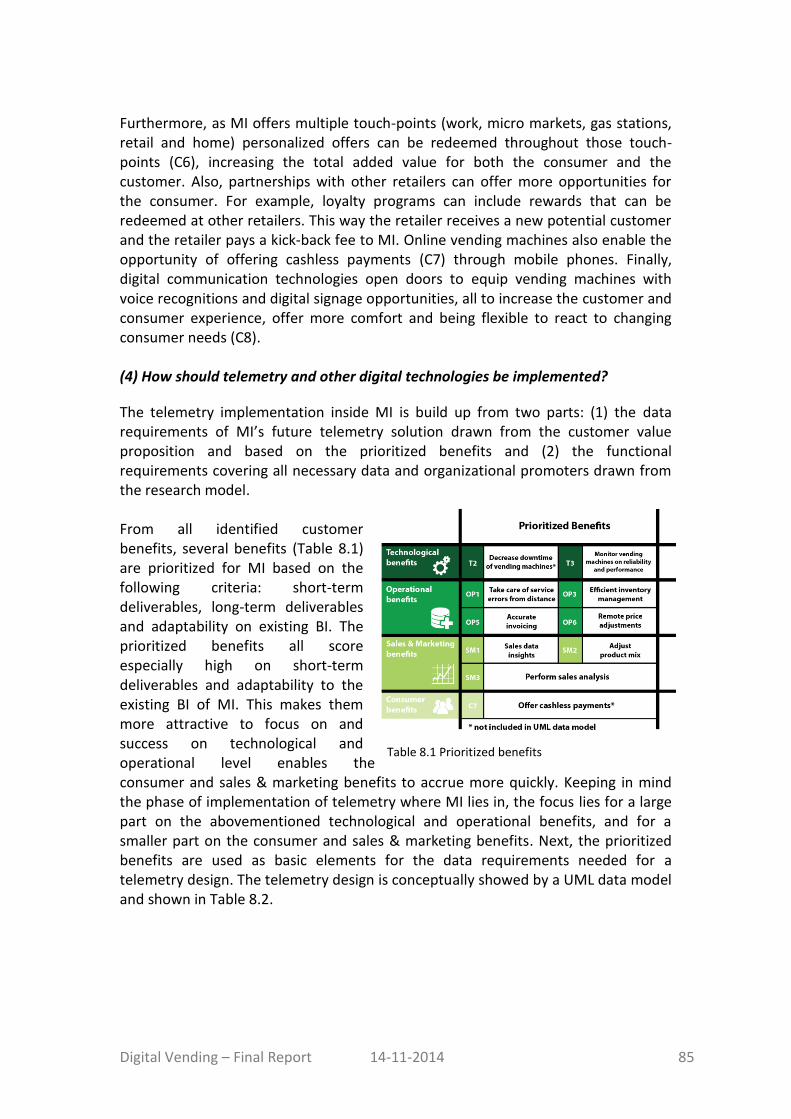
Digital Vending – Final Report 14-11-2014 85
Furthermore, as MI offers multiple touch-points (work, micro markets, gas stations, retail and home) personalized offers can be redeemed throughout those touch-points (C6), increasing the total added value for both the consumer and the customer. Also, partnerships with other retailers can offer more opportunities for the consumer. For example, loyalty programs can include rewards that can be redeemed at other retailers. This way the retailer receives a new potential customer and the retailer pays a kick-back fee to MI. Online vending machines also enable the opportunity of offering cashless payments (C7) through mobile phones. Finally, digital communication technologies open doors to equip vending machines with voice recognitions and digital signage opportunities, all to increase the customer and consumer experience, offer more comfort and being flexible to react to changing consumer needs (C8). (4) How should telemetry and other digital technologies be implemented?
The telemetry implementation inside MI is build up from two parts: (1) the data requirements of MI’s future telemetry solution drawn from the customer value proposition and based on the prioritized benefits and (2) the functional requirements covering all necessary data and organizational promoters drawn from the research model. From all identified customer benefits, several benefits (Table 8.1) are prioritized for MI based on the following criteria: short-term deliverables, long-term deliverables and adaptability on existing BI. The prioritized benefits all score especially high on short-term deliverables and adaptability to the existing BI of MI. This makes them more attractive to focus on and success on technological and operational level enables the consumer and sales & marketing benefits to accrue more quickly. Keeping in mind the phase of implementation of telemetry where MI lies in, the focus lies for a large part on the abovementioned technological and operational benefits, and for a smaller part on the consumer and sales & marketing benefits. Next, the prioritized benefits are used as basic elements for the data requirements needed for a telemetry design. The telemetry design is conceptually showed by a UML data model and shown in Table 8.2.
Table 8.1 Prioritized benefits

Digital Vending – Final Report 14-11-2014 86
Table 8.2 UML data model
The prioritized benefits are used to define all relevant data requirements, object classes, the relationships between those object classes and their corresponding identified constraints. This results in a UML data model visually how all object classes are related regarding a sufficient future telemetry design for MI. When comparing MI’s future telemetry solution with market benchmark DE Connectivity, they generally overlap. Differences exist in DE Connectivity offering the benefits OP4 and C2, whereas MI’s future telemetry solution is not (yet). Based on the findings from several internal and external interviews, the conceptual research model was adjusted to a final research model, shown in figure 8.3, where all data and organizational promoters are present that strengthen projects drawn from the ABI-MI integration. Thus, having these factors present during the implementation of telemetry will increase the likelihood of success. The assumed data promoters are: the presence of an appropriate data infrastructure, the presence of data “scientists” and the definition of functionalities in the early stages of the project. The assumed organizational factors are the presence of top management support, cooperation between IT and marketing departments and the presence of good project management.

Digital Vending – Final Report 14-11-2014 87
(5) How could these benefits and business opportunities translate into a sound
business case for Maas International?
This Thesis chose a cash-flow approach to determine the net present value (NPV), internal rate of return (IRR) and Discounted Payback Period (DPP) of implementing telemetry at MI over a period of 5 years. For a cash-flow statement, the incoming cash-flows, outgoing cash-flows and investment costs need to be determined. In short, the incoming cash-flows consist of savings made on technology, operations, inventory management and an increase on sales. The outgoing cash-flows are yearly costs made by telemetry and include provider connection fees, telemetry software license costs and personnel. The investments costs consist of telemetry hardware, route planning software and implementation costs. Both a worst and best case scenario are calculated to give more detailed information and support on decision-making. As for the incoming cash-flow savings on a technological level; the detection of component failure in an early stage or service errors can prevent the customer from notifying MI. This results in customer support savings at MI for taking care of customer service calls. At an operational level, telemetry can enable financial benefits on making route planning more efficient; and thus decreasing the number of total vending machine visits and the time spend per visit. Next, telemetry enables MI to manage inventory management more efficient; meaning it will decrease the amount of purchasing and indirectly the storage costs. The profit impact of increased
Figure 8.3 Final research model

Digital Vending – Final Report 14-11-2014 88
sales are only indirectly measurable and include inter alia: product price adjustments, improvement of sales pitch, adjusting the product mix based on sales analysis, the offering of loyalty programs and promotions and the execution of several business opportunities identified in this Thesis. Based on both financial statements and criteria, all checked and confirmed by MI, a worst and best case scenario is calculated and shown in Table 8.4 and 8.5.
The worst case scenario gives a NPV of € 3.316.100, an IRR of 26% and a DPP of 2,5 years. The best case scenario gives a NPV of € 8.837.957, an IRR of 49% and a DPP of 1,5 years. Based on the NPV’s of both worst and best case scenarios, implementing telemetry seems highly profitable. As for the IRR, MI indicates an IRR of 20% is needed in order to consider the project doable. Both IRR’s of worst and best case scenario fulfil this need. Based on this business case, it would be profitable to implement telemetry, as both worst and best case scenarios will results in a positive NPV, IRR and DPP. However, although savings are considered to be positive in almost any way, MI should think how to determine those savings. For example, when turning the savings made on efficient route planning (regardless the type of vending machine) into less operator costs (wages), the question is whether MI should fire some of its operators matching the amount of savings in %. Another possibility is to increase their daily workload with more routes, or give their operators other tasks within MI. Though, MI should not only judge telemetry on its financial benefits, but also on its power to be a key enabler in optimizing MI’s operations and inventory management, and open doors to new business opportunities that can be monetized both on the short- and long-term.
Table 8.5 Best case cash-flow overview Table 8.4 Worst case cash-flow overview
Digital Vending – Final Report 14-11-2014 89
8.2 Main research question
Now all answers to all sub-research questions are outlined above, a final answer can be given on the main research question below. Also, a brief reflection will be given on how this answer can be reflected on the current situation at MI.
“How should telemetry and other digital communication technologies be implemented and what business opportunities could be captured and implemented
through the adoption of those for Maas Internationals vending machines and service concepts?”
As described in paragraph 8.1, sub-research question 4 outlines in what way telemetry should be implemented inside MI based on the benefits that are chosen to have the highest priority. The focus lies on technological and operational level, whereas most of the sales & marketing and consumer benefits can be realized as soon as telemetry is properly implemented. Important is to realize that the implementation of telemetry consists of two parts, namely the data requirements and functional requirements. The business opportunities that can be captured through telemetry are outlined in sub-research question 2 and include: the creation of a customer marketing platform, advertising opportunities through vending machine screens, the creation of a mobile consumer App, the offering of multiple telemetry packages and the sales of data. Important is to note that these business opportunities (sales, marketing and consumer focused) can be fully exploited once telemetry is successfully implemented on a technological and operational level.
8.3 Reflection
When reflecting these findings to MI’s current situation, it is important to notice that MI should make sure that all necessary data and organizational promoters drawn from the final research model are present during the implementation of telemetry. As for the data promoters, an appropriate data infrastructure and a specific definition of functionalities (partly by the outcomes of this research) are present. However, there is no internal resource that can be qualified as a data “scientist”; being able to interact with collected data and include more creative IT skills than a traditional data analyst. As the literature showed in chapter 2, this is one of the main implementation barriers companies’ face when trying to translate data into business improvement. As for the organizational promoters, top management support for the telemetry project is present inside MI since resources are made available and telemetry is included as an integral part of the overall company’s strategy on the long-term. Next, the presence of good project management has recently started to take form, partly by the outcomes of this research, including the disciplines marketing, sales, operations, logistics, IT, R&D and manufacturing (wholly owned subsidiary Spengler GmbH). As of October 28th, the telemetry project kicked off, having sufficient resources available and guided by a strict project planning. The cooperation between

Digital Vending – Final Report 14-11-2014 90
IT & marketing as the last organizational promoter is still in progress, as a marketing department is set up since October 1st, including a trade marketer, product marketer and marketing director. The cooperation between IT and marketing should also be closely guided by the presence of one or more data “scientists”. To conclude, MI has two out of three data and organizational promoters present now, meaning a proper first step is made. To successfully implement telemetry the presence of data “scientists” and the cooperation between IT and marketing is of vital importance. When reflecting the telemetry design to the existing situation at MI, there should be noted that it is important to start with implementing only the prioritized benefits, and add more functionality once the telemetry design actually works. Seen the influence telemetry can have on MI’s daily activities, it is important to minimalize the risk and start with a limited number of customers and gain experience with the implementation process. If successfully implemented, MI can expand to more customers.
8.3.1 Possible obstacles
To end this paragraph, two issues can be identified as possible obstacles of implementing telemetry inside MI, besides the missing of two promoters and thus the presence of two barriers, mentioned in the research model. First of all, a qualified IT vendor should be selected, being able to provide the necessary telemetry technology and has a clear vision on how to interact with the end-consumer. MI should avoid selecting one IT vendor for a telemetry solution, one IT vendor for making a mobile consumer App, and another IT vendor for governing all incoming data. Therefore, an advice would be to select an IT vendor that can offer the necessary market proven technology, suitable consumer-focused cross channel marketing tools, and sufficient data governance. Second, MI should realize that being 100% “online” is one of the vision statements they pronounced recently. Meaning, all employees should carry the same vision and should be able to look forward. Here lies a huge challenge for MI, as it carried a more technocratic focus the last decades and employed people with a technocratic focus, whereas the world is telling us, proven by market analyses shown in chapter 2, that the vending industry is shifting towards a more online consumer-oriented focus. Hence, the internal capabilities should consist of a healthy combination of both analytical business intelligence and interactive marketing.
8.4 Theoretical implications
Several theoretical implications can be taken into account when examining this research. First of all, this research contributes to literature in a way that it provides a research model integrating analytical business intelligence and interactive marketing. As the integration of both analytical BI and interactive marketing has not

Digital Vending – Final Report 14-11-2014 91
been studied at best, this research contributes more specifically in trying to gain more insights in what factors influence this integration. Second, this research contributes to literature by examining not only technological or data influencers, but also organizational influencers. As La Valle et al. (2011) outlined, the adoption barriers organizations face most for data-driven marketing solutions are managerial and cultural rather than related to data and technology. This research tried to find organizational factors on a managerial and cultural level that can counteract these adoption barriers and can strengthen the integration between analytical BI and interactive marketing. Third, this research contributes to literature as it is the first research performed about the implementation of telemetry in the vending industry. Kumar (2008, 2010ab, 2013) performed research on telemetry in the vending industry, but primarily focused on influential consumer metrics and did not examined the implementation process of telemetry inside an organization. Other prior research regarding telemetry was performed primarily in the chemistry, utility and healthcare industry.
8.4.1 Further research
Next, two suggestions on performing further research based on this research are given. First of all, this research is performed internally at a vending operating company and externally at companies which core business lies on the interface of analytical BI and marketing. It would be interesting to conduct further research at companies acquiring the same business model, but in a different sector which has not been studied yet. An example could be the copier industry. Second, this research outlines business opportunities to engage the consumer in a new vending experience. As vending machines are psychical objects and the vending consumer experience is based on view, taste, scent and feel. Further research could be done to neurological and physiological metrics influencing the consumer during a vending experience. This is also outlined by Kumar et al. (2013); stating neurological research can identify modulation in the levels of neural activity in response to changes in stimuli, which may then predict attitudinal or behavioral change.
8.5 Practical implications
Several practical implications can be defined based upon this research. As this Thesis is considered as a design-focused business problem-solving project, it is closely linked to the current practical situation at MI. The most important practical implications are outlined below. First of all, the business case outlined in chapter 7 assumes that 100% of the installed base of vending machines (hot drinks, cold drinks and snacks VM’s) can be equipped with telemetry. It still has to be examined if all vending machines are suitable for equipping telemetry, as technology can be out-dated, or it would be too
Digital Vending – Final Report 14-11-2014 92
expensive to replace certain parts. Newly introduced vending machines will certainly be equipped with telemetry. Second, a major concern for all vending operators in The Netherlands including MI is the uncertainty regarding the introduction of NFC chips in mobile phones and debit cards. NFC stands for Near Field Communications and is a contactless, short-range, low power link evolved from radio-frequency identification (RFID) tech that can transfer small amounts of data between two devices held a few centimetres from each other. In short, a NFC chip inside your mobile phone or debit card enables the possibility of cashless payments. However, only the newest and most expensive mobile phones include a NFC chip, for example Apple’s Iphone 6 (Apple, 2014). As for debit cards, Dutch banks are slow with adopting the NFC chip in their debit cards, and withhold a passive attitude towards the issue, indicating it could take one or two years before a vast part of all consumers in The Netherlands carry the NFC option in their debit card. This could slow down the usage of cashless payment methods offered by MI’s mobile consumer App. Third, cashless mobile payments have high transaction costs. PayPal charges 1,5% transactions costs over the total amount of purchase plus € 0,35 per transaction. This could have a significant effect on the product margins. Especially the € 0,35 transaction fee is relatively high compared to the product margins MI’s deals with. Fourth, once telemetry makes route planning more efficient, especially on cold and snacks vending machines, operators’ routes could be partly changed. Nowadays, many operators take care of the same routes sometimes for years, but dynamic route planning will most likely change existing routes to make them more efficient. An operator knowing how to enter the building and being socially attached to his customers, also carries significant value. This should be taken into account when operator routes are being optimized. Fifth, from the installed base of vending machine types hot drinks, cold drinks and snacks, 85% are hot drinks vending machines. When implementing telemetry, MI should take into account that hot drinks VM’s need to be visited anyway due to cleaning reasons and more financial benefits can be gained at the cold drinks and snacks vending machines. Next, sufficient financial benefits on operator visits can only be realized if the percentage of monetized savings increases in the future. Sixth, once operational and personal consumer data will be collected and stored, the governance of this data is very important. MI should pay close attention to all laws regarding the collection and storage of personal information, and should make clear to the consumer what data is collected and where it is used for. The same accounts for the operational side of governing the collected data. MI shifts to a more data-driven organisation when implementing telemetry. Route planning and inventory management gets more efficient on the long-term, as more historic data gets available. Losing important historic data could have huge impacts on route planning and inventory management.

Digital Vending – Final Report 14-11-2014 93
Seventh, MI should not judge telemetry only on its financial benefits, but also on its power to be a key enabler in optimizing MI’s operations and inventory management, and open doors to new business opportunities that can be monetized both on the short- and long-term. Finally, implementing telemetry within MI will affect a lot of disciplines inside MI, namely operations, sales, marketing, R&D, procurement, logistics and IT. As described in the problem analysis, MI working culture is characterized as one where routine greatly influences decision-making. A data-driven technology like telemetry will enable more data-driven decision-making, requiring a different mind-set from MI’s employees.
8.6 Limitations
Like every research, there are limitations to be mentioned. This paragraph outlines all limitations regarding the research that has been done. First, the collection and analysis of data was performed by only one researcher. This means the researcher was aware of the connotations allowing him to interpret the data more accurately. The collection and analysis of the data should be done by two researchers, to avoid biased phenomena. One person could construct the interviews, the other person could analyse the data. Furthermore, the interviews could also be taken by two different persons. Second, the research consist of only two external case studies with one according in-depth interview and one internal case study with multiple in-depth interviews. To increase the reliability of the research, more external case studies could be done, preferably in different industries as the copier, utility or health industry. Also, reliability could be increased by conducting multiple in-depth interviews at both external case studies instead of one. Third, the internal case study and both external case studies are performed at companies based in The Netherlands. There could be cultural differences in the way people think about organizational and managerial factors influencing the ABI-MI integration. The same accounts for geographical differences. Fourth, the final research model is based on the collection and analysis of qualitative data, leaving room for interpretation and providing no statistical support. The research outcomes, found in the final research model, are all assumed to strengthen the ABI-MI integration. The research would have benefitted from combining the case study approach with a questionnaire, in order to provide sufficient statistical significance.
Digital Vending – Final Report 14-11-2014 94
9 Bibliography Abos (2014). Connect.Me; meten = weten! Retrieved on 01-09-2014. Acker, O., Grone, F., Blockus, A. and Bange, C. (2011). Inmemory analytics –
Strategies for real-time CRM. Journal of Database Marketing & Customer Strategy Management 18(2): 129–136.
Air Vend (2014). Live Telemetry Solution. Retrieved from www.air-vend.com/home
on 14-08-2014. Aken, J. v., Berends, H., & Bij, H. v. (2007). Problem Solving in Organizations. New
York: Cambridge University Press. Alliance Data (2013). News Release, Alliance Data to scale up to Europe. Retrieved from www.phx.corporate-ir.net/phoenix on 23-09-2014. Anderson, J. C., Narus, J. A., & Wouter, v. R. (2006). Customer value propositions in
business markets. Harvard Business Review, 84, 90-99. Angelov, S., Eshuis, R., Kusters, R. (2009). Reader Information Modelling. Retrieved on 28-08-2014. Apple (2014). Iphone 6. Retrieved from www.apple.com/nl/iphone-6/ on 08-10-2014. Arlow, J., & Neustadt I. (2004). Enterprise patterns and MDA: Building better
software with archetype patterns and UML. Boston: Addison-Wesley. Automatic Merchandiser (2013). Special Annual Report: State of the Vending
Industry. Retrieved on 04-08-2014. Bahrami, A. (1999). Object Oriented Systems Development: Using the Unified
Modeling Language. New York: Irwin McGraw-Hill. Batra, R. (1995). The new direct marketing: How to implement a profit-driven DBM
strategy. Burr Ridge, IL: Irwin. Booch, G. (2000). Unifying enterprise development teams with the UML. Journal of
Database Management, 11(4), 37-39. Booz & Company (2012). Real-time analytics industries. Retrieved 29-05-2014. BrandLoyalty (2014). Our Offer. Retrieved from www.brandloyalty-int.com/en-GB/home/ on 04-09-2014.

Digital Vending – Final Report 14-11-2014 95
Chen, M., Mao, S., & Liu, Y. (2014). Big data: A survey. Mobile Networks and Applications, 19(2), 171-209.
Chui, M., Löffler, M., & Roberts, R. (2010). The internet of things. McKinsey
Quarterly, 2, 1-9. Clark, M. (2012). Single View of the Customer in UK Businesses and the Emerging
Role of Big Data. The SAS Institute, Marlow. Retrieved 01-07-2014. Cockburn, A. (2001). Writing effective use cases. Boston, MA, USA: Addison-Wesley
Longman Publishing Co., Inc. ISBN 0-201-70225-8. Cooper, R. G., Edgett, S. J. & Kleinschmidt, E. J. (2001). Portfolio management for
new product development: results of an industry practices study. R&D Management, 31(4), 361–380.
Cooper, D. R. & Schindler, P. S. (2003). Business research methods. New York, NY:
McGraw-Hill. Dadashzadeh, M. (2013). Big data and the hobson's choice for IT
management. International Journal of Management & Information Systems (Online), 17(4), 235.
Damirchi, G. V., & Shafai, J. (2011). A framework to innovation in marketing
management by utilizing business intelligence. Interdisciplinary Journal of Contemporary Research in Business, 3(2), 1643-1653.
Davenport, T. H., Barth, P., & Bean, R. (2012). How big data is different. MIT Sloan
Management Review, 54(1), 43-46. De Backer, Y., & Van, d. L. (2005). Key account management: Creating added value in
european hospitals. Journal of Medical Marketing, 5(3), 219-229. Dobing, B., & Parsons, J. (2000). Understanding the role of use cases in UML: A
review and research agenda. Journal of Database Management, 11(4), 28-36. Douwe Egberts (2014). DE Connectivity. Retrieved from
www.douweegbertsprofessional.com/nl-NL/nederland/nieuws-events/nieuws/2014/lancering-nieuw-service-concept/ on 29-08-2014.
Ericsson (2011). More than 50 billion connected devices. White Paper. Retrieved on
22-05-2014. European Vending Association (EVA) (2014). About the European Vending
Association. Brussels. Retrieved 02-07-2014.
Digital Vending – Final Report 14-11-2014 96
First Research (2014). Industry Profile; Vending Machine Operators Q1 2014. Retrieved on 12-05-2014.
Forbes (2013). Why is the Starbucks mobile payments App so successful? Retrieved from www.forbes.com/sites/quora/2014/06/13/why-is-the-starbucks-mobile-payments-app-so-successful/ on 11-10-2014. Formula One World Championship Limited (2014). Formula 1 Live Timing. Retrieved
from www.formula1.com/live_timing/ on 14-08-2014. Frynas, J.G., Mellahi, K., Pigman, G.A. (2006). First mover advantages in international
business and firm-specific political resources. Journal of Strategic Management. 27(40):321,345.
Gantz, J., Reinsel, D. (2011). Extracting value from chaos. IDC iView, pp 1–12.
Retrieved 29-05-2014. Gartner Research (2010). Trends that business intelligence leaders can not afford to
ignore. Retrieved 23-06-2014. Golfarelli, M., & Rizzi, S. (2009). A survey on temporal data warehousing.
International Journal of Data Warehousing and Mining,5(1), 1-17. Guarda, T., Santos, M. F., Pinto, F., Silva, C., & Lourenço, J. (2012). A conceptual
framework for marketing intelligence. International Journal of e-Education, e-Business, e-Management and e-Learning, 2(6), 455.
Guion, L., Diehl, D., McDonald, D. (2001). Conducting an in-depth interview; University of Florida. Retrieved from www.edis.ifas.ufl.edu/fy393 on 16-06-2014. Gronroos, C. (2000). Service Management and Marketing: A customer Relationship
Management approach, John Wiley & Sons Ltd., Chichester. Hardgrave, B. C. (1999). Adopting object-oriented development: One company's experience. Proceedings of the Sixth Americas Conference on Information
Systems. Milwaukee, WI, August 13-15, 568-570. Hedgcock, R. (1998). Automating the marketing environment and transforming data
into insight: the data warehouse and the database marketing, Direct Marketing, pp. 56-58.
HEMA (2014). Hema taart online bestellen. Retrieved from www.hema.nl/winkel/eten-en-drinken/gebak/taarten on 12-10-2014. Hongcharu, B., PhD. (2011). Instantaneous marketing: An analysis of processes to
make A connection with customers through new communications

Digital Vending – Final Report 14-11-2014 97
technologies. International Journal of Management and Information Systems, 15(4), 113-121.
Hult, G. T., Hurley, R. F., & Knight, G. A. (2004). Innovativeness: its antecedents and
impact on business performance. Industrial Marketing Management, 33, 429–438.
Hultén, B. (2011). Sensory marketing: The multi-sensory brand-experience
concept. European Business Review, 23(3), 256-273. Inmon, W.H. (1992). Building the Data Warehouse. John Wiley, 1992. Inmon, W.H. (2013). Big Data Implementation vs. Data Warehousing. Retrieved from
http://www.b-eye-network.com/view/17017 on 13-07-2014. IBM (2014). UML basics: The class diagram. Retrieved from www.ibm.com/developerworks/rational/library/content/RationalEdge/sep04/bell/ on 14-10-2014. Intel (2011). Intel helps IT manage software defined infrastructure, ensure reliability.
Retrieved 22-06-2014. King, N. (1994). The qualitative research interview, in C. Cassell and G. Symon (eds.)
Qualitative methods in Organizational Research. London: Sage, pp 14-36. Kumar, V. (2008). Managing Customers for Profit: Strategies to Increase Profits and
Build Loyalty, Wharton School Publishing, Upper Saddle River, NJ. Kumar, V., Petersen, J.A. and Leone, R.P. (2010a). “Driving profitability by
encouraging customer referrals: who, when, and how”, Journal of Marketing, Vol. 74 No. 5, pp. 1-17.
Kumar, V., Aksoy, L., Donkers, B., Venkatesan, R., Wiesel, T. and Tillmanns, S.
(2010b). Undervalued or overvalued customers: capturing total customer engagement value, Journal of Service Research, Vol. 13 No. 3, pp. 297-310.
Kumar, V., Chattaraman, V., Neghina, C., Skiera, B., Aksoy, L., Buoye, A., & Henseler,
J. (2013). Data-driven services marketing in a connected world. Journal of Service Management, 24(3), 330-352.
Kursan, I., & Mihic, M. (2010). Business Intelligence: The role of the internet in
marketing research and business decision-making. Management: Journal of Contemporary Management Issues, 15(1), 69-86.
Kvale, S. (1996). InterViews: an Introduction to Qualitative Research Interviewing.
Londeon: Sage
Digital Vending – Final Report 14-11-2014 98
Lange, C., Chaudron, M., & Muskens, J. (2006). In practice: UML software architecture and design description. IEEE Software,23(2), 40-46.
Lariviere, B., Joosten, H., Malthouse, E., Van Birgelen, M., Aksoy, P., Kunz, W. H., &
Huang, M. (2013). Value fusion: The blending of consumer and firm value in the distinct context of mobile technologies and social media. Rochester: Social Science Research Network. Retrieved on 22-05-2014.
LaValle, S., Lesser, E., Shockley, R., Hopkins, M. S., & Kruschwitz, N. (2011). Big data,
analytics and the path from insights to value. MIT Sloan Management Review, 52(2), 21-32.
Li, Y., Hou, M., Liu, H., & Liu, Y. (2012). Towards a theoretical framework of strategic
decision, supporting capability and information sharing under the context of internet of things. Information Technology and Management, 13(4), 205-216.
Maas International (MI) (2014). Telemetry opportunities. Retrieved 24-05-2014. MacTelemetry (2014). Foot Traffic Analytics, MAC Telemetry. Retrieved from
http://www.mactelemetry.com/ on 08-08-2014. Mackenna, R. (2002), Acesso Total: O novo Conceito de Marketing de Atendimento,
Rio de Janeiro: Campus, 2002. Manyika, J, Chui, M., Brown, B., Bughin, J., Dobbs, R., Roxburgh, C., Byers, AH. (2011)
Big data: the next frontier for innovation, competition, and productivity. McKinsey Global Institute. Retrieved 12-07-2014.
McKinsey Global Institute (2011). Disruptive technologies. McKinsey & Company.
Retrieved 13-06-2014. MEI (2012). Road to Technology: Lessons Learned Along the Way. MEI EASITRAX.
Retrieved 12-06-2014. Mowbray, T. J. (1999). Software architecture in practice. IBM Systems Journal, 38(1),
122-123. Musso, F. (2010). Innovation in marketing channels. Symphonya, (1), 23-41. MyOrder (2014). Mobiel bestellen & betalen. Retrieved from www.myorder.nl on
08-09-2014. Oxford Dictionaries (2014). Benchmark, definition. Retrieved from
www.oxforddictionaries.com/definition/english/benchmark on 08-09-2014.

Digital Vending – Final Report 14-11-2014 99
Ozok, A. A., & Wei, J. (2010). An empirical comparison of consumer usability preferences in online shopping using stationary and mobile devices: Results from a college student population. Electronic Commerce Research, 10(2), 111-137.
Patel, K. (2012), “AmEx tests new ways to transact in social media”, Ad Age,
Retrieved 11-04-2014. Peppers, D., M. Rogers. (1993). The One to One Future. Doubleday, New York.
Retrieved 03-07-2014. Peterson, M., Koch, V., Grone, F. and Vo, K. (2010). Online customers, digital
marketing – The CMO-CIO connection. Journal of Direct, Data and Digital Marketing Practice. 11(3): 219-221.
Pfohl, H.C., Buse, H.P. (2000). Inter organizational logistics systems in flexible
production networks: an organizational capabilities perspective. International Journal of Physical Distribution & Logistics Management. 30(5):388408.
PR Newswire (2000). A new way to pay: E-commerce deal between olameter and
mondex international creates new payment scheme for electric utilities. (2000, Dec 20). Retrieved on 23-07-2014.
Purcell, B. (2013). The emergence of "big data" technology and analytics. Journal of
Technology Research, 4, 1-7. O’Regan, M., Ashok, K., Maksimova, O. and Reshetin, O. (2011). Optimizing market
segmentation for a global mobile phone provider for both targeting and insight. Journal of Advertising Research 51(4): 571–577.
Responsys (2014). Give mobile engagement a push. Retrieved from www.responsys.com on 23-07-2014. Rogers, D. and Sexton, D. (2012). Marketing ROI in the Era of Big Data. Retrieved 02-
06-2014. Rui, H., Yip, G.S. (2008). Foreign acquisitions by Chinese firms: a strategic intent
perspective. Journal of World Energy Law & Business. 43(2):213–226. Saarijärvi, H., Karjaluoto, H., & Kuusela, H. (2013). Customer relationship
management: The evolving role of customer data.Marketing Intelligence & Planning, 31(6), 584-600.
Santucci, G. (2010). The Internet of Things: Between the Revolution of the Internet
and the Metamorphosis of Objects. Forum American Bar Association. Retrieved 01-07-2014.

Digital Vending – Final Report 14-11-2014 100
Selic, B. (2006). UML 2: A model-driven development tool. IBM Systems Journal, 45(3), 607-620.
Simpson, R. L. (1999). Let's talk telemetry. Nursing Management, 30(2), 14-5. Skarzauskiene, A., & Kalinauskas, M. (2012). The future potential of internet of
things. Socialines Technologijos, 2(1). Stone, M. D., & Woodcock, N. D. (2014). Interactive, direct and digital
marketing. Journal of Research in Interactive Marketing,8(1), 4-17. Strategy Analytics (2014). What is consumer telemetry?. Retrieved from
http://www.strategyanalytics.com/default.aspx?mod=ConsumerTelemetry&m=7 on 10-05-2014.
Sweebr (2014). Uw kassa vanaf nu online. Retrieved from www.sweebr.com/nl/ on 02-09-2014. Symantec (2012). Putting the Customer First Leads to Significant Improvements in
SEP Product. Retrieved from www.symantec.com/connect/blogs/putting-customer-first-leads-significant-improvements-sep-product on 05-05-2014.
Techradar (2013). What is NFC and why is it in your phone. Retrieved from www.techradar.com/news/phone-and-communications/what-is-nfc-and-why-is-it-in-your-phone-948410 on 14-10-2014. The Valley (2014). Wie zijn wij? Retrieved from www.thevalley.nl/wie-zijn-wij on 10- 09-2014. Tommy Hilfiger Europe (2014). Hilfiger Stores BV. Retrieved from www.nl.tommy.com/jurisdisch/CS_IMPRINT,nl_NL,pg.html on 08-10-2014. Touchrate (2014). Marketing solutions to increase customer engagement. Retrieved
14-07-2014. Unicum (2014). Online Telemetry. Retrieved from www.unicum.ru/en/uonline/know
on 28-08-2014. Ushakov, I. B. (1998). Experience based approach to technology adoption: Key success factors. OOPSLA'98 Mid-year Workshop on Applied Object Technology.
Denver, CO. July 19-21. Vagabond (2013). Vagabond Introduces WiFi Telemetry Hardware Insights Series.
Retrieved from www.vendingmarketwatch.com on 22-05-2014. Van Doorn, J., Verhoef, P. and Bijmolt, T. (2007), “The importance of non-linear
relationships between attitude and behaviour in policy research”, Journal of

Digital Vending – Final Report 14-11-2014 101
Consumer Policy, Vol. 30 No. 2, pp. 75-90. Vavra, T. G. (1993). Marketing de relacionamento (aftermarketing), SP: Editora Atlas. Vendon (2014). Complete Telemetry Solution. Retrieved from
www.vendon.net/products#software on 01-09-2014. Verhoef, P.C., Venkatesan, R., McAlister, L., Malthouse, E.C., Krafft, M. and Ganesan,
S. (2010). CRM in data-rich multichannel retailing environments: A review and future research directions. Journal of Interactive Marketing. 24(2): 121–137.
Vermesan, O., Friess, P. (2011). Internet of Things: Global Technological and Societal
Trends, River Publisher, Aalborg, pp. 9–52. Verschuren, P., & Doorewaard, H. (2010). Designing a Research Project (2nd ed.).
The Hague: Eleven International Publishing. Wang, H., Wang, S. (2008): A knowledge management approach to data mining
process for business intelligence, Industrial Management & Data Systems, Vol.108, No. 5, pp. 622-634.
Ward, P.T., Duray, R. (2000). Manufacturing strategy in context: environment,
competitive strategy and manufacturing strategy. Journal of Operations Management 18(2):123–138.
Webber, R. (2013). “The evolution of direct, data and digital marketing”, Journal of
Direct, Data and Digital Marketing Practice, Vol. 14 No. 44, pp. 291-309. Xu, X. (2012). Internet of Things in Service Innovation. Amfiteatru Economic, 14, 698-
719. Retrieved on 12-06-2014. Yan, T., Wen, Q. (2011). Building the Internet of Things using a mobile RFID security
protocol based on information technology. Journal of Advanced Computational Science Intelligence and System Environments, 104:143:149.
Yang, S. C. (2012). Mobile applications and 4G wireless networks: A framework for
analysis. Campus - Wide Information Systems, 29(5), 344-357.
Yen, B., Farhoomand, A., & Ng, P. (2004). Constructing an e-supply chain at Eastman chemical company. Journal of Information Technology, 19(2), 93-107.

Digital Vending – Final Report 14-11-2014 102
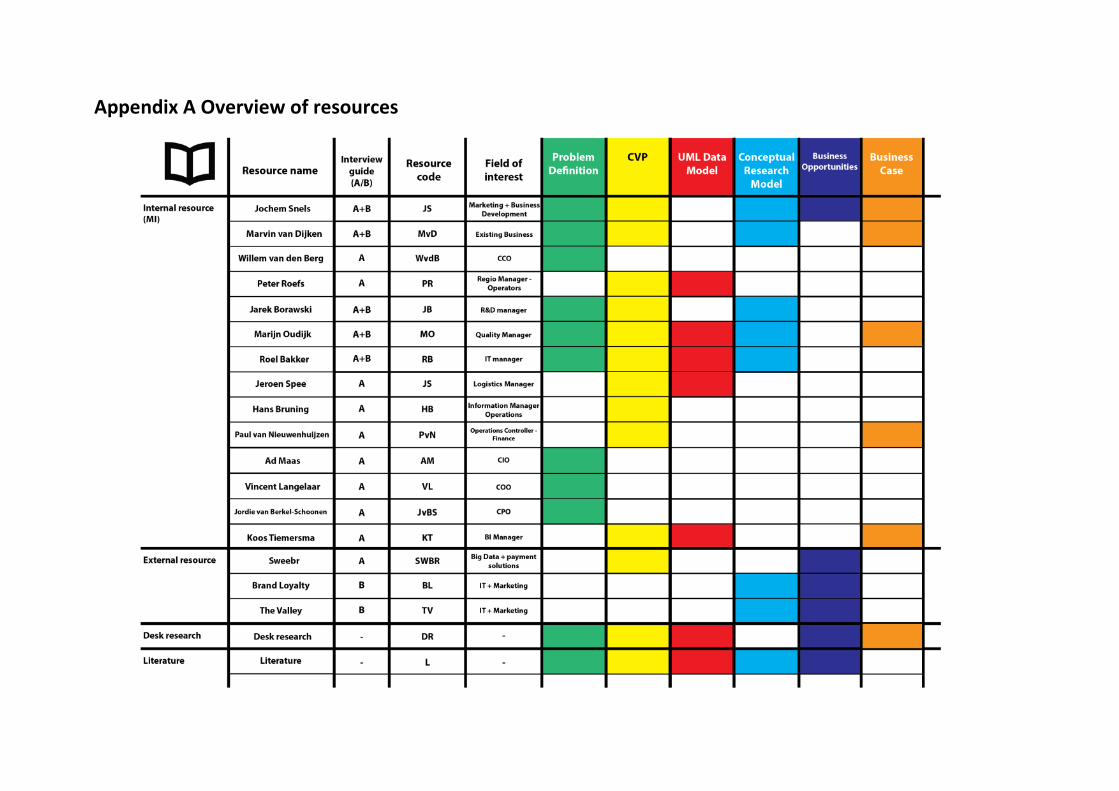
Appendix A Overview of resources
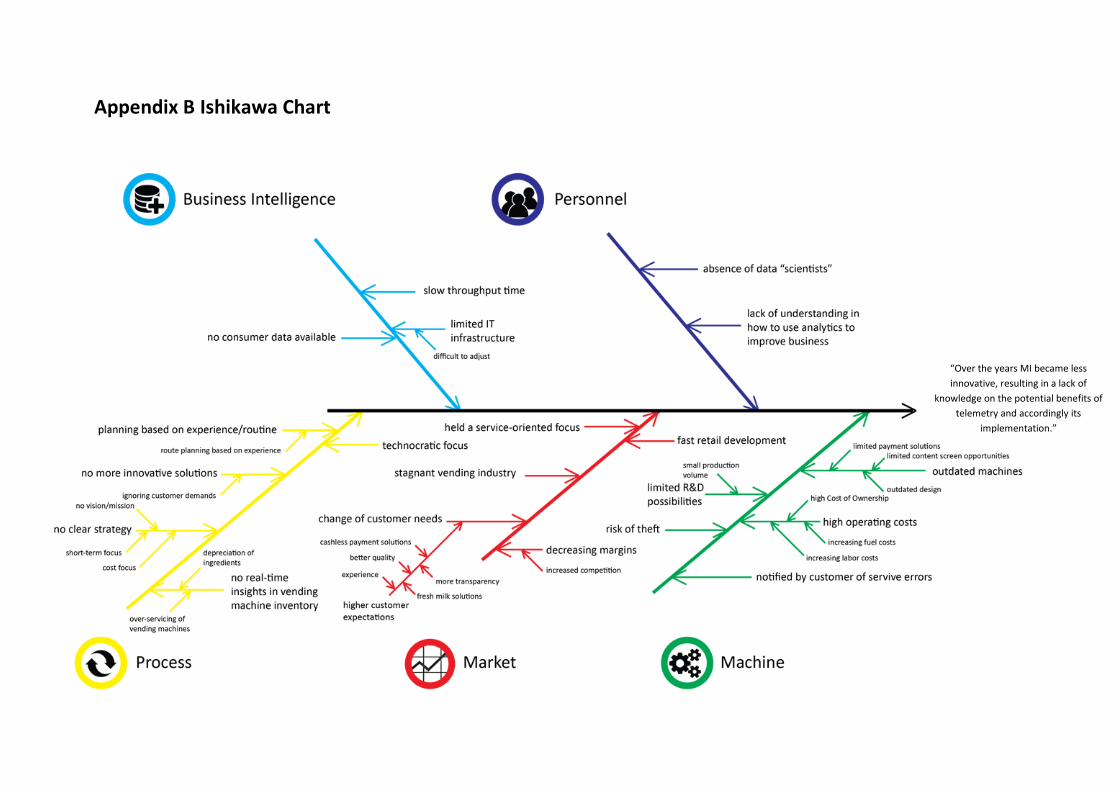
Appendix B Ishikawa Chart
“Over the years MI became less
innovative, resulting in a lack of
knowledge on the potential benefits of
telemetry and accordingly its
implementation.”
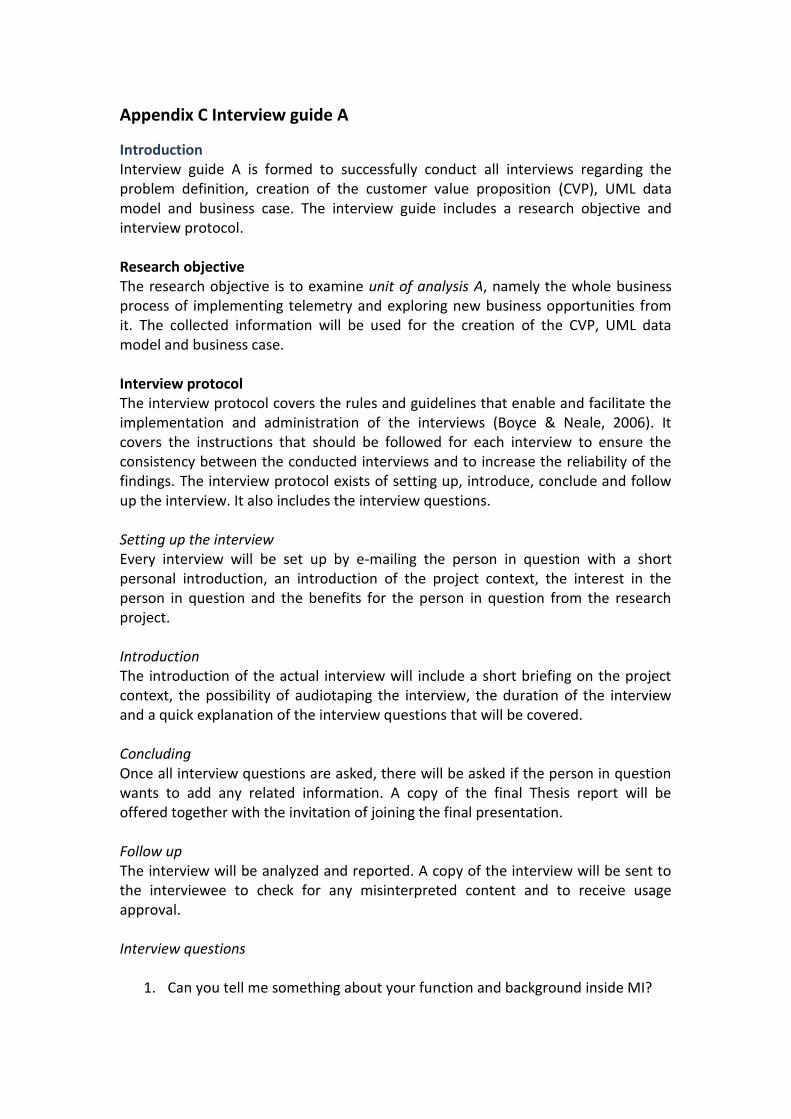
Appendix C Interview guide A
Introduction Interview guide A is formed to successfully conduct all interviews regarding the problem definition, creation of the customer value proposition (CVP), UML data model and business case. The interview guide includes a research objective and interview protocol. Research objective The research objective is to examine unit of analysis A, namely the whole business process of implementing telemetry and exploring new business opportunities from it. The collected information will be used for the creation of the CVP, UML data model and business case. Interview protocol The interview protocol covers the rules and guidelines that enable and facilitate the implementation and administration of the interviews (Boyce & Neale, 2006). It covers the instructions that should be followed for each interview to ensure the consistency between the conducted interviews and to increase the reliability of the findings. The interview protocol exists of setting up, introduce, conclude and follow up the interview. It also includes the interview questions. Setting up the interview Every interview will be set up by e-mailing the person in question with a short personal introduction, an introduction of the project context, the interest in the person in question and the benefits for the person in question from the research project. Introduction The introduction of the actual interview will include a short briefing on the project context, the possibility of audiotaping the interview, the duration of the interview and a quick explanation of the interview questions that will be covered. Concluding Once all interview questions are asked, there will be asked if the person in question wants to add any related information. A copy of the final Thesis report will be offered together with the invitation of joining the final presentation. Follow up The interview will be analyzed and reported. A copy of the interview will be sent to the interviewee to check for any misinterpreted content and to receive usage approval. Interview questions
1. Can you tell me something about your function and background inside MI?

2. How would you describe telemetry?
3. In what way are you involved in the telemetry project inside MI?
4. What do you think are the benefits of telemetry for MI?
5. In what way do you think it will influence your daily tasks and activities?
6. Do you think the telemetry project has any roadblocks?
7. What role has telemetry in interacting with the end-consumer?

Appendix D Interview guide B
Introduction Interview guide B is formed to successfully conduct all interviews regarding the examination of the conceptual research model. The interview guide includes a research objective and interview protocol. Research objective The research objective is to examine unit of analysis B, the examination of the conceptual research model. The collected information will be used to check and/or adjust the conceptual research model. Several data and organizational promoters and barriers of the integration between analytical BI and interactive marketing will be identified upon MI and other related organizations. Interview protocol The interview protocol covers the rules and guidelines that enable and facilitate the implementation and administration of the interviews (Boyce & Neale, 2006). It covers the instructions that should be followed for each interview to ensure the consistency between the conducted interviews and to increase the reliability of the findings. The interview protocol exists of setting up, introduce, conclude and follow up the interview. It also includes the interview questions. Setting up the interview Every interview will be set up by e-mailing the person in question with a short personal introduction, an introduction of the project context, the interest in the person in question and the benefits for the person in question from the research project. Introduction The introduction of the actual interview will include a short briefing on the project context, the possibility of audiotaping the interview, the duration of the interview and a quick explanation of the interview questions that will be covered. Concluding Once all interview questions are asked, there will be asked if the person in question wants to add any related information. A copy of the final Thesis report will be offered together with the invitation of joining the final presentation. Follow up The interview will be analyzed and reported. A copy of the interview will be sent to the interviewee to check for any misinterpreted content and to receive usage approval. Interview questions 1. Can you tell me something about your function and background inside your organization? 2. What role does data and analytical BI play inside your organization? 3. What role has marketing inside your organization?

4. What do you think influences the integration between IT and/or BI and (interactive) marketing? 5. What do you think is needed on IT and/or BI level to successfully implement data solutions drawn from the integration between IT/BI and marketing?
6. What do you think is needed on organizational level to successfully implement data solutions drawn from the integration between IT/BI and marketing?
7. Do you think there are roadblocks in successfully implementing data solutions in your organization drawn from the integration between IT/BI and marketing? If so, how would you describe those? 8. Can you describe the process of making project goals? 9. How would you describe the role of top management in these kind of implementations? 10. What else do you think is needed to successfully implement data solutions drawn from the integration between IT/BI and marketing? 11. Is there anything you like to add regarding this research project and interview questions?
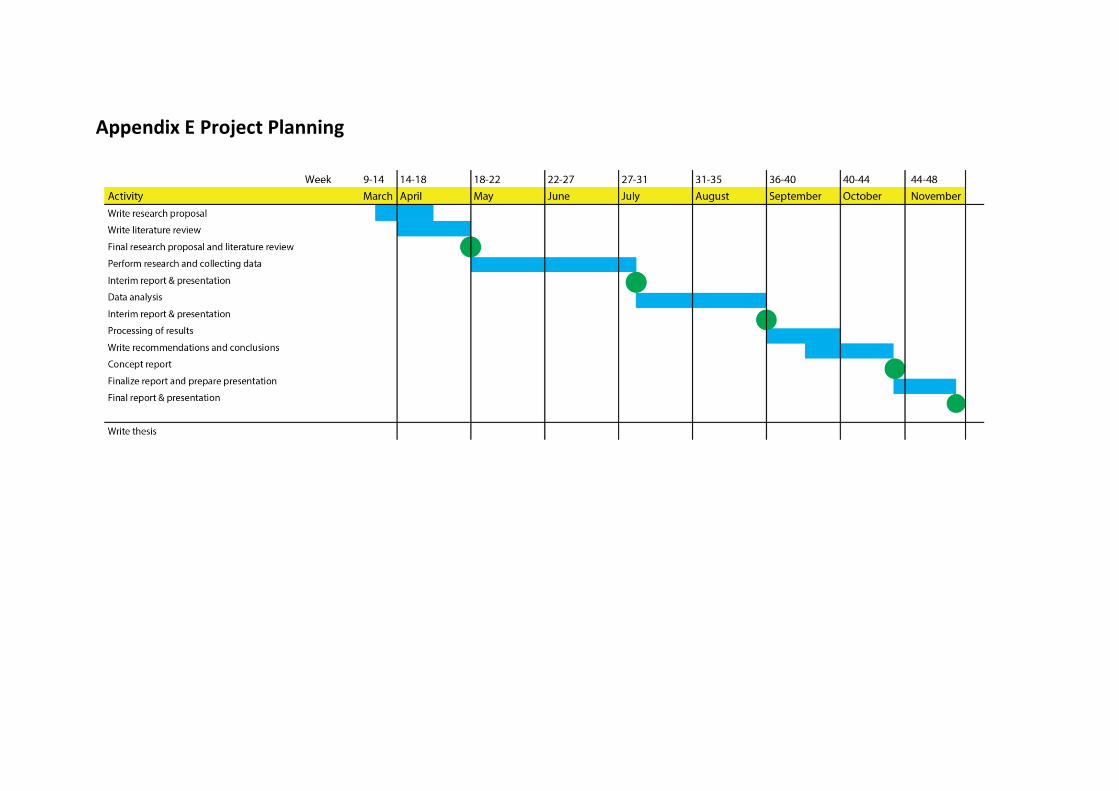
Appendix E Project Planning

Appendix F Publications per year
Year Number of publications
2014 10
2013 9
2012 12
2011 13
2010 10
2009 1
2008 3
2007 2
2006 4
2005 1
2004 3
2003 0
2002 1
2001 1
2000 6
1999 4
1998 2
1997 0
1996 0
1995 1
1994 0
1993 2
1992 1
YEAR
0
2
4
6
8
10
12
14
20
14
20
13
20
12
20
11
20
10
20
09
20
08
20
07
20
06
20
05
20
04
20
03
20
02
20
01
20
00
19
99
19
98
19
97
19
96
19
95
19
94
19
93
19
92
Number of publications per year

Appendix G The Customer Framework
The Customer Framework (Stone & Woodcock, 2014)

Appendix H IoT industries
Possible data acquisition equipment’s in the IoT (Chen et al., 2014)
IoT affecting different industrial sectors (Vermesan et al., 2011)
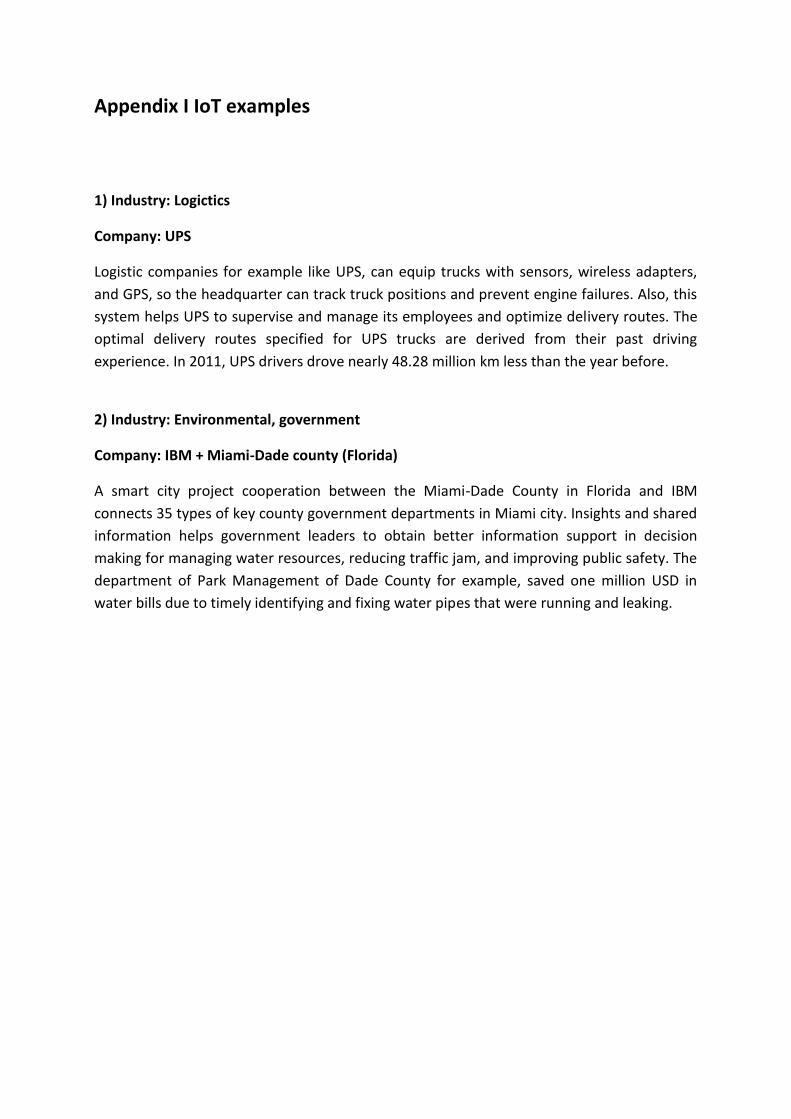
Appendix I IoT examples
1) Industry: Logictics
Company: UPS
Logistic companies for example like UPS, can equip trucks with sensors, wireless adapters,
and GPS, so the headquarter can track truck positions and prevent engine failures. Also, this
system helps UPS to supervise and manage its employees and optimize delivery routes. The
optimal delivery routes specified for UPS trucks are derived from their past driving
experience. In 2011, UPS drivers drove nearly 48.28 million km less than the year before.
2) Industry: Environmental, government
Company: IBM + Miami-Dade county (Florida)
A smart city project cooperation between the Miami-Dade County in Florida and IBM
connects 35 types of key county government departments in Miami city. Insights and shared
information helps government leaders to obtain better information support in decision
making for managing water resources, reducing traffic jam, and improving public safety. The
department of Park Management of Dade County for example, saved one million USD in
water bills due to timely identifying and fixing water pipes that were running and leaking.
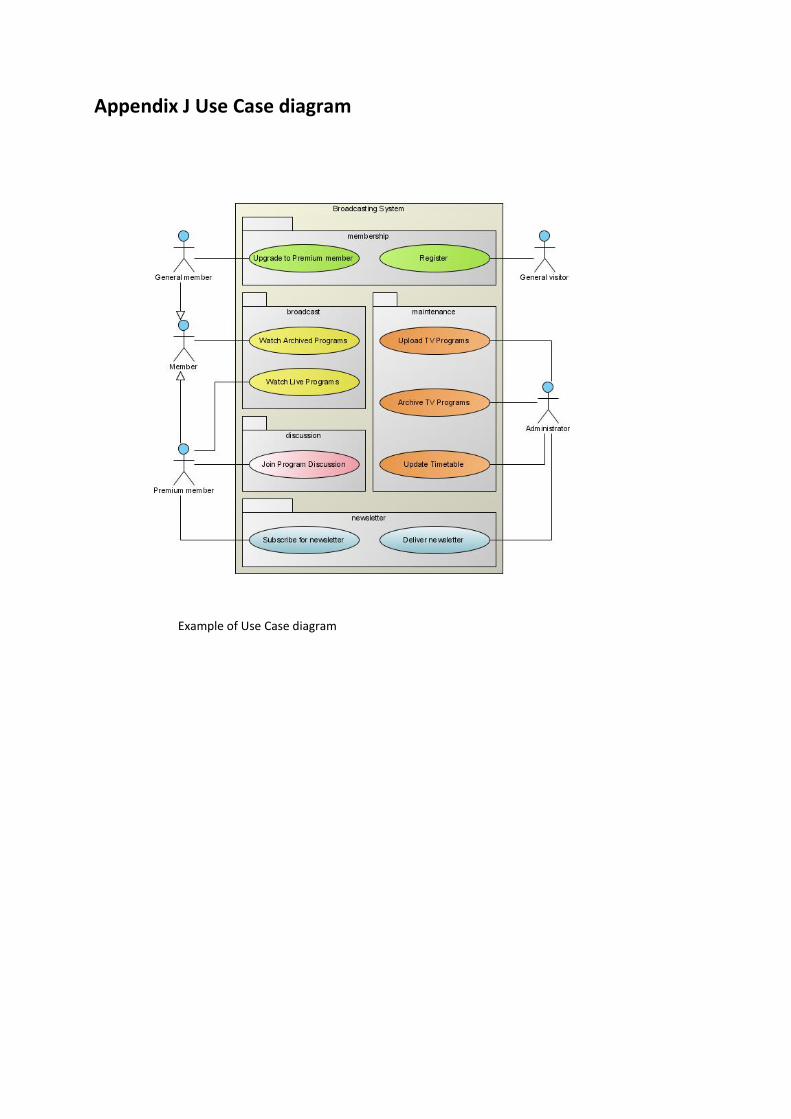
Appendix J Use Case diagram
Example of Use Case diagram

Appendix K levels of analytical capability
Firms withholding the Aspirational capability level are the furthest
away from achieving their desired analytical goals, often focus on
efficiency and cost reduction, and often have few of the necessary
building blocks (people, processes or tools), to collect, understand
or act on analytic insights.
Organizations containing the Experienced capability level are looking
beyond cost reduction and are developing better ways to collect,
understand and act on analytics effectively in order to begin optimizing
their organizations.
Transformed organizations have substantial experience using
analytics across a broad range of functions. These firms use
analytics as a competitive differentiator, are less focused on cost
reductions and more on driving customer profitability and making
targeted investments and are already adept at organizing people,
processes and tools to optimize and differentiate.
K2 Analytical usage per capability level
LaValle et al., 2011

Appendix L Recommendations analytics-driven management
1 Focus on the biggest and highest-value opportunities
It’s difficult for people to change decision-making processes based on experience and
routine within an organization to decision-making on data, especially when that data
counters with the existing knowledge. To overcome this obstacle, LaValle et al. (2011) state
that an organization needs to align their analytical objectives with their general strategic
business direction. This to avoid skepticism and timing issues on organizational changes.
Gartner Research (2010) also supports this theory, stating an analytical BI tool is part of a
broader BI strategy, taken into account its overall business value and underlying technology
architecture, while remaining aware of the challenges inherent in every major new
technology.
2 Within each opportunity, start with questions, not data
Organizations should start with defining the insights and questions needed to meet the
overall organizations strategy and objectives and then identifying those pieces of data
needed for answers. The defined insights can be used to target specific subject areas,
whereas readily available data can be used for initial analytical models. This eliminates gaps
in the data infrastructure and by narrowing the scope to specific areas; value can be realized
more quickly, while the insights are still relevant.
3 Embed insights to drive actions and deliver value
New methods and tools to embed information into business processes such as use cases,
analytics solutions, optimization, workflows and scenario simulations, are making insights
more understandable and actionable. These methods make it possible for decision makers
to fully see their customers’ purchases, payments and interactions. Also, it will enable
organizations to listen to customers’ unique needs about channel and product preferences.
4 Keep existing capabilities while adding new ones
As executives use analytics more frequently to inform day-to-day decisions and actions,
increasing demand for insights keeps resources at each level engaged while expanding
analytic capabilities. Modeling and visualization tools will provide greater business value
than before. However, its important new tools should supplement earlier ones or continue

to be used side by side as needed. When an organization becomes more data driven, this
process needs to be additive, and existing capabilities should continue to be supported.
5 Use an information agenda to plan for the future
Information arrives more and more through unstructured digital channels as social media,
mobile applications and Internet-based gadgets. Molding this data into an information
agenda that is integrated, consistent and trustworthy helps the organization to share and
deliver across all applications and processes. The information agenda aligns IT and business
goals through enterprise information plans and help establish necessary links between those
who set the strategy of an organization and those who manage the data and information. An
information agenda consists of: information governance policies, data architecture, data
currency, data management and analytical tool kits based upon user needs. In short, the
information agenda is a key enabler of analytics initiatives by providing the right information
and tools at the right times based upon business-driven priorities.
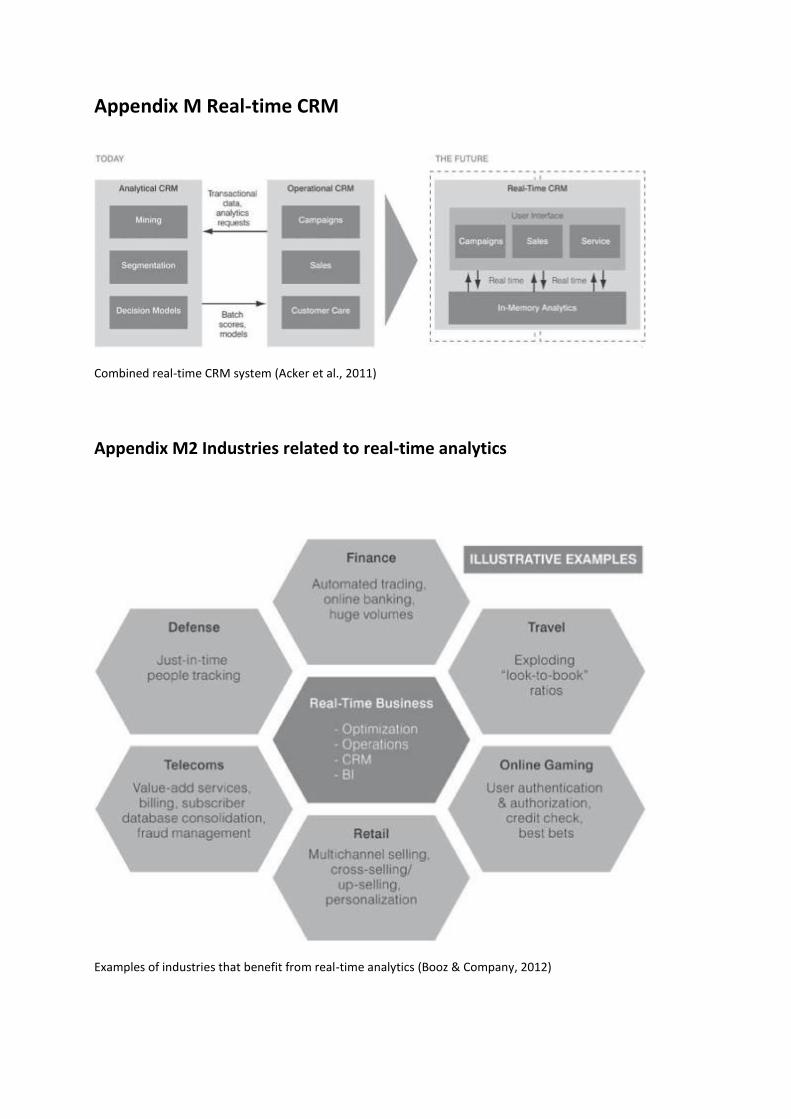
Appendix M Real-time CRM
Combined real-time CRM system (Acker et al., 2011)
Appendix M2 Industries related to real-time analytics
Examples of industries that benefit from real-time analytics (Booz & Company, 2012)

Appendix O Conceptual Research Model
Figure O1 Conceptual research model
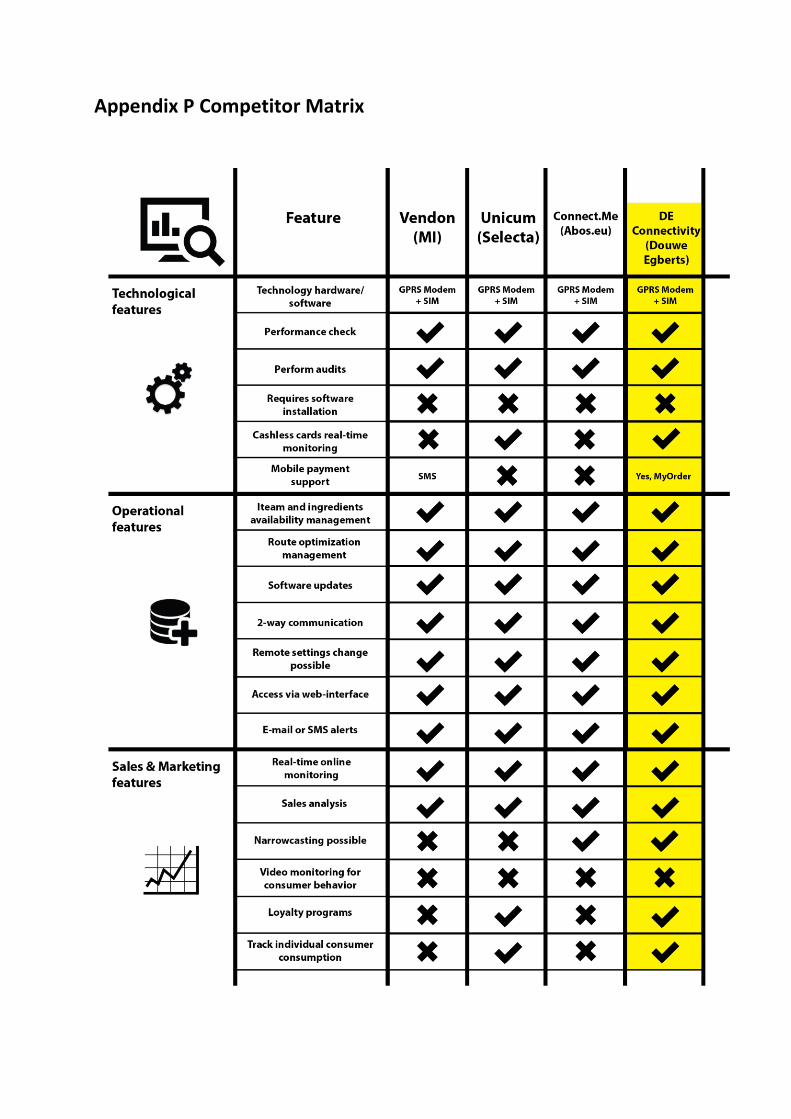
Appendix P Competitor Matrix

Appendix Q Prioritized benefits
Table Q1 Prioritized benefits on technology and operations

Table Q2 Prioritized benefits on sales & marketing and consumer

Appendix R1 UML model preparation
Identification relevant object classes
Table R1 shows an overview of all relevant object classes covering the scope of all prioritized
benefits. Appendix R2 outlines a summary description of every object class to give an
impression of the loaded information. Appendix R3 shows a table with all object classes and
their according attributes. Attributes represent the properties of their corresponding object
class (Eshuis et al., 2009). For example: every operator (object class) is identified by an
operator number (attribute).
Identification of relevant relationships between these object classes
In UML modeling, a relationship is a connection between model elements (IBM, 2014). There
are many type of relationship including associations, dependencies and realizations. The
most commonly used relationship is an association relationship. An association is a
relationship between two classifiers, such as classes or use cases that describes the reasons
for the relationship and the rules that govern the relationship.
Appendix R4 shows an overview of all identified relationships. As can also be seen in Table
3.6, technological benefits are highlighted by the color dark-green, operational benefits by
green and sales & marketing benefits by light-green. The same accounts for Appendix R4,
where all relationships are highlighted by a color indicating to what type of benefit they add
value. All relationships are typed as associations, except for Inventory VM – refills –
Operator, where refills is an association class of objects Inventory VM and Operator. Chapter
4 will describe in detail how all relationships relate to each other, visualized by the UML data
model.
Table R1 Relevant object classes
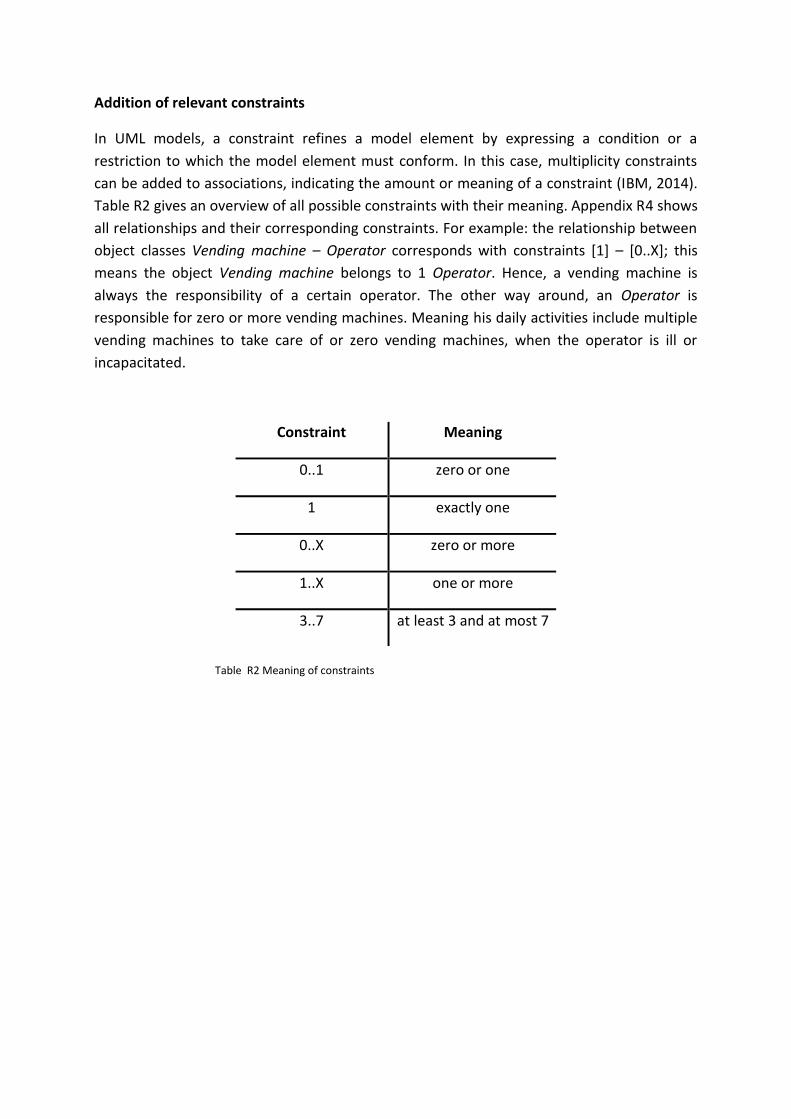
Addition of relevant constraints
In UML models, a constraint refines a model element by expressing a condition or a
restriction to which the model element must conform. In this case, multiplicity constraints
can be added to associations, indicating the amount or meaning of a constraint (IBM, 2014).
Table R2 gives an overview of all possible constraints with their meaning. Appendix R4 shows
all relationships and their corresponding constraints. For example: the relationship between
object classes Vending machine – Operator corresponds with constraints [1] – [0..X]; this
means the object Vending machine belongs to 1 Operator. Hence, a vending machine is
always the responsibility of a certain operator. The other way around, an Operator is
responsible for zero or more vending machines. Meaning his daily activities include multiple
vending machines to take care of or zero vending machines, when the operator is ill or
incapacitated.
Constraint Meaning
0..1 zero or one
1 exactly one
0..X zero or more
1..X one or more
3..7 at least 3 and at most 7
Table R2 Meaning of constraints

Appendix R2 Summary Object Classes
Operator
1. An operator refills vending machines and fixes service errors when possible. 2. An operator number identifies an operator.
Service engineer
1. A service engineer fixes service errors of vending machines in case the responsible operator is not skilled enough. Based on the availability of the service engineer, an automatic real-time service error notification is sent. Once received, a service engineer can take further action and solve the problem.
2. A service engineer number identifies a service engineer.
Service error
1. A service error defines an undesired event coming from a vending machine. A Service error includes a service error number, date, type and required service engineer number or operator number. First, the operator receives an automatic service error notification. If the responsible operator can’t fix the service error, an available service engineer will receive the service error notification.
Customer
1. The customer is considered as a client of MI. A customer number identifies a customer.
Vending machine
1. A vending machine has inventory containing hot/cold drinks or snacks. 2. A vending machine contains an identification number, machine type and location. A
vending machine also registers the last cleaning moment. 3. A vending machine can also be monitored on sales and technical performance and
can sent service errors.
Clean
1. A vending machine is cleaned by an operator. The “clean” contains a clean type, date and operator number.

Product
1. A product can be a hot/cold drink or cold snack, like coffee, Coca-Cola or Twix. A product contains a product number, type, price, weight, expiration date and inventory number. The Inventory of the vending machine notes the amount of products still left in the machine through real-time inventory information.
2. Products are purchased by employees of customers and restocked by operators. 3. Product prices can be changed by a Sales manager.
Drink
1. A drink contains a drink number, type, price, weight, expiration date and inventory number.
2. A drink can be a hot or cold drink. Both are product types a vending machine can offer.
Snack
1. A snack contains a snack number, type, price, weight, expiration date and inventory number.
2. A snack is one of the product types offered in the vending machine.
Ingredient
1. Ingredients, like coffee beans or cacao, are used to prepare a hot drink inside a vending machine. An ingredient has a number, type, price, weight, expiration date and inventory number. Ingredient inventory is derived from the number of purchases or “clicks”, as every product made from ingredients has according ingredient weights.
2. Operators restock ingredients in the same inventory as cold drinks and snacks.
Inventory VM
1. Inventory inside a vending machine stands for the amount of products and ingredients still available for purchasing. Ingredient inventory is derived from the number of purchases or “clicks”, as every product made from ingredients has according ingredient weights. This due to the absence of sensors inside the current vending machines.
2. An operator refills inventory on ingredients and products.
Invoice
1. A customer invoice contains an invoice number, date and customer number. Furthermore it includes the amount of products purchases by the customer.
2. Every week or month, an invoice is sent to the customer.

Purchase
1. A purchase contains a product number, product type, product price, purchase number, purchase date and purchase quantity. A product is purchased by employees of the customer.
2. A vending machines’ sales performance can be checked by monitoring all purchases. 3. A customers invoice is made from all customers’ purchases.
Sales Manager
1. The sales manager can change product prices and includes a sales manager number. 2. A sales manager can also adjust the product mix according to sales analysis.
Performance
1. A vending machine can be checked on its technical and sales performance. The technical performance includes the reliability of the vending machine, whereas the sales performance includes the amount of purchases made by customers.

Appendix R3 Object Classes + Attributes
Class Attribute Attribute name
Operator Operator number OperNo
Service engineer Service engineer number SerEngiNo
Service error Service error number Service error date Service error type Service error engineer number
SerErNo SerErDate SerErType SerEngiNo
Customer Customer group number CustomerNo
Vending machine Vending machine number Vending machine type Vending machine location Last cleaning moment
VmNo VmType VmLocation /VmLastClean
Clean Clean type Clean Date Clean Operator No
CleanType CleanDate CleanOperNo
Product Product number Product type Product price Product weight Product expiration date Product inventory number
ProdNo ProdType ProdPrice ProdWeight ProdExDate ProdInvNo
Drink Drink number Drink type Drink price Drink weight Drink expiration date Drink inventory number
DrinkNo DrinkType DrinkPrice DrinkWeight DrinkExDate DrinkInvNo
Snack Snack number Snack type Snack price Snack weight Snack expiration date Snack inventory number
SnackNo SnackType SnackPrice SnackWeight SnackExDate SnackInvNo
Ingredient Ingredient number Ingredient type Ingredient price Ingredient weight Ingredient expiration date Ingredient inventory number
IngrNo IngrType IngrPrice IngrWeight IngrExDate IngrInvNo
Inventory VM Product amount A Ingredient amount A Product A order threshold
ProductAmountA IngredientAmountA ProductAThreshold

Ingredient A order threshold
IngredientAThreshold
Invoice Invoice number Invoice date Invoice customer number Product amount A Product amount B Product amount C Product amount D Ingredient amount A Ingredient amount B
InvoiceNo InvoiceDate InvoiceCustomerNo ProductAmountA ProductAmountB ProductAmountC ProductAmountD IngredientAmountA IngredientAmountB
Purchase Product number Product type Product price Purchase number Purchase date Purchase quantity
ProdNo ProdType ProdPrice PurchaseNo PurchaseDate PurchaseQuantity
Sales manager Sales manager number SalesMaNo
Performance Purchase number Purchase date Purchase quantity Door open number Door open date Total down time
PurchaseNo PurchaseDate PurchaseQuantity DoorOpenNo DoorOpenDate TotalDownTime

R4 Relationships & Constraints

Appendix S UML Data Model
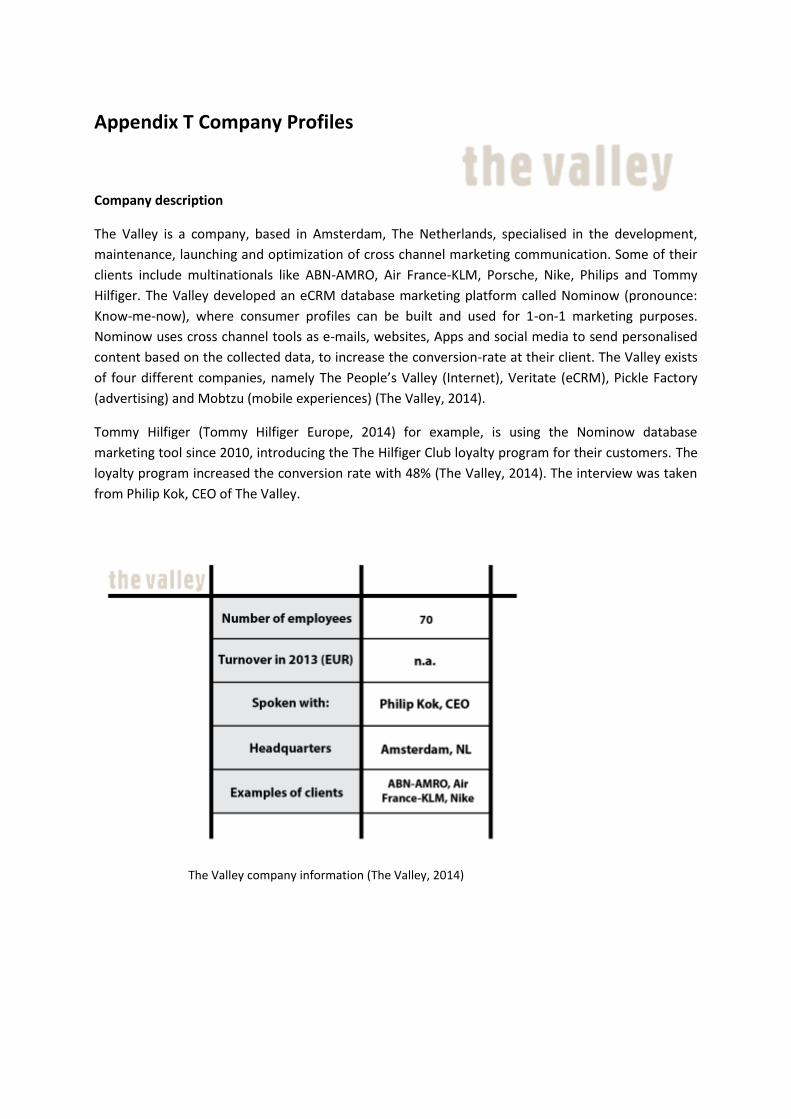
Appendix T Company Profiles
Company description
The Valley is a company, based in Amsterdam, The Netherlands, specialised in the development,
maintenance, launching and optimization of cross channel marketing communication. Some of their
clients include multinationals like ABN-AMRO, Air France-KLM, Porsche, Nike, Philips and Tommy
Hilfiger. The Valley developed an eCRM database marketing platform called Nominow (pronounce:
Know-me-now), where consumer profiles can be built and used for 1-on-1 marketing purposes.
Nominow uses cross channel tools as e-mails, websites, Apps and social media to send personalised
content based on the collected data, to increase the conversion-rate at their client. The Valley exists
of four different companies, namely The People’s Valley (Internet), Veritate (eCRM), Pickle Factory
(advertising) and Mobtzu (mobile experiences) (The Valley, 2014).
Tommy Hilfiger (Tommy Hilfiger Europe, 2014) for example, is using the Nominow database
marketing tool since 2010, introducing the The Hilfiger Club loyalty program for their customers. The
loyalty program increased the conversion rate with 48% (The Valley, 2014). The interview was taken
from Philip Kok, CEO of The Valley.
The Valley company information (The Valley, 2014)

Company description
BrandLoyalty is specialized in turning casual consumers into loyal shoppers by creating data-driven
loyalty programs designed to generate immediate changes in consumer behaviour. BrandLoyalty,
one of the largest and most successful data-driven loyalty marketers in Europe, is based in ‘s-
Hertogenbosch, Netherlands. Large retailers as Delhaize, Coop and Spar are clients of BrandLoyalty
(hereafter: BL). BL generates more than half of its sales from Germany, France and Italy in Europe, as
well as key markets in Asia. Additional new markets are being developed, including Russia and China.
In November 2013 Alliance Data Systems Corperation (Dallas, USA), a leading provider of loyalty and
marketing solutions derived from transaction-rich data, bought a 60% ownership in BL.
BrandLoyalty company information (BrandLoyalty, 2014)

Company description
Sweebr is a company specialized in developing online payment solution software for retailers. The
company provides web-based dashboards to maintain and view insights of real-time data
transactions. Also, Sweebr is also a potential IT partner for implementing telemetry inside MI. The
company is based in Haarlem, Netherlands.
Sweebr company information (Sweebr, 2014)

Appendix U Business Case
Operations savings - Efficient route planning
Table U1 Operations savings criteria
Total number of visits/year 1.623.768 + 73.704 + 61.968 = 1.759.440
Operator wage/year € 40.000
Number of full-time operators MI 295
Total operator wage/year € 40.000 x 295 = € 11.800.000
Costs per visit € 11.800.000 / 1.759.440 = € 6,71
Overhead costs € 3,29
Total costs per visit € 6,71 + € 3,29 = € 10
Inventory Management - Efficient inventory management
Table U2 Inventory Management savings criteria
Example on calculated purchasing costs/VM/year:
Total clicks/purchases per hot VM/year 311.700.000
Average purchasing price/hot drink € 0,07
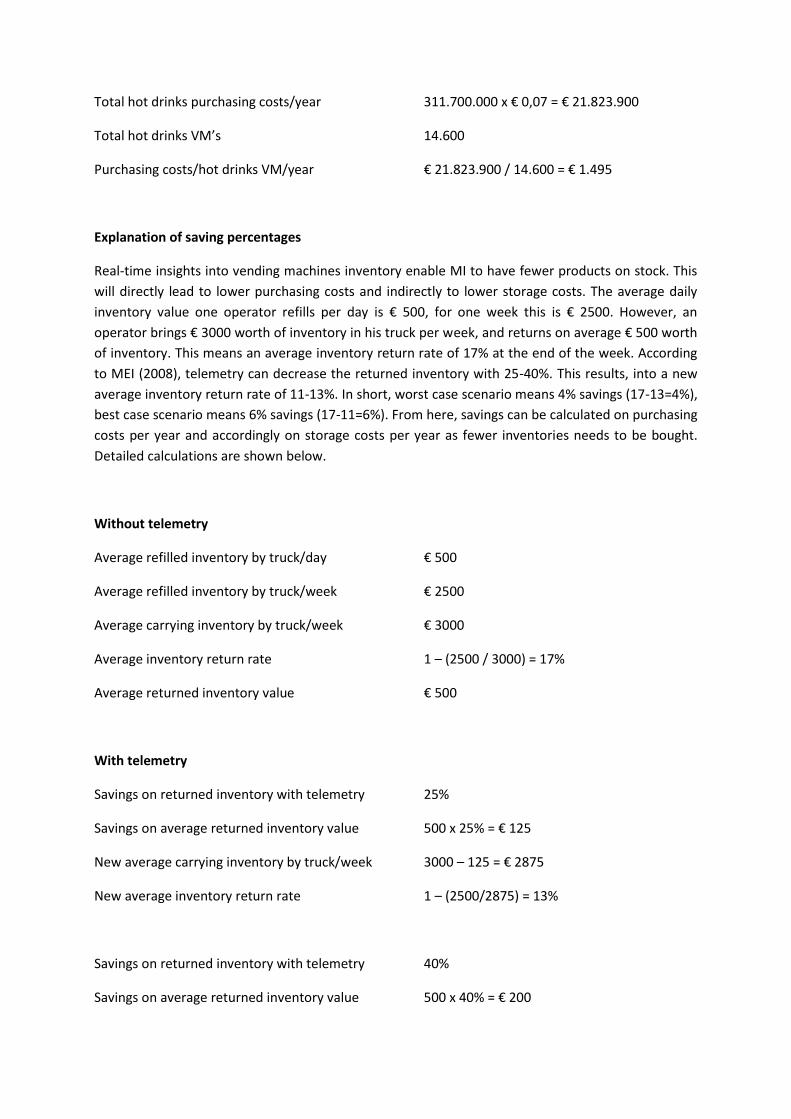
Total hot drinks purchasing costs/year 311.700.000 x € 0,07 = € 21.823.900
Total hot drinks VM’s 14.600
Purchasing costs/hot drinks VM/year € 21.823.900 / 14.600 = € 1.495
Explanation of saving percentages
Real-time insights into vending machines inventory enable MI to have fewer products on stock. This
will directly lead to lower purchasing costs and indirectly to lower storage costs. The average daily
inventory value one operator refills per day is € 500, for one week this is € 2500. However, an
operator brings € 3000 worth of inventory in his truck per week, and returns on average € 500 worth
of inventory. This means an average inventory return rate of 17% at the end of the week. According
to MEI (2008), telemetry can decrease the returned inventory with 25-40%. This results, into a new
average inventory return rate of 11-13%. In short, worst case scenario means 4% savings (17-13=4%),
best case scenario means 6% savings (17-11=6%). From here, savings can be calculated on purchasing
costs per year and accordingly on storage costs per year as fewer inventories needs to be bought.
Detailed calculations are shown below.
Without telemetry
Average refilled inventory by truck/day € 500
Average refilled inventory by truck/week € 2500
Average carrying inventory by truck/week € 3000
Average inventory return rate 1 – (2500 / 3000) = 17%
Average returned inventory value € 500
With telemetry
Savings on returned inventory with telemetry 25%
Savings on average returned inventory value 500 x 25% = € 125
New average carrying inventory by truck/week 3000 – 125 = € 2875
New average inventory return rate 1 – (2500/2875) = 13%
Savings on returned inventory with telemetry 40%
Savings on average returned inventory value 500 x 40% = € 200

New average carrying inventory by truck/week 3000 – 200 = € 2800
New average inventory return rate 1 – (2500/2800) = 11%
Savings on inventory management worst case 17% - 13% = 4%
Savings on inventory management best case 17% - 11% = 6%
Sales – increase sales
Table U3 Sales “savings”criteria
Example hot drinks VM:
Total amount of hot drinks VM 4600
Total revenue per hot drinks VM’s/year € 6.480.000
Revenue/hot drinks VM/year € 6.480.000 / 4600 = € 1409
Gross profit/VM/year € 1409 x 60% = € 845
Cash-flow statement - Discounted payback period
Table U4 Worst case discounted payback period
Table U5 Best case discounted payback period

Appendix U2 Financial Overview
Installed base
Table U6 Current installed base of VM’s
Financial criteria
Table U7 Costs criteria
Table U8 Investment costs
Table U9 Costs per year
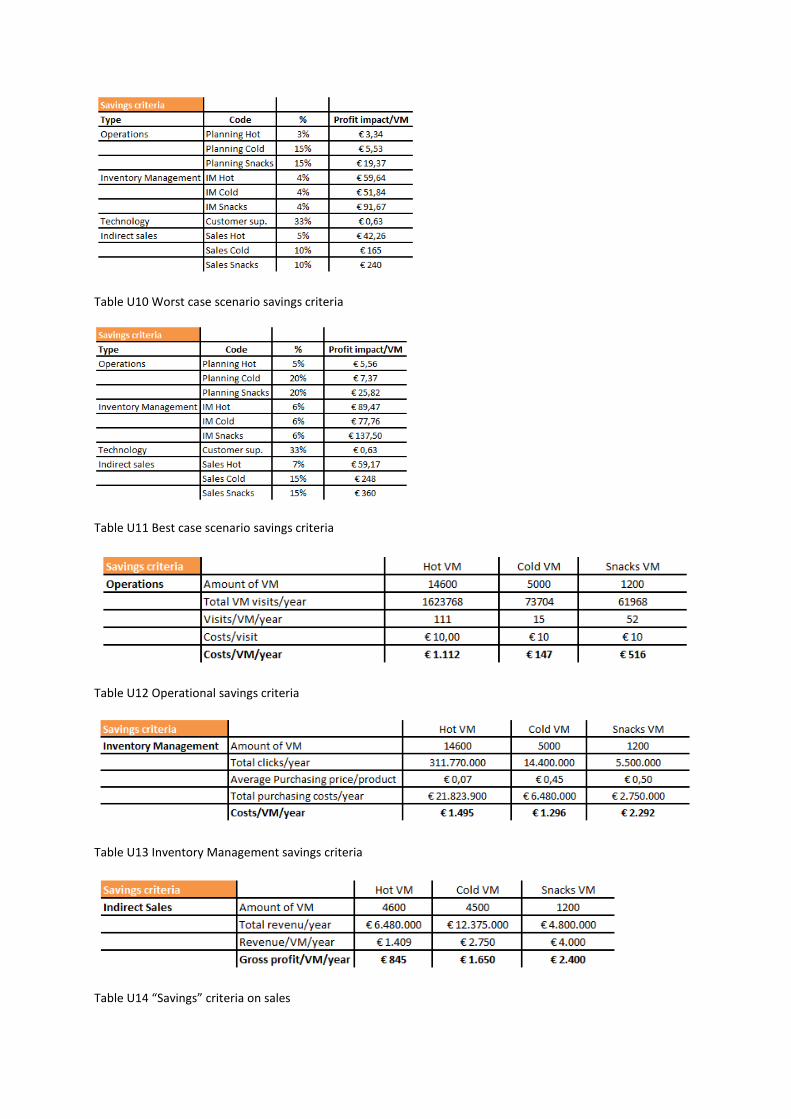
Table U10 Worst case scenario savings criteria
Table U11 Best case scenario savings criteria
Table U12 Operational savings criteria
Table U13 Inventory Management savings criteria
Table U14 “Savings” criteria on sales

Total savings/profit impact per year
Table U15 Worst case scenario savings/earnings per year
Table U16 Best case scenario savings/earnings per year
Cash-flow statements
Table U17 Worst case cash-flow statement
Table U18 Best case cash-flow statement
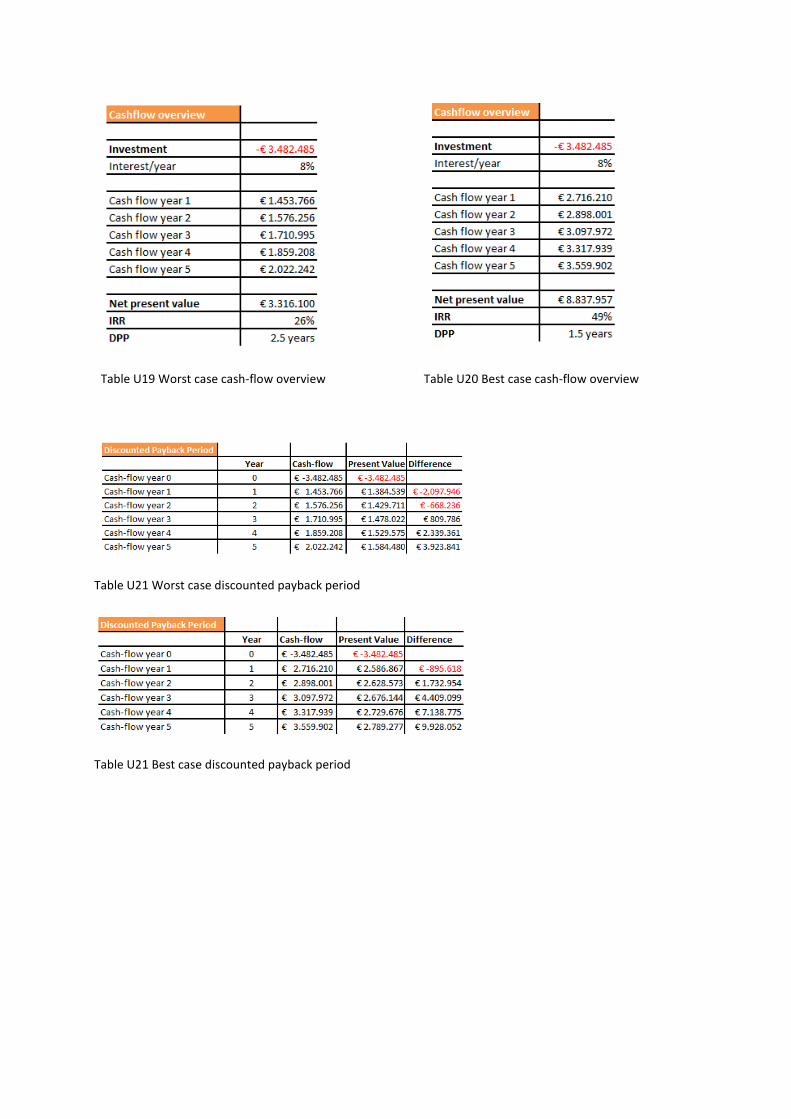
Table U21 Worst case discounted payback period
Table U21 Best case discounted payback period
Table U20 Best case cash-flow overview Table U19 Worst case cash-flow overview