dimensions and perceptional differences of ... - core.ac.uk potentially grow to be attractions,...
TRANSCRIPT
Dimensions and Perceptional Differences of Exhibition Destination Attractiveness:
The Case of China
Dr. Xin Jin
Department of Tourism, Leisure, Hotel and Sports Management
Griffith Business School
Gold Coast Campus, Griffith University,
Parklands Drive, Southport Qld 4215, Australia
Phone: +61 7 5552 7413
Fax: +61 7 5552 8507
Email: [email protected]
Dr Karin Weber
School of Hotel & Tourism Management
The Hong Kong Polytechnic University
Email: [email protected]
Dr. Thomas Bauer
School of Hotel & Tourism Management
The Hong Kong Polytechnic University
Hong Kong, China
Submitted to Journal of Hospitality and Tourism Research – 25 May 2011
Re-Submitted on 19 September 2011
* Corresponding author
This paper has not been published elsewhere and has not been submitted simultaneously for
publication elsewhere.
Dimensions and Perceptional Differences of Exhibition Destination Attractiveness:
The Case of China
ABSTRACT
The meetings, incentives, conventions and exhibitions (MICE) industry has evolved into
a vital sector of business tourism. The vast majority of research to date has focused on the
convention/meeting sector (Lee & Back, 2005; Yoo & Weber, 2005), with studies on convention
site selection being especially prominent. In contrast, the exhibition sector and particularly,
exhibition destination attractiveness, have received relatively little research attention. This study
aims to address this research gap by examining, from the exhibitors’ perspective, key factors for
an attractive and successful exhibition destination. Based on 616 survey responses from
exhibitors collected at nine trade fairs in four cities in Mainland China, study findings
highlighted the critical importance of two types of cluster effects – ‘host city leadership in the
industry,’ and ‘host city/region as a source of exhibitors’ - to an exhibition destination’s
attractiveness for exhibitors. Accessibility, venue facilities, and the destination’s leisure and
economic environment were considered less important. Implications of the study results are
discussed and directions for future research provided.
Keywords: Exhibition, Site Selection, Clusters, China
1
INTRODUCTION
The meetings, incentives, conventions and exhibitions (MICE) industry has evolved into
a vital sector of business tourism, following significant growth in the past decades. It is
increasingly recognized by governments as highly lucrative (Jago & Deery, 2010; McCabe,
2008). Both trade and consumer exhibitions, like meetings and conventions, are business events
that potentially grow to be attractions, catalysts, animators, place marketers, and image-makers
to a destination that can enhance its tourism industry (Getz, 2008). Interest in the value of
business events has been intense for the past decade in particular so that now almost all major
cities have invested in state-of-the-art convention and exhibition facilities, together with relevant
bodies devoted to selling the space and bidding for events (Weber & Ladkin, 2011).
Concurrently, there has been a significant increase in research related to this important
industry that generates substantial economic and non-economic benefits for destinations around
the world. The vast majority of research to date has focused on the convention sector (Lee &
Back, 2005; Yoo & Weber, 2005), with conventions being defined as ‘formal assemblies
attracting a large number of people for a common or specific purpose’ (Kirchgeorg, 2005, p. 35)
that sometimes but not always incorporate an exhibition to showcase products of relevance and
interest to convention attendees. However, the focus of this study is on exhibitions that rather
than being part of conventions, are stand-alone events held regularly at a fixed location with the
primary purpose of exhibiting products relating predominantly to a single industry.
In contrast to the convention sector, the exhibition sector has received relatively little
research attention. Jin’s (2010) review of the major studies on exhibitions published in English
language trade, marketing and hospitality journals during the period from 1974 until 2010
reveals that studies relating to exhibition selection, performance, management and effectiveness
evaluations from the perspective of exhibitors have received most research attention. There are a
number of studies on visiting objectives and on-going search behavior (e.g., Godar & O’Connor,
2001; Smith, Hama & Smith, 2003), yet, studies from the visitors’ perspective are relatively few
in number. Studies from the organizer and venue perspective are rare (e.g., Luo, 2007), with
studies focusing on the perspectives of other stakeholders being even less. It is also apparent that
the spatial distribution of exhibitions and exhibition destination attractiveness are under-
2
researched. Yet, a destination’s attractiveness is a key component contributing to the success of
an exhibition, together with the exhibition event itself, the exhibition organizer, and the
exhibition venue (Sasserath, Wenhart & Daly, 2005). Destination/venue attractiveness and the
event together form an integrated exhibiting experience for exhibitors, forming a synergistic
relationship with exhibition development. It is a key factor for exhibitors, as well as visitors,
when making decisions on whether or not to participate in an exhibition.
Mainland China presents a suitable setting to examine the various dimensions of
exhibition destination attractiveness for two reasons. First, there is its exhibition industry’s
current size and future growth potential, following rapid growth in the past decades (Jin, Weber
& Bauer, 2010). It is regarded as a valuable resource in showcasing the country’s economic
vision, has a tangible positive impact on local revenues, and plays a significant role in promoting
success for Chinese brands in a global market, in addition to the direct value of its own
commercial success (Reed, 2007). In 2007 China’s indoor exhibition space amounted to
2,516,581 square meters, the third highest in the world after the USA and Germany (UFI, 2007),
while revenue generated from exhibitions was estimated at approximately US$ 1.7 billion in
2005, with exhibition center revenue totaling US$ 373 million (Kay, 2007). In view of
anticipated growth rates of China’s economy of 7-9% per annum for another two to three
decades (Holz, 2008), demand for exhibitions in Mainland China is expected to rise concurrently.
Second, China’s exhibition industry is based on the German exhibition model whereby
exhibition development is closely linked to the development of industrial clusters (Kirchgeorg,
2005). Furthermore, numerous international exhibition organizing companies such as AUMA 1
member companies Reed Exhibitions and UBM have brand-name trade shows not only in China
but also in numerous other countries around the world. Thus, China’s exhibition industry shares
similarities with many other exhibition destinations that are also based on the German exhibition
model.
1 - Ausstellungs- und Messe-Ausschuss der deutschen Wirtschaft e.V (Association of the German
Trade Fair Industry)
3
Based on city size, prestige, economic strength, tradition and history in hosting
exhibitions, and the number of exhibitions hosted per annum, Shanghai, Beijing and Guangzhou
are typically classified as first-tier cities in the exhibition sector in China, while provincial
capital cities or economically developed cities striving to develop the exhibition industry are
classified as second-tier cities (e.g. Chan, 2008; Guo, 2007). Shanghai, Beijing and Guangzhou
dominate the market, with the number of exhibitions in these cities increasing. Many state-of-
the-art facilities in second-tier cities across the country are under-utilized, with exhibitions
fluctuating and positioning of these cities being more challenging, as noted by Jin, Bauer and
Weber (2010).
Given the significance of the exhibition industry for many destinations around the world,
and the development state of the exhibition industry in Mainland China, this study aims to
address the current gap in research by examining exhibitors’ perceptions of exhibition
destination attractiveness. In the context of Mainland China’s exhibition industry, two research
questions in particular will be addressed, namely:
1) What constitutes destination attractiveness for an exhibition destination from the
exhibitors’ perspective?
2) Do first and second-tier destinations perform differently with regard to destination
attractiveness factors from the exhibitors’ perspective?
LITERATURE REVIEW
Convention and Exhibition Site Selection
Numerous studies have identified convention site selection variables and their relative
perceived importance. Factors affecting site selection decisions can be broadly divided into site-
specific and association factors (Weber & Chon, 2002). Go and Zhang (1997) classified the
convention site selection criteria into two primary categories: 1) destination environment
(capacity) and 2) meeting facilities. Thus, the destination environment, meeting facilities, and
association factors form the three key constructs in convention site selection from the meeting
planners’ perspective. Many convention studies empirically verified the destination being an
important consideration for convention attendees. Oppermann (1996) first discussed the
4
relationship between destination image and convention site selection. Baloglu and Love (2005)
established the link between the perceived cognitive, affective and overall image of five cities in
the United States by association meeting planners and their site selection intention. The
perceived image of the cities includes perceived restaurant/retail accessibility, facilities, logistics,
city image, and the support and services from the Convention and Visitors Bureaus (CVBs).
Chacko and Fenich (2000) aimed to quantify the influence and importance of specific destination
attributes in the overall destination image for seven convention cities in the United States. They
found that image is the result of a city’s attractiveness, based largely on its physical attributes,
and that location is a critical factor in determining success, while the promotional appeal is a
significant contributor to overall destination image. In a subsequent study, Fenich (2001)
proposed a conceptual framework that may be used by a community or a convention center to
benchmark itself against immediate competitors. Bookable hotel rooms, restaurants, the size of
the convention center, air service, local transportation, cost, climate, safety/security and the
prosperity of the community were the primary categories of this framework.
Following a comprehensive review of the literature on convention site selection, Crouch
and Ritchie (1998) identified eight key dimensions considered in the site selection process by
association meeting planners, namely 1) accessibility, 2) local support, 3) extra-conference
opportunities, 4) accommodation facilities, 5) meeting facilities, 6) information, 7) site
environment and 8) other criteria. Subsequently, Crouch and Louviere (2004) established that the
venue cost, food quality, plenary rooms, on-site/off-site accommodation and participant
proximity are the five most important attributes influencing convention site selection of meeting
planners. More recently, Lee and Back (2008) examined factors affecting brand satisfaction and
attitudinal brand loyalty of convention attendees. Their findings confirm that convention site
selection has a significant, positive impact on (convention) brand satisfaction, which results in
attitudinal brand loyalty (Chaudhuri & Holbrook, 2001).
While the vast majority of studies have focused on an assessment of first-tier destinations,
Nelson & Rys (2000) analyzed a number of factors especially relevant to the attractiveness of
smaller convention destinations (second-tier cities) in the United States. They concluded that a
lack of direct air access and clear destination image constrained the development of smaller cities
5
as potential convention sites, although affordability, friendliness of staff and local people, quality
food service, shopping opportunities and centrality of sites might help second-tier convention
destinations to attract local/regional association business. In short, convention site selection
variables and their relative perceived importance are well established, in contrast to exhibition
destination attractiveness.
Considering the ‘promotable’ (Hedorfer & Todter, 2005, p. 119) nature of travel to an
exhibition, relating to its program, venue and host destination, factors that affect convention
selection are likely to also have a certain impact on exhibition selection decisions. Both
conventions and exhibitions potentially provide host destinations with business and income,
investment and sponsorship, tax revenue, employment and training, increased business
opportunities, an improved destination image and increased visitor numbers. Thus, literature on
decision-making for convention participation, site selection, and convention feasibility is
conducive to understanding similar aspects in exhibition organization and site selection.
However, exhibitions are business events that are fundamentally different from conventions in a
number of ways, namely: 1) the location for conventions is usually not fixed whereas it is for
trade exhibitions; 2) for conventions, there is only one group of participants targeted by the event
organizers, that is, convention attendees (or delegates) whereas in exhibitions, there are two
groups who attend and are targeted by the event organizer - exhibitors and exhibition visitors (or
buyers) – with the relationship between the two parties potentially influencing exhibition
participation; 3) educational and networking opportunities regardless of the convention location
are critical for convention attendees whereas business transactions and information exchange
serve as the primary purpose for exhibition attendees; 4) exhibitions often involve a display of
goods, with a requisite construction of exhibition booths, and thus, logistics is a major concern
for both organizers and exhibitors and 5) costs for convention attendees are generally the same,
given the set registration fees. In contrast, fees to participate in an exhibition can differ greatly
for exhibitors and visitors (Blythe, 1999), with exhibitors in particular paying different fees
depending on their booth size and location. Most importantly, numerous authors emphasize the
impact of economic attributes of a destination, such as ‘market leadership’, ‘composition of the
regional industry’, ‘industry fragmentation’ and ‘economic concentration’ (Fuchslocher, 2005;
6
Hedorfer & Todter, 2005; Rubalcaba-Bermejo & Cuadrado-Roura, 1995) on destinations being
successful exhibition hosts.
Exhibition Destination Attractiveness
Several studies have discussed the impact of ‘location’ on exhibition cultivation and
attendance. For example, Hedorfer and Todter (2005) identified the following advantages of
Germany as a destination for promotable business travel: central location in Europe; scenery;
town development and history; accommodation variety and facilities; shopping and food
provision; market leadership; services; high standard of infrastructure and excellent public
transport. Fuchslocher (2005) pointed out that location has considerable influence on the success
of exhibitions. He argued that exhibitors would not acknowledge the merit of location factors,
but would react both immediately and negatively to problems resulting from location factors.
Rubalcaba-Bermejo and Cuadrado-Roura's (1995) study represents a key study that
examines and empirically confirms the relationship between urban hierarchies and exhibitions
distribution. Utilizing data from 140 fair-hosting cities in Europe, they aimed to identify the
relationship between exhibition development and city characteristics. Data utilized included the
number of fairs, sectors represented, direct exhibitors, visitors, direct foreign exhibitors and
foreign visitors, in addition to net rented area. They noted that a set of varying destination factors
explains why some destinations are more attractive exhibition hosts than others. These factors
include: 1) tradition and history, 2) local income and population, 3) infrastructure and
communication availability, 4) location, 5) tourism, environmental and weather conditions, 6)
public investment and support policies, 7) the city’s international standing, 8) exhibition centre
size and 9) the composition of the regional industry. Another finding was that the size of
exhibitions in a city depends on industry fragmentation and sector specialization. Bigger cities
have a greater number of fairs and a higher level of sector diversification. Interestingly, they
found that exhibition size and internationalization may be non-correlated in European trade
exhibitions. Big exhibition-hosting cities compete with one another within the different
combinations of size and internationalization. As they grow, cities tend to enhance their
international position. Although Rubalcaba-Bermejo and Cuadrado-Roura's study provided a
7
comprehensive list of success factors for exhibition destinations, these factors were not the focus
of their study, and thus, the importance of these factors was not examined.
Integrating destination attributes discussed in the convention site selection and exhibition
literature, the following dimensions are identified that are potentially important for a destination
to be competitive as exhibition host: 1) accessibility, 2) exhibition facilities, 3) accommodation,
4) city leisure environment, 5) local support/policies, 6) composition of the regional economy, 7)
tradition and history, 8) local income and population, 9) international prestige and 10) local
support and policies. In addition, more recently Jin (2010) introduced the construct of ‘clusters’
into the exhibition destination attractiveness context, drawing on Porter’s Cluster theory. Cluster
theory traces its origin to the notion of ‘industrial districts’ discussed by Marshall (1966, p. 225),
which refers to a “concentration of small businesses of a similar character in particular localities.”
Porter’s (1998, p. 197) cluster theory renewed worldwide interest in industrial districts, with
clusters being defined as “geographic concentrations of interconnected companies, specialized
suppliers, service providers, firms in related industries, and associated institutions in particular
fields that compete but also cooperate.” He points out that “the roots of productivity lie in the
national and regional environment for competition” (1998, p. 7) and the “presence of clusters
suggests that much competitive advantage lies outside a given company or even outside its
industry, residing instead in the locations of its business units” (1998, p. 198). Cluster
advantages relate to co-location and localization externalities, like specialized labor markets and
infrastructure (Enright, 2003; Gordon & McCann, 2000), and interactive learning and knowledge
creation (Maskell, 2001; Wolfe & Gertler, 2004). Enright (2003) pointed to a significant impact
of clusters on corporate performance, regional economic development, and national
competitiveness. Clusters, as concentrations of businesses in particular localities, may explain
the spatial distribution of exhibitions (Rubalcaba-Bermejo & Cuadrado-Roura, 1995). Accepting
this notion, and based on in-depth interviews with 32 exhibitors, Jin (2010) advanced nine
measurement items to capture the cluster effect in the context of exhibitions. These items were
subsequently subjected to purification by an expert panel that consisted of three prominent
exhibition organizers and four academics who are actively involved in event-related research.
They were then pilot-tested and confirmed at an exhibition in Guangzhou which collected 216
8
responses. These measurements are used in the context of this study to further advance our
understanding of exhibition destination attractiveness.
Based on the review of literature covering convention site selection, exhibition
destination attractiveness, and China’s exhibition industry, this paper proposes the following
hypothesis and proposition:
H1: Exhibition destination attractiveness is a second-order construct composed of six
factors: 1) cluster effect, 2) venue facilities, 3) accommodation, 4) economic
environment, 5) city leisure environment and 6) accessibility.
P1: First and second-tier cities in China perform differently pertaining to
destination attractiveness factors from the exhibitors’ perspective.
METHODOLOGY
This research employed a quantitative approach and collected 616 responses via a face-
to-face survey method from exhibitors exhibiting at nine trade exhibitions hosted in four cities in
Mainland China – Shanghai, Hangzhou, Nanjing and Wuhan. As previously noted, Shanghai,
Beijing and Guangzhou are the key first-tier cities in the exhibition market in China. Shanghai
and Guangzhou respectively lead two exhibition-active industrial belts – the Yangtze River belt
and the Pearl River belt, with a number of second-tier cities located within or near these belts.
Since the pilot test was conducted in Guangzhou, the focus of the main survey was on the
Yangtze River belt. As a key purpose of the study was to compare perceptions of destination
attractiveness of first and second-tier cities, Shanghai was selected as a first-tier city, and
Hangzhou, Nanjing and Wuhan as second-tier cities. The lack of second-tier cities near Beijing
resulted in this city being considered unsuitable for the study.
Sampled exhibitions were selected based on availability, organizer and host destination
category, geographical location and dates. These exhibitions were of diverse ownerships, namely
1) government-owned, 2) local entrepreneur and local industry association-owned, 3) foreign
exhibition company-owned and 4) joint partnerships. They also covered varied industry sectors,
thus the representativeness of the population is enhanced, with non-observation error being low.
9
The sample size was determined based on the purpose of this study to collect a heterogeneous
sample and the requirement of the statistical analysis methods utilized.
The development of the instrument followed Churchill’s (1979) approach. Measurements
were adapted from the destination attractiveness/convention site selection literature. Destination
infrastructure, accessibility and environment indicators were mainly adapted from Lin, Morais,
Kerstetter and Hou (2007) and Chi and Qu (2008). Destination business environment items were
based on Enright and Newton (2005), while items measuring venue facilities were mainly based
on the opinions of the interviewed exhibitors, although Jung (2005) served as an additional
reference. The construct ‘cluster effect’ follows the definition of Porter (1998) and Enright
(2003), with measurement items adopted from Jin (2010). Although a number of studies have
used exploratory factor analysis to classify destination-related items, these studies are not
congruent in terms of measurement items, and different labels were given to name the emergent
latent factors in different studies (e.g., Chi & Qu, 2008; Lin et al., 2007). Thus, measurement
items adapted from the literature were subjected to purification and validation via exploratory
factor analysis.
The questionnaire was developed in both English and Chinese to cover both international
and domestic (Chinese) exhibitors. The questionnaire was first developed in English, then
translated into Chinese and finally, translated back into English, adopting a back-to-back
translation procedure (Chapman & Carter, 1979). The translations were compared, any
discrepancies discussed and resolved, with questionnaires being revised accordingly. Two
professional interpreters were employed for this task; both were native Chinese speakers with
many years of professional experience. A 7-point Likert scale indicating a level of agreement
ranging from “strongly disagree” (1) to “strongly agree” (7) was utilized for all measurements.
With the support of exhibition organizers, 24 survey helpers conducted face-to-face surveys
onsite under the supervision of the lead author. They were assigned to different halls in an
exhibition and instructed to cover both bigger and smaller booths. One exhibition booth was
treated as one interviewee. Questionnaire completion took around 15 to 20 minutes. The
response rate ranged from 70% to 90% in different exhibitions.
10
Exploratory factor analysis (EFA), confirmatory factor analysis (CFA), and independent
sample t-tests were utilized for data analyses employing SPSS 17.0. EFA and CFA were
conducted following a general practice of using a calibration and validation sample respectively
(Hair, Anderson, Tatham & Black, 2006), obtained by randomly splitting the data into two
datasets with equal numbers. Differences in perceptions of destination attractiveness variables
were assessed between exhibitors exhibiting in the first-tier city (Shanghai) versus exhibitors
exhibiting in second-tier cities (Hangzhou, Nanjing and Wuhan). Independent sample t-tests
were conducted at the factor level, based on the EFA results.
RESULTS
Respondent Profile
Table 1 provides the sample profile both at the aggregate and venue-specific level, as the
latter can disclose more detailed information about the subjects in each sampled exhibition. At
the aggregate level, about half of the sample was from medium-sized enterprises with 50 to 300
employees. Smaller enterprises with less than 50 employees and larger enterprises with more
than 300 employees accounted for approximately 25% each, although this differed slightly
among the sampled exhibitions. About one-third of the respondents were first-time exhibitors,
yet again, this figure fluctuated among different exhibitions. In terms of annual exhibition
attendance in China, aggregately, more than 60% of firms attended more than two exhibitions
per annum. As for global exhibition attendance, almost 50% of firms exhibited at least twice per
annum at overseas exhibitions. The frequency with which firms in China exhibit both
domestically and internationally indicates that they are actively seeking exhibiting opportunities,
which is not restricted to first-tier cities in China.
INSERT TABLE 1 ABOUT HERE
EFA of Destination Attractiveness
Using a calibration sample EFA was employed to assess the dimensionality of the
destination attractiveness construct. Tests for reliability (Cronbach alpha) for each dimension
were performed to ensure the quality of measurements (Churchill, 1979). A value higher than .9
is considered excellent, higher than .8 is regarded as good, while a value higher than .7 is
acceptable (Field, 2005). The Kaiser-Mayer-Olkin measure of sampling adequacy (KMO) and
11
Barlett’s Test of Sphericity examine the adequacy of sample size and validity of the correlation
matrix; KMO values between .7 and .8 are considered good, values above .8 are judged great
(Field, 2005). The EFA test met all the criteria and the result was a six-factor solution,
explaining 61.4% of the total variance. These six factors were labeled destination leisure
environment; cluster effect 1 (leadership of the host city in the industry); venue facilities;
accessibility; cluster effect 2 (host city/region as a source of exhibitors) and destination
economic environment. Table 2 summarizes the results of the EFA. Next, factors and indicators
identified by the EFA were used for first-order CFA analysis.
INSERT TABLE 2 ABOUT HERE
First-Order CFA of Destination Attractiveness
Based on the EFA result, a first-order CFA model for destination attractiveness was first
tested (Table 3) on a validation sample. Standard factor loadings, t-values, squared multiple
correlations (SMC), and composite reliability (CR) were reported to measure the reliability and
validity of the measurement models. All factor loadings were above 0.5 and each indicator t-
value exceeds 7.0 (p<0.001), suggesting that these indicators were viable measures for the
designated constructs. SMC measures the reliability of the indictors by showing the proportion of
variance in an indicator that is explained by its underlying latent variable. A high SMC value
indicates high reliability for the indicator concerned (Diamantopoulos & Siguaw, 2000). CR
exceeding .6 indicates good construct validity (Bagozzi & Yi, 1988). CR was calculated for each
of the six latent constructs. The values demonstrated good internal consistency, as follows:
destination leisure environment (.80); venue facilities (.80); accessibility (.75); destination
economic environment (.75); cluster effect 2 (.74) and cluster effect 1 (.64). Model fit indices,
such as chi-square (χ²), Goodness of Fit Index (GFI), Root Mean Square Error of Approximation
(RMSEA), Comparative Fit Index (CFI) indicate if the proposed measurement model was
plausible or not. According to Hair et al. (2006), significant p-values can be expected for a
sample size of more than 250 and containing more than 30 measurement items. Thus, if CFI is
above .9 and RMSEA is lower than .07, the model indicates reasonable fit. Model fit indices in
this study showed that the measurement model fitted the data well (χ² = 435.279, df=211,
p<0.001, χ²/df=2.063, GFI=0.886, CFI=0.914, RMSEA=0.060).
12
INSERT TABLE 3 ABOUT HERE
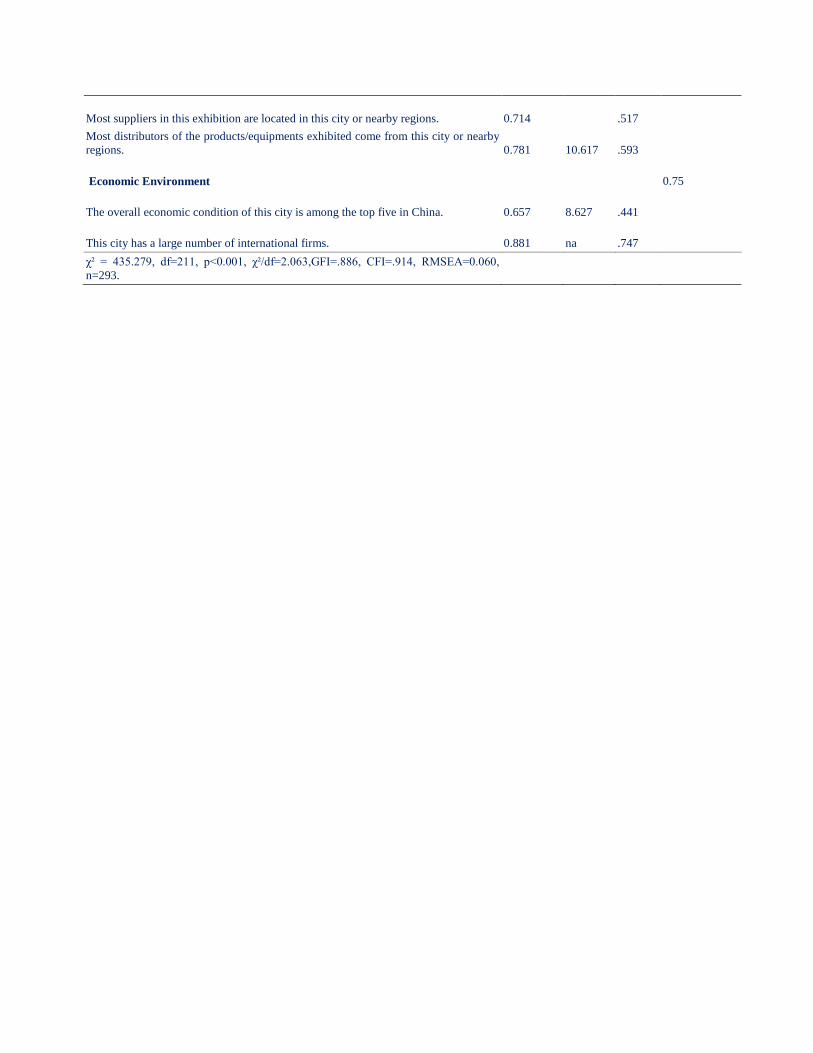
Two indicators (‘I have no language barriers in this city’, and ‘location of this exhibition
center is excellent’) had a low SMC value (0.255 and 0.286 respectively), suggesting that about
25% and 28% of variances in these indicators respectively were explained by the underlying
latent variables. However, considering that the overall construct validity (0.80 for both constructs)
was good and that fit indices were not improved significantly if the two indicators were removed,
they were kept to fully represent the construct and maximize reliability. Thus, first-order CFA
confirmed the six-factor model for destination attractiveness, and indicators for each of the six
factors.
Second-Order CFA of Destination Attractiveness
With dimensions confirmed by the first-order CFA, a second-order CFA (Table 4) was
conducted to establish the correlation parameters between the underlying dimensions and the
second-order construct (destination attractiveness). A second-order factor can be regarded as
“one way of accounting for covariance between constructs, just as first-order factors account for
covariation between observed variables” (Hair et al., 2006; p. 816). A second-order model is still
subject to construct validity standards. Thus, standard factor loadings, t-value, SMC and CR
were reported to measure the reliability and validity of the second-order model. Result shows
that the second-order model exhibits adequate fit (χ² =712.831, df = 220 p<0.001, χ²/df=3.240,
GFI=0.905, CFI=0.909, PNFI=0.761, RMSEA=0.060), and compared to the first-order
measurement model, it is more parsimonious and performs better on indices that reflect
parsimony (PNFI=0.761, PCFI=0.791, PRATIO=0.870). Other fit indices (GFI, CFI, RMSEA
etc.) are as good as, or even better than, the first-order model. Composite reliability of the factors
all comfortably exceed 0.70. Thus, all statistics support the assumption that the destination
attractiveness construct reflects variances in multiple first-order latent factors as a second-order
factor. In summary, based on the results of EFA, first and second-order CFA, it can be concluded
that destination attractiveness, in the exhibition context in Mainland China, perceived from the
exhibitors’ perspective, is a higher-order construct composed of six factors: 1) cluster effect 1
(host city leadership in the industry), 2) venue facilities, 3) cluster effect 2 (host city/region as a
13
source of exhibitors), 4) destination leisure environment, 5) destination economic environment
and 6) accessibility.
INSERT TABLE 4 ABOUT HERE
Differences in Exhibitor Perceptions of First versus Second-Tier Cities
In order to examine potential differences in perceptions of destination attractiveness,
perceptions of exhibitors attending exhibitions in the first-tier city were compared with those
who exhibited in second-tier cities (Table 5). Independent sample t-tests showed that there were
significant differences in terms of cluster 1 (leadership of host city in the industry), economic
standing of the destination and leisure environment. Results indicate that Shanghai rated
significantly higher in terms of economic standing and cluster effect 1 than second-tier cities
(Hangzhou, Nanjing and Wuhan), in line with their actual economic development. Interestingly,
Shanghai’s leisure environment was rated lower than that of the second-tier cities, with Nanjing
and Hangzhou in particular being famous tourist destinations. Furthermore, there was no
significant difference in terms of venue facilities, destination as a source of exhibitors and
accessibility, indicating that second-tier cities are perceived as having as good venue facilities
and accessibility as the first-tier city.
INSERT TABLE 5 ABOUT HERE
CONCLUSIONS
This research empirically tested dimensions of exhibition destination attractiveness in the
Mainland China context from the perspective of exhibitors. It confirmed that destination
attractiveness is a higher-order construct composed of six factors: 1) cluster effect 1 (host city
leadership in the industry), 2) venue facilities, 3) cluster effect 2 (host city/region as a source of
exhibitors), 4) destination leisure environment, 5) destination economic environment and 6)
accessibility.
Accessibility and a destination’s economic and leisure environments had a significant
impact on exhibition destination attractiveness, albeit to a lesser extent than cluster effects and
venue facilities. Economic environment was measured by strong economic conditions and the
14
presence of a large number of international firms. This is in line with previous studies that stress
the importance of economic standing of an exhibition destination (e.g., Fuchslocher, 2005;
Rubalcaba-Bermejo & Cuadrado-Roura, 1995). Regarding destination leisure environment,
findings of this research support previous studies positing that exhibitors and visitors typically
prefer cities with pleasant environments (e.g., Jin, Bauer & Weber, 2010). Compared to German
destinations for exhibitions, China’s second and third-tier cities lack both international prestige
and a history of hosting exhibitions. Thus, cities with a better leisure environment with regard to
safety, cleanliness, tourist facilities and openness should be more competitive in developing the
exhibition industry in their locality. Accessibility, measured by ease of access to the city,
location and ease of getting information on the city was perceived as important, lending support
to similar findings in previous studies on convention site selection and exhibition center success
factors (e.g., Crouch & Louviere, 2004; Hiller, 1995; Rubalcaba-Bermejo & Cuadrado-Roura
1995). However, the most important constituents of destination attractiveness were cluster
effects.
Two dimensions for the cluster effect were established: 1) host city leadership in the
industry and 2) host city/region as a source of exhibitors. Cluster effects result in distinct
differences for exhibition destinations versus convention or tourism destinations. ‘Host city
leadership in the industry’ was manifested in a host city being an important distribution hub of a
specific industry sector, having support from related industries and a strong professional industry
association. It had the greatest impact on exhibition destination attractiveness, closely followed
by the ‘Host city/region being a source for exhibitors.’ Exhibitors are aware of and prefer host
destinations with cluster effects that have developed over time, thus, supporting arguments that
the maturity of an industry in a destination is important to the cultivation of exhibitions for a
specific industry sector (Butler, Bassiouni, El-Adly & Widjaja, 2007; Chan, 2005), and that
exhibitions mirror economic and industry developments (e.g., Kirchgeorg, 2005). It also provides
evidence that the development of China’s exhibition industry is similar to that in Germany where
exhibitions gained strength as a result of cluster effects, both past and current (Brenner &
Gildner, 2006). It is likely to prove very difficult to start an exhibition in a city in China without
any of the cluster advantages. This is in marked contrast to exhibitions developed in, for example,
15
Las Vegas, where exhibition development is based on available space, professional operation and
touristic value (Sanders, 2002) rather than any cluster effects.
This research provides practitioners and policy makers with a means of assessing and
enhancing the competitiveness of their destination. It identified the various destination business
factors; it also confirmed that destination business factors have a greater impact than leisure
factors on exhibition destination attractiveness. Since destinations are able to directly compete on
the basis of business-related factors (Enright & Newton, 2005), this finding offers a direction for
destinations to develop and enhance their competitiveness in the exhibition sector.
Destinations that possess leadership in a particular industry, have good venue facilities
and accommodation options, are accessible and located near the manufacturing base for the
exhibited products are likely to be more attractive to both organizers and exhibitors. Thus,
gateway cities and leading regional cities, which have strong financial support to build venue
facilities, ease of access and a variety of quality accommodation, are likely to be more
competitive as exhibition destinations. However, this is not to say that smaller cities are
automatically excluded from developing successful exhibitions, as the ability to locate or
relocate an exhibition not only depends on destination attractiveness dimensions but also on the
professionalism of organizers, their effort and determination, and support gained from industry
associations, local government and venues.
Indeed, second-tier cities were found to possess the necessary resources to host large-
scale exhibitions. However, they are not as competitive as benchmark cities due to the absence of
leadership of the city in the industry and a less favorable business environment. Hence, premier
exhibitions may still be located in first-tier cities, yet destination decentralization is possible in
that regional flagship exhibitions in different growth regions will increase in number and
significance. Thus, relocating exhibitions to destinations with market demand but less advanced
venue facilities and destination amenities appears viable, and well-developed and managed
exhibition centers in second-tier cities will have good opportunities to attract exhibitions.
Decentralization of destinations should be in the interest of exhibitors as they could have easier
access to regional markets and enhance their regional presence (Tan, Hock & Piaw, 2004). As
16
decentralization is a worldwide trend, the findings of this research may also have implications
for other second-tier cities around the world.
The exhibition destination attractiveness dimensions developed in this study may be
adopted to rate the attractiveness of other destinations, especially emerging markets possessing
similar market and destination conditions to those of the first and second-tier cities sampled in
this research. First, measurements of these dimensions possess a high level of universality.
Second, there is a trend of exhibitions moving from traditional markets such as Europe and North
America to Asia, and within Asia moving from a few gateway cities to second-tier cities (Beier
& Damböck, 2008). Asia experienced the highest rate of growth in venue space from 2006 to
2010 (25%), compared to Europe (10%), North America (7%) and the Middle East (18%) (Beier
& Damböck, 2008). China is the largest emerging market and leads Asia’s exhibition industry
development. Considering the decentralization of exhibitions and destinations, it should be
possible to generalize the findings of this study, with the requisite caution, to other countries,
especially developing countries in Asia and the Middle East where the exhibition industry is
advancing fast.
Finally, the study findings indicate that exhibition destination attractiveness is different
from convention destination attractiveness, primarily for the importance of factors such as the
cluster effect (leadership of the city in the industry and the host city as a source of exhibitors)
and economic environment. Thus, in future research on site selection a clear distinction has to be
made between exhibitions and conventions rather than approaching the subject from a more
general MICE segment perspective.
Study Limitations and Future Research Directions
This study has arbitrary boundaries and limitations. First, this study focuses on location-
fixed, trade-to-trade exhibitions with a variety of topics, scopes and scales of importance.
Findings from this research may not be transferable to trade-to-consumer exhibitions or location-
mobile exhibitions. Second, this study examines exhibitions at international and national levels
which were hosted in first and second-tier cities in Mainland China. There are special conditions
present in this exhibition setting that may not readily be found in exhibitions hosted in other

17
destinations. Thus, caution shall be taken when generalizing the findings to other exhibition
settings. Third, this study deals with dimensions and perceptional differences of exhibition
destination attractiveness. However, the impact of this construct on other variables has not been
explored and presents a fruitful area for future research. More specifically, the impact of
exhibition destination attractiveness on customer loyalty, behavioral intentions and exhibition
brand preference may be explored. This can empirically demonstrate if and to what extent this
construct is important in the broader exhibition context. Furthermore, exhibition destination
attractiveness from the visitors’ perspective may be investigated, given the focus of the current
study on the exhibitors’ perspective. This would provide a more comprehensive assessment of
the construct and determine whether perceptual differences exist between these two key players
who drive exhibition demand. Finally, factors beyond exhibition destination attractiveness may
be explored to better understand the decision-making process of both exhibitors and visitors to
attend a particular exhibition among a range of alternatives.
REFERENCES
Bagozzi, R. P., & Yi, Y. (1988). On the evaluation of structural equation models. Journal of the
Academy of Marketing Science, 16(1), 74-94.
Baloglu, S., & Love, C. (2005). Association meeting planners' perceptions and intentions for five
major US convention cities: the structured and unstructured images. Tourism
Management, 26(5), 743-752.
Beier, J., & Damböck, S. (2008). The role of exhibitions in the marketing mix. The Global
Association of the Exhibition Industry. Retrieved from
http://www.ufi.org/Medias/pdf/ufiactivities/education/UFI_education.pdf
Blythe, J., (1999). Visitor and exhibitor expectations and outcomes at trade exhibitions.
Marketing Intelligence & Planning, 17(2), 100-108.
Brenner, T., & Gildner, A. (2006). The long-term implications of local industrial clusters.
European Planning Studies, 14(9), 1315-1328.
Butler, C., Bassiouni, Y., El-Adly, M., & Widjaja, A. (2007). Revamping the value chain in
exhibition facilities: the case of the Dubai exhibition industry. Facilities, 25(11/12), 419-
436.
Chacko, H. E., & Fenich, G. G. (2000). Determining the importance of US convention
destination attributes. Journal of Vacation Marketing, 6(3), 211-220.
Chan, C. (2005). Exhibition theory and practice. Shenzhen: Haitian publications.
Chan, C. (2008). On spatial distribution of China’s exhibitions. China Exhibition. Retrieved
August 20, 2008, from: http://www.cnki.net
Chapman, D., & Carter, J. (1979). Translation procedures for the cross cultural use of
measurement instruments. Educational Evaluation and Policy Analysis, 1(3), 71-76.
Chaudhuri, A., & Holbrook, M. B. (2001). The chain of effects from brand trust and brand affect
to brand performance: The role of brand loyalty. Journal of Marketing, 65(2), 81–93.
Chi, C. G., & Qu, H. (2008). Examining the structural relationships of destination image, tourist
satisfaction and destination loyalty: An integrated approach. Tourism Management, 29(4),
624-636.
Churchill, G. A. (1979). A paradigm for developing better measures of marketing constructs.
Journal of Marketing Research, 16(1), 64-73.
Crouch, G. I., & Louviere, J. J. (2004). The determinants of convention site selection: A logistic
choice model from experimental data. Journal of Travel Research, 43(2), 118-130.
Crouch, G. I., & Ritchie, J. (1998). Convention site selection research: A review, conceptual
model, and propositional framework. Journal of Convention & Exhibition Management,
1(1), 49-69.
Diamantopoulos, A., & Siguaw, J. A. (2000). Introducing LISREL: a guide for the uninitiated.
London, SAGE.
Enright, M.J. (2003). Regional clusters: What we know and what we should know. In Bröcker, J.,
Dohse, D., & Soltwedel, R. (Ed.). Innovation clusters and interregional competition.
Berlin, Springer.
Enright, M. J., & Newton, J. (2005). Determinants of tourism destination competitiveness in Asia
Pacific: Comprehensiveness and universality. Journal of Travel Research, 43(4), 339-
350.
Fenich., G. (2001). Towards a conceptual framework for assessing community attractiveness for
conventions. Journal of Convention & Exhibition Management, 3(1), 45-64.
Field, A. (2005). Discovering statistics using SPSS (2nd ed.). London: Sage Publications.
Fuchslocher, H. (2005). Analysis of exhibitors – an instrument of fair controlling. In Kirchgeorg,
M., Giese, W., & Dornscheidt, W. (Eds.). Trade show management: planning,
implementing and controlling of trade shows, conventions and events (pp.287-303).
Wiesbaden, Gabler Verlag.
Getz, D. (2008). Event tourism: Definition, evolution, and research. Tourism Management, 29(3),
403-428.
Go, F., & Zhang, W. (1997). Applying importance-performance analysis to Beijing as an
international meeting destination. Journal of Tourism Research, Spring, 42–49.
Godar, S. H., & O'Connor, P. J. (2001). Same time next year -- Buyer trade show motives.
Industrial Marketing Management, 30(1), 77-86.
Gordon, I. R., & McCann, P. (2000). Industrial clusters: complexes, agglomeration and/or social
networks? Urban studies, 37(3), 513–532.
Guo, J. (2007). The report on development of China's convention & exhibition economy 2006-
2007. Beijing: Social Sciences Academic Press.
Hair, J. F., Anderson, R. E., Tatham, R. L., & Black, W. C. (2006). Multivariate analysis (6th
ed.). Englewood, NJ: Prentice Hall
Hedorfer, P. & Todter, N. (2005). The importance of trade fairs and conferences to the German
venue. In Kirchgeorg, M., Giese, W., & Dornscheidt, W. (Ed.). Trade show management:
planning, implementing and controlling of trade shows, conventions and events (pp. 117-
127). Wiesbaden, Gabler Verlag.
Hiller, H. (1995). Conventions as mega-events. A new model for host-host city relationships.
Tourism Management, 16(5), 375-379.
Holz, C. A. (2008). China's Economic Growth 1978-2025: What we know today about China's
economic growth tomorrow. World Development, 36(10), 1665-1691.
Jago, L. & Deery, M (2010). Delivering Innovation, Knowledge and Performance: The Role of
Business Events. Business Events Council of Australia. Sydney.
Jin, X. (2010). Exhibition Brand Preference in Mainland China: The role of relationship quality
and destination attractiveness. Unpublished Doctoral Dissertation. The Hong Kong
Polytechnic University. Hong Kong, China.
Jin, X., Bauer, T. & Weber, K. (2010). China’s second-tier cities as exhibition destinations.
International Journal of Contemporary Hospitality Management, 22(4), 552 - 571.
Jin, X., Weber, K., & Bauer, T. (2010). The state of the exhibition industry in China. Journal of
Convention & Event Tourism, 11(1), 2-17.
Jung, M. (2005). Determinants of exhibition service quality as perceived by attendees. Journal of
Convention & Event Tourism, 7(3/4), 85-98.
Kay, A. (2007). International exhibition organizers in China and their performance. Doctoral
Dissertation. The Hong Kong Polytechnic University.
Kirchgeorg, M. (2005). Characteristics and forms of trade shows. In Kirchgeorg, M., Giese, W.,
& Dornscheidt, W. (Ed.). Trade show management: planning, implementing and
controlling of trade shows, conventions and events (pp. 33-56). Wiesbaden, Gabler
Verlag.
Lee, J., & Back, K. (2008). Attendee-based brand equity. Tourism Management, 29(2), 331-344.
Lee, M. J., & Back, K. (2005). A review of convention and meeting management research 1990-
2003: Identification of statistical methods and subject areas. Journal of Convention &
Event Tourism, 7(2), 1-20.
Lin, C., Morais, D. B., Kerstetter, D. L., & Hou, J. (2007). Examining the role of cognitive and
affective image in predicting choice across natural, developed, and theme-park
destinations. Journal of Travel Research, 46(2), 183 -194.
Luo, Q. (2007). Trade show operation models: Characteristics, process, and effectiveness --
cases from Dongguan. Journal of China Tourism Research, 3(3/4), 478-508.
McCabe, V. S. (2008). Strategies for career planning and development in the Convention and
Exhibition industry in Australia. International Journal of Hospitality Management, 27(2),
222-231.
Marshall, A., (1966) Principles of economics. London: Macmillan.
Maskell, P. (2001). Towards a knowledge-based theory of the geographical cluster. Industrial
and Corporate Change, 10(4), 921-944.
Nelson, R., & Rys., S. (2000). Convention site selection criteria relevant to secondary convention
destinations. Journal of Convention & Exhibition Management, 2(2-3), 71-82
Oppermann, M. (1996). Convention destination images: analysis of association meeting planners'
perceptions. Tourism Management, 17(3), 175-182.
Porter, M., (1998). On competition. Boston : Harvard Business School.
Reed. (2007). Exhibition spending hits $10 billion in 2006. Retrieved February 20, 2008, from:
http://www.reedexpo.com.cn/en/News/ShowInfo.aspx?ID=540 (accessed 20th Feb, 2008)
Rubalcaba-Bermejo, L., & Cuadrado-Roura, J. R. (1995). Urban hierarchies and territorial
competition in Europe: Exploring the role of fairs and exhibitions. Urban Studies, 32(2),
379 -400.
Sasserath, M., Wenhart, C., & Daly, N. (2005). The impact of brand management on trade fairs.
In Kirchgeorg, M., Giese, W., & Dornscheidt, W. (Ed.). Trade show management:
planning, implementing and controlling of trade shows, conventions and events (pp.445-).
Wiesbaden, Gabler Verlag.
Sanders, H. (2002). Convention Myths and Markets: A critical review of convention center
feasibility studies. Economic Development Quarterly, 16(3), 195-210.
Smith, Hama, & Smith. (2003). The effect of successful trade show attendance on future show
interest: exploring Japanese attendee perspectives of domestic and offshore international
events. Journal of Business & Industrial Marketing, 18(4/5), 403-418.
Tan, D., Hock, M. G., & Piaw, T. C. (2004). An introspective look at the exhibition industry in
Singapore. National University of Singapore, 7(6), 1–32.
UFI. (2007).The world map of exhibition venues and future trends. Retrieved February 10, 2008,
from:www.ufinet.org/media/publicationspress/2007_ufi_world_map_of_exhibition_venu
es.pdf.
Weber, K., & Chon, K. (2002). Convention Tourism. The Haworth Hospitality Press.
Weber, K. & Ladkin, A. (2011). Career Identity and its Relation to Career Anchors and Career
Satisfaction: The Case of Convention and Exhibition Industry Professionals in Asia. Asia
Pacific Journal of Tourism Research, 16 (2), 167-182.
Wolfe, D.A., & Gertler, M.S. (2004). Clusters from the Inside and Out: Local Dynamics and
Global Linkages. Urban Studies, 41(5-6), 1071-1093
Yoo, J., & Weber, K. (2005). Progress in Convention Tourism Research. Journal of Hospitality
& Tourism Research, 29(2), 194 -222.
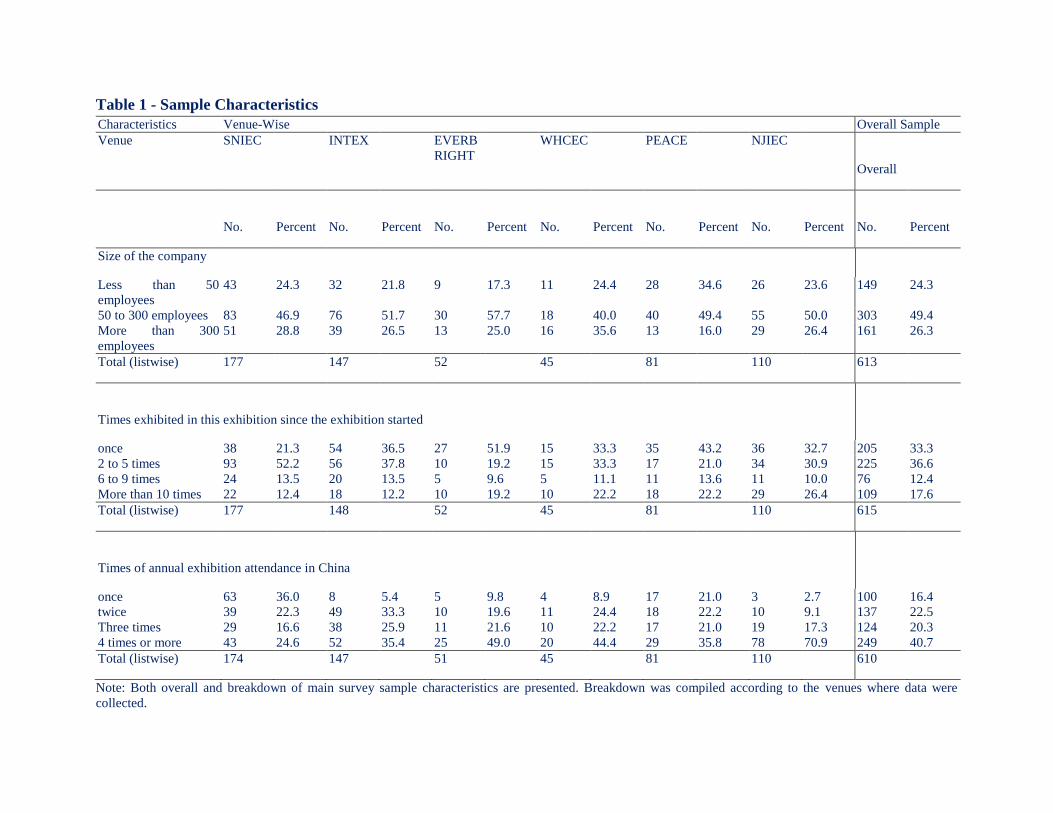
Table 1 - Sample Characteristics
Characteristics Venue-Wise Overall Sample
Venue SNIEC
INTEX
EVERB
RIGHT WHCEC
PEACE
NJIEC
Overall
No. Percent No. Percent No. Percent No. Percent No. Percent No. Percent No. Percent
Size of the company
Less than 50
employees
43 24.3 32 21.8 9 17.3 11 24.4 28 34.6 26 23.6 149 24.3
50 to 300 employees 83 46.9 76 51.7 30 57.7 18 40.0 40 49.4 55 50.0 303 49.4
More than 300
employees
51 28.8 39 26.5 13 25.0 16 35.6 13 16.0 29 26.4 161 26.3
Total (listwise) 177
147
52
45
81
110
613
Times exhibited in this exhibition since the exhibition started
once 38 21.3 54 36.5 27 51.9 15 33.3 35 43.2 36 32.7 205 33.3
2 to 5 times 93 52.2 56 37.8 10 19.2 15 33.3 17 21.0 34 30.9 225 36.6
6 to 9 times 24 13.5 20 13.5 5 9.6 5 11.1 11 13.6 11 10.0 76 12.4
More than 10 times 22 12.4 18 12.2 10 19.2 10 22.2 18 22.2 29 26.4 109 17.6
Total (listwise) 177
148
52
45
81
110
615
Times of annual exhibition attendance in China
once 63 36.0 8 5.4 5 9.8 4 8.9 17 21.0 3 2.7 100 16.4
twice 39 22.3 49 33.3 10 19.6 11 24.4 18 22.2 10 9.1 137 22.5
Three times 29 16.6 38 25.9 11 21.6 10 22.2 17 21.0 19 17.3 124 20.3
4 times or more 43 24.6 52 35.4 25 49.0 20 44.4 29 35.8 78 70.9 249 40.7
Total (listwise) 174
147
51
45
81
110
610
Note: Both overall and breakdown of main survey sample characteristics are presented. Breakdown was compiled according to the venues where data were
collected.
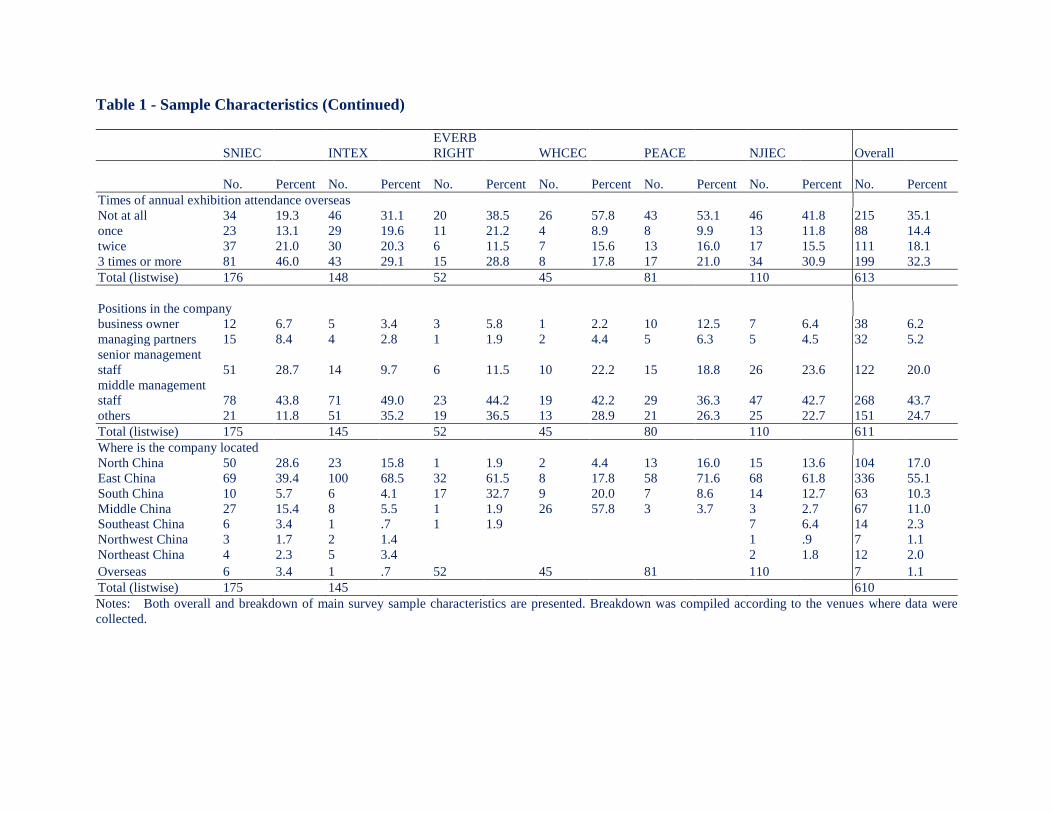
Table 1 - Sample Characteristics (Continued)
SNIEC INTEX
EVERB
RIGHT WHCEC PEACE NJIEC
Overall
No. Percent No. Percent No. Percent No. Percent No. Percent No. Percent No. Percent
Times of annual exhibition attendance overseas
Not at all 34 19.3 46 31.1 20 38.5 26 57.8 43 53.1 46 41.8 215 35.1
once 23 13.1 29 19.6 11 21.2 4 8.9 8 9.9 13 11.8 88 14.4
twice 37 21.0 30 20.3 6 11.5 7 15.6 13 16.0 17 15.5 111 18.1
3 times or more 81 46.0 43 29.1 15 28.8 8 17.8 17 21.0 34 30.9 199 32.3
Total (listwise) 176 148 52 45 81 110 613
Positions in the company
business owner 12 6.7 5 3.4 3 5.8 1 2.2 10 12.5 7 6.4 38 6.2
managing partners 15 8.4 4 2.8 1 1.9 2 4.4 5 6.3 5 4.5 32 5.2
senior management
staff 51 28.7 14 9.7 6 11.5 10 22.2 15 18.8 26 23.6 122 20.0
middle management
staff 78 43.8 71 49.0 23 44.2 19 42.2 29 36.3 47 42.7 268 43.7
others 21 11.8 51 35.2 19 36.5 13 28.9 21 26.3 25 22.7 151 24.7
Total (listwise) 175 145 52 45 80 110 611
Where is the company located
North China 50 28.6 23 15.8 1 1.9 2 4.4 13 16.0 15 13.6 104 17.0
East China 69 39.4 100 68.5 32 61.5 8 17.8 58 71.6 68 61.8 336 55.1
South China 10 5.7 6 4.1 17 32.7 9 20.0 7 8.6 14 12.7 63 10.3
Middle China 27 15.4 8 5.5 1 1.9 26 57.8 3 3.7 3 2.7 67 11.0
Southeast China 6 3.4 1 .7 1 1.9 7 6.4 14 2.3
Northwest China 3 1.7 2 1.4 1 .9 7 1.1
Northeast China 4 2.3 5 3.4 2 1.8 12 2.0
Overseas 6 3.4 1 .7 52 45 81 110 7 1.1
Total (listwise) 175 145 610
Notes: Both overall and breakdown of main survey sample characteristics are presented. Breakdown was compiled according to the venues where data were
collected.
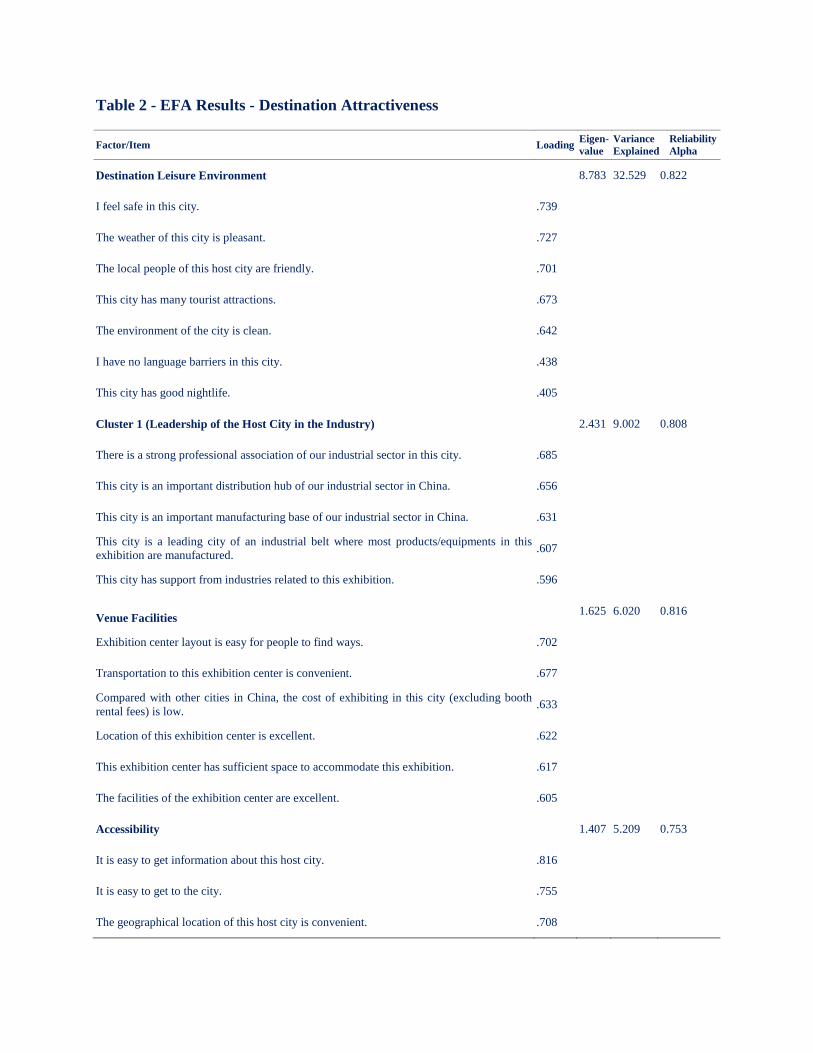
Table 2 - EFA Results - Destination Attractiveness
Factor/Item Loading Eigen-
value
Variance
Explained
Reliability
Alpha
Destination Leisure Environment
8.783 32.529 0.822
I feel safe in this city. .739
The weather of this city is pleasant. .727
The local people of this host city are friendly. .701
This city has many tourist attractions. .673
The environment of the city is clean. .642
I have no language barriers in this city. .438
This city has good nightlife. .405
Cluster 1 (Leadership of the Host City in the Industry)
2.431 9.002 0.808
There is a strong professional association of our industrial sector in this city. .685
This city is an important distribution hub of our industrial sector in China. .656
This city is an important manufacturing base of our industrial sector in China. .631
This city is a leading city of an industrial belt where most products/equipments in this
exhibition are manufactured. .607
This city has support from industries related to this exhibition. .596
Venue Facilities 1.625 6.020 0.816
Exhibition center layout is easy for people to find ways. .702
Transportation to this exhibition center is convenient. .677
Compared with other cities in China, the cost of exhibiting in this city (excluding booth
rental fees) is low. .633
Location of this exhibition center is excellent. .622
This exhibition center has sufficient space to accommodate this exhibition. .617
The facilities of the exhibition center are excellent. .605
Accessibility
1.407 5.209 0.753
It is easy to get information about this host city. .816
It is easy to get to the city. .755
The geographical location of this host city is convenient. .708

Cluster 2 (Host City/Region as a Source of Exhibitors)
1.212 4.491 0.716
China’s manufacturing firms in our industry are especially located in this city or nearby
regions. .655
Most suppliers in this exhibition are located in this city or nearby regions. .618
Most distributors of the products/equipments exhibited come from this city or nearby
regions. .611
Destination Economic Environment
1.121 4.151 0.721
The overall economic condition of this city is among the top five in China. .847
This city has a large number of international firms. .708
N=294, KMO = 0.886;
Bartlett's Test of Sphericity: Approx. Chi-Square=2964.900, df=351, Sig.=.000;
Total variance explained = 61.403;
Rotation Method: Varimax with Kaiser Normalization. Rotation converged in 8 iterations.
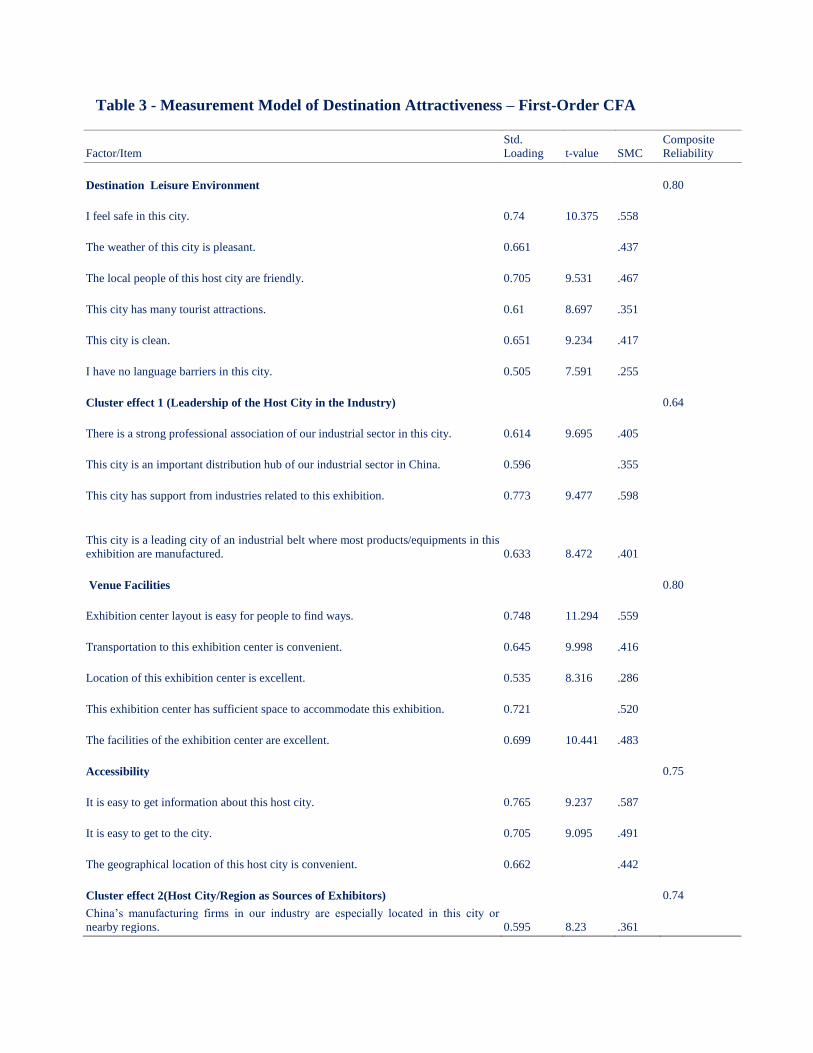
Table 3 - Measurement Model of Destination Attractiveness – First-Order CFA
Factor/Item
Std.
Loading t-value SMC
Composite
Reliability
Destination Leisure Environment 0.80
I feel safe in this city. 0.74 10.375 .558
The weather of this city is pleasant. 0.661 .437
The local people of this host city are friendly. 0.705 9.531 .467
This city has many tourist attractions. 0.61 8.697 .351
This city is clean. 0.651 9.234 .417
I have no language barriers in this city. 0.505 7.591 .255
Cluster effect 1 (Leadership of the Host City in the Industry) 0.64
There is a strong professional association of our industrial sector in this city. 0.614 9.695 .405
This city is an important distribution hub of our industrial sector in China. 0.596 .355
This city has support from industries related to this exhibition. 0.773 9.477 .598
This city is a leading city of an industrial belt where most products/equipments in this
exhibition are manufactured. 0.633 8.472 .401
Venue Facilities 0.80
Exhibition center layout is easy for people to find ways. 0.748 11.294 .559
Transportation to this exhibition center is convenient. 0.645 9.998 .416
Location of this exhibition center is excellent. 0.535 8.316 .286
This exhibition center has sufficient space to accommodate this exhibition. 0.721 .520
The facilities of the exhibition center are excellent. 0.699 10.441 .483
Accessibility 0.75
It is easy to get information about this host city. 0.765 9.237 .587
It is easy to get to the city. 0.705 9.095 .491
The geographical location of this host city is convenient. 0.662 .442
Cluster effect 2(Host City/Region as Sources of Exhibitors) 0.74
China’s manufacturing firms in our industry are especially located in this city or
nearby regions. 0.595 8.23 .361
Most suppliers in this exhibition are located in this city or nearby regions. 0.714 .517
Most distributors of the products/equipments exhibited come from this city or nearby
regions. 0.781 10.617 .593
Economic Environment 0.75
The overall economic condition of this city is among the top five in China. 0.657 8.627 .441
This city has a large number of international firms. 0.881 na .747
χ² = 435.279, df=211, p<0.001, χ²/df=2.063,GFI=.886, CFI=.914, RMSEA=0.060,
n=293.
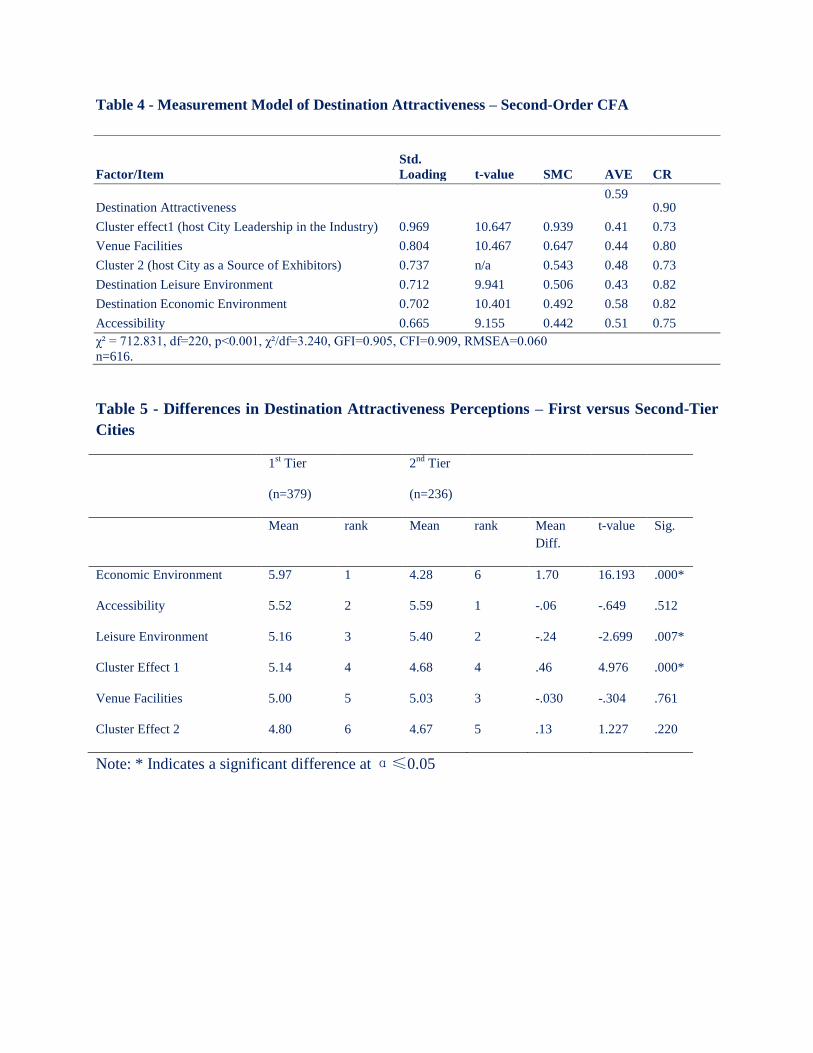
Table 4 - Measurement Model of Destination Attractiveness – Second-Order CFA
Factor/Item
Std.
Loading t-value SMC
AVE CR
Destination Attractiveness 0.59
0.90
Cluster effect1 (host City Leadership in the Industry) 0.969 10.647 0.939 0.41 0.73
Venue Facilities 0.804 10.467 0.647 0.44 0.80
Cluster 2 (host City as a Source of Exhibitors) 0.737 n/a 0.543 0.48 0.73
Destination Leisure Environment 0.712 9.941 0.506 0.43 0.82
Destination Economic Environment 0.702 10.401 0.492 0.58 0.82
Accessibility 0.665 9.155 0.442 0.51 0.75
χ² = 712.831, df=220, p<0.001, χ²/df=3.240, GFI=0.905, CFI=0.909, RMSEA=0.060
n=616.
Table 5 - Differences in Destination Attractiveness Perceptions – First versus Second-Tier
Cities
1
st Tier
(n=379)
2
nd Tier
(n=236)
Mean rank Mean rank Mean
Diff.
t-value Sig.
Economic Environment 5.97 1 4.28 6 1.70 16.193 .000*
Accessibility 5.52 2 5.59 1 -.06 -.649 .512
Leisure Environment 5.16 3 5.40 2 -.24 -2.699 .007*
Cluster Effect 1 5.14 4 4.68 4 .46 4.976 .000*
Venue Facilities 5.00 5 5.03 3 -.030 -.304 .761
Cluster Effect 2 4.80 6 4.67 5 .13 1.227 .220
Note: * Indicates a significant difference at α≤0.05