dipartimento di scienze economiche e metodi matematici … · 2014-10-01 · vito amendolagine,...
TRANSCRIPT

Università degli Studi di BariDipartimento di Scienze Economiche e Metodi
Matematici
Southern Europe Research in Economic StudiesS.E.R.I.E.S.
SERIES e MATEF sono pubblicati a cura del Dipartimento di Scienzeeconomiche dell'Università degli Studi di Bari.I lavori riflettono esclusivamente le opinioni degli autori e nonimpegnano la responsabilità del Dipartimento.SERIES e MATEF vogliono promuovere la circolazione di studi ancorapreliminari e incompleti, per suscitare commenti critici esuggerimenti.Si richiede di tener conto della natura provvisoria dei lavori pereventuali citazioni o per ogni altro uso.
SERIES and MATEF are published under the auspices of theDepartment of Economics of the University of Bari.Any opinions expressed here are those of the authors and notthose of the Department.Often SERIES and MATEF divulge preliminary or incomplete work,circulated to favor discussion and comment.Citation and use of these paper should consider their provisionalcharacter.
WORKING PAPER NO.
Vito Amendolagine, Rosa Capolupo and Nadia Petragallo
Export Status and Performance in a Panel of ItalianManufacturing Firms
0027

1
Export Status and Performance in a Panel of Italian Manufacturing Firms
Vito Amendolagine, Rosa Capolupo*, Nadia Petragallo
Università d Bari, Dipartimento di Scienze economiche
Abstract
Following a growing literature we test, in this paper, the two alternative hypotheses of self selection and learning by exporting across different Italian manufacturing firms. Using matched sampling techniques, we estimate whether new export-oriented firms are more efficient than domestically-oriented firms on the basis of three Italian representative Surveys of manufacturing firms covering consecutive triennial periods (1995-2003). Our findings indicate that export entrants improve their productivity in the first period after entry. This occurs for both total factor productivity (TFP) and labour productivity growth rates. These results are consistent with those found in the existing literature for many countries. The only lasting significant effect that we find among the different measures of performances is that new exporters earn higher profits than their domestic counterparts.
Keywords: international trade, Export-led growth, productivity, matched techniques JEL Classification: F11, F14, O12, C22 * Corresponding author: Rosa Capolupo, email: [email protected]
Acknowledgement: the authors wish to thank participants at the CNR Meeting in International Economics and Development of the Italy Trade Research Group, held in Lecce (University of Salento) the 22 and 23 of May 2008 for their helpful comments and suggestions. The usual disclaimer applies.

2
Introduction
The literature on the relationship between productivity growth and international trade
is very large and has seen a renewed impulse in recent years with the appearance of models
of endogenous growth, which suggest that economies benefit from their international
openness through enhanced income growth. According to this literature the interaction of
country openness and growth comes mainly through technology diffusions and spillovers
generated by improvement in knowledge in trade-partner countries. The access through
international trade to a wide variety of intermediate goods and new final products helps
increase productivity and fosters economic growth (Grossman and Helpman [1991]) The
macroeconomic empirical results, however, are contentious and the econometric link has
proved to be not always robust. The alternative to test the prediction that exports enhance
productivity growth has been the shift from macro to microeconomic evidence at plant or
firm levels. The perspective for single firms of going in international markets is in
accordance with endogenous growth theoretical predictions: exporting firms, being
exposed to new knowledge and technology in the global market, could take advantage
from this exposure through substantial learning processes that may improve their
performances.
On this ground, there is a large body of empirical evidence − known as “the
microeconomics of international firm activity (Wagner, 2008, p. 591) − that show a
positive correlation between firm productivity and export propensity. However, also in this
context, no firm conclusions have been achieved either on the learning mechanism that
occurs after engaging in trade or on the long-lived effects of learning by exporting. The
most obvious productivity channels highlighted in this literature are akin to the ones
identified in the macro–growth studies (technology transfer, more intense competition and
scale effects), though the specific mechanisms that boost productivity may differ across

3
firms and sectors. In particular, firms entering into the export market gain new knowledge
and technical practice from their competitors. Likewise, customers and demand conditions
may lead to improved firm productivity as firms are forced to conform to higher standard
of quality (De Loecker [2007]). On the theoretical ground these arguments have been
referred to as the learning by exporting hypothesis (LBEH, henceforth).
However, the positive association between exports and productivity is compatible
also with an alternative prediction suggested in the literature on international trade with
heterogeneous firms. It is argued that the casual link between exporting and productivity is
driven by self selection of the most productive firms, which to enter the export market have
to cope with a range of extra fixed (sunk) and variable costs. In the most recent theoretical
models, the common finding is that in equilibrium more efficient firms select into
exporting while the less efficient serve only the internal market (Bernard et al. [2003], Das
et al. [2001], Melitz [2003]). Therefore, the productivity-increase precedes firm’s entry
into the export market.
In light of the arguments above, and although both mechanisms are likely, empirical
studies have been more supportive of the self selection hypothesis (Roberts and Tybout
[1997], Lach and Tybout [1998], Clerides et al. [1998], Bernard and Jensen [1999, 2004],
Greenaway et al. [2005], Delgado et al. [2002], Greenaway and Kneller [2007b, 2008],
SGEP [2008]). To a lesser extent, there are studies that do find evidence consistent with
the LBEH according to which firms improve productivity dynamics after they start
exporting either in developing or developed countries [Kraay [1999], Girma et al [2004],
Baldwin and Gu [2003] Isgut and Fernandes [2007], Farinas and Marcos (2007), Crespi et
al. [2008], Serti and Tomasi [2008]) 1. The conventional approach to test the hypothesis is
to analyse firm’s performance measures such as labour productivity, total factor 1 Exhaustive reviews of the evidence on both the two hypotheses are Wagner (2007), Greenaway and Kneller (2007a).

4
productivity, average costs and the like. By summarising the empirical literature reviewed
by Wagner (2007), among the 54 studies covering 34 countries, the causal link from
exporting to productivity (LBEH) has been confirmed in almost 26 studies2.
The purpose of this work is to examine to what extent Italian firms learn from
exporting and if this process is long-lived. Italy serves as an interesting case study for the
significant number of exporters and the high average export intensity of its manufacturing
firms.
Evidence on LBEH is already available for Italy but it is still a few. For Germany,
for example, the LBEH has been tested seven times, for UK eight times and, to a lesser
extent, the same has happened for many other countries (Spain, USA, Japan, and Taiwan).
For Italy, the paper most cited in the literature is that of Castellani (2002). The author
uses cross section econometrics and distinguishes between export status of the firm and
export intensity, measured by the share of export to total sales. By using the latter measure,
the main outcome of the paper is that the process of learning exists for firms with high
export intensity and is associated with an improvement in the level of productivity but not
in its growth rate.
Our results do not contrast with this previous finding but identifies a growth
productivity effect for exporters independently from their export intensity. By further
exploring the linkage between export status and ex-post productivity, our work offers some
advantages. Firstly, by using up-to-date waves of the same data set, that cover three
subsequent periods relative to Castellani’s paper, enables us to individuate and to follow
through a longer time span the performance of firms that enter into the export market for
2 The studies that found LBE effects should be distinguished by country and years analysed, level or growth effects after entry, duration of such effects. However LBE effects have been found for USA, some European countries excluded Germany, most Asian countries (Taiwan, Korea and Japan, Latin America Countries, transition economies (Slovenia) some African Countries. For details see Wagner (2007) and the more recent meta analysis of Martin et al. (2009).

5
the first time3. Secondly, we apply matching techniques which allow us to detect the causal
effect between entrance in the export market and firm productivity4. Since from the
literature we know that exporting firms perform better than non-exporters, a better
understanding of the process can be obtained if we look at switching firms, that is those
firms that become new exporters. Thirdly, we investigate additional economic performance
differences by assessing the impact of exporting not only on productivity but also on gross
firm profits per employee. As evidenced by Das et al (2007), a firm may benefit from its
export activity by increasing export profits rather than by achieving higher productivity.
We use firm level data to compare productivity and profitability measures across new
exporters and non-exporters and consistently find that the former out-perform the latter.
The remaining of the paper is organised as follows. In Section 2 we discuss the data
set by implementing some preliminary statistical analysis on the entire sample of firms.
The evidence includes estimation of export premia, after controlling for some firm
characteristics. In Section 3 we outline the econometric framework and the estimation
procedures. As said at the outset, we use sample-matching techniques to test the learning-
by-exporting hypothesis. In section 4 we report our main findings. Our evidence is that
exporting firms become more productive in the first period they have started exporting but
the effect disappears in the second period. The last section concludes.
2. Data Sources and Preliminary Analysis
Description of the Data set
The empirical investigation uses data collected in regular surveys by the banking
group Unicredit-Capitalia. Descriptive analysis of Italian firms in these surveys is
3 The paper by Castellani (2002) covers the first two waves of the same Survey (by Medio Credito Centrale, now Unicredit-Capitalia for the periods 1989-1991 and 1992-1994. Our paper covers the subsequent surveys from 1995 to 2003. 4 Indeed, also the recent work by Serti and Tomasi (2008) refers to Italian manufacturing and uses matching techniques. Their paper uses a different data set (from Istat) which covers the period 1989-1997.

6
widespread and discussed widely in many papers (see Castellani, 2002). The data set we
use is based on the latest three waves of the three-year survey on manufacturing firms that
covers the periods 1995-1997, 1998-2000, and 2001-2003. The data set covers all sectors
in the economy and reports, through stratified samples on geographical areas, industries,
and sectors, several characteristic of the selected unit surveyed, such as balance sheet
values at annual frequency (from 1995 to 2003), as well as indicators capturing size,
economic performance, physical capital, investment in physical capital and R&D, product
and process innovations, different internationalisation strategies, company organization,
etc. For exports the data set provides export intensity of the firms (percentage of exports on
total sales) and export status only for the last year of each survey5. Unfortunately, export
intensity is not available for the period 1998-2000 and, hence, our analysis focuses on
export participation only and its impact on productivity. The Appendix provides details on
data construction and deflation procedures adopted in the paper.
We omit observations reporting missing values for the variables used to estimate total
factor productivity (TFP) as well as observations, which reveal a missing or negative value
added for more than two years over each three-year-wave. The entire sample is composed
of almost 5000 firms and we chose those firms answering all survey waves. According to
the analysis performed the number of firms will vary as will be described in the subsequent
sections.
This section provides some basic descriptive evidence on performance differences
between exporting and non-exporting firms. Table 1 reports information on firm
characteristics in the different periods analysed.
5 In the internationalization part of the survey, firms answer at the following questions: 1) has the firm exported all or part of its output in the last year of the survey? 2) What is for each firm the percentage of its exports on total sales? Firms are asked to indicate the geographical area of destination in terms of percentage of exports on total sales. The nine geographical areas are: EU (15), New Entrants in the EU in 2004, Russia and other EU countries, Africa, Asia, China, Usa-Canada and Mexico, Latin America, Australia.

7
Table 1. - Descriptive statistics of export participation of Italian firms by period,
localization and sectors (%)
1995-1997 1998-2000 2001-2003 Number of total firms
4497 4680 4289
Share of exporters
71.49 67.34 74.72
Mean export intensity
38.53
Not available
40.08
Share of exporters By Pavitt sectors Traditional (%) Scale intensive Specialized Science based
40.89 25.02 29.29 1.54
50.59 14.83 28.98 5.60
48.91 14.69 31.36 3.91
By geographical areas: North-West North East Centre South
43.2 31.07 15.89 9.61
39.39 29.17 20.20 11.24
37.73 32.00 16.88 13.39
Source: Authors’ calculation from the Unicredit-Capitalia dataset. Figures refer to the whole sample.
There is a wide variation across sectors in the propensity for firm to export. Nearly
50% of firms in the traditional sector are engaged in exporting. It includes textiles,
wearing, leather products and footwear, wood products, etc. all pertaining to “Made in
Italy” landmark industries. As regarding firms distinguished by the other Pavitt sectors, it
grows the role of the specialized sectors (to which belongs the mechanical sector), while,
clearly, emerges the minor weight of the science-based sector, which is very distant from
the percentage of firms that pertains to the other sectors. However, we can notice that the
number of firms that have become exporters in the science based sector is more than
doubled in the period under analysis. Obviously, there is also a wide variation across
regions. Nearly 70% of the exporting firms are located in the North. However, from the
table, by comparing different periods, we can notice some timid changing in the

8
geographic structure of the Italian manufacturing sector. Besides the increased role of
exporting firms of the North Eastern regions, it is noteworthy the increase in the
percentage of firms of the Southern ones, even if they still remain at a low 13 % of total
exporters in our sample6.
If we compare the total sales and TFP kernel densities of exporters and non-exporters
for the three periods under analysis, it is straightforward to show that exporting firms
dominate non-exporters over these economic indicators (see Appendix C).
It is instructive, however, to visually examine in Figures 1, 2 and 3 distinguishing
trajectories of productivity among firms with different trade strategies of
internationalisation.
Figure 1. Labour productivity firm profiles with different export status (1998-2003)
∩
3540
4550
prod
1998 1999 2000 2001 2002 2003year
always neverstarters quitters
It is evident from the graph that, on average, currently exporters display a better
performance than non-exporters in labour productivity measured as the ratio of value
added over the number of employees. It has been constructed by considering firms that
6 For a detailed analysis on the structure and specialization of Italian exports through comparative advantages see De Benedictis (2005).

9
export in t and in t+s (always), firms that export in t and do not export in t+s (quitters),
firms that never exported (never) and, finally, firms that do not export in t and exports in
t+s. The same categories of firms are used to observe their performance with respect to
TFP. Figure 2 is very instructive since it reflects at the firm level what is already known at
sectoral and macro levels (Bassanetti et al. (2004)7.
Figure 2. TFP firm profiles with different export status 1995-2000
While from 1995 to 1998 TFP grows, although with different slopes for selected
units in the various waves of the Survey, from 1999-2000 TFP starts to decline and fell
considerably in the period 2000-2003. Despite this decline, the relative profiles of the firms
remain roughly the same. As evidenced from the Figure 3, continuing exporting firms and
new entrants in the foreign market have a TFP, which is much higher than firms that
7 The authors have estimated that in the manufacturing industry the contribution of TFP to value added in the period from 1996-2001 has been slightly negative (-01%) in a trend that was significantly decelerating by the second half of the ‘90s. The same decreasing path of TFP is detected for Italy in Daveri and Jona-Lasinio (2005, 2008).
-.4-.2
0.2
.4(m
ean)
tfp
1995 1996 1997 1998 1999 2000year
always startersquitters never
10
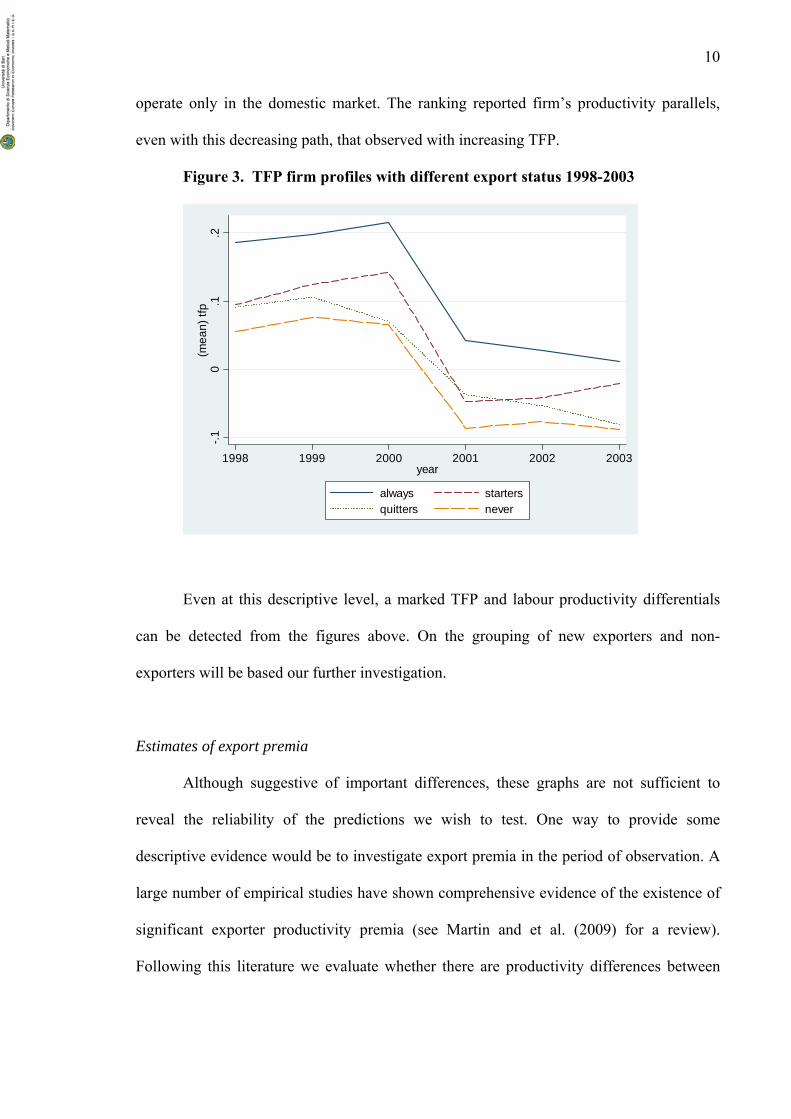
operate only in the domestic market. The ranking reported firm’s productivity parallels,
even with this decreasing path, that observed with increasing TFP.
Figure 3. TFP firm profiles with different export status 1998-2003
Even at this descriptive level, a marked TFP and labour productivity differentials
can be detected from the figures above. On the grouping of new exporters and non-
exporters will be based our further investigation.
Estimates of export premia
Although suggestive of important differences, these graphs are not sufficient to
reveal the reliability of the predictions we wish to test. One way to provide some
descriptive evidence would be to investigate export premia in the period of observation. A
large number of empirical studies have shown comprehensive evidence of the existence of
significant exporter productivity premia (see Martin and et al. (2009) for a review).
Following this literature we evaluate whether there are productivity differences between
-.10
.1.2
(mea
n) tf
p
1998 1999 2000 2001 2002 2003year
always startersquitters never

11
exporters and non-exporters by estimating the export premia given by the β coefficient of
the following OLS regression:
ti
J
jjtititi DSECTlDEXPy ,
1,,, )ln()ln( εδγβα ++++= ∑
=
(1)
where i indexes firms, t indexes time period, yi,t represents some measure of firm
performance and DEXPi,t (Domestic Exporters) is a categorical variables that takes value
one if firm exported in the last year of the survey and 0 otherwise. We control for size ( li,t
refers to the log of the number of employees of firm i in period t) as well as for
productivity industry effects. DSECT are the ATECO 2-digit sector dummies (from sector
16 to 36 minus one) and subscript j refers to the number of industries or sectors. The key
parameter β in the equation indicates the average change in performance for firms that
become exporters with respect to firms that remain non-exporters.
Consistently with previous empirical findings, Table 2 shows the existence of
significant productivity differentials between exporting firms and non-exporters in the
years1997, 2000, 2003.
Table 2. – Firm characteristics differentials between exporters and non-exporters
Firm characteristics
t=1997 t=2000 t=2003
yi, β β β
Value added per worker 0.094***
(0192191)
0.095***
(.0177957)
0.0777 ***
(0.021737)
Gross Sales per worker 0.224***
(0.0276737)
0.246***
(0.0203034)
0.1894957 ***
(0.0274905 )
Average wage 0.024*
(0.0132513)
0.025**
(0.0123611)
0.0264665
(0.0162052)
Capital intensity (K/L) 0.072** 0.138*** 0.0844486 **

12
(.0360786) (.0351468) (0.0394193)
R&D expenditure per
worker
0.028
(.1173986)
0.236**
(.0905202)
0.2091226*
(0.1138323)
TFP 0.1109***
(.0354391)
0.0689***
(.0154288)
0.0766616 ***
(0.0201323)
Employment 0.5558***
(0.0373)
0.5023***
(0.0308)
0.6569
(0.0407)
No. (max) observations 4,061 4,626 4,073 Notes: ***, **, * are significance levels at 1, 5, and 10% respectively. All regressions include a size effect and nominal values are deflated by the appropriate industry deflator. As the number of observations referred to each variable may vary, we report the maximum number of observations available for each year. The estimate β over the full sample of firms for the periods 1995-1997, 1998-2000 and
2001-2003 provide some evidence that exporters outperform non-exporters in terms of the
variables indicated in Table 2. It is clear that exporters operate on a larger scale (18-20%),
are more capital intensive ( in a range of 7-13% ) and have on average a higher labour
productivity roughly represented by value added per worker (around 9 %). All the export
premia are significant, with the exception of R&D premium in the first period.
The coefficients of average wages are not economically significant (2%) 8. This is
explained by national labour contracts that do not allow great wage differentials for
workers in the same industry. As regards TFP the export premia confirm the trajectories
already displayed in the graphs: export premia decrease for exporters from 11% in the
period 1995-1997 to 6-7 % in the last two periods. Undoubtedly, however, the stylised fact
that emerges from this preliminary analysis is that self selection in the export market is
8 These results show that first exporters and never exporters are not greatly heterogeneous when
controlling for industry characteristics. The main rationale behind the finding is the great number of exporting firms (73% of the sample and in some sectors it increases to 80%) and the high potential for non–exporters to enter the export market. However, these figures are consistent with other found for industrialised countries. Greater heterogeneity is found for developing countries (see, for example Alvarez and Lopez [2005] for Chilean firms.

13
evident: export market participation is generally associated with higher productivity
performances.
Self-selection To test for the presence of self-selection, we create two cohorts of firms that start
exporting, respectively, in 1998 and 2001. Firms selected as starters had never exported
over the past three years. In the first cohort they resulted to be 40 while in the second
cohort their number is 100. As a counterfactual, we choose firms that never do exporting
over the whole period (1995-2003)9. Then, we pool the two cohorts together and run the
test over the entire panel. The equation estimated is the following:
tistitisti CONTROLSSTARTy ,,,, )ln( εγβα +++= −− with 31 ≤< s
(2) The sense of the test is to detect whether today export starters were more productive than
non-exporters before the entry into the export market. The exercise is run for a maximum
of three lags but the test is performed also with shorter lags. The results are reported the
table 3.
Table 3 Self -selection t-1 t-2 t-3 Ln(TFP) .0978204*
(.0506655) .0637272 (.0509684)
.0617877 (.0631512)
Ln(Y/L) .1215655 (.16003)
.0958924 (.1619234)
.1032426 (.1719334)
Ln(Gross Profit per worker)
.3372264 (.2845666)
.275865 (.3134046)
-.1802738 (.3071585)
Ln(Employment) .1724254 ** (.0726513)
.1980598 ** (.0727203)
.1767275 ** (.0807334)
Ln(K) .3092681 ** (.1231196)
.2931221 ** (.1223489)
.3208028 ** (.1355127)
N. max obs. 787 797 714 Note: ***, **, * are significance levels at 1, 5, and 10% respectively. Standard Errors are in parenthesis . 9 The number of firms in the counterfactual is 583.

14
It turns out, from the table, that firms starting exporting have not had a larger technical
productivity in the past. It is not possible to detect higher productivity for exporting firms
in t-3 and t-2 while we can notice a higher TFP only one year before foreign-market-entry.
However, exporters are characterized by a larger size in terms of both capital (30%) and
labour (17%) endowments with respect to non-exporters.
In the next section we develop a difference in difference procedure to test for the
presence of learning by exporting effects in the data.
3. The Econometric Approach
The methodology adopted in this paper is a difference–in–difference approach. A
rapidly expanding literature on firm heterogeneity and internationalization strategies has
developed over the last years and has begun to adopt this approach. The main finding is
that exporters are ex-ante different from those that choice do not enter into the export
market. In particular they tend to be larger, more productive, more capital and skill
intensive. This generates a self-selection issue that engender endogeneity biases in the
econometric analysis. A mode to solve this problem is to apply propensity-score matching
and difference in difference estimators (DiD).10 . These techniques yield more robust and
reliable results relative to standard approaches. The scope of this technique is to evaluate
the causal effect of some treatments (exporting) on some outcomes Y experienced by units
in the population of interest (exporting firms). In particular, a control group of domestic
firms is selected (the counterfactual) with features (observed variables) very similar to the
sample of the treated group represented by domestic firms that enter for the first time into
the export market. By confronting pre and post exporting dynamics of the treated and the
untreated group we can evaluate the causal effect of new exporters versus non-exporters on
10 See Heckman et al. (1997, 1998) and Blundell and Costa Dies, ( 2000) for a detailed discussion of these methods.

15
some firm performance measures. To isolate the effect of exporting on firm performance it
is necessary to find a counterfactual of domestic firms which are similar in characteristics
to the exporters. If self selection is present the comparison between the features of export
entrants and never exporters does not reveal any causal effect of export on firm
performance. Many recent works in the literature follow this approach (Harnold and
Hussinger [2005], De Loecker [2007], Girma et al. [2003, 2004], Greenaway and Kneller
[2003], Greenaway, Gullstrand and Kneller [2005], Arnold and Javorcik [2005]Wagner
[2002, 2007], Alvarez and Lopez [2005], among others).
Formally, Let EXPit ∈ {0,1} be a dummy indicating whether firm i chooses to enter
the export market for the first time at time period t. Let us denote with y1sit+ the outcome y
obtained at time t +s , with s ≥ 0, by firms which have chosen to export and with y 0sit+ the
hypothetical value of y if they had not entered the foreign market .
By using the methodology of Blundell and Costa Dias [2002]; Heckman et al. [1997]
the average treatment effect on the treated (ATT) exporting firms may be written as:
[ ] [ ] [ ]111ˆ 0101 =−===−= ++++ itsititsititsitsit EXPyEEXPyEEXPyyEδ (3)
where δ̂ captures the difference between the average outcome for firms that have entered
the export market and the average effect for the same group under the hypothesis that they
did not export. A missing data problem arises, because we cannot observe both the
outcomes, y1sit+ and y 0
sit+ , for the same unit. Hence, we approximate the treated firms’
behaviour in a non-observed condition (non-exporters) with the average performance of
the non-exporting firms (the counterfactual):
]0[ 0 =+ itsit EXPyE
The value of EXPit depends on observed characteristics and on the economic
environment in which firms operate.

16
From the data each firm is assigned a probability of falling in the treatment group
conditional on a set of covariates X measured at time t-s:
)1( stit XEXPP −= (4)
The purpose is to calculate the ex ante probability of exporting, in order to select
those firms which had not exported, but that had similar possibilities to do it with respect
to the treated firms.
In practice, we match the treated group with the firms in the control group, i.e. those
firms which happen to be the nearest neighbours in terms of the propensity score. The
latter is obtained from a logit estimation of the treatment choice on some observed lagged
variables. Thus, these conditional probabilities referred as to the individual’s propensity
scores allow us to construct a control group in which every treated unit is matched to an
untreated unit that has similar characteristics at the time before the treatment.
To identify the probability of entry we perform a logit model of export-market-entry
in which we include covariates suggested by the empirical literature.
Among the various characteristics used, our specification can be represented as
follows:
),,,,,()1( 11,1,1,1,, ttttititititi DareanDinnovatioDSECFINANCEagesizeTFPFSTARTP −−−−−==
(5)
where DSEC denotes industry dummies. Matching is therefore performed by
comparing first time exporters and non-exporters across these observable pre-entry
characteristics After the matching process, we are able to estimate the average impact of
internationalising by using two different estimators: the standard matching estimator (SM)
and the difference in difference estimator (DiD).
The SM or ATT estimator allows us to compare the post-entry average performances
of both the treated and the untreated firms and may be written as:

17
01ˆsitsitATT yy ++ −=δ (6)
The DiD estimator allows us to compare the mean change difference in the
performances before and after the treatment for both the exporting and the non-exporting
units.
=DID
^δ [ ] [ ]0011
sitsitsitsit yyyy −+−+ −−− (7)
Following the method put forth by Mayer (1995) we may estimate the DiD through the
following equation:
jitit
jtDID
jt
jit Xddday εβαββ +++++=∆ 4
'21 (8)
where j = 0,1 indicates whether firm has entered the export market or not, while t = 0,1
indicates, respectively, the pre- and the post-entry period. The vector of covariates X
allows us to control for other sources of heterogeneity in the dependent variable. The
dummies d are constructed as follows:
td = 1 if t = 1 and 0 otherwise;
jd = 1 if j = 1 and 0 otherwise;
jtd = 1 if j = 1 and t = 1 and 0 otherwise.
Estimating αDID
by OLS yields the DiD estimator of the learning by exporting
effect on Italian firms. If we set t=1, then we can estimate the Score Matching Estimator :
ji
ji
jSM
ji Xday εβα +++=∆ ' (9)
4. Matched Propensity Score and Difference-in Difference Results
We are interested in estimating ex–post performance of exporters. After having
identified the control group of firms, the last step of our work is to evaluate the causal

18
effect of exporting on the growth rate of labour productivity as well as the variation in the
growth rate of TFP and other business performances at time t+s with s>0 following entry.
Therefore, we proceed by estimating equations (8) and (9). By denoting with ∆y i.t the
average growth rate of the variable that proxies for business performance for firm entered
in the export market, the estimated Differences–in–Differences results and Standard
Matching (SM) results are reported in the Tables 4 and 5 .The first one considers the
productivity effects, i.e., labour productivity and TFP, while the second one focuses on
other performance measures such as the growth rate of profit per worker, the growth rate of
employment and that of the capital stock.
Table 4. SM and DiD results: Export market entry and the impact on TFP and labour productivity Dep.variables One
period after entry t+1 SM
Two periods after entry t+2 SM
One period after entry t+1 DiD
Two periods after entry t+2 DiD
∆ ln TFP 0.03961 (2.60)***
0.01663 (1.07)
0.03484 (1.75)*
0.00817 (0.39)
R 2
No.Obs . Sector dummies Regional dummies Time dummies
0.15 501 Yes Yes Yes
0.09 470 Yes Yes Yes
0.14 501 Yes Yes Yes
0.09 470 Yes Yes Yes
∆lnY/L 0.0412 (2.24)**
0.03307 (2,22)**
0.0419 (1.99)**
0.02729 (1.24)
R 2
No.Obs . Sector dummies Regional dummies Time dummies
0.07 501 Yes Yes Yes
0.06 460 Yes Yes Yes
0.15 501 Yes Yes Yes
0.05 460 Yes Yes Yes
NOTES: ***significant at 1%; ** significant at 5%; * significant at 10% Bootstrap z statistics in parentheses (500 replications). The constant is included in all regressions. SM compares simple average of the treatment group and the control group

19
One period after entry (t+1) is calculated as the average growth rate between 1999 and 1998 for entrants in the 1998 and between 2002 and 2001 for entrants in the period 2001. Analogously, the growth rates for period t+2 is calculated as the average annual growth rates between year 2000-1998 for firms entered in 1998 and 2003-2001 for firms entered in year 2001. The test is run over the pooled cohorts described above (Section 2). The other covariates used in the final regressions for all the performance measures are: Age, size, innovation, average wages. Table 5. SM and DiD results. Export market and other performance measures Dep.variables One
period after entry t+1 SM
Two periods after entry t+2 SM
One period after entry t+1 DiD
Two periods after entry t+2 DiD
∆ln Gross Profit per worker
0.15205 (1.42)
0.14459 (1.75)*
0.2741 (2.07)**
0.35656 (3.15)***
R 2
No.Obs. Sector dummies Regional dummies Time dummies
0.06 356 Yes Yes Yes
0.09 325 Yes Yes Yes
0.53 356 Yes Yes Yes
0.08 325 Yes Yes Yes
∆ln Employment
−0.002 (−.29)
0.00069 (0.08)
−0.01534 (−2.68)**
−0.0160 (−1.45)
R 2
No.Obs. Sector dummies Regional dummies Time dummies
0.06 513 Yes Yes Yes
0.06 484 Yes Yes Yes
0.07 513 Yes Yes Yes
0.07 484 Yes Yes Yes
∆lnK −0.00094 (−0.06)
−0.01634 (−1.05)
−0.02926 (−1.77)*
− 0.03204 (−1.99)**
R 2
No.Obs. Sector dummies Regional dummies Time dummies
0.06 516 Yes Yes Yes
0.06 474 Yes Yes Yes
0.06 516 Yes Yes Yes
0.06 474 Yes Yes Yes
NOTES: ***significant at 1%; ** significant at 5%; * significant at 10% Bootstrap z statistics in parentheses (500 replications). The constant is included in all regressions. SM compares simple average of the treatment group and the control group One period after entry (t+1) is calculated as the average growth rate between 1999 and 1998 for entrants in the 1998 and between 2002 and 2001 for entrants in the period 2001. Analogously, the growth rates for

20
period t+2 is calculated as the average annual growth rates between year 2000-1998 for firms entered in 1998 and 2003-2001 for firms entered in year 2001. The test is run over the pooled cohorts described above (Section 2). The other covariates used in the final regressions for all the performance measures are: Age, size, innovation , average wages.
In line with the findings displayed in the tables above, we find that the labour
productivity growth of new entrants is higher in the first period. We observe a labour
productivity growth of about 4% after 2 years of entering in the export market but the
effect disappears and becomes economically and statistically insignificant after three years
from the time of foreign market entry. Also TFP grows. In t+1 TFP grows of about the
same magnitude of labour productivity either with SM or DiD estimators and the effect is
statistically significant. The average effect of exporting is not very large and also for this
performance measure our results confirm that the effects are temporary. This finding
implies also that there is not a simple scale effect caused by the firm market expansion but
some technology and knowledge transfers, and therefore a process of learning, from firm
exposure to foreign markets.
Turning to the results of Table 5, the same estimators applied to other performance
measures show that the growth rate of capital and labour will decrease. Most likely, the
meaning is that exporting requires a process of rationalization in the use of resources to
reduce production costs and increase the competitiveness of the exporting firms.
More recently, Das, Roberts and Tybout (2007) by looking at exporting strategies
of firms develop a dynamic model of export supply that embodies heterogeneity in export
profit and market entry costs for new exporters. They show that exporting pay off
measured by higher profits is a potential important source of aggregate export response.
The basic idea is that balance sheet data does not include information about profits from
exporting but it is possible to identify this effect by comparing profits of exporters with
revenues and costs of non-exporting firms with characteristics similar to the first ones. The
21
growth rate of profits in our DiD estimator may be identified with profits from exports.
Remarkably, the effect of exporting on gross profit per worker in our estimation is the only
variable that conserves a significant effect on both periods after firm entry into the export
market.
5. Conclusions
In this paper we have tested the microeconometric hypothesis of learning by
exporting, which attributes a productivity growth effect to firms exposed to foreign
markets, in a representative sample of Italian manufacturing firms. In doing so we have
applied, as has become standard in this literature, matching techniques, (propensity score
matching and difference and difference estimators), which have the advantage of reducing
heterogeneity between exporters and non-exporters and therefore enables us to capture
causal productivity effects that can be reliably attributed to firm’s exposure to foreign
markets. We have assessed the post entry effects of new exporters by comparing their
performance with that of firms that serve only the internal markets. Our study uses three
waves of Unicredit-Capitalia- Surveys (VII,VIII, IX) to select non-exporters as a match of
196 entering exporters. This sample of control is used to estimate many performance
measures stressed by the recent literature: labour productivity growth, TFP growth, as well
as the gross profit growth rate, the growth rate of employment and the growth rate in
physical capital endowments. We find simultaneous evidence of both hypotheses.
More precisely our findings can be summarised as follows:
• Exporting firms are more productive than non exporters before entry in the export
market; (self selection)
• Newly exporting firms exhibit productivity improvements after entry. The
indicators of economic performance either in terms of labour productivity or TFP

22
productivity growth, estimated with SM and DiD techniques, show that export
entrants, relative to non exporters, improve their performance in the period t+1,
which corresponds to 2 years in our sample. The effect vanishes in period t+2;
• No positive effect has been found from export starters on growth in input intensity
either labour or physical capital.
• However in the second period (t+2) we find that export entrants exhibit a
significant growth in their rate of gross profit per employee. We can think at a
mechanism, according also with the previous result, in which exporting firms to
become more competitive may reduce internal costs and this raises the profit of
exporters.
In conclusion, the study addresses the question of whether the relationship between
exporting and efficiency reflects causation flowing from export exposure to improvement
in performance. Despite the effects are not long lasting, we cannot exclude that entrant
exporters become more productive once they start exporting, This is consistent with the
LBEH. These results are consistent with those found in the previous literature for other
countries.
References Alvarez, R. and Lopez, R.A. (2005). Exporting and Firm Performance: Evidence from
Chilean Plants, Canadian Journal of Economics, Vol 38., pp. 1384-1400.
Antràs, P (2003). Firms, Contract and Trade, Quarterly Journal of Economics, 118, (4) 1375-1418.
Arnold, J and Hussinger, K. (2005). Export Behaviour and Firm Productivity in German Manufacturing. A Firm level Analysis, Welthwirtschaftliches Archiv, Vol. 141, 219-243.
Arnold J: and Javorcik, B:S. (2005). Gifted Kids or Pushy Parent? Foreign Acquisitions and Plant Performance in Indonesia, CEPR Discussion Paper N. 5065.
Baldwin, J.R. and Gu, W. (2003). Export market Participation and productivity Performance in Canadian Manufacturing, Canadian Journal of Economics, Vol.36, 634-657.

23
Barba Navaretti G. and D. Castellani (2004a). “Does Investing Abroad Affect Performance at Home? Comparing Italian Multinational and National Enterprises”, CEPR Discussion Paper, N° 4284.
Bassanetti, A. Iommi, C., Jona Lasinio, C. and Zollino, F. (2004). La crescita dell’economia italiana negli anni novanta tra ritardo tecnologico e rallentamento della produttività, Banca d’Italia, Temi di Discussione, N. 539.
Bernard, A and Jensen, B. (1999) Exceptional Export Performance: Cause, Effect or Both? Journal of International Economics, Vol. 47, 1-25.
Bernard, A and Jensen, B. (2004) Why Some Firm Export, Review of Economics and Statistics, 86, 561-569.
Castellani, D. (2002). Export Behaviour and Productivity Growth: Evidence from Italian Manufacturing Firms, Weltwirtschaflitches Archiv, vol, 138, pp. 605-628.
Clerides, S. Lack, S and Tybout, J. (1998). Is Learning By Exporting Important ? Micro-Dynamic Evidence from Colombia, Mexico and Morocco, Quarterly Journal of Economics, 113, 903-947.
Das, S., Roberts, M. and Tybout, M. (2007) Market Entry, Producers Heterogeneity and Export Dynamics, Econometrica, 75, 837-873.
Daveri, F. and Jona-Lasinio, C. (2008), Offshoring and Productivity Growth in the Italian Manufacturing Industries, Cesifo Economic Studies, 54, 414-450.
Daveri, F. and Jona-Lasinio, C. (2005), Italy’s Decline: Getting the Facts Right, Discussion Giornale degli Economisti e Annali di Economia,64, 365-421.
De Benedictis, L. (2005) Three decades of Italian Comparative Advantages, The World Economy, 28, 1679-1709.
De Loecker, J. (2007). Do Export Generate Higher Productivity? Evidence from Slovenia, Journal of International Economics, 73, 69-98.
Degado, M. Farinas, J and Ruano (2002). Firm Productivity and Export Markes: A Non-Parametric Approach, Journal of International Economics, 57, 397-422.
Farinas, J.C. and Marcos, M. (2007). Exporting and Economic Performance: Firm-level Evidence of Spanish Manufacturing, The World Economy, 618-646.
Girma, S. Greenway, D and Kneller, R. (2003). Export Market Exit and Performance Dynamics: A Causality Analysis of matched Firms, Economics Letters, 83, pp 317-324.
Girma, S. Greenway, D an Kneller, R. (2004). Does Exporting Increase productivity. A Microeconometric Analysis of matched Firms, Review of International Economics, 12, pp. 855-866.
Greenaway, D. and Kneller, R. (2007a). Firm Heterogeneity, Exporting and Foreign Direct Investment, Economic Journal, vol 117, F134-F161.
Greenaway, D and Kneller, R. (2007b). Industry Differences, in the Effect of Export Market Entry: Learning by Exporting, Review of World Economics, 143, 416-432.
Greenaway, D., Gullstrand, J. and Kneller, R. (2005). Exporting May not always boost Firm Level Productivity, Weltwirtschaflitches Archiv, 141, pp. 561-582.

24
Greenaway, D. and Kneller, R.(2003). Exporting Productivity and Agglomeration: A Matched Difference in Difference Analysis of matched firms, GER Reearch Paper 03/45, University of Nottingham.
Greenaway, D. and Kneller, R. (2008). Exporting , Productivity and Agglomeration European Economic Review, 52, 919-939
Grossman, G. and Helpman, E. (1991). Innovation and Growth in the Global Economy, Cambridge, MIT Press.
ISGEP (International Study Group on Exports and Productivity) (2008). Understanding Cross-Country Differences in Export Premia: Comparable Evidence for 14 Countries, Review of World Economics, 144, 596-635.
Isgut, A. and Fernandes, A. (2007) Learning by Exporting Effects: Are They for Real? MPRA Working paper, N° 3121 (http://mpra.ub.uni-muenchen.de/3121/).
Kraay, A, (1999). Export and Economic Performance: Evidence from a Panel of Chinese Enterprises, World Bank.
Martin, P.S. and Yang, Y. (2009) The Impact of Exporting on Firm Productivity: A meta-Analysis of the Learning by Exporting Hypothesis, Review of World Economics, (published online 11 August 2009).
Melitz, M.J. (2003) The Impact of Trade on Intra Industry Reallocations and Aggregate Industry Productivity, Econometrica, Vol. 71, 1695-1725.
Meyer, B.D. (1995). Natural and Quasi-Experiments in Economics, Journal of Business & Economic Statistics, 13, 151-161.
Roberts, M.J. and Tybout, J.R. (1997) The Decision to Export in Colombia: An Empirical Model of Entry with Sunk Cost, American Economic Review, Vol. 87, 545-564.
Serti, F. and Tomasi, C. (2008). Self-selection and Post Entry Effects of Exports: Evidence from Italian Manufacturing Firms, Review of World Economics, 144, 660-694
Wagner, J. (2002). The Causal Effect of Export on Firm Productivity: First Evidence from a Matching Approach, Economics Letters , vol. 77, pp.287-92
Wagner, J. (2007). Exports and Productivity: A survey of the Evidence from Firm Level Data, The World Economy, vol 30, pp.60-82
Wagner, J. (2008).Exports, Imports and Productivity at the Firm Level. An International Perspective, Review of World Economics,144, 591-595
Appendix A: Variable Definitions
Production (Y) = Net sales of the firm, taken by the related balance sheet deflated by the appropriate National Statistical (ISTAT) industrial production price index.
Gross Profit per worker, balance sheet value of revenues minus costs deflated by appropriate price deflator
Age = constructed by the year of firm’s constitution as declared in the questionnaire
INNOVATION = dummy variable (0,1), that takes value 1 if the firm incurs process or product innovations during the period covered by the survey and used in this work (1998-2000 and 2001-2003) as declared in the questionnaire (Has your enterprise

25
introduced in the period 2001-2003: 1) any technological new product? 2) Any improved process ? We summed the two answers and constructed a new binary variable that includes both product and process innovations
W= unit wage cost that is computed as the total wage bill of the firm divided by its total employment.
R&D= the amount of yearly investments to R&D projects as declared by firms in the questionnaire (How is the amount (in €) of R&D investment that your enterprise has done in yearX?)
K= fixed capital sock at the end of the period as the accounting value of net immobilization as reported in the balance sheet
VA = the balance sheet value which stays for the value added of firm
L= total employment given by the sum of blue collars and white collars
Y/L = labour productivity defined as the ratio of value added to the number of employees of the firm. The data set does not report the yearly effective hours of work and this is the only way to measure labour productivity
K/L = firm’s ratio of capital stock to employment
TFP = TFP is estimated as a regression residual of a Cobb-Douglas production function. The data used for TFP calculations are the balance sheet values of output (net sales), capital (the accounting value of net immobilization assets) and total number of workers of the firm. The elasticities of output with respect to capital and labour at firm levels are estimated by a random effect regression with an AR(1) disturbance term. We tried to assess if these figures were appropriate to measure the capital input and we realized that the accounting value reported in the data set coincides with the value of the capital input calculated by the perpetual inventory method. An obvious caveat with this variable is due to the correlation between exogenous variables and the error term since the latter is expected to influence the factor input decisions. This is a well-known econometric problem that we solve partially by adopting the described procedure (see, i.e.Barba Navaretti et al. 2004).
FIN= financial variable constructed from accounting values and given by net capital + financial debt divided by the number of workers. It captures the ability to catch credit by the individual firm.
Appendix B: Estimation of the logit model
This appendix, in Table B1, shows the results from our logit regression for entry into the export market that generates the propensity score used to match each new exporter to its nearest-neighbour non-exporter. By picking up non-exporter firms with similar characteristics to export starters we correct for selection bias. In our sample, we selected an equal number of non-exporters for the 140 treated firms. Our logit includes as covariates the initial level of TFP to proxy for the firm unobserved efficiency, size, age, other useful indicators of the current export status such as the innovative content of the output, and a financial variable. Since the propensity to export is likely to vary across regions and industries, we include a set of industry and regional dummies. We model the probability of starting exporting as follows:
}|1Pr{ 0, ii XSTART =

26
Where X is a vector of firm characteristics already specified, prior the period of starting on which the probability of starting to export is regressed. The vector X includes TFPt-1, Sizet-
1 Aget-1, Financet-1 and several regional and industry dummies. Industrial dummies control for different unobserved sectoral shocks, while regional dummies control for heterogeneity among firms with respect to geographical location. The probability of exporting is increasing with TFP, the innovative content of output and the financial variable, which we believe is important to face costs of entry of new exporters. Our result shows that an increase of 1 percentage point in the capacity of the firm to obtain credit increases the probability of exporting by 3.7 %. Also in this regression we found the poor performance of Age and also regional dummies. Then we can conclude that age of firm and belonging to a particular region are not significant in determining whether or not to enter in foreign markets Table B1. Logit estimates on the probability of exporting 1998-2000 Coefficients P values
Size (Ln Employmentt-1) (number of employees) (1997))
0.2006 . 0.56
Aget-1 (1997) -0.0087 0.54
Ln TFP t-1 (1997) -0.860* 0.07
Innovation t-1 (1997) 1.265*** 0.016
Ln finance t-1 (1997) 0.0791*** 0.007
Region dummies Yes Industry dummies Yes Constant -8.442 0.002 N. Of observ. 176 Pseudo R2 0.15 2001-2003 Coefficients p values Size (Ln Employment t-1) (2000))
0.292.* 0.08
Age t-1 (2000) 0.0009 0.60 Ln TFP t-1 (2000) 0.50* 0.09 Innovation t-1 (2000) 0.215 0.49 Ln finance t-1 (2000) 0.037*** 0.02 Regional dummies Yes Industry dummies Yes Constant -2.807** 0.05

27
N. observ. 547 Pseudo R2 0.09 Notes: *, **, *** indicate statistical significance at 10 %, 5% and 1% respectively. The dependent variable DEXP=1 if a domestic firm in year t-1 becomes exporter in year t The explanatory variables are lagged one year when annual data are available in the Survey. For some categorical variables (such as innovation) the lag of one period corresponds at the average over the previous three-year period. Table B2 reports an assessment of the robustness of matching in our sample. The matching to be reliable should result in characteristics of the counterfactual as close as possible to those of the new exporting firms by finding for each firm that become exporter (treated unit) similar firms that continue to serve only the domestic market (untreated). The Table shows that after matching the hypothesis that the means of the variables considered are significantly different is always rejected at the 1% level of significance. Overall, the matching implemented seems to have made the means of the two groups closer, except for the profitability variable. Table B2. Assessing the matching quality
N. firms
Ln TFP*
Ln Value Added
Ln Employment
Ln
Gross Profit pw
Ln
Labour Productivity
Ln
Finance
Ln K
All treated
151 .35798 9.3369 3.2565 7.7254 8.0759 6.0466 9.0955
All controls
670 .26209 9.1393 3.1017 7.4807 7.9989 5.9328 8.8563
P-value**
0.060 0.017 0.033 0.387 0.631 0.323
0.068
Treated on common support
140 .35365 9.3352 3.262 7.7339 8.083 6.0381 9.1068
Matched controls
140 .39014 9.4166 3.3236 7.9608 8.4112 5.9742 9.2372
P-value 0.610 0.528 0.582 0.503 0.152 0.664 0.474
Notes:*Values of the variables are taken at t-1, one year before firms start exporting .The p values test the null hypothesis that the means in the two groups are significantly different.

28
Appendix C The Figure below reports density estimates of total sales and TFP between exporters and non-exporters in different periods of our sample.
Figure C1 : Density estimates of TFP and Total sales between exporters and non--exporters
0.5
11.
5
-2 -1 0 1 2TFP 1997
exporters non exporters
0.5
11.
5
-3 -2 -1 0 1 2TFP 2000
exporters non exporters0
.51
1.5
-10 -5 0 5TFP 2003
exporters non exporters
0.1
.2.3
.4.5
0 5 10 15SALES 1997
exporters non exporters
0.2
.4.6
6 8 10 12 14 16SALES 2000
exporters non exporters
0.1
.2.3
.4
5 10 15 20 25SALES 2003
exporters non exporters
Univariate Kernel densities. Source: Capitalia. Authors' calculations.
Performance comparison between exporters and non exporters
Notes: Density estimates shown are based on Epanechnikov kernel functions using optimal widths. The variable represented is ln of total sales.