direct carrier billing in 2016 - global market report by fortumo
TRANSCRIPT

Direct Carrier Billing
Global market report by Fortumo

You are reading the �rst annual overview published by Fortumo on direct
carrier billing, taking a look back at the previous year. In this report, we give
an overview of 3 countries of each region (Asia Paci�c, Latin America, Middle
East & Africa, Western Europe and Central & Eastern Europe) that had the
biggest growth in direct carrier billing transaction volume.
For anyone keeping an eye on mobile industry news, it should come as no
surprise that Asia Paci�c has grown to dominate the global digital landscape.
Currently, Latin America is still the biggest overall region in transaction
volume for carrier billing. However, the signi�cant growth in smartphone
ownership combined with lack of payment cards means Asia Paci�c will more
than likely take over this position during 2017.
Introduction
Direct Carrier Billing in 2016: Global Market Report

If you wish to refresh your memory on what happened during 2016, please check out our monthly news summaries, highlighting the biggest stories of the mobile industry from each month of last year:
Data presented in this report has been aggregated across all digital and virtual products and services sold through Fortumo’s Cross-Platform Payment Solution, which is available to consumers on desktop devices, smartphones, tablets as well as feature phones.
Mattias LiivakHead of Marketing & PR
Should you have any questions about the report, please reach out to us at [email protected].
Andrea BoettiVP of Global Business Development & Sales
January February March April
May June July August
September October November December
2016 news summaries17 News 26 News 25 News 28 News
32 News 25 News 27 News 20 News
20 News 16 News 14 News 18 News
Direct Carrier Billing in 2016: Global Market Report

Asia Pacific
Fortumo coverage:
Australia, Bangladesh, Cambodia, Hong Kong, India,
Indonesia, Malaysia, New Zealand, Pakistan, Philippines,
Singapore, South Korea, Taiwan, Thailand, Vietnam
Monthly ARPPUof region:
Monthly medianARPPU of region:
Average transactionvalue in region:
Median ATVof region:
Language localization: 91% of all users in Asia Paci�c have browser language set to English
67%
TABLET
DESKTOP
MOBILE
30%
3%
TRAFFICSOURCES
% denotes 2015-2016 change
$7.3 $3.1 $2.8 $2.37% 3%7% 4%% denotes 2015-2016 change % denotes 2015-2016 change % denotes 2015-2016 change
15
2016 REGIONAL OVERVIEW
1605
LANGUAGELOCALIZATION
91% English
COUNTRIESMILLION USERS
Direct Carrier Billing in 2016: Global Market Report
Other languages9%
Direct Carrier Billing in 2016: Global Market Report
6%
30%
44%
30% 53%
138%
100%
200%
6%
26%
5%
21%
TABLET
DESKTOP
MOBILE
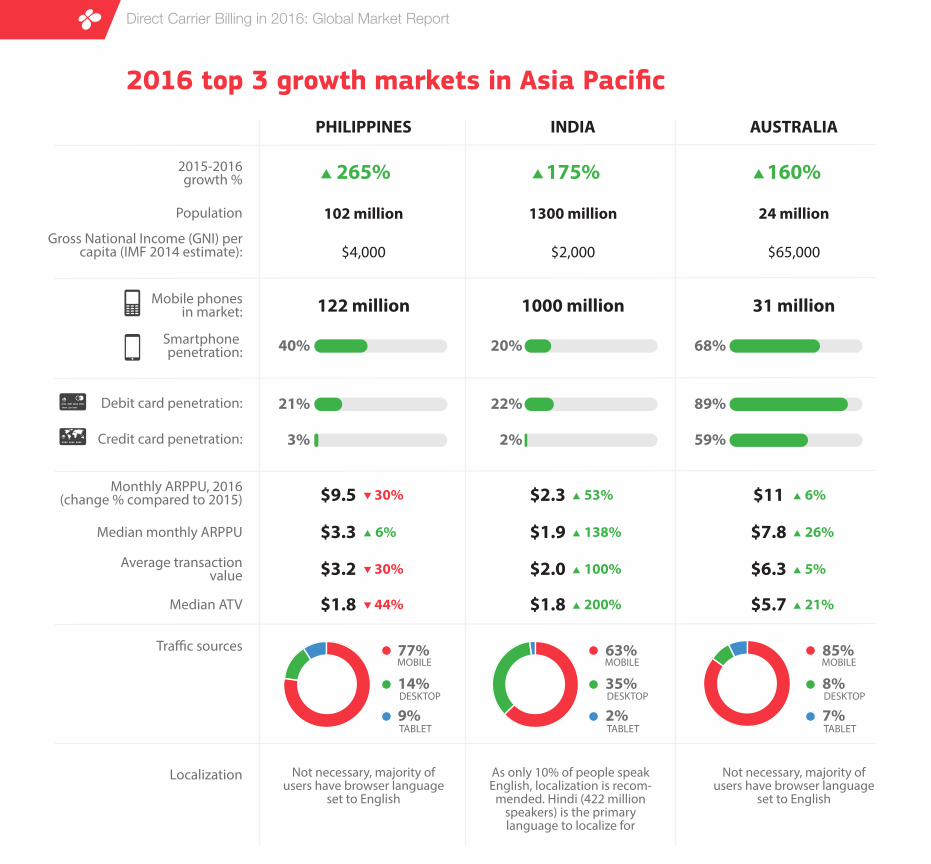
PHILIPPINES INDIA
160%
Population 102 million 1300 million 24 millionGross National Income (GNI) per
capita (IMF 2014 estimate): $4,000 $2,000 $65,000
Mobile phonesin market: 122 million 1000 million 31 million
265% 175%
AUSTRALIA
2015-2016growth %
Smartphone penetration: 20% 68%
Debit card penetration: 21% 22% 89%
Credit card penetration: 3% 2% 59%
Monthly ARPPU, 2016 (change % compared to 2015) $9.5 $2.3 $11
Median monthly ARPPU $3.3 $1.9 $7.8
Average transactionvalue $3.2 $2.0 $6.3
Median ATV $1.8 $1.8 $5.7
Localization Not necessary, majority of users have browser language
set to English
As only 10% of people speak English, localization is recom-
mended. Hindi (422 million speakers) is the primary language to localize for
Not necessary, majority of users have browser language
set to English
Tra�c sources
2016 top 3 growth markets in Asia Pacific
40%
77%
14%
9%TABLET
DESKTOP
MOBILE63%
35%
2%TABLET
DESKTOP
MOBILE85%
8%
7%
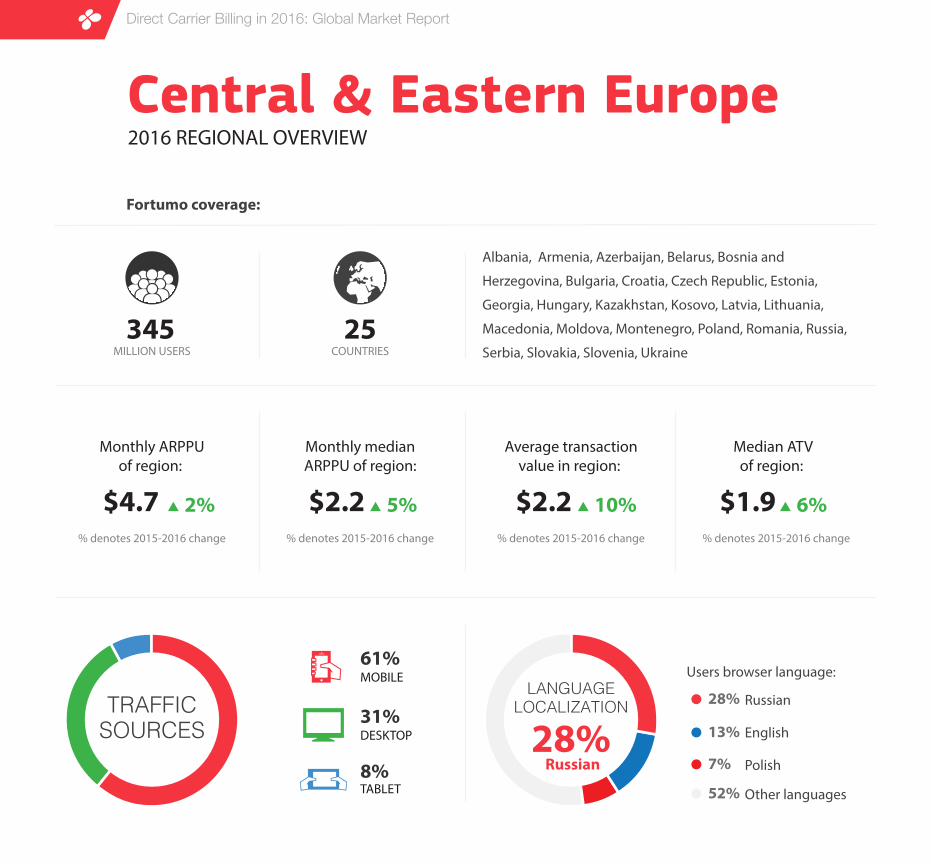
Central & Eastern Europe
Fortumo coverage:
Albania, Armenia, Azerbaijan, Belarus, Bosnia and
Herzegovina, Bulgaria, Croatia, Czech Republic, Estonia,
Georgia, Hungary, Kazakhstan, Kosovo, Latvia, Lithuania,
Macedonia, Moldova, Montenegro, Poland, Romania, Russia,
Serbia, Slovakia, Slovenia, Ukraine
Monthly ARPPUof region:
Monthly medianARPPU of region:
Average transactionvalue in region:
Median ATVof region:
61%
TABLET
DESKTOP
MOBILE
31%
8%
TRAFFICSOURCES
% denotes 2015-2016 change
$4.7 $2.2 $2.2 $1.92% 5% 10% 6%% denotes 2015-2016 change % denotes 2015-2016 change % denotes 2015-2016 change
25
2016 REGIONAL OVERVIEW
345
LANGUAGELOCALIZATION
28% Russian
COUNTRIESMILLION USERS
Users browser language:
Direct Carrier Billing in 2016: Global Market Report
Polish
English
Russian28%
13%
7%
Other languages52%
Direct Carrier Billing in 2016: Global Market Report
5%
8%
19%
16%
TABLET
DESKTOP
MOBILE
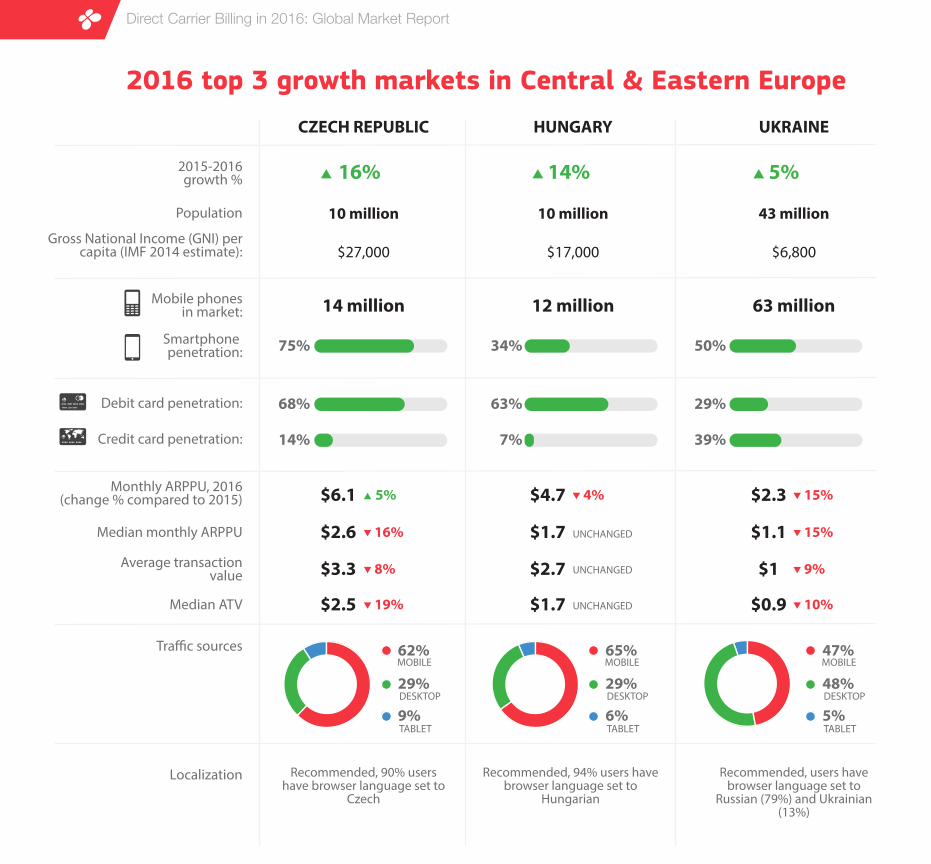
CZECH REPUBLIC HUNGARY
5%
Population 10 million 10 million 43 millionGross National Income (GNI) per
capita (IMF 2014 estimate): $27,000 $17,000 $6,800
Mobile phonesin market: 14 million 12 million 63 million
16% 14%
UKRAINE
2015-2016growth %
Smartphone penetration: 34% 50%
Debit card penetration: 68% 63% 29%
Credit card penetration: 14% 7% 39%
Monthly ARPPU, 2016 (change % compared to 2015) $6.1 $4.7 $2.3
Median monthly ARPPU $2.6 $1.7 $1.1
Average transactionvalue $3.3 $2.7 $1
Median ATV $2.5 $1.7 $0.9
Localization Recommended, 90% users have browser language set to
Czech
Recommended, 94% users have browser language set to
Hungarian
Recommended, users have browser language set to
Russian (79%) and Ukrainian (13%)
Tra�c sources
2016 top 3 growth markets in Central & Eastern Europe
75%
62%
29%
9%TABLET
DESKTOP
MOBILE65%
29%
6%TABLET
DESKTOP
MOBILE47%
48%
5%
4%
UNCHANGED
UNCHANGED
UNCHANGED
9%
10%
15%
15%
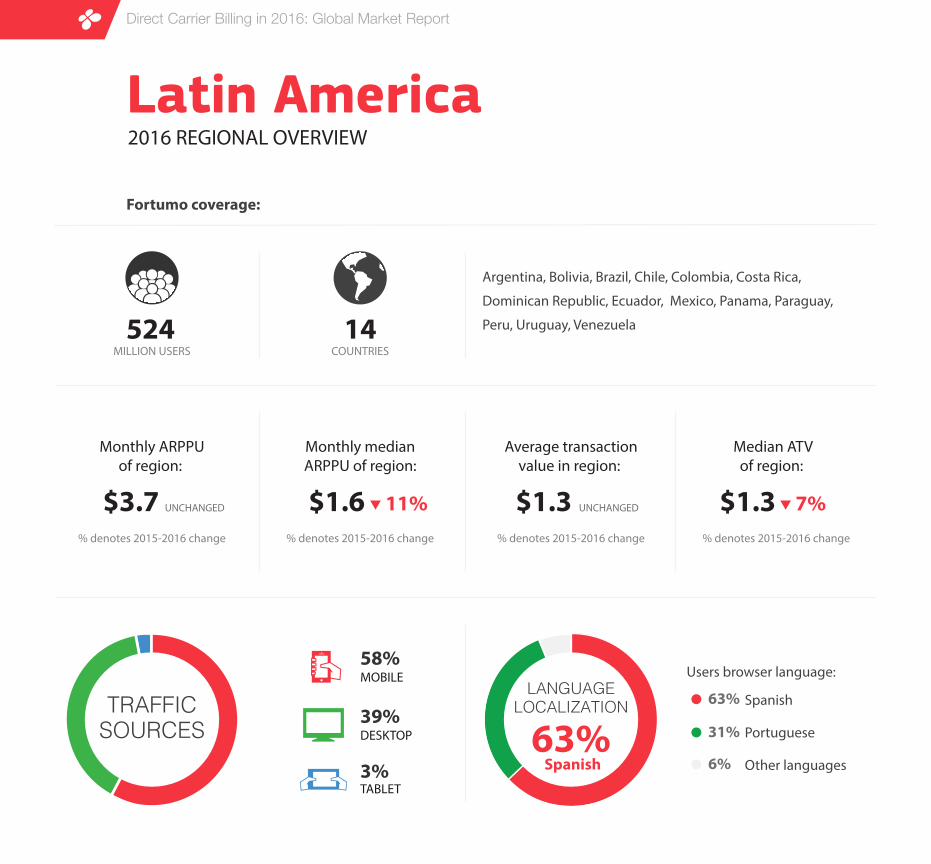
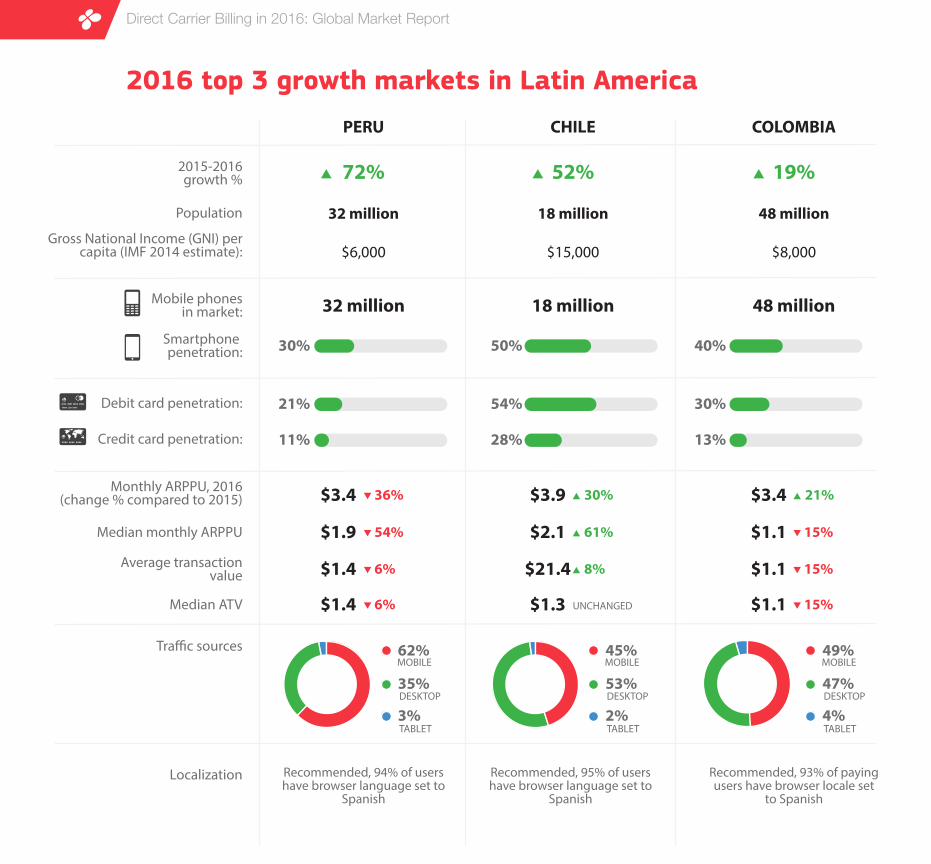
Latin America
Fortumo coverage:
Argentina, Bolivia, Brazil, Chile, Colombia, Costa Rica,
Dominican Republic, Ecuador, Mexico, Panama, Paraguay,
Peru, Uruguay, Venezuela
Monthly ARPPUof region:
Monthly medianARPPU of region:
Average transactionvalue in region:
Median ATVof region:
58%
TABLET
DESKTOP
MOBILE
39%
3%
TRAFFICSOURCES
% denotes 2015-2016 change
$3.7 $1.6 $1.3 $1.311% 7%% denotes 2015-2016 change % denotes 2015-2016 change % denotes 2015-2016 change
14
2016 REGIONAL OVERVIEW
524
LANGUAGELOCALIZATION
63% Spanish
COUNTRIESMILLION USERS
UNCHANGED
Users browser language:
Portuguese
Spanish63%
31%
Direct Carrier Billing in 2016: Global Market Report
Other languages6%
UNCHANGED
Direct Carrier Billing in 2016: Global Market Report
6%
6%
36% 30%
61%
8%
21%
TABLET
DESKTOP
MOBILE
PERU CHILE
19%
Population 32 million 18 million 48 millionGross National Income (GNI) per
capita (IMF 2014 estimate): $6,000 $15,000 $8,000
Mobile phonesin market: 32 million 18 million 48 million
72% 52%
COLOMBIA
2015-2016growth %
Smartphone penetration: 50% 40%
Debit card penetration: 21% 54% 30%
Credit card penetration: 11% 28% 13%
Monthly ARPPU, 2016 (change % compared to 2015) $3.4 $3.9 $3.4
Median monthly ARPPU $1.9 $2.1 $1.1
Average transactionvalue $1.4 $21.4 $1.1
Median ATV $1.4 $1.3 $1.1
Localization Recommended, 94% of users have browser language set to
Spanish
Recommended, 95% of users have browser language set to
Spanish
Recommended, 93% of paying users have browser locale set
to Spanish
Tra�c sources
2016 top 3 growth markets in Latin America
30%
62%
35%
3%TABLET
DESKTOP
MOBILE45%
53%
2%TABLET
DESKTOP
MOBILE49%
47%
4%
54%
UNCHANGED
15%
15%
15%

Middle East & Africa
Fortumo coverage:
Algeria, Bahrain, Cote d'Ivoire, Egypt, Ethiopia, Iraq, Israel,
Jordan, Kenya, Kuwait, Lebanon, Morocco, Mozambique,
Nigeria, Oman, Qatar, Saudi Arabia, Senegal, South Africa,
Tunisia, Turkey, United Arab Emirates
Monthly ARPPUof region:
Monthly medianARPPU of region:
Average transactionvalue in region:
Median ATVof region:
72%
TABLET
DESKTOP
MOBILE
21%
7%
TRAFFICSOURCES
% denotes 2015-2016 change
$8.4 $3.2 $2.5 $2.18% 19%% denotes 2015-2016 change % denotes 2015-2016 change % denotes 2015-2016 change
22
2016 REGIONAL OVERVIEW
603
LANGUAGELOCALIZATION
55% English
COUNTRIESMILLION USERS
13% 11%
Users browser language:
Arabic
French
English55%
17%
17%
Turkish6%
Other languages5%
Direct Carrier Billing in 2016: Global Market Report

Direct Carrier Billing in 2016: Global Market Report
18%
31%
23%
8%
4%
3%
60%
40%
60%
TABLET
DESKTOP
MOBILE
TUNISIA LEBANON
58%
Population 11 million 6 million 47 millionGross National Income (GNI) per
capita (IMF 2014 estimate): $4,000 $10,000 $1,000
Mobile phonesin market: 17 million 4 million 36 million
184% 159%
KENYA
2015-2016growth %
Smartphone penetration: 48% 36%
Debit card penetration: 12% 33% 35%
Credit card penetration: 6% 11% 5%
Monthly ARPPU, 2016 (change % compared to 2015) $3.4 $9.1 $1.6
Median monthly ARPPU $2.3 $3.9 $0.8
Average transactionvalue $1.4 $2.9 $0.7
Median ATV $1.3 $3 $0.8
Localization Recommended, 90% of users have browser language set to
French
Recommended, 21% of users have browser language set to
Arabic
Not necessary, 97% of users have browser language set to
English
Tra�c sources
2016 top 3 growth markets in Middle East & Africa
27%
76%
21%
3%TABLET
DESKTOP
MOBILE53%
43%
4%TABLET
DESKTOP
MOBILE83%
14%
3%
9%
4%
6%

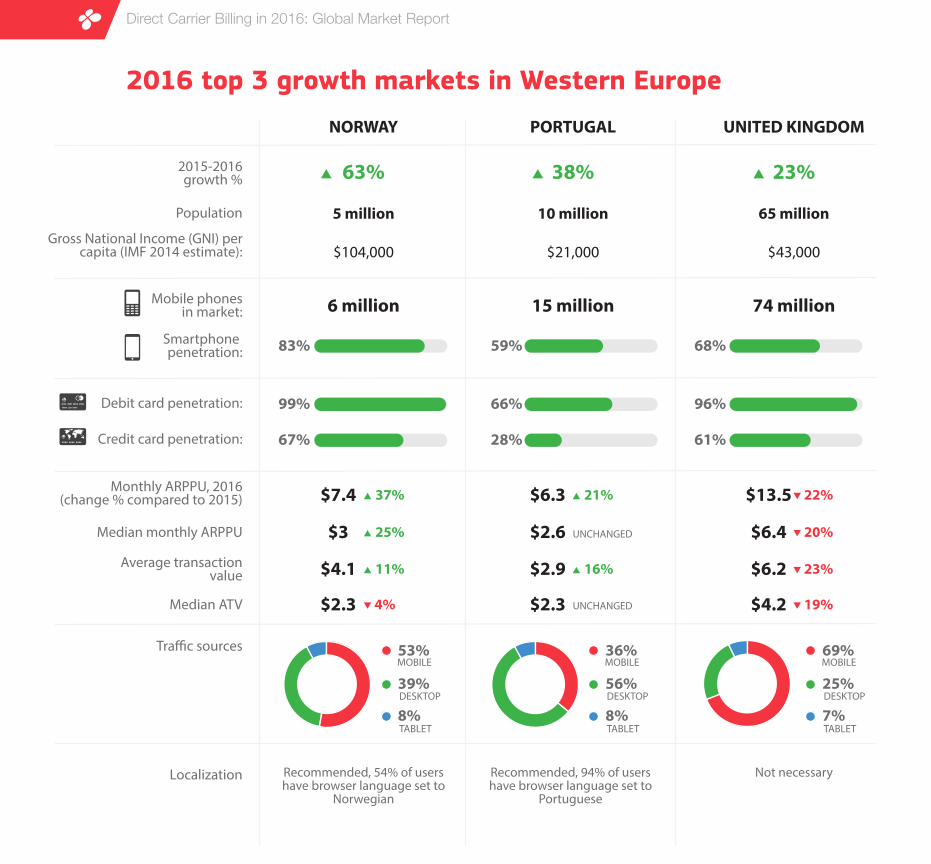
Western Europe
Fortumo coverage:
Austria, Cyprus, Belgium, Denmark, Finland, France, Germany,
Greece, Ireland, Italy, Luxembourg, Netherlands, Norway,
Portugal, Spain, Sweden, Switzerland, United Kingdom
Monthly ARPPUof region:
Monthly medianARPPU of region:
Average transactionvalue in region:
Median ATVof region:
73%
TABLET
DESKTOP
MOBILE
18%
9%
TRAFFICSOURCES
% denotes 2015-2016 change
$9.7 $4.2 $4.3 $3.121% 1%2% 9%% denotes 2015-2016 change % denotes 2015-2016 change % denotes 2015-2016 change
18
2016 REGIONAL OVERVIEW
417COUNTRIESMILLION USERS
LANGUAGELOCALIZATION
20% English
Users browser language:
German
French
English20%
13%
10%
Italian
Other languages47%
10%
Direct Carrier Billing in 2016: Global Market Report
Direct Carrier Billing in 2016: Global Market Report
4%
37%
25%
11%
21%
16%
TABLET
DESKTOP
MOBILE
NORWAY PORTUGAL
23%
Population 5 million 10 million 65 millionGross National Income (GNI) per
capita (IMF 2014 estimate): $104,000 $21,000 $43,000
Mobile phonesin market: 6 million 15 million 74 million
63% 38%
UNITED KINGDOM
2015-2016growth %
Smartphone penetration: 59% 68%
Debit card penetration: 99% 66% 96%
Credit card penetration: 67% 28% 61%
Monthly ARPPU, 2016 (change % compared to 2015) $7.4 $6.3 $13.5
Median monthly ARPPU $3 $2.6 $6.4
Average transactionvalue $4.1 $2.9 $6.2
Median ATV $2.3 $2.3 $4.2
Localization Recommended, 54% of users have browser language set to
Norwegian
Recommended, 94% of users have browser language set to
Portuguese
Not necessary
Tra�c sources
2016 top 3 growth markets in Western Europe
83%
53%
39%
8%TABLET
DESKTOP
MOBILE36%
56%
8%TABLET
DESKTOP
MOBILE69%
25%
7%
23%
19%
20%
22%
UNCHANGED
UNCHANGED

Additional reading
What metrics to measure for your payment solutions?
Read now
How to do a background check on your carrier billing provider?
Read now
Who to partner with to launch carrier billing?
Read now
https://fortumo.comhttps://facebook.com/fortumohttps://twitter.com/fortumohttps://www.linkedin.com/company/fortumo-ltd.
Fortumo is a mobile payments company that enables direct carrier billing with more than 350 mobile operators in 90+ countries. Fortumo's payment products work across a wide range of platforms including desktop devices, smartphones, feature phones, tablets and smart TV-s. These products give consumers a simple, 1-click payment method to charge online purchases to their phone bill. For app stores, digital media companies and game developers, Fortumo provides one integration with 350 mobile operators as well as a single point of contact for settlements, reporting, support and infrastructure upgrades. Founded in 2007, Fortumo has offices in Estonia, San Francisco, Beijing, Delhi, Singapore & Hanoi and is backed by Intel Capital and Greycroft Partners.
This document is for informational purposes only. Fortumo and the authors make no expressed or implied warranties in this document. Fortumo and the author(s) make no representation or warranty in relation to the accuracy, completeness or reliability of the information contained in this document. Any opinions expressed in this document are subject to change without notice. This document may be based on a number of assumptions and different assumptions could result in materially different results. This document should not be regarded by recipients as a substitute for obtaining independent advice and/or the exercise of their own judgement, and is not to be relied upon by recipients. Fortumo and the authors, and any of their members, directors, employees or agents do not accept any liability for any loss or damage arising out of the use of all or any part of this document. Copyright © 2017 Fortumo | All rights reserved.