direct testimony of tim woolf...26 the board should approve e1’s request to change the primary dsm...
TRANSCRIPT

Before the Nova Scotia Utility and Review Board
In The Matter of The Public Utilities Act, R.S.N.S 1989, c380, as amended
And
In The Matter of An Application by EfficiencyOne for approval of a Supply Agreement For Electricity Efficiency And Conservation Activities between EfficiencyOne (e1) and Nova Scotia Power Inc. (NSPI), the establishment of a final agreement between the parties, and approval of a
2016-2018 Demand Side Management (DSM) Resource Plan (M06733)
Direct Testimony of
Tim Woolf
On The Topic of
The EfficiencyOne 2016-2018 DSM Plan
On Behalf of
Counsel to Nova Scotia Utility and Review Board
June 2, 2015

Table of Contents
1. INTRODUCTION AND QUALIFICATIONS ........................................................................ 1
2. SUMMARY OF CONCLUSIONS AND RECOMMENDATIONS ....................................... 2
3. OVERVIEW OF THE NSPI 2014 INTEGRATED RESOURCE PLAN ................................ 4
4. OVERVIEW OF EFFICIENCYONE’S 2016-2018 DSM PLAN ............................................ 6
5. OVERVIEW OF THE RATE AND BILL IMPACT STUDY ............................................... 12
Rate Impacts ........................................................................................................................ 14
Bill Impacts ......................................................................................................................... 21
Participation Rates ............................................................................................................... 23
NSPI Analysis of Rate, Bill, and Participation Impacts ...................................................... 26
Rate and Bill Impacts of the IRP Cases Relative to E1’s 2016-2018 DSM Plan ............... 27
6. NSPI’S ALTERNATIVE DSM PLAN .................................................................................. 28
Affordability ........................................................................................................................ 28
Comparison with Other Jurisdictions .................................................................................. 33
Deferring the Need for New Capacity ................................................................................. 37
Recommendation Regarding NSPI’s Proposal ................................................................... 39
7. ADDITIONAL COST-EFFECTIVE DSM SAVINGS .......................................................... 39
8. COST-EFFECTIVENESS TESTING .................................................................................... 42
9. STANDARDIZED FILING REQUIREMENTS .................................................................... 45
10. RECOMMENDATIONS ........................................................................................................ 47
List of Schedules
Schedule TW-1: Resume of Tim Woolf
Schedule TW-2: National Efficiency Screening Project, Resource Value Framework

Direct Testimony of Tim Woolf 1
1. INTRODUCTION AND QUALIFICATIONS 1
Q. Please state your name, title, and employer. 2
A. My name is Tim Woolf. I am a Vice President at Synapse Energy Economics, located at 3
485 Massachusetts Avenue, Cambridge, MA 02139. 4
Q. Please describe Synapse Energy Economics. 5
A. Synapse Energy Economics (Synapse) is a research and consulting firm specializing in 6
electricity and gas industry regulation, planning, and analysis. Our work covers a range of 7
issues, including economic and technical assessments of demand-side and supply-side 8
energy resources; energy efficiency policies and programs; integrated resource planning; 9
electricity market modeling and assessment; renewable resource technologies and 10
policies; and climate change strategies. Synapse works for a wide range of clients, 11
including attorneys general, offices of consumer advocates, public utility commissions, 12
environmental advocates, the U.S. Environmental Protection Agency, U.S. Department of 13
Energy, U.S. Department of Justice, the Federal Trade Commission and the National 14
Association of Regulatory Utility Commissioners. Synapse has over 25 professional staff 15
with extensive experience in the electricity industry. 16
Q. Please summarize your professional and educational experience. 17
A. Before rejoining Synapse, I was a commissioner at the Massachusetts Department of 18
Public Utilities (DPU). In that capacity, I was responsible for overseeing a substantial 19
expansion of clean energy policies, including significantly increased ratepayer-funded 20
energy efficiency programs; an update of the DPU energy efficiency guidelines; the 21
implementation of decoupled rates for electric and gas companies; the promulgation of 22
net metering regulations; review and approval of smart grid pilot programs; and review 23
and approval of long-term contracts for renewable power. I was also responsible for 24
overseeing a variety of other dockets before the commission, including several electric 25
and gas utility rate cases. 26
Prior to being a commissioner at the Massachusetts DPU, I was employed as the Vice 27
President at Synapse; a Manager at Tellus Institute; the Research Director at the 28

Direct Testimony of Tim Woolf 2
Association for the Conservation of Energy; a Staff Economist at the Massachusetts 1
DPU; and a Policy Analyst at the Massachusetts Executive Office of Energy Resources. 2
I hold a Master’s in Business Administration from Boston University, a Diploma in 3
Economics from the London School of Economics, a BS in Mechanical Engineering and 4
a BA in English from Tufts University. My resume, attached as Schedule TW-1, presents 5
additional details of my professional and educational experience. 6
Q. On whose behalf are you testifying in this case? 7
A. I am providing evidence on behalf of Counsel to the Nova Scotia Utility and Review 8
Board. 9
Q. Have you previously testified before the Utility and Review Board? 10
A. Yes. I provided evidence on behalf of the Board in Matter No. M04819, regarding 11
Efficiency Nova Scotia Corporation’s Electricity Demand-Side Management (DSM) Plan 12
for 2013 ‒ 2015; and in Matter No. M03669, regarding Efficiency Nova Scotia 13
Corporation’s Electricity Demand-Side Management Plan for 2012. 14
Q. What is the purpose of your testimony? 15
A. The purpose of my testimony is to review the 2016-2108 DSM Plan filed by 16
EfficiencyOne (E1) in this docket. My testimony is focused on the appropriate DSM 17
budget and savings levels, and addresses a variety of related issues, such as affordability, 18
cost-effectiveness screening, and rate and bill impact analyses. I address the role of the 19
Nova Scotia Power Incorporated (NSPI or the Company) 2014 Integrated Resource Plan 20
(IRP) in informing the 2016-2018 DSM Plan. I also address the proposed changes to the 21
cost-effectiveness screening methodologies, as well as NSPI’s request for standardized 22
filing requirements. 23
2. SUMMARY OF CONCLUSIONS AND RECOMMENDATIONS 24
Q. Please summarize your primary conclusions. 25
A. My primary conclusions are as follows: 26

Direct Testimony of Tim Woolf 3
1. The results of NSPI’s 2014 IRP clearly indicate that increased levels of DSM will 1
lead to increased reductions in electricity costs and customer bills. Relative to the No 2
DSM Case, the Low DSM, Base DSM, and Mid DSM Cases were estimated to save 3
electricity customers roughly $1.3, $1.6, and $1.7 billion, respectively, over the 4
course of the study period. 5
2. NSPI’s alternative DSM plan is not more affordable than E1’s DSM Plan. It will 6
result in higher electricity costs and bills, will create lost opportunities, will create 7
customer inequities, and is not consistent with best practices in DSM program 8
design. 9
3. E1’s 2016-2018 DSM Plan is cost-effective and affordable. This is true not only in 10
terms of long-term reductions in electricity costs and bills, but also in terms of short-11
term rate impacts. 12
4. E1 could expand its DSM program budgets to reach higher savings levels. Such an 13
expansion would be consistent with the findings of the 2014 IRP, would 14
significantly increase the cost savings from the DSM programs, and would not result 15
in large or undue short-term rate increases. 16
5. The Program Administrator Cost (PAC) test offers several important advantages for 17
screening efficiency resources, relative to the Total Resource Cost (TRC) test. 18
Q. Please summarize your recommendations. 19
A. I recommend the following: 20
The Board should reject NSPI’s alternative DSM plan. 21
The Board should direct E1 to pursue additional DSM savings beyond those included 22
in the 2016-2018 DSM Plan. In particular, E1 should modify the DSM program 23
budgets to be comparable to the budgets in the Base DSM Case from the 2014 IRP, 24
and seek to achieve the DSM savings levels in the Mid DSM Case. 25
The Board should approve E1’s request to change the primary DSM screening test 26
from the TRC to the PAC for the purpose of future DSM cost-effectiveness analyses. 27

Direct Testimony of Tim Woolf 4
The Board should direct E1 to work with stakeholders to investigate other issues 1
regarding the cost-effectiveness testing practices, including (a) the appropriate 2
discount rate to use for screening; (b) screening at the sector level for decision-3
making purposes; and (c) the use of a template for identifying costs and benefits used 4
in screening. 5
The Board should direct E1 to work with stakeholders to develop a standardized 6
filing requirement for all future DSM plan filings. 7
3. OVERVIEW OF THE NSPI 2014 INTEGRATED RESOURCE PLAN 8
Q. Why do you begin your testimony with an overview of NSPI’s 2014 IRP? 9
A. The 2014 IRP provides an important foundation for the development of the 2016-2018 10
DSM Plan. In general, integrated resource planning allows for comprehensive, long-term 11
modeling analyses to investigate a diverse set of resource options, including a wide 12
variety of DSM options. 13
The IRP is used to estimate the long-run system costs associated with each resource 14
scenario, in terms of the net present value of revenue requirements (PVRR). The long-run 15
system cost is the primary factor used to identify the optimal resource plan. 16
Q. Please summarize the key findings of the 2014 IRP, with regard to DSM planning. 17
A. The 2014 IRP includes several different DSM cases to compare the impacts of adding 18
different amounts of DSM on the NSPI system. The key elements of the DSM cases are 19
presented in Table 3.1. 20

Direct Testimony of Tim Woolf 5
Table 3.1 DSM Cases in the 2014 IRP.1 1 Three-Year
Budget ($million)
Three-Year Savings (GWh)
Three-Year Cost of Saved
Energy ($/kWh)
Total Cost (PVRR
$million)
Savings vs. No DSM (PVRR $million)
No DSM 0 0 0 12,302 0
50% Low DSM not available not available not available 11,762 540
Low DSM 127 312 0.41 10,981 1,321
Base DSM 153 418 0.37 10,731 1,571
Mid DSM 183 519 0.35 10,623 1,679
High DSM 304 591 0.51 10,779 1,523
2
Q. Which DSM case did NSPI select as a part of its Preferred Resource Plan in the 3
2014 IRP? 4
A. In its final 2014 IRP report, NSPI did not select a Preferred Resource Plan. The Company 5
claimed that it would prefer to wait to determine the appropriate level of DSM investment 6
as part of the 2016-2018 DSM planning process.2 NSPI also expressed concerns about 7
affordability and near-term rate impacts resulting from DSM programs.3 8
Q. What did the Board find with regard to NSPI’s decision not to select a Preferred 9
Resource Plan in the 2014 IRP? 10
A. The Board stated that it was “very disappointed” with NSPI’s decision to not select a 11
Preferred Resource Plan in the 2014 IRP, and directed NSPI to select a Preferred 12
Resource Plan.4 13
Q. How did NSPI respond to the Board’s direction? 14
A. NSPI acknowledged that the Mid DSM Case is the lowest-cost case, and agreed to use 15
that case as the IRP’s Preferred Resource Plan.5 The Company also noted that “the 16
1 Synapse Energy Economics, October 20, 2014. Filing to the Nova Scotia Utility and Review Board on Nova Scotia Power’s October 15, 2014 Integrated Resource Plan: Key Planning Observations and Action Plan Elements, Case M05522, CRP and Sensitivity NPV RR Matrix. Navigant 2014. Nova Scotia 2015‐2040 Demand Side Management (DSM) Potential Study presented to Efficiency Nova Scotia. EfficiencyOne Evidence, February 27, 2015, p. 29.
2 NSPI, 2014 Integrated Resource Plan, NS Power Final Report, October 15, 2014, p. 9. 3 NSPI, 2014 Integrated Resource Plan, NS Power Final Report, October 15, 2014, p. 8. 4 Utility and Review Board, Letter to Nova Scotia Power, Re: Integrated Resource Plan 2014 / P-884.14, p. 3. 5 NSPI, Letter to the Utility and Review Board, Re: Integrated Resource Plan – M05522, p. 6.

Direct Testimony of Tim Woolf 6
amount of DSM suggested in the Plan is not affordable by our customers and NS Power 1
is committed to continue to work at refining the approach to DSM in an effort to arrive at 2
the most affordable and low cost approach for our customers.”6 3
4. OVERVIEW OF EFFICIENCYONE’S 2016-2018 DSM PLAN 4
Q. Please summarize how EfficiencyOne’s 2016-2018 DSM Plan compares to the cases 5
analyzed in the 2014 IRP. 6
A. E1’s DSM Plan builds off of the DSM cases in the 2014 IRP, but is not entirely 7
consistent with any one of those cases. With regard to costs, the E1 DSM Plan budgets 8
are comparable to the budgets of the Low DSM Case in the 2014 IRP.7 With regard to 9
savings, the E1 DSM Plan energy and capacity savings are comparable to the Base DSM 10
Case in the 2014 IRP.8 Additional details are provided in the figures below. 11
Q. Please summarize the energy savings included in EfficiencyOne’s DSM Plan. 12
A. Figure 4.1 presents the projected annual energy savings from E1’s DSM Plan. It also 13
includes historical annual energy savings, both in terms of planned savings and actual 14
savings. Figure 4.1 also presents the projected energy savings from the Low, Base, and 15
Mid DSM cases from the 2014 IRP, for comparison purposes. 16
6 NSPI, Letter to the Utility and Review Board, Re: Integrated Resource Plan – M05522, p. 6. 7 EfficiencyOne Evidence, February 27, 2015, p. 26. 8 The E1 Plan is designed to achieve roughly 98 percent of the energy savings and roughly 91 percent of the
capacity savings of the Base DSM Case. EfficiencyOne Evidence, February 27, 2015, p. 30.

Direct Testimony of Tim Woolf 7
Figure 4.1 Annual Energy Savings (GWh): Historical, E1 DSM Plan, and 2014 IRP Cases9 1
2
Figure 4.2 presents the same information, but in terms of annual energy savings as a 3
percent of NSPI retail sales. This is a commonly used way to normalize DSM savings 4
that allows for comparison of savings levels across different utilities, provinces, and 5
states. 6
9 E1(Synapse) IR-1, Attachment 1, Figure 2.2; E1(Synapse) IR-1, Attachment 2, Figure 1; E1(Synapse) IR-1, Attachment 3, Figure 2.1.1 and Figure 4.2.1; E1(Synapse) IR-2; EfficiencyOne Evidence, February 27, 2015, p. 6 and 22 - 24; Navigant 2014, Nova Scotia 2015‐2040 Demand Side Management (DSM) Potential Study presented to Efficiency Nova Scotia, Appendix C, p. 30 - 33; NSPI Evidence, April 10, 2015, Appendix B - NSPI Alternate DSM Plan Electronic REVISED.

Direct Testimony of Tim Woolf 8
Figure 4.2 Annual Energy Savings (Percent of Sales): Historical, E1 DSM Plan, and 2014 IRP Cases10 1
2
Q. Please summarize the capacity savings included in EfficiencyOne’s DSM Plan. 3
A. Figure 4.3 presents the projected annual capacity savings from E1’s DSM Plan. It also 4
includes historical actual annual capacity savings. Figure 4.3 also presents the projected 5
capacity savings from the Low, Base, and Mid DSM cases from the 2014 IRP, for 6
comparison purposes. 7
10 E1(Synapse) IR-1, Attachment 1, Figure 2.2; E1(Synapse) IR-1, Attachment 2, Figure 1; E1(Synapse) IR-1, Attachment 3, Figure 2.1.1 and Figure 4.2.1; E1(Synapse) IR-2; EfficiencyOne Evidence, February 27, 2015, p. 6 and 22 - 24; Navigant 2014, Nova Scotia 2015‐2040 Demand Side Management (DSM) Potential Study presented to Efficiency Nova Scotia, Appendix C, p. 30 - 33; NSPI Evidence, April 10, 2015, Appendix B - NSPI Alternate DSM Plan Electronic REVISED; NSPI (Synapse) IR-16. From 2015 to 2018, sales are assumed to decline consistent with the simple average growth rate from 2011 to 2014 (-2.3%).

Direct Testimony of Tim Woolf 9
Figure 4.3 Annual capacity Savings (MW): Historical, E1 DSM Plan, and 2014 IRP Cases11 1
2
Q. Please summarize the DSM budgets in EfficiencyOne’s DSM Plan. 3
A. Figure 4.4 presents the DSM program budgets for E1’s DSM Plan. It also includes 4
historical budgets, both in terms of planned savings and actual savings. Figure 4.4 also 5
presents the DSM program budgets of the Low, Base, and Mid DSM cases from the 2014 6
IRP, for comparison purposes. 7
11 E1(Synapse) IR-1, Attachment 1, Figure 2.2; E1(Synapse) IR-1, Attachment 3, Figure 2.1.1 and Figure 4.2.1; EfficiencyOne Evidence, February 27, 2015, p. 6 and 22 - 24; Navigant 2014, Nova Scotia 2015‐2040 Demand Side Management (DSM) Potential Study presented to Efficiency Nova Scotia, Appendix C, p. 30 - 33; NSPI Evidence, April 10, 2015, Appendix B - NSPI Alternate DSM Plan Electronic REVISED.

Direct Testimony of Tim Woolf 10
Figure 4.4 Annual DSM Budgets ($million): Historical, E1 DSM Plan, and 2014 IRP Cases12 1
2
Q. Please summarize the cost-effectiveness results of EfficiencyOne’s DSM Plan. 3
A. Figure 4.5 presents the benefit-cost ratios for E1’s DSM Plan, for the whole DSM 4
portfolio, for both the TRC test and the PAC test results. It also includes the historical 5
benefit-cost ratios. As indicated, the portfolio is highly cost-effective, particularly from 6
the perspective of the PAC test results. 7
Figure 4.5 Portfolio Benefit-Cost Ratios: Historical and E1 DSM Plan – TRC and PAC Tests13 8
9
12 E1(Synapse) IR-1, Attachment 1, Figure 2.2; E1(Synapse) IR-1 Attachment 2, Figure 1; E1(Synapse) IR-1, Attachment 3, Figure 2.1.1 and Figure 4.2.1; EfficiencyOne Evidence, February 27, 2015, p. 6 and 22 - 24; E1(Synapse) IR-2; Navigant 2014, Nova Scotia 2015‐2040 Demand Side Management (DSM) Potential Study presented to Efficiency Nova Scotia, Appendix C, p. 30 - 33; NSPI Evidence, April 10, 2015, Appendix B - NSPI Alternate DSM Plan Electronic REVISED.
13 E1(Synapse) IR-2; EfficiencyOne Evidence, February 27, 2015, p. 22 – 24.
Direct Testimony of Tim Woolf 11
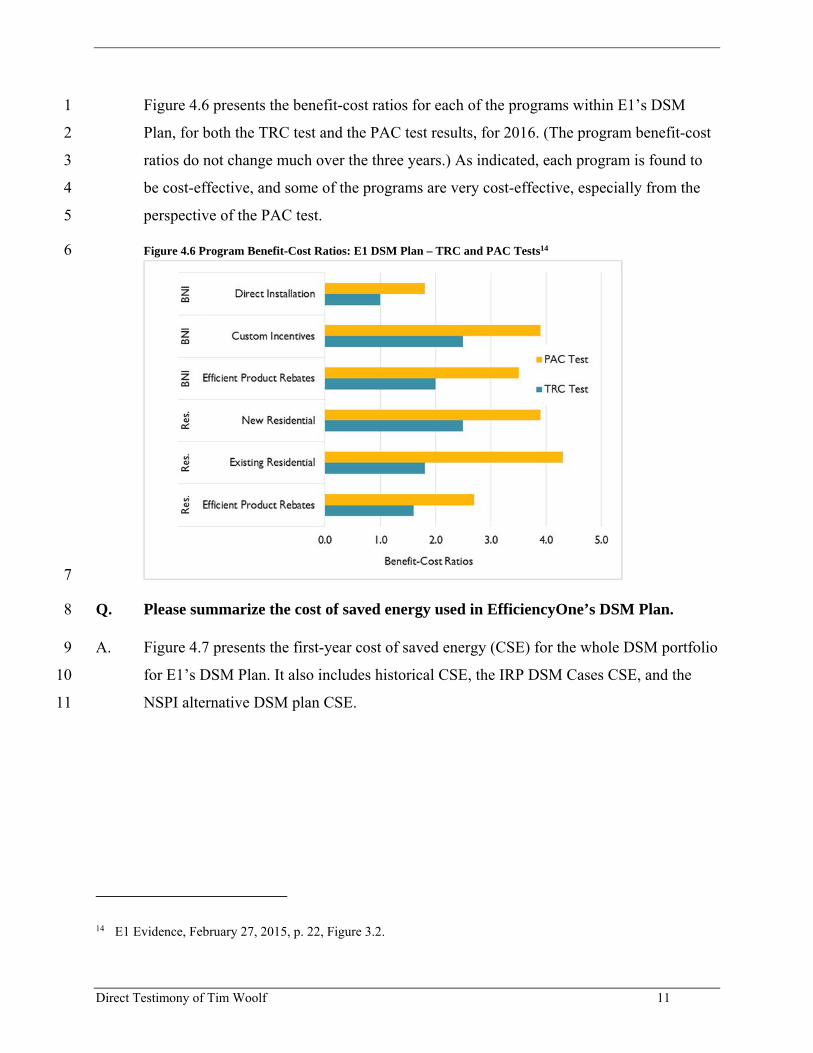
Figure 4.6 presents the benefit-cost ratios for each of the programs within E1’s DSM 1
Plan, for both the TRC test and the PAC test results, for 2016. (The program benefit-cost 2
ratios do not change much over the three years.) As indicated, each program is found to 3
be cost-effective, and some of the programs are very cost-effective, especially from the 4
perspective of the PAC test. 5
Figure 4.6 Program Benefit-Cost Ratios: E1 DSM Plan – TRC and PAC Tests14 6
7
Q. Please summarize the cost of saved energy used in EfficiencyOne’s DSM Plan. 8
A. Figure 4.7 presents the first-year cost of saved energy (CSE) for the whole DSM portfolio 9
for E1’s DSM Plan. It also includes historical CSE, the IRP DSM Cases CSE, and the 10
NSPI alternative DSM plan CSE. 11
14 E1 Evidence, February 27, 2015, p. 22, Figure 3.2.

Direct Testimony of Tim Woolf 12
Figure 4.7 First-Year Cost of Saved Energy ($/kWh): Historical, E1 DSM Plan, and 2014 IRP Cases15 1
2
5. OVERVIEW OF THE RATE AND BILL IMPACT STUDY 3
Q. What is the purpose of a rate and bill impact study? 4
A. The purpose of a rate and bill impact study is to provide the Board and others with useful 5
information regarding the extent to which the proposed DSM Plan is likely to impact 6
customer rates and bills over the short- and long-term future. The Energy Efficiency and 7
Conservation Restructuring Act (the Act) requires the consideration of affordability in 8
reviewing DSM Plans. Affordability has two different aspects that are sometimes in 9
tension: lower costs versus higher rates. The cost-effectiveness analysis indicates the 10
extent to which the DSM programs might lower costs. The rate and bill impact 11
assessment indicates the extent to which DSM programs might increase rates. 12
Q. What are the key elements to a rate and bill impact study? 13
A. In order to fully understand the rate and bill implications of energy efficiency programs, 14
it is necessary to consider three types of impacts: rate impacts, bill impacts, and DSM 15
program participation rates. Rate impacts, properly estimated, indicate the extent to 16
15 E1(Synapse) IR-1, Attachment 1, Figure 2.2; E1(Synapse) IR-1 Attachment 2, Figure 1; E1(Synapse) IR-1, Attachment 3, Figure 2.1.1 and Figure 4.2.1; EfficiencyOne Evidence, February 27, 2015, p. 6 and 22 - 24; E1(Synapse) IR-2; Navigant 2014, Nova Scotia 2015‐2040 Demand Side Management (DSM) Potential Study presented to Efficiency Nova Scotia, Appendix C, p. 30 - 33; NSPI Evidence, April 10, 2015, Appendix B - NSPI Alternate DSM Plan Electronic REVISED.

Direct Testimony of Tim Woolf 13
which rates might increase due to energy efficiency. Bill impacts indicate the extent to 1
which average customer bills might be reduced due to energy efficiency. Participation 2
rates indicate the extent to which customers will experience bill reductions or bill 3
increases. Taken together, these three measures indicate the extent to which customers as 4
a whole will be affected by energy efficiency. 5
Q. How should rate impacts be estimated? 6
A. Rate impact estimates should account for all factors that impact rates, either positively or 7
negatively. This would include all avoided costs that might exert downward pressure on 8
rates (e.g., generation, transmission, and distribution), including the avoided costs of 9
complying with environmental regulations. Rate impacts should be estimated over the 10
long term, to capture the full period of time over which the efficiency savings will occur. 11
Rate impacts should also be put into terms that place them in a meaningful context; for 12
example, in terms of cents per kilowatt-hour or percent of total rates. 13
Q. How should bill impacts be estimated? 14
A. The bill impacts should build upon the estimates of rate impacts described above. The 15
rate impacts apply to every customer within the rate class analyzed. Bill impacts, on the 16
other hand, will vary among customers depending upon whether they participate in the 17
DSM programs, and depending upon which DSM program they participate in. Ideally, 18
bill impacts should be estimated separately for each of the types of DSM programs. As 19
with rate impacts, bill impacts should be estimated over the long term, and they should be 20
put into terms that place them in a meaningful context; for example, in terms of dollars 21
per month or percent of total bills. 22
Q. How should program participation rates be estimated? 23
A. Program participation rates should be estimated by dividing the program participants by 24
the total population of eligible customers to get a rate in percentage terms. This should be 25
done for each year, and for each program. Participation rates should be compiled across 26
several years to indicate the extent to which customers are participating in the programs 27
over time. To the extent possible, participation in multiple programs and across multiple 28
years should be accounted for. The long-term program participation rates can be 29

Direct Testimony of Tim Woolf 14
compared with the long-term bill impacts and the long-term rate impacts to get a sense of 1
the extent to which customers are benefiting from the DSM programs. 2
Q. How should all this information be used? 3
A. This information should be used by regulators and utilities to strike an appropriate 4
balance between reduced costs and increased rates. This information should be used to 5
answer several key questions: 6
How much will the efficiency programs reduce electricity system costs and average 7
customer bills? 8
How much will the efficiency programs increase customer rates, over the short term 9
and long term? 10
What portion of customers is expected to participate in efficiency programs over the 11
long term, and thereby experience a net reduction in bills? 12
Answers to these questions will help regulators and utilities to understand the full impact 13
of efficiency programs, and to balance the tradeoffs between reduced costs and increased 14
rates. 15
Rate Impacts 16
Q. Please summarize what the EfficiencyOne rate and bill impact study finds with 17
regard to the rate impacts of the different DSM Cases. 18
A. Figure 5.1 presents a summary of E1’s estimate of the residential rate impacts of the Low 19
DSM Case in the 2014 IRP. This analysis compares the rate impacts of the Low DSM 20
Case to a hypothetical case where there are no DSM programs at all. In the next three 21
years, the Low DSM Case is expected to result in rates that are roughly 3 percent higher 22
than the rates in a case where there were no DSM programs. Over the long term, 23
however, the Low DSM Case is expected to result in lower rates as a result of the 24
capacity costs avoided by the DSM savings. 25

Direct Testimony of Tim Woolf 15
Figure 5.1 Rate Impacts of the Low DSM Case, Relative to No DSM - Residential16 1
2
Figure 5.1 also presents the average rate impact over the study period. As indicated, the 3
average rate impact is estimated to be quite low; roughly 0.06 percent. 4
Q. Does the rate and bill impact study provide additional information that would be of 5
use to the Board? 6
A. Yes. A comparison of a DSM case relative to a hypothetical future with no DSM is of 7
limited use, because such a hypothetical future is not likely to occur. A much more 8
relevant question for this docket is: How much is a particular DSM case likely to increase 9
rates relative to other DSM cases? In particular, what are the likely rate impacts of the 10
Low DSM Case relative to a case with lower budgets and lower savings, or a case with 11
higher budgets and higher savings? 12
Q. Does the rate and bill impact study address these questions? 13
A. Yes. The study estimates the rate impacts of the 50% Low DSM Case, the Base DSM 14
Case and the Mid DSM Case from the 2014 IRP. 15
16 E1 Response to Synapse IR-17, Attachment1.

Direct Testimony of Tim Woolf 16
Q. What does the rate and bill impact study find with regard to the Mid DSM Case? 1
A. Figure 5.2 presents a summary of the estimated rate impacts as a result of the Mid DSM 2
Case. It presents the impacts of the Low DSM Case (as in Figure 5.1), as well as the 3
additional impacts of the Mid DSM Case. The Mid DSM Case is expected to result in 4
greater rate impacts (both positive and negative) than the Low DSM Case, relative to no 5
DSM programs at all. 6
Figure 5.2 Rate Impacts of the Low DSM Case and the Mid DSM Case, Relative to No DSM - Residential17 7
8
The long-term average rate impacts from both plans are expected to be very similar: the 9
long-term average for the Low DSM Case is 0.06 percent increase in rates, while the 10
long-term average for the Mid DSM Case is a 0.02 percent reduction in rates. 11
Q. How would the Mid DSM Case affect rates relative to the Low DSM Case? 12
A. Figure 5.2 above also indicates how the Mid DSM Case would affect rates relative to the 13
Low DSM Case. The green bars indicate the impact that the Mid DSM Case would have 14
above and beyond the Low DSM Case. It shows that in the early years the Mid DSM 15
Case would result in rates that are roughly two percent higher, but over the long-term 16
17 E1 Response to Synapse IR-17, Attachment1.

Direct Testimony of Tim Woolf 17
average the Mid DSM Case would result in rates that are roughly the same as the Low 1
DSM Case. 2
Q. What does the rate and bill impact study find with regard to the 50% Low Case? 3
A. Figure 5.3 presents a summary of the estimated rate impacts as a result of the 50% Low 4
DSM Case. It presents the impacts of the Low DSM Case (as in Figure 5.1), as well as 5
the additional impacts of the 50% Low DSM Case. The 50% Low DSM Case is expected 6
to result in smaller rate impacts (both positive and negative) than the Low DSM Case, 7
relative to no DSM programs at all. 8
Figure 5.3 Rate Impacts of the 50% Low DSM Case - Residential18 9
10
The long-term average rate impacts from both plans are expected to be very similar: the 11
long-term average for the Low DSM Case is 0.06 percent increase in rates, while the 12
long-term average for the 50% Low DSM Case is a 0.0 percent increase in rates. 13
Q. What does the rate and bill impact study find with regard to rate impacts on other 14
customer classes? 15
A. The study results are fairly similar across the customer classes. 16
18 E1 Response to Synapse IR-17, Attachment1.
Direct Testimony of Tim Woolf 18
When comparing the Low DSM Case to the No DSM Case, the short-term rate 1
impacts are roughly two to three percent, and the long-term rate impacts are very 2
small, sometimes positive and sometimes negative. 3
When comparing the Mid DSM Case to the Low DSM Case, the differences are very 4
small, with short-term rate impacts of roughly one percent, and long-term rate 5
impacts that are so small as to be negligible. 6
Note that these rate impact analyses should be seen as rough estimates, with some 7
limitations in methodology, with several uncertainties, and a material range of error. 8
Q. What are the limitations in the methodology of the rate and bill impact analysis? 9
A. The rate and bill impact study does not include two factors that will affect customer rates 10
and bills. 11
First, the analysis does not account for the fact that DSM savings will result in reduced 12
sales, which will result in reduced revenues, relative to no DSM. Whenever NSPI has a 13
rate case, the rates will have to be higher than they would have been without the DSM, in 14
order to recover fixed costs over a reduced level of sales. This can have a significant 15
impact on rates, depending upon how frequently NSPI has rate cases and the magnitude 16
of efficiency savings. E1 does not include this impact on rates in the rate and bill impact 17
study but offers to investigate that analysis for the next rate and bill impact study.19 18
Second, the price of fuel would likely be reduced as a result of purchasing and consuming 19
less fuel in E1’s DSM Plan. E1 does not include the avoided energy costs in the rate 20
impact analysis, because those avoided energy costs would not reduce electricity prices. 21
Energy costs are simply passed on to customers through the fuel adjustment mechanism 22
(FAM), and thus avoided energy costs do not necessarily reduce the price of energy in the 23
FAM. However, the price of fuel that is included in the FAM is likely to be reduced as a 24
result of purchasing and consuming a smaller volume of fuel in the DSM Plan. In other 25
words, reducing consumption of the marginal fuel source should bring down the average 26
19 EfficiencyOne Evidence, February 27, 2015, Appendix D, Attachment 1.

Direct Testimony of Tim Woolf 19
fuel price, and this average fuel price is used in the FAM. E1 does not include this 1
reduction in the FAM price in the rate and bill impact study. E1 indicates that this 2
analysis has not been a focus of attention to date but that it would be pleased to begin 3
making refinements in this area.20 4
Q. What do these omissions imply about the value of the rate and bill impact analysis? 5
A. They imply that the Board and other parties should use the result of the analysis with 6
caution. The two impacts will offset each other, because the impact of the FAM price will 7
reduce prices while the impact of reduced revenues will increase prices. However, there 8
is no reason to believe that the two impacts will completely offset each other. Therefore, 9
the results of E1’s current rate and bill impact should be seen as high-level 10
approximations that illustrate some of the rate impact issues, but they should not be 11
considered as precise forecasts. 12
Q. Is there another perspective to consider when analyzing rate impacts? 13
A. Yes. Customers tend to notice rates and bills when they change over time. That is, 14
customers are likely to notice when rates increase (or decrease) from one month to the 15
next, or from one year to the next. In fact, this type of rate impact is more meaningful to 16
customers than a comparison of two DSM scenarios when one of those scenarios will not 17
occur, by definition. I refer to these impacts as “year-to-year” impacts, to distinguish 18
them from a comparison of a DSM scenario with scenario without DSM. 19
Q. Is there a good way to indicate how rates might change from year to year as a result 20
of the DSM programs? 21
A. Yes. One way is to assess how the DSM budget changes from one year to the next. 22
Figure 5.4 presents the total DSM budgets for the historical years of 2011-2014, the 23
planned budget for 2015, and the expected budgets for 2016-2018 under three different 24
DSM scenarios. 25
20 EfficiencyOne Evidence, February 27, 2015, Appendix D, Attachment 1.

Direct Testimony of Tim Woolf 20
Figure 5.4 Residential DSM Charges: Historical and under Three IRP Cases 1
2
Q. What conclusions do you draw from this comparison of the DSM budgets? 3
A. This comparison of DSM budgets suggests that: 4
Under the E1 DSM Plan, the DSM budgets would be comparable to the budgets of 5
recent years. This suggests that the year-to-year rate impacts of the E1 DSM Plan 6
would be negligible. 7
Under the IRP Base DSM Case, the DSM budgets would be higher than those of 8
recent years. This suggests that customers would experience a slight increase in rates 9
from 2015 to 2016, and then negligible year-to-year rate impacts after that. 10
Under the NSPI alternative DSM Plan, the DSM budgets would be significantly 11
lower than those of recent years. This suggests that customers would experience a 12
slight reduction in rates in from 2015 to 2016, and then negligible year-to-year rate 13
impacts after that. 14
In sum, the year-to-year rate impacts of this range of DSM plans will be much smaller 15
than the rate impacts described above, which compare the DSM plans to a hypothetical 16
scenario with no DSM programs at all. This is a very important finding to keep in mind, 17
given that year-to-year rate impacts are more important to customers than rate impacts 18
relative to hypothetical scenarios. 19

Direct Testimony of Tim Woolf 21
Bill Impacts 1
Q. What does the rate and bill impact study find with regard to the bill impacts of the 2
proposed DSM programs? 3
A. First, it is important to note that there are two types of bill impacts: the impacts on 4
program participants and the impacts on non-participants. The bill impacts on non-5
participants will be similar to the rate impacts described above. As non-participants’ rates 6
increase or decrease, their bills will increase or decrease commensurately.21 7
The bill impacts on program participants will be a result of two effects: the increase in 8
rates, and the reduction in consumption as a result of the efficiency savings. The 9
reduction in consumption will depend upon which efficiency measures each participant 10
adopts, and therefore can vary considerably across participants. 11
It is also useful to present the bill impacts on “total” customers. This is a combination of 12
the bill impacts on all customers, both participants and non-participants. While there is no 13
single customer that falls into the total customer category, it is nonetheless useful for 14
indicating how bills might change across all customers as a whole. Also, the results on 15
total customers will present similar information as the results of the cost-effectiveness 16
analysis using the PAC test. Both analyses present the extent to which average customer 17
bills are reduced by the DSM programs. The total customer bill impact presents the 18
results in terms of the percent of customer bills, while the PAC test presents the results in 19
terms of present value of net benefits and a benefit-cost ratio. 20
Q. Please summarize the bill impact results of the rate and bill study. 21
A. Figure 5.5 presents the long-term average bill impacts for residential customers, 22
including the impacts on participants, non-participants, and customers in total. It shows 23
the bill impacts for the Low DSM Plan as well as the Mid DSM Case, relative to the No 24
DSM Case. As with the rate impacts, the long-term average bill impacts for the non-25
participants are quite small. The participant impacts, on the other hand, are dramatic—26
21 If customers pay a fixed customer charge or demand charge, they will experience a larger percentage impact on their rates than the percentage impact on their bills.
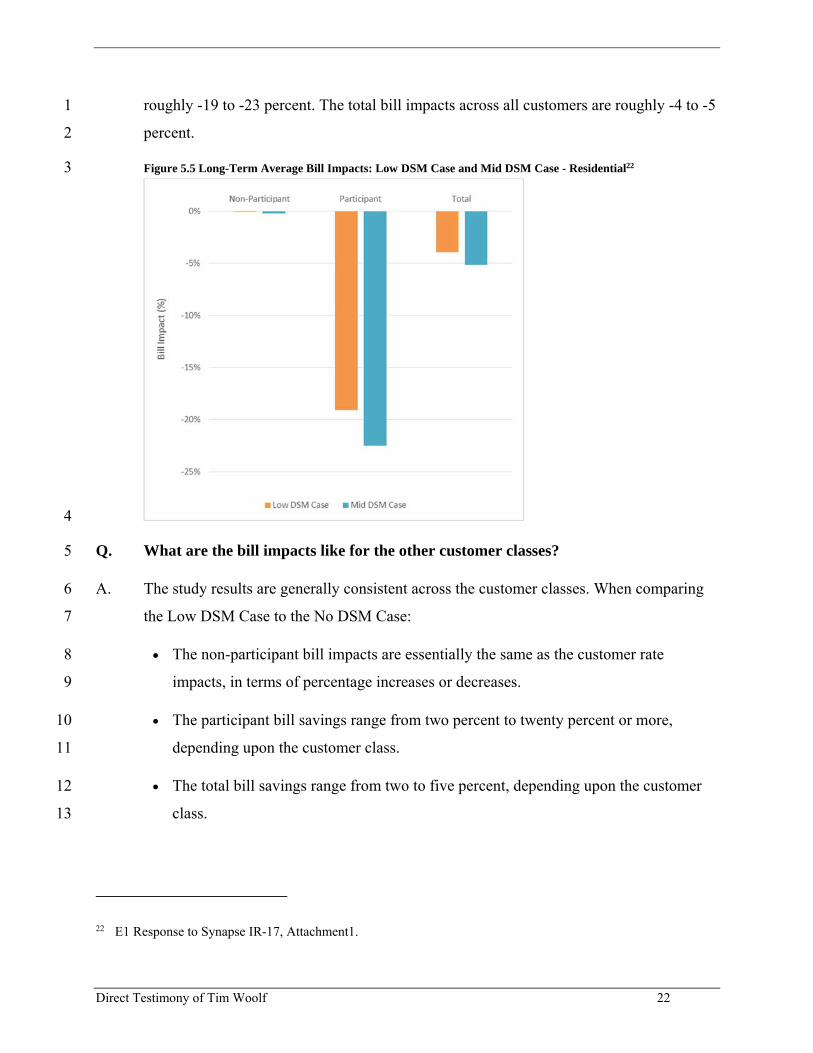
Direct Testimony of Tim Woolf 22
roughly -19 to -23 percent. The total bill impacts across all customers are roughly -4 to -5 1
percent. 2
Figure 5.5 Long-Term Average Bill Impacts: Low DSM Case and Mid DSM Case - Residential22 3
4
Q. What are the bill impacts like for the other customer classes? 5
A. The study results are generally consistent across the customer classes. When comparing 6
the Low DSM Case to the No DSM Case: 7
The non-participant bill impacts are essentially the same as the customer rate 8
impacts, in terms of percentage increases or decreases. 9
The participant bill savings range from two percent to twenty percent or more, 10
depending upon the customer class. 11
The total bill savings range from two to five percent, depending upon the customer 12
class. 13
22 E1 Response to Synapse IR-17, Attachment1.

Direct Testimony of Tim Woolf 23
As with the rate impacts, these bill impact results should be used with some caution, 1
given the limitations of the study methodology. They are useful for drawing general 2
conclusions regarding the bill impacts on participants, non-participants and customers in 3
total. 4
Participation Rates 5
Q. What does the rate and bill impact study find with regard to the participation rates 6
of the proposed DSM programs? 7
A. The rate and bill impact study presents the amount of customer participation in each of 8
the programs, for each customer sector. It also uses the number of eligible customers by 9
program to estimate the participation rate for each program. The study presents both 10
annual and cumulative participation rates for 2016 through 2018. 11
Q. Please describe some of challenges in estimating program participation rates. 12
A. There are several challenges in estimating participation rates for DSM programs. One of 13
the greatest challenges is accounting for customers that participate in more than one DSM 14
program, either within a year or across years. To the extent that this occurs, customers 15
may be double-counted, thereby indicating a higher number of participants and higher 16
participation rates than what actually occurs. On the other hand, those customers that do 17
participate more than once will experience even greater reductions in bills. E1 has 18
attempted to remove duplicate participants in its estimates of participation impacts. 19
For some programs, the number of eligible customers may be very different from other 20
programs, which makes it difficult to compare participation rates across programs. This is 21
especially true for the New Residential program, where the eligible customers are a small 22
fraction of the total residential customers. In such cases, care must be taken in presenting 23
the participation rates and in adding the participation rates into those of other programs. 24
In some cases, customers from several different sectors may participate in a single 25
program. For example, the Efficient Products program serves many residential customers, 26
but commercial and industrial customers can participate as well. For these programs, E1 27

Direct Testimony of Tim Woolf 24
has estimated the number of customers that will participate from each customer class, in 1
order to avoid double-counting or under-counting across customer classes. 2
Q. Please summarize the rate and bill impact study findings with regard to the 3
participation rates in the residential sector. 4
A. Figure 5.6 presents a summary of the cumulative participation rates for the residential 5
programs. It includes the actual participation rates for historical DSM activities (2011-6
2014), the expected participation rates for 2015 programs, and the projected participation 7
rates for the 2016-2018 DSM Plan.23 It also indicates the extent to which participation 8
rates would increase under the Mid DSM Case from the 2014 IRP. 9
Figure 5.6 Cumulative Participation Rates for Residential Programs24 10
11
It is most useful to present cumulative rate impacts over this entire period, to indicate the 12
extent to which customers will be able to offset rate increases by participating in 13
efficiency programs. Customers participating in efficiency programs in any one year will 14
be able to offset rate increases that may occur many years into the future. Note that this 15
graph does not include participation in programs from 2008 through 2010, and therefore 16
understates the cumulative participation to date. 17
23 Actual participation rates for 2011-2014 are from E1 Response to Synapse IR-18. Estimated participation rates for 2015 are from E1 Response to Synapse IR-19. Forecasted participation rates for 2016-2018 are from E1 Response to Synapse IR-17.
24 E1 Response to Synapse IR-17, Attachment1.

Direct Testimony of Tim Woolf 25
Also, note that the New Residential program participation rate is presented using the total 1
amount of residential customers as eligible participants, even though only new homes are 2
eligible for the program. This is done to be able to compare the New Residential program 3
participation rates alongside the other programs, and to add those participants in the 4
residential total participants. 5
Q. How should one interpret the fact that the total participation rate exceeds 100 6
percent of customers in 2016 and beyond? 7
A. Of course, it is not possible for more than 100 percent of residential customers to 8
participate in efficiency programs. The participation rates that exceed 100 percent 9
indicate that there are cases where the same customer participates more than once; either 10
within a year to across years. While E1 attempted to adjust the participation numbers for 11
multiple participation, it appears that some remains. It is especially likely that there is 12
multiple participation across the Efficient Products and the Energy Savings Actions 13
programs, because the latter program encourages customers to participate in the former. 14
For this reason it is important to interpret the participation rates results with caution, 15
especially where participation rates are added across multiple programs. 16
Figure 5.7 presents the same information as Figure 5.6, but with the participation of the 17
Energy Savings Actions removed. This figure probably understates participation rates, 18
given that it completely excludes a program that serves many customers, while Figure 5.6 19
overstates participation rates, as it apparently includes multiple participation by some 20
customers. 21

Direct Testimony of Tim Woolf 26
Figure 5.7 Cumulative Participation Rates for Residential Programs – Energy Savings Actions Removed25 1
2
NSPI Analysis of Rate, Bill, and Participation Impacts 3
Q. NSPI does not use the rate and bill impact study prepared by EfficiencyOne. What 4
reason does it give for not using the study? 5
A. NSPI notes that E1’s rate and bill impact (RBIM) study is incomplete because it does not 6
account for the periodic adjustment to rates that is necessary to account for the ongoing 7
recovery of fixed costs that are embedded in rates. NSPI claims that this results in an 8
understatement of rate and bill impacts. The Company recommends that the current 9
version of the RBIM study be disregarded by the Board and stakeholders because it is 10
incomplete.26 11
Q. Do you agree with NSPI on this point? 12
A. I do agree with NSPI that it is important to somehow account for the increase in rates that 13
is likely to occur from the recovery of the fixed-cost portion of lost revenues. However, I 14
do not agree that the RBIM study should be completely disregarded because it does not 15
account for this effect. Instead, the RBIM study should be used in a way that recognizes 16
25 E1 Response to Synapse IR-17, Attachment1. 26 NSPI Evidence, p. 44.

Direct Testimony of Tim Woolf 27
its limitations, both those that might understate rate impacts and those that might 1
overstate them, as noted above. 2
Furthermore, the RBIM study provides some useful information regarding participation 3
rates, described in the previous section. The analysis of participation rates is completely 4
unaffected by the rate impact analysis, and therefore does not suffer from the omission 5
cited by NSPI. Consequently, it is inappropriate to simply reject the participation rate 6
analysis for the reason cited by NSPI. 7
Q. Does NSPI conduct any rate, bill, or participation impact analysis itself? 8
A. No.27 9
Rate and Bill Impacts of the IRP Cases Relative to E1’s 2016-2018 DSM Plan 10
Q. What does this analysis of rate impacts indicate about E1’s 2016-2018 DSM Plan? 11
A. The DSM scenarios used in the rate and bill impact analysis are from the 2014 IRP and 12
are not consistent with the DSM proposals from E1 or NSPI. In particular, E1’s DSM 13
Plan assumes budgets that are comparable to the Low DSM Case, but savings that are 14
comparable to the Base DSM Case. Because of these differences it is difficult to draw 15
detailed conclusions from the rate and bill impact study regarding the EI DSM Plan. 16
However, it is possible to draw some general conclusions. 17
Q. What general conclusions regarding the E1 DSM Plan can you draw from the rate 18
and bill impact study? 19
A. In terms of program budgets, the E1 DSM Plan is comparable to the Low DSM Case 20
from the IRP. Therefore, this case will provide a reasonable indication of the short-term 21
rate impacts associated with the recovery of DSM costs. 22
However, the E1 DSM Plan is assumed to achieve higher savings than the Low DSM 23
Case, which should result in greater amounts of avoided costs and therefore lower rates 24
over the long term, relative to what is found in the Low DSM Case. Therefore, the E1 25
27 NSPI Response to Synapse IR-2.

Direct Testimony of Tim Woolf 28
DSM Plan is likely to have short-term rate impacts that are close to those identified in the 1
Low DSM Case, but lower long-term rate than those identified in the Low DSM Case. 2
6. NSPI’S ALTERNATIVE DSM PLAN 3
Q. Please summarize NSPI’s alternative DSM plan. 4
A. NSPI recommends a DSM plan with a spending level of approximately $22 million per 5
year. NSPI does not provide many details regarding the alternative DSM plan. Instead, it 6
recommends that essentially the same DSM programs be offered, but with the most 7
expensive efficiency measures removed. In this way, NSPI argues, the costs of the DSM 8
programs will be significantly reduced, without a commensurate reduction in efficiency 9
savings. 10
Q. On what basis does NSPI recommend the alternative DSM plan with such reduced 11
budgets? 12
A. NSPI argues that its alternative DSM plan will be more affordable for its customers. The 13
Company refers to Section 79I(1) of the Act, noting that one of the goals behind the new 14
DSM model in Nova Scotia is to make electricity more affordable.28 15
NSPI also points to other regions in Canada that operate DSM programs at a lower cost 16
of saved energy (CSE), and claim that Nova Scotia can and should operate DSM 17
programs at comparable CSE levels.29 18
Affordability 19
Q. Do you agree that NSPI’s alternative DSM plan will be more affordable than E1’s 20
DSM plan? 21
A. No. There are several different aspects of affordability, with regard to electricity services. 22
One aspect is electricity rates: lower rates are more affordable than higher rates. Another 23
aspect is electricity bills: lower bills are more affordable than higher bills. 24
28 NSPI Evidence, p. 14. 29 NSPI Evidence, p. 3, pp. 15-22.

Direct Testimony of Tim Woolf 29
With regard to DSM resources, the goal of maintaining low rates is sometimes in conflict 1
with the goal of maintaining low bills. Cost-effective DSM programs will reduce 2
customer bills on average, but may increase customer rates. (This effect is demonstrated 3
in Section 5 of my testimony.) Ultimately, a customer’s electricity bill is a better 4
indication of what is affordable, relative to the electricity rate, because the bill determines 5
the amount of money paid by the customer. Nonetheless, electricity rates are also an 6
important consideration when assessing affordability, especially because some customers 7
may not participate in the DSM programs and may primarily experience increased rates. 8
(E1’s projection of participants and non-participants is also presented in Section 5 of my 9
testimony.) 10
Q. How does NSPI present the issue of affordability? 11
A. NSPI discusses affordability almost entirely in terms of the amount of budget spent on 12
the DSM programs. The Company’s evidence focuses on reducing the cost of saved 13
energy and reducing the DSM budgets, implying that these two factors are the only 14
indication of affordability.30 15
Q. Are there other indicators of affordability? 16
A. Yes. In my view, the most important indicator of the affordability of a DSM plan is its 17
impact on electricity system costs, as measured by the net present value of revenue 18
requirements (PVRR). The revenue requirements indicate the amount of money that 19
customers will be expected to pay for electricity services over the long term. Those 20
resource plans and portfolios that result in the lowest PVRR will result in the lowest costs 21
to customers, and therefore will be most affordable to customers. 22
When screening DSM resources, the PAC test provides a direct indication of the potential 23
for DSM resources to reduce utility system PVRR. Therefore, the results of the PAC test 24
are a good indicator of the affordability of DSM programs. This is one of the reasons that 25
I support the proposal to use the PAC test for screening DSM resources in Nova Scotia. (I 26
address this issue in more detail in Section 8 of my testimony.) 27
30 See for example, NSPI Evidence, pp. 14-15 and 24-25.

Direct Testimony of Tim Woolf 30
Q. What do the results of the 2014 IRP indicate about the ability of DSM to reduce 1
utility system costs? 2
A. The 2014 IRP clearly indicates that higher levels of DSM savings will lead to lower 3
levels of utility system costs, in terms of lower PVRR. As indicated in Table 3.1 above, 4
the 50% Low, Low, Base, and Mid DSM Cases from the 2014 IRP are estimated to save 5
roughly $540, $1,321, $1,571, and $1,679 million in PVRR relative to the no DSM case, 6
respectively. 7
Q. How much will EfficiencyOne’s 2016-2018 DSM Plan reduce utility system costs? 8
A. E1 estimates that the 2016-2018 DSM Plan will reduce utility system costs by $296 9
million in PVRR. This value is the net benefit from the perspective of the PAC test, 10
which includes the impact on revenue requirements from the DSM Plan, relative to no 11
DSM. (This result is considerably lower than the reductions in utility system costs 12
identified in the 2014 IRP and cited in the previous answer, because the DSM Plan 13
considers only DSM investments for the three-year period, while the IRP considers DSM 14
investments that continue through the entire study period.) 15
Q. What are the likely rate impacts of E1’s and NSPI’s DSM plans? 16
A. To answer this question properly, it is important to consider the rate and bill impacts over 17
both the short-term and long-term future. In general, increased spending on cost-effective 18
DSM programs will result in: 19
increased rates over the short term; 20
similar rates over the long term; and 21
lower average bills over both the short and the long term. 22
Figure 5.3 above presents the difference in annual rate impact between the Low DSM 23
Case and the 50% Low DSM Case in the 2014 IRP, over both the short term and the long 24
term, for the residential class. As indicated, over the short term, the Low DSM Case will 25
increase rates by less than 2 percent relative to the 50% Low DSM case. However, over 26
the long term, the Low DSM Case is expected to result in slightly lower rates relative to 27
the 50% Low DSM case. 28

Direct Testimony of Tim Woolf 31
Note that NSPI’s alternative DSM Plan is not identical to the 50% Low DSM Case in the 1
IRP, and E1’s DSM Plan is not identical to the Low DSM Case in the IRP. Nonetheless, 2
the IRP cases illustrate the key point regarding the magnitude of short-term versus long-3
term rate and bill impacts. In sum, the short-term rate impacts are small and are offset 4
against the long-term rate and bill impacts. 5
Q. How should the Board consider the issue of short-term versus long-term impacts? 6
A. In general, regulatory commissions have an obligation to encourage utilities to provide 7
safe, reliable, low-cost electricity services. They also have an obligation to ensure that 8
utility actions, initiatives, and resource planning decisions are in the public interest. In 9
order to achieve these key goals, regulators must consider the long-term implications of 10
their policies, as well as the short-term implications. 11
Supply-side generation, transmission, and distribution resources can easily last for 30 12
years or more, with cost implications for just as long. Consequently, utility and regulatory 13
commissions must consider the long-term cost implications of both supply-side and 14
demand-side resources. Otherwise, too much emphasis on short-term rates can result in 15
higher long-term costs. 16
Q. Please summarize your points regarding the affordability of the E1 DSM Plan and 17
the NSPI alternative DSM plan. 18
A. NSPI’s discussion of affordability is incomplete, because it focuses only on the short-19
term rate impacts while ignoring the short term bill impacts and the long-term rate and 20
bill impacts. A complete analysis of the affordability of the two DSM plans suggests that 21
(a) the E1 DSM Plan will result in significantly lower net costs than NSPI’s plan, and (b) 22
the E1 DSM plan will result in higher rates over the short term but very similar rates over 23
the long term. This more complete picture suggests that E1’s DSM Plan will be more 24
affordable than NSPI’s. 25
Q. Is affordability the only factor to consider when evaluating DSM plans? 26
A. No. Affordability, both in terms of electricity costs and electricity rates, is an important 27
consideration when evaluating DSM plans, but it is not the only consideration. It is also 28

Direct Testimony of Tim Woolf 32
necessary to consider issues that are more difficult to quantify but are important 1
nonetheless. For example, it is important to consider customer equity impacts and best 2
practices in program design. 3
Q. How should customer equity impacts be considered when designing and evaluating 4
DSM programs and plans? 5
A. Customers who participate in DSM programs will experience immediate reductions in 6
electricity bills. DSM programs should seek to provide opportunities for all customer 7
types, and indeed all customers, to participate in DSM programs in one way or another. 8
Broader, more comprehensive customer participation will make the set of DSM programs 9
more equitable, while narrow, more limited customer participation will make the DSM 10
programs less equitable. 11
Q. How is NSPI’s alternative DSM plan likely to affect the equity of the efficiency 12
programs? 13
A. NSPI’s alternative DSM plan explicitly excludes the most expensive efficiency measures 14
in order to reduce the cost of the programs, even though these measures are cost-effective 15
and less expensive than supply-side alternatives. This approach will reduce the number of 16
efficiency measures being provided, and will reduce the extent to which customers will 17
be able to participate in the programs and reduce their bills. 18
For example, low-income and small business customers are some of the most difficult 19
and most expensive customers to serve. By narrowing down the list of available 20
efficiency measures, the NSPI DSM plan will make it more difficult for these customers 21
to be served. This is an inequitable outcome. 22
In fact, if NSPI’s rationale were taken to its logical extension, that only the lowest-cost 23
efficiency measures should be supported, then this would lead to a set of programs where 24
only the medium and large business customers are provided with efficiency services. This 25
would clearly be an inequitable outcome. A better approach would be to promote the 26
implementation of all cost-effective efficiency measures, in a way that serves as many 27
types of customers, and as many customers, as possible. 28

Direct Testimony of Tim Woolf 33
Q. How should best practices in program design be considered when designing and 1
evaluating DSM programs and plans? 2
A. One of the important goals in designing DSM programs is to avoid lost opportunities. 3
Lost opportunities arise when a customer does not implement an efficiency measure 4
when he or she has the opportunity to do so, and it becomes uneconomic to implement 5
the measure at a later time. For example, during the course of a residential home energy 6
audit, an auditor might identify nine different cost-effective efficiency measures. If the 7
DSM program only provides customer incentives for the four lowest-cost measures, then 8
the customer is very unlikely to install the remaining five measures, and these five 9
measures will become lost opportunities. Further, it would not make sense for E1 to try to 10
implement those remaining five measures at a later point in time, because it would be 11
much more expensive to visit that customer’s home again in the future. NSPI’s 12
alternative DSM plan is not consistent with best practices in DSM program design 13
because it will result in significant lost opportunities, by its very design. 14
Comparison with Other Jurisdictions 15
Q. Does NSPI offer any other justifications for its alternative DSM plan? 16
A. In the executive summary of its evidence, NSPI states that the “E1 DSM Plan is neither 17
cost-effective nor affordable when measured in the context of the following: 18
the E1 DSM Plan recommends DSM spending that is among the highest in Canada 19
on both a per-capita basis and a per-customer basis; 20
the level of DSM proposed by E1 is significantly more than required to avoid 21
capacity investments by NS Power; and 22
additional demand-side management is not needed during the current contract period 23
for compliance with Nova Scotia’s Renewable Electricity Standard or to meet power 24
system demand.”31 25
31 NSPI Evidence, p. 3.

Direct Testimony of Tim Woolf 34
I address the first bullet in this subsection. I address the second two bullets in the 1
following subsection. 2
Q. Please summarize NSPI’s analysis of the DSM spending in other Canadian 3
jurisdictions. 4
A. NSPI hired ICF International (ICFI) to conduct a review of the level of DSM budgets and 5
savings in other Canadian jurisdictions and the state of Maine (ICFI study). The ICFI 6
study finds that of the jurisdictions reviewed: 7
DSM spending in Nova Scotia is highest on a per-capita basis and among the highest 8
on a per-customer basis.32 9
The cost of saved energy is among the highest in Nova Scotia, in terms of first-year 10
costs divided by first-year savings.33 11
Nova Scotia has the highest level of DSM savings as a percentage of the utility’s 12
retail sales.34 13
NSPI then uses the DSM cost of saved energy results to argue that the cost of saved 14
energy in Nova Scotia is too high, and should be reduced. 15
Q. Do you agree with the results of the ICFI study? 16
A. While I have not reviewed the assumptions or results of the ICFI study in much detail, I 17
am not surprised by the results. Nova Scotia has been a leader among the Canadian 18
provinces in its IRP practices and its DSM planning and implementation. 19
32 NSPI Evidence, p. 16. 33 NSPI Evidence, p. 18, Figure 3.2 (REVISED). Efficiency New Brunswick was removed from this graph. NSPI’s
Evidence (Revised) shows that Efficiency New Brunswick’s first year cost was substantially higher ($0.52/kWh) than that of any of the other program administrators. (2016-2018 DSM NS Power Evidence Appendix A Page 77 of 100, REVISED)
34 NSPI Evidence, p. 22.

Direct Testimony of Tim Woolf 35
Q. Do you agree with NSPI’s argument that the comparison with other Canadian 1
jurisdictions indicates that E1’s DSM program budgets and cost of saved energy are 2
too high? 3
A. No. There are many factors that need to be considered to make a meaningful comparison 4
across provinces. Each province has its own statutes, regulations, utility systems, and 5
policy goals. These differences might dictate different approaches to DSM planning. 6
More importantly, the DSM budgets and CSE are only a part of the picture. It is 7
important to consider additional information in order to compare the value of the DSM 8
plans across jurisdictions. For example, the ICFI report finds that Nova Scotia achieves 9
the highest level of DSM savings as a percent of electricity sales. This is one of the 10
reasons for the higher DSM budgets per capita and per customer; higher savings require 11
higher budgets. 12
As another example, the ICFI study finds that E1’s DSM program offerings are more 13
numerous than in most Canadian jurisdictions, and that it offers one of the most 14
comprehensive DSM portfolios in Canada.35 Again, this explains why Nova Scotia has 15
higher budgets per capita and per customer. This is also important because it indicates 16
that Nova Scotia serves more efficiency measures to more customers, thereby offsetting 17
the impacts of increased budgets through greater program participation. 18
There are also some important DSM considerations that are not addressed in the ICFI 19
study. Greater DSM budgets will result in greater amounts of cost savings, in terms of the 20
present value of revenue requirements. Nova Scotia is presumably able to achieve greater 21
reductions in electricity system costs than other Canadian provinces, due to its 22
proportionally larger DSM programs. 23
The ICFI study also does not provide any information regarding the extent to which 24
electricity customers in other jurisdictions have participated in the DSM programs. 25
Increased levels of program participation will offset increased DSM budgets and costs. 26
As indicated in Section 5 of my testimony, the Nova Scotia DSM programs have reached, 27
35 ICFI Study, p. 10.

Direct Testimony of Tim Woolf 36
and are expected to reach, a large portion of electricity customers. While the ICFI study 1
does not present the DSM participation rates in the other Canadian provinces, it is quite 2
likely that they are much lower than those of Nova Scotia. 3
Q. The ICFI study also considers the budgets and savings levels from one U.S. state: 4
Maine. Why did the study include Maine in the comparison? 5
A. Maine was included in the comparison because it is located close to Nova Scotia.36 6
Q. Does it makes sense to include only Maine in this comparison? 7
A. Not necessarily. Once the study is expanded beyond the boundaries of Canada, it 8
becomes important to be more thoughtful about which additional jurisdictions to include. 9
There is a wide variety in the amount of DSM budgets and savings throughout the United 10
States, and there is no reason to include only Maine in this comparison. 11
Q. Are there other states in the region whose DSM programs could be compared to 12
Nova Scotia’s DSM programs? 13
A. Yes. Massachusetts, Rhode Island, and Vermont are all relatively close to Nova Scotia, 14
and would make a useful comparison. These states provide some of the most 15
comprehensive DSM programs in North America. If they were added to the set of 16
comparison jurisdictions, then they would put the Nova Scotia programs in a different 17
light. Figure 6.1 presents the historical and projected DSM savings, as a percent of retail 18
sales, for Nova Scotia, Maine, Massachusetts, Rhode Island, and Vermont. As indicated, 19
the Nova Scotia DSM programs are small relative to these leading states. 20
36 Evidence of NSPI, Appendix A, Attachment B, page 5 of 37.

Direct Testimony of Tim Woolf 37
Figure 6.1 Efficiency Savings (percent of retail sales): NS, MA, VT, RI – Historical and Planned37 1
2
This comparison with Massachusetts, Rhode Island, and Vermont admittedly involves 3
some “cherry picking,” because these three states are among the leading jurisdictions in 4
North America with regard to DSM planning and implementation. I present them here to 5
demonstrate that Maine is not the only nearby, relevant state that could be compared with 6
Nova Scotia. 7
Deferring the Need for New Capacity 8
Q. NSPI also justifies its alternative DSM plan on the grounds that additional DSM is 9
not needed to defer new generation capacity additions. Do you agree with this 10
argument? 11
A. No, I do not. In fact, this argument is based on a misunderstanding, or a 12
misrepresentation, of the role of DSM in long-term resource planning. First, DSM offers 13
a variety of benefits, of which avoided generation capacity is only one. These benefits 14
include avoided energy costs, avoided transmission costs, avoided distribution costs, as 15
well as reduced risk and avoided environmental emissions. All of these benefits should be 16
considered when assessing the value of DSM programs and plans. 17
37 The Narragansett Electric Company d/b/a National Grid. National Grid 2015-2017 Energy Efficiency and System Reliability Procurement Plan. September 2, 2014. Submitted to the Rhode Island Public Utilities Commission.

Direct Testimony of Tim Woolf 38
NSPI may be correct that additional DSM is not needed to defer new generation for 1
several years into the future. According to the 2014 IRP, when comparing the Low, Base, 2
and Mid DSM cases, the first time that new generation capacity might be deferred is not 3
until 2032.38 4
However, this does not mean that additional DSM provides no value to customers until 5
2035, as NSPI implies. On the contrary, DSM will provide value in terms of avoided 6
energy costs. These reduced energy costs are what makes up the difference in PVRR 7
between the Low, Base, and Mid DSM cases. As indicated in Table 3.1 above, the Mid 8
DSM Case is estimated to reduce PVRR by $358 million relative to the Low DSM case. 9
This is an indication of the energy benefits available from DSM programs, even when 10
there is no need to defer generation capacity for many years into the future.39 11
Q. Are there other important considerations with regard to the role of DSM potentially 12
deferring the need for new generation capacity? 13
A. Yes. When it does come time to defer or avoid new generation capacity, which might 14
well come before 2032, it is important to have implemented as much cost-effective DSM 15
savings as possible between now and then. In order to understand this point, it is critical 16
to recognize that energy efficiency resources and savings take many years to develop, 17
especially to develop the amount of capacity savings needed to defer or avoid a new 18
power plant. In order for energy efficiency to be able to defer a new power plant several 19
years from now, it is necessary to implement a significant amount of cost-effective 20
energy efficiency programs until then. 21
Conversely, if the Company does not implement a significant amount of cost-effective 22
DSM every year between now and then, then it becomes much more difficult for DSM 23
programs to have a meaningful impact on the need for a new power plant when the need 24
does arise. If the Company were to achieve only a relatively small amount of DSM 25
38 NSPI Evidence, p. 35, Figure 4.1. 39 It is my understanding that the 2014 IRP includes only the benefits of avoiding energy and capacity costs from
generators, and it does not include the benefits of deferring or avoiding transmission and distribution investments. Consequently, the IRP understates the reduction in PVRR available from additional DSM programs.

Direct Testimony of Tim Woolf 39
savings over the next few years, there may not be sufficient time to develop the level of 1
savings needed to defer or eliminate the need for that next new plant. 2
Energy efficiency resources cannot simply be turned on and off like a faucet of water 3
based on short-term expectations. Efficiency programs are most effective when they are 4
provided with consistent funding and resources over many years in order to provide 5
stability regarding (a) the utility management and staff dedicated to efficiency planning 6
and implementation; (b) the infrastructure of contractors and trade allies in the province 7
and region needed to implement programs; and (c) the customer engagement needed to 8
adopt efficiency measures in their homes and businesses. 9
Recommendation Regarding NSPI’s Proposal 10
Q. What do you recommend with regard to NSPI’s alternative DSM plan? 11
A. I recommend that the Board reject NSPI’s alternative plan. The alternative plan is not 12
consistent with Nova Scotia DSM policy; is not more affordable than E1’s DSM Plan; 13
will result in increased electricity costs and bills; will serve a smaller number of 14
electricity customers; is not equitable across electricity customers; and will create 15
significant lost opportunities that might never be captured. 16
7. ADDITIONAL COST-EFFECTIVE DSM SAVINGS 17
Q. Are there more cost-effective DSM savings available than what is included in E1’s 18
DSM Plan? 19
A. Yes. The 2014 IRP found that there is considerably more cost-effective DSM savings 20
available than what is included in E1’s DSM Plan. As described in Section 4 of my 21
testimony, the E1 Plan includes budgets that are comparable to the Low DSM Case, and 22
energy and capacity savings that are comparable to the Base DSM Case. The IRP found 23
that considerably more DSM savings could be achieved from the Mid DSM Case. 24
Furthermore, as described in Section 3 of my testimony, the Board found that the Mid 25
DSM Case should be considered the Preferred Resource Plan. 26

Direct Testimony of Tim Woolf 40
Q. Why did E1 not use the Mid DSM Case as the basis for its 2016-2018 DSM Plan? 1
A. E1 did not include the Mid DSM Case savings in its DSM Plan due to concerns over the 2
short-term rate impacts associated with the higher budgets in that case. E1 acknowledged 3
that the Mid DSM Case would be the lowest cost and most affordable over the long term, 4
but also noted that it would result in increased rates over the short term.40 E1 concluded 5
that its proposed DSM Plan would represent a better balance between short-term and 6
long-term considerations, relative to the Mid DSM Case.41 7
Q. Do you agree with the balance that E1 has proposed between short-term and long-8
term considerations? 9
A. No. I do agree that both short-term and long-term implications should be balanced in 10
developing DSM plans. However, I believe that E1 has placed too much emphasis on the 11
short-term rate impacts at the risk of the long-term cost benefits. 12
The findings of the 2014 IRP are quite clear that the Mid DSM Case will create 13
significantly more reductions in cost relative to the Low DSM Case. As indicated in 14
Table 3.1 above, the Mid DSM Case was estimated to reduce costs, in terms of PVRR, by 15
over $358 million relative to Low DSM. This is a lot of long-term customer savings that 16
would be foregone by E1’s balancing of short- and long-term impacts. 17
Meanwhile, the difference in rate impacts between the Low and the Mid DSM Cases is 18
not so large that it is worth forgoing these long-term benefits. As indicated in Figure 5.2 19
above, the Mid DSM Case is expected to increase short-term rates by roughly 2 percent 20
relative to the Low DSM Case, and to have long-term rate impacts that are essentially the 21
same as the Low DSM Case. This is a fairly small short-term impact in order to reduce 22
long-term costs for customers by roughly $350 million. 23
40 EfficiencyOne Evidence, February 27, 2015, p. 40. 41 EfficiencyOne Evidence, February 27, 2015, p. 31.

Direct Testimony of Tim Woolf 41
Q. Is it important to consider DSM program participation impacts when balancing 1
short- versus long-term implications? 2
A. Yes, it is very important. Increased rates will be directly offset by participation in the 3
DSM programs, making rate impacts much less of a concern. E1 has missed this critical 4
point in its balancing of short- versus long-term impacts. 5
As indicated in Section 5 and Figures 5.6 and 5.7 above, a very large portion of 6
residential customers is expected to participate in E1’s DSM program over the course of 7
2011 through 2018. While these participation estimates are still approximate, and contain 8
some amount of duplication across customers, they do indicate that a large majority of 9
residential customers will likely participate in DSM programs in one way or another over 10
this period. They also indicate that the Mid DSM Case will result in more customer 11
participation than the Low DSM Case. 12
For every customer that participates in a DSM program during this period, a rate impact 13
of 2 percent will be offset by the bill savings as a result of reduced consumption. Even a 14
rate impact of 5 percent, which is the estimated impact of the Mid DSM Case relative to 15
the hypothetical no DSM Case (see Figure 5.2 above), will be mostly or totally offset by 16
participation in the DSM programs (See Figure 5.5 above). 17
These participation results indicate that the short-term rate impacts are likely to be much 18
less of a concern than what is implied by E1 and NSPI, because only a small portion of 19
customers will experience increased bills—the majority will experience reduced bills 20
despite the increased rate. 21
Q. What do you recommend with regard to including additional DSM savings in its 22
2016-2018 DSM Plan? 23
A. I recommend that the Board direct E1 to expand its budget and savings levels beyond 24
those proposed in the 2016-2018 DSM Plan. Rather than using budget levels comparable 25
to the Low DSM Case to get savings levels comparable to the Base DSM Case, I 26
recommend that E1 attempt to use budget levels that are comparable to the Base DSM 27
Case to get savings levels comparable to the Mid DSM Case. 28

Direct Testimony of Tim Woolf 42
In other words, the Board should direct E1 to increase its DSM budgets to roughly $50 1
million per year, to get energy savings that are roughly equal to 1.8 percent of retail 2
electricity sales. E1 should be able to achieve this level of savings at a cost of saved 3
energy roughly equal to the CSE of its 2016-2018 DSM Plan.42 4
Q. Do you think this expanded DSM plan will be cost-effective, affordable, and in the 5
public interest? 6
A. Yes. There is no question that my proposed expanded DSM plan will be cost-effective; 7
the IRP found the Mid DSM Case to be very cost-effective (with PVRR savings of 8
roughly $1,679 million relative to no DSM), and my proposal would require less costs 9
than that case. My expanded DSM plan will clearly be affordable, in terms of reduced 10
customer bills and small to negative impacts on long-term rates. There may be slightly 11
higher short-term rate impacts from my expanded DSM plan, but these would be 12
relatively small and would be offset for the many customers who participate in the DSM 13
programs. 14
8. COST-EFFECTIVENESS TESTING 15
Q. Has E1 requested that the Board approve a change to the DSM cost-effectiveness 16
methodology used in Nova Scotia? 17
A. Yes. E1 has requested that the primary cost-effectiveness test used to screen DSM 18
programs be changed from the total resource cost (TRC) test to the program administrator 19
cost (PAC) test. This request is based upon an analysis of DSM screening in Nova Scotia 20
prepared by Dunsky Energy Consulting (DEC).43 21
Q. What reasons are given for switching from the TRC test to the PAC test? 22
A. DEC and E1 identify several concerns about the use of the TRC test, including 23
(1) accuracy, because not all inputs are calculated appropriately; (2) bias, because there is 24
42 E1’s DSM Plan has a three-year CSE of roughly 0.30/kWh, as indicated in Figure 4.7. For my proposal, a three-year budget of $153 million, and three-year savings of 519 GWh would result in a CSE of $0.29/kWh.
43 EfficiencyOne Evidence, February 27, 2015, Appendix I.

Direct Testimony of Tim Woolf 43
a lack of inclusion of all appropriate customer benefits; and (3) ratepayer value, because 1
the TRC test is not an accurate reflection of ratepayer value.44 DEC and E1 recommend 2
the use of the PAC test because it is inherently balanced, it is a better indication of the 3
ratepayer value of DSM, and it is more consistent with the least-cost procurement view 4
and the Public Utilities Act.45 5
Q. Do you support E1’s request for the Board to approve a change from the TRC test 6
to the PAC test? 7
A. Yes. I share the concerns raised by DEC and E1 regarding the TRC test, and I agree with 8
the reasons why they believe the PAC test is superior. 9
Q. Do you have any reservations about using the PAC test to screen DSM programs? 10
A. Only one. Both the PAC and the TRC tests are limited in that they do not easily allow for 11
the incorporation of energy policy benefits associated with DSM programs. DSM offers 12
some energy policy benefits that are difficult to quantify and monetize, and therefore are 13
often left out of the PAC and the TRC test. 14
One example is the benefits provided to low-income customers with regard to reducing 15
their energy burdens and making it easier for them to pay their energy bills. This impact 16
on low-income customers is widely recognized as a significant benefit of low-income 17
DSM programs, yet it is rarely if ever captured in the PAC test. Consequently, some low-18
income DSM programs might fail the PAC test, but be cost-effective and in the public 19
interest nonetheless because of these unquantified benefits. 20
Q. What do you recommend with regard to future application of the PAC test? 21
A. I recommend that the PAC test be used as the primary test for screening DSM, but that it 22
be used in a way that recognizes its limited ability to account for energy policy benefits. 23
If a program fails the PAC test but is understood to have significant energy policy 24
benefits that are not accounted for in that test, then E1 and the Board should consider 25
44 EfficiencyOne Evidence, February 27, 2015, p. 57. 45 EfficiencyOne Evidence, February 27, 2015, pp. 57-58

Direct Testimony of Tim Woolf 44
finding that program to be cost-effective if the benefits are deemed to be big enough. 1
Additional discussion and recommendations on this issue are provided in the recent study 2
from the National Efficiency Screening Project, included with my testimony as Exhibit 3
TW-2. 4
Q. Are there other recommendations in this docket to modify the DSM screening 5
practices? 6
A. Yes. The DEC report makes three additional recommendations:46 7
The PAC test should be applied for information purposes at the program and 8
portfolio levels, and for decision-making purposes at the sector level. 9
Critical inputs, including the discount rate and risk issues, be re-examined for 10
consistency in the context of Nova Scotia DSM. 11
A transparent reporting template be developed to facilitate future understanding of 12
critical test choices. 13
Q. Do you support these recommendations? 14
A. I agree that the Board, E1, NSPI, and other stakeholders should investigate these three 15
issues for the purpose of resolving them prior to future analyses of DSM programs. 16
Q. Is there any one of these three issues that you think should be given high priority for 17
resolving? 18
A. Yes. I recommend that the Board place a high priority on resolving the question of which 19
discount rate should be used for screening DSM programs. The choice of discount rate 20
can have a dramatic effect on the results of the cost-effectiveness analysis, particularly 21
for DSM programs with long measure lives, such as residential retrofit programs and new 22
construction programs. In addition, the choice of discount rate is not a simple matter, and 23
requires thoughtful consideration of Nova Scotia’s energy policy goals. 24
46 EfficiencyOne Evidence, February 27, 2015, Appendix I, p. 35.

Direct Testimony of Tim Woolf 45
In my view, the utility weighted average cost of capital should not be used as the discount 1
rate for analyzing DSM programs, regardless of which screening test is used. The utility 2
weighted average cost of capital is an appropriate discount rate to use if the goal of DSM 3
screening is to maximize investor value. However, that is not the goal of DSM screening. 4
The goal of DSM screening is to identify those DSM resources that are in the public 5
interest. Consequently, the discount rate used for DSM screening should reflect a time 6
preference that is consistent with the public interest.47 7
9. STANDARDIZED FILING REQUIREMENTS 8
Q. NSPI has recommended that the Board adopt a standardized filing requirement for 9
future DSM plans, to ensure that sufficient information is provided at the time of 10
filing to ensure an efficient review of such plans.48 Do you agree? 11
A. Yes. Standardized filing requirements would make for a much more efficient review of 12
future DSM plans, by all the stakeholders and by the Board. This is a very low-cost, no-13
regrets way to improve the review of DSM plans, and ultimately improve the quality of 14
the plans themselves. 15
Q. Has NSPI recommended specific standardized filing requirements? 16
A. Yes. In testimony on behalf of NSPI, David Pickles provides a list of information that 17
should be provided to support review and approval of DSM programs. That list includes 18
the following:49 19
A description of the measures included in the program 20
A description of the customer incentive to be provided 21
A description of how the program intends to influence participants 22
A description of the target market 23
47 For more information, see the Resource Value Framework, attached as Exh TW-2. 48 NSPI Evidence, April 10, 2015, p.6. 49 Direct Testimony of David Pickles on behalf of NSPI, April 10, 2015, pp.30-32.

Direct Testimony of Tim Woolf 46
A description of activities to work with trade allies and other market participants 1
A count of all major program activities, achievements, and deliverables anticipated 2
by year 3
A description of marketing activities 4
Annual energy and demand savings 5
Annual participation by measure 6
Annual budget detail 7
Customer service standards and metrics 8
High-level description of the EM&V plan 9
Q. Do you agree that this information should be provided in future DSM filings? 10
A. Yes, all of this information would be useful in reviewing future DSM filings. 11
Q. Do you recommend adding to or modifying this list in any way? 12
A. Yes. I recommend modifying and adding to the list as follows: 13
Lifetime energy and demand savings should be provided, in addition to annual 14
energy and demand savings. 15
Annual participation does not need to be tracked by measure, but it should be tracked 16
by program. Also, the filing should include participation rates, which are determined 17
by dividing participants by eligible customers. 18
The filing should include the results of the cost-effectiveness analysis for each 19
program, including the costs, benefits, net benefits, and benefit-cost ratio, in terms of 20
present value dollars. These results should be provided in terms of the PAC test. 21
The filing should include a detailed description of the avoided costs used in the cost-22
effectiveness analysis. This should separately identify the different components of 23
avoided cost, including energy, capacity, transmission and distribution, and any other 24
Direct Testimony of Tim Woolf 47
avoided costs used in the analysis. This should also include the avoided costs for 1
each year of the study period. 2
The filing should include a detailed description of how the proposed plan is 3
consistent with the findings of the most recent IRP conducted by NSPI. 4
The filing should include the levelized cost of saved energy for each program. 5
The filing should include a detailed description of the rate and bill impact analysis. 6
These results should be summarized in an accessible and informative way, and 7
should be presented for all customer classes. 8
10. RECOMMENDATIONS 9
Q. Please summarize your recommendations. 10
A. I recommend the following: 11
The Board should reject NSPI’s alternative DSM plan. 12
The Board should direct E1 to pursue additional DSM savings beyond those included 13
in the 2016-2018 DSM Plan. In particular, E1 should modify the DSM program 14
budgets to be comparable to the budgets in the Base DSM Case from the 2014 IRP, 15
and seek to achieve the DSM savings levels in the Mid DSM Case. 16
The Board should approve E1’s request to change the primary DSM screening test 17
from the TRC test to the PAC test, for the purpose of future DSM cost-effectiveness 18
analyses. 19
The Board should direct E1 to work with stakeholders to investigate other issues 20
regarding the cost-effectiveness testing practices, including (a) the appropriate 21
discount rate to use for screening; (b) screening at the sector level for decision-22
making purposes; and (c) the use of a template for identifying costs and benefits used 23
in screening. 24
The Board should direct E1 to work with stakeholders to develop a standardized 25
filing requirement for all future DSM plan filings. The standardized filing 26
requirement should include at least the information listed herein, and should be 27

Direct Testimony of Tim Woolf 48
formatted in a way that provides easy access to all relevant information and is 1
consistent over time. 2
Q. Does this conclude your direct testimony? 3
A. Yes, it does. 4

Tim Woolf page 1 of 15
Tim Woolf, Vice President
Synapse Energy Economics I 485 Massachusetts Avenue, Suite 2 I Cambridge, MA 02139 I 617‐453‐7031
twoolf@synapse‐energy.com
PROFESSIONAL EXPERIENCE
Synapse Energy Economics Inc., Cambridge, MA. Vice President, 2011 ‒ present.
Provides expert consulting on the economic, regulatory, consumer, environmental, and public policy
implications of the electricity and gas industries. The primary focus of work includes technical and
economic analyses, electric power system planning, climate change strategies, energy efficiency
programs and policies, renewable resources and related policies, power plant performance and
economics, air quality, and many related aspects of consumer and environmental protection.
Massachusetts Department of Public Utilities, Boston, MA. Commissioner, 2007 ‒ 2011.
Oversaw a significant expansion of clean energy policies as a consequence of the Massachusetts Green
Communities Act, including an aggressive expansion of ratepayer‐funded energy efficiency programs;
the implementation of decoupled rates for electric and gas companies; an update of the DPU energy
efficiency guidelines; the promulgation of net metering regulations; review of smart grid pilot programs;
and review of long‐term contracts for renewable power. Oversaw six rate case proceedings for
Massachusetts electric and gas companies. Played an influential role in the development of price
responsive demand proposals for the New England wholesale energy market. Served as President of the
New England Conference of Public Utility Commissioners from 2009‐2010. Served as board member on
the Energy Facilities Siting Board from 2007‐2010. Served as co‐chair of the Steering Committee for the
Northeast Energy Efficiency Partnership’s Regional Evaluation, Measurement and Verification Forum.
Synapse Energy Economics Inc., Cambridge, MA. Vice President, 1997 ‒ 2007.
Tellus Institute, Boston, MA. Senior Scientist, Manager of Electricity Program, 1992 ‒ 1997.
Association for the Conservation of Energy, London, England. Research Director, 1991 ‒ 1992.
Massachusetts Department of Public Utilities, Boston, MA. Staff Economist, 1989 ‒ 1990.
Massachusetts Office of Energy Resources, Boston, MA. Policy Analyst, 1987 ‒ 1989.
Energy Systems Research Group, Boston, MA. Research Associate, 1983 ‒ 1987.
Union of Concerned Scientists, Cambridge, MA. Energy Analyst, 1982‐1983.
EDUCATION
Boston University, Boston, MA
Master of Business Administration, 1993

Tim Woolf page 2 of 15
London School of Economics, London, England
Diploma, Economics, 1991
Tufts University, Medford, MA
Bachelor of Science in Mechanical Engineering, 1982
Tufts University, Medford, MA
Bachelor of Arts in English, 1982
REPORTS
Whited, M., T. Woolf, A. Napoleon. 2015. Utility Performance Incentive Mechanisms: A Handbook for
Regulators. Synapse Energy Economics for the Western Interstate Energy Board.
Woolf, T., E. Malone, F. Ackerman. 2014. Cost‐Effectiveness Screening Principles and Guidelines for
Alignment with Policy Goals, Non‐Energy Impacts, Discount Rates, and Environmental Compliance Costs.
Synapse Energy Economics for Northeast Energy Efficiency Partnerships (NEEP) Regional Evaluation,
Measurement and Verification Forum.
Woolf, T., E. Malone, C. Neme. 2014. Regulatory Policies to Support Energy Efficiency in Virginia. Synapse
Energy Economics and Energy Futures Group for the Virginia Energy Efficiency Council.
Woolf, T., M. Whited, E. Malone, T. Vitolo, R. Hornby. 2014. Benefit‐Cost Analysis for Distributed Energy
Resources: A Framework for Accounting for All Relevant Costs and Benefits. Synapse Energy Economics
for the Advanced Energy Economy Institute.
Woolf, T., E. Malone, J. Kallay. 2014. Rate and Bill Impacts of Vermont Energy Efficiency Programs.
Synapse Energy Economics for the Vermont Public Service Department.
Woolf, T., C. Neme, P. Stanton, R. LeBaron, K. Saul‐Rinaldi, S. Cowell. 2014. The Resource Value
Framework: Reforming Energy Efficiency Cost‐Effectiveness Screening. The National Efficiency Screening
Project for the National Home Performance Council.
Malone, E. T. Woolf, K. Takahashi, S. Fields. 2013. “Appendix D: Energy Efficiency Cost‐Effectiveness
Tests.” Readying Michigan to Make Good Energy Decisions: Energy Efficiency. Synapse Energy Economics
for the Council of Michigan Foundations.
Stanton, E. A., S. Jackson, G. Keith, E. Malone, D. White, T. Woolf. 2013. A Clean Energy Standard for
Massachusetts. Synapse Energy Economics for the Massachusetts Clean Energy Center and the
Massachusetts Departments of Energy Resources, Environmental Protection, and Public Utilities.
Woolf, T., K. Saul‐Rinaldi, R. LeBaron, S. Cowell, P. Stanton. 2013. Recommendations for Reforming
Energy Efficiency Cost‐Effectiveness Screening in the United States. Energy Efficiency Screening Coalition
for the National Home Performance Council.

Tim Woolf page 3 of 15
Woolf, T., E. Malone, J. Kallay, K. Takahashi. 2013. Energy Efficiency Cost‐Effectiveness Screening in the
Northeast and Mid‐Atlantic States. Synapse Energy Economics for Northeast Energy Efficiency
Partnerships, Inc. (NEEP).
Raab Associates and Synapse Energy Economics. 2013. Massachusetts Electric Grid Modernization
Stakeholder Working Group Process: Report to the Department of Public Utilities from the Steering
Committee. Prepared for the Massachusetts Department of Public Utilities. DPU 12‐76.
Jackson, S., P. Peterson, D. Hurley, T. Woolf. 2013. Forecasting Distributed Generation Resources in New
England: Distributed Generation Must Be Properly Accounted for in Regional System Planning. Synapse
Energy Economics for E4 Group.
Woolf, T., E. Malone, L. Schwartz, J. Shenot. 2013. A Framework for Evaluating the Cost‐Effectiveness of
Demand Response. Synapse Energy Economics and Regulatory Assistance Project for the National Forum
on the National Action Plan on Demand Response: Cost‐effectiveness Working Group.
Woolf, T., W. Steinhurst, E. Malone, K. Takahashi. 2012. Energy Efficiency Cost‐Effectiveness Screening:
How to Properly Account for ‘Other Program Impacts’ and Environmental Compliance Costs. Synapse
Energy Economics for Regulatory Assistance Project and Vermont Housing Conservation Board.
Woolf, T., M. Whited, T. Vitolo, K. Takahashi, D. White. 2012. Indian Point Replacement Analysis: A Clean
Energy Roadmap. A Proposal for Replacing the Nuclear Plant with Clean, Sustainable Energy Resource.
Synapse Energy Economics for Natural Resources Defense Council (NRDC) and Riverkeeper.
Keith, G., T. Woolf, K. Takahashi. 2012. A Clean Electricity Vision for Long Island: Supplying 100% of Long
Island's Electricity Needs with Renewable Power. Synapse Energy Economics for Renewable Energy Long
Island.
Woolf, T. 2012. Best Practices in Energy Efficiency Program Screening: How to Ensure that the Value of
Energy Efficiency is Properly Accounted For. Synapse Energy Economics for National Home Performance
Council.
Woolf, T., J. Kallay, E. Malone, T. Comings, M. Schultz, J. Conyers. 2012. Commercial & Industrial
Customer Perspectives on Massachusetts Energy Efficiency Programs. Synapse Energy Economics for the
Massachusetts Energy Efficiency Advisory Council.
Woolf, T., M. Wittenstein, R. Fagan. 2011. Indian Point Energy Center Nuclear Plant Retirement Analysis.
Synapse Energy Economics for Natural Resources Defense Council (NRDC) and Riverkeeper.
Woolf, T., V. Sabodash, B. Biewald. 2011. Equipment Price Forecasting in Energy Conservation Standards
Analysis. Synapse Energy Economics for Appliance Standards Awareness Project and Natural Resources
Defense Council (NRDC).
Johnston, L., E. Hausman, A. Sommer, B. Biewald, T. Woolf, D. Schlissel, A. Rochelle, D. White. 2007.
Climate Change and Power: Carbon Dioxide Emission Costs and Electricity Resource Planning. Synapse
Energy Economics for Tallahassee Electric Utility.

Tim Woolf page 4 of 15
Woolf, T. 2007. Cape Light Compact Energy Efficiency Plan 2007‐2012: Providing Comprehensive Energy
Efficiency Services to Communities on Cape Cod and Martha’s Vineyard. Synapse Energy Economics for
the Cape Light Compact.
Woolf, T. 2007. Review of the District of Columbia Reliable Energy Trust Fund and Natural Gas Trust Fund
Working Group and Regulatory Processes. Synapse Energy Economics for the District of Columbia Office
of People's Counsel.
Woolf, T. 2006. Cape Light Compact Annual Report on Energy Efficiency Activities in 2005. Synapse
Energy Economics for the Cape Light Compact, submitted to the Massachusetts Department of
Telecommunications and Energy and the Massachusetts Division of Energy Resources.
Steinhurst, W., T. Woolf, A. Sommer, K. Takahashi, P. Chernick, J. Wallach. 2006. Integrated Portfolio
Management in a Restructured Supply Market. Synapse Energy Economics and Resource Insight for the
Ohio Office of Consumer Counsel.
Peterson, P., D. Hurley, T. Woolf, B. Biewald. 2006. Incorporating Energy Efficiency into the ISO‐New
England Forward Capacity Market. Synapse Energy Economics for Conservation Services Group.
Woolf, T., D. White, C. Chen, A. Sommer. 2005. Potential Cost Impacts of a Renewable Portfolio Standard
in New Brunswick. Synapse Energy Economics for New Brunswick Department of Energy.
Woolf, T., K. Takahashi, G. Keith, A. Rochelle, P. Lyons. 2005. Feasibility Study of Alternative Energy and
Advanced Energy Efficiency Technologies for Low‐Income Housing in Massachusetts. Synapse Energy
Economics and Zapotec Energy for the Low‐Income Affordability Network, Action for Boston Community
Development, and Action Inc.
Woolf, T. 2005. The Cape Light Compact Energy Efficiency Plan: Phase III 2005‐2007: Providing
Comprehensive Energy Efficiency Services to Communities on Cape Cod and Martha’s Vineyard. Synapse
Energy Economics for the Cape Light Compact.
Woolf, T. 2004. Review of Avoided Costs Used in Minnesota Electric Utility Conservation Improvement
Programs. Synapse Energy Economics for the Minnesota Office of Legislative Auditor.
Woolf, T. 2004. NEEP Strategic Initiative Review: Qualitative Assessment and Initiative Ranking for the
Residential Sector. Synapse Energy Economics for Northeast Energy Efficiency Partnerships, Inc.
Woolf, T. 2004. A Balanced Energy Plan for the Interior West. Synapse Energy Economics, West Resource
Advocates, and Tellus Institute for the Hewlett Foundation Energy Series.
Steinhurst, W., P. Chernick, T. Woolf, J. Plunkett, C. Chen. 2003. OCC Comments on Alternative
Transitional Standard Offer. Synapse Energy Economics for the Connecticut Office of Consumer Counsel.
Woolf, T. 2003. Potential Cost Impacts of a Vermont Renewable Portfolio Standard. Synapse Energy
Economics for Vermont Public Service Board, presented to the Vermont RPS Collaborative.

Tim Woolf page 5 of 15
Biewald, B., T. Woolf, A. Rochelle, W. Steinhurst. 2003. Portfolio Management: How to Procure
Electricity Resources to Provide Reliable, Low‐Cost, and Efficient Electricity Services to All Retail
Customers. Synapse Energy Economics for Regulatory Assistance Project and Energy Foundation.
Woolf, T., G. Keith, D. White, M. Drunsic, M. Ramiro, J. Ramey, J. Levy, P. Kinney, S. Greco, K. Knowlton,
B. Ketcham, C. Komanoff, D. Gutman. 2003. Air Quality in Queens: Cleaning Up the Air in Queens County
and Neighboring Regions. Synapse Energy Economics, Konheim & Ketcham, and Komanoff Energy
Associates for Natural Resources Defense Council (NRDC), Keyspan Energy, and the Coalition Helping to
Organize a Kleaner Environment.
Chen, C., D. White, T. Woolf, L. Johnston. 2003. The Maryland Renewable Portfolio Standard: An
Assessment of Potential Cost Impacts. Synapse Energy Economics for the Maryland Public Interest
Research Group.
Woolf, T. 2003. The Cape Light Compact Energy Efficiency Plan: Phase II 2003 ‒ 2007: Providing
Comprehensive Energy Efficiency Services to Communities on Cape Cod and Martha’s Vineyard. Synapse
Energy Economics, Cort Richardson, Vermont Energy Investment Corporation, and Optimal Energy
Incorporated for the Cape Light Compact.
Woolf, T. 2002. Green Power and Energy Efficiency Opportunities for Municipalities in Massachusetts:
Promoting Community Involvement in Energy and Environmental Decisions. Synapse Energy Economics
for the Massachusetts Energy Consumers Alliance.
Woolf, T. 2002. The Energy Efficiency Potential in Williamson County, Tennessee: Opportunities for
Reducing the Need for Transmission Expansion. Synapse Energy Economics for the Harpeth River
Watershed Association and the Southern Alliance for Clean Energy.
Woolf, T. 2002. Electricity Restructuring Activities in the US: A Survey of Selected States. Synapse Energy
Economics for Arizona Corporation Commission Utilities Division Staff.
Woolf, T. 2002. Powering the South: A Clean and Affordable Energy Plan for the Southern United States.
Synapse Energy Economics with and for the Renewable Energy Policy Project and a coalition of Southern
environmental advocates.
Johnston, L., G. Keith, T. Woolf, B. Biewald, E. Gonin. 2002. Survey of Clean Power and Energy Efficiency
Programs. Synapse Energy Economics for the Ozone Transport Commission.
Woolf, T. 2001. Proposal for a Renewable Portfolio Standard for New Brunswick. Synapse Energy
Economics for the Conservation Council of New Brunswick, presented to the New Brunswick Market
Design Committee.
Woolf, T., G. Keith, D. White, F. Ackerman. 2001. A Retrospective Review of FERC’s Environmental Impact
Statement on Open Transmission Access. Synapse Energy Economics and the Global Development and
Environmental Institute for the North American Commission for Environmental Cooperation, with the
Global Development and Environment Institute.
Tim Woolf page 6 of 15
Woolf, T. 2001. Repowering the Midwest: The Clean Energy Development Plan for the Heartland.
Synapse Energy Economics for the Environmental Law and Policy Center and a coalition of Midwest
environmental advocates.
Woolf, T. 2000. The Cape Light Compact Energy Efficiency Plan: Providing Comprehensive Energy
Efficiency Services to Communities on Cape Cod and Martha’s Vineyard. Synapse Energy Economics for
the Cape Light Compact.
Woolf, T., B. Biewald. 1999. Market Distortions Associated With Inconsistent Air Quality Regulations.
Synapse Energy Economics for the Project for a Sustainable FERC Energy Policy.
Woolf, T., B. Biewald, D. Glover. 1998. Competition and Market Power in the Northern Maine Electricity
Market. Synapse Energy Economics and Failure Exponent Analysis for the Maine Public Utilities
Commission.
Woolf, T. 1998. New England Tracking System. Synapse Energy Economics for the New England
Governors’ Conference, with Environmental Futures and Tellus Institute.
Woolf, T., D. White, B. Biewald, W. Moomaw. 1998. The Role of Ozone Transport in Reaching Attainment
in the Northeast: Opportunities, Equity and Economics. Synapse Energy Economics and the Global
Development and Environment Institute for the Northeast States for Coordinated Air Use Management.
Biewald, B., D. White, T. Woolf, F. Ackerman, W. Moomaw. 1998. Grandfathering and Environmental
Comparability: An Economic Analysis of Air Emission Regulations and Electricity Market Distortions.
Synapse Energy Economics and the Global Development and Environment Institute for the National
Association of Regulatory Utility Commissioners.
Biewald, B., T. Woolf, P. Bradford, P. Chernick, S. Geller, J. Oppenheim. 1997. Performance‐Based
Regulation in a Restructured Electric Industry. Synapse Energy Economics, Resource Insight, and the
National Consumer Law Center for the National Association of Regulatory Utility Commissioners.
Biewald, B., T. Woolf, M. Breslow. 1997. Massachusetts Electric Utility Stranded Costs: Potential
Magnitude, Public Policy Options, and Impacts on the Massachusetts Economy. Synapse Energy
Economics for the Union of Concerned Scientists, MASSPIRG, and Public Citizen.
Woolf, T. 1997. The Delaware Public Service Commission Staff’s Report on Restructuring the Electricity
Industry in Delaware. Tellus Institute for The Delaware Public Service Commission Staff. Tellus Study No.
96‐99.
Woolf, T. 1997. Preserving Public Interest Obligations Through Customer Aggregation: A Summary of
Options for Aggregating Customers in a Restructured Electricity Industry. Tellus Institute for The
Colorado Office of Energy Conservation. Tellus Study No. 96‐130.
Woolf, T. 1997. Zero Carbon Electricity: the Essential Role of Efficiency and Renewables in New England’s
Electricity Mix. Tellus Institute for The Boston Edison Settlement Board. Tellus Study No. 94‐273.

Tim Woolf page 7 of 15
Woolf, T. 1997. Regulatory and Legislative Policies to Promote Renewable Resources in a Competitive
Electricity Industry. Tellus Institute for The Colorado Governor’s Office of Energy Conservation. Tellus
Study No. 96‐130‐A5.
Woolf, T. 1996. Can We Get There From Here? The Challenge of Restructuring the Electricity Industry So
That All Can Benefit. Tellus Institute for The California Utility Consumers' Action Network. Tellus Study
No. 95‐208.
Woolf, T. 1995. Promoting Environmental Quality in a Restructured Electric Industry. Tellus Institute for
The National Association of Regulatory Utility Commissioners. Tellus Study No. 95‐056.
Woolf, T. 1995. Systems Benefits Funding Options. Tellus Institute for Wisconsin Environmental Decade.
Tellus Study No. 95‐248.
Woolf, T. 1995. Non‐Price Benefits of BECO Demand‐Side Management Programs. Tellus Institute for
Boston Edison Settlement Board. Tellus Study No. 93‐174.
Woolf, T., B. Biewald. 1995. Electric Resource Planning for Sustainability. Tellus Institute for the Texas
Sustainable Energy Development Council. Tellus Study No. 94‐114.
ARTICLES
Woolf, T., E. Malone, C. Neme, R. LeBaron. 2014. “Unleashing Energy Efficiency.” Public Utilities
Fortnightly, October, 30‐38.
Woolf, T., A. Sommer, J. Nielson, D. Berry, R. Lehr. 2005. “Managing Electricity Industry Risk with Clean
and Efficient Resources.” The Electricity Journal 18 (2): 78‒84.
Woolf, T., A. Sommer. 2004. “Local Policy Measures to Improve Air Quality: A Case Study of Queens
County, New York.” Local Environment 9 (1): 89‒95.
Woolf, T. 2001. “Clean Power Opportunities and Solutions: An Example from America’s Heartland.” The
Electricity Journal 14 (6): 85‒91.
Woolf, T. 2001. “What’s New With Energy Efficiency Programs.” Energy & Utility Update, National
Consumer Law Center: Summer 2001.
Woolf T., B. Biewald. 2000. “Electricity Market Distortions Associated With Inconsistent Air Quality
Regulations.” The Electricity Journal 13 (3): 42‒49.
Ackerman, F., B. Biewald, D. White, T. Woolf, W. Moomaw. 1999. “Grandfathering and Coal Plant
Emissions: the Cost of Cleaning Up the Clean Air Act.” Energy Policy 27 (15): 929‒940.
Biewald, B., D. White, T. Woolf. 1999. “Follow the Money: A Method for Tracking Electricity for
Environmental Disclosure.” The Electricity Journal 12 (4): 55‒60.
Woolf, T., B. Biewald. 1998. “Efficiency, Renewables and Gas: Restructuring As if Climate Mattered.” The
Electricity Journal 11 (1): 64‒72.

Tim Woolf page 8 of 15
Woolf, T., J. Michals. 1996. “Flexible Pricing and PBR: Making Rate Discounts Fair for Core Customers.”
Public Utilities Fortnightly, July 1996.
Woolf, T., J. Michals. 1995. “Performance‐Based Ratemaking: Opportunities and Risks in a Competitive
Electricity Industry.” The Electricity Journal 8 (8): 64‒72.
Woolf, T. 1994. “Retail Competition in the Electricity Industry: Lessons from the United Kingdom.” The
Electricity Journal 7 (5): 56‒63.
Woolf, T. 1994. “A Dialogue About the Industry's Future.” The Electricity Journal 7 (5).
Woolf, T., E. D. Lutz. 1993. “Energy Efficiency in Britain: Creating Profitable Alternatives.” Utilities Policy
3 (3): 233‒242.
Woolf, T. 1993. “It is Time to Account for the Environmental Costs of Energy Resources.” Energy and
Environment 4 (1): 1‒29.
Woolf, T. 1992. “Developing Integrated Resource Planning Policies in the European Community.” Review
of European Community & International Environmental Law 1 (2) 118‒125.
PRESENTATIONS
Woolf, T. 2014. “The Resource Value Framework: Reforming Energy Efficiency Cost‐Effectiveness
Screening.” Presentation at the ACEEE Summer Study, August 21, 2014.
Woolf, T. 2013. “Recommendations for Reforming Energy Efficiency Cost‐Effectiveness Screening in the
United States.” Presentation at the National Association of Regulatory Commissioners Annual Meeting,
November 18, 2013.
Woolf, T., B. Biewald, and J. Migden‐Ostrander. 2013. “NARUC Risk Workshop for Regulators.”
Presentation at the Mid‐Atlantic Conference of Regulatory Utility Commissioners, June 2013.
Woolf, T. 2013. “Energy Efficiency Screening: Accounting for ‘Other Program Impacts’ & Environmental
Compliance Costs.” Presentation for Regulatory Assistance Project Webinar, March 2013.
Woolf, T. 2013. “Energy Efficiency: Rates, Bills, Participants, Screening, and More.” Presentation at
Connecticut Energy Efficiency Workshop, March 2013.
Woolf T. 2013. “Best Practices in Energy Efficiency Program Screening.” Presentation for SEE Action
Webinar, March 2013.
Woolf, T. 2013. “Energy Efficiency Screening: Application of the TRC Test.” Presentation for Energy
Advocates Webinar, January 2013.
Woolf, T. 2012. “Best Practices in Energy Efficiency Program Screening.” Presentation for American
Council for an Energy‐Efficient Economy Webinar, December 2012.

Tim Woolf page 9 of 15
Woolf, T. 2012. “In Pursuit of All Cost‐Effective Energy Efficiency.” Presentation at Sierra Club Boot
Camp, October 2012.
Woolf, T. 2012. “Best Practices in Energy Efficiency Program Screening.” Presentation at NARUC Summer
Meetings ‒ Energy Efficiency Cost‐Effectiveness Breakfast, July 2012.
Woolf, T. 2011. “Energy Efficiency Cost‐Effectiveness Tests.” Presentation at the Northeast Energy
Efficiency Partnerships Annual Meeting, October 2011.
Woolf, T. 2011. “Why Consumer Advocates Should Support Decoupling.” Presentation at the 2011
ACEEE National Conference on Energy Efficiency as a Resource, September 2011.
Woolf, T. 2011. “A Regulator’s Perspective on Energy Efficiency.” Presentation at the Efficiency Maine
Symposium In Pursuit of Maine’s Least‐Cost Energy, September 2011.
Woolf, T. 2010. “Bill Impacts of Energy Efficiency Programs: The Importance of Analyzing and Managing
Rate and Bill Impacts.” Presentation at the Energy in the Northeast Conference, Law Seminar
International, September 2010.
Woolf, T. 2010. “Bill Impacts of Energy Efficiency Programs: The Implications of Bill Impacts in
Developing Policies to Motivate Utilities to Implement Energy Efficiency.” Presentation to the State
Energy Efficiency Action Network, Utility Motivation Work Group, November 2010.
Woolf, T. 2010. “Bill Impacts of Energy Efficiency Programs.” Presentation to the Energy Resources and
Environment Committee at the NARUC Winter Meetings, February 2010.
Woolf, T. 2009. “Price‐Responsive Demand in the New England Wholesale Energy Market: Description of
NECPUC’s Limited Supply‐Side Proposal.” Presentation at the NEPOOL Markets Committee Meeting,
November 2009.
Woolf, T. 2009. “Demand Response in the New England Wholesale Energy Market: How Much Should
We Pay for Demand Resources?” Presentation at the New England Electricity Restructuring Roundtable,
October 2009.
Woolf, T. 2008. “Promoting Demand Resources in Massachusetts: A Regulator’s Perspective.”
Presentation at the Energy Bar Association, Northeast Chapter Meeting, June 2008.
Woolf, T. 2008. “Turbo‐Charging Energy Efficiency in Massachusetts: A DPU Perspective.” Presentation
at the New England Electricity Restructuring Roundtable, April 2008.
Woolf T. 2002. “A Renewable Portfolio Standard for New Brunswick.” Presentation to the New
Brunswick Market Design Committee, January 10, 2002.
Woolf, T. 2001. “Potential for Wind and Renewable Resource Development in the Midwest.”
Presentation at WINDPOWER 2001 in Washington DC, June 7, 2001.

Tim Woolf page 10 of 15
Woolf T. 1999. “Challenges Faced by Clean Generation Resources Under Electricity Restructuring.”
Presentation at the Symposium on the Changing Electric System in Florida and What it Means for the
Environment in Tallahassee, FL, November 1999.
Woolf, T. 2000. “Generation Information Systems to Support Renewable Portfolio Standards, Generation
Performance Standards and Environmental Disclosure.” Presentation at the Massachusetts
Restructuring Roundtable on behalf of the Union of Concerned Scientists, March 2000.
Woolf, T. 1998. “New England Tracking System Project: An Electricity Tracking System to Support a Wide
Range of Restructuring‐Related Policies.” Presentation at the Ninth Annual Energy Services Conference
and Exposition in Orlando, FL, December 1998.
Woolf, T. 2000. “Comments of the Citizens Action Coalition of Indiana.” Presentation at Workshop on
Alternatives to Traditional Generation Resources, June 2000.
Woolf, T. 1996. “Overview of IRP and Introduction to Electricity Industry Restructuring.” Training session
provided to the staff of the Delaware Public Service Commission, April 1996.
Woolf, T. 1995. “Competition and Regulation in the UK Electric Industry.” Presentation at the Illinois
Commerce Commission's workshop on Restructuring the Electric Industry, August 1995.
Woolf, T. 1995. “Competition and Regulation in the UK Electric Industry.” Presentation at the British
Columbia Utilities Commission Electricity Market Review, February 1995.
TESTIMONY
Missouri Public Service Commission (Case No. ER‐2014‐0370): Direct testimony on the topic of Kansas
City Power and Light’s rate design proposal. On behalf of Sierra Club. April 16, 2015.
Missouri Public Service Commission (File No. EO‐2015‐0055): Rebuttal and surrebuttal testimony on the
topic of Ameren Missouri’s 2016‐2018 Energy Efficiency Plan. On behalf of Sierra Club. March 20, 2015
and April 27, 2015.
Florida Public Service Commission (Dockets No. 130199‐EI et al.): Direct testimony on the topic of
setting goals for increasing the efficiency of energy consumption and increasing the development of
demand‐side renewable energy systems. On behalf of the Sierra Club. May 19, 2014.
Massachusetts Department of Public Utilities (Docket No. DPU 14‐__): Testimony regarding the cost of
compliance with the Global Warming Solution Act. On behalf of the Massachusetts Department of
Energy Resources and the Department of Environmental Protection. May 16, 2014.
Kentucky Public Service Commission (Case No. 2014‐00003): Direct testimony regarding Louisville Gas
and Electric Company and Kentucky Utilities Company’s proposed 2015‐2018 demand‐side management
and energy efficiency program plan. On behalf of Wallace McMullen and the Sierra Club. April 14, 2014.
Maine Public Utilities Commission (Docket No. 2013‐168): Direct and surrebuttal testimony regarding
policy issues raised by Central Maine Power’s 2014 Alternative Rate Plan, including recovery of capital

Tim Woolf page 11 of 15
costs, a Revenue Index Mechanism proposal, and decoupling. On behalf of the Maine Public Advocate
Office. December 12, 2013 and March 21, 2014.
Colorado Public Utilities Commission (Docket No. 13A‐0686EG): Answer and surrebuttal testimony
regarding Public Service Company of Colorado’s proposed energy savings goals. On behalf of the Sierra
Club. October 16, 2013 and January 21, 2014.
Kentucky Public Service Commission (Case No. 2012‐00578): Direct testimony regarding Kentucky
Power Company’s economic analysis of the Mitchell Generating Station purchase. On behalf of the
Sierra Club. April 1, 2013.
Nova Scotia Utility and Review Board (Matter No. M04819): Direct testimony regarding Efficiency Nova
Scotia Corporation’s Electricity Demand Side Management Plan for 2013 ‒ 2015. On behalf of the
Counsel to Nova Scotia Utility and Review Board. May 22, 2012.
Missouri Office of Public Counsel (Docket No. EO‐2011‐0271): Rebuttal testimony regarding IRP rule
compliance. On behalf of the Missouri Office of the Public Counsel. October 28, 2011.
Nova Scotia Utility and Review Board (Matter No. M03669): Direct testimony regarding Efficiency Nova
Scotia Corporation’s Electricity Demand Side Management Plan for 2012. On behalf of the Counsel to
Nova Scotia Utility and Review Board. April 8, 2011.
Rhode Island Public Utilities Commission (Docket No. 3790): Direct testimony regarding National Grid’s
Gas Energy Efficiency Programs. On behalf of the Division of Public Utilities and Carriers. April 2, 2007.
North Carolina Utilities Commission (Docket E‐100, Sub 110): Filed comments with Anna Sommer
regarding the Potential for Energy Efficiency Resources to Meet the Demand for Electricity in North
Carolina. Synapse Energy Economics on behalf of the Southern Alliance for Clean Energy. February 2007.
Rhode Island Public Utilities Commission (Docket No. 3765): Direct and Surrebuttal testimony
regarding National Grid’s Renewable Energy Standard Procurement Plan. On behalf of the Division of
Public Utilities and Carriers. January 17, 2007 and February 20, 2007.
Minnesota Public Utilities Commission (Docket Nos. CN‐05‐619 and TR‐05‐1275): Direct testimony
regarding the potential for energy efficiency as an alternative to the proposed Big Stone II coal project.
On behalf of the Minnesota Center for Environmental Advocacy, Fresh Energy, Izaak Walton League of
America, Wind on the Wires and the Union of Concerned Scientists. November 29, 2006.
Rhode Island Public Utilities Commission (Docket No. 3779): Oral testimony regarding the settlement of
Narragansett Electric Company’s 2007 Demand‐Side Management Programs. On behalf of the Division
of Public Utilities and Carriers. November 24, 2006.
Nevada Public Utilities Commission (Docket Nos. 06‐04002 & 06‐04005): Direct testimony regarding
Nevada Power Company’s and Sierra Pacific Power Company’s Renewable Portfolio Standard Annual
Report. On behalf of the Nevada Bureau of Consumer Protection. October 26, 2006

Tim Woolf page 12 of 15
Nevada Public Utilities Commission (Docket No. 06‐06051): Direct testimony regarding Nevada Power
Company’s Demand‐Side Management Plan in the 2006 Integrated Resource Plan. On behalf of the
Nevada Bureau of Consumer Protection. September 13, 2006.
Nevada Public Utilities Commission (Docket Nos. 06‐03038 & 06‐04018): Direct testimony regarding
the Nevada Power Company’s and Sierra Pacific Power Company’s Demand‐Side Management Plans. On
behalf of the Nevada Bureau of Consumer Protection. June 20, 2006.
Nevada Public Utilities Commission (Docket No. 05‐10021): Direct testimony regarding the Sierra
Pacific Power Company’s Gas Demand‐Side Management Plan. On behalf of the Nevada Bureau of
Consumer Protection. February 22, 2006.
South Dakota Public Utilities Commission (Docket No. EL04‐016): Direct testimony regarding the
avoided costs of the Java Wind Project. On behalf of the South Dakota Public Utilities Commission Staff.
February 18, 2005.
Rhode Island Public Utilities Commission (Docket No. 3635): Oral testimony regarding the settlement of
Narragansett Electric Company’s 2005 Demand‐Side Management Programs. On behalf of the Division
of Public Utilities and Carriers. November 29, 2004.
British Columbia Utilities Commission. Direct testimony regarding the Power Smart programs contained
in BC Hydro’s Revenue Requirement Application 2004/05 and 2005/06. On behalf of the Sierra Club of
Canada, BC Chapter. April 20, 2004.
Maryland Public Utilities Commission (Case No. 8973): Oral testimony regarding proposals for the PJM
Generation Attributes Tracking System. On behalf of the Maryland Office of People's Counsel. December
3, 2003.
Rhode Island Public Utilities Commission (Docket No. 3463): Oral testimony regarding the settlement of
Narragansett Electric Company’s 2004 Demand‐Side Management Programs. On behalf of the Division
of Public Utilities and Carriers. November 21, 2003.
California Public Utilities Commission (Rulemaking 01‐10‐024): Direct testimony regarding the market
price benchmark for the California renewable portfolio standard. On behalf of the Union of Concerned
Scientists. April 1, 2003.
Québec Régie de l'énergie (Docket R‐3473‐01): Direct testimony with Philp Raphals regarding Hydro‐
Québec’s Energy Efficiency Plan: 2003‐2006. On behalf of Regroupment national des Conseils régionaux
de l’environnement du Québec. February 5, 2003.
Connecticut Department of Public Utility Control (Docket No. 01‐10‐10): Direct testimony regarding the
United Illuminating Company’s service quality performance standards in their performance‐based
ratemaking mechanism. On behalf of the Connecticut Office of Consumer Counsel. April 2, 2002.

Tim Woolf page 13 of 15
Nevada Public Utilities Commission (Docket No. 01‐7016): Direct testimony regarding the Nevada
Power Company’s Demand‐Side Management Plan. On behalf of the Bureau of Consumer Protection,
Office of the Attorney General. September 26, 2001.
United States Department of Energy (Docket Number‐EE‐RM‐500): Comments with Bruce Biewald,
Daniel Allen, David White, and Lucy Johnston of Synapse Energy Economics regarding the Department of
Energy’s proposed rules for efficiency standards for central air conditioners and heat pumps. On behalf
of the Appliance Standards Awareness Project. December 2000.
US Department of Energy (Docket EE‐RM‐500): Oral testimony at a public hearing on marginal price
assumptions for assessing new appliance efficiency standards. On behalf of the Appliance Standards
Awareness Project. November 2000.
Connecticut Department of Public Utility Control (Docket No. 99‐09‐03 Phase II): Direct testimony
regarding Connecticut Natural Gas Company’s proposed performance‐based ratemaking mechanism. On
behalf of the Connecticut Office of Consumer Counsel. September 25, 2000.
Mississippi Public Service Commission (Docket No. 96‐UA‐389): Oral testimony regarding generation
pricing and performance‐based ratemaking. On behalf of the Mississippi Attorney General. February 16,
2000.
Delaware Public Service Commission (Docket No. 99‐328): Direct testimony regarding maintaining
electric system reliability. On behalf of Delaware Public Service Commission Staff. February 2, 2000.
Delaware Public Service Commission (Docket No. 99‐328): Filed expert report (“Investigation into the
July 1999 Outages and General Service Reliability of Delmarva Power & Light Company,” jointly authored
with J. Duncan Glover and Alexander Kusko). Synapse Energy Economics and Exponent Failure Analysis
Associates on behalf the Delaware Public Service Commission Staff. February 1, 2000.
New Hampshire Public Service Commission (Docket No. 99‐099 Phase II): Oral testimony regarding
standard offer services. On behalf of the Campaign for Ratepayers Rights. January 14, 2000.
West Virginia Public Service Commission (Case No. 98‐0452‐E‐GI): Rebuttal testimony regarding codes
of conduct. On behalf of the West Virginia Consumer Advocate Division. July 15, 1999.
West Virginia Public Service Commission (Case No. 98‐0452‐E‐GI): Direct testimony regarding codes of
conduct and other measures to protect consumers in a restructured electricity industry. On behalf of the
West Virginia Consumer Advocate Division. June 15, 1999.
Public Service Commission of West Virginia (Case No. 98‐0452‐E‐GI ): Filed expert report (“Measures to
Ensure Fair Competition and Protect Consumers in a Restructured Electricity Industry in West Virginia,”
jointly authored with Jean Ann Ramey and Theo MacGregor) in the matter of the General Investigation
to determine whether West Virginia should adopt a plan for open access to the electric power supply
market and for the development of a deregulation plan. Synapse Energy Economics and MacGregor
Energy Consultancy on behalf of the West Virginia Consumer Advocate Division. June 1999.

Tim Woolf page 14 of 15
Massachusetts Department of Telecommunications and Energy (DPU/DTE 97‐111): Direct testimony
regarding Commonwealth Electric Company’s energy efficiency plan, and the role of municipal
aggregators in delivering demand‐side management programs. On behalf of Cape and Islands Self‐
Reliance Corporation. January 1998.
Delaware Public Service Commission (DPSC 97‐58): Direct testimony regarding Delmarva Power and
Light’s request to merge with Atlantic City Electric. On behalf of Delaware Public Service Commission
Staff. May 1997.
Delaware Public Service Commission (DPSC 95‐172): Oral testimony regarding Delmarva’s integrated
resource plan and DSM programs. On behalf of the Delaware Public Service Commission Staff. May
1996.
Colorado Public Utilities Commission (5A‐531EG): Direct testimony regarding the impact of proposed
merger on DSM, renewable resources and low‐income DSM. On behalf of the Colorado Office of Energy
Conservation. April 1996.
Colorado Public Utilities Commission (3I‐199EG): Direct testimony regarding the impacts of increased
competition on DSM, and recommendations for how to provide utilities with incentives to implement
DSM. On behalf of the Colorado Office of Energy Conservation. June 1995.
Colorado Public Utilities Commission (5R‐071E): Oral testimony on the Commission's integrated
resource planning rules. On behalf of the Colorado Office of Energy Conservation. July 1995.
Colorado Public Utilities Commission (3I‐098E): Direct testimony on the Public Service Company of
Colorado's DSM programs and integrated resource plans. On behalf of the Colorado Office of Energy
Conservation. April 1994.
Delaware Public Service Commission (Docket No. 96‐83): Filed comments regarding the Investigation of
Restructuring the Electricity Industry in Delaware (Tellus Institute Study No. 96‐99). On behalf of the
Staff of the Delaware Public Service Commission. November 1996.
Colorado Public Utilities Commission (Docket No. 96Q‐313E): Filed comments in response to the
Questionnaire on Electricity Industry Restructuring (Tellus Institute Study No. 96‐130‐A3). On behalf of
the Colorado Governor's Office of Energy Conservation. October 1996.
State of Vermont Public Service Board (Docket No. 5854): Filed expert report (Tellus Institute Study No.
95‐308) regarding the Investigation into the Restructuring of the Electric Utility Industry in Vermont. On
behalf of the Vermont Department of Public Service. March 1996.
Pennsylvania Public Utility Commission (Docket No. I‐00940032): Filed comments (Tellus Institute
Study No. 95‐260) regarding an Investigation into Electric Power Competition. On behalf of The
Pennsylvania Office of Consumer Advocate. November 1995.
New Jersey Board of Public Utilities (Docket No. EX94120585Y): Initial and reply comments (“Achieving
Efficiency and Equity in the Electricity Industry Through Unbundling and Customer Choice,” Tellus

Tim Woolf page 15 of 15
Institute Study No. 95‐029‐A3) regarding an investigation into the future structure of the electric power
industry. On behalf of the New Jersey Division of Ratepayer Advocate. September 1995.
Resume dated April 2015

The Resource Value Framework Reforming Energy Efficiency Cost-Effectiveness Screening
The National Efficiency Screening Project
Updated August 16, 2014
A division of the Home Performance Coalition

National Efficiency Screening Project – Summary of Recommendations
The Resource Value Framework: Reforming Energy Efficiency Cost-Effectiveness Screening © 2014 The National Home Performance Council, Inc., a division of the Home Performance Coalition
The National Efficiency Screening Project
The National Efficiency Screening Project (NESP) is a group of organizations and individuals that are working together to improve the way that utility customer-funded electricity and natural gas energy efficiency resources are screened for cost-effectiveness. NESP is coordinated by the National Home Performance Council, Inc., a division of the Home Performance Coalition. The purpose of this project is to improve efficiency screening practices throughout the United States, and to help inform decision-makers regarding which efficiency resources are in the public interest and what level of investment is appropriate.
About This Document
This document provides an overview of NESP’s recommendations for using the Resource Value Framework (RVF) to improve cost-effectiveness testing. The rationale for and description of the RVF are intentionally succinct and compact in this report, despite the complexity of some of the issues. In the future, we may revise this report, as well as develop accompanying support documents or follow-up reports, to reflect stakeholder input and further analysis by the authors and project advisors.
Authors
This document was prepared by Tim Woolf, Synapse Energy Economics; Chris Neme, Energy Futures Group; Pat Stanton, Conservation Services Group, Inc.; Robin LeBaron, National Home Performance Council, Inc.; Kara Saul-Rinaldi, National Home Performance Council, Inc.; and, Steve Cowell, Conservation Services Group, Inc.
Project Advisors As of August 16, 2014
Philippe Dunsky, Dunsky Energy Consulting Tom Eckman, Northwest Power and Conservation Council Dian Grueneich, Former California Public Utilities Commission Commissioner M. Sami Khawaja, Cadmus Marty Kushler, American Council for an Energy Efficient Economy Julie Michals, Northeast Energy Efficiency Partnerships Peter Miller, Natural Resources Defense Council Jerrold Oppenheim, Democracy and Regulation Sonny Popowsky, Former Consumer Advocate, Pennsylvania Steve Schiller, Schiller Consulting, Inc. Rodney Sobin, Alliance to Save Energy Carol White, National Grid

© 2014 National Home Performance Council, Inc., a division of the Home Performance Coalition
Project Members As of August 16, 2014
The following organizations are members of the National Efficiency Screening Project, and support the principles and recommendations presented here.
Alliance to Save Energy Local Energy Alliance Program
American Council for an Energy Efficient Economy
MaGrann Associates
National Grid
Arkansas Advanced Energy Association
Association for Energy Affordability, Inc.
National Home Performance Council, Inc., a division of the Home Performance Coalition
BKi National Housing Trust
Building Performance Contractors Association Natural Resources Defense Council
Building Performance Institute, Inc. Northeast Energy Efficiency Council
Clinton Foundation: Home Energy Affordability Program
PECI
Performance Systems Development
Conservation Connection Consulting Retrofit Software
Conservation Services Group Sealed
Democracy and Regulation Sierra Club
Efficiency First Southeast Energy Efficiency Alliance
Energy Federation Incorporated Southern Environmental Law Center
Environment America Southwest Energy Efficiency Project
Environment Northeast Truveon Corporation
Home Performance Guild of Oregon Wisconsin Energy Center
NESP welcomes additional organizations to join this list of members. If your organization wishes to participate in this project, please sign up using the web site provided below.
Further Information
This document, and related materials from the NESP, is available at the following website: http://www.nhpci.org/campaigns.html.

National Efficiency Screening Project – Summary of Recommendations
Contents
1. MISSION STATEMENT .................................................................................................... 1
2. THE RESOURCE VALUE FRAMEWORK ............................................................................. 1
a. Both Flexibility and Guidance .............................................................................................. 1
b. Principles ............................................................................................................................. 2
c. The Public Interest Perspective ........................................................................................... 2
d. Designing an Appropriate Screening Test with the Resource Value Framework ................ 4
e. How the Standard Screening Tests Fit Within the Resource Value Framework .................. 4
f. Treatment of Benefits .......................................................................................................... 6
g. Documentation and Transparency ...................................................................................... 7
3. ADDITIONAL SCREENING CONSIDERATIONS .................................................................... 9
4. ADDITIONAL RESEARCH ................................................................................... 9

National Efficiency Screening Project – Summary of Recommendations Page 1
1. MISSION STATEMENT
The National Efficiency Screening Project (NESP) is a group of organizations and individuals that are working together to improve the way that electricity and natural gas energy efficiency resources are screened for cost-effectiveness. The purpose of this initiative is to improve efficiency screening practices throughout the United States, and to help inform decision-makers regarding which efficiency resources are in the public interest and what level of investment is appropriate.
Customer-funded energy efficiency programs have generated tens of billions of dollars of savings for households and businesses throughout the nation. In addition to reducing energy bills of program participants, efficiency programs create real benefits for all energy consumers, by deferring the need for new power plants, reducing marginal energy costs, avoiding transmission and distribution costs, reducing risk on the utility system, and helping to achieve a variety of important energy policy goals.
States have a tremendous opportunity to expand upon these benefits through ongoing and future energy efficiency initiatives. However, to take full advantage of this opportunity many states need to revisit and update their cost effectiveness screening methods and practices.
The California Standard Practice Manual has been widely used for many years as a guide for how to apply energy efficiency screening tests. However, this manual is out of date and does not address several of the key challenges facing regulators today. Its treatment of many issues is also very general, leaving significant details to interpretation. As a result, what are commonly thought to be “standard” tests are in fact applied inconsistently across states, including in ways that do not accurately reflect the value of energy efficiency.1
The NESP was formed with a view to encouraging more consistent application of energy efficiency screening tests. To this end, we will prepare an initial framework and, going forward, intend to design a new Standard Practice Manual to assist states in improving their efficiency screening.
2. THE RESOURCE VALUE FRAMEWORK
The NESP recommends that each state use the Resource Value Framework (RVF) for developing and implementing efficiency screening tests. The RVF includes the following elements.2
a. Both Flexibility and Guidance
One of the key concepts underlying the Resource Value Framework is that states should not be limited to the traditional screening tests presented in the California Standard Practice Manual (i.e., the Utility Cost,
1 For more information see National Home Performance Council, Best Practices in Energy Efficiency Program Screening: How to Ensure that
the Value of Energy Efficiency is Properly Accounted For, July 2012. 2
For more information see National Efficiency Screening Project, Recommendations for Reforming Energy Efficiency Cost-Effectiveness
Screening in the United States, November 2013.

Page 2 © 2014 National Home Performance Council, Inc., a division of the Home Performance Coalition
Total Resource Cost, Societal Cost, Participant Cost and Rate Impact Measure tests).3 There are other ways of defining screening tests that are consistent with the principles outlined below and more in line with a state’s energy policy goals.4
Further, the Resource Value Framework is not a recommendation for a single energy efficiency screening test. It is a framework of principles and recommendations to provide guidance for states to develop and implement tests that are consistent with sound principles and best practices. It is intentionally designed to provide each state with the flexibility to ensure that the test they use meets their state’s distinct needs and interests, as provided in relevant energy policies and regulatory orders.
b. Principles
In designing an energy efficiency screening test, each state should adhere to the following principles.
The Public Interest. The ultimate objective of efficiency screening is to determine whether a particular energy efficiency resource is in the public interest.
Energy Policy Goals. Efficiency screening practices should account for the energy policy goals of each state, as articulated in legislation, commission orders, regulations, guidelines and other policy directives. These policy goals provide guidance with regard to which efficiency programs are in the public interest.
Symmetry. Efficiency screening practices should ensure that tests are applied symmetrically, where both relevant costs and relevant benefits are included in the screening analysis. For example, a state that chooses to include participant costs in its screening test should also include participant benefits, including low-income and other participant non-energy benefits, otherwise the test will be skewed against energy efficiency resources.
Hard-to-Quantify Benefits. Efficiency screening practices should not exclude relevant benefits on the grounds that they are difficult to quantify and monetize. Several methods are available to approximate the magnitude of relevant benefits, as described below.
Transparency. Efficiency program administrators should use a standard template to explicitly identify their state’s energy policy goals and to document their assumptions and methodologies.
Applicability. In general, the Resource Value Framework can be used by regulators in any state to determine if customer-funded energy efficiency resources are cost-effective. The RVF may also be applicable for evaluating the costs and benefits of other demand-side and supply-side resources, although application in this context has not yet been fully examined.
c. The Public Interest Perspective
Efficiency screening tests are often described as representing a particular “perspective.” For example, the Utility Cost test is meant to represent the perspective of the utility system and the Societal Cost test is meant to represent the perspective of society as a whole.
3 Currently few, if any, states apply these tests as defined in the California Standard Practice Manual, because each state modifies the
“standard” tests in a variety of ways. 4
Throughout this document we use the term energy policy goals to refer to those policy goals related to the regulated utilities in the state.

National Efficiency Screening Project – Summary of Recommendations Page 3
One of the challenges in designing an efficiency screening test is that these two perspectives do not fully address the perspective of utility regulators. The utility system perspective is sometimes considered to be too narrow because it does not account for some key energy policy goals, e.g., promoting customer equity, assisting low-income customers, or promoting economic development. The societal perspective is sometimes considered to be too broad because it could, theoretically, include some costs and benefits that are outside the scope of utility regulator’s authority.
The utility regulator’s primary responsibility is to serve and protect the public interest through oversight of the utility system.5 In practice, utility regulators frequently make determinations as to whether utility investments or actions are in the public interest. Such determinations typically require weighing many different factors and considerations, some of which require tradeoffs (e.g., cost versus reliability). These public interest determinations require utility regulators to consider those factors that are within the bounds of their authority as economic regulators. This same approach can, and should, be applied to screening energy efficiency resources.
We recommend that the primary efficiency screening test used by each state reflect a public interest perspective. In other words, the test should account for all the costs and benefits that indicate whether an efficiency resource is in the public interest. The determination of whether an energy efficiency resource is in the public interest should be based on the energy policy goals of each state.
Utility, Public Interest, and Societal Perspectives
It is important to note that the public interest perspective is not the same as the societal perspective. Unlike the societal perspective, the public interest perspective is explicitly designed to include only those impacts that are determined to be within the bounds of utility regulators’ scope and authority. Some
5 The statutes that create public utility commissions and the commission mission statements often explicitly identify safeguarding the public
interest as the commission’s primary role. For example, The Texas Public Utility Regulatory Act states: “It is the purpose of this title to grant the Public Utility Commission of Texas authority to make and enforce rules necessary to protect customers of telecommunications and electric services consistent with the public interest” (Sec. 11.002). The California Public Utility Commission’s mission states: “The CPUC serves the public interest by protecting consumers and ensuring the provision of safe, reliable utility service and infrastructure at reasonable rates, with a commitment to environmental enhancement and a healthy California economy.”

Page 4 © 2014 National Home Performance Council, Inc., a division of the Home Performance Coalition
societal costs and benefits might fall outside those bounds. This is illustrated in the figure above. The energy policy benefits that are not typically included in the Utility System perspective but could be included in the public interest perspective include, for example: promote customer equity, reduce risk, improve system reliability, reduce energy price volatility, reduce the environmental impacts of energy, or promote economic development.
d. Designing an Appropriate Screening Test with the Resource Value Framework
Each state that uses the Resource Value Framework to design (or modify) its efficiency screening test should take the following steps:
1. Explicitly acknowledge that the ultimate objective of efficiency screening is to determine whether a particular energy efficiency resource is in the public interest, and that determinations of the public interest should include consideration of state energy policy goals.
2. Identify the state’s energy policy goals that are relevant to, and might be affected by, energy efficiency resources, for example: ensure fair treatment of low-income programs and customers, promote customer equity, reduce risk, improve system reliability, reduce energy price volatility, reduce the environmental impacts of energy, or promote economic development.
3. Identify a way of accounting for those energy policy goals in the state’s screening test. Below we describe several methods to account for hard-to-quantify costs and benefits. Each state should identify which method will be used to account for each of its relevant energy goals.
4. Use the Resource Value Framework template to explicitly identify the assumptions and methodologies necessary to ensure that the test is balanced, transparent, and takes the appropriate energy policy goals into account. Below we provide some information and an example of what such a template should include.
We recognize that there may be value to applying more than one screening test when evaluating the cost-effectiveness of energy efficiency. In practice, however, it is often necessary to choose a primary test for screening energy efficiency, for those cases where an efficiency resource passes one test but not another. We recommend that states use the Resource Value Framework to design the primary test used to screen efficiency resources.
e. How the Standard Screening Tests Fit Within the Resource Value Framework
Here we briefly summarize how the Resource Value Framework compares with the standard efficiency screening tests described in the California Standard Practice Manual.6 (See Attachment 1 for an overview of the standard screening tests.) We also summarize some recommendations about how the standard screening tests should, or should not, be used when evaluating cost-effectiveness.
Note that while almost all states indicate that they are using the TRC test, the Utility Cost test, or the Societal test, in practice states use many different variations of these tests. In fact, very few states use the exact same screening test, because each modifies the “standard” tests in a variety of ways. The primary purpose of the Resource Value Framework is to provide a set of principles and concepts that allow states
6 We use the term “standard” screening tests to refer to the theoretical definition of the test, as distinct from the tests that are applied in
practice, which vary considerably across states.

National Efficiency Screening Project – Summary of Recommendations Page 5
to continue this practice of developing their own screening test, but ensures that it is done in a way that is explicit, transparent, balanced, and methodologically consistent.
The Utility Cost Test7
The utility system costs and benefits are fundamental drivers for implementing efficiency resources, and should be included in any efficiency screening test.8 Therefore, all the components of the standard Utility Cost test should be included in any efficiency screening test. However, states must recognize that the standard Utility Cost test by itself cannot properly reflect several important energy policy goals, for example the equitable treatment of low-income efficiency programs.9 Therefore, states that use the Utility Cost test should supplement it by applying the principles outlined above, in order to ensure that the test properly accounts for all of the state’s energy policy goals.
The Societal Cost Test
The Societal Cost test, as is sometimes applied today, typically includes utility system impacts, participant impacts, and selected societal impacts (e.g., environmental externalities, economic development). It is important that if this approach is chosen, all societal costs and all societal benefits, including all participant costs and benefits, are included in the analysis. States that use the Resource Value Framework to design a screening test and that have policy goals that address societal impacts (e.g., reduce environmental impacts of energy, promote job creation) will end up with a screening test that is similar to the Societal Cost test as it is commonly applied today.
The Total Resource Cost Test
There are serious concerns about how the TRC test is currently used in most states to screen energy efficiency resources. In practice, states that use the TRC test include participant costs, but typically do not include any or all of the relevant participant non-energy benefits, with the result being a test that is both biased against efficiency resources and that provides decision-makers with inaccurate information regarding “total resource" costs and benefits. We recommend against using the TRC test, unless states apply the principles outlined above and ensure symmetry by fully capturing both participant costs and participant benefits, using reasonable estimates of non-energy benefits. Moreover, a decision to fully include participant impacts in the screening test essentially leads toward adoption of a public interest perspective. By including participant impacts, the TRC test crosses a fundamental boundary by including impacts that are outside the scope of the utility perspective. If the goal of the test is to include impacts outside the scope of the utility perspective, then a public interest perspective is more appropriate than the TRC test perspective. Jurisdictions that use a “modified” TRC test as their benefit/cost test frequently use modifications designed to account for public interest issues.
7 This test is sometimes referred to as the Program Administrator Cost (PAC) test. 8
The one exception is the Participant test, which is focused exclusively on participant costs and benefits. 9
Well-designed low-income programs often require that the utilities or other third parties pay all of the costs of efficiency measures, so that
program participants do not have to make a contribution. Other types of efficiency programs, by contrast, often require a participant contribution and thus require a much smaller utility contribution. Consequently, a strict application of the Utility Cost test will structurally disadvantage low-income programs, relative to other programs, by including the total measure costs.

Page 6 © 2014 National Home Performance Council, Inc., a division of the Home Performance Coalition
Regardless of whether a state currently uses, or starts modifying its screening test from, the Utility Cost test, the TRC test, or the Societal Cost test, it should make sure that the test accounts for the state's energy policy goals.
The Participant Cost Test
We recommend that the standard Participant Cost test not be used for screening energy efficiency resources. While the impacts on program participants may be an important consideration, they are a secondary consideration relative to the impacts captured in the other tests. This test should be used for program design and customer information purposes, but not for portfolio or program cost-effectiveness screening.
The Ratepayer Impact Measure Test
We recommend that the standard Ratepayer Impact Measure (RIM) test not be used for screening energy efficiency resources. The RIM test is not a test of the cost-effectiveness of a new resource; instead it focuses on the re-allocation of already sunk utility system costs. The rate impacts from efficiency resources are essentially a matter of customer equity, but the RIM test is not a good indicator of customer equity: It is overly narrow, ignores many of the benefits of energy efficiency programs, is inconsistent with the assessment of supply-side resources, does not necessarily reflect the actual impact on rates, and deprives customers of the opportunity to lower their bills through energy efficiency measures. Utilities and regulators that are concerned about the rate impacts of efficiency resources should address customer equity concerns separately from the cost-effectiveness screening, by comprehensively analyzing short- and long-term rate, bill and customer participation impacts, and by ensuring that all customer classes and segments contributing to energy efficiency funding have reasonable access to energy efficiency program opportunities.10
f. Treatment of Benefits
Efficiency screening practices should not exclude relevant benefits on the grounds that they are difficult to quantify.11 Applying rough or qualitative approximations of hard-to-quantify benefits and costs is preferable to assuming that those benefits do not exist or have no value. We recommend that the following options be used to account for relevant benefits:
Relevant benefits should be put into monetary terms to the greatest extent possible.
In the absence of monetary terms, relevant benefits should be accounted for using estimates (or proxies) (either in terms of a percent of benefits or in terms of $/MWh or $/therm) to approximate the value of the non-monetized benefits.
In the absence of monetary terms or estimates, relevant benefits should be accounted for using alternative screening benchmarks, i.e., allowing efficiency programs to be considered in the public interest at pre-determined benefit-cost ratios of less than one.
10 See State Energy Efficiency Action Network 2011. Analyzing and Managing Bill Impacts of Energy Efficiency Programs: Principles and
Recommendations. 11
These recommendations and methodologies also apply to relevant hard-to-quantify costs.

National Efficiency Screening Project – Summary of Recommendations Page 7
In the absence of better alternatives, relevant benefits should be accounted for using regulatory judgment, i.e., allowing regulators and program administrators to account for hard-to-quantify benefits without using any of the options above.
Those relevant benefits that are not put into monetary terms should nonetheless be quantified (e.g., estimated in terms of tons of emissions avoided, net number of jobs produced, reduced sick days) to the extent possible. Quantification of relevant benefits can help inform the application of other estimates, alternative benchmarks and regulatory judgment.
g. Documentation and Transparency
We recommend that states use a Resource Value Framework template to provide a transparent, consistent structure for presenting efficiency costs and benefits. The template should clearly document the key screening assumptions (e.g., discount rate, measure life, savings levels), as well as the quantitative and qualitative cost and benefit findings. A sample Resource Value Framework template is provided below.
Section 1 of this template should include the key pertinent assumptions used in screening the efficiency resource. If the resource is screened at the program level, then there should be one template filled out for each program. If the resource is screened at the sector or portfolio level, then the template should be completed for the sector or portfolio.
Section 2 should include the monetized utility system costs and benefits. These costs and benefits should be the foundation for any efficiency screening test.
Section 3 should include monetized participant costs and participant benefits—for those states that have explicitly decided to include participant costs and benefits. If a state chooses not to include participant benefits (including reasonable estimates of participant non-energy benefits), then it cannot include participant costs either. In such a case, Section 3 should be left blank.
Section 4 should account for monetized public costs and benefits, as appropriate, in order to reflect the state’s articulated energy policies. These impacts can be added in to all of the other monetized costs and benefits.
Finally, Section 5 should include all of the non-monetized public costs and benefits deemed necessary to reflect the state’s energy policies, so that these can be considered separately from the total monetized costs and benefits. These public costs and benefits should be accounted for in any efficiency screening test. Including these public impacts is necessary to align the efficiency screening test with the state’s energy policy goals. This alignment with a state’s energy policy goals is what distinguishes the Resource Value Framework from the standard efficiency screening tests.
It is important to reiterate that Section 2 presents a list of the utility system costs and benefits that should be included in any efficiency screening test. Sections 3, 4 and 5, however, present an illustrative list of costs and benefits that a state should take into account, depending upon its energy policy goals. States may choose to account for impacts beyond the illustrative impacts presented above. Also note that this

Page 8 © 2014 National Home Performance Council, Inc., a division of the Home Performance Coalition
template should be accompanied by references that provide full documentation for all the assumptions and results presented.12
12 These assumptions are often documented in a Technical Reference Manual.
13 If a non-utility entity is responsible for providing energy efficiency services, then that Program Administrator’s costs rather than “utility”
costs should be included.
Resource Value Framework - Template Program Name: Date: 1. Key Assumptions, Parameters and Summary of Results
Analysis Level □ Program □ Portfolio
Measure Life Discount Rate Projected Annual Savings Projected Lifetime Utility Savings
2. Monetized Utility Costs13 Monetized Utility Benefits
Program Administration Avoided Energy Costs Incentives Paid to Participants Avoided Capacity Costs Shareholder Incentive Avoided T&D Costs Evaluation Wholesale Market Price Suppression Other Utility Costs Avoided Environmental Compliance Costs Other Utility System Benefits NPV Total Utility Cost NPV Total Utility Benefits 3. Monetized Participant Costs Monetized Participant Benefits Participant Contribution Participants' Savings of Other Fuels Participant’s Increased O&M Costs Participant Non-Energy Benefits: Other Participant Costs Participants' Water and Sewer Savings Participants' Reduced O&M Costs Participants' Health Impacts Participant Employee Productivity Participant Comfort Additional Low-Income Participant Benefits Other Participant Non-Energy Benefits NPV Total Participant Cost NPV Total Participant Benefits 4. Monetized Public Costs Monetized Public Benefits Public Costs Public Benefits of Low Income Programs Reduced Environmental Impacts (if monetized) Public Fuel and Water Savings Reduced Public Health Care Costs Other Public Benefits NPV Total Public Costs NPV Total Public Benefits Total Monetized Costs and Benefits
Total Costs Total Benefits Benefit- Cost Ratio Net Benefits
5. Non-Monetized Public Costs and Benefits Non-Monetized Benefits Comments Promotion of Customer Equity Reduced Risk Increased Reliability Reduced Environmental Impacts (if not monetized) Increased Jobs and Economic Development 6. Determination:
□ Program is in the public interest □ Program is not in the Public Interest

National Efficiency Screening Project – Summary of Recommendations Page 9
3. ADDITIONAL SCREENING CONSIDERATIONS
Regardless of how each state ultimately designs a screening test, we recommend that each state apply
the following best practices for screening energy efficiency:
Avoided costs. States should require that efficiency screening analyses account for all relevant utility system costs avoided by efficiency resources, including: generation costs, transmission costs, distribution costs, environmental compliance costs, the price suppression effects in wholesale markets and utility-perspective non-energy benefits.
Additional utility system benefits. Energy efficiency screening practices should recognize the benefits that some programs offer regarding customer equity, risk reduction, and market transformation. These should be considered benefits that accrue to the utility system, and should therefore be included in any cost-effectiveness test.
Discount rates. States should require that the discount rates used to screen energy efficiency be based on the overall regulatory perspective underlying the screening test, and the risk associated with the energy efficiency investment. For example, states that use the societal perspective should use a societal discount rate, such as a U.S. Treasury Note rate for a period of time equivalent to the efficiency portfolio savings lifetime.
Risk benefits. States should account for risk mitigation benefits when screening energy efficiency. For example, energy efficiency reduces the need for additional fossil-fired generation, thereby lowering the utility’s exposure to both fuel price volatility and carbon control compliance cost risk.14 Risk mitigation benefits accrue to the utility system, and therefore should be included in any screening test. Risk mitigation benefits should be accounted for either in selecting a discount rate, in modeling avoided costs, or as an explicit benefit to be included in the cost-effectiveness analysis.
Screening level. States should screen energy efficiency resources at the program, sector or portfolio level, not at the measure level.
Study period. Efficiency screening analyses should use a study period that is long enough to include the full operating lives of all the measures included in the energy efficiency programs.
4. ADDITIONAL RESEARCH
We recommend that research be undertaken to address several efficiency resource screening issues that warrant additional analysis and discussion. For example, additional research on the following topics would help contribute to the improvement of energy efficiency screening in many states:
An analysis of the appropriate choice of specific discount rates to use when screening energy efficiency resources to represent a utility or societal perspective. This would include an
14 See Appendix L - Portfolio Model of the 5th Northwest Power and Conservation Plan, pp. 129-136 for an extended discussion of the risk
mitigation benefits of energy efficiency. Available at: http://www.nwcouncil.org/media/4401326/Appendix_L_Portfolio_Model.pdf.

Page 10 © 2014 National Home Performance Council, Inc., a division of the Home Performance Coalition
assessment of the cost of capital for funding energy efficiency, as well as the expected risk associated with the resource.
An analysis providing generic estimates of values for the most important participant and societal non-energy benefits. The purpose of this would be to provide states with readily available, well-documented, transparent and credible estimated values for non-energy benefits, making it more practical to account for these benefits without the need for sometimes costly research.
An analysis of the appropriate way to account for rate and bill impacts when screening energy efficiency programs. This would include an assessment of how to quantitatively assess customer equity issues associated with energy efficiency resources, without relying upon the flawed Rate Impact Measure test.
An analysis of the appropriate way to account for free-riders, spillover and market transformation. The purpose of this would be to provide guidance for how states should use “gross” savings and “net” savings estimates in a consistent, sound manner over both the short-term and long-term planning horizon, thus ensuring symmetry in the analysis.
An analysis of the true incremental cost of an efficiency measure. This would include recommendations for how to account for the incremental measure cost caused by improved efficiency, as distinguished from the incremental measure cost caused by non-efficiency features.
Guidance on how to determine the baseline that should be accounted for when screening the value of incremental benefits from an energy efficiency investment.
An analysis of the proper application of measure lives and study periods.
Finally, we recommend that a new Energy Efficiency Standard Practice Manual be developed to build off of the concepts outlined in this document. The purpose of this new manual would be to update and expand upon the California Standard Practice Manual, and to provide comprehensive guidance for all states on how to improve their energy efficiency screening practices. We intend to develop such a manual and to include a wide range of stakeholders in that process.

National Efficiency Screening Project – Summary of Recommendations Page 11
Attachment 1 – The Standard Cost-Effectiveness Tests
Components of the Standard Cost-Effectiveness Tests
Participant Cost Test
RIMTest
Utility CostTest
TRC Test
Societal CostTest
Energy Efficiency Program Benefits:
Avoided Energy Costs --- Yes Yes Yes Yes
Avoided Capacity Costs --- Yes Yes Yes Yes
Avoided Transmission and Distribution Costs --- Yes Yes Yes Yes
Wholesale Market Price Suppression Effects --- Yes Yes Yes Yes
Avoided Cost of Environmental Compliance --- Yes Yes Yes Yes
Non-Energy Benefits (utility) --- Yes Yes Yes Yes
Non-Energy Benefits (participant) Yes --- --- Yes* Yes*
Non-Energy Benefits (societal) --- --- --- --- Yes
Customer Bill Savings Yes --- --- --- ---
Energy Efficiency Program Costs:
Program Administrator Costs --- Yes Yes Yes Yes
EE Measure Cost: Program Financial Incentive --- Yes Yes Yes Yes
EE Measure Cost: Participant Contribution Yes --- --- Yes Yes
Lost Revenues to the Utility --- Yes --- --- ---
* In theory, participant non-energy benefits should be included in the TRC and the Societal tests. However, in practice they are typically
underestimated or wholly neglected. As a result, most TRC assessments understate the efficiency benefits.
Implications of the Standard Cost-Effectiveness Tests
Test Key Question Answered
Summary Approach Implications
Societal Cost Will total costs to society decrease?
Includes the costs and benefits experienced by all members of society.
Most comprehensive comparison.
Total Resource Cost
Will utility system costs plus program participants’ costs decrease?
Includes the costs and benefits experienced by the utility system, plus costs and benefits to program participants.
By including impacts beyond the utility’s costs and benefits, this test is essentially based on a societal perspective.
Utility Cost Will utility system costs decrease?
Includes the costs and benefits experienced by the utility system.
Limited to impacts on utility revenue requirements. Indicates net impact on utility costs and utility bills.
Participant Will program participants’ costs decrease?
Includes the costs and benefits experienced by the customers who participate in the program.
Useful in program design to improve participation. Of limited use for cost-effectiveness screening.
Rate Impact Measure
Will utility rates decrease?
Includes the costs and benefits that will affect utility rates, including utility system costs and benefits as well as lost revenues.
Does not provide useful information regarding rate impacts or customer equity. Should not be used for cost-effectiveness screening.

A division of the Home Performance Coalition
www.nhpci.org