directorate-general for internal · pdf filedirectorate-general for internal policies ......
TRANSCRIPT


DIRECTORATE-GENERAL FOR INTERNAL POLICIES
POLICY DEPARTMENT B: STRUCTURAL AND COHESION POLICIES
AGRICULTURE AND RURAL DEVELOPMENT
TRENDS IN EU-THIRD COUNTRIESTRADE OF MILK AND DAIRY PRODUCTS
STUDY

This document was requested by the Chair of the Committee on Agriculture and RuralDevelopment.
AUTHOR
Guillaume RagonnaudPolicy Department B: Structural and Cohesion PoliciesEuropean ParliamentB-1047 BrusselsE-mail: [email protected]
EDITORIAL ASSISTANCE
Catherine Morvan
LINGUISTIC VERSIONS
Original: EN
ABOUT THE PUBLISHER
To contact the Policy Department or to subscribe to its monthly newsletter please write to:[email protected]
Manuscript completed in September 2014.© European Union, 2014.
This document is available on the Internet at:http://www.europarl.europa.eu/studies
DISCLAIMER
The opinions expressed in this document are the sole responsibility of the author and donot necessarily represent the official position of the European Parliament.
Reproduction and translation for non-commercial purposes are authorized, provided thesource is acknowledged and the publisher is given prior notice and sent a copy.

DIRECTORATE-GENERAL FOR INTERNAL POLICIES
POLICY DEPARTMENT B: STRUCTURAL AND COHESION POLICIES
AGRICULTURE AND RURAL DEVELOPMENT
TRENDS IN EU-THIRD COUNTRIESTRADE OF MILK AND DAIRY PRODUCTS
STUDY
Abstract:
This document gives an overview of EU-third countries trade of milk andmilk products. After outlining EU dairy trade in 2013, it reports salient trendsin EU-third countries trade in milk and milk products. Finally, it elaborateson the outlook for 2012-2023 and on the expected increase in consumptionin emerging countries.
IP/B/AGRI/NT/2014-09 September 2014
PE 529.076 EN


Trends in EU-Third Countries trade of milk and dairy products____________________________________________________________________________________________
3
TABLE OF CONTENT
LIST OF FIGURES 5
1. INTRODUCTION: INCREASING DEMAND IN EMERGING COUNTRIESHAS DRIVEN DAIRY TRADE 7
2. A SNAPSHOT OF DAIRY MARKETS: 2013 WAS A RECORD YEAR FOREU EXPORTS 9
2.1. World markets 92.1.1. WMP 92.1.2. SMP 102.1.3. Butter 112.1.4. Cheese 11
2.2. European Union 122.2.1. EU Exports of dairy products to third countries in 2013 122.2.2. Imports of dairy products from third countries 132.2.3. Evolution of EU exports and imports of dairy products to
third countries 132.2.4. A major and growing trade surplus 15
3. TRENDS IN EU THIRD COUNTRIES TRADE OF MILK AND MILKPRODUCTS 17
3.1. Butter 173.1.1. SMP 173.1.2. WMP 183.1.3. Cheese 193.1.4. Wheypowder 20
4. OUTLOOK FOR 2014-2023: AN EXPANSION IN GLOBAL DAIRYTRADE IS FORECASTED 23
5. CONCLUSION: CONSUMPTION IN EMERGING COUNTRIES ISEXPECTED TO INCREASE IN THE FUTURE 25
REFERENCES 27
ANNEXES 29
ANNEX 1: The 20 world’s largest dairy companies in 2014 29ANNEX 2: Trend in China Whole Milk Powder import volumes
(2008-2014) 31ANNEX 3: FAO price index: milk products (2007-May 2014) 33

Policy Department B: Structural and Cohesion Policies____________________________________________________________________________________________
4

Trends in EU-Third Countries trade of milk and dairy products____________________________________________________________________________________________
5
LIST OF FIGURES
Figure 1Main importers and exporters of milk (2012-2014) 9
Figure 2World trade in WMP 10
Figure 3World trade in SMP 11
Figure 4World trade in butter 11
Figure 5EU exports of dairy products to third countries in 2013 12
Figure 6EU imports of dairy products from third countries in 2013 13
Figure 7EU Exports of milk and milk products (1988-2013) 14
Figure 8EU imports of milk and milk products from third countries (1988-2013) 14
Figure 9Evolution of EU trade surplus in trade in milk and milk products 15
Figure 10Imports of milk and milk products from China (2005-2014) 16
Figure 11Trends in EU third countries trade in butter (1000 tonnes) 17
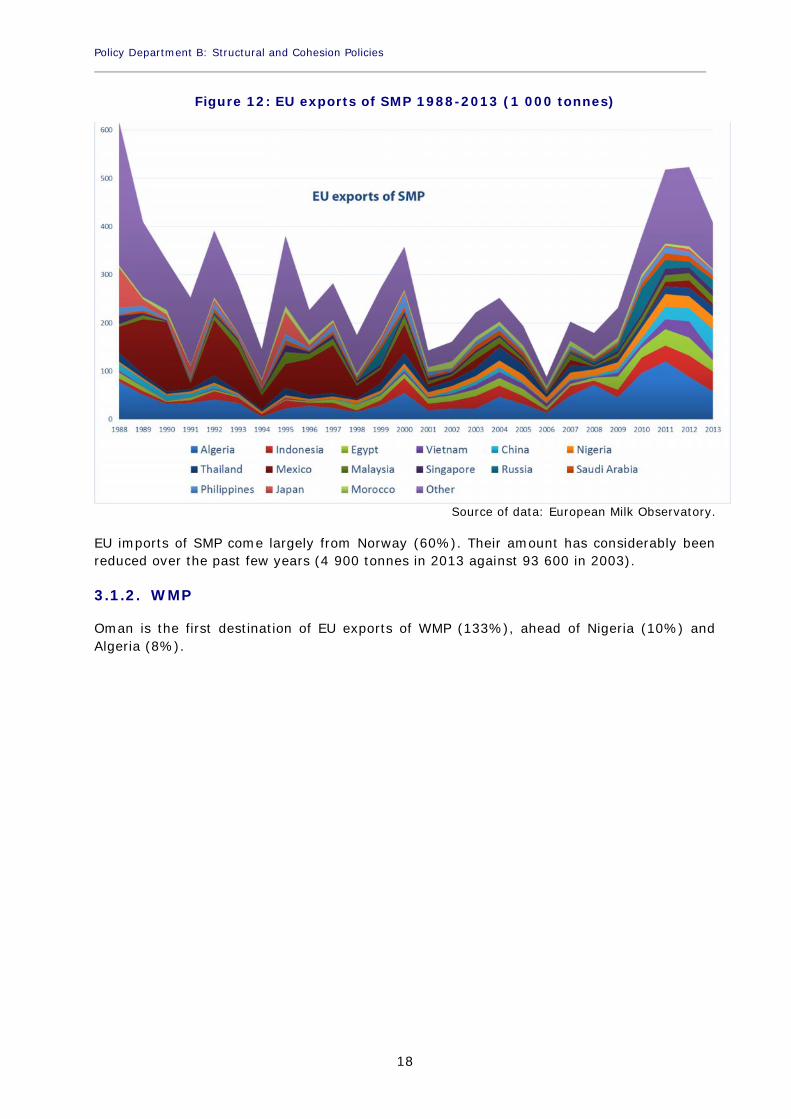
Figure 12EU exports of SMP 1988-2013 (1 000 tonnes) 18
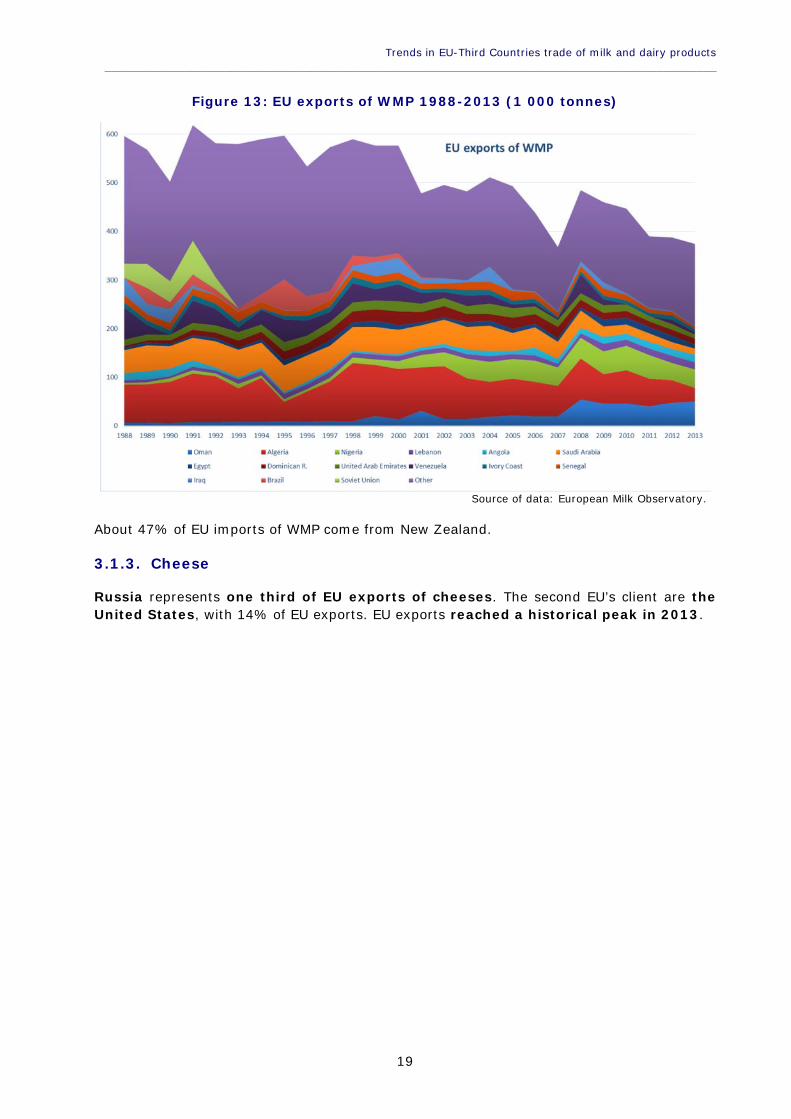
Figure 13EU exports of WMP 1988-2013 (1 000 tonnes) 19
Figure 14EU exports of cheeses 1988-2013 (1 000 tonnes) 20
Figure 15EU exports of wheypowder 1988-2013 (1 000 tonnes) 21
Figure 16Main dairy products exporters: 2013 and 2023 23
Figure 17Main dairy products importers: 2013 and 2023 24

Policy Department B: Structural and Cohesion Policies____________________________________________________________________________________________
6

Trends in EU-Third Countries trade of milk and dairy products____________________________________________________________________________________________
7
1. INTRODUCTION: INCREASING DEMAND IN EMERGINGCOUNTRIES HAS DRIVEN DAIRY TRADE
Over the past decades, consumption of milk products in the world has been rising,which means more potential market opportunities for EU dairy producers. This growthhas been due to the increasing demand in emerging countries, supported by risingincomes (considered as the strongest driver of increased demand for dairy products),changing diets (increasing food intake and changing composition of food consumption),population growth and urbanisation.
The EU is among the main players on the global dairy market. Next year, the EUsystem of dairy quotas, which has been in place for thirty years to control the level ofmilk production, is coming to an end. As EU markets for milk and dairy products arerelatively mature, the supplementary volumes of milk that will be produced after theend of quotas will probably have to be exported.
Due to the perishability of dairy products the bulk of dairy production is consumeddomestically without entering international trade. The main dairy commodities that aretraded on global markets are Whole Milk Powder (WMP), Skimmed Milk Powder (SMP),butter, cheese and wheypowder.
In recent years, considerable growth has occurred in fresh dairy trade (not onlyproducts like yogurts and cream but also liquid milk). One important trade flow is liquidmilk exported from the EU to China (100 000 tonnes in 2013 from 56 000 in 2012).Nevertheless, this remains small in relation to the trade in the other dairy productscovered and may only be a temporary phenomenon.
BOX 1: Importance of the EU dairy sector in the EU food and drink sector
The EU dairy sector is among the top five sub-sectors of the EU food and drinkindustry (in terms of added value). It represents 14% of the turnover of this industry,9% of its added value, 8% of its employees and 4% of its companies. It is alsoconsidered as the most innovative food sector in the EU. According to the EuropeanDairy Association, there are around 12 000 dairy processing and production sites inthe EU, employing directly 300 000 people. These sites are partnering with one milliondairy farms. More than 300 cheeses and dairy products are protected by the EUquality labels (Geographical Indications). In 2014, three EU companies were in the top5 of the world’s largest dairy companies.

Policy Department B: Structural and Cohesion Policies____________________________________________________________________________________________
8

Trends in EU-Third Countries trade of milk and dairy products____________________________________________________________________________________________
9
2. A SNAPSHOT OF DAIRY MARKETS: 2013 WAS ARECORD YEAR FOR EU EXPORTS
2.1. World markets
In 2014, world trade in dairy products is projected to rise by +1.8% in 2014, aslower rate than in recent years, reaching 69 million tonnes of milk equivalent, thanksto good climatic conditions, lower feed costs and good prices on global dairy markets.
New Zealand and the EU are the two main exporters and account for 50% of worldtrade. They are both anticipated to record an increase in sales. The United Statesare ranked third, with 15% of exports. Exports from Australia are expected to fall due toreduced milk production.
Figure 1: Main importers and exporters of milk (2012-2014)
Source: FAO.
Asia is anticipated to remain the main centre for rising international demand in 2014.Increased purchases are forecast for China, Islamic Republic of Iran, Indonesia andthe Philippines. The (high) level of imports from Saudi Arabia, the United ArabEmirates, Japan, Singapore, Malaysia and Thailand will remain constant or slightlydecrease.
Lower international prices may stimulate import demand in Africa. The principalimporters that could see an increase are Algeria, South Africa and Ghana.
Imports by Russia were also anticipated to increase (strong demand for butter and SMP).
2.1.1. WMP
World exports of WMP are projected to rise by 2.5% in 2014 to 2.5 million tonnes. Thiscompares with limited growth of 1.1% in 2013, when a milk production shortfall constrainedtrade. China is expected to retain its position as the principal importer of WMP and witnessa further expansion in purchases, with its imports of WMP for 2014 provisionally estimatedup by 7.8 %, to 796 000 tonnes – or one-third of total trade. Elsewhere in Asia, lowerprices may stimulate demand in several major markets, including the United Arab Emirates,Singapore, Oman, Sri Lanka, Indonesia and the Philippines. Importers in North Africa andLatin America and the Caribbean, including Algeria and Nigeria, may return more fully to themarket. In Brazil, rising domestic production is expected to displace imports.

Policy Department B: Structural and Cohesion Policies____________________________________________________________________________________________
10
Figure 2: World trade in WMP
Source: FAO.
Only New Zealand, among the principal exporters with 45% of trade, is expected toincrease the level of its sales – by 6% to 1.4 million tonnes. Other members of thisgroup, which comprises the EU, Argentina and Australia, are expected to reduce saleseither because manufacturers find it more profitable to concentrate on otherproducts, as in the case of the EU, or due to reduced milk production, for Argentinaand Australia. Some of the smaller-scale exporting countries, such as Uruguay, Belarusand Costa Rica, may increase sales.
2.1.2. SMP
Trade in SMP is predicted to grow by 5.0% to 2 million tonnes, a rate of increase similarto the previous two years. The principal markets for SMP are (in order of volume) China,Mexico, Indonesia, Russia, Algeria, the Philippines and Malaysia, followed byVietnam, Saudi Arabia, Egypt, Thailand and Singapore. While China is anticipated toremain the main market, a rise in purchases is also anticipated for some other majorimporters, including (in order of volume) Mexico, Indonesia, Russia and Algeria.
Over 70% of world SMP exports are supplied by the United States, EU and NewZealand. In 2014, each is predicted to increase sales, with the EU recording the strongestgrowth, as high butter prices in domestic markets make it more profitable to produceSMP/butter than WMP. This tendency is reflected in the EU export data, which up toFebruary 2014 showed a 50% increase over the same period last year. In 2013, Indiaentered the world market for SMP in a significant way, and its sales leapt 250%, to 130000 tonnes, placing it fifth by volume among exporters. Trade data for the first two monthsshow that strong growth has continued into 2014. India’s SMP exports for 2014 areprojected to expand by 6% to 137 000 tonnes. Last year, India’s principal markets wereBangladesh, Egypt, Algeria and Saudi Arabia, with many other countries making purchases,indicating that India’s exporters are exploring wide-ranging markets throughoutNorth Africa, the Middle East and Southeast Asia. Elsewhere, exports by fourth-placeAustralia are forecast to be unchanged in the face of limited milk supplies.

Trends in EU-Third Countries trade of milk and dairy products____________________________________________________________________________________________
11
Figure 3: World trade in SMP
Source: FAO.
2.1.3. Butter
Trade in butter is forecast to increase by 0.9% to 919 000 tonnes, a rate similar to lastyear. Demand for butter comes mainly from Southeast Asia, the Middle East and theRussian Federation, although, as with many other milk products, China hassubstantially increased purchases in recent years. Additionally, as a result of tradingagreements and duty-free access for inward processing (where products are importedduty free for additional processing and export), the EU is both an important butterimporter (ranking fourth) and exporter (ranking second). Overall, many of theprincipal markets, in particular the Russian Federation, China, Saudi Arabia, the EU and theIslamic Republic of Iran, are expected to increase imports in 2014.
Four of the five main exporters – New Zealand, the EU, Belarus and Australia – areanticipated to see a moderate increase in sales in 2014, while those of the United Statescould decline. In the case of New Zealand, trends in WMP prices will influence availabilityduring the second part of the year, as processors seek to maximise returns from thenew season’s milk production. Price trends will also determine the extent of UnitedStates’ participation in the international marketplace, as it has the possibility of eitherexporting or supplying its domestic market, which absorbs over 90% of production. Thesame factors would also apply in the case of the EU, where internal prices haveremained substantially above international ones, limiting trade potential.
Figure 4: World trade in butter
Source: FAO.
2.1.4. Cheese
Trade in cheese is forecast to register limited growth, increasing by 0.6% to 2.5 milliontonnes. Four countries, the Russian Federation, Japan, the United States and Saudi

Policy Department B: Structural and Cohesion Policies____________________________________________________________________________________________
12
Arabia, account for just over 40% of demand. The EU remains the major cheeseexporter, supplying 33% of world trade, not including the substantial amount of cheesethat is traded among the EU countries themselves. Other important exporters are theUnited States, New Zealand, Australia, Saudi Arabia, Belarus, Egypt, Switzerland,Argentina, Turkey and Uruguay. Most of this group of countries are expected to maintaintrade levels slightly above those of 2013. One exception could be the United States, wherelimited competition from other countries is expected to stimulate further growth in exports.
2.2. European Union
2.2.1. EU Exports of dairy products to third countries in 2013
In 2013, cheeses were by far the main dairy product exported by the EU to thirdcountries, both in value (around 40% of total value of dairy exports) and in quantity(around one quarter). Cheeses, WMP and SMP are the three main traded products, asthey represented together more than two third of the value of EU exports of dairyproducts to third countries (68%). In terms of volume, these three products represent ‘only’half of the total volume of dairy products exported (49%).
Figure 5: EU exports of dairy products to third countries in 2013
RANK(VALUE)
DAIRYPRODUCTS
VALUE(EUR
MILLION)
SHARE INTOTAL
VALUE (%)
QUANTITY(1000
TONNES)
SHARE INTOTAL
QUANTITY(%)
1 CHEESES 3773 39,3% 785 24,4%
2 WHOLE MILKPOWDER 1447 15,1% 374 11,6%
3 SKIM MILKPOWDER 1267 13,2% 408 12,7%
4 WHEYPOWDER 869 9,1% 514 16,0%
5 FRESH 543 5,7% 551 17,1%
6 CASEINES 466 4,9% 62 1,9%
7 BUTTER 442 4,6% 102 3,2%
8 CONDENSED 428 4,5% 251 7,8%
9 LACTOSE 257 2,7% 152 4,7%
10 BUTTEROIL 99 1,0% 21 0,7%
Total 9591 100,0% 3220 100,0%Source: Based on data from European Milk Observatory.

Trends in EU-Third Countries trade of milk and dairy products____________________________________________________________________________________________
13
In 2013, milk and milk products exports (EUR 9.6 billion) accounted for 8% of total EUagricultural exports (EUR 120.1 billion). For example, this is more than exports ofwheat (EUR 5.7 billion) and exports of wine and vermouth (EUR 9.1 billion).
In the first five months of 2014, EU exports were higher than last year's level formost of the dairy products, with the only exception of cheese, which decreased by 2%.
Butter, butter oil and milk powders have been the most dynamic products so far in2014, especially SMP. EU butter exports to Russia increased by 37% in the first 5 monthsof 2014, while cheese exports decreased by 11%. Algeria has been the main market for EUexports of milk powders. China and Indonesia are also very dynamic importers of EUSMP.
2.2.2. Imports of dairy products from third countries
Cheeses alone represented in 2013 more than half of the imported products in value, andslightly less than half in volume. Caseines are the second most imported products in value.
Figure 6: EU imports of dairy products from third countries in 2013
RANK(VALUE)
DAIRYPRODUCTS
VALUE(EUR
MILLION)
SHARE INTOTAL
VALUE (%)
QUANTITY(1000
TONNES)
SHARE INTOTAL
QUANTITY(%)
1 CHEESES 436 57,4% 75 45,2%
2 CASEINES 138 18,2% 19 11,4%
3 BUTTER 63 8,3% 24 14,5%
4 BUTTEROIL 51 6,7% 17 10,2%
5 LACTOSE 17 2,2% 8 4,8%
6 SKIM MILKPOWDER 15 2,0% 5 3,0%
7 WHEYPOWDER 15 2,0% 8 4,8%
8 FRESH 13 1,7% 6 3,6%
9 WHOLE MILKPOWDER 9 1,2% 3 1,8%
10 CONDENSED 3 0,4% 1 0,6%
Total 760 100,0% 166 100,0%Source: Based on data from European Milk Observatory.
2.2.3. Evolution of EU exports and imports of dairy products to thirdcountries
REMARK: all the graphs in this section have been produced based on the following source,which can be consulted for more detail: Historical Series - EU Exports and Imports of DairyProducts to Third countriesThe latest monthly data for 2014 are available at: EU Dairy Exports to Third countries: 2014
EU exports of milk and milk products has been following an ascending trend since 1988.Since 2009, they have even surged. They reached a historical peak in 2013, with 9.6billion EUR.

Policy Department B: Structural and Cohesion Policies____________________________________________________________________________________________
14
Figure 7: EU Exports of milk and milk products (1988-2013)
Source: Based on data from European Milk Observatory.
EU imports of milk and dairy products are insignificant compared to exports, whichleads to a considerable trade surplus.
Figure 8: EU imports of milk and milk products from third countries (1988-2013)
Source: Based on data from European Milk Observatory.

Trends in EU-Third Countries trade of milk and dairy products____________________________________________________________________________________________
15
2.2.4. A major and growing trade surplus
The EU ha in 2013 a large trade surplus in its trade in dairy products with third countries(EUR +8.8 billion).
Since 1988, the EU has always had a trade surplus regarding trade of dairy products.Since 2009, the EU trade surplus has increased very quickly (+87%), reaching EUR8.8 billion in 2013. Why? The surplus was boosted by the strong increase in EU exports.
Figure 9: Evolution of EU trade surplus in trade in milk and milk products
Source: Calculations based on data from European Milk Observatory.
BOX 2: A focus on China
Since 2000, the Chinese government has implemented policies to promote dairy production.Traditionally, milk and milk products were not commonly consumed in China. However,government guidelines on milk consumption, economic growth and urbanisation(consumption is higher in urban areas than in rural areas) have led to the gradualincorporation of milk into the Chinese diet and to the development of the local milk sector.The rapid growth of the sector has exceeded the ability of value chains to maintain thesafety of the products, as illustrated by the melanine contamination scandal in 2008, whichexperts have linked to the quick and unregulated development of the sector. China haspreferred foreign dairy products for babies, since this food crisis. China’s domesticproduction decreased by -6% in 2013. If the country cannot satisfy its demand domesticallyit will have to go on importing vast amounts of milk and milk products on the global market.

Policy Department B: Structural and Cohesion Policies____________________________________________________________________________________________
16
Figure 10: Imports of milk and milk products from China (2005-2014)
Source: FAO.

Trends in EU-Third Countries trade of milk and dairy products____________________________________________________________________________________________
17
3. TRENDS IN EU THIRD COUNTRIES TRADE OF MILKAND MILK PRODUCTS
3.1. Butter
EU exports of butter rely largely on Russia, as the country represents by far (30%)the biggest market for EU exports of butter. Singapore (8%) is the second biggestmarket for the EU, followed by Turkey (5%).
In recent years, EU exports in butter have decreased, and have been stable over the pasttwo years.
Figure 11: Trends in EU third countries trade in butter (1000 tonnes)
Source of data: European Milk Observatory.
Regarding EU imports of butter, New Zealand has historically represented the main originof imports. In 2013, this country represented nearly 90% of EU imports of butter.
3.1.1. SMP
For Algeria has represented the biggest EU client as regards exports of SMP (14%), aheadof Chine (12%) and Indonesia (10%).
Policy Department B: Structural and Cohesion Policies____________________________________________________________________________________________
18
Figure 12: EU exports of SMP 1988-2013 (1 000 tonnes)
Source of data: European Milk Observatory.
EU imports of SMP come largely from Norway (60%). Their amount has considerably beenreduced over the past few years (4 900 tonnes in 2013 against 93 600 in 2003).
3.1.2. WMP
Oman is the first destination of EU exports of WMP (133%), ahead of Nigeria (10%) andAlgeria (8%).
Trends in EU-Third Countries trade of milk and dairy products____________________________________________________________________________________________
19
Figure 13: EU exports of WMP 1988-2013 (1 000 tonnes)
Source of data: European Milk Observatory.
About 47% of EU imports of WMP come from New Zealand.
3.1.3. Cheese
Russia represents one third of EU exports of cheeses. The second EU’s client are theUnited States, with 14% of EU exports. EU exports reached a historical peak in 2013.

Policy Department B: Structural and Cohesion Policies____________________________________________________________________________________________
20
Figure 14: EU exports of cheeses 1988-2013 (1 000 tonnes)
Source of data: European Milk Observatory.
69% of EU imports of cheeses come from Switzerland.
3.1.4. Wheypowder
EU exports of wheypowder have followed a clear increasing trend over the past fewyears. EU’s main client is China, with 33% of EU exports, followed by Indonesia (12%). EUexports reached a historical peak in 2013. Whey based ingredients are crucial for theglobal food industry

Trends in EU-Third Countries trade of milk and dairy products____________________________________________________________________________________________
21
Figure 15: EU exports of wheypowder 1988-2013 (1 000 tonnes)
Source of data: European Milk Observatory.
EU imports of whey powder have remained at low levels (8 200 tonnes in 2013).

Policy Department B: Structural and Cohesion Policies____________________________________________________________________________________________
22
Trends in EU-Third Countries trade of milk and dairy products____________________________________________________________________________________________
23
4. OUTLOOK FOR 2014-2023: AN EXPANSION INGLOBAL DAIRY TRADE IS FORECASTED
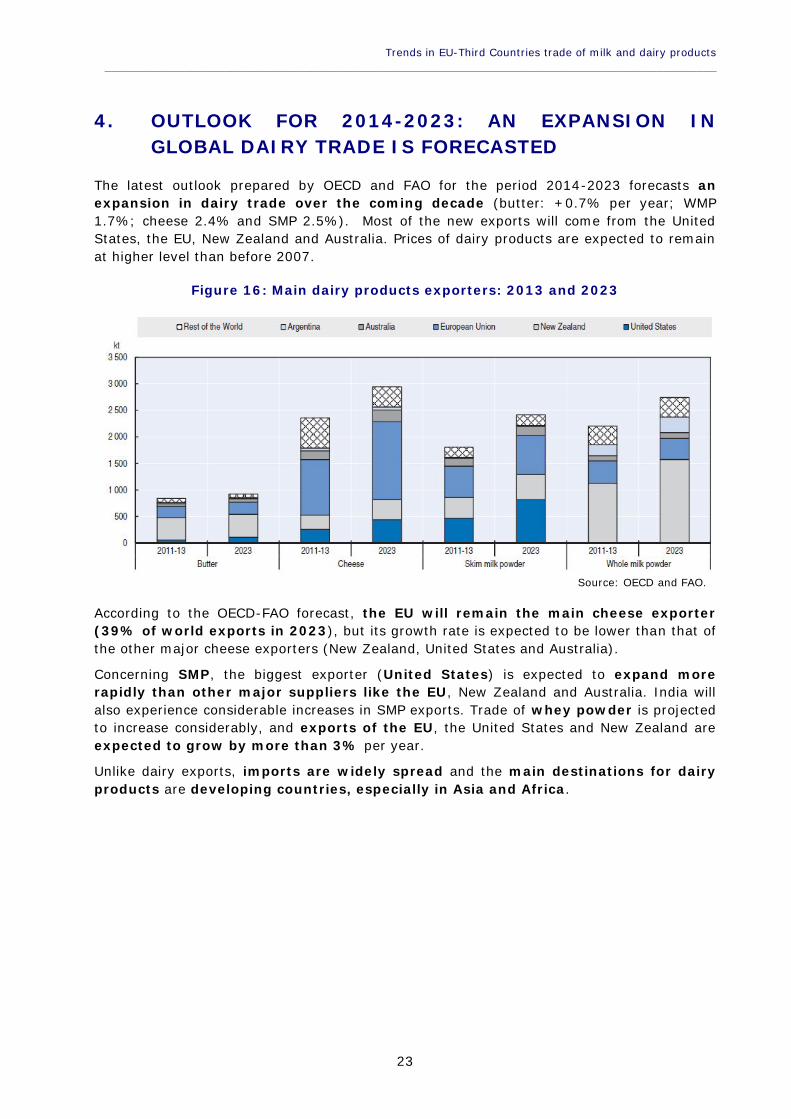
The latest outlook prepared by OECD and FAO for the period 2014-2023 forecasts anexpansion in dairy trade over the coming decade (butter: +0.7% per year; WMP1.7%; cheese 2.4% and SMP 2.5%). Most of the new exports will come from the UnitedStates, the EU, New Zealand and Australia. Prices of dairy products are expected to remainat higher level than before 2007.
Figure 16: Main dairy products exporters: 2013 and 2023
Source: OECD and FAO.
According to the OECD-FAO forecast, the EU will remain the main cheese exporter(39% of world exports in 2023), but its growth rate is expected to be lower than that ofthe other major cheese exporters (New Zealand, United States and Australia).
Concerning SMP, the biggest exporter (United States) is expected to expand morerapidly than other major suppliers like the EU, New Zealand and Australia. India willalso experience considerable increases in SMP exports. Trade of whey powder is projectedto increase considerably, and exports of the EU, the United States and New Zealand areexpected to grow by more than 3% per year.
Unlike dairy exports, imports are widely spread and the main destinations for dairyproducts are developing countries, especially in Asia and Africa.

Policy Department B: Structural and Cohesion Policies____________________________________________________________________________________________
24
Figure 17: Main dairy products importers: 2013 and 2023
Source: OECD and FAO.

Trends in EU-Third Countries trade of milk and dairy products____________________________________________________________________________________________
25
5. CONCLUSION: CONSUMPTION IN EMERGINGCOUNTRIES IS EXPECTED TO INCREASE IN THEFUTURE
Recent data published in August 2014 show that milk prices in the EU and United Statesremain at relatively high levels, feed costs are low and weather patterns havebeen benign, supporting production growth.
Per capita consumption of dairy products in developing countries is expected tocontinue increasing (+1.9% per year), leading to increased trade. The main factors thatmay affect the future of the global dairy markets, and hence trade, are:
The development of Chinese production of milk and dairy products, as China’sdemand in crucial for the future price development on world dairy markets. It isexpected that the Chinese milk production will start to grow again.
The end of the EU quota system in 2015: will the transition be smooth (as actualmilk output remained below EU quota levels for most EU member states) or willthere be a strong supply reaction?
The new Margin Protection Program (MPP) in the US Farm Act (makingpayments to dairy producers when the difference between milk prices and feed costsfalls below a minimum level) could increase United States’ production and exports.
Weather events, in the context of climate change (New-Zealand, the biggestsuppliers of exports has a pasture-based model and therefore is strongly weatherdependent).
Trade policy developments such as Free Trade Agreements.
Economic growth in developing countries.
Animal diseases.

Policy Department B: Structural and Cohesion Policies____________________________________________________________________________________________
26
Trends in EU-Third Countries trade of milk and dairy products____________________________________________________________________________________________
27
REFERENCES
Analysis on the future developments in the dairy sectorArla consolidated annual report 2013Commodity Market Development in Europe – OutlookConference "The EU dairy sector: developing beyond 2015Copa-Cogeca presents keys actions needed in the EU dairy sector and overview of marketsituationData trends of the European Food and Dring Industry 2013-2014Development of the dairy market situation and the operation of the "Milk Package"provisionsEC announces new initiatives to strengthen EU dairy market beyond 2015,Economic Analysis of EU Dairy Sector Development beyond 2015: Trade, Exports and WorldMarket IntegrationEU Dairy Exports to Third countries: 2014EU dairy sector investments continue to target export markets, Agritrade-CTA, 2014EU perspectives in the world dairy marketEuropean Dairy Association Economic Report 2014European dairy policy in the years to come; Quota abolition and competitivenessEuropean Milk Market ObservatoryEuropean Union Dairy SectorEvaluation of CAP Measures Applied to the Dairy SectorExport competitiveness of dairy products on global markets: The case of the EuropeanUnion countries,Extra-EU agricultural trade 2013FAO: Dairy Production and ProductsFarmers dip their toes in global dairy markets, The Times, January 2014Global Dairy Sector: Status and TrendsGlobal Dairy Update August 2014, Fonterra.Historical Series - EU EXPORT of Dairy Products to Third countriesMilk and dairy production statistics - Portrait of the EU milk production sectorMilk and dairy products in human nutritionMilk and Milk ProductsMilk and milk productsMilk availability: trends in production and demand and medium-term outlook, FAO, 2012.Milk Market Situation Fact SheetMilk Market Situation, July 2014Milk supplier Fonterra moves to broaden China footprint, Financial Times, 27/08/14.OECD-FAO Agricultural Outlook 2014 - DairyProspects for Agricultural Markets and Income in the EU 2012-2022Rabobank Global Dairy Top-20: challenging conditions pave the way for acquisitions and tie-upsRencontres sur les chemins du lait, Lactalis.The expanding EU dairy herd and the growing importance of overseas markets, including inAfrica, Agritrade-CTA, 2014World importance and present tendencies of dairy sector

Policy Department B: Structural and Cohesion Policies____________________________________________________________________________________________
28

Trends in EU-Third Countries trade of milk and dairy products____________________________________________________________________________________________
29
ANNEXES
ANNEX 1: The 20 world’s largest dairy companies in 2014
Source: Rabobank. * = estimates. Note: Turnover data are dairy sales only, based on 2013 financials andMerger and Acquisitions transactions completed between 1 January and 15 June 2014; the pending merger ofArla Foods and Walhorn is not included.

Policy Department B: Structural and Cohesion Policies____________________________________________________________________________________________
30

Trends in EU-Third Countries trade of milk and dairy products____________________________________________________________________________________________
31
ANNEX 2: Trend in China Whole Milk Powder importvolumes (2008-2014)
Source: Fonterra, 2014.

Policy Department B: Structural and Cohesion Policies____________________________________________________________________________________________
32

Trends in EU-Third Countries trade of milk and dairy products____________________________________________________________________________________________
33
ANNEX 3: FAO price index: milk products (2007-May2014)
Source: FAO.

Policy Department B: Structural and Cohesion Policies____________________________________________________________________________________________
34
