disaster risk management in post-2015 development goals
TRANSCRIPT

April 2013
Edited by Tom Mitchell, Lindsey Jones, Emma Lovell and Eva Comba
DisAsTEr risk MAnAgEMEnT in PosT-2015 DEvELoPMEnT goALs PoTEnTiAL TArgETs AnD inDiCATors

978-1-909464-31-5
© Overseas Development Institute 2013
Readers are encouraged to quote or reproduce material from ODI Working Papers for their own publications, as long as they are not being sold commercially. For online use, we ask readers to link to the original resource on the ODI website. As copyright holder, ODI requests due acknowledgement and a copy of the publication.
Overseas Development Institute
203 Blackfriars Road | London SE1 8NJ | UK
Tel: +44 (0)20 7922 0300 Fax: +44 (0)20 7922 0399
www.odi.org.uk
The views presented in this paper are those of the author(s) and do not necessarily represent the views of ODI or our partners.

Suggested citation: Mitchell, T., Jones, L., Lovell, E., Comba, E. (2013) (eds) Disaster risk management in post-2015 development goals: potential targets and indicators. London: Overseas Development Institute
DisAsTEr risk MAnAgEMEnT in PosT-2015 DEvELoPMEnT goALs PoTEnTiAL TArgETs AnD inDiCATors

AcknowledgementsWe would like to thank the contributing chapter authors.
We would also like to thank the following reviewers for their support and comments:
Sevara Atamuratova, Irasema Alcántara Ayala, Gina Bergh, Angie Bone, Salvano Briceno, Nick Burnett, John Cooper, Madeline Duffy, Kristie L. Ebi, Stephan Hallegate, Nick Harvey, Kelly Hawrylyshyn, Qudsia Huda, Aasha Kapur Mehta, Aileen Kitching, Sari Kovats, Pedro Martins, Tony McMichael, Reinhard Mechler, Robert Muir-Wood, Virginia Murray, Pascal Peduzzi, Mark Pelling, Marla Petal, Roger Pielke Jr, Sylvain Ponserre, Victoria Presland, Laura Rodriguez, Emma Samman and Andrew Shepherd.
We would also like to thank Roo Griffiths for copyediting the report and Patrick Ward and Steven Dickie for their help with design and layout.
Disaster risk ManageMent in Post-2015 DeveloPMent goals | Potential targets and indicatorsii

Contents Executive summary viii Tom Mitchell, Lindsey Jones, Emma Lovell and Eva Comba (Overseas Development Institute)
1 Introduction 1 Tom Mitchell, Emma Lovell, Eva Comba and Lindsey Jones (Overseas Development Institute)
2 Disasters and their economic impacts 7 Disaster Resilience and Post-2015 Development Goals: The Options for Economics Targets and Indicators Nicola Ranger and Swenja Surminski (Grantham Research Institute on Climate Change and the Environment, London School of Economics and Political Science)
3 Disaster Deaths 25 Proposed indicators for monitoring disaster-related mortality Debarati Guha-Sapir and Philippe Hoyois (Centre for Research on the Epidemiology of Disasters)
4 Disasters and their impact on poverty 33 Assessment of options for disaster-related poverty targets Daniel Clarke and Robert Reid (World Bank)
5 Health in a Disasters goal 41 The health imperative for disaster risk management: a discussion of key issues in the context of the global consultations on disaster risk reduction in the post-2015 development agenda World Health Organization
6 Disaster Resilience in a poverty reduction goal 57 Resilience in the context of poverty reduction post-2015: the new geography of poverty and risk Andy Sumner (King’s College London)
7 DRR in an education goal 71 Realising the interplay of education and disaster risk reduction in development goals: a review of integrated indicators and options for post-2015 Lisa Zook Sorensen, Richard Rumsey, Fe Garcia (World Vision)
8 Synthesis 86 Lindsey Jones, Tom Mitchell, Emma Lovell and Eva Comba (Overseas Development Institute)
Annex 96 References 113
iii

iv Disaster risk ManageMent in Post-2015 DeveloPMent goals | Potential targets and indicators

Tables and Figures
Tables1 Key tests for assessing the most suitable goals, targets and indicators 42 Typology of economic indicators of resilience, populated with examples from Annex A 153 Analysis of how proposed targets perform against a set of criteria* 194 Indicators of disaster resilience 225 Proposed mortality indicators 316 Summary of studies reporting on chronic and transitory poverty 377 Advantages and limitations of proposed targets and indicators 398 Review of possible indicators from the literature 549 What are vulnerability and resilience? 6110 Shocks by income quintile in Mexico, 2002-2005 (%of households) 6211 Estimates of the distribution of global poverty, and poverty incidence, 2008 6412 Estimates of poverty, $10/day per capita, 2010 and 2030 6613 Most vulnerable developing countries to sea level rises and vulnerable populations, 2008 vs. 2050. 6714 Poverty - areas and determinants 6815 Indicators of 'material or physical aspects of poverty' (standards of living and risk) 6916 Indicators of 'social or relational aspects of poverty' (societal relations and risk management) 7017 Indicators of 'subjective and perceptional aspects of poverty' (personal perceptions and risks) 7018 A review of the current literature 7919 Possible education/DRR targets 8120 Review of possible indicators from the literature 8221 Recommended education/DRR goals, targets and Indicators 8422 A review of economic indicators of disaster risk and resiliencem 9623 Proposed economic targets 9924 Proposed indicators by scale 10025 Existingseverityclassificationtools 10126 Proposed Health Indicators 10227 Current education-related DRM indicators 10728 Child Centred DRR Outcomes: Knowledge and Education: Plan International 111
Figures1 Schematic diagram illustrating the impact of a disaster on a developed economy and a developing economy 102 Relative Economic Impacts 123 Economic losses grouped by World Bank income class, 1989-2010 124 Framework for conceptualising economic factors adopted in this chapter 135 Typology of resilience indicators 146 Global(direct)economiclossesfromnaturaldisasters(correctedforinflation) 217 Trends in climato-hydro-meteorological and geophysical disasters, 1985-2011 288 Trends in killed and affected per million populations, 1985-2011 299 Daily income by probability of failing into poverty, Chile, Mexico and Peru 6510 Proposed goal appropriate education and skills for full participation in society 106
v

Acronyms
ACFID Australian Council for International Development ADEA Association for the Development of Education in AfricaCAPRA Central American Probabilistic Risk Assessment CCA Climate Change AdaptationCCC Core Commitments to Children CIGI Centre for International Governance Innovation CRED Centre for Research on the Epidemiology of DisastersCPRC Chronic Poverty Research CentreCYP Children and Young PeopleDDI DisasterDeficitIndexDFID Department for International DevelopmentDRM Disaster Risk Management DRR Disaster Risk Reduction ER Economic ResilienceEFA Education for All EM-DAT Emergency Events DatabaseERI Economic Resilience IndexESD Education for Sustainable Development EWS Early Warning SystemGAM Global Acute MalnutritionGDP Gross Domestic ProductGIZ Deutsche Gesellschaft für Internationale ZusammenarbeitGNI Gross National Income GRIP GlobalRiskIdentification ProgrammeGTZ Deutsche Gesellschaft für Technische ZusammenarbeitHFA Hyogo Framework for Action HIC High-Income CountryHVCA Hazard, Vulnerability and Capacity Assessments
IADB Inter-American Development Bank ICT Information and Communication Technology IFRC International Federation of Red Cross and Red Crescent SocietiesIHR International Health Regulations (2005)IMF International Monetary FundINEE Inter-Agency Network for Education in EmergenciesIPCC Intergovernmental Panel on Climate ChangeIRDR Integrated Research on Disaster Risk LDC Least Developed CountryLDI Local Disaster IndexLIC Low-Income CountryLMIC Lower-Middle-Income Country LMTF Learning Metrics Task ForceMCE Maximum Considered EventMDG Millennium Development GoalMIC Middle-Income CountryM&E Monitoring and EvaluationNCD Non-Communicable DiseaseNGO Non-Governmental OrganisationODA OfficialDevelopmentAssistanceODI Overseas Development InstituteOECD Organisation for Economic Co-operation and Development OPHI Oxford Poverty and Human Development InitiativePVI Prevalent Vulnerability IndexPHC Primary Health CarePISA Programme for International Student AssessmentPPP Purchasing Power ParityRMI Risk Management IndexRRI Risk Reduction IndexSDG Sustainable Development GoalUK United Kingdom
vi Disaster risk ManageMent in Post-2015 DeveloPMent goals | Potential targets and indicatorsvi

UMIC Upper-Middle-Income CountryUN United NationsUNCTAD United Nations Conference on Trade and DevelopmentUNDP UN Development ProgrammeUNESCO UNEducational,ScientificandCultural OrganizationUNFCCC UN Framework Convention on Climate ChangeUNICEF United Nations Children›s FundUNISDR UN International Strategy for Disaster Risk Reduction WEO World Economic OutlookWFP World Food ProgrammeWHO World Health Organization
vii

Disasters can hamper economic growth, affect poverty levels and cause human suffering.Withoutsignificantaction,theextentandimpactofeconomicandsocialdamage associated with disasters will get worse over the next 20 years, largely as a result of growing exposure of people and assets. This has the potential to reverse development progress in hard-hit areas. Including measures to promote disaster risk management (DRM) in the post-2015 development goals is needed to incentivise investment in advance of shocks to protect lives and livelihoods – but also save money. The report examines options for including DRM in the post-2015 development framework. Its eight chapters, each authored by leading international experts, combine to explore three scenarios for how it could be included:
1. A standalone goal on disasters, supported by targets. The report assesses targets on reducing mortality, reducing economic losses, preventing impoverishment and protecting and improving health systems;
2. A target on disasters within a goal on ‘resilience’, ‘security’ or ‘tackling obstacles to development’; drawing on the detailed assessments of the targets mentioned above.
3. Integration of DRM into other goals. The report particularly highlights how DRM could be included in poverty reduction and education goals.
Ultimately, which scenario or combination of scenarios unfolds depends on the purpose and form of the overall framework. Will there be just a few goals or many? Will they apply equally to all countries? Will countries be able to set their own targets and choose their own indicators? Will the goals be focused more on poverty reduction, environmental sustainability or both?
Executive summaryTom Mitchell, Lindsey Jones, Emma Lovell and Eva Comba Overseas Development Institute
viii Disaster risk ManageMent in Post-2015 DeveloPMent goals | Potential targets and indicators

The reports of the UN’s Thematic Consultation process, the Secretary-General’s High-Level Panel on the Post-2015 Development Agenda and the Open Working Group on Sustainable Development Goals will help determine the answers to these questions over the coming months. Hence, the options presented in this report and the detailed targetsandindicatorsdiscussedineachofthechaptersremainflexibleandpreliminaryat this stage and the scenarios detailed are not mutually exclusive.
Considering goals, targets and indicators for DRMThe report probes the most suitable targets and indicators in each of the scenarios detailed based on a set of criteria developed by an expert group. These criteria are set out below:
Options for goals Options for targets Options for Indicators
● Is it understood the same way by all stakeholders?
● Can it be communicated clearly?
● Is it politically acceptable for key constituencies?
● Does it motivate the right actions?
● Is it a priority for poor people?
● Would concerted action on the target actually make a positive difference?
● Is there a good basis on which to calibrate the target (ambitious but achievable)?
● Is the target meaningful at all scales?
● Does it reinforce human rights?
● Is it simple and easy to understand?
● Can progress be measured every year?
● Do reliable, comparable, disaggregated data already exist or can they be developed?
● Is measurement likely to be relatively transparent/ corruption free?
● Is there capacity to measure progress everywhere or can it be developed easily?
● Does the indicator link to the target?
What is quickly apparent is that few targets and indicators can satisfy all criteria. Significanttrade-offsemerge–oftenbetweenincentivisingtherightkindofdisaster-relevant activities, ensuring measurability and being attractive to policymaking audiences. The implications of this are that selected targets may in some cases be suboptimal in promoting effective DRM. Not only that, but if poorly selected, or skewed too heavily towards one of criteria listed above, some may serve to encourage weak practices or perverse incentives (and in the worst cases could lead to increased vulnerability). Consequently, proceeding with care is paramount, but there are viable options as detailed below.
ix
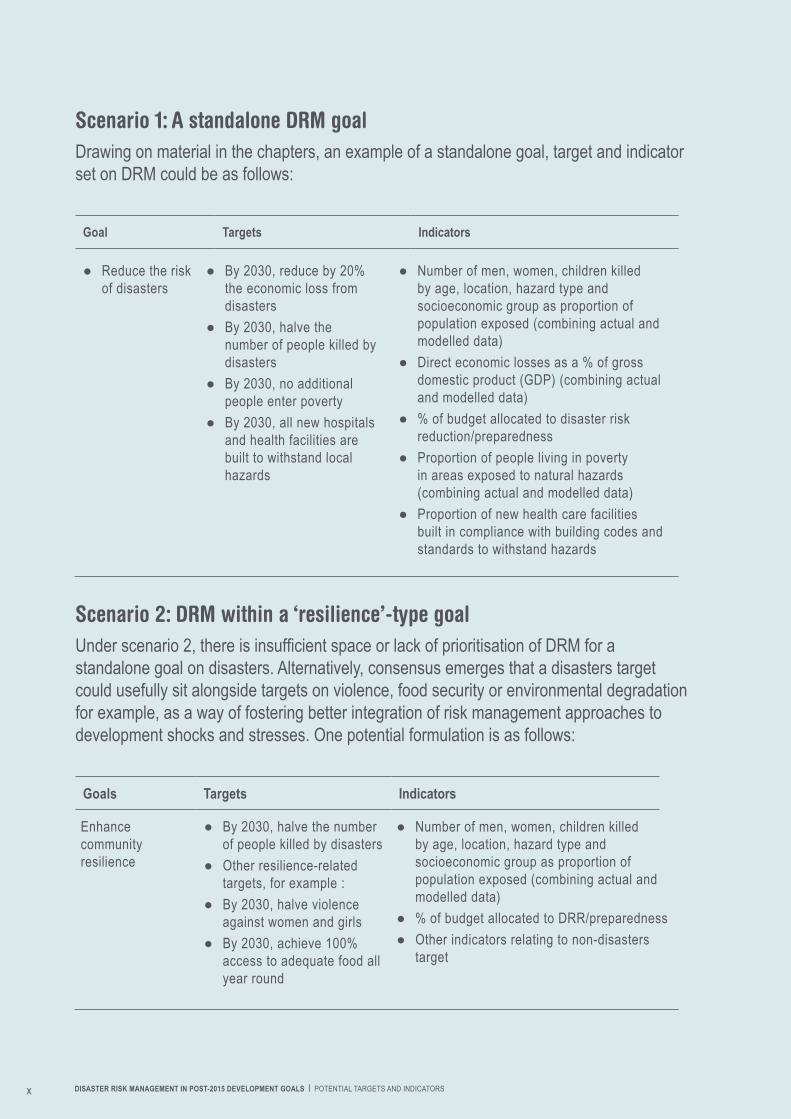
Scenario 1: A standalone DRM goalDrawing on material in the chapters, an example of a standalone goal, target and indicator set on DRM could be as follows:
Goal Targets Indicators
● Reduce the risk of disasters
● By 2030, reduce by 20% the economic loss from disasters
● By 2030, halve the number of people killed by disasters
● By 2030, no additional people enter poverty
● By 2030, all new hospitals and health facilities are built to withstand local hazards
● Number of men, women, children killed by age, location, hazard type and socioeconomic group as proportion of population exposed (combining actual and modelled data)
● Direct economic losses as a % of gross domestic product (GDP) (combining actual and modelled data)
● % of budget allocated to disaster risk reduction/preparedness
● Proportion of people living in poverty in areas exposed to natural hazards (combining actual and modelled data)
● Proportion of new health care facilities built in compliance with building codes and standards to withstand hazards
Scenario 2: DRM within a ‘resilience’-type goalUnderscenario2,thereisinsufficientspaceorlackofprioritisationofDRMforastandalone goal on disasters. Alternatively, consensus emerges that a disasters target could usefully sit alongside targets on violence, food security or environmental degradation for example, as a way of fostering better integration of risk management approaches to development shocks and stresses. One potential formulation is as follows:
Goals Targets Indicators
Enhance community resilience
● By 2030, halve the number of people killed by disasters
● Other resilience-related targets, for example :
● By 2030, halve violence against women and girls
● By 2030, achieve 100% access to adequate food all year round
● Number of men, women, children killed by age, location, hazard type and socioeconomic group as proportion of population exposed (combining actual and modelled data)
● % of budget allocated to DRR/preparedness ● Other indicators relating to non-disasters
target
x Disaster risk ManageMent in Post-2015 DeveloPMent goals | Potential targets and indicators

Scenario 3: DRM mainstreamed in other goalsIncombinationwitheitherofthefirsttwoscenarios,orifDRMisconsideredprimarilyasacross-cutting concern in an effort to prevent DRM from being siloed, Scenario 3 involves the integration of DRM (or resilience-related) targets and indicators across other goal areas. Selected examples from poverty and education goals could be as follows:
Goals Targets Indicators
Goal on poverty reduction
Reduce by 1 billion, the number of people 'at risk' [of falling into poverty]
● Proportion of the population above/below the ‘security poverty line’ of $10 PPP per capita at which the risk of falling back into poverty falls drastically
Goal on education By 2030, halve the number of children killed in schools by disasters, with no children killed by disasters in new schools built after 2015
● % of newly built early childhood development, primary and secondary educational facilities certified to be in conformity with locally appropriate hazard-resistant building standards, codes and norms
● # of children killed in schools by disasters, with no children killed by disaster in new schools built after 2015 (disaggregated by sex, age and disability)
Detailed analysis of potential goals, targets and indicators across each of the scenarios areexploredinthereport.Thereporthighlightssomeimportantfindings.
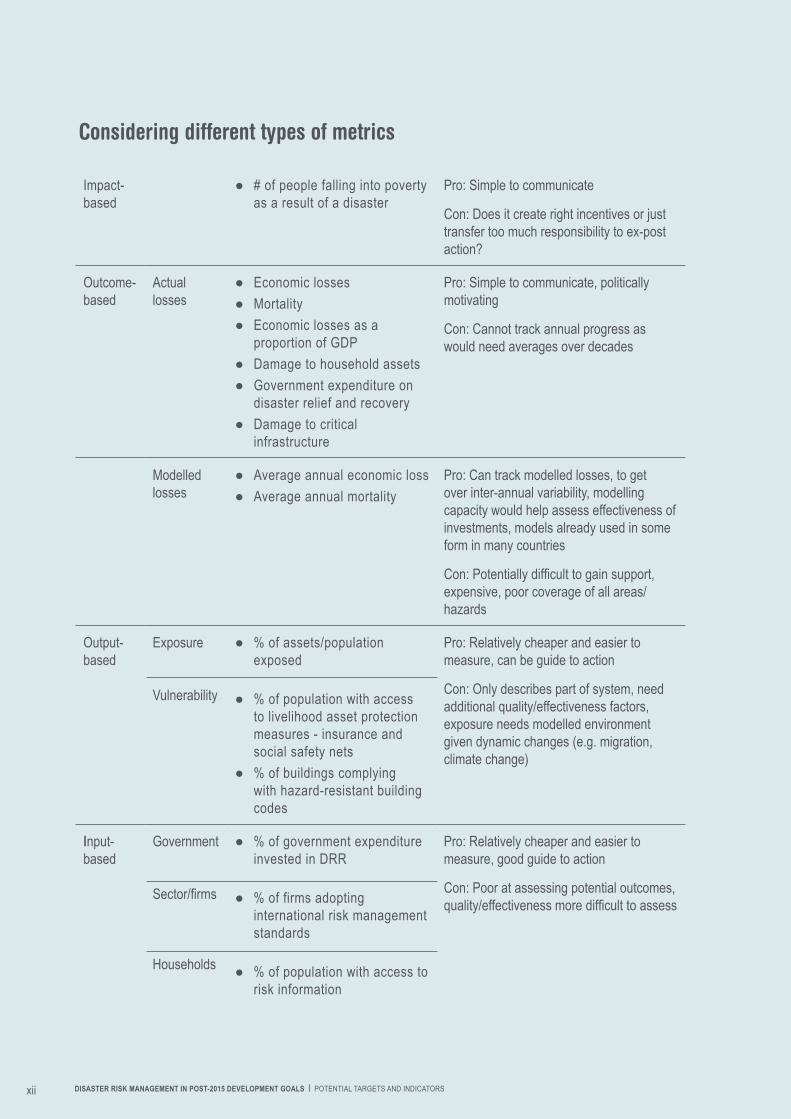
The type of metric matters – They must support ex-ante action, including on extensive risksThetypeofindicatorsusedtomonitorprogresswillhaveasignificantimpactonthetypeof DRM-related activities that are incentivised and how they are measured. A range of impact, outcome, output and input metrics are relevant for tracking DRM activities, each with their own pros and cons (see table below). Impact- and outcome-based categories have the advantage of being relatively simple to communicate and often generate strong political motivation. Input- and output-based categories are typically easier to measure and act as a useful guide to how DRM-related activities can be promoted. However, on their own, none can deliver the spectrum of activities needed to ensure holistic DRM. Where possible, a range of indicators from across the typology of indicator categories is therefore needed, ones that monitor and incentivise both ex-ante and ex-post actions and ones that support action to reduce extensive (small scale, more common) and intensive (high magnitude, less common, more headline grabbing) disaster risk.
xixi
Impact- based
● # of people falling into poverty as a result of a disaster
Pro: Simple to communicate
Con: Does it create right incentives or just transfer too much responsibility to ex-post action?
Outcome-based
Actual losses
● Economic losses ● Mortality ● Economic losses as a
proportion of GDP ● Damage to household assets ● Government expenditure on
disaster relief and recovery ● Damage to critical
infrastructure
Pro: Simple to communicate, politically motivating
Con: Cannot track annual progress as would need averages over decades
Modelled losses
● Average annual economic loss ● Average annual mortality
Pro: Can track modelled losses, to get over inter-annual variability, modelling capacity would help assess effectiveness of investments, models already used in some form in many countries
Con:Potentiallydifficulttogainsupport,expensive, poor coverage of all areas/hazards
Output- based
Exposure Vulnerability
● % of assets/population exposed
● % of population with access to livelihood asset protection measures - insurance and social safety nets
● % of buildings complying with hazard-resistant building codes
Pro: Relatively cheaper and easier to measure, can be guide to action
Con: Only describes part of system, need additional quality/effectiveness factors, exposure needs modelled environment given dynamic changes (e.g. migration, climate change)
Input-based
Government Sector/firms Households
● % of government expenditure invested in DRR
● % of firms adopting international risk management standards
● % of population with access to risk information
Pro: Relatively cheaper and easier to measure, good guide to action
Con: Poor at assessing potential outcomes, quality/effectivenessmoredifficulttoassess
Considering different types of metrics
xii Disaster risk ManageMent in Post-2015 DeveloPMent goals | Potential targets and indicators
An outcome-related target, measured using a blend of observational data and modelled techniques, coupled with a set of input/output indicators to guide action, appears one of the most compelling formulations. This combination would have the advantage of supporting ex-ante risk reduction globally by improving the information base on which to act. Such an advance is long overdue.
Tracking annual progress on DRM requires modelsAs detailed above, a number of the report’s proposed targets present the option of using probabilistic risk models in tracking and measuring progress. Such models simulate the losses from thousands of possible events, allowing for an assessment of the damages expected in a given year. These have many advantages, not least of which is the ability to project the impact (and therefore imply the effectiveness of DRM strategies) ofdisastersonagivenpopulationandoveraspecifictimeperiod.Thiscanlookattheeffects of disasters on a number of variables, including number of deaths, economic losses and levels of poverty. Models also offer the opportunity of assessing preparedness for high-impact low-probability events, a factor that observational records may struggle to adequately account for given the possible 15-year time period of the post-2015 goals.However, models are not without their limitations. For one, they are heavily dependent onthequalityofdatainputs,whichpresentssignificantchallengesformanydevelopingcountries. Models are also inevitably subjective; modellers make certain assumptions (andsimplifications)acrosstheinteractionsofvariousnatural,socialandeconomicvariables–manyofwhichwillbedifficulttotestempiricallyovershorter-termtimeperiods.Thisisparticularlythecaseforfloodanddroughtevents,forwhichriskmodelsare in their infancy. In addition, issues of trust, transparency and ownership present a number of challenges, especially in the contexts of low technical capacity within many developing countries. Nevertheless, models do add value in complementing other observational measures and targets, and their utility in a post-2015 framework should not be discounted. Rather, policymakers may well wish to take advantages of recent progress in the development and application of risk modelling where relevant, particularly with regard to their role in monitoring year-on-year progress and addressing the variable natureofdisasteroccurrence.Thiswilllikelyhaveanumberofspin-offbenefitsfortheway in which countries approach DRM challenges.
xiii

Coherence between Post-2015 Development Goals and Successor to Hyogo Framework for Action is crucialInclusion of disasters within the framework will ultimately secure a considerable amount of political momentum and interest in the delivery of DRM. However, given intense competition between competing development priorities, disasters will invariably have alimitedprofilewithintheframework–whetherasastandalonegoalormainstreamedwithin others. A post-2015 framework must therefore not be seen as the ultimate vehicle for delivering the full range of objectives of the DRM community, though it is undoubtedly important. As such, coordination and overlap between other disaster-relevantframeworksisvitalforfillingthesegapsandpromotingDRMacrossalllevelsof governance. In this regard, coherence between the post-2015 consultative process on a successor to the Hyogo Framework for Action (2005-2015) and the post-2015 development agenda is crucial.
xiv Disaster risk ManageMent in Post-2015 DeveloPMent goals | Potential targets and indicators

Looking Forward Post-2015 A review of Education-related Targets and indicators in Disaster risk reduction, resilience, and Management
Chapter 1

introduction
Tom Mitchell, Emma Lovell, Eva Comba and Lindsey Jones Overseas Development Institute

The Millennium Development Goals (MDGs) have successfully raised popular and political support for poverty reduction. For over a decade, they have represented a tool for measuring development progress, elaborated through a set of targets and indicators. Nevertheless, the world has changed considerably since efforts began to develop the MDGs, and while many traditional MDG issues remain unresolved, there are key challenges and issues that warrant inclusion in a new framework when the current MDG commitment period expires in 2015.
One such issue is the increasing propensity for disasters and the failure of existing development frameworks and policies to reduce the impact of disasters on society and the economy (see Wilkinson et al., 2012). Globally, exposure to disasters is rising as more people and assets are located in hazard-prone locations. Furthermore, disaster risk is expected to further increase in coming decades as vulnerability, exposure and the frequency and severity of many hazards are influenced by a range of factors, including population growth, urbanisation and climate change (Foresight, 2012; IPCC, 2012). Disasters can hamper the achievement of development goals; can reverse development gains; and often have their harshest impact on poor people (IPCC, 2012; UNISDR, 2009a). Conversely, without adequate focus on protecting people and assets from disasters, development processes can also serve to increase disaster risk (Wisner et al., 2003). For these reasons, disaster risk management (DRM) should be a core feature of the post-2015 development agenda and the goals, targets and indicators that emerge (Mitchell et al., 2012).
While the need to tackle disasters was a feature of the original Millennium Declaration, it did not translate into a disasters goal, target or indicator in the MDGs. Since then, governments have signed the Hyogo Framework for Action (HFA), the global agreement to build disaster resilience (2005-2015), which has served to establish DRM as a core development issue. The inclusion of DRM as a key feature of the Rio+20 text, on the G-20 agenda and as a central feature of an IPCC Special Report, all in 2012, demonstrates the emphasis being placed on reducing disaster risk internationally in the face of growing disaster losses, and serves to highlight the broad appeal of the issue across policy arenas.
In the context of the post-MDG discussion, ‘disasters’ have been featured in the UN thematic consultations, most recently serving as the subject of a meeting in Jakarta (February 2013) hosted by the president of Indonesia, and have been the topic of several technical studies and policy notes relating to 2015 goals (e.g. Mitchell, 2012; Mitchell et al., 2012; UNDP, 2013; UNISDR/WMO–UN Task Team, 2012). A number of proposals and documents on the architecture of the overall post-2015 goals framework have included DRM as a central feature – notably by the Centre for International Governance Innovation (CIGI)/Bellagio Group, the UN ‘Realizing the Future We Want for All’ Report and Save the Children, among others (see www.post2015.org for a database of proposals). The communique from the meeting of the UN Secretary General’s High Level Panel on the Post-2015 Development Agenda in Bali (March 2013), also included ‘disaster preparedness’ as a prominent consideration. Furthermore, as the Sustainable Development Goals (SDGs) ‘Open Working Group’ begins its work, the focus on disaster risk reduction (DRR) in the Rio+20 outcome document, ‘The Future We Want’, will be a critical foundation for further discussions. This calls for countries to:
● Accelerate implementation of the HFA, at all levels, and build resilience to disasters with a renewed sense of urgency;
● Commit adequate, timely and predictable resources to DRR, including for the international community to help with technical assistance and technology transfer;
● Ensure early warning systems (EWS) and disaster risk assessments are a key part of disaster resilience efforts at all levels; and
● Ensure investments and development plans integrate a comprehensive approach to reducing risk and enable smooth transitions between relief, recovery and development, including by linking with climate change adaptation (CCA) and promoting gender- based approaches.
Accordingly, while organisations, reports and inter-governmental processes have made the case for including DRM in post-2015 goals, few have embarked on serious attempts to assess which targets and indicators might be most suitable. This reports seeks to address this, by analysing
3

potential post-2015 DRM targets and indicators associated with mortality, economics, poverty and health, and ways DRM could be included in other goals relating to education and poverty reduction. This reflects the way DRM should be considered across key development sectors and highlighted as a development priority that can be achieved by having its own goal or target. Participants of the Jakarta consultation endorsed such an approach (see UNDP, 2013).
1.1 Formulating targets and indicators for DrMRecent work on ways to include DRM in post-2015 goals has highlighted criteria and priorities for selecting the most appropriate targets and indicators. For example, Mitchell (2012) highlights that good targets and indicators should match the interest of the target audience, be easy to interpret, incentivise the right kind of action, be representative of the issue being considered, show
Box 1: An eight-point checklist for developing targets and indicators on DrMA target and indicator set on DRM should:
● Be motivating – ambitious but achievable; ● Be amenable to aggregation globally but
also suitable for translating to national, sub-national and community levels;
● Include outcome-oriented components; ● Include risk reduction components; ● Add value rather than focusing on aspects
that are already improving; ● Be simply and straightforward to
communicate; ● Be measurable, though not necessarily
already measured globally, with the potential for a baseline to be created; and
● Be able to capture trends in both extensive and intensive disaster risk.
Table 1: key tests for assessing the most suitable goals, targets and indicators
Options for goals Options for targets Options for Indicators
● Is it understood the same way by all stakeholders?
● Can it be communicated clearly?
● Is it politically acceptable for key constituencies?
● Does it motivate the right actions?
● Is it a priority for poor people?
● Would concerted action on the target actually make a positive difference?
● Is there a good basis on which to calibrate the target (ambitious but achievable)?
● Is the target meaningful at all scales?
● Does it reinforce human rights?
● Is it simple and easy to understand?
● Can progress be measured every year?
● Do reliable, comparable, disaggregated data already exist or can they be developed?
● Is measurement likely to be relatively transparent/corruption free?
● Is there capacity to measure progress everywhere or can it be developed easily?
● Does the indicator link to the target?
4 Disaster risk ManageMent in Post-2015 DeveloPMent goals | Potential targets and indicators

developments over a relevant time period, have a baseline and be scientifically and statistically sound.1 Box 1 highlights a further set of priorities for formulating targets and indicators that have been specially tailored to DRM in the context of post-2015 goals (ibid.).
The final priority on extensive and intensive risk is particularly important, as, while intensive risks manifest as major headline-grabbing disasters, evidence suggests that, globally, development progress and household poverty are most heavily affected by small-scale disasters that are often not recorded in international databases or covered by the media (UNISDR, 2009a).
Criteria for assessing the utility of goals, targets and indicators on DRM in the context of post-2015 goals were further elaborated in an expert group workshop hosted by the UK Department for International Development and the Overseas Development Institute (ODI) in December 2012 (see Table 1). This approach has been used to guide the work of the different authors contributing to this report.
1.2 structure of the reportThe report is divided into two clusters. The first cluster examines options for a standalone goal, targets and indicators on DRM. The chapters focus on economics impacts, mortality, vulnerability (through a poverty lens) and health. The second cluster looks at ways in which DRM might be reflected in other goal areas, particularly those focused on poverty reduction and education. The report concludes with a synthesis of key findings.
In Chapter 2, Dr Nicola Ranger and Dr Swenja Surminski of the London School of Economics focus on options for targets and indicators on DRM related to their economic impact. The authors highlight that the extent of economic damage from natural disasters is linked intimately with the level of development, depth of poverty and pace of economic growth. In this context, economic resilience to disasters can be considered as a key enabler of broader development goals. In formulating targets and indicators, the authors assess the potential trade-offs between relevance and measurability. They offer perspectives on the key question of how economic losses or economic
resilience associated with disasters can be measured every year, recognising that intensive disaster risks are infrequent by their nature.
In Chapter 3, Debarati Guha-Sapir and Philippe Hoyois of the Centre for Research on the Epidemiology of Disaster assess options for targets and indicators relating to disaster mortality. The authors highlight how disaster deaths vary considerably between disaster types and socioeconomic contexts, but, while data on deaths are often collected in many regions, few countries assess what determines why some people die over others. Further, they discuss how disasters data require standardisation in terms of basic definitions, concepts and collection methods to establish globally comparable datasets. They go on to elaborate potential targets and six indicators on mortality, along with suggestions on how to improve measurement.
Chapter 4, written by Daniel Clarke and Robert Reid of the World Bank, highlights how disasters affect the poorest and most vulnerable disproportionately, especially women, children and the elderly and those affected by conflict and violence. It discusses targets and indicators for reducing disaster-induced poverty, and calls for blending statistical approaches to measuring progress that combine observational data and model-based data to overcome the high variability in disaster impacts each year.
Chapter 5, by the World Health Organization, investigates options for including health in a DRM goal and targets. It demonstrates the importance of taking a broad perspective on disasters – to include technological and conflict-related disasters as well as communicable disease epidemics – in the context of national health systems and multi-sectoral action. The chapter focuses on options for potential indicators, including measurement of health outcomes, strengthening capacities (including for the implementation of the International Health Regulations (2005)) and the creation of safer, more prepared and more resilient health facilities.
In Chapter 6, Dr Andy Sumner, of Kings College London, examines the links between poverty, vulnerability and resilience, and questions whether the existing treatment of poverty in the MDGs adequately reflects a resilience and vulnerability perspective. The chapter looks at how the
55

geography of poverty and risk may intersect in 2030, and proposes three poverty domains and accompanying indicators that would improve the way resilience to shocks could be factored in any post-2015 framework. The underlying objective is to ensure shocks and stresses of all kinds, whether disaster related or otherwise, do not hamper poverty reduction efforts.
Chapter 7, written by Fe Garcia, Richard Rumsey and Lisa Zook Sorensen from World Vision International, focuses on the link between disasters and education, considering how DRM could be included within indicators associated with an education goal. While the authors acknowledges that identifying indicators and targets that elaborate the full interplay between disasters and education is challenging, they go on to propose some preferred options. The chapter also stresses the importance of having education-related indicators associated with a DRM target and to strengthen the links between the issues by cross-referencing.
Chapter 8 synthesises the findings of each of the chapters, proposes a summary of targets and indicators and discusses next steps, including how to test candidate targets and indicators at country and community level.
Chapter 1 Endnotes
1 Adapted from Bosch and Gabrielson (2003)
6 Disaster risk ManageMent in Post-2015 DeveloPMent goals | Potential targets and indicators

Chapter 2

Disasters and their economic impacts
nicola ranger and swenja surminski Grantham Research Institute on Climate Change and the Environment, London School of Economics and Political Science
Disaster resilience and Post-2015 Development goals: The options for Economics Targets and indicators

Executive summaryEconomic damage from natural disasters is linked intimately with development, poverty and economic growth. Low-income countries (LICs) show high economic vulnerability to disasters. Damages to assets, public infrastructure and long-term productivity as a result of disasters can set back development and erode gains in poverty alleviation. Economic resilience to disasters is an important enabler of many broader development goals.
There is a trade-off to be made between relevance and measurability in selecting a target. Indicators like economic losses are relevant and powerful, yet come with measurement challenges. In particular, the annual volatility in loss means progress cannot be monitored every year. Yet input- and output-based indicators, like annual spending on DRR and exposed gross domestic product (GDP), while being informative and easy to measure, alone provide only a narrow view of overall resilience.
We would recommend the following target: ‘Economic losses as a fraction of output are reduced by 20%’. This formulation comes with a number of advantages:
● It can be measured at household, sector and national levels. This means it has the advantage of covering the whole economy.
● It should motivate action beyond traditional development agencies, stimulating action from households, firms and finance ministries.
● It should motivate action with a greater focus on DRR, rather than just ex-post action.
● It is pro-growth: the emphasis is on enhancing the resilience of growth.
● It will require ambitious action from high-, middle- and low-income countries.
The effectiveness of such a target could be strengthened with a complementary basket of indicators, which includes:
● Transparent ‘input-’ and ‘output’-based indicators, against which it is possible to measure key dimensions of progress in terms of reducing economic vulnerability easily and clearly every year;
● Indicators that directly reflect humanitarian priorities and poverty reduction goals, to ensure actions are directed at assisting the most vulnerable in society; and
● Model-based indicators of expected damages, which provide risk estimates and can be used to monitor progress annually and set meaningful benchmarks.
Developing an operational framework for monitoring performance against economic indicators will require significant investments in building capacity at international, national and local scales. There is a growing precedent for establishing such monitoring programmes at the local level in LICs and middle-income countries (MICs). Developing these capacities more widely will have co-benefits for DRM planning.
2.1 introductionIn this chapter, we consider a range of economic indicators for monitoring disaster resilience within a post-2015 development framework. We evaluate their advantages and disadvantages, particularly in the context of their ability to motivate action to reduce the impacts of disasters on development. The outcome of this discussion is the proposal of a set of targets and indicators that could be used either as a standalone framework, or alongside other targets and indicators, for example related to the impacts of disasters on poverty or the existing MDGs.1
In this section, we introduce the concept of economic resilience and present the case as to why economic resilience to disasters is a crucial component of development and poverty alleviation, and therefore an important target within the upcoming post-2015 development goals. Section 2.2 then gives an overview of the types of indicators that could fit within the post-2015 framework. Based on this analysis, and the criteria set out by ODI, Section 2.3 proposes a single target and Section 2.4 a complementary basket of economic indicators. Finally, Section 2.5 provides some final thoughts on the feasibility of these.
Economic resilience can be defined as ‘the policy-induced ability of an economy to withstand or recover from the effects of [exogenous]
99

Time
Shock
Impa
ct o
n Pr
oduc
tivity
(% G
DP)
Recovery
Developed economyDeveloping economy
immediate impact on poverty and human security and can set back development by several years (Figure 1).
In the short term, natural hazards damage and destroy property, assets (including crops, livestock and natural capital like forests), infrastructure and livelihoods, and disrupt economic activity. In poorer communities, which are more exposed and vulnerable to natural hazards,3 this immediate loss of income and assets can force people into poverty and threaten human security (UNISDR, 2009a).
For poorer communities, the impacts can also be longer lived. Whereas in richer communities,
shocks’ (Briguglio et al., 2008).2 In this case, the exogenous shocks are natural hazards, such as floods and droughts.
But, why is economic resilience an important policy issue for LICs, where humanitarian losses from natural hazards are so considerable? And, following on from this, what is the role of economic indicators of disaster resilience within an international policy agenda that is focused on development and poverty alleviation?
Development, poverty alleviation and economic resilience to natural hazards are intimately linked. The economic impacts of natural hazards have an
Figure 1: schematic diagram illustrating the impact of a disaster on a developed economy and a developing economy
Note: In a developed economy, the initial impact of the shock is less deep, owing to investments in risk reduction and preparedness, and the economy recovers more quickly; sometimes, there is even a productivity gain owing to increased production in the construction sector. In developing countries, the impact can be (relatively) larger and longer lived.
Sour
ce: B
ased
on
Halle
gatte
et a
l. (2
007)
10 Disaster risk ManageMent in Post-2015 DeveloPMent goals | Potential targets and indicators10

2009a), progress is unequal. Some of the poorest communities are being left behind, and some are becoming more vulnerable to natural hazards.
Without building economic resilience to natural disasters, the gains in development, poverty alleviation and human security promoted by the post-2015 development agenda will be repeatedly eroded (Mechler, 2009; World Bank, 2010). This is particularly concerning when we consider that climate change is expected to increase the severity of climate hazards over the coming decades (Handmer et al., 2012).
2.2 Economic indicators of resilienceIn this section, we review economic indicators of resilience. We introduce a typology to group these indicators into one of four types, and then discuss the advantages and disadvantages of the indicators within each grouping in the context of measuring progress against a goal to increase the resilience to disasters.
Definition of an ‘economic’ indicatorIt is useful first to define what we mean by an economic indicator. The narrowest definition would be an indicator that has some monetary quantity, such as the value of property damaged, or the value of exposed assets. An alternative approach is to include all factors that influence wealth and long-term economic growth. In this chapter, we move towards the later definition. This is consistent with the latest discussion on ‘beyond GDP’ approaches (highlighted within the Rio+20 dialogue),7 which recognise that long-term economic growth, which is vital for poverty alleviation (Dercon, 2012), is a process of accumulation and management of a portfolio of assets, including manufactured capital (the traditional ‘economic’ component), natural capital and human and social capital.8
We limit the scope of our coverage of economic outcomes from disasters to traditional monetary factors (Figure 4). This is because mortality and other non-monetary outcomes, including health and education, are covered in accompanying chapters. However, we take a broader view on
financial reserves, social safety nets and mechanisms like insurance4 mean communities can rebuild and recover from shocks quickly (Hoeppe and Gurenko, 2006), in poorer communities recovery is slower, and the cost of rehabilitation tends to divert resources away from more productive investments (Hallegatte et al., 2007). This is seen at all levels of organisation. For example, at the household level, investments may be diverted away from new equipment and educating children, reducing the long-term prospects for escaping poverty (UNISDR, 2009a). At the regional and national scales, investments in improved public services (health, education and utilities), sectoral development and infrastructure (roads, information and communication technology (ICT) and energy) may be foregone. The result is a long-term decrease in productivity and economic growth (World Bank, 2010).
These effects can be seen clearly in a range of economic indicators. When expressed as a percentage of GDP, the direct (immediate) economic losses from natural disasters in LICs were more than 14 times higher than in high-income countries (HICs) between 1980 and 2011 (Figure 2). Looking longer term, Raddatz (2009) finds that, on average, in LICs, the total cost of disasters is equivalent to 1% of GDP (or 2% for droughts); in HICs, it is around 0.25% of GDP.
Mitchell (2012) describes disaster resilience as an enabling factor in sector-oriented development goals, including those concerning water, food, education, infrastructure and health. As described above, economic factors are crucial in each of these.
The urgency of building economic resilience to natural hazards is underlined by the rapid increase in economic losses from disasters observed around the world. Today, economic losses from natural disasters cost on average $125 billion per year5 globally, and are rising at a rate of around $30 billion per decade (Figure 3). Much of this trend results from growing exposure to disasters (Handmer et al., 2012).6 To some extent, it is inevitable that, in a much richer, more populous world, losses will rise (Hallegatte, 2012), but there can be considerable benefits, both humanitarian and financial, to making growth more resilient to natural hazards (Bowen et al., 2011).
In addition, while there is some evidence that resilience is increasing on average (UNISDR,
11

Figure 2: relative Economic impacts
Sour
ce: A
utho
rs’ c
alcula
tion
base
d on
dat
a pr
ovide
d by
Mun
ich R
e.So
urce
: Aut
hors
’ calc
ulatio
n ba
sed
on d
ata
prov
ided
by M
unich
Re.
Figure 3: Economic losses grouped by World Bank income class, 1989-2010
0
50,000
100,000
150,000
200,000
250,000
300,000
1980 1985 1990 1995 2000 2005 2010
Low Income Middle Income High Income
Dire
ct L
osse
s fr
om N
atur
al H
azar
ds ($
mill
ion,
201
0)
0.000000%
0.000050%
0.000100%
0.000150%
0.000200%
0.000250%
LIC MIC HIC
12 Disaster risk ManageMent in Post-2015 DeveloPMent goals | Potential targets and indicators

A typology of indicatorsWe have already discussed a number of economic indicators in Section 2.1, including direct losses and losses as a fraction of GDP. These are the two most common ‘outcome-based’ measures of the economic resilience to natural hazards. We suggest indicators can be placed into one of four categories:
1. Indicators that measure inputs, or specific actions, like the scale of investment in disaster resilience;
2. Indicators that measure the outputs of action, such as the fraction of the population living in regions exposed to natural hazards;
3. The outcomes themselves, such as actual economic losses and damages to critical infrastructure; and
4. The impact on the overarching goal – development and poverty alleviation.
Figure 5 illustrates this framework.
Impact- and outcome-based measures can provide
the drivers of economic resilience. The rationale for applying this approach in this context is that damages to any of these types of assets could have a material impact on traditional monetary wealth; for example, damages to agricultural land or water resources could have significant impacts on long-term economic growth. Similarly, building the resilience of human and natural assets, through, for example, risk education or restoring mangroves, respectively, will reduce the economic impacts of disasters and should be included in the definition of economic resilience. By narrowing the definition to traditional monetary factors, there is a chance of disincentivising investments in building the resilience of natural and human capital.
The impacts on natural capital are an important gap in the chapters. Natural capital accounting is now becoming available and accepted internationally, and so it may be feasible to include it in measures of economic loss and resilience. This option should be considered carefully; for example, including natural capital in economic resilience could reduce the transparency of indicators9 and delay monitoring while the necessary additional capacity and accounting frameworks are developed.
Figure 4: Framework for conceptualising economic factors adopted in this chapter
Wealth
Manufactured capitale.g. finance, equipment,
crops, infrastructure
Natural capitale.g. forests, ecosystems, mineral
resources, fisheries, soil
Human & social capitale.g. people, skills, social networks
Long-term economic growth
Sour
ce: A
dapte
d fro
m sit
eres
ource
s.wor
ldban
k.org
/EXT
SDNE
T/Re
sour
ces/N
atura
l-Cap
ital-A
ccou
nting
-Fac
t-She
et.pd
f
13

2. A political motivator of action: unlike non-monetary indices, economic indicators, because they are directly tied to growth and prosperity, are of strong interest to households, government (including, importantly, finance ministries), firms and politicians, so can motivate action across the board.
3. Motivator of ex-ante risk reduction: it is difficult to reduce direct economic losses through ex-post action, so economic loss focuses more attention on ex-ante measures. This has benefits for mortality, education, health and poverty dimensions of resilience to disasters.
4. Relevant and applicable at a range of spatial scales: a target should aim to cover the whole economy, not just the very poorest communities, and should be relevant across households, firms and government. In theory, economic loss can be calculated at household, community, meso or national scale. It can be aggregated across regions and countries. The only limitation on spatial scale is the granularity of the data. The most common level of resolution is national, but this can hide imbalances across a country.
a picture of the actual realised risk and resilience of a country, sector or community. Input- and output-based indicators provide information about specific drivers of exposure and vulnerability to natural hazards, providing a slice of the whole picture of resilience, albeit in more detail.
Table 2 gives examples of a range of economic indicators across each of these categories and summarises some their general advantages and disadvantages. Below, we provide a more detailed discussion of the strengths and weaknesses of these various indicators in terms of measuring progress in disaster resilience. This is supplemented by Annex A, which provides a summary of the economic indicators used in practice today.
outcome- and impact-based indicatorsActual economic loss Economic loss is the most comprehensively measured indicator of disaster resilience. It has long been used as an indicator by many organisations,10 and has several advantages:
1. Transparent and easy to communicate: economic loss is understandable by all and tangible and relevant to all, including HICs and LICs.
Figure 5: Typology of resilience indicators
Input
● National disaster risk reduction and resilience plan
● Investment in disaster resilience as a fraction of GDP
Output Outcome Impact
● % population/assets in exposed regions
● Critical infrastructure and housing built to resistant standards
● Actual Economic loss
● Annual spending on disaster relief
● Damage to critical infrastructure
● Number of people falling into poverty as a result of disaster
● Reduction in economic growth from baseline
14 Disaster risk ManageMent in Post-2015 DeveloPMent goals | Potential targets and indicators
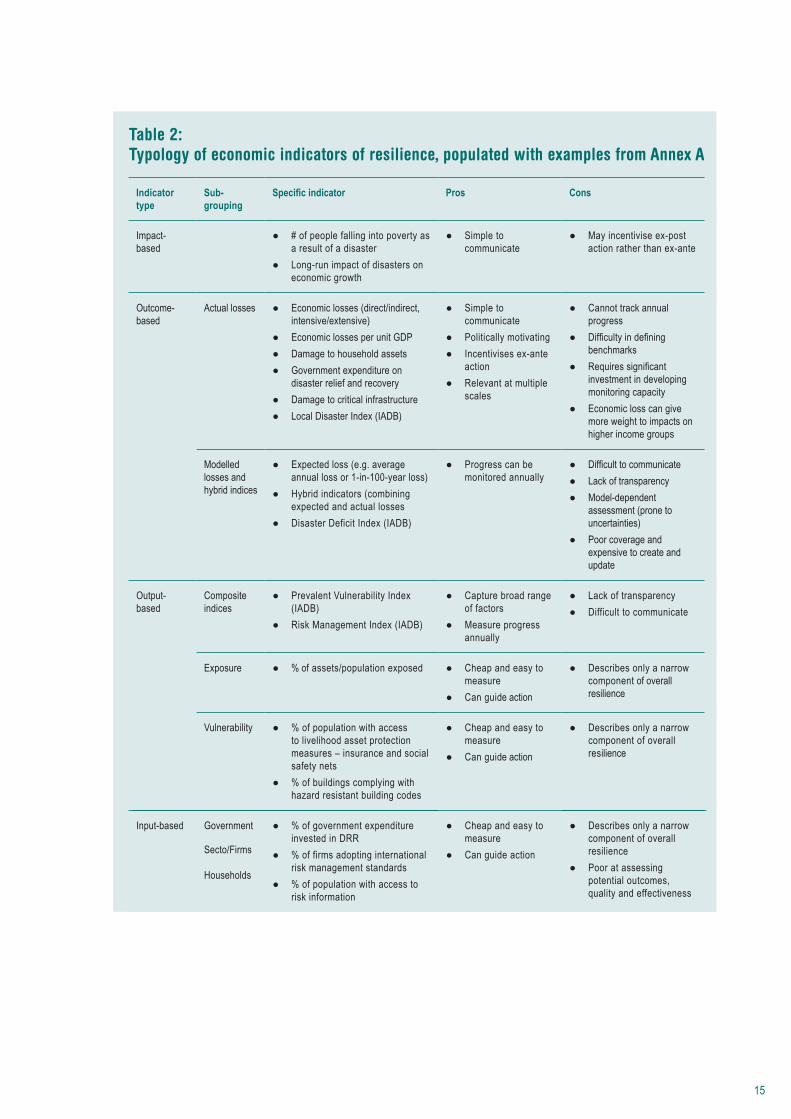
Table 2: Typology of economic indicators of resilience, populated with examples from Annex A
Indicator type
Sub-grouping
Specific indicator Pros Cons
Impact-based
● # of people falling into poverty as a result of a disaster
● Long-run impact of disasters on economic growth
● Simple to communicate
● May incentivise ex-post action rather than ex-ante
Outcome-based
Actual losses ● Economic losses (direct/indirect, intensive/extensive)
● Economic losses per unit GDP ● Damage to household assets ● Government expenditure on
disaster relief and recovery ● Damage to critical infrastructure ● Local Disaster Index (IADB)
● Simple to communicate
● Politically motivating ● Incentivises ex-ante
action ● Relevant at multiple
scales
● Cannot track annual progress
● Difficultyindefiningbenchmarks
● Requiressignificantinvestment in developing monitoring capacity
● Economic loss can give more weight to impacts on higher income groups
Modelled losses and hybrid indices
● Expected loss (e.g. average annual loss or 1-in-100-year loss)
● Hybrid indicators (combining expected and actual losses
● Disaster Deficit Index (IADB)
● Progress can be monitored annually
● Difficulttocommunicate ● Lack of transparency ● Model-dependent
assessment (prone to uncertainties)
● Poor coverage and expensive to create and update
Output-based
Composite indices
● Prevalent Vulnerability Index (IADB)
● Risk Management Index (IADB)
● Capture broad range of factors
● Measure progress annually
● Lack of transparency ● Difficult to communicate
Exposure ● % of assets/population exposed ● Cheap and easy to measure
● Can guide action
● Describes only a narrow component of overall resilience
Vulnerability ● % of population with access to livelihood asset protection measures – insurance and social safety nets
● % of buildings complying with hazard resistant building codes
● Cheap and easy to measure
● Can guide action
● Describes only a narrow component of overall resilience
Input-based Government
Secto/Firms Households
● % of government expenditure invested in DRR
● % of firms adopting international risk management standards
● % of population with access to risk information
● Cheap and easy to measure
● Can guide action
● Describes only a narrow component of overall resilience
● Poor at assessing potential outcomes, quality and effectiveness
15

loss would not be an appropriate indicator of resilience because it removes the effects of important drivers of resilience, like urbanisation.
Some initiatives are addressing the gaps in data availability. For example, the DesInventar programme15 is now utilised in several countries across Latin America and beyond to provide bottom-up municipality-level estimates of the impacts of natural hazards (feeding into the Local Disaster Index of the Inter-American Development Bank (IADB)) using a consistent method. Such initiatives not only have advantages for monitoring, but also build knowledge that can be applied in informing DRM.
Modelled loss and hybrid indices The insurance industry has for many years used probabilistic ‘catastrophe risk models’ to help overcome problem (2) above. These models simulate the losses from thousands of possible events, allowing for an assessment of expected damages (Muir-Wood, 2012) in an average year. They are based on detailed data on exposure and vulnerability and simulation models and/or historical data on physical hazards.
These models do have several drawbacks. For example:
● The loss estimates are model dependent – different models will give different estimates.
● The quality of risk estimates will depend on the quality of data inputs, which is limited in LICs.
● Risk models inevitably apply simplifications that may lead to misleading results and so could misinform action.16
● Models are expensive to create and need to be updated regularly. Across many LICs, risk modellers will be building models from scratch.
● Models require a high degree of technical capacity to use, update and interpret.
● Finally, the issue of trust in models – relying on a ‘black-box’ model – limits transparency and so may be unappealing to politicians and the public.
Despite this, risk models can add value by complementing measures of actual losses. For example, they might be used in parallel, to demonstrate annual progress, and help inform future policy.17 Simple, transparent risk models
However, there are challenges in applying economic loss as an indicator of resilience:
1. Technical and capacity challenges in increasing the quality and scope of monitoring: the availability of reliable local data on economic damages is a challenge in most countries (IFRC, 2007). The most comprehensive records are those held by the insurance industry, but these have coverage that is biased towards HICs, and they often lack transparency and are not freely available. Economic indicators are muchmoredifficulttocount than, say, fatalities or injury, and are more prone to inconsistencies in accounting methods,11 errors and biases.12 Extending coverage and increasing quality will requiresignificantinvestmentandcapacitybuilding from the bottom up as well as top- down auditing.
2. Inability to track progress annually: hazards occur relatively infrequently and so it takes many years or even decades to build up a record long enough to monitor progress in building resilience.13 This also creates a challenge in identifying a benchmark to monitor progress against. For example, it would be particularly problematic to define a single benchmark year, like 2010, as this may have been a particularly active year (in terms of hazard occurrence) in some countries and not in others. Benchmarking, based on assessing actual losses, would need to be carried out over an extended period (at least 10 years at the global level, and preferably more locally), but even then would be prone to biases. This is particularly a problem for measuring resilience to extreme events; for example, to measure progress in building resilience to a 1-in-50-year event, one would need to monitor actual losses for 100 years or ideally much longer.
3. Bias towards high-income groups: a drawback of economic loss as a motivator of action is that it will naturally bias action towards building the resilience of higher income groups. Loss per unit output (e.g. GDP or household output) provides a more equitable way to compare losses across society, placing a greater weight where losses represent a larger portion of output (Figure 1). A more technical version is the normalised loss,14 often calculated in the academic community (e.g. Pielke and Landsea, 2007). Normalised
16 Disaster risk ManageMent in Post-2015 DeveloPMent goals | Potential targets and indicators

mechanisms (UNISDR’s Hyogo Monitor) and aggregate proxy indices, such as the Economic Resilience Index (Briguglio et al., 2008), which incorporates governance, social development, macroeconomic stability and microeconomic market efficiency. Indeed, generic development indices, such as the Human Development Index, have been shown to be good indicators of disaster resilience (Matyas and Pelling, 2012).
3. Monitoring of specific actions that influence exposure and vulnerability: these include ‘the proportion of development decisions that incorporate disaster risk and resilience’ and ‘annual spending on DRR’ (Annex B)
4. Composite indicators of vulnerability and exposure: these include the Community-based Risk Index used by the Deutsche Gesellschaft für Internationale Zusammenarbeit (GIZ), the Risk Management Index used by the Inter-American Development Bank (IADB) and the Disaster Risk Index used by the United Nations Development Programme (UNDP).
A drawback of specific indicators like ‘number of people living within 5m elevation from mean sea level’ or ‘annual spending on DRR’ is that, while they provide transparent and specific information, they also give a narrow view on the drivers of resilience. An advantage of aggregate indicators, compared with individual indices, is that they capture several aspects of resilience. A drawback is that they do not make good communications tools or motivators because they are not transparent or meaningful to the average politician, firm or community.
summaryA conclusion from this analysis is that, in identifying a target, or set of indicators, for disaster resilience we come up against a trade-off between relevance and measurability:
● Relevance: outcome-based indicators, like the economic loss from disasters, provide a picture of overall economic resilience, and are relevant to all stakeholders, whereas input- and output-based indicators, like annual spending on DRR, provide a more narrow (albeit more detailed) view, which could not claim to represent overall resilience.
● Measurability: input- and output-based
can be particularly useful as a complementary tool (e.g. the Ranger et al. 2011 risk model for flooding in Mumbai). Systematic errors are not necessarily an issue, as it is the relative change in an indicator that is important rather than the absolute level.
In addition, risk models add value by providing risk information for disaster resilience planning, for example allowing a policymaker to view the potential impacts of a simulated 1-in-200-year event and assess the financial benefits of different risk reduction strategies (e.g. Mechler et al., 2009). Several initiatives are now extending the coverage of catastrophe risk models to LICs, for example the Global Earthquake Model18 and the World Bank’s Central American Probabilistic Risk Assessment (CAPRA) platform.19
Other outcome- and impact-based indicators More easily measurable indicators of the economic outcomes of disasters include, for example, government spending on disaster relief and rehabilitation. This type of indicator is informative but has a narrower scope.
Possible impact-based indicators include the number of people forced into poverty as a result of a disaster, and the long-run impacts of disasters on economic growth. A complication with these indicators is that poverty and economic growth are driven by many factors beyond disaster resilience, and so it is difficult to define a meaningful baseline and attribute impacts to the disaster.20
input- and output-based indicatorsInput- and output-based indicators have the advantage over the previous sets of indicators of being relatively easy to measure, and progress can be monitored annually.21 An array of such indicators is used in the disaster risk community at a variety of scales. A full list is given in Annex A. This includes for example:
1. Measures of exposure to disasters: this includes the number of people living within 5m elevation from mean sea level, or the ‘exposed GDP’ indicator used in the UNISDR’s Global Risk Assessment.
2. Measures of vulnerability to disasters: this includes specific factors such as the proportion of the population with access to EWSs or government financial reserves and contingency
17
We assume there will be only one target for economic resilience, which must perform well against each of these criteria.
Table 3 lists each input and output target currently proposed (from Annex B) and gives an assessment of their performance against each of the six criteria. This assessment is high level, based on a review of the literature (e.g. Bandura, 2008; UNFCCC, 2012; UNISDR, 2008), and, therefore, we apply only a coarse index, where performance is ranked on a three-point scale (0 = not at all, 1 = somewhat, 2 = definitely). A more detailed appraisal could consider a more refined index and take inputs from expert elicitation.
The highlighted rows in Table 3 are those proposed targets that meet three or more of the criteria. In reality, some criteria may be weighted more strongly than others.
From this analysis, we draw the following conclusions:
● Only two of the proposed targets strongly meet the criteria that targets reinforce human rights and are a priority for poor people: ‘No people falling into poverty as a result of a disaster’ and ‘Disasters don’t add to inequality’.
● The second criterion, that concerted action would make a positive difference, may exclude many of the input- and output-based indicators, as these are often too narrow to claim they could make a real difference by themselves.
● The requirements that the target be simple and easy to understand, meaningful at all scales and is ambitious yet achievable exclude many of the possibly targets, for example the model-based outcome indicators (not simple and easy to understand) and the halving of economic impacts (unlikely to be achievable).
Based on this analysis, we suggest two possible types of targets for disaster resilience, which each perform well against the criteria.
1. Absolute losses, e.g. economic losses,23 reduced by 20% by the 2030s; and
2. Relative losses: e.g. economic losses as a fraction of output, reduced by 20% by the 2030s, or stabilised with respect to economic growth.
The targets that refer directly to poverty (e.g. ‘No
indicators are easier to measure and progress can be measured every year. Outcome- and impact-based indicators come with more significant measurement problems and, in some cases, volatility in losses means progress cannot be monitored every year.
The appropriate target and indicators will depend on the objectives and criteria set out by the post-2015 framework. Examples are given in the following sections.
For all indicators, the indicator will only be as good as the underlying data; in many developing countries, data on hazards, vulnerability and exposure can be scarce and unreliable, with observation networks and data infrastructure often in need of modernisation and upgrading (UNFCCC, 2012). Investing in developing the core data (disaster loss information, exposure mapping and socioeconomic data), including data collection, processing, storage and analysis, willbringmanyco-benefitsforriskmanagementand development planning. To be useful, such investments must be complemented by support for capacity building (including training, skills, guidance and institutional frameworks). Neither can be a one-off, but require sustained effort.
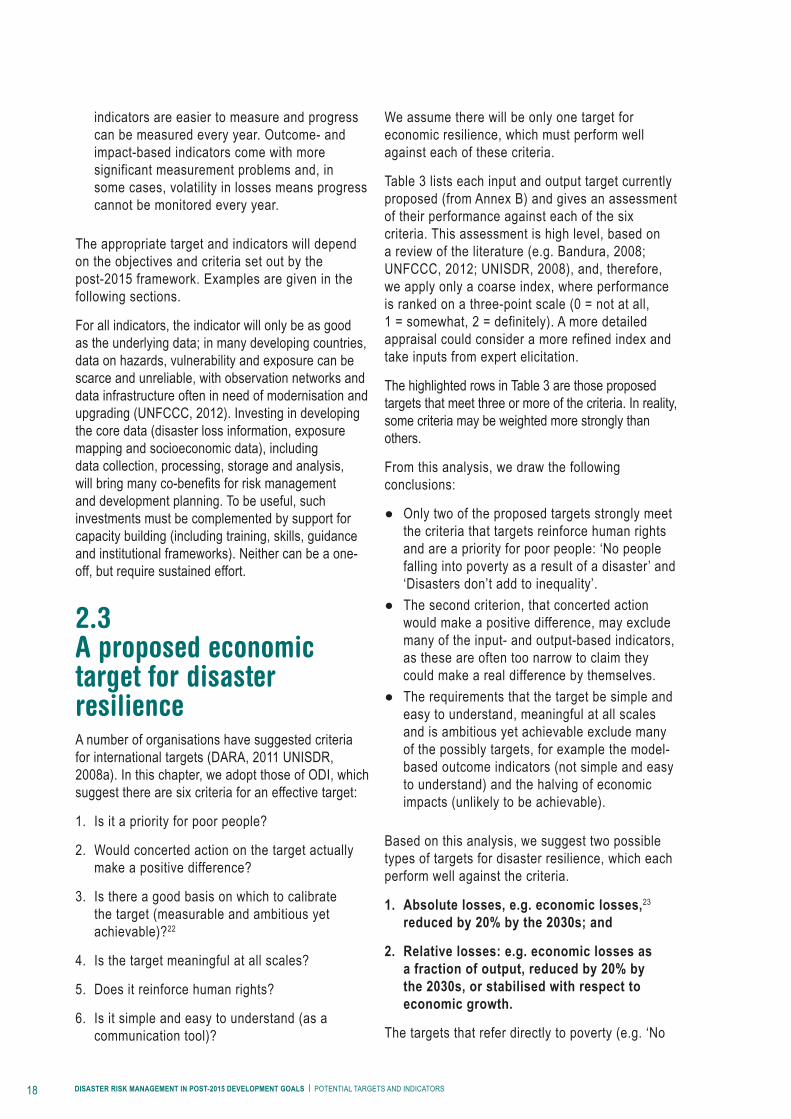
2.3 A proposed economic target for disaster resilienceA number of organisations have suggested criteria for international targets (DARA, 2011 UNISDR, 2008a). In this chapter, we adopt those of ODI, which suggest there are six criteria for an effective target:
1. Is it a priority for poor people?
2. Would concerted action on the target actually make a positive difference?
3. Is there a good basis on which to calibrate the target (measurable and ambitious yet achievable)?22
4. Is the target meaningful at all scales?
5. Does it reinforce human rights?
6. Is it simple and easy to understand (as a communication tool)?
18 Disaster risk ManageMent in Post-2015 DeveloPMent goals | Potential targets and indicators

Table 3: Analysis of how proposed targets perform against a set of criteria 25 Ranking against criteria: A Is it a priority for poor people B Would concerted action make a positive difference C Is there a good basis on which to calibrate the target D Is the target at all scales E Does it reinforce human rights F Is it simple and easy to understand
Type A B C D E F Pros Cons
# of people falling into poverty as a result of a disaster
Impact 2 2 0 2 2 2 ● A priority for poor people and links to human rights
● Unlikely to be achievable ● Could incentivise ex-post
action rather than ex-ante ● Difficult to measurable
Stabilise level of losses in spite of GDP growth
Outcome 1 2 2 2 1 2 ● Simple and easy to understand
● Not a priority for poor people
Nations to halve disaster-related economic loss by 2030
Outcome 1 2 1 0 1 2 ● Simple and easy to understand
● Unlikely to be achievable
20% reduction in expected economic losses
Outcome 1 2 1 2 0 0 ● Not simple to understand ● Not a priority for poor people
Halve expected economic impact of extreme disasters (e.g. 1-in-50 year)
Outcome 1 1 1 2 1 0 ● Relevant at all scales
● Relies on risk models ● Unlikely to be achievable
Eliminate negative impact of disaster on poverty level
Impact 2 2 1 2 2 2 ● Priority for poor people
● Could incentivise ex-post action rather than ex-ante
Zero household asset depletion
Outcome 1 1 0 0 1 0 ● Difficult to understand ● Not meaningful at all scales
Halve average household income loss
Outcome 1 2 0 0 1 1 ● Difficult to understand ● Large data gaps
Disasters do not add to inequality
Impact 2 1 0 2 2 1 ● Not simple and easy to understand
● Difficult to quantify
Halve disaster-related economic loss in the period 2015-2030 (from 2000-2015)
Outcome 1 2 1 2 1 2 ● Easy to understand
● Unlikely to be achievable
Direct economic losses as % of GDP over 15-year period (compared with baseline period)
Outcome 1 2 1 2 1 2 ● Unlikely to be a priority for poor people (could be improved by expressing relative to income or household assets, rather than GDP)
By 2025, have 5% of national budgets committed to reducing disaster risk each year
Input 1 1 2 0 1 2 ● Too narrow to have meaningful impact
Disasters do not impact economic growth beyond the year in which they occur
Impact 2 2 1 2 1 1 ● Priority for poor people
● Could incentivise ex-post action rather than ex-ante
● Difficulttomeasure(problematic accounting owing to reconstruction efforts)
Sour
ce: F
rom
Mitc
hell,
2012
, UNI
SDR
and
DIFI
D/OD
I wor
ksho
p, L
ondo
n, D
ecem
ber 2
012
19

There are a number of technical issues to consider when implementing such a target:
● Operational issues: monitoring will require building significant capacity locally and nationally, as well as implementing auditing procedures and data collection at the international level. It will also require agreement on standardised accounting frameworks.
● Scale: economic losses could theoretically be monitored at any scale, but for international reporting it might be limited to national, regional or sectoral aggregates, to ensure greater data quality.
● Scope: it could be beneficial to limit the scope of measurement to direct economic losses for international reporting, as indirect losses are more prone to biases.27 It may also be beneficial to disaggregate by disaster type to better inform risk management planning. There is an open question over whether the measurement should include natural capital.
● Output indicators: GDP is the easiest output indicator to apply, but other indicators may be more relevant, particularly at the sub-national scale, including income or capital measures. National savings (Mechler, 2009) or capital accumulation are other potential indicators, but are subject to significant data limitations. If economic loss measures include natural capital, then the weighting measure should also account for natural capital (Section 2.2).
● Complementary indicators: there may be complementary role for modelled indicators, to help monitor progress year on year and to establish benchmarks (Section 2.2). Complementing an economic loss target with a broader set of indicators should also help ensure action is not limited to those sectors and areas with greatest economic value (Section 2.4).
● Setting the level of ambition: we suggest an aspirational target of a 20% decline in economic loss relative to output by 2030, but this is open to debate. The target should be set at a level that is ambitious but achievable. It should reflect an appropriate balance between the costs and benefits of action, recognising that some risk taking can be productive and beneficial (Hallegatte, 2012). We are aware of no research available to guide such a level.28
people falling into poverty as a result of a disaster’) and development (e.g. ‘Disasters do not impact economic growth beyond the year in which they occur’) perform strongly against the criteria but are not recommended because they pose very significant measurement challenges that make them infeasible to apply in practice (see more detailed discussion in Chapter 4).24
We can compare the benefits of absolute and relative loss targets as follows:
● Absolute loss targets, because they are not linked to output, are particularly ambitious and should focus attention on the need to tackle the long-term drivers of rising losses, such as rapid growth in hazard-prone areas.
● Absolute loss targets could be seen as ‘anti-growth’, while relative loss targets are pro-growth. Economic losses will be strongly driven by economic growth. While a target should aim to make economic growth resilient, it should not be anti-growth. Monitoring absolute levels would send the wrong signal, as a development framework would not want to suppress activities that can be pro-poor, such as urbanisation and economic growth (Hallegatte, 2012).
● Absolute loss targets could bias action towards those activities that build the resilience of the highest income groups. Relative loss targets will help rebalance efforts towards activities that reduce the greatest proportional loss.
Given this discussion, we recommend the target:
Economic losses as a fraction of output are reduced by 20% by the 2030s
The appropriate benchmark periods and target periods for this target are open to debate. A longer period is preferable, particularly at the national scale when relying on observations. At the global level, a 10-year period (as a minimum) may be suitable, for example using a benchmark period of 2005-2015 and a target period of 2020-2030.26 At the national or sub-national scale, with such a short 10-year measurement period, there would be considerable volatility. This would need to be considered when reporting on progress, though a blended approach using observed and modelled data, as discussed above, would help to track progress annually.
20 Disaster risk ManageMent in Post-2015 DeveloPMent goals | Potential targets and indicators

Sour
ce: N
atur
al ha
zard
dat
a pr
ovide
d by
Mun
ich R
e an
d so
cioec
onom
ic da
ta b
y the
Wor
ld Ba
nk
Figure 6: global (direct) economic losses from natural disasters (corrected for inflation)
$0
$50,000
$100,000
$150,000
$200,000
$250,000
$300,000
1980 1985 1990 1995 2000 2005 2010 2015 2020 2025 2030
20% reduction by 2030
~$180bn per year by 2030
~$125bn per year in 2010
Given this, we suggest that a desirable target for economic resilience might then be that trends in economic losses at least decouple from rising economic output, such that losses grow, on average, more slowly than output. This would imply that economic growth is becoming more resilient to disasters. A point of reference is that, on current trends, direct economic losses are set to rise by more than 40% by 2030 (Figure 7) and there are reasons to believe that this is an underestimate.29
Finally, we conclude that this target would need to be complemented by a basket of indicators that more directly reflect humanitarian priorities and poverty reduction goals to ensure action is directed at the most vulnerable in society. The next section considers the design of such a basket of indicators.
2.4 A basket of indicators of economic resilienceIn this section, we propose a basket of indicators that could complement the target proposed in Section 2.3 (or another target). ODI suggests there are five criteria for an effective indicator:
1. Can progress be measured every year?
2. Do reliable, comparable, disaggregated data already exist or can they be developed?
3. Is measurement likely to be relatively transparent/corruption free?
4. Is there capacity to measure progress everywhere or can it be developed easily?
5. Does the indicator link to the target?
Indicators should be more focused on specific
Note: Since 1980, total losses have exceeded $2.4 trillion globally.
21
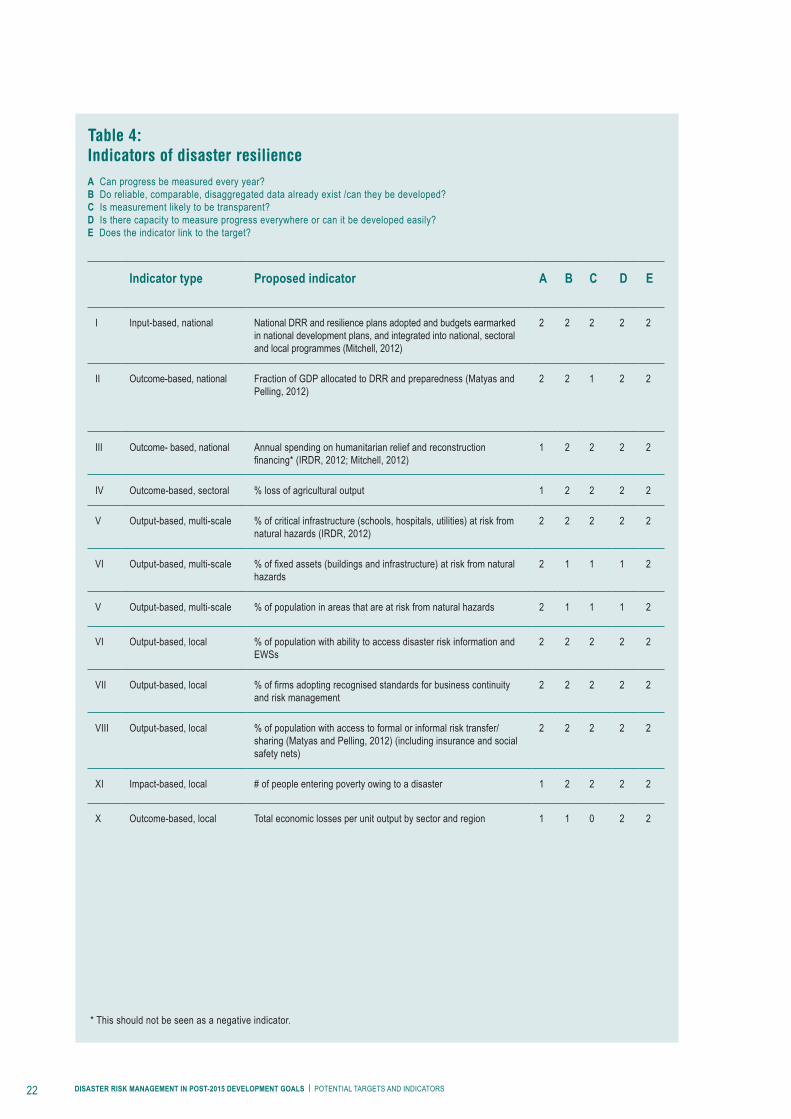
Table 4: indicators of disaster resilienceA Can progress be measured every year? B Do reliable, comparable, disaggregated data already exist /can they be developed? C Is measurement likely to be transparent? D Is there capacity to measure progress everywhere or can it be developed easily? E Does the indicator link to the target?
Indicator type Proposed indicator A B C D E
I Input-based, national National DRR and resilience plans adopted and budgets earmarked in national development plans, and integrated into national, sectoral and local programmes (Mitchell, 2012)
2 2 2 2 2
II Outcome-based, national Fraction of GDP allocated to DRR and preparedness (Matyas and Pelling, 2012)
2 2 1 2 2
III Outcome- based, national Annual spending on humanitarian relief and reconstruction financing*(IRDR,2012;Mitchell,2012)
1 2 2 2 2
IV Outcome-based, sectoral % loss of agricultural output 1 2 2 2 2
V Output-based, multi-scale % of critical infrastructure (schools, hospitals, utilities) at risk from natural hazards (IRDR, 2012)
2 2 2 2 2
VI Output-based, multi-scale %offixedassets(buildingsandinfrastructure)atriskfromnaturalhazards
2 1 1 1 2
V Output-based, multi-scale % of population in areas that are at risk from natural hazards 2 1 1 1 2
VI Output-based, local % of population with ability to access disaster risk information and EWSs
2 2 2 2 2
VII Output-based, local %offirmsadoptingrecognisedstandardsforbusinesscontinuityand risk management
2 2 2 2 2
VIII Output-based, local % of population with access to formal or informal risk transfer/sharing (Matyas and Pelling, 2012) (including insurance and social safety nets)
2 2 2 2 2
XI Impact-based, local # of people entering poverty owing to a disaster 1 2 2 2 2
X Outcome-based, local Total economic losses per unit output by sector and region 1 1 0 2 2
* This should not be seen as a negative indicator.
22 Disaster risk ManageMent in Post-2015 DeveloPMent goals | Potential targets and indicators

2.5 Final thoughtsIn this chapter, we have appraised a range of possible indicators of economic resilience. A full analysis of the advantages and disadvantages of economic indicators relative to other types of indicators is beyond our scope, but we are able to draw the following conclusions:
1. Economic indicators are important in capturing the immediate and long-run impacts of disasters on development, human security and poverty, and may help motivate action to reduce risks ex-ante from a broad range of actors. An outcome-based indicator like economic loss could therefore be a highly relevant target within the post-2015 framework.
2. However, outcome-based indicators do come with measurement challenges. Particularly important for the post-2015 framework is the problem that progress cannot be monitored annually without using complex and expensive models. To make these indicators operational will also require a significantinvestmentincapacityatinternational,national and local levels (which could itself be beneficial).Inassessingthesuitabilityofeconomicloss as a target for resilience, one must weigh up its high relevance with the operational challenges involved.
3. To help overcome these challenges, we recommend complementing the target with a basket of indicators thatmonitormorespecificactionsanddriversofresilience, like annual spending on DRR, that are more easily measurable on an annual basis.
4. Finally, economic indicators and targets should be complemented by a range of indicators that more directlyreflecthumanitarianprioritiesandpovertyreduction goals. Economic indicators alone do not capture the humanitarian impacts of disasters well. Complementing an economic target with a broader set of indicators should ensure that action is focused appropriately.
actions, for example ‘DRR integrated within the national development plan’, and should aim to motivate appropriate action at the national, sectoral and local scales. They should also capture the main risks (e.g. risks to the agriculture sector) and priorities (e.g. reducing poverty). The basket of indicators will therefore need to be tailored to a country, sector or locale.
We propose a possible basket of indicators, drawing on those already used today (Table 4). We have limited the number to 10 for simplicity and ranked each against the 5 ODI criteria (0 = not at all, 1 = somewhat, 2 = definitely) as in Section 2.3.
From the list given in Table 4, different actors (firms, sectors) and countries can select the most appropriate three to five indicators for their circumstances. For example, a HIC might select Indicators I, II, V, VIII and X. A low-income agricultural economy might select Indicators, I, II, III, IV and XI.
Note that all the indicators given in Table 3 could also be added to this list. In addition, many of the existing MDG indicators will be indicators of resilience to natural hazards, for example proportion of the population below $1 per day (Indicator 1.a) and proportion of the urban population living in slums (Indicator 7.10).
23
Chapter 2 Endnotes
1 For example, economic resilience to disasters is relevant to MDG 2 ‘Eradicate extreme poverty and hunger’ and MDG 7 ‘Ensure environmental sustainability’.
2 The concept of economic vulnerability and resilience is subject to some debate. It is often considered ‘the positive connotation of vulnerability’ (Matyas and Pelling, 2012); accordingly, Briguglio et al. (2008) define economic vulnerability as ‘the exposure of an economy to exogenous shocks’. Matyas and Pelling (2012) suggest that the positive connotation of vulnerability is too narrow a definition for resilience, preferring to see it as a process than an outcome, including, for example, measures to reduce risks before a disaster strikes (including hard and soft protection) and reduce the impacts of an event when it occurs (social safety nets, emergency planning and insurance).
3 For example, poorer communities are typically more dependent on natural capital and climate-sensitive sectors, like agriculture and fisheries. They also usually invest far less in DRR and preparedness.
4 While in the developed world, more than 40% of economic loss from natural hazards is covered by insurance, in developing countries around 97% of the cost falls on national governments and local firms and communities (Hoeppe and Gurenko, 2006).
5 All economic values here are given in 2010 US$ unless otherwise stated. These values represent only the direct losses, such as damage to infrastructure and property, and do not capture the indirect economic impacts, such as the loss of long-term productivity and reduced economic growth.
6 There is no evidence that climate change has played an important role (Handmer et al., 2012). Data issues and the inability to quantify trends in vulnerability mean it is difficult to draw out any firm conclusions on trends resulting from climate change.
7 http://www.worldbank.org/en/news/feature/2012/05/30/rio-20-natural-capital-accounting-feature
8 This framework was based on the classic livelihoods perspective and later supplemented with recognition of the importance of political economy, including governance structures (Dercon, 2012).
9 Some disaggregation will be desirable to identify weaknesses and inform policy.
10 For example, global losses used by the Intergovernmental Panel on Climate Change (IPCC), national losses used by the UN International Strategy for Disaster Reduction (UNISDR) (e.g. in its Global Risk Assessments and HFA Monitor), regional losses used by the World Bank (its hotspots study) and household- and firm-level losses used by the insurance industry.
11 Different aspects of loss estimates have differing quality, and there is little consistency in accounting methods between databases. For example, insured losses are most accurate (but limited geographically), while estimates of indirect losses are patchy; Pelling (2006) and Matyas and Pelling (2012) highlight that some aspects of loss, such as damage to informal housing and impacts on livelihoods, are missing. Existing databases also tend to be biased toward large (intensive) events, while the smaller and more frequent (extensive) events are missed from records
12 For example, too much emphasis on losses from intensive events could lead to decisions that put more emphasis on social safety nets and insurance and less weight on ex-ante risk reduction. Not representing indirect losses could mean investments to reduce long-run impacts on development are foregone.
13 For example, the large year-to-year variability in Figure 3 (which is far ‘noisier’ at local scale). Some have tried to overcome this problem by studying loss per event, but to truly correct for event occurrence one would need to normalise for event magnitude, size, where it strikes and all the other unique circumstances. This would require data series longer than currently exist. Calculating loss per event does have the advantage of removing some of the influence of climate change from trends.
14 Normalised loss accounts for factors such as differences in population densities, capital assets and the size and frequency of events (etc.) to give a ‘purer’ estimate of resilience.
15 http://www.desinventar.org/16 For example, modelling of the response of different crops to rainfall
variability or the damages to infrastructure caused by flooding will be simplified and so could misrepresent true risk. Risk models to date have typically focused on direct economic losses, and not captured indirect impacts.
17 Clarke (2012) take this to the next level, by proposing a hybrid indicator that combines actual and modelled losses numerically to smooth annual loss trends. A challenge here is simplicity and transparency.
18 http://www.globalquakemodel.org19 http://www.ecapra.org20 For example, one would need to estimate the baseline rate of
economic growth and level of poverty if the disaster had not occurred to create a meaningful indicator of resilience.
21 Indicators are ‘deductive’ rather than ‘inductive’ and so are less reliant on actual loss data (Pelling, 2006).
22 We add to this that targets should be measurable; the most powerful of the original MDGs were those that had clear, specific and measurable outcomes, such as the reduction in maternal deaths in childbirth (Muir-Wood, 2012).
23 The reader will note that we have reduced the ambition of the proposed targets compared with the targets outlined in the literature (Annex 2).
24 This was a conclusion of the expert review of the targets. See also Section 2.2.
25 From Mitchell, 2012, UNISDR and DIFID/ODI workshop, London, December 2012
26 Progress could be measured at interim periods (e.g. 2010-2020 and 2015-2025).
27 Extending the target to also cover indirect losses would draw attention to the need to act to reduce the drivers here (including, e.g., preparedness, EWSs and social safety nets), which is crucial for poverty alleviation and securing development gains.
28 Indeed, this level is likely to be different between countries.29 Over the coming two decades, we expect continued growth in
population and wealth, but an increasingly large portion of this growth will be focused in LICs and lower-middle-income countries (LMICs), which are more vulnerable to natural hazards, and in urban areas, which tend to be located in more hazard-prone areas near coasts and rivers (UNISDR, 2009a). At the same time, climate change will, on average, increase the intensity of weather extremes, pushing losses to even higher levels.
24 Disaster risk ManageMent in Post-2015 DeveloPMent goals | Potential targets and indicators

Chapter 3
25

Disaster Deaths
Debarati guha-sapir and Philippe Hoyois Centre for Research on the Epidemiology of Disasters
Proposed indicators for monitoring disaster-related mortality

Executive summaryDisaster deaths serve as an immediate proxy measure of disaster severity and are reported systematically. Data from the Emergency Events Database (EM-DAT) show there are patterns in deaths, and they vary significantly between disaster types and the socioeconomic contexts in which they occur. Stronger evidence on determinants of death, especially at the community level, is needed.
Disaster impact databases that systematically compile physical characteristics and human impacts for all disasters and all countries exist and are used widely. Regional and disaster-specific databases are also available; these are more specialised. Frequency of use by multiple stakeholders and public visibility are a major incentive for data units to maintain quality and encourage sustainability. But the main barrier to reliable data is the lack of standardised terms and definitions of basic concepts such as ‘disaster’ and the shortage of quantifiable impacts. Two global datasets, EM-DAT and Munich Re, have worked together to harmonise their disaster terms and classification categories, but international norms are a prerequisite for reliable reporting.
Priority areas that require resolution for the mortality monitoring process to be more accurate, credible and comparable are as follows
● Multiple sourcing of mortality data and use of triangulation techniques with different data sources, such as satellite, population grids and sample surveys, will enhance accuracy and reduce bias in mortality indicators.
● Definition of appropriate baselines that represent the counterfactual level of mortality is needed for comparisons for long-term disasters such as droughts or famines.
● Exploration and testing of predictive models in developing country settings are key.
In this chapter, we present an overview of mortality and its drivers in disasters, the main gaps and priorities to improve reliability of mortality data and, finally, six mortality indicators, which can draw on existing data sources.
3.1 natural disasters: global overview Between 1961 and 2010, natural disasters affected a global annual average of 129.6 million people,1 according to EM-DAT.2 These disasters claimed an average of almost 99,000 lives per year – of people who died as an immediate consequence of the event. This figure excludes those who died after the emergency phase, from disaster-related food shortage and disease outbreaks, which could potentially add substantially to the death toll. The greatest share of the increase is claimed by climate-related disasters, which have increased from an annual average of 77% of all disasters in 1980-1989 to 84% from 2000 (Figure 7).
Although there has been little increase in the occurrence of geophysical disasters such as earthquakes, data from EM-DAT suggest that mortality per event may be increasing (Guha-Sapir and Hoyois, 2013). Population density in cities and in areas with high geophysical risk has increased since 1950, and half of the large cities inthedevelopingworldarevulnerabletofloods,severe storms and earthquakes (Noji, 2005; Pelling, 2003). Asia is the region that has the highest numbers of reported disasters and affected populations. Population density, earthquakes and storms are the main drivers of this increase in mortality. On the other hand, numbers of deaths per flood event are increasing, suggesting an escalation in their severity.
Deaths as a result of disasters are used widely as an immediate proxy measure for the severity of the event and therefore reported systematically. Humanitarian aid and aid for preparedness and prevention often use mortality as a lever for decision making and resource allocation. At national and local levels, disaster mortality is a strong incentive for the development of DRR and preparedness programmes. At all levels, operational mortality indicators are highly policy relevant but need to take into account hazard specificities.
27XXX

mortality and for which little can be done in terms of primary prevention.
First, the type of onset of a disaster can be a determinant of mortality, as the predictability of a disaster influences the possibilities of evacuation or protective action acts, and therefore also the event-related mortality. Earthquakes are a good example of mortality being high largely because of their short prediction notice and, therefore, time for protective action. In contrast, slower-onset events such as droughts and floods are more predictable and generally cause fewer deaths. However, as start and end periods are difficult to define, longer-term mortality from these events is often underestimated.
Most disaster types can be classified by their onset characteristics and therefore their mortality potential. Duration will also influence mortality, as protracted effects of a disaster will increase the exposure of
3.2 variations in death tolls Since the 1980s, the trend in numbers killed and affected by disasters per million population has been increasing (Figure 8). Disaggregated analyses indicate the trend is most pronounced for floods and earthquakes. Many factors play a role in determining the levels of mortality from a hazardous event; some are intrinsic to the hazard, some are a function of the context that makes it a disaster.
Factors that are intrinsic to the hazard and influence mortalityHazards that bring on a disaster present physical characteristics that have a specific influence on
Figure 7: Trends in climato-hydro-meteorological and geophysical disasters, 1985-2011
(absolute numbers and polynomial regression lines)
Sour
ce: E
M-D
AT.
0
200
150
250
300
350
400
1985 1990 1995 2000 2005 2010
Climatological, Hydrological, Meteorological Geophysical
Num
ber
of d
isas
ters
100
50
28 Disaster risk ManageMent in Post-2015 DeveloPMent goals | Potential targets and indicators
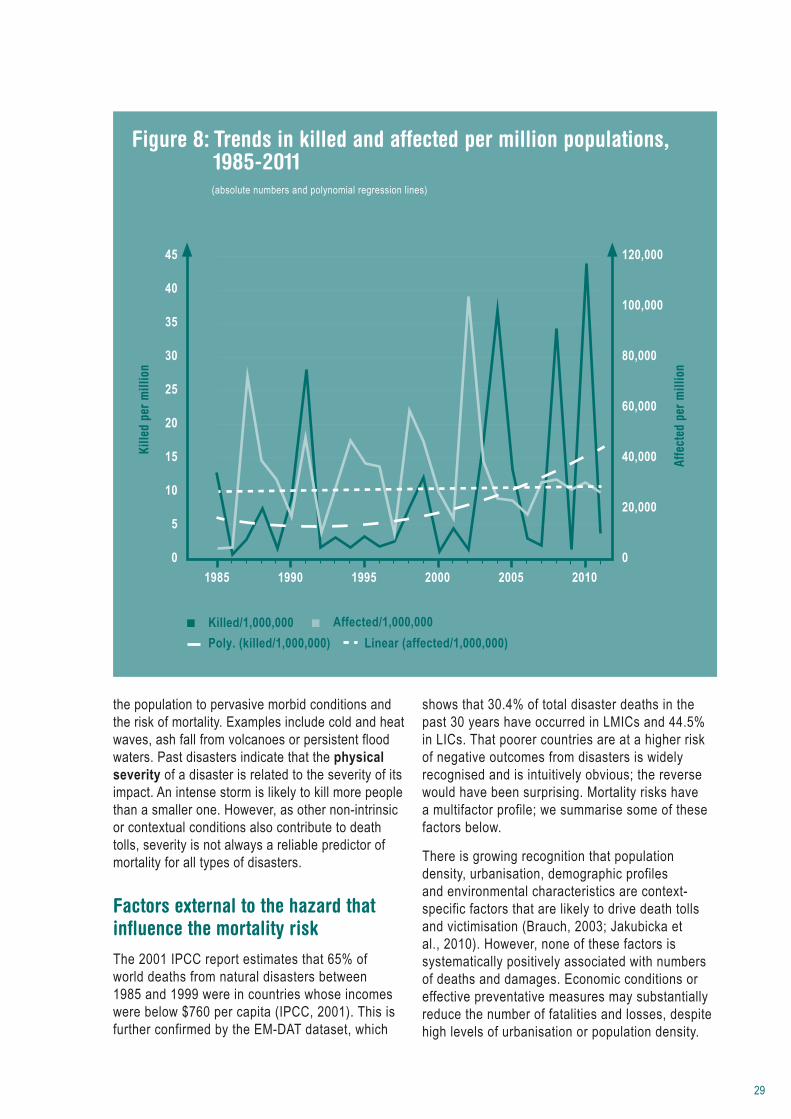
shows that 30.4% of total disaster deaths in the past 30 years have occurred in LMICs and 44.5% in LICs. That poorer countries are at a higher risk of negative outcomes from disasters is widely recognised and is intuitively obvious; the reverse would have been surprising. Mortality risks have a multifactor profile; we summarise some of these factors below.
There is growing recognition that population density, urbanisation, demographic profiles and environmental characteristics are context-specific factors that are likely to drive death tolls and victimisation (Brauch, 2003; Jakubicka et al., 2010). However, none of these factors is systematically positively associated with numbers of deaths and damages. Economic conditions or effective preventative measures may substantially reduce the number of fatalities and losses, despite high levels of urbanisation or population density.
the population to pervasive morbid conditions and the risk of mortality. Examples include cold and heat waves, ash fall from volcanoes or persistent flood waters. Past disasters indicate that the physical severity of a disaster is related to the severity of its impact. An intense storm is likely to kill more people than a smaller one. However, as other non-intrinsic or contextual conditions also contribute to death tolls, severity is not always a reliable predictor of mortality for all types of disasters.
Factors external to the hazard that influence the mortality risk The 2001 IPCC report estimates that 65% of world deaths from natural disasters between 1985 and 1999 were in countries whose incomes were below $760 per capita (IPCC, 2001). This is further confirmed by the EM-DAT dataset, which
Figure 8: Trends in killed and affected per million populations, 1985-2011
(absolute numbers and polynomial regression lines)
0 0
100,000
20,000
80,000
60,000
40,000
120,000
5
10
15
20
25
30
35
40
45
1985 1990 1995 2000 2005 2010
Kille
d pe
r m
illio
n
Affe
cted
per
mill
ion
Killed/1,000,000 Affected/1,000,000Poly. (killed/1,000,000) Linear (affected/1,000,000)
29

3.3 gaps and prioritiesScientificallysound and harmonised definition of a disaster and its classification is a main barrier today to reliable disaster impact indicator monitoring. Among the global databases, Munich Re NatCat and EM-DAT have harmonised between them the classificationanddefinitionofterms,andSwissRe joined the discussions in 2011. While many other policy studies and reports use the EM-DAT definitionforadisaster,thereisundoubtedlyaneedtoreviewthisandotherdefinitionsandeventuallytoreformulateittoreflectglobalrequirements,whilestillkeepingitquantifiable.Althoughmeetingalltheseconstraints is not easy, this should be a feasible goal.
Second, unavailability of age/sex distributions of mortality is a major barrier to understanding the risks of mortality, and therefore designing effective DRM/DRR programmes. Field experience indicates that obtaining this information for all disasters in all countries is probably not a realistic option. However, systematic sample surveys could be a powerful tool to fill this gap in knowledge. Experience from the widely used SMART sample surveys (http://www.smartmethodology.org/) in conflict settings could be useful.
Third, population exposure estimates by hazard and by country are central to sounder and more accurate calculation of indicators, as using national populations as denominators can be misleading in larger countries. Such estimates should be made available by country and by hazard type for the calculation of indicators.
Fourth, as the severity of an event can play an important role in its impact, common severity indices or reference guidelines need to be developed based on currently available severity measurement tools (Annex C).
Fifth, although the severity of a disaster plays an important role as a determinant of mortality, institutional frameworks, governance structures and other developmental characteristics may be stronger drivers of disaster impact (Anbarci et al., 2005; Escaleras et al., 2007; Keefer et al., 2011). Corruption, for example, particularly in the construction sector, is likely to be associated with earthquake mortality, as most deaths owe to building collapse and non-compliance with building codes (Kaisin, 2012).
Second, the effectiveness of local preparedness measures to reduce the risk of mortality requires evidence on the factors that determine mortality, without which such measures are based on stereotypes. Moreover, preparedness measures such as EWSs must be better linked to early action – a lesson from the 2011 Horn of Africa drought, whose death toll remains to be estimated (Kim and Guha-Sapir, 2012). EWS without community awareness of protection options or effective dissemination also aggravates death tolls, as illustrated by the impact of Cyclone Nargis in Myanmar (Webster, 2008).
Third, demographic characteristics and civil status are important risk factors for mortality. Women, children, the elderly, non-documented immigrants, slum dwellers and the poor may be at higher mortality and morbidity risk, and policies to target them will be required (Bourque et al., 2007; Tierney et al., 2001). Sounder evidence on the indisputable vulnerability of women and children is required, as this group can account for nearly 70% of a developing country population (Doocy et al., 2007). For industrialised countries there are few cause-of-death studies, but studies on the 2003 heat wave in Western Europe (Cadot et al., 2007) and the east Japan tsunami (Tatsuki, 2013) suggest that, in these settings, the elderly may be at particularly elevated levels of risk. The identification of population subgroups that are at a higher relative risk of mortality needs objective evidence through specific and well-designed studies (Sawai, 2011).
Mitigating these and other risk factors is feasible if DRM/DRR policies are based on reliable and time series data on impact at global, regional and sub-national levels. Global, regional and disaster-focused databases include the following:
● EM-DAT (www.emdat.be/) ● Munich Re NatCat (www.munichre.com/
en/reinsurance/business/non-life/georisks/natcatservice/default.aspx)
● Suisse Re Catnet (www.swissre.com/clients/client_tools/about_catnet.html)
● Dartmouth Flood Observatory (http://floodobservatory.colorado.edu/)
● USGS earthquake catalogues (http://earthquake.usgs.gov/regional/neic/)
● DesInventar (http://www.desinventar.org/)
30 Disaster risk ManageMent in Post-2015 DeveloPMent goals | Potential targets and indicators

3.4 Proposed mortality indicators In this section, we propose a set of mortality indicators for global monitoring of disaster-related mortality. These have realistic data requirements and would provide a credible evidence base for policymaking. A primary target of DRM should be to reduce disaster-related deaths, and mortality indicatorsareadirectreflectionofthesuccessofsuchprogrammes. The indicators below should provide the minimum information required to assess whether a disaster-prone region is reducing the mortality impact of natural hazards.
Concerning the target for monitoring mortality indicators, generally, death tolls from disasters as a broad concept can be understood similarly
Finally, while past impact data help establish risk factors and provide insights into trends over the past decades, their ability to predict future scenarios is limited, especially for certain types of disasters. Simulation models based on sets of assumptions can provide valuable support in targeting preparedness and prevention. Earth scientists, engineers and meteorologists have made much progress in these areas (e.g. Coburn and Spence, 2006; Wald et al., 2005). In general, these models are tested against observed data to establish their precision and accuracy. These models need to be further developed with multidisciplinary inputs, and specificallyforlow-resourcesettingsorurbanareasin the developing world. Uncertainties need to be well described to ensure investments in low-resource setting obtain the maximum value for money. DRM/DRR policies that combine observed data with predictive models can substantially enrich monitoring and prevention of mortality.
Table 5: Proposed mortality indicators
Data component Indicator name Target Comment
Crude disaster-related mortality rate
# of dead as a result of all disaster divided by those exposed to all disaster
● 50% reduction in high-frequency disasters in 5 years
● 15% reduction in disasters that have low warning potential in 10 year
● Return times of certain disasters such as earthquakesortsunamiswillinfluencethe target
● Agreement needed on standard methods to estimate exposed populations
Disaster-specificmortality rate
# of dead per # exposed by disaster type
30% reduction in most frequent disaster in the country in 5 years
Same as above
Composite impact index Weighted index of death and economic losses
Statisticallysignificantdownwardtrend in index measured every 5 years
Useful for international comparisons and to ensure wealthy countries with high-value assets and low deaths and poor countries with low-value assets and high deaths are comparedonalevelplayingfield
Cause-specificmortalityrates
% medical causes of death
30% reduction in main causes of mortality from disasters in 5 years. Countries may choose disasters that have the greatest impact
Prevention and preparedness especially for life-saving purposes require an understanding of cause of death from disasters
Age-/sex-specificmortality rates
Deaths by age and sex categories
75% of reports present deaths by age and sex in 5 years
Children (0-15 years), adults of working age (16-50 years) in poor communities), those 50 years and above. Sample surveys could be considered for selected large-scale disasters toestablishage/sexprofiles
Public infrastructures specificmortalityrates
#ofdeadinspecifiedpublic infrastructure
75% reduction in 10 years. Downward trend during this time
Schools (children), critical infrastructures (administrations,hospitals,firebrigadesetc.)
31
There needs to be further research with regard to ways in which the indicators should be formulated and presented. Multi-year mortality rates or moving averages could be more useful than annual rates, since these will smooth high annual variability and diminish the impact of infrequent return period disasters. Another example would be use of an indicator calculated on ‘conditional’ mortality that uses ratesonlyfromdisastersoveraspecificseverity,such as mortality from storms above a wind strength threshold. These types of indicators would then focus onlyoneventsabovedefinedthresholdsofhazardseverity scales.
Finally, different regions and different disasters may require different formulations of indicators. For example, the mortality risks for earthquakes are not thesameasthoseforriverfloods,andmayrequiredifferent indicators – especially if they are to serve policy on preparedness and prevention.
3.5 ConclusionEstablishing targets and monitoring indicators presupposes a strong and reliable data system withscientificallyrobustmethodsanddefinitions.That said, most countries that pay the highest price for disasters in terms of lives and livelihoods have few resources to undertake and maintain credible data systems. Therefore, a solution that is realistic for such countries and sustainable in the long run should be envisaged. A joined-up regional effort that uses a combination of approaches – systematic data collection, simulation predictive models of impact, systematic sample surveys – can ensure credible monitoring of progress.
by the media, politicians, communities and other stakeholders. It is only at detailed analytical levels that the concepts can become more complex. Often, these complexities can be academic and of less relevance for operational purposes. Disaster mortality rates can be communicated clearly in simple terms, in this case numbers of dead per population group. Societal sensitivity to disaster mortality makes this target highly acceptable to stakeholders, including politicians in most forms of government. With such undeniable readability, the focus on death tolls and on their reduction can be a strong incentive to tailor DRM/DRR with broad support of exposed communities.
With regard to the proposed targets, high disaster death tolls in poor populations and their subsequent impact on survivors (Cas et al., 2011; Rodriguez-Llanes et al., 2011) make effective disaster mortality reduction a priority in poor countries, especially from developmental perspectives. In these settings, capturing the full cost and implications of disaster mortality is crucial so that disaster losses can be weighted correctly against competing priorities of a more immediate nature.
Concerted action between health, social services, public infrastructure and civil society can make a substantial difference in terms of mortality reduction in all types of economies, one that can be measurable. Focusing on reductions by age/sex will also contribute to a reinforcement of human rights. Reducing deaths by a certain percentage or targeting a declining trend in disaster-related mortality should be simple to understand for politicians and community members.
With regard to indicators, disaster mortality rates have to be adequately standardised to allow for comparisons across countries and time. At this time, data exist to allow calculation of most of the indicators proposed,butmuchcanbedonetofillimportantgaps (harmonised methods, age/sex data, exposure estimations), discussed above. Transparency of disaster mortality is an issue, since increasing tolls to heighten the chances of attracting international aid or reducing them for political expediency cannot be excluded. Triangulation of data sources, proposed earlier, is one way to increase transparency. Capacity to measure progress will depend on the technical capacity of the data source organisation. It will require sustained expertise to ensure objective collection and validation of data and the production of useable analysis over the long term. Ideally, DRM/DRR programmes should provide measurable inputs and baselines for benchmarking progress.
Chapter 3 Endnotes
1 Natural disasters are triggered by a natural hazard and alter severely the normal functioning of a community or a society requiring immediate emergency response and possible external support for recovery. Without severe alteration, the event cannot be considered as a disaster. See IPCC (2012)
2 EM-DAT defines a disaster as an event that has either 10 killed or 1, 000 affected, or a call for international assistance.
32 Disaster risk ManageMent in Post-2015 DeveloPMent goals | Potential targets and indicators

Chapter 4
33

Disasters and their impact on poverty
Daniel Clarke and robert reid World Bank1
Assessment of options for disaster-related poverty targets

4.1 introductionDisasters can reverse gains made in poverty reduction, throwing large numbers of vulnerable and marginalised households, previously above the poverty line, into poverty. Disasters affect the poor and vulnerable disproportionately, especially women, children, the elderly and those recovering from the impact of conflicts. Very often, it is those living on the fringe of society without adequate coping mechanisms (savings, insurance, social safety nets, family etc.) who are most vulnerable to the impacts of disasters, and are most likely to fall into poverty through the consequences of disasters. For example, case studies carried out in Dar es Salaam, Jakarta, Mexico City and São Paulo found that, in all four cities, those living in informal settlements were most vulnerable to climate-related and disaster risks (World Bank, 2011a).
Although there is limited literature that directly correlates disaster impacts with poverty, some examples illustrate this effect. For example, in Haiti, the percentage of poor and extreme poor fell by more than 8% on average across the country between 2001 and 2010, but following the 2010 earthquake it was estimated that poverty had returned to the 2001 level, with 71% in moderate poverty and 50% in extreme poverty (Government of the Republic of Haiti, 2010). Similar findings are cited in analysis carried out following the 2011 drought that affected Djibouti, which suggests that post-disaster poverty levels in the country were probably even higher than 2002 levels, when extreme poverty was 42% and relative poverty 74% of the population (République de Djibouti, 2011).
When considering an overall objective of reducing or eliminating absolute poverty in the medium term, it is not enough to ensure households are free from absolute poverty most years – even short time periods spent in extreme poverty can have long-run consequences, both for health outcomes (particularly if there are young children in the household) and for livelihoods (particularly if households have to engage in forced selling of assets to meet basic consumption needs). In the language of poverty measurement, it is not enough just to eliminate chronic poverty, whereby households are in poverty (in that their welfare is below a given poverty line) for a number of consecutive years. Transitory poverty, whereby
households are in poverty in some years but not in others, must also be addressed, or growth out of chronic poverty may only be temporary.
If individuals and communities are able to build resilience1 to natural hazards and avoid falling into poverty as a result of disasters, these disaster-induced poverty spikes can be avoided, and growth out of chronic poverty can be protected. This chapter therefore suggests that a relevant indicator to measure progress towards building disaster resilience, particularly in the most vulnerable segments of society, can focus on impact indicators related to transitory poverty, in the context of the headline development goal to reduce/eliminate poverty.
The chapter addresses two aspects of DRM poverty indicators. First, we introduce two potential indicators for disaster-induced transitory poverty and argue that they would be measureable and clear, would capture disaster-induced poverty well and would incentivise both better understanding of the impact of risk on poverty and action to address causes rather than symptoms.
Second, we consider challenges with experience-based disaster indicators from the perspective of statistical theory, noting that year-to-year comparisons are difficult to make within a single country, as disasters are sporadic and can occur with varying intensity and frequency. We present a potential solution, drawing on advances by the insurance industry in using models that take into account (among other things) the probability of an extreme event of a given magnitude occurring in a given year. This chapter explores the feasibility of using such models in tracking national poverty reduction progress over time.
The proposed indicators are given below. There are, of course, alternative approaches that could be considered, but for the purposes of this chapter we restrict attention to the following:
● No increase in proportion of population in poverty;
● No additional people enter poverty; and ● Less than a 1-in-50-year chance a disaster will
return proportion of population in poverty to 2015 levels.
The above three indicators could each be applied to any underlying static poverty measure, such as the $1 per day (PPP) headcount poverty measure.
35
Of course, such measures would inherit challenges of the selected underlying poverty measure. For example, if a headcount poverty measure were used as the basis, the resulting dynamic indicator would not reflect worsening poverty for those already in poverty. Alternatively, other static poverty measures, such as the ‘material poverty’, ‘social poverty’ or ‘subjective poverty’ measures proposed in Chapter 6, could be used as the poverty measure underlying the above indicators.
This chapter is not advocating for one approach over another, and we are aware that there are approaches to track disaster resilience progress over time. For example, input- and output-based indicators of resilience can also be used to consider the extent to which countries have put in place means of reducing disaster risk, such as DRM strategies and action plans, safe schools, hospitals and critical infrastructure, EWSs, flood protection infrastructure etc. However, we leave aside the pros and cons of using such approaches, and instead focus on presenting and analysing a potential impact-based indicator for disaster-induced poverty.
4.2 Three potential indicators for disaster resiliencePoverty that lasts a long time is known as ‘chronic poverty’. By contrast, people who move into and out of poverty are said to experience ‘transitory poverty’ (CPRC, 2009). Table 6 presents a collection of evidence on transitory and chronic poverty.
Arif and Bilquees (2006) suggest that by emphasising exclusively on the measurement and targeting of chronic poverty, policymakers focus too heavily on structural changes in existing policies such as education, health and land reforms that aim to permanently enhance the incomes and assets of the chronic poor. However, an appreciation of the social cost of transitory poverty can make measures such as safety nets, credit and insurance schemes relatively more attractive, as such mechanisms can help protect the development gains of households.
Eradicating transitory poverty is evidently one component of eradicating poverty (which includes chronic and transitory poverty), and can be justified
both because being in poverty at a given moment in time is undesirable, but also because even brief periods in poverty can cause long-term problems for people, households and communities. This is especially true for disaster-induced transitory poverty, because disasters typically affect whole communities at a time, and traditional mechanisms for coping, such as relying on nearby friends and family, are of limited use.
For example, Alderman et al. (2006) estimate that the 1982-1984 drought in Zimbabwe resulted in surviving children completing 0.4 grades fewer of schooling and having lifetime earnings reduced by 14%. Dercon et al. (2005) estimate that the 1984-1985 famine in Ethiopia led to reduced consumption and distress sales that reduced income nine years later by 16% relative to counterparts who had not suffered to the same degree.
Indicators that accurately capture resilience to disasters could be effective at stimulating effective responses to the disaster-induced transitory poverty that can be devastating for households. In the remainder of this section, we present three potential indicators that attempt to do just this; we conclude the section with a comparison and summary. All three indicators capture dynamic aspects of poverty, and could be used with any static poverty measure that separates people into ‘in poverty’ and ‘not in poverty’ at a given moment in time.
‘no increase in the proportion of the population in poverty’The first indicator, ‘No increase in the proportion of the population in poverty’, focuses on the dynamics of poverty from the perspective of a country. If the indicator used a poverty definition that featured in another indicator (such as a $1 per day PPP definition of poverty), then no additional data would need to be collected; one would just use these data to target not only reductions in poverty but also the protection of gains.
Of the three indicators, this would be by far the simplest to measure. However, unlike the two other potential indicators, it would not stimulate the collection of additional data that could be useful for targeting resources, and would not be directly attributable to disaster impacts.
36 Disaster risk ManageMent in Post-2015 DeveloPMent goals | Potential targets and indicators
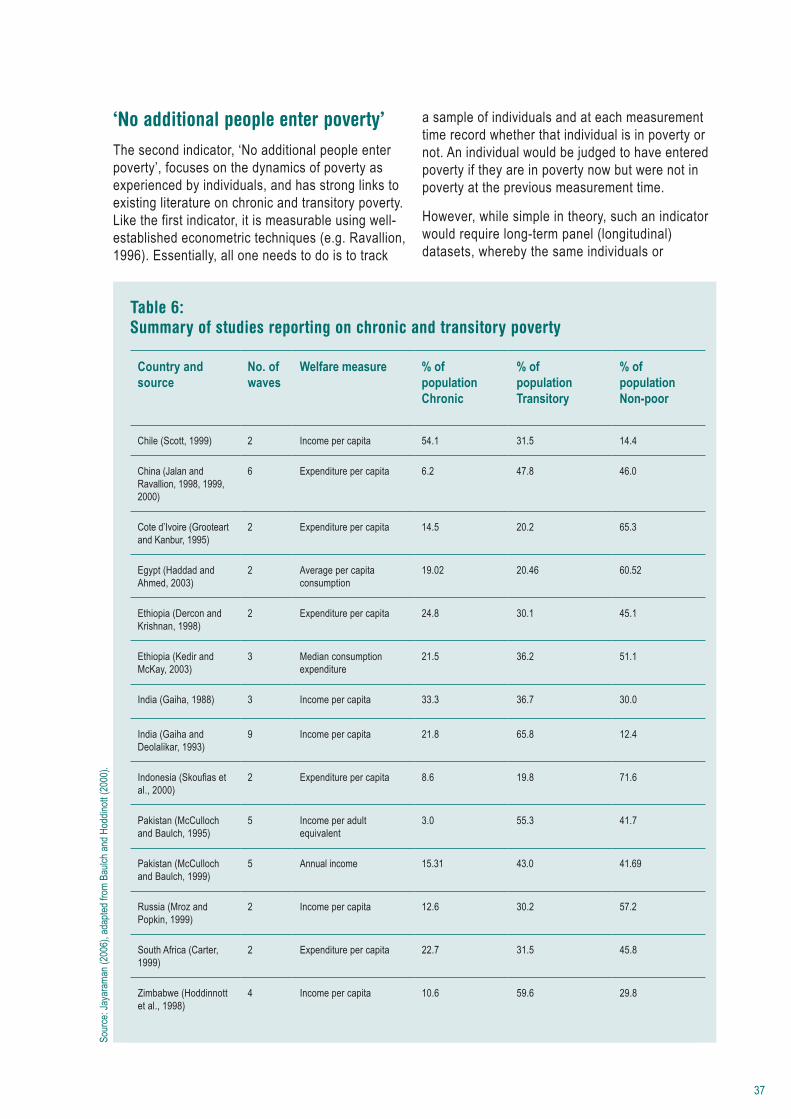
a sample of individuals and at each measurement time record whether that individual is in poverty or not. An individual would be judged to have entered poverty if they are in poverty now but were not in poverty at the previous measurement time.
However, while simple in theory, such an indicator would require long-term panel (longitudinal) datasets, whereby the same individuals or
‘no additional people enter poverty’The second indicator, ‘No additional people enter poverty’, focuses on the dynamics of poverty as experienced by individuals, and has strong links to existing literature on chronic and transitory poverty. Like the first indicator, it is measurable using well-established econometric techniques (e.g. Ravallion, 1996). Essentially, all one needs to do is to track
Table 6: summary of studies reporting on chronic and transitory poverty
Country and source
No. of waves
Welfare measure % of population Chronic
% of population Transitory
% of population Non-poor
Chile (Scott, 1999) 2 Income per capita 54.1 31.5 14.4
China (Jalan and Ravallion, 1998, 1999, 2000)
6 Expenditure per capita 6.2 47.8 46.0
Cote d’Ivoire (Grooteart and Kanbur, 1995)
2 Expenditure per capita 14.5 20.2 65.3
Egypt (Haddad and Ahmed, 2003)
2 Average per capita consumption
19.02 20.46 60.52
Ethiopia (Dercon and Krishnan, 1998)
2 Expenditure per capita 24.8 30.1 45.1
Ethiopia (Kedir and McKay, 2003)
3 Median consumption expenditure
21.5 36.2 51.1
India (Gaiha, 1988) 3 Income per capita 33.3 36.7 30.0
India (Gaiha and Deolalikar, 1993)
9 Income per capita 21.8 65.8 12.4
Indonesia(Skoufiasetal., 2000)
2 Expenditure per capita 8.6 19.8 71.6
Pakistan (McCulloch and Baulch, 1995)
5 Income per adult equivalent
3.0 55.3 41.7
Pakistan (McCulloch and Baulch, 1999)
5 Annual income 15.31 43.0 41.69
Russia (Mroz and Popkin, 1999)
2 Income per capita 12.6 30.2 57.2
South Africa (Carter, 1999)
2 Expenditure per capita 22.7 31.5 45.8
Zimbabwe (Hoddinnott et al., 1998)
4 Income per capita 10.6 59.6 29.8
Sour
ce: J
ayar
aman
(200
6), a
dapte
d fro
m Ba
ulch a
nd H
oddin
ott (2
000)
.
37
attempts to tackle this limitation, although by doing so it introduces other challenges.
‘Less than a 1-in-50-year chance that a disaster will return the proportion of the population in poverty to 2015 levels’The third indicator, ‘Less than a 1-in-50-year chance that a disaster will return the proportion of the population in poverty to 2015 levels’, focuses on the 1-in-50-year disaster resilience of a country. This, if measured well, could focus attention on resilience to politically conceivable, but low-probability, disasters. Such an indicator offers substantial measurement challenges, but would provide an impetus for building probabilistic risk models in disaster-prone developing countries, which could be used to support informed investments in disaster resilience.
In choosing a strategy for measuring such an indicator, one must implicitly make a judgement about:
● How subjective development indicators should be;
● When we really learn about resilience: when events occur, and the level of resilience is demonstrated, or when an expert, or set of experts, judges that resilience has changed; and
● When events occur, what we really learn about resilience.
Mitchell (2012) and Muir-Wood (2012) propose potential disaster resilience indicators that could be used alongside disaster resilience goals. Broadly speaking, Mitchell (2012) takes an approach based on experience (what has happened), whereas Muir-Wood (2012) suggests an approach based on modelled variables (what the risk model predicts will happen on average).
An experience approach would estimate the 1-in-50-year disaster-induced poverty rate for a given year as the xth largest disaster-induced poverty rate over a 20x year period. As discussed by Muir-Wood (2012), the main challenge with this is that it would not account for ‘how bad the 20-year period was’ compared with what would be expected in the future. The indicator could be very high in a bad 20-year period or very low in a good 20-year period, and an
households are tracked over time. Although such data are increasingly common, they are not yet available in many countries. However, investing in such data would have substantial additional benefits for understanding and tackling poverty (Wadugodapitiya and Baulch, 2010), such as:
● Informing the effective design, targeting and implementation of anti-poverty policies;
● Enabling the monitoring and robust evaluation of policy; and
● Helping policymakers identify the policies that facilitate escape from poverty.
To measure disaster resilience under such an indicator, one would need a disaster to occur, and then for a new round of the panel survey to be collected in the aftermath of the disaster. This would allow an estimate of the effect of that disaster on individuals, and calculation of the number of people who have entered poverty following the disaster. Of course, the precise timing of the new round of the panel survey would affect the results, as, for example, some people may enter poverty as a result of the disaster but then be able to exit poverty before the survey, although the survey could be designed carefully in a way to account for this.
Another challenge of this approach to measuring disaster resilience is that it can be difficult to distinguish people entering poverty because of a disaster and people entering poverty after a disaster but owing to shocks and stresses other than the disaster itself. Regardless, in disaster-prone countries, disasters are likely to be a substantial cause of transitory poverty, and the collection of high-frequency data on poverty can help guide evidence-based actions, even if the data are imperfect.
A more pressing challenge with the above two approaches is that both would not account for the intensity of a disaster. This would mean that a 1-in-500 year high intensity disaster event would distort the trend, even if in relative terms the impact had been significantly reduced thanks to DRM measures put in place, such as in the case of the Great East Japan Earthquake and tsunami. Any such impact-based indicator will reflect recent historical experience, but this may not reflect (in a probabilistic sense) the true disaster resilience of a country, region or city. Our third proposed indicator
38 Disaster risk ManageMent in Post-2015 DeveloPMent goals | Potential targets and indicators

of incompleteness of the underlying exposure database. Probabilistic risk models would need to be updated throughout the period 2015-2030 to reflect changes in exposure, vulnerability and hazards, if the results were to accurately reflect the changing resilience.
Were probabilistic risk models developed for countries exposed to substantial disaster risk, it would be possible to run the models in the aftermath of a given disaster to sense-check the model. For example, one might report that an experience in a given country as bad as in year 2016 is estimated to occur once every 10 years (i.e. with probability 10%), or that an experience as bad as in year 2017 is estimated to occur once every 2 years (i.e. with probability 50%).
Comparing the indicatorsEach indicator has strengths and weaknesses
apparent downward or upward trend over the period 2015-2030 would be driven by the timing of disasters asopposedtoreflectingafundamentalchangeindisaster resilience.
A modelled approach (Muir-Wood 2012) would use a probabilistic model to estimate the average expected 1-in-50-year disaster-induced poverty rate over 100,000 ‘equally probable versions of next year’, using the exposure and vulnerability information for the current year. Purely modelled indicators may be smoother from year to year than experience-based estimates, but are subjective, in the sense that experts’ claims are unlikely to be empirically disprovable (in a probabilistic sense) over a 20-year period, will require continual updating of probabilistic risk models and may not reflect trends in actual resilience, particularly for perils like flood and drought, for which risk models are in their infancy. More generally, there is always a risk of model error, for example because
Table 7: Advantages and limitations of proposed targets and indicators
Advantages Indicator 1 No increase in proportion of population in poverty
Indicator 2 No additional people enter poverty
Indicator 3 Less than 1-in-20-year chance that a disaster will return the proportion of population in poverty to 2015 level
Measurable •
Clear / ?
Captures resilience to recurrent events
Captures resilience to low-probability events
(unless low-probability event occurs)
(unless low-probability event occurs)
Incentivises investments in collecting data that could support better understanding of the impact of risk on poverty
Incentivises action to address causes rather than symptoms
Low cost (annual panel survey) (probabilistic risk models)
Objective
39

from the perspective of capturing disaster-induced poverty (Table 7). As already discussed, over a 15-year period, Indicator 1 may capture changes in resilience to recurrent shocks quite well, but will (probably) not capture resilience to low-probability events. Moreover, it will not incentivise investment in data, with wide-reaching policy implications. Indicator 2 is also likely not to capture resilience to low-probability events, but could incentivise investment in data with many potential uses, albeit at a cost. Indicator 3 is subjective, potentially very expensive and perhaps less clear than the other two potential indicators, but has the potential to capture resilience to extreme events and, by doing so, support evidence-based investments to improve resilience to an even greater degree than the other two indicators.
4.3 ConclusionMonitoring progress towards building disaster resilience is challenging, but will enhance the quality of a post-2015 development framework by providing an evidence basis for action to ensure poverty reduction progress can withstand shocks and stresses, including disasters. A target of eliminating disaster-induced poverty could be considered legitimate under the overarching goal of poverty reduction, as could a broader target of eliminating all transitory poverty. Both targets could seek to address shocks and stresses that result in new poverty.
If the international community were to consider impact-based indicators to measure disaster resilience over time, then a modelled or hybrid approach could be considered in addition to raw impact-based indicators to account for varying levels of intensity and probabilities of natural hazards. The benefits and limitations of such approaches, as outlined above, must be recognised.
There is a need to find a balance between feasibility and accuracy of targets and indicators. Further work may be needed to consider input- and output-based indicators that measure the extent to which countries have implemented DRM measures, as well as or instead of measuring changing impact of disasters over time. Both options have their merits, and a combination of impact-level targets combined with input/output-level indicators could be the best path to pursue.
Chapter 4 Endnotes
1 Views expressed in this paper are the authors’ and should not be attributed to the World Bank or the Global Facility for Disaster Reduction and Recovery. Email: [email protected], [email protected].
2 ‘The ability of countries, communities and households to manage change, by maintaining or transforming living standards in the face of shocksorstresses–suchasearthquakes,droughtorviolentconflict–withoutcompromisingtheirlong-termprospects.’(Dfid2011)
40 Disaster risk ManageMent in Post-2015 DeveloPMent goals | Potential targets and indicators

Chapter 5
41xxx

Health in a Disasters goal
World Health Organization 2
The health imperative for disaster risk management: a discussion of key issues in the context of the global consultations on disaster risk reduction in the post-2015 development agenda1

Executive summaryProtecting human health is a key imperative in action to manage disaster-related risks and reduce the impacts of all hazards on communities. Many different hazards, such as natural and technological disasters, epidemic diseases and conflicts, have the potential to have substantial consequences for people’s health and well-being, and the functioning of health systems and societies at large. Improved health outcomes in emergency and disaster risk management is best obtained from multi-sectoral action by health systems and other sectors working together with all communities at risk of emergencies and disasters. Such collaboration helps reduce health consequences, particularly deaths, injuries, illnesses and disabilities. Building health system resilience and health sector capacities for emergency and disaster risk management, particularly at community level, is essential to effective multi-sectoral DRM, which also supports sustainable development.
Clear objectives for human health aspects of DRM, including monitoring and reporting with targeted health outcome indicators, is fundamental to measuring the impact of hazards on communities and to measuring the effectiveness of DRM measures implemented by all sectors. In preparation for the post-2015 development agenda, a wide range of indicators to address the health dimensions of DRM has been suggested. Indicators should take account of baseline health status, health service coverage and health systems functioning as well as those that specifically measure health consequences and health emergency and disaster risk management implementation. In considering which indicators have most traction and value, preference should be given, as far as possible, to data that are already collected and reported on a regular basis by countries, WHO and other bodies, including the World Bank. These include indicators related to health outcomes, national health emergency risk management programmes, safer hospital programmes (UNISDR, 2011a) and implementation of the International Health Regulations (IHR 2005) (WHO, 2008c). General descriptions of possible targets have been proposed that are aligned with above-mentioned indicators.
Further consultations with WHO Member States and partners are required on targets and indicators
on health aspects of the disaster theme, as well as on the advocacy for disaster-related indicators to be considered in consultations on health goals for the post-2015 development agenda.
5.1 introductionProtecting human health is a key imperative for reducing risks to communities from all types of hazards, including those that lead to emergencies and to disasters when they are on a scale that overwhelms the local capacities. Moreover, they can result in substantial consequences for health, including deaths, injuries, diseases, disabilities, psychosocial problems and other effects, such as damage to health facilities and disruption to the delivery of health services over extended periods. The adverse health effects from hazards can be avoided or reduced by the application of a wide range of risk management measures by health and other sectors working together with people who are at risk of these events. Health emergency and disaster risk management refers to the systematic analysis and management of health risks, posed by emergencies and disasters, through a combination of (i) hazard and vulnerability reduction to prevent and mitigate risks; (ii) preparedness; (iii) response; and (iv) recovery measures. It follows that human health outcomes, including mortality, injury, illness and disability, are fundamental to measuring the impact of disasters on communities and to measuring the effectiveness of DRM measures implemented by all sectors in communities and countries, and supported by regional and international entities.
Related to the issue of health within the broader disaster risk management theme, is that of health within the post-2015 development agenda (Global Thematic Consultation on Health, 2013). A recent draft report provides a summary of the main themes, messages and recommendations that have emerged from the global consultations held from September 2012 to January 2013 (ibid.). Various health goals have been proposed for inclusion in the post-2015 framework, with most discussion centring on: (i) maximising healthy life expectancy; (ii) universal health coverage; and (iii) a set of MDG-like health goals. The draft report also shows how health is linked to other thematic consultations, including disasters,
43

consequences and overwhelm local capacities. Not only are hazards often linked together, as seen in the March 2011 east Japan tsunami (triggered by a large earthquake M9) and the subsequent Fukushima nuclear accident, but also there are many common elements in managing the risks regardless of the hazard. The capacity of the health and other sectors must be enhanced to manage all types of hazards, which may have widespread effects for communities, including not just health.
The discipline of emergency and disaster risk management has many conceptual challenges that affect the scope of the discourse and the application of a standardised approach to all aspects of measurement. These challenges are associated with:
● The imprecision of the definitions and absence of a logical framework linking key terms, such as vulnerability, risk and risks, disasters, risk reduction, risk management and resilience;
● Descriptions of the scale of the potential or real impact of hazards on communities, from events that can be managed with routine arrangements (including health care), to emergencies and disasters that may require non-routine measures in health and other sectors, such as construction to higher standards and mass casualty management systems;
● Defining the range of hazards that could be considered in the scope of a discussion of disasters;
● The attribution of impacts to specific hazards, events and disasters, which may span hours, days, years or even decades;
● Defining the population at risk; and ● Delineating the range of measures for reducing
risks posed by hazards across the risk management continuum from prevention and preparedness to response and recovery, as well as enabling capacities such as policies and legislation, risk assessments and human resource management.
While some of these issues are explored in this and other chapters, there is a need for further analysis and consultations on these key issues in order to advance policy, practice and measurement considerations for the disaster theme of the post-2015 development agenda.
conflict and fragility; water; food and nutrition security; education; and energy. Further dialogue is required on linking the thematic areas of health and disasters, and on advocacy for disaster-related dimensions to be addressed in the consultations on the health theme for the post-2015 development agenda.
The aim of this chapter on the health imperative for DRM is to present key issues on health aspects of disaster risk management and to discuss possible indicators for consideration in the global consultations on DRR for the post-2015 development agenda.
5.2 Framing the discussionThe scope of this paper is influenced by approaches and principles that are informing the development by WHO and partners of a framework on emergency and disaster risk management for health and the discipline of health systems management. The framework is based on risk management, all-hazards, multi-sectoral, multidisciplinary, sustainable development and community-centred approaches, and on the application of ethical, humanitarian and human rights principles.
The framework refocuses actions by all sectors on managing risks rather than events to achieve better health outcomes for those facing the risk of emergencies and disasters. All measures or treatments that contribute to the management of risk are considered, including those aimed at hazard prevention, vulnerability reduction, building individual and community resilience, preparedness, response and recovery. There are many other capacities that are needed to support the implementation of risk treatments, including policies and legislation, financial resources, planning and coordination mechanisms, a competent health workforce, risk assessments, information management, risk communication, technical guidance on good practice, research and effective monitoring, evaluation and reporting.
All hazards - natural , biological and epidemic-related, technological hazards and conflict and other societal related- , should be considered within the scope of the theme of disasters as they all have the potential to cause significant health
44 Disaster risk ManageMent in Post-2015 DeveloPMent goals | Potential targets and indicators

affected in the immediate response, and possibly for many years. International consensus views disasters as barriers to progress on the health-related MDGs, as they often set back hard-earned development gains in health and other sectors.
The disruption of economic, social and governmental mechanisms may halt or hinder appropriate preparedness, response and recovery. The consequences from hazards may exacerbate systems that were previously failing or systems that are critical to seeking and providing health care (e.g. roads, power supply, water supply). A multi-sectoral approach to DRM is critical to assure that both direct and indirect risks to health have been addressed.
There is a wide range of human health effects associated with the impact of hazards on communities:
● Increased number of deaths and injuries; ● Population displacement; ● Missing persons; ● New cases of disease (e.g. respiratory
diseases, diarrhoeal diseases); ● New cases of disability; ● Increased number of cases of psychological
and social behavioural disorders; ● Possible food shortages and nutritional
deficiencies; ● Illness or injury among response personnel; and ● Disruption to routine care for non-
communicable disease (NCD) conditions such as chronic diseases (Keim MJ. and Abrahams J., 2012)
Annually between 2000 and 2009, an average of some 270 million people were affected by disasters from natural and technological hazards.3 Over 1.1 million deaths were recorded in 4,130 large-scale disasters from natural hazards (UNISDR, 2012). The incidence of natural disasters has been increasing and climate change will contribute to an increase in the risk of extreme weather events for millions of individuals, their homes, their communities and the infrastructure that supports them.
The International Federation of the Red Cross and Red Crescent Societies (IFRC) has estimated that between 1998 and 2007, there were nearly 3,200 technological disasters, with approximately
5.3 Managing the risks to human health from hazards, emergencies and disasters
impacts of Hazards on healthNatural, biological, technological and societal hazards put the health of vulnerable populations at risk and have the potential to cause significant harm to public health. Examples of these hazards include:
● Natural: earthquakes, landslides, tsunamis, cyclones/hurricanes, floods, droughts or extreme temperatures, forest fires;
● Biological: epidemic disease in humans, plants or animals, pandemic diseases, infestations of pests;
● Technological: building fires, structural collapses, chemical substances, radiological agents, transportation crashes; and
● Societal: conflict, stampedes, acts of terrorism.
Hazards may affect health directly or through the disruption of health systems, facilities and services, leaving many without access to health care in times of emergency. The pattern of health impacts varies among different hazards. These impacts may occur at various stages of a disaster event, including the immediate and direct consequences, as well as secondary consequences such as food shortages and damage to basic infrastructure such as water supplies and safe shelter, which are essential for health. The impact of hazards and their consequences may disrupt primary health care services, disease surveillance systems and the care of people with chronic conditions. Displaced populations may also be exposed to increased risks of communicable disease due to overcrowding and unsanitary conditions in evacuation shelters and camp settings. Furthermore, when there is damage to hospitals and other health care facilities or health workers are killed or injured, or leave the disaster affected areas owing to insecurity and violence, the delivery of health services can be seriously
45

● Hunger and malnutrition are in fact the number one risk to the health worldwide — greater than AIDS, malaria and tuberculosis combined. Undernutrition contributes to 2.6 million deaths of children under five each year – one third of the global total (UNICEF, 2011b). The vast majority of hungry people (98%) live in developing countries, where almost 15% of the population is undernourished (WFP, 2011).
● Among the key causes of hunger are natural disasters, conflict, poverty, poor agricultural infrastructure and over-exploitation of the environment (WFP, 2011).
vulnerabilities that modify health risksRisks can be described in terms of hazards, people’s vulnerabilities to hazards and the resources and capacities available to manage the related risks (Dfid, 2006). While the attention in DRM may naturally fall on the hazards, in many situations it is not the hazard that leads to a disaster, but the vulnerability and inability of the population to anticipate, cope with, respond to and recover from its effects. Human vulnerability entails a complex mix of issues that includes social, economic, health and cultural factors, which affect the level of exposure to a hazard and individual susceptibilities. It is this interaction between the hazards to which a community is exposed and the vulnerabilities and capacities of that community that will determine the ultimate impact of the disaster. “Risk” is the measurement of this interaction.
Key risk factors that can increase human vulnerability and can therefore increase the risk disaster-related morbidity and mortality include (Thomalla, F., 2006):
● Low income; ● Low socioeconomic status; ● Lack of home ownership; ● Single-parent family; ● Age: older than 65 years; ● Age: younger than 5 years; ● Female sex; ● Chronic illness; ● Disability;
100,000 people killed and nearly 2 million people affected (WHO, 2009b).
Epidemic diseases and other biological hazards are ever present. Major outbreaks related to new and re-emerging infectious diseases such as SARS, influenza (H1N1 and H5N1) and cholera have occurred during the past few decades with devastating effects on human health. Climate change is also expected to increase risk of water-borne and vector-borne diseases in both rural and urban areas.4
Complex emergencies, including conflict, continue to affect tens of millions of people, causing internal and external displacement of people. In 2010, there were an estimated total of 27 million persons who remained internally displaced by armed conflict across the world.
Health consequences of disasters also are typically greater in countries and communities with the least resources and where health status is already compromised by malnutrition or other factors. For instance:
● Over 1.5 billion people live in countries affected by repeated cycles of political and criminal violence and fragility (World Bank, 2011b). According to the Uppsala Conflict Database, there were 37 on-going conflicts worldwide in 20115.
● Societal disruption can lead to excessive deaths from violence, infectious diseases, malnutrition and complications from untreated chronic disease.
● Of the 20 countries with the highest childhood mortality rates in the world (UNICEF, 2011a), at least 15 have experienced civil conflicts over the past two decades. Similarly, 9 out of the 10 countries with the highest ratios of maternal mortality have recently experienced conflict (World Bank, 2011b).
● Two and half billion people are without access to improved sanitation – including over a billion who lack any sanitation facilities.6 Lack of sustainable and acceptable infrastructure increases the risk of water-borne disease. For example, in Africa, 115 people die every hour from diseases linked to poor sanitation and contaminated water. These situations are exacerbated in times of disaster and degradation or elimination of pre-existing systems7
46 Disaster risk ManageMent in Post-2015 DeveloPMent goals | Potential targets and indicators

response capacities related to not only gender but also socioeconomic factors, such as age, disability, mobility, social isolation, culture and ethnicity.
Three specific areas of vulnerability to disaster impacts from a health perspective are summarised below.
Non-communicable diseases NCDs are the leading cause of death globally, with roughly three-quarters of all NCD-related deaths occurring to aged populations (over 60) (WHO, 2011a). Cardiovascular disease, cancer, respiratory diseases and diabetes account for 80% of all NCD-related deaths. While NCDs affect all age groups and all regions, NCDs do not affect all populations equally.
The main problem from disasters for people with NCDs is that disasters can result in an acute cessation and disruption of therapy, due to a lack of access to drugs and/or health services, e.g. renal dialysis. Such an acute cessation can lead to life-threatening complications of the diseases, e.g. acute-on-chronic renal failure, diabetic crisis, stroke, myocardial infarct, and acute respiratory distress.
As the global population of individuals over 60 years continues to grow, it is essential to take a comprehensive approach to NCD prevention, diagnosis and management (WHO, 2008a). Early and ongoing cost-effective interventions aimed at the prevention and/or mitigation of the effects of NCDs should occur throughout the life course. Health professionals should be trained in identifying and diagnosing NCDs in their earliest stages (WHO, 2011a). Ensuring those that have NCDs are maintained on a course of therapy that effectively controls the disease will make them more resilient when the disaster occurs Appropriate management and follow-up care is essential to minimise mortality and morbidity from NCDs and to decreasing economic burdens on individuals and family units, especially when social and health systems and services can be disrupted following disasters.
Old age In the context of disasters and emergencies, careful consideration should be given to the ageing population. Recent data suggest increased vulnerability for ageing populations, especially those in LICs and MICs. Physical weakness, comorbidities and isolation can all make the ageing population increasingly vulnerable before,
● Nutritional status ● Immunisation status; and ● Social isolation or exclusion.
A major reason for vulnerability is the proximity of people to hazards. Recent demographic trends, coupled with unsustainable development and urbanisation, place more people at risk. By 2040, the global population is expected to have increased by 2 billion: from 6.9 billion in 2010, to 7.7 billion in 2020, and to 8.9 billion in 2040. The vast majority (95%) of this increase will result from population growth in less developed countries, which will increase from 5.7 billion in 2010 to 6.4 billion in 2020, and to 7.6 billion in 2040 (Government Office for Science, 2012). In the past 30 years, the proportion of people living in flood-prone river basins has increased by 114%, while the proportion of people living on cyclone-exposed coastlines has grown by 192%. Over half of the world’s large cities (2-15 million people) are highly vulnerable to seismic activity (UNISDR, 2011b). Development practice must be risk sensitive and take into account emergency and disaster risk management, including the implications for human health.
The burden of disasters falls disproportionately on vulnerable populations, namely, the poor, ethnic minorities, old people and people with disabilities. Worldwide, the loss of life from climate-related disasters is far higher among the less developed nations than it is in developed nations. Within each nation, including developed nations, poor people are the most affected (IPCC, 2007). Evidence suggests democracies and nations with less income inequality suffer fewer deaths from emergencies and disasters, indicating that political and governance change may be an important indicator of future risk (Kahn M. 2005). Reducing poverty is an essential component of reducing vulnerability to hazards. High-risk populations must be prioritised in targeted efforts to mitigate human vulnerability to hazards.
In many types of disasters and conflicts, women and girls face risks related to sexual assault and other forms of violence while health status and cultural traditions may hamper their ability to protect themselves (e.g. pregnancy, type of clothing, care-taker roles etc.) or to access health services. Thus, reporting on the health indicators for DRM needs to be differentiated to take account of variance in vulnerabilities, resilience and
47

reduction and preparedness measures, and failure to receive a range of services, including food, water, shelter and clothing – before, during and after emergencies (ACFID, 2005; Handicap International, 2005; Harris and Enfield 2003; WHO, 2005a; 2005b). Disability is a multi-sectoral issue and therefore, within the context of emergency risk management, health professionals need to coordinate with a range of sectors in order to increase the effectiveness of disability-related actions, and influence the overall health outcomes of people with disabilities.
5.4 Health in a multi-sectoral approach to disaster risk managementThe dialogues on the post-2015 development agenda, including the Rio+20 Conference, have highlighted the need for a more integrated approach to DRM. Health system resilience and capacity for emergency and disaster risk management are essential to effective multi-sectoral disaster management – regardless of whether the disaster owes to a natural hazard, an environmental incident, a disease threat, armed conflict or some combination of factors. In terms of prevention and preparedness, the HFA places emphasis on more comprehensive risk assessment and more resilient and prepared communities. Emergency response and recovery requires coordination and early action with particular attention to environmental health (including water and sanitation), food aid/nutrition, shelter and health care services for trauma, communicable diseases, non-communicable diseases; mental health; maternal and neonatal health; sexual and reproductive health; and basic health.
In order for the health of the population to be protected during and after a disaster, wider determinants of health such as water, sanitation, nutrition and security also need to be adequately addressed through multi-sectoral collaboration and action. Essential infrastructure such as communications, logistics, energy and water supplies and emergency services need to be protected through the work of multi-sectoral partnerships to ensure the continuity of health services.
during and after an emergency or disaster (The Sphere Project, 2011). The ageing population is also often among the poorest in developing countries, and neglected in disaster preparedness and response. Moreover, communication messages are often inappropriate or not targeted at the ageing population, increasing gaps in care, treatment and management.
Disability It is estimated 15% of the global population lives with some form of disability (WHO, 2011b). People with disabilities are disproportionately affected by and experience particularly high rates of mortality and morbidity in emergencies and disasters (ACFID, 2005). People with disabilities are more vulnerable than people without disabilities owing to poorer health, lower education achievements, less economic participation and higher rates of unemployment, which leads to worse health and social outcomes (WHO, 2011b). Women with disabilities and older people in particular experience more discrimination and exclusion than other people with disabilities (Handicap International, 2008). Emergencies increase the vulnerability of people with disabilities, as they may be less able to escape from hazards and lose devices including hearing aids and medications. People with visual, hearing and intellectual impairments and severe mental health conditions may be unprepared for events that lead to emergencies. When a community is forced to evacuate, people with disabilities may be left behind (ACFID, 2005; Atlas Alliance, 2011, WHO, 2005a), and the capacity of care-givers and care settings may be reduced during and after an emergency.
In an emergency, people with difficulties functioning may also have greater difficulty accessing basic needs including food, water, shelter, latrines and health care services (Atlas Alliance, 2011; WHO, 2005a). Furthermore, emergencies also create a new generation of people with disabilities owing to injuries, poor basic surgical and medical care, emergency-induced mental health and psychological problems, abandonment and breakdown in support structures and preventive health care (Oosters 2005; WHO, 2005a).
People with disabilities are often not identified in communities in assessments before, during and after emergencies. Lack of disaggregated data and of systematic identification of people with disabilities results in lack of access to vulnerability
48 Disaster risk ManageMent in Post-2015 DeveloPMent goals | Potential targets and indicators

Primary health care (PHC) focuses on basic services to improve health status (e.g. vaccinations, nutrition, maternal care, treatment of simple ailments), which in turn builds community resilience and provides the foundation for responding to emergencies (WHO, 2011c). Policies and strategies focusing on PHC can contribute to decreasing vulnerability and preparing households, communities and health systems for disasters. Following a disaster, focus is often given to acute care needs and specialist interventions; while important, it is usually simple ailments, and chronic and pre-existing conditions that prove the largest burden of disease. Moreover, when not addressed properly, pre-existing and chronic conditions may have significant and multiplicative economic and societal consequences.
Community-based actions are at the front line of protecting health in emergencies because:
● Local knowledge of local risks is used to address the actual needs of the community.
● Local actions prevent risks at the source, by avoiding exposure to local hazards.
● A prepared, active and well-organised community can reduce risks and the impact of emergencies.
● Many lives can be saved in the first hours after an emergency through community response before external help arrives (WHO et al., 2011).
Hospitals and health infrastructure: health systems are composed of public, private and non-governmental facilities that work together to serve the community; these include hospitals, PHC centres, laboratories, pharmacies and blood banks. Safe hospital programmes ensure health facilities are safely built to withstand hazards, remaining operational in emergencies (WHO, 2011d).
Developing adaptable and resilient health care systems
● Surge capacity: health care systems need to prepare to cope with large numbers of patients. This may require mobilising staff around the country to aid affected areas.
● Flexibility in health care systems: flexibility to deliver different functions is an essential component of health care delivery. This may mean temporarily reducing some services (e.g. elective surgery) in order to expand others (e.g. outpatient services, emergency surgery).
Progress has been made at global, regional, national and community levels, but the capacity of countries in the health sector for emergency and disaster risk management remains extremely variable8.
A global assessment of national health sector emergency preparedness and response was conducted by WHO in 2007 and gathered information from 62 participating countries (WHO, 2008b). The majority of countries in each region had experienced an emergency or disaster in the past five years. This demonstrates the vital importance of effective national health emergency preparedness and response programmes in all countries. Most countries (85%) reported the existence of a national emergency preparedness and response policy. Although two-thirds of countries reported the presence of national, multidisciplinary health emergency preparedness and response plans, only half of those countries reported that such plans were developed by a formal committee, were based on vulnerability assessment or were linked to the multi-sectoral plan. Up to 50% of countries have no budget allocation to sustain the health emergency preparedness and response planning function.
Emergency preparedness and response programmes do not include a training and capacity-building component in more than one-third of countries. In countries with existing emergency preparedness and response training courses, only half reported that such training is based on training needs analyses and competency standards. Just under two-thirds (63%) reported the presence of guidelines in health emergency preparedness and response. Less than half (44%) reported using audits to assess the effectiveness of emergency preparedness and response programmes. Nevertheless, a number of countries at high risk of hazards, such as Bangladesh, Cuba, Indonesia, Mozambique, the Philippines and Turkey, have strengthened their capacities for health emergency and DRM; in some countries, the health sector has led initiatives developing multi-sectoral approaches to DRM9.
Health care systems provide core capacities for DRM for health. Some countries affected by disasters have limited basic health services and infrastructure, which in itself hugely compounds the challenges of disaster response. Countries with well-developed systems are often much more resilient and better prepared for disasters.
49
5.5 Health indicators for measuring health consequences and progress on emergency and disaster risk management for health Resilient health programmes and services, infrastructure and dedicated health sector capacities for health emergency and disaster risk management can enhance the effectiveness of multi-sectoral DRM while simultaneously supporting wider sustainability objectives (e.g. renewable energy solutions are used to strengthen resilience of health facilities and maintain their operational capacity in emergencies). In the context of DRM, public health programmes (such as good coverage of vaccination, nutrition, reproductive health, basic PHC, and chronic diseases management services) build capacities and resilience of individuals and communities to risks, to reduce the consequences and fully recover. Identifying health-relevant ‘indicators’ of effective DRM in the context of sustainable development can help provide a more robust approach to disaster management overall.
These indicators should explicitly recognise health outcomes as essential measures of the effects of hazards on communities and the effectiveness of disaster management measures in health and other sectors collectively. Indicators should highlight the role of health systems in contributing to overall health resilience and also capacities and performance focused on health emergency and DRM.
In summary, the health dimensions of DRM that might need to be considered cover the following issues:
● Hazard effects on human health (e.g. deaths, injuries, illness, disability, malnutrition);
● Improving the availability and accessibility of data of health outcomes which are collected and reported by countries;
● Development of the national capacities required under for the IHR (2005) (WHO, 2008);11
Business continuity planning: plans to maintain the continuity of health sector operations include identifying priority services, mechanisms for response coordination and communicating with staff and partner organisations10.
The International Health Regulations The 194 Member States of WHO have agreed and bound themselves to a set of regulations with the purposes of preventing and controlling the international spread of adverse public health events. While the IHR are not focussed on disasters there is a very considerable congruence and synergy between the IHR commitments of both countries and WHO and a number of aspects of disaster risk management. One of the key obligations of States Parties to the IHR is to develop and maintain national core capacities for the detection, investigation, response and reporting of public health events within their territories. Analysis of these capacities has resulted in the identification of main areas of work;
● National legislation, policy and financing ● Coordination and NFP (National IHR Focal
Point) Communications ● Surveillance ● Response ● Preparedness ● Risk communication ● Human resources ● Laboratory
In line with the scope of the Regulations these capacities are to cover a range of public health hazards including; infectious (biological); chemical and radiological. Additional capacities are also required in certain designated point of entry (international ports, airports and ground crossings). The existence of these capacities not only plays an important role in preventing and controlling the international spread of disease but will also contribute to the preparedness for and response to natural and other disasters occurring in the country. (WHO, 2012)
50 Disaster risk ManageMent in Post-2015 DeveloPMent goals | Potential targets and indicators
measurement in many instances; ● Proportion of countries meeting and sustaining
IHR (2005) core capacities; ● Percentage of countries with a health
emergency and disaster risk management programme (including a capacity development strategy, a coordination body and regular budget);
● Percentage of countries conducting an all-hazards health emergency and disaster risk management capacity assessment at least every two years;
● Percentage of countries that have conducted an assessment of the safety and preparedness of essential health facilities; and
● Percentage of new hospitals and health facilities built to withstand local hazards.
5.6 Considerations for indicator selectionA wide range of indicators to address the health dimensions of DRM has been suggested. These indicators include health outcomes and measures of the capacities and performance of health systems generally and for managing the risks from specific hazards. In considering which indicators have most value and can be most practically collected and reported, preference should be given, as far as possible, to data that are already collected and reported on a regular basis by countries, WHO and bodies, including the World Bank. The WHO Global Health Observatory (http://app.who.int/gho/data/view.main.160) provides open access to a wide range of health datasets on mortality, burden of diseases, the MDGs and others, assessing the status of health and performance of health measures in a variety of contexts.
WHO collects data and provides reports on national health emergency and disaster risk management programmes, implementation of safe hospital programmes (UNISDR, 2011a) and implementation of the IHR (2005) (WHO, 2012). In terms of availability of health services during disasters, data sources are ministries of health, national health emergency management coordination committees, the Inter-Agency Standing Committee health clusters in humanitarian emergencies and global health programmes
● Development and implementation of national all-hazards health emergency and disaster risk management programmes, capacity assessments and risk assessments;
● Inclusion of health in multi-sectoral DRM policies, platforms, risk assessments and programmes;
● Inclusion of health impact assessments in land use and other development planning at all levels;
● Disease surveillance systems with early warning functions;
● All-hazards emergency response and recovery planning, coordination mechanisms and exercises;
● Health resources available for DRM, including health facilities, hospital beds and the health workforce;
● Health workforce development for emergency and disaster risk management;
● Assessment of safer, prepared and resilient health care facilities, as well as implementation of measures to improve levels of safety, security and preparedness;
● Access to and usage of sustainable energy and water supplies by health facilities;
● Health services coverage, including vaccination coverage, births assisted by skilled attendants, water supply and core public health programmes to specific communities such as for malaria, tuberculosis and HIV; and
● Community resilience. Some examples of possible indicators to address these health-related dimensions of DRM were identified at the WHO Expert Consultation in preparation for the Rio+ 20 Summit in May 2012. They have been supplemented by other indicators drawn from the IHR (2005) and the Global Health Cluster and are shown in Annex D.
WHO requires further consultations with Member States and partners to determine the suitability and level of targets for the health aspects of DRM. Some general descriptions of these possible target areas are as follows:
● Percentage reductions in health impacts, including deaths, injury, illness and disability owing to hazards, in specific contexts, and noting the substantial challenges of
51
A primary goal of emergency and disaster risk management is to prevent and reduce mortality and morbidity through prevention, mitigation and preparedness measures, as well as in response and recovery. In the response to natural disasters and conflicts,mortalityistheprimeindicatorbywhichtoassess the impact of an emergency, the magnitude of needs and the adequacy of the emergency response (ChecchiandRoberts,2005).Crudeandunder-fivemortality rates are used internationally to benchmark the severity of emergencies (Salama et al., 2004) and evaluate the effectiveness of assistance, usually in refugee camp settings or from intermittent surveys.Yearlynationaldataoncrudeandunder-fivemortality may be available at global level.12 Moreover, retrospective household surveys are occasionally used to estimate and describe patterns of mortality at local level where the emergency has occurred. However, such surveys can only occur infrequently and cannot supply the relief system’s information demandinasufficientlytimelyandflexiblefashion.They do not provide a satisfying tracking solution.
● Number of cases or incidence rates for selected diseases relevant to the local context
● Case fatality ratio for most common diseases Those indicators are outcome measures of the effect of an emergency, including epidemics. They are available in most countries through routine epidemiological surveillance systems or EWSs. Weekly, monthly and annual trends can be tracked and comparisons with previous years can be made.
Core capacities under the international Health regulations (2005)
● Countries meet and sustain IHR (2005) core capacities identified through the global monitoring framework
Compliance with the IHRs is monitored yearly since 2008 and reported back to the World Health Assembly through monitoring by States Parties of the development of their core capacities at the national, intermediate and local community/primary response under the International Health Regulations (2005).13 The IHR national capacities monitoring tool includes 28 indicators covering all the capacity areas. The indicators relating to coordination, surveillance, response and preparedness are listed below:
States Parties are encouraged to monitor their progress in establishing the national capacities required under the IHR using a self-assessed monitoring tool. Data provided by countries using the tool is summarised and reported to the World Health Assemblyannually.Thefirsttargetforensuringthecapacities passed in June 2007 with some countries indicating that they have the capacities in place and many others requesting an extension to the target deadline. The monitoring framework is being reviewed and adapted to meet the different country status with respect to the established capacities.
The strength of health system monitoring depends on the development of baseline data that enable detection and measurement of the impact of hazards on the health of populations at risk. However, the data that are available may change before, during and after an event. Consequently, indicator selection and data collection planning should be adaptable and focusedonthespecificpurposesofmeasurement.
Candidate health-related indicators that have the most potential for inclusion in the post-2015 development agenda for DRM are described below.
Hazard impacts on human health and wellbeing
● Country disaster data on health outcomes at a national level are reported on an annual basis
Human health indicators are essential for measuring the consequences of hazards which affect communities and for the measurement of performance of programmes by all sectors. Concerted efforts are required to ensure such data are collected and reported by national authorities. The disaster data should include the number of events, deaths, injuries, diseases, missing persons and disabilities by hazard on an annual basis (with data disaggregated by sex and age). Guidance should be provided by international agencies to ensure the data are collected and presented in a standardised way across countries. Although some countries have good systems of collection, collation and reporting of these data, most do not and substantial investment will be needed to obtain reliable global data.
● Crude mortality rate (baseline and in emergency situations)
● Under-five mortality rate (baseline and in emergency situations)
52 Disaster risk ManageMent in Post-2015 DeveloPMent goals | Potential targets and indicators

● A national emergency response plan is developed as a component of a multi-sectoral emergency response plan and reviewed and updated on a regular basis.
As noted previously, WHO conducted a global assessment of the status of national health sectors emergency preparedness and response, to which some 62 countries responded. A report was released with analysis reported by region (WHO, 2008b). Further monitoring will be conducted from 2014 onwards to support World Health Assembly Resolution 64.10 adopted in 2011: ‘Strengthening national health emergency and disaster management capacities and the resilience of health systems’.
● Average population per health unit (usually PHC facilities offering general health services) by administrative unit or country (benchmark for this indicator is <10 000 people per unit)
Availability of health resources is regularly monitored and national data are available at the Global Health Observatory.14 Moreover, these data can be inferred at local level from the mapping of health facilities and populationfigures.
● Coverage of measles vaccination (12-23 months)
Yearly data on measles vaccination coverage are available at national level. These data are also widely available at local level through calculation of administrative coverage. Occasionally, measles vaccination coverage surveys are also conducted, mostly coupled with nutrition surveys.
safer, prepared and resilient health care facilities
● Proportion of existing health care facilities in hazard-prone areas that have been assessed for levels of safety, security and preparedness
● Proportion of existing health care facilities that have increased their level of safety through structural and structural measures and/or preparedness
● Proportion of new health care facilities built and certified in compliance with national building codes and standards to withstand hazards
Coordination and NFP communications
● A mechanism is established for the coordination of relevant sectors in the implementation of IHR (2005).
● IHR National Focal Point functions and operations areinplaceasdefinedbytheIHR(2005).
Surveillance
● Indicator based, surveillance includes an early warning function for the early detection of a public health event.
● Event based surveillance is established and functioning.
Response
● Public health emergency response mechanisms are established.
● Case management procedures are implemented for IHR relevant hazards.
● Infection prevention and control (IPC) is established at national and hospital levels.
● A programme for disinfection, decontamination and vector control is established.
Preparedness
● A Multi-hazard National Public Health Emergency Preparedness and Response Plan is developed.
● Priority public health risks and resources are mapped.
Health system capacities in multi-sectoral disaster risk management
● A national programme for all-hazards health emergency and disaster risk management with a capacity development strategy, a coordination body and regular budget is established
● An all-hazards health emergency and disaster risk management capacity assessment is conducted on a regular basis (every two years);
● Health emergency risk assessments are conducted on a regular basis (every two years);
● National-level exercises to test health emergency response plans are conducted on a regular basis; and
53
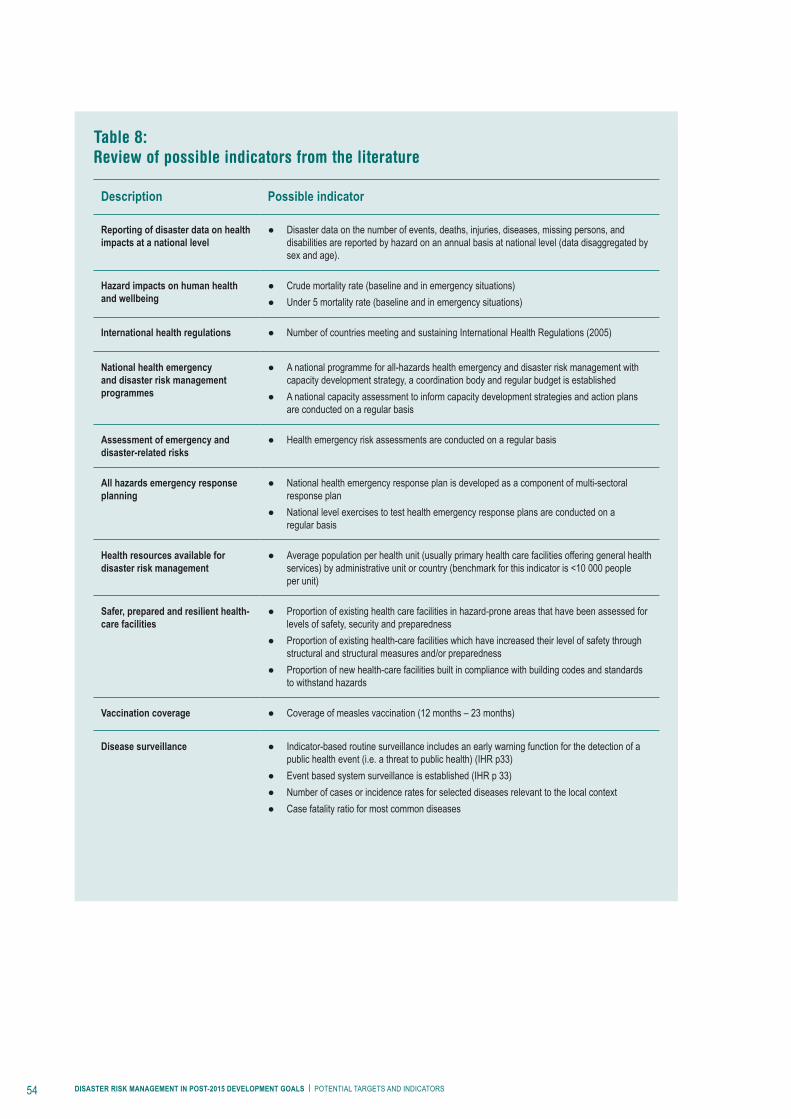
Table 8: review of possible indicators from the literature
Description Possible indicator
Reporting of disaster data on health impacts at a national level
● Disaster data on the number of events, deaths, injuries, diseases, missing persons, and disabilities are reported by hazard on an annual basis at national level (data disaggregated by sex and age).
Hazard impacts on human health and wellbeing
● Crude mortality rate (baseline and in emergency situations) ● Under 5 mortality rate (baseline and in emergency situations)
International health regulations ● Number of countries meeting and sustaining International Health Regulations (2005)
National health emergency and disaster risk management programmes
● A national programme for all-hazards health emergency and disaster risk management with capacity development strategy, a coordination body and regular budget is established
● A national capacity assessment to inform capacity development strategies and action plans are conducted on a regular basis
Assessment of emergency and disaster-related risks
● Health emergency risk assessments are conducted on a regular basis
All hazards emergency response planning
● National health emergency response plan is developed as a component of multi-sectoral response plan
● National level exercises to test health emergency response plans are conducted on a regular basis
Health resources available for disaster risk management
● Average population per health unit (usually primary health care facilities offering general health services) by administrative unit or country (benchmark for this indicator is <10 000 people per unit)
Safer, prepared and resilient health-care facilities
● Proportion of existing health care facilities in hazard-prone areas that have been assessed for levels of safety, security and preparedness
● Proportion of existing health-care facilities which have increased their level of safety through structural and structural measures and/or preparedness
● Proportion of new health-care facilities built in compliance with building codes and standards to withstand hazards
Vaccination coverage ● Coverage of measles vaccination (12 months – 23 months)
Disease surveillance ● Indicator-based routine surveillance includes an early warning function for the detection of a public health event (i.e. a threat to public health) (IHR p33)
● Event based system surveillance is established (IHR p 33) ● Number of cases or incidence rates for selected diseases relevant to the local context ● Case fatality ratio for most common diseases
54 Disaster risk ManageMent in Post-2015 DeveloPMent goals | Potential targets and indicators

identification and evaluation of desired health outcomes by countries. They must be continually reassessed as part of the process that defines health programming objectives related to health emergency and disaster risk management.
The essential discussion must be on identification and prioritisation of health objectives by countries that may or may not have directly relevant, readily obtainable and reliable indicators. The important contexts are the national and local contexts. At the country level, countries will determine the priorities for action in health emergency and disaster risk management. Consequently, in addition to direct consequences of near-term mortality, morbidity and disability from an event, the most relevant indicators are those the country has selected from its health objectives and targets. Also, in terms of emergency and disaster risk management, countries must assess the effect that health consequences have on the objectives of other sectors, such as through changes in available work force, school absenteeism, law, order and security and provision of critical infrastructure and services. Development policies need to adopt strategies for land use that do not place people’s lives at risks while codes and standards are required to ensure that buildings and infrastructure, including those that support health services, are resilient to disasters. These are challenging requirements and call for cooperative country-level engagement and decision processes.
In order to improve the utility of indicators, there is a continuing need to accurately track outcomes and trends. Data on disaster impacts and outcomes need to be collected using robust systematic methodologies. In particular, global health statistics for mortality, injuries, illnesses and disability resulting from the impact of hazards need strengthening.15 Furthermore, analysis of health capacities, vulnerabilities and needs for capacity building should be strengthened in risk assessments (including the UNISDR Global Assessment Report) and economic analyses (UNISDR, 2011a). A global research strategy for disaster health would help address the deficiencies in data and evidence on disaster risks and interventions.
At community level, social factors are essential determinants of vulnerabilities and resilience to disasters. Further efforts are required to identify indicators that enable the measurement of
National hazard mapping and inventory of health facilities can be combined to identify which health facilities are in hazard-prone areas. WHO has developed a Hospital Safety Index and other tools to assess the safety and preparedness of hospitals and other health facilities which will enable countries to establish a schedule for retrofitting and improving the preparedness of the most essential and vulnerable facilities.
WHO collects data and provides reports to the Global Platform on Disaster Risk Reduction on the implementation of national safer hospital programmes. Data on safe hospitals programmes will also be collected by WHO for a global report on country capacities for health emergency and disaster risk manageme
5.7 Conclusion This chapter on the health imperative for DRM reports the key issues and indicators in the context of the global consultations on DRR for the post-2015 development agenda. Many different hazards, such as natural, technological, epidemic disease and conflict hazards, have the potential to cause substantial consequences for people’s health and well-being, and the functioning of health systems and societies at large. Improved health outcomes are the result of multi-sectoral action by health systems and other sectors working together with all communities at risk of emergencies and disasters. This collaboration helps reduce health outcomes, particularly deaths, injuries, illnesses and disabilities. Building health system resilience and health sector capacities for emergency and disaster risk management, particularly at community level, is essential to effective multi-sectoral DRM, which also supports sustainable development.
Most of the proposed potential indicators are drawn from a variety of extant health sector guidance and recent consultations on indicators for the post-2015 development agenda and reflect the need to protect human health as a key imperative for action to manage disaster-related risks and reduce the impacts of all hazards on communities. They are included here to facilitate an appreciation of the range of indicators that inform monitoring and assessment of different dimensions of health. They are not a substitute for careful
55

community resilience. These indicators should take into account that community members are connected to one another and work together so they are able to:
● Function and sustain critical systems, even under stress;
● Adapt to changes in the physical, social, or economic environment (including changes to hazards, vulnerabilities and capacities);
● Be self-reliant if external resources are limited or cut off; and
● Learn from experience to improve over time (Arbon, 2012).
A focus on DRM and health is needed by all thematic areas addressed in the post-2015 development agenda to show the linkages between health, disaster management and other aspects of sustainable development. A broader exploration of the linkages between disasters and health is required for the health theme for post-2015 development agenda, building on the references in the draft report of the Global Thematic Consultation on Health. At the same time, the inclusion of health targets and indicators in the disaster theme will ensure the global community and, particularly, national governments focus their DRM efforts on reducing the widespread risks and the health consequences of emergencies and disasters on communities worldwide.
Chapter 5 Endnotes
1 ThischapterisbasedonareportonthefindingsofaWorldHealthOrganization (WHO) Expert Consultation on Health Indicators for Rio+20 Discussions and Decisions (17-18 May 2012) which was co-sponsored and supported by the National Institute of Environmental Health Sciences, US (http://www.who.int/entity/hia/green_economy/indicators_disasters2.pdf).
2 WHO contributors: Jonathan Abrahams, Sharon Akoth, Richard Brennan, David Brett-Major, Rudi Coninx, Max Hardiman, Xavier de Radigues, Claudine Prudhon and Liviu Vedrasco. WHO retains the copyright to this chapter and has granted ODI permission for its reproduction. A very special thank you to Professor Virginia Murray, Dr Angie Bone and Dr Aileen Kitching, Public Health England for their valuable input into and review of this chapter.
3 www.emdat.be5 UppsalaConflictDataProgram.UppsalaConflictDataProgram.
Available at: http://www.pcr.uu.se/research/ucdp/ 6 See http://www.unicef.org/wash/index_statistics.html7 See
http://www.who.int/features/factfiles/sanitation/facts/en/index2.html8 WHO/United Kingdom Health Protection Agency (2011). ‘Disaster Risk
Management for Health Fact Sheets: Overview’. 9 Ibid.10 Ibid.11 While IHR implementation is not a comprehensive indicator for
disasters, implementation of IHR and the development of associated core capacities are a strong health sector contribution to disaster management and sustainable development.
12 See http://data.worldbank.org/indicator/SH.DYN.MORT/countries 13 See http://www.who.int/ihr/checklist/en/ 14 See http://apps.who.int/gho/data/node.main.506 15 WHO World Health Statistics and WHO Global Burden of Disease
reporting data.
56 DISASTER RISK MANAGEMENT IN POST-2015 | DEVELOPMENT GOALS: POTENTIAL TARGETS AND INDICATORS

Chapter 6

Disaster resilience in a poverty reduction goal
Andy sumner King's College London
resilience in the context of poverty reduction post-2015: the new geography of poverty and risk
Executive summaryThis chapter focuses on questions of enhancing resilience and reducing vulnerability amid broader debates on poverty reduction in any post-2015/new MDG framework(s). However, its scope is different to that of others in this ODI report as it is wider and goes beyond resilience largely in the context of DRR. In short, it is about how the broader issues of enhancing resilience and reducing vulnerability could be factored into the post-2015 framework(s).
The chapter does three things: (i) it sets out the changing context for poverty and vulnerability reduction post-2015 or a ‘new geography of poverty’, and extends this into a ‘new geography of risk’, making projections forward to 2030; (ii) it outlines the relationships between poverty, vulnerability, risk and resilience, and their manifestations in this ‘new geography’; and (iii) it suggests three poverty/vulnerability domains and accompanying indicators emerging that would have value-added in tracking enhanced resilience in any post-2015 framework with the aim that stressors and shocks do not hamper broader poverty reduction efforts, whether they be disaster-related or other shocks and stressors.
key messages1 The poor (however defined) face a range of
variabilities and risks, in terms of not only shocks but also slow-burning stressors, which can deplete resilience/capacities to cope in general and particularly during acute shocks. Such risk exposure is potentially compounded and co-evolving, and can be a major hindrance to governments’ poverty reduction efforts. Further, ‘poverty’ does not in all likelihood end at $1.25/day or $2/day per person or the national poverty line, as insecurity and the risk of falling in poverty often continue up to around $10/day per capita, at which point vulnerability to extreme/moderate poverty declines drastically.
2 The good news is that the bulk of the world’s poor (however defined) are no longer concentrated largely in the world’s LICs, least developed countries (LDCs) or aid-dependent countries, so the prospects for reducing risk are, in many countries, not hindered by overall financial resources per se to the extent they have been in the current MDG period.
3 Three poverty indicators – with feasible 2030 targets – that would better capture the tracking of poverty from a resilience perspective in a post-2015 framework would be (i) proportion of population below the ‘security poverty line’ of $10 PPP per capita (to be reduced by 1 billion people by 2030 or 2 billion by 2040); (ii) proportion of population ‘not receiving social protection’ (to be reduced to 25%) or government spending on social protection as a proportion of GDP (to be increased to 5% of GDP); and (iii) a new indicator added to the Gallup World Poll reporting the proportion of the population replying positively to the question, ‘Are you better able to cope with hazards/shocks than a year ago?’ An alternative indicator, already available in Gallup World Poll is, ‘Is the area where you live becoming more liveable?’ (with a target for either of positive end-of-scale responses from over 75% of the population).
6.1 introductionThis chapter focuses on questions of enhancing resilience and reducing vulnerability amid broader debates on poverty reduction in any post-2015/new MDG framework(s). For this chapter, ‘post-2015 framework’ means the MDGs/SDGs process widened to include two other ‘post-2015 frameworks’, relevant to the topic of DRR, namely, climate change post-Kyoto and DRR post-Hyogo, being negotiated in 2015.
However, the scope of this chapter is different to others in this ODI report as it is wider and goes beyond resilience largely in the context of DRR. In short, it is about how the broader issues of enhancing resilience and reducing vulnerability could be factored into the post-2015 framework(s).
The discussion relates to both the impacts of major shocks (e.g. large-scale flooding) and more frequent slow-burning stressors (e.g. repeated ‘minor’ flooding) on poverty and poverty reduction efforts, and how both stressors and shocks can hamper broader efforts to reduce poverty. Vulnerability is not defined simply by exposure to an external pressure but determined by the development processes that regulate relationships between a unit of interest and a hazardous process or force. Vulnerability then is internal to development, not an externality of development.
59

means less resilience and more resilience means less vulnerability, in any area of concern (natural hazards, health, education, economic, financial or institutional capacity etc.).
In its most general sense, vulnerability is thus seen as the risk that a household, community or country could be negatively affected by a stress or shock associated with an environmental, socioeconomic, physical or political hazard, or some combination thereof, that as noted is part of development processes not external to it (Naude et al., 2009a; 2009b). Questions of risk, variability, sensitivity and exposure are at the heart of the concepts of poverty, vulnerability and resilience: how a household, community or country deals with and reacts to risk; what kinds of outcomes result from a particular risk; and through what processes a risk produces a given outcome.
Vulnerability is not the same as risk. Risk results from the combination of hazards and vulnerability. For example, the IPCC Working group on Managing the Risks of Extreme Events and Disasters to Advance Climate Change Adaptation (SREX) (IPCC, 2012) observes that the main determinant of vulnerability to climate-related disasters is exposure (where people live and quality of dwellings), not susceptibility or hazard character. Shock and stress emanate from hazards. UNISDR (2009b) thus defines vulnerability as ‘the characteristics and circumstances of a community, system or asset that make it susceptible to the damaging effects of a hazard’.
This discussion alludes to fact that the impacts of hazards can be disaggregated into shocks and stressors. The UNISDR Global Assessment Report (2009a) uses the terms ‘high intensity low frequency’ and ‘low intensity high frequency’ to distinguish two types of hazards and extensive versus intensive risk. Extensive describes individual low-impact but high-frequency and widespread events that can in aggregate have a greater erosive effect on development gain than intensive events, which describe unique, catastrophic events. These are somewhat comparable with shocks and stressors: shocks refer to sudden-onset risk events, such as floods, droughts and price spikes, whereas stressors refer to more gradual shifts, such as regular non-catastrophic flooding, land degradation or socioeconomic marginalisation (Hart, 2009). A key
6.2 What are vulnerability and resilience?A common starting point in thinking about poverty in terms of vulnerability and resilience is to consider what is meant by the terms ‘vulnerability’ and ‘resilience’ in terms of sensitivity to and capacity to cope with hazards/shocks/stressors or variability within the development process.1 Table 9 provides definitions and combinations that point towards the independence of vulnerability and resilience. Combinations of high and low resilience and high and low vulnerability are possible, and examples of each are given. The outline draws on a metaphor developed by Room (2000) and Wood (2003), which emphasises two key dimensions of the vulnerability–resilience nexus. The first, ‘snakes and ladders’, refers to expected and unexpected vulnerability – meaning variability – that can lead to an advance (ladder) or decline (snake) in human wellbeing. Second, ‘buffers and passports’ refers to resilience capacities (buffers) and abilities to take opportunities from the situation faced (passports). Poverty (or otherwise) is determined, and poverty alleviation or resilience-building capacity circumscribed by governance. While livelihoods remain central, this observation shifts the balance of attention from livelihoods towards governance in explaining, mediating and moderating poverty, risk and resilience. For example, access to security of tenure, where people live, access to insurance, microcredit, local support networks and so forth all hinge on governance in a broad sense – informal and formal.
In an extensive review of longitudinal datasets, Dercon and Shapiro (2007) note that an individual’s descent into poverty can be explained by anticipated temporary shocks such as illness and health-related expenses; social and customary expenses on marriage and funerals; high-interest private loans; crop disease; and drought and irrigation failure. Dealing with such temporary shocks often requires strategies (buffers and possibly passports for some), such as selling assets – which may result in greater vulnerability in the longer term. Indeed, ‘risk-averse’ strategies become more important under conditions of compound, repeat and complex shocks and stressors. One might say they are two sides of the same coin: more vulnerability
60 Disaster risk ManageMent in Post-2015 DeveloPMent goals | Potential targets and indicators

Table 10: Shocks by income quintile in Mexico, 2002-2005 (%of households)In sum, resilience and vulnerability do not represent opposite ends of the spectrum, but rather form part of the same equation: resilience determines in large part how people or systems prepare and respond to shocks, and hence how people or systems are affected by those shocks and how vulnerable they are to experiencing a particular outcome. Further, some variability can be anticipated to a certain extent, such as funeral costs or dowry. It is useful to distinguish, as the IPCC SREX does, between coping (using assets to mitigate harm today) with adaptation – reorganising entitlements and consequent assets in preparation for anticipated harm tomorrow.
The current MDGs were borne in a different era, when vulnerability and resilience, DRR and CCA
distinction is the difference in time scale. While the duration of a shock may be short, its impacts can persist for longer after the initial event and erode resilience capital, as noted earlier.
Finally, it is worth noting vulnerability can be viewed as vulnerability to falling below a specific poverty line or falling further below a specific poverty line (see also later discussion). The poor (however defined) may face different kinds of risk exposures, in terms of not only the qualitative and quantitative nature of hazard exposure but also physicality and existing stretched resilience/capacities to cope. For example, as Table 10 shows, the proportion of Mexican households facing shocks in the poorest income quintile (a relative definition of poverty) is significantly higher than that in the richest income quintile.
Table 9 What are vulnerability and resilience?
High Low
Vulnerability or ‘snakes and ladders’ Sensitivity and/or ‘hazard’/ ’harm’/ variability’
High Highly vulnerable but resilient, e.g. an elderly couple living in aflood-proneneighbourhoodbut with full health and property insurance, supporting social networks and excellent emergency services
High vulnerability and low resilience, e.g. an isolated rural community dependent on rain-fed agriculture and with few resources following previous rounds of economic or environmental stress and shock; a community beyond the reach of humanitarian and development aid, perhaps becauseofconflict
Low Not vulnerable and with high resilience, e.g. a well-resourced family not exposed to current hazardsandwithsufficientcapacitytoenjoyflexibilityin resource expenditure (i.e. savings), access to knowledge resources to plan for the future and insurance to cope with unforeseen contingencies and surprises
Not vulnerable but also not resilient, e.g. a household not exposed to current risk, but one that has not been able or is not willing to invest in protecting the household from uncertainty and future contingencies. Investment in education and insurance and engagement in community governance are not priorities
Sour
ce: A
dapte
d fro
m Su
mner
and M
allet
(201
3)
Resilience or ‘buffers and passports’ Capacity to cope and/or (even) advance
61

of poverty, and by ill-health (Alkire et al., 2012; Glassman et al., 2011; Kanbur and Sumner, 2011).
This means the bulk of the world’s poor (however defined) are no longer largely concentrated in the world’s poorest countries – whether defined as LICs or LDCs or aid-dependent countries. Of course, this is not to say the 300 million extreme ($1.25) poor in LICs/LDC do not matter rather than the bulk of world poverty is now in countries where average income are rising. The result, one could argue is that, to a certain extent, the resource constraints and aid-led costing debates of the first round of MDGs are less pressing in any new MDGs/post-2015 framework. Most MICs have credit ratings and can borrow from capital markets (and indeed may prefer to do so to avoid conditionalities). Concessional lending may remain important, as it is cheaper, but it is important to note the number of aid-dependent countries is declining and the vast bulk of world poverty is no longer in such countries. In fact, almost 130 developing countries have an official development assistance (ODA) to gross national income (GNI) ratio of less than 2%, and only around 40 countries have an ODA to GNI ratio of more than 10% in the most recent data (Edward and Sumner, 2013).
Although the World Bank’s country thresholds do not mean a sudden change in countries when a line is crossed in per capita income, substantially higher levels of average per capita income in countries that are experiencing significant economic growth implies substantially more domestic resources available for poverty reduction. Of greater note for aid donors is the fact that the aid system, including many aid agencies, does, in general, treat countries differently if they are MICs (or at least consider MIC classification a reason in itself for reducing aid flows). However, there are good reasons for continuing aid to MICs
were less prominent on the political agenda. Despite the clear reference to the topic in the 2000 Millennium Declaration, with specific MDGs selected soon after, DRR was not included explicitly, and the link with MDG 7 is arguably too tenuous to be meaningful. MDG 7 became the environment MDG, including a number of indicators such as on forest cover and protected areas (and also sanitation and drainage), but this was not extended to consider hazards arising from degraded environments.
The Millennium Declaration notes the importance of ‘protecting our common environment’ and agreement ‘to intensify cooperation to reduce the number and effects of natural and man-made disasters’, and includes a mention of climate change; the MDGs contain several elements of vulnerability (poverty, health care, education, sanitation and drainage), but these are somewhat disarticulated and so lose policy purchase. That said, the MDGs also focused extensively on ill-health, the most common impoverishing shock.
6.3 The new geography of poverty and risk
The new geography of povertyThe ‘new geography of poverty’ refers to the fact that the distribution of global poverty (income poverty as well as ill-health and malnutrition) has shifted from countries classified by the World Bank as low income towards (new) MICs, and a billion extreme ($1.25) poor or a ‘new bottom billion’ live in MICs (Sumner, 2010; 2012a; 2012b; 2012c). The same is true by multidimensional measures
Table 10 shocks by income quintile in Mexico, 2002-2005 (%of households)
Exposure to any shock
Loss of dwelling Loss of crops
Loss of livestock
Dwelling, crops and livestock
Poorest 20% 29.0 1.6 5.7 2.3 8.0
Richest 20% 21.5 0.5 1.5 1.5 3.1
Average 25.1 0.9 2.8 1.2 4.2
Sour
ce: A
dapte
d fro
m Ló
pez-C
alva
and O
rtiz-Ju
arez
(201
1)
62 Disaster risk ManageMent in Post-2015 DeveloPMent goals | Potential targets and indicators

either now or at some point in the foreseeable future, and/or whether the dominant analytical country categories are out-dated. It could be argued that many of the world’s extreme poor already live in countries where the total cost of ending extreme and even moderate expenditure poverty is not prohibitively high as a percentage of GDP and, by 2020, even with fairly conservative estimates (see Sumner, 2012b), most of world poverty may be in countries that do have the domestic financial resources to end at least extreme if not moderate poverty. However, constraints remain, and there are significant questions over whether the country classifications are still meaningful, relating to the heterogeneity of new MICs and their economic growth patterns, as well as differing administrative state capacities and constraints of domestic political economy in terms of the taxation base and support for redistributive policies.
It is fair to say ending, or getting close to ending, $1.25 poverty by 2030 can be viewed largely as feasible without ‘bending the curve’ too much (see Karver et al., 2012; Ravallion, 2013). On a similar logic, $2 poverty could fall to 500-600 million in 2030, with a net cost of ending $2 poverty in 2030 potentially as low as 0.1-0.2% of world GDP (Edward and Sumner, 2013). The pre-requisites are though, if growth meets International Monetary Fund (IMF) World Economic Outlook (WEO) forecasts and inequality trends are favourable.
A new geography of risk?In light of the above, it may be an opportune time to think about a new higher poverty line based on resilience. One way this can be done is to take a ‘security from poverty’ poverty line of $10/day PPP per capita. The $10 line has been identified by Pritchett (2006) and empirically explored in Chile, Mexico and Brazil by López-Calva and Ortiz-Juarez (2011). The empirical basis of such a ‘resilience line’ or ‘security from poverty’ poverty line is as follows. It is estimated that the risk of falling back into poverty in Latin America (where poverty is defined by the higher Latin American poverty line of $4-5) drastically falls – to about 10% at around $10 per capita per day (see Figure 9) (López-Calva and Ortiz-Juarez, 2011). Further, $10 per capita is associated with completion of secondary school across Latin America, providing some greater security from poverty (Birdsall, 2012).
in terms of concessional loans rather than grants. Further aid modalities could be the co-financing of global or regional public goods such as vaccination programmes and/or research and knowledge transfer from MICs to other countries of successful policies.
Over time, it is likely that the expanding number of MICs will make far greater demands for traditional donors’ focus to be on ‘policy coherence’ (better trade, migration and other policies) than for small amounts of ODA transfer which would be very small relative to the size of recipients economies
If we take a broader scope than the (somewhat arbitrary) middle-income threshold for income per capita, 80 developing countries converge with the Organisation for Economic Co-operation and Development (OECD) countries per capita income by achieving GDP per capita growth of more than twice the OECD average over the past decade (OECD, 2012).
At the other end of the spectrum, projections for future economic growth point towards a small group of about 20 countries, possibly fewer, that will remain low income even in 2030, of which many, but not all, are conflict- or post-conflict-affected countries.
In terms of this new geography of poverty, it is worth looking at what exactly has happened. In 1990, almost all of the world’s poor people (however defined) lived in countries then classified as LICs, with average income barely above the higher international poverty line ($2 per capita PPP). Addressing global poverty was framed largely around aid and resources transfers. Now, however, (based on 2008 data) most of the world’s poor live in MICs, and mostly in countries that are new MICs or ‘emerging economies’ where average income is significantly higher – around five times the higher international poverty line in the LMIC group as a whole (about $10/day PPP per capita). In short, 30 countries – notably five populous countries – where the bulk of the world’s poor live, became better off in average income terms and transitioned from LIC to MIC status, and poverty did not fall as much as one might expect. The net result was a reclassification of world poverty into MICs.
This changing pattern of global poverty raises various questions about whether ‘global poverty’ requires reframing as a national distribution issue in a world of fewer and fewer aid-dependent countries,
63

Table 11 Estimates of the distribution of global poverty, and poverty incidence, 2008
$1.25 poverty line $2 poverty line
Millions of people
% of world’s poor
Poverty incidence (% population)
Millions of people
% of world’s poor
Poverty incidence (% population)
LICs 316.7 25.7 48.5 486.3 20.6 74.4
LMICs 711.6 57.7 30.2 1,394.5 59.2 59.1
UMICs 205.5 16.7 8.7 476.6 20.2 20.3
LDCs 324.0 26.3 46.4 505.0 21.4 72.2
Total 1,233.8 100.0 22.8 2,357.5 100.0 43.6
Note: UMIC = upper-middle-income country.
Sour
ce: S
umne
r (20
12a)
base
d on d
ata pr
oces
sed f
rom
Povc
alNet
(201
2).
Surprisingly, perhaps, if one takes this $10/day per capita poverty line, poverty has actually been increasing in recent decades under the MDGs, indicating that, although the number of people in extreme poverty may have been falling, the number vulnerable to falling into poverty has been increasing. The total number of $10 poor is likely to peak soon at around 5 billion people or 70% of the world’s population, and then could go two ways. Under slow economic growth and rising inequality, it could rise by an extra billion people by 2030; under strong economic growth and falling inequality, it could fall by a billion people by 2030 and then by almost another billion by 2040.
The geography of poverty and risk if one takes $10 per capita points not towards the poorest countries (meaning LICs or LDCs or aid-dependent countries) (see Table 12). Currently, and ahead to 2030, those under the $10 ‘security from poverty’ poverty line will live in countries that are MICs and ‘emerging economies’. Of the current 5.1 billion people living under $10/day per capita, only 15% live in LICs (or LDCs or ‘fragile states’); 85% live in MICs and largely ‘convergence MICs’, or the group of ‘emerging market economies’ (Edward and Sumner, 2013). This is not to suggest those $10 poor people in
the poorest countries matter less – clearly we are talking about entire populations, potentially with the least state capacity to cope; rather, the data remind us that, if we accept a higher poverty line, then poverty extends way beyond small numbers of LICs or LDCs (see Table 12).
One could extend this, of course, considering populations covered or not by social protection or populations reporting positive/negative trends in self-declared ability to cope (see later discussion on indicators) or, indeed, populations vulnerable and/or resilient to the impacts of climate change (extreme weather, sea level changes and agricultural productivity changes). For example, the IPCC (2007) noted that 80% of the 300 million people who lived within 5m of sea level were in developing countries. Wheeler (2011) outlines climate risks and coping ability by country and finds that the top 20 countries most at risk of extreme weather in 2015 are a number with considerable poverty levels, including MICs and LICs.
It is worth noting that most of the world’s poor live in 10 countries that are almost all listed in the top 20: China, India, Vietnam, Bangladesh, Ethiopia and the Philippines. Indeed, the countries listed above as most at risk account for 800 million of the world’s poor, although, of course, not all
64 Disaster risk ManageMent in Post-2015 DeveloPMent goals | Potential targets and indicators

2008-2050 are the most striking for Africa. In the period between 2008 and 2050, areas of Africa and Asia are forecast to lose between 10% and 20% in agricultural productivity on average. Areas in Central Africa and the southern and northern extremes of the continent are each expected to experience significant losses of at least 18%; East Africa is likely to be affected less severely, suffering similar productivity losses to parts of Asia and the Middle East – in the region of 10-14%.
6.4 Poverty, vulnerability and resilience
overviewIn light of the shifting geography of poverty and risk, this section outlines the set of relationships between poverty, vulnerability, risk and resilience, manifestations in the ‘new geography’ outlined above. The section thus focuses on questions of situating resilience amid boarder debates
those in India and China and other countries are at risk. Of the top 20 most vulnerable countries to climate change, a total of 11 are MICs, 4 are LICs and the remaining are members of the OECD. Of the MICs, both India and Indonesia are projected to experience dramatic increases in the size of the population vulnerable to sea level rises. With respective increases of 80% and 60%, the two countries are likely to house a combined total of over 58 million of the most vulnerable people by 2050. A further 6 million people in China will also be exposed to sea level rises, to make the total in that country 22 million. Nigeria, the Philippines and Egypt will also see the size of their vulnerable populations more than double between 2008 and 2050. Of the LICs, the size of Bangladesh’s vulnerable population is, unsurprisingly set to grow to around 27 million people – more than double the 2008 size – to become the second largest vulnerable population of the countries listed.
Another take on risk from climate would be agricultural productivity. Although extreme weather and sea level risks are dominant in MICs and Asia, projected agricultural productivity losses in
Figure 9: Daily income by probability of failing into poverty, Chile, Mexico and Peru
0
8.0
6.0
10.0
12.0
14.0
16.0
20.0
18.0
.00-.02. 04-.06. 10-.12. 18-.20. 26-.28. 50-.60.08-.10. 14-.16. 22-.24. 30-.40
4.0
2.00.10
8.59.69.7
Per c
apita
inco
me
a da
y (a
t 200
5 PP
P)
Probabilities of fall into poverty
Sour
ce: L
ópez
-Calv
a and
Ortiz
-Juar
ez (2
011)
.
Mexico PeruChile
65

the World Bank’s $1.25 or $2/day of Chen and Ravallion, 2008; 2012). However, over time, there has been a shift to human development (meaning health, education, nutrition and so forth) and more recently aggregating these into multidimensional poverty measures (e.g. the UNDP/Oxford Poverty and Human Development Initiative (OPHI) Multidimensional Poverty Index). In contrast, the relational or social aspects of poverty are non-material but play a significant role in shaping the material aspects. These might be taken to mean personal relationships and social relations. Finally,
on poverty and vulnerability. Poverty has been approached using various perspectives, but three aspects of poverty can be drawn out. These are material or physical aspects of poverty, relational or social aspects of poverty and subjective or perceptional aspects of poverty (see Table 14).
The material or physical domain of poverty has historically/typically been judged by income or consumption expenditure per capita (e.g. in developing countries by national poverty lines or internationally comparable measures such as
Fragile states = World Bank list or ‘Fragile Situations’ (34 countries); LDCs = UN list; Emerging Economies = IMF list of Emerging Market Economies.
Table 12 Estimates of poverty, $10/day per capita, 2010 and 2030
2010 Pessimistic Optimistic Pessimistic Optimistic Pessimistic Optimistic
Millions
Global total 5,130 6,010 5,107 5,780 4,481 5,514 4,149
Current LICs 699 1,117 1,056 1,115 1,048 1,119 1,057
Current MICs 4291 4,751 3,959 4,538 3,362 4,356 3,081
LDCs 763 1,217 1,150 1,220 1,151 1,223 1,160
Fragile states 350 622 568 623 568 624 569
Emerging economies 3,759 3,894 3,210 3,676 2,621 3,474 2,352
% of total
Current LICs 13.6 18.6 20.7 19.3 23.4 20.3 25.5
Current MICs 83.6 79.0 77.5 78.5 75.0 79.0 74.3
LDCs 14.9 20.2 22.5 21.1 25.7 22.2 28.0
Fragile states 6.8 10.3 11.1 10.8 12.7 11.3 13.7
Emerging economies 73.3 64.8 62.9 63.6 58.5 63.0 56.7So
urce
: Edw
ard a
nd S
umne
r (20
13).
Extrapolated current trends Static inequality ‘Best-ever’ distribution
66 Disaster risk ManageMent in Post-2015 DeveloPMent goals | Potential targets and indicators

Note: Remaining top 20 vulnerable countries are OECD countries.
the subjective or perceptional aspects of poverty are also non-material but play a significant role in shaping both the material aspects and the relational or social aspects. These could include subjective life satisfaction or satisfaction with environment (e.g. Gallup’s World Poll) or, for some, more hedonic concepts of happiness and/or mental wellbeing/health.
The material or physical aspects of poverty and vulnerability/resilienceIt has long been commonplace to think about poverty and vulnerability in terms of their material dimensions. Traditionally, there has been a focus on tangible assets and entitlements (such as income, labour, capital, as per the Sustainable Livelihoods approach). The assumption here is that assets and entitlements represent the resources that can be mobilised and managed when an individual or a system is confronted with a threat; in other words, resilience (Moser, 1998).
Households can also make ‘material-based’ decisions in order to increase their resilience. Morduch (1995) presents a range of examples that demonstrate how individuals and households engage in ‘income-smoothing’ activities, such as making conservative production or employment choices and diversifying economic activities, in order to protect themselves from ‘adverse income shocks’ before they occur (that is, ex-ante). Indeed, such ‘risk-averse’ strategies become even more important under conditions of compound and complex shocks and stressors.
The ‘material aspects’ also include the physical basis of poverty and vulnerability/resilience, meaning the proportion of the population without secure tenure, including slum dwellers, squatters and renters living without rent protection legislation, or where there is no legal requirement for households to be built to disaster standards; one could add also those without access to basic sanitation and water. A material focus on the geographical characteristics of a particular place has, in the past, and particularly in the disaster-risk literature, been used to identify people living in particular areas as vulnerable, when it is now widely acknowledged that ‘hazard risks, their impacts and local responses are not predetermined by individual or location’ (Webb and Harinarayan, 1999).
Table 13: Most vulnerable developing countries to sea level rises and vulnerable populations, 2008 vs. 2050.
Vulnerable population (millions)
2008 2050
MICs
India 20.6 37.2
China 16.2 22.3
Indonesia 13.0 20.9
Philippines 6.5 13.6
Nigeria 4.3 9.7
Vietnam 5.7 9.5
Egypt 2.1 6.3
Brazil 2.6 4.5
Turkey 2.6 3.9
Malaysia 1.9 3.5
Thailand 1.8 2.6
LICs
Bangladesh 13.2 27.0
Myanmar 2.8 4.6
Korea Rep 4.8 5.3
Mozambique 1.2 2.8
Sour
ce: W
heele
r (20
11).
67

Table 14: Poverty - areas and determinants
Material or physical aspects of poverty – ‘needs met’ and ‘practical welfare and standards of living’
Relational or social aspects of poverty – ‘ability to act meaningfully’ and ‘personal and social relations’
Subjective or perceptional aspects of poverty – ‘life satisfaction’ and ‘values, perceptions and experience’
Area The objectively observable outcomes people are able to achieve
The extent to which people are able to engage with others to achieve their particular needs/goals.
The meanings people give to the goals they achieve and the processes in which they engage.
Key determinants ● Income, wealth and assets ● Employment and livelihood
activities ● Education and skills ● Physical health and (dis)
ability ● Access to services and
amenities ● Environmental quality
● Relations of love and care ● Networks of support and
obligation ● Relations with the state: law,
politics, welfare ● Social, political and cultural
identities and inequalities ● Violence,conflictand(in)
security ● Scope for personal and
collectiveactionandinfluence
● Understandings of the sacred and the moral order
● Self-concept and personality
● Hopes, fears and aspirations
● Sense of meaning/ meaninglessness
● Levels of (dis)satisfaction ● Trust and confidence
Sour
ce: A
dapte
d fro
m Mc
Greg
or an
d Sum
ner (
2010
).
However, it is important to see poverty not as a state but as a trajectory, as vulnerability and resilience help determine these trajectories. There is a rich literature on vulnerability to poverty (e.g. Dercon and Shapiro, 2007; Hulme et al., 2001; Pritchett et al., 2000). Certainly, people move in and out of poverty, and do not escape poverty at once but in a series of steps (see Dercon and Shapiro, 2007; Narayan and Petesch, 2007). This implies that many of those labelled ‘poor’ are moving in and out of poverty, depending on vulnerabilities, shocks, stresses and capacities to cope; and that those above $2/day may actually sometimes be ‘poor’.
Material poverty remains an issue in MICs despite higher average income per capita. In the LMIC group, a third of the population comes under $1.25 and 60% of the population is living under $2 (see Table 11). That said, the costs of ending $2 poverty as a proportion of GDP are likely to be negligible by 2020-2030 (Sumner, 2012c). Thus, the use of the $10/day per capita ‘resilience line’ outlined above may be useful in the post-2015 framework (see Table 15).
The relational or social aspects of poverty and vulnerability/resilienceAs noted above, poverty and vulnerability are about governance and formal and informal institutions. North (1995) notes in his seminal work that institutions are the ‘humanly devised constraints that structure human interaction […] composed of formal rules […] [and] informal constraints’. While the risk of a household falling below the poverty line is minimised in a society in which formal safety nets exist, such as the provision of basic levels of welfare and social protection, in many developing countries life is ‘non-insured’ (Duffield, 2008).
This can be related to McGregor’s work (1991; 1994) on patron–client relations in Bangladesh. McGregor found that, in order to cope with their environment and avoid poverty and vulnerability in the present, poor people entered into ‘bargains’ with wealthier patrons, who in turn provided a level of welfare and security. As a consequence of this bargain or negotiation, however, the client’s ability to seek routes out of poverty in the longer term was diminished. As the author argued, ‘consenting participation in the existing hierarchical organisation of rural society, which assures some degree of security, reinforces the institutions which
68 Disaster risk ManageMent in Post-2015 DeveloPMent goals | Potential targets and indicators

disaster is rooted in the particular social structure of the community that has been affected by a given hazard. Depending on one’s characteristics, relationships, networks and status, perceptions of what constitutes being or feeling ‘vulnerable’ can vary enormously. For example, research by Valentine (1989) into how men and women experience public spaces differently explores the various ways in which perceptions of vulnerability and resilience can be influenced and defined. As Cannon (1994) explains, the determination of vulnerability and resilience is a complex characteristic formed by a mix of factors, which are themselves derived in large part from class, gender and ethnic attributes, as well as from personal perceptions of vulnerability and resilience. The same ideas apply to perceptions of risk.
The value of a subjective approach to vulnerability and resilience is that it compels us to question the assumptions that go into both vulnerability and resilience assessments and common attitudes towards vulnerabilities. It also represents a step in the direction of privileging hitherto silenced voices, and tailoring a perspective of vulnerability and resilience that is more contextually sensitive. Finally, none of these three aspects of poverty should be viewed in isolation; each is interacting and producing compound outcomes. Rather, how people feel (subjective aspects) can have significant consequences for the behaviour and activities of individuals, which can in turn shape material and relational/social wellbeing. Similarly, people’s actual experiences of and exposure to disasters can shape their future perceptions and responses. An element here is the degree of risk awareness of specific populations: in some
serve to deny the possibility of easy recourse to other organisational arrangements (for example, cooperation amongst the poor, or open access to markets, or to government social security)’.
Thus, in reality, the poor face something of a trade-off: longer-term aspirations are foregone in favour of more immediate imperatives regarding basic livelihood security. So, where formal welfare regimes are non-existent, informal institutions, such as the organisational hierarchies of Bangladeshi rural society, take on a greater significance. The treatment here of this domain is inevitably summarised, given space constraints. One could draw further from an extensive literature on social networks; politics and political relationships; employer–employee relationships; and market relationships.
Access to formal (e.g. government-backed), reliable social protection (meaning social insurance and social assistance) is instrumental in reducing vulnerability to poverty. Thus such indicators would be useful indicators of poverty from a resilience lens. Coverage of and spend on social protection in MICs is improving significantly, with coverage rates in many LMICs and UMICs reasonable and spending on social protection in the range of 5-10% of GDP (see Table 16).
The subjective or perceptual aspects of poverty and vulnerability/resilienceFinally, it is important to note the ways in which poverty and vulnerability are, perhaps above all, highly subjective in people’s experiences and responses. Quarantelli (2005) contends that any
Table 15 indicators of 'material or physical aspects of poverty' (standards of living and risk)
Indicators Proportion of the population above/below the ‘security poverty line’ of $10 PPP per capita at which the risk of falling back into poverty falls drastically.
Equity sub-indicator Ratio of population above $10 to that below $10 would capture inequality of risk.
Dataset World Bank, PovcalNet, 1981-2008, 127 developing countries.
Feasible 2030 target A feasible global target for 2030 would be to reduce by 1 billion the number of people ‘at risk’, meaning under $10 per capita.
69

burning stressors depleting resilience/capacities to cope and compounded and co-evolving exposure. However, given that the bulk of the world’s poor (however defined) are no longer concentrated largely in the world’s LICs or aid-dependent countries, the prospects for increasing resilience are, in many countries, not hindered by overall financial resources per se to the extent they were in the MDG period. To that end, three poverty indicators (with respective 2030 targets) have been proposed to support the inclusion of resilience building in the post-2015 framework.
places risk awareness may be greater. Further, a collective and historic experience of disasters also shapes social norms, which may be more important in terms of shaping behaviour.
In light of this, a new indicator could be added to the Gallup World Poll to report the proportion of the population replying positively to the question, ‘Are you better able to cope with hazards/shocks than a years ago?’ There is an alternative, and existing, potential question in the Gallup World Poll: ‘Is the area where you live becoming more liveable?’ (see Table 17).
6.5 Concluding remarksThis chapter has focused on questions of enhancing resilience and reducing vulnerability amid broader debates on poverty and vulnerability reduction in the post-2015 framework(s). The poor (however defined) face various variabilities, in terms of not only in terms of shocks but also slow-
Table 16 indicators of 'social or relational aspects of poverty' (societal relations and risk management)
Indicators Proportion of the population ‘not receiving social protection’ or social protection expenditures as % of GDP.
Equity sub-indicator Ratio of population covered to the population not covered would capture inequality of risk.
Dataset Coverage data: World Bank, ASPIRE dataset, 2005-2010, 55 developing countries; expenditure data: World Bank Social Safety Net dataset, 2000-2010, 87 countries
Feasible 2030 target A feasible target for 2030 could be developed from the data, for example to increase social protection spend to 5% of GDP or 75% population coverage. This would be based on the logic that the current median spend in the countries with data is around 5% of GDP. The OECD average is 15% of GDP. In terms of current coverage: Afghanistan, 2007: 15% of population ‘receiving social protection’.
Table 17 indicators of 'subjective and perceptional aspects of poverty' (personal perceptions and risks)
Indicators A new indicator added to the Gallup World Poll reporting the proportion of the population replying positively to the question, Are you better able to cope with hazards/shocks than a years ago?
Equity sub-indicator Ratio of the population replying high positive to population replying low negative (assuming a sliding scaleoffiveresponses)tothequestion would capture inequality of risk.
Dataset Gallup World Poll would be able to collect the data.
Feasible 2030 target A feasible target for 2030 could be ambitious – for example positive end-of-scale responses from over 75% of the population. An alternative indicator, already available in Gallup World Poll is, Is the area where you live becoming more liveable?
Chapter 6 Endnotes
1 This section and below draw in particular on Sumner and Mallet (2013).
70 Disaster risk ManageMent in Post-2015 DeveloPMent goals | Potential targets and indicators

Chapter 7
71
Drr in an education goal
Lisa Zook sorensen, richard rumsey and Fe garcia World Vision1
realising the interplay of education and disaster risk reduction in development goals: a review of integrated indicators and options for post-2015

Executive summaryThe 2000-2015 MDGs framework was risk blind, not taking into account the impact of natural hazards, conflict and climate change on sustainable development. However, as evidence mounts regarding the ways in which disasters challenge development, this is being seen as an increasingly important topic for the post-2015 agenda. This chapter puts forward options and recommendations for targets and indicators that leverage the interplay between education and DRR.
Education is unique in that disasters have a great impact on the sector yet in itself it is also a powerful tool to reduce disaster losses. Specifically, disasters have a major effect on educational achievements by damaging school infrastructure and disrupting education cycles, thereby affecting the most vulnerable and exacerbating poverty, forcing children to drop out of school and undermining the resiliency of communities. At the same time, however, education, which increases public awareness and equips youth with critical thinking skills, is essential to build disaster resilience.
Since DRR is inherently a cross-sectoral field, it is believed that having education-related DRR concepts in both an education goal and a DRR goal encourages integration and synergy, leading to a more comprehensive approach to DRR. The table below presents proposed targets and indicators, which were generated through a literature review and stakeholder discussions.
The post-2015 MDG agenda has the opportunity to create an integrated and holistic approach to education and child wellbeing. While there is a need to prioritise DRR/climate change adaptation (CCA)/resilience in order to better safeguard the provision of education services to ensure quality education, education is an essential tool for promoting DRR and CCA skills development, behaviour change and action. Creating clear and measurable indicators that leverage this interplay is challenging, but funding needs to be invested in participatory and transparent/accessible mechanisms to document and hold governments (national and local) accountable. With relevant and appropriate integration of DRR/CCA into development policies and interventions for education, it is envisaged that there will be substantial increased resilience of vulnerable children and their communities to changing risks.
7.1 PurposeThe 2000-2015 MDGs framework was risk blind, not taking into account the impact of natural hazards, conflict and climate change in terms of sustainable development. However, as evidence mounts regarding the ways in which disasters challenge development, this is being seen as an increasingly important topic for the post-2015 agenda. Disaster risk and resilience2 cuts across multiple development sectors, and the UN System Task Team on the Post-2015 Development Agenda plans to consider goals in this area as they relate to mortality, economics, poverty, health and education.
This chapter puts forward options and recommendations for targets and indicators that leverage the interplay between education and DRR3 by:
● Examining the role of DRR in educational achievement as well as the role of education in strengthening DRR efforts;
● Providing an overview of relevant target/indicators to date;
● Discussing the advantages and disadvantages of different options for targets/indicators;
● Identifying what the preferred targets and indicators are and why;
● Discussing what it will take to gather and assess data; and
● Discussing what other practical opportunities and challenges exist.
7.2 introductionA universal challenge of the 21st century, the increasing threat of disasters and their costly consequences demand that the international community integrate DRR into the post-2015 agenda. As evidenced by both the HFA (i.e. HFA Priority 3 on DRR Knowledge and Education) and the UN Framework Convention on Climate Change (UNFCCC) (Article 6), awareness has grown on the significance of climate change, reflecting both an increase in knowledge regarding the phenomenon and mounting concerns worldwide about the frequency of natural disasters.
73

losses. More than a billion students are enrolled in primary and secondary school, with about 875 million school children living in high seismic zones and hundreds of millions exposed to regular flood, landslide, extreme wind and fire hazards (UNISDR, 2010). While loss of life from major disasters is decreasing significantly, economic and livelihood losses associated with disasters are increasing considerably, undermining already stressed education budgets, as well as aggravating barriers to children’s access to education and completion of quality learning – particularly for girls and other marginalised groups. In particular, disasters have an impact on education by (Risk RED, 2008):
increasing death tolls on students, teachers and staffExclusion from education can result when students, teachers and staff are killed or suffer physical harm as a consequence of unsafe school infrastructure. The 2008 earthquake in Sichuan, China, killed around 5,335 children because school classrooms collapsed, in many cases while buildings around them stood firm (Branigan, 2009). The 2005 earthquake in Kashmir left 17,000 students dead inside their classrooms, with at least 20,000 more disabled or severely injured. The 2012 earthquake in Haiti left hundreds of teachers and thousands of students dead when more than 3,000 school buildings in the earthquake zone were destroyed or damaged, according to estimates by the UN Children’s Fund (UNICEF) (Romero, 2010). Those in schools built in harm’s way (i.e. land exposed to floods, landslides, tsunamis and earthquakes) or not built to withstand expected and recurring natural hazards can experience fatal or serious injury, given the concentration of students attending classes at the same time (i.e. Haiti earthquake) … impacts that could be prevented!
Disrupting educational services and learning
● Access to school: damages caused by disasters can result in students and teachers as well as school personnel being cut off from school facilities. Flooded rivers and plains, damaged bridges and blocked roads are a common occurrence in disaster-prone areas. In Cambodia’s flood-prone areas, the annual
Knowledge and education is a key component in resilience-building strategies. The HFA (2005-2015) serves as the first effort to explain, describe and detail the work required of all different sectors and actors – including education – to reduce disaster risk. A number of agencies see the post-2015 development agenda as providing a new chance to address the underlying causes of vulnerabilities and hazards, particularly for at-risk children and communities. Furthermore, the post-2015 HFA agenda is an unparalleled opportunity to demonstrate international leadership on integrating DRR into the top-level framework that will guide poverty reduction and development efforts after the MDGs.
Education is unique in that disasters have a great impact on the sector yet in itself it is also a powerful tool to reduce disaster losses. Specifically, disasters have a major effect on educational achievements by damaging school infrastructure and disrupting education cycles, thereby affecting the most vulnerable and exacerbating poverty, forcing children to drop out of school and undermining the resiliency of communities (WHO, 2009a). At the same time, however, education, which increases public awareness and equips youth with critical thinking skills, is essential to build disaster resilience, as illustrated by HFA Priority Action 3, ‘Use knowledge, innovation and education to build a culture of safety and resilience at all levels’. As a result, this chapter sets out potential indicators and targets relating to (i) education as a tool for building disaster resilience and (ii) DRR as an essential practice for improving the educational attainment of children around the world.
7.3 impact of disasters on educationThe World Education Forum, which supports the Dakar Framework for Action on Education for All (EFA) by the year 2015, is acutely aware of the significant challenges disasters pose in hazard-prone countries to meeting their EFA goals and the need for international support to mitigate these effects.4 Natural hazards and extreme weather patterns destroy educational institutions, interrupt educational processes and result in great human
74 DISASTER RISK MANAGEMENT IN POST-2015 | DEVELOPMENT GOALS: POTENTIAL TARGETS AND INDICATORS

swelling of the Mekong River reportedly cause 60% of schools to close for 2.5 months each school year (Risk RED, 2008). In Nepal since 1991, the number of days off has increased by up to 65% in both the hills and the Terai, though slightly more in the former. Much of this increase is attributed to extreme weather and natural disasters and to the use of schools as shelters in the aftermath of such occurrences. The number of days off is so great that it threatens to reduce school attendance to below the required 220 days (Plan International, 2012). Chaos and lack of law and order in the aftermath of disasters also cause concern for the safety of girls in travelling to schools (Plan International, 2013).
● School interruption when school facilities are used as shelter: Schools are often used as shelter for those internally displaced by disasters. ‘Pakistani children reported schools staying closed for six months after the 2010 Attabad landslide disaster, as school buildings became refugee camps’ (ODI and Plan International, 2012). Throughout South and Southeast Asia, annual monsoons and typhoons, and inadequate housing and emergency asylum, force large numbers to seek shelter in schools, sometimes for a month at a time, causing students to fall behind and many to drop out.
● New responsibilities for children, affecting enrolment and gender parity: school enrolment dropped, especially among girls, in Bolivia, Indonesia, Nepal and Vietnam following extensive disasters (UN, 2011). Death or injury of parents or caregivers, or simply loss of family income, forces children to take on new responsibilities, such as looking after younger siblings, or to adopt new livelihood responsibilities. Loss of housing and harvests/land forces disaster-affected families to relocate, causing disruption to children’s education, as well as making families rely on their children for greater support with household chores and income generation activities. Girls and boys in South Asia have shared how frequent droughts and floods are increasing their workload within the home, as well as child labour, early marriage and child trafficking (ODI and Plan International, 2012).
● Lost school days owing to climate change impacts on morbidity: climate change puts
more children at risk of malaria and dengue fever. Increases in rainfall, temperature and humidity will favour the spread of malaria-transmitting mosquitoes, which could ‘put 220 million to 400 million additional people at greater risk of the disease that kills about 1 million a year’. Additionally, reduced water availability as a result of climate change inhibits provision of school sanitation, often meaning menstruating girls have to stay at home.
Wasting development investments ● Impacts on school facilities: if schools are
damaged as a result of a disaster, children are left without a place to learn. With no plans for an alternative location or facility, children may be excluded from school for prolonged periods of time and in great numbers. In 2008, heavy flooding in Bolivia damaged 347 schools, interrupting the education of 20,000 students.5 The 2006 Super Typhoon Durian in the Philippines caused $20 million in damage to schools, including to 90-100% of school buildings in three cities and 50-60% of school buildings in two other cities (UNISDR, 2008b).
● Reverses in progress on youth economic empowerment: the World Bank states that, ‘Much of the progress so far achieved [...] to tackle challenges of high unemployment and integration with the global economy can be jeopardised by climate change. Income and employment may be lost as a result of more frequent droughts in rural areas, and floods and sea surges in urban and coastal areas’.6 The increased strain from damages and economic losses resulting from disasters is set to exacerbate problems in already under-resourced education systems, and calls for a greater focus on relevant education to ensure future generations have the skills to adapt to climate change.
inhibiting recovery and resilience ● Psychosocial impacts on students, teachers
and staff: without knowledge of the hazards associated with context-specific disasters and vulnerabilities, and without risk reduction literacy, school communities can fall into perpetual cycles of incapacity, where low levels of functionality block proactive prevention, protection and response to catastrophes.
75

● Changing perceptions and behaviours (Adams, 2012; PISA, 2006): evidence shows that investments in climate change education, including DRR, can change both perceptions and behaviours. An individual’s attitudes and behaviours with regard to the environment are likely the result of multiple factors, including knowledge, awareness, attitudes and social expectations.8
● Increasing environmental responsibility for sustainable development: a better understanding of scientific knowledge is associated with greater environmental awareness and a stronger sense of responsibility for sustainable development (ADEA, 2010). Relevant education content such as climate literacy and green technology can help provide the knowledge and skills needed for making informed decisions about how to adapt to a changing environment.
● Equipping students with critical thinking and problem-solving skills: critical thinking and problem-solving skills help learners make informed decisions about how to adapt to a changing environment. Given the uncertainty that climate change brings, education can provide the necessary skills to enable students to comprehend, analyse and use information to think creatively and change behaviour in order to adapt to different futures.9
● Empowering communities through both formal and non-formal learning: education is a key platform for disseminating useful information on global collective actions and negotiations, as well as local awareness, local impacts and local actions that are needed for climate change adaptation and mitigation as well as food and energy security. Recent studies from the World Bank and the Centre for Global Development state that educating girls and women is one of the best ways of ensuring that communities are better able to adapt and thus be less vulnerable to extreme weather events and climate change.10
● Raising awareness about hazards, related risks and possible responses: this can be done by mainstreaming DRR into the national/local education system, in primary and secondary schools as well as within tertiary and vocational institutions, in order to help raise awareness and understanding about different local hazards. ‘This can also be
Interruptions to students’ education and learning trajectory could reduce their confidence and hopes for a promising future. Without psychosocial support, post-traumatic stresses can also inhibit some children from refocusing on their studies long after a disaster event has passed.
● Missed opportunity to offer stability and hope in times of crisis: ‘Education in emergencies is a necessity that can be both life-sustaining and life-saving, providing physical, psychosocial and cognitive protection. It sustains life by offering structure, stability, and hope for the future during a time of crisis, particularly for children and adolescents, and provides essential building skills, and supporting conflict resolution and peace-building’ (INEE, 2008).
All girls and boys have a fundamental right to both education and safety under the UN Convention on the Rights of the Child. Equal access for all children to quality and relevant learning and to safe schools is a growing development challenge, one that is exacerbated by climate shocks and other stresses. Ensuring education continuity within a safe, resilient environment is of utmost importance. Equally essential is that the post-2015 education targets and indicators focus on relevant and quality learning that will equip students with CCA and DRR skills that will be of use for their future families and livelihoods (UNESCO, 2012).
7.4 The role of education in strengthening Drr efforts and building resilience7
Education can be a cost-effective approach to proactively building DRM and resilience in communities. It provides sectoral, widespread reach and systemic sustainability for climate-smart DRR awareness raising, knowledge and skills development. The HFA acknowledges the role of education in solving the global challenge of climate change and disasters and calls for the use of knowledge, innovation and education to build a culture of safety and resilience at all levels. Education plays an instrumental role in DRR by:
76 Disaster risk ManageMent in Post-2015 DeveloPMent goals | Potential targets and indicators

UNESCO and UNICEF are leading the Global Thematic Consultation on Education in the Post-2015 Development Agenda. This commenced in September 2012 and is coming to a close in March 2013, and aims to define the role of education in the post-2015 development agenda. It is expected to (i) review the international education and development experience since 2000; (ii) identify current development trends and challenges, as well as future scenarios that need to be taken into account when defining the post-2015 education framework, including conflict, climate change and increasing disasters; (iii) look at cross-cutting themes;12 and (iv) consider the nature of the post-2015 agenda.
Proposals for the post-2015 education goals from the Basic Education Coalition, the Centre for International Governance Innovation, the Global Campaign for Education, the Commonwealth Secretariat and Save the Children push the quality and equity of education (see Annex E). Additionally, the Global Campaign for Education – US Chapter (2013) states, ‘as the world envisions global challenges beyond 2015, certain cross-cutting issues come into focus. Economic stability and youth unemployment, security and conflict, climate change and environmental sustainability – education is at the centre of all of these leading global challenges and their solutions.’ In this context, the value of teaching ‘life skills’, which provides an easy entry point for DRR, is expected also to receive appropriate attention.
The Learning Metrics Task Force (LMTF)13 is an instrumental contributor to the collaborative development of post-2015 education targets and indicators for post-2015. Co-convened by the Center for Universal Education at The Brookings Institution and UNESCO’s Institute for Statistics, the LMTF aims to develop a global consensus on measuring learning beyond literacy and numeracy in order to achieve the vision of ‘what every child everywhere should learn and be able to do, whether at the classroom, system, or global level, by the time they reach post-primary age’. The task force has released its first report, ‘Towards Universal Learning: What Every Child Should Learn’, with a holistic framework of seven learning domains important for children and youth to develop. An LMTF Measurement and Metrics Task Force has started to meet to address ways to measure learning outcomes. Overall, any consensus on the post-2015 education metrics
passed on by students and teachers to family members, and therefore has an additional secondary impact’.11
The UN Educational, Scientific and Cultural Organization (UNESCO) promotes Education for Sustainable Development (ESD) (Poutrel, 2012), which tasks education with seeking to ‘balance human and economic well-being with cultural traditions and respect for the Earth’s natural resources’ and draws attention to learning content, including citizenship, peace and health education, among others. ESD, through its interdisciplinary and holistic approach to learning, can help create resilient societies and encourage a long-term perspective in decision-making processes, critical thinking and holistic and innovative approaches to problem solving. In this way, ESD can make a substantial contribution to DRR, while DRR can in turn increase the relevance and quality of education in disaster-prone areas. The post-2015 agenda is the ideal place to emphasise education for sustainable development.
7.5 Education metricsThis chapter proposes to integrate DRR-related targets and indicators into the education metrics for post-2015. To do so, it is first important to understand the current thinking on the post-2015 development agenda relating to education and where DRR-related targets and indicators, including CCA education, are applicable.
Overall, there is an overwhelming push for the education goals post-2015 to refocus on quality learning without compromising efforts to secure 100% access to education; to better align the EFA and education MDG frameworks, as well as with the Global Campaign for Education, the Global Partnership for Education, Education First and the UN Girls’ Education Initiative; and to pay more attention to equity. While the Dakar Framework for Action on EFA was broad reaching in its agenda, focusing on the education spectrum from early childhood care and education, to primary and secondary education, and adult learning, the MDGs on education (MDG 2 and MDG 3) narrowed this focus to universal primary schooling and gender equality.
77

national and sub-national education authorities and local school communities (including children), working in collaboration with their disaster management counterparts in order to maintain safe learning environments and plan for educational continuity, conforming to international standards; and
● DRR education and life skills, which should be designed to develop a culture of safety and resilient communities.
Based on the learning and good practices from these initiatives, this chapter proposes that the post-2015 agenda focus on risk reduction and building resilience in the education sector, in order not only to mitigate the effects disasters have education, but also to use education to empower children and their communities to be better prepared before, during and after disasters. In addition, relevant DRR/CCA knowledge and skills need to be part of post-2015 aims for education quality and equity, so future generations can adapt and prosper through future resilient livelihoods.
7.7 A review of possible targets and indicators addressing education and Drr Since the literature does not explicitly state or propose targets, we have created an initial, indicative list of possible targets, adapted from the outcomes, commitments and key actions in the literature as described in Section 6.6 and outlined in Annex F. We categorise these possible targets using the three pillars of Comprehensive School Safety and list them in Table 19. Table 19 outlines only the targets we developed and considered in the development of this chapter, on the basis of initiatives described in Section 6, in order to narrow things down to the proposed targets and indicators discussed in Section 6.9.
The targets considered above would be disaggregated by age and sex, and, when feasible, include disability in order to ensure equity and inclusiveness. In addition, the term ‘disaster’ in the indicatorsagainreferstothebroaderdefinitionthatincludes, but is not limited to, natural disasters, longer-term consequences of climate change,
is still far from reality. Proposals for universal learning targets are particularly controversial, so this chapter is limited to the current discussions.
7.6 A review of current initiatives addressing education and Drr Several initiatives that address the interplay of education and DRR currently exist. In the development of this paper, we reviewed these current guidelines, frameworks and initiatives. It is important to keep in mind that not every initiative has outlined concrete goals, targets and indicators in this area. Rather, several organisations outline activities or priorities with possible sources of data to measure. Bearing this in mind, we discuss the advantages and disadvantages of each initiative below with the goal of consolidating priorities for the post-2015 agenda. We have examined each framework in terms of how representative it is of DRR-related education challenges; its emphasis on using education as a tool for DRR; its suitability for translation to national, sub-national and community levels; its clarity; and its measurability. By no means is this a comprehensive review; rather, it is an initial look into the current work being done in this area. Please refer to Annex F for a more comprehensive description of each initiative.
As described above, most current practices are focused primarily on one of the following: (i) mitigating the impacts disasters have on education by safeguarding schools; (ii) ensuring education continuity in emergencies; or (iii) empowering the community and students to build disaster resilience. While each of these areas is essential, this chapter seeks to propose a set of targets and indicators that ensure the interplay between education and DRR is realised before, during and after an emergency. As a result, this chapter uses the three pillars from the Comprehensive School Safety Framework as an all-encompassing way to frame education and DRR (ADPC et al., 2012):
● Safe school facilities, which involves education authorities, architects, engineers, builders and school community members in safe site selection, design, construction and maintenance (including safe and continuous access to the facility);
● School disaster management established via
78 Disaster risk ManageMent in Post-2015 DeveloPMent goals | Potential targets and indicators
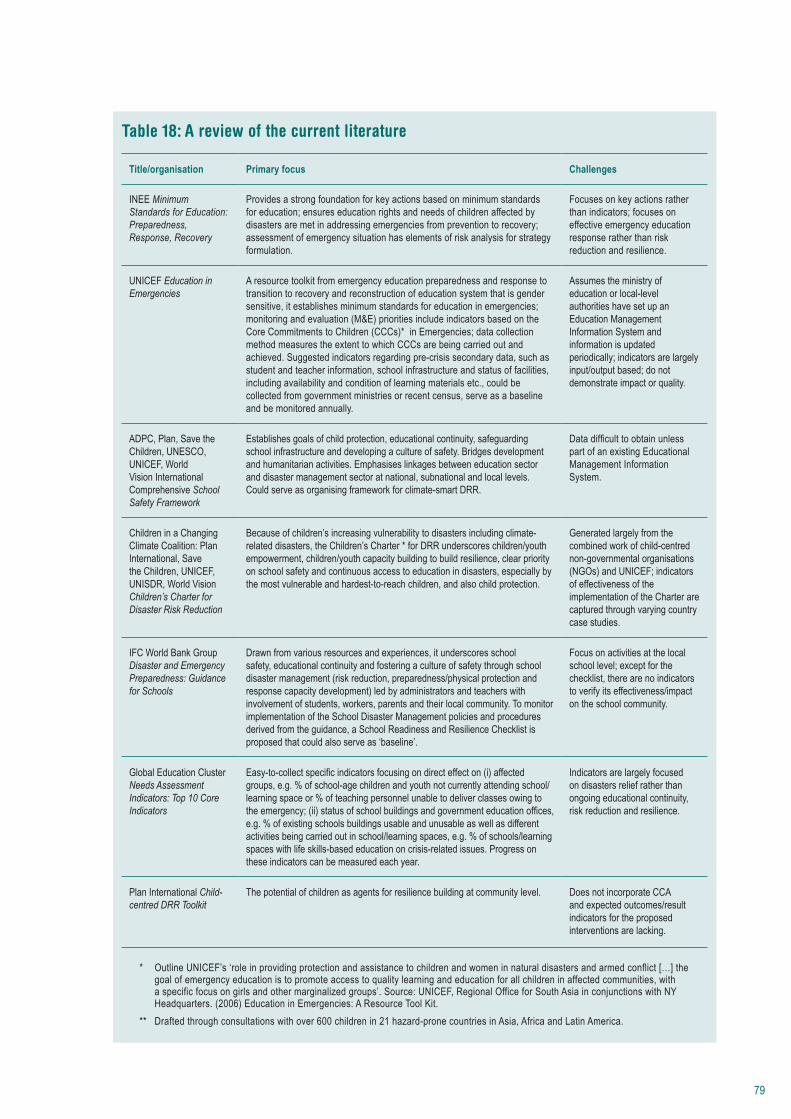
Table 18: A review of the current literature
Title/organisation Primary focus Challenges
INEE Minimum Standards for Education: Preparedness, Response, Recovery
Provides a strong foundation for key actions based on minimum standards for education; ensures education rights and needs of children affected by disasters are met in addressing emergencies from prevention to recovery; assessment of emergency situation has elements of risk analysis for strategy formulation.
Focuses on key actions rather than indicators; focuses on effective emergency education response rather than risk reduction and resilience.
UNICEF Education in Emergencies
A resource toolkit from emergency education preparedness and response to transition to recovery and reconstruction of education system that is gender sensitive, it establishes minimum standards for education in emergencies; monitoring and evaluation (M&E) priorities include indicators based on the Core Commitments to Children (CCCs)* in Emergencies; data collection method measures the extent to which CCCs are being carried out and achieved. Suggested indicators regarding pre-crisis secondary data, such as student and teacher information, school infrastructure and status of facilities, including availability and condition of learning materials etc., could be collected from government ministries or recent census, serve as a baseline and be monitored annually.
Assumes the ministry of education or local-level authorities have set up an Education Management Information System and information is updated periodically; indicators are largely input/output based; do not demonstrate impact or quality.
ADPC, Plan, Save the Children, UNESCO, UNICEF, World Vision International Comprehensive School Safety Framework
Establishes goals of child protection, educational continuity, safeguarding school infrastructure and developing a culture of safety. Bridges development and humanitarian activities. Emphasises linkages between education sector and disaster management sector at national, subnational and local levels. Could serve as organising framework for climate-smart DRR.
Datadifficulttoobtainunlesspart of an existing Educational Management Information System.
Children in a Changing Climate Coalition: Plan International, Save the Children, UNICEF, UNISDR, World Vision Children’s Charter for Disaster Risk Reduction
Because of children’s increasing vulnerability to disasters including climate-related disasters, the Children’s Charter * for DRR underscores children/youth empowerment, children/youth capacity building to build resilience, clear priority on school safety and continuous access to education in disasters, especially by the most vulnerable and hardest-to-reach children, and also child protection.
Generated largely from the combined work of child-centred non-governmental organisations (NGOs) and UNICEF; indicators of effectiveness of the implementation of the Charter are captured through varying country case studies.
IFC World Bank Group Disaster and Emergency Preparedness: Guidance for Schools
Drawn from various resources and experiences, it underscores school safety, educational continuity and fostering a culture of safety through school disaster management (risk reduction, preparedness/physical protection and response capacity development) led by administrators and teachers with involvement of students, workers, parents and their local community. To monitor implementation of the School Disaster Management policies and procedures derived from the guidance, a School Readiness and Resilience Checklist is proposed that could also serve as ‘baseline’.
Focus on activities at the local school level; except for the checklist, there are no indicators to verify its effectiveness/impact on the school community.
Global Education Cluster Needs Assessment Indicators: Top 10 Core Indicators
Easy-to-collectspecificindicatorsfocusingondirecteffecton(i)affectedgroups, e.g. % of school-age children and youth not currently attending school/learning space or % of teaching personnel unable to deliver classes owing to theemergency;(ii)statusofschoolbuildingsandgovernmenteducationoffices,e.g. % of existing schools buildings usable and unusable as well as different activities being carried out in school/learning spaces, e.g. % of schools/learning spaces with life skills-based education on crisis-related issues. Progress on these indicators can be measured each year.
Indicators are largely focused on disasters relief rather than ongoing educational continuity, risk reduction and resilience.
Plan International Child-centred DRR Toolkit
The potential of children as agents for resilience building at community level. Does not incorporate CCA and expected outcomes/result indicators for the proposed interventions are lacking.
* Outline UNICEF’s ‘role in providing protection and assistance to children and women in natural disasters and armed conflict […] the goal of emergency education is to promote access to quality learning and education for all children in affected communities, with a specific focus on girls and other marginalized groups’. Source: UNICEF, Regional Office for South Asia in conjunctions with NY Headquarters. (2006) Education in Emergencies: A Resource Tool Kit.
** Drafted through consultations with over 600 children in 21 hazard-prone countries in Asia, Africa and Latin America.
79

violenceandconflict.Targetswerediscussedusingthe ODI criteria for an effective target, outlined in Annex G.
Protection of children’s life is absolutely paramount to any other goal. While accurate assessment of Target A is dependent on existing data, the quality of which is highly questionable, concerted efforts are required to ensure that reliable data necessary to monitor and measure this target are collected. We added the clause regarding ‘new schools built after 2015’ after the literature review revealed the high price of retrofitting,whichwouldmakeitanextremelydifficulttarget for most countries.
Target B is a priority in that it encourages continuity of education in emergencies. The associated indicators would have to address the assessment of safety and accessibility for a child, which may prove challenging.
Targets C and D emphasise the importance of DRR through policy and advocacy. Target C is a national-level target that incorporates other sectors to ensure the integration of DRR. Target D is a local-level targetthatrelatesmorespecificallytoschoolsandincorporates the best practices in Section 6.6 of Disaster Management Committees to ensure safety in schools.
Targets E and F encourage and emphasise the importance of using education as a tool for DRR, an essential consideration for the post-2015 agenda. Target E is aspirational in that it examines individual children being equipped with essential DRR- and CCA-related knowledge and life skills. Whether these data are easy to obtain will depend on the indicators relating to life skills measurement that are a current topic in post-2015 education discussions. Target F takes a similar approach, but is slightly easier to collect data on, given that it is evaluated at the school level. It is important to consider that much time and detail are necessary to develop and contextualise such life skills curricula.
7.8 A review of possible indicators addressing education and Drr We took an approach similar to that in Section 7.7 in the review of possible indicators to address the interplay between education and DRR. Again, we
examined possible indicators using the ODI criteria in Annex G.
Indicator H is a measure of possible Target C, ‘By 2030, all nations have developed national DRR and resilience plans for each sector’. While it is a necessary indicator and target for national-level DRR, it is importanttorecognisethatcomparabilitywillbedifficultas a result of disparities across communities, nations andevenregions(includingriskprofile,resourcesandcapacity and other competing priorities being set for theeducationsector).Transparencymaybeinfluencedby what different governments deem appropriate for their image internationally and/or by the ease of data collection. It is possible that civil society will play a role toincreaseaccountabilityandsupportbeneficiaries’engagement in M&E. Possible Indicator J addresses the lack of documentation regarding disasters and education by encouraging data management plans.
Comparing indicators C and D, D is the preferred option because it takes into account local barriers that may prevent children from attending school as a result of a disaster. For instance, it would evaluate days missed as a result of a child being fearful of violence in the school as well as whether a child is unable to attend school because his or her uniform has been ruined as a result of a disaster and can no longer meet uniform requirements. Possible Indicator C, however, is easier to collect data on.
Indicators A and E refer to ensuring school infrastructure safety through architectural and structural compliance. ‘Safe’ buildings are largely dependent on the adoption and implementation of appropriate building codes and construction supervision processes. Supporting governments to achieve quality construction that is safe for occupation is part of a wider issue and cannot be dealt with only as part of an education focus. Individual schools have a strong role in safety, but government engagement is key in terms of compliance with building codes and addressing larger issues such as appropriate land allocation and procurement policies/M&E.
7.9 Proposed targets and indicators Given that DRR has a great impact on educational achievement and education is a useful and necessary tool for DRR, we propose emphasising
80 Disaster risk ManageMent in Post-2015 DeveloPMent goals | Potential targets and indicators

Table 19: Possible education/Drr targets
Possible target Type
Safe school facilities
A. By 2030, halve the number of children killed in schools by disasters, with no children killed by disaster in a new school built after 2015 (disaggregated by sex and age)
Impact
B. By 2030, every child is educated in a quality learning environment that is safe and accessible (disaggregated by sex and age)
Outcome
School disaster management
C. By 2030, all nations have developed and resourced/implemented national DRR, CCA and resilience plans for each sector
Outcome
D. By 2030, all schools have in place an integrated DRR process with local government and communities, prioritising disaster management and resilience building
Outcome
Disaster risk reduction education and life skills
E. By 2030, all children are equipped with DRR- and CCA-related life skills preparing them for a safer and prosperous future (disaggregated by sex and age)
Outcome
F. By 2030, all schools use knowledge, innovation and education to build a culture of safety and resilience through curricular and co-curricular activities
Outcome
the interplay of education and DRR in both the education-specific sector goal, targets and indicators and the DRR-specific sector goal, targets and indicators. Mitchell (2012) writes, ‘A preferred outcome for the inclusion of disaster resilience in the post-2015 development framework would see it represented as a single goal (vertical integration) as well as treated as an indicator in a range of other goals (horizontal integration)’.
As discussed previously, it is expected that the post-2015 agenda (assuming an education goal is retained) will most likely focus on learning outcomes (numeracy and literacy) and other learning domains (in particular relevant learning for skills and job creation)14 that could incorporate DRR, CCA and resilience. In a 2013 Children in a Changing Climate consultation with children across the world on their views on the priorities of the post-HFA, children expressed the desire to have skills that ‘enable them to protect themselves from risks and troubles’ (India) and greater opportunities for children to participate in building resilience, for example community emergency planning (Dominican Republic).
Assuming there is a vertical DRR goal in the post-2015 agenda, we propose that this focuses on the development of policy and programmes that integrate DRR into the education sector. This will ensure DRR is a priority at national and local levels to address the impact on education before, during and after a disaster.
The first pillar from the Comprehensive School Safety framework is addressed through indicators that emphasise school infrastructure and infrastructure so schools’ access routes meet locally appropriate hazard-resilient building standards and codes. School disaster management (Pillar 2) is addressed through national policies and integration of disaster management into existing school annual management plans/budgets/management committees. Risk reduction and resilience education (Pillar 3) is addressed by integrating context-specific DRR into both formal and non-formal curricula and public awareness. It is also important to emphasise the role of non-formal learning settings to ensure outreach to out-of-school girls and boys and to the wider community. As such, school-based disaster management activities must link to or engage with wider community DRR interventions.
81
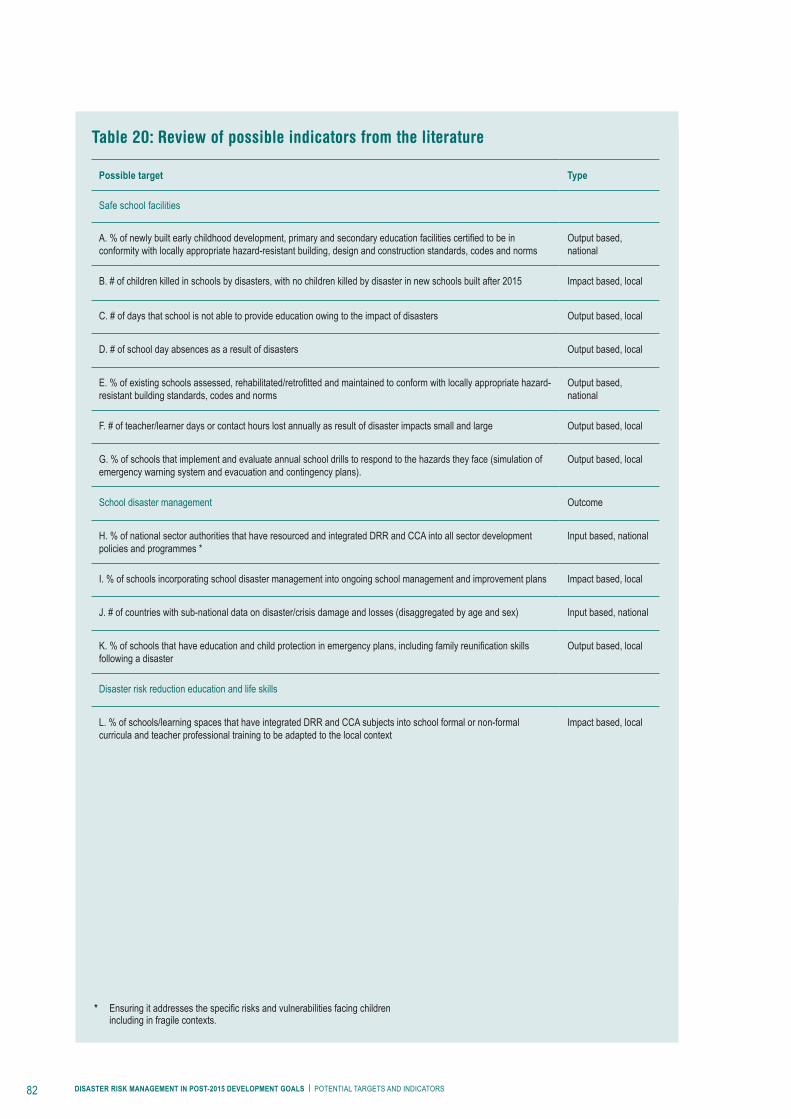
Table 20: review of possible indicators from the literature
Possible target Type
Safe school facilities
A.%ofnewlybuiltearlychildhooddevelopment,primaryandsecondaryeducationfacilitiescertifiedtobeinconformity with locally appropriate hazard-resistant building, design and construction standards, codes and norms
Output based, national
B. # of children killed in schools by disasters, with no children killed by disaster in new schools built after 2015 Impact based, local
C. # of days that school is not able to provide education owing to the impact of disasters Output based, local
D. # of school day absences as a result of disasters Output based, local
E.%ofexistingschoolsassessed,rehabilitated/retrofittedandmaintainedtoconformwithlocallyappropriatehazard-resistant building standards, codes and norms
Output based, national
F. # of teacher/learner days or contact hours lost annually as result of disaster impacts small and large Output based, local
G. % of schools that implement and evaluate annual school drills to respond to the hazards they face (simulation of emergency warning system and evacuation and contingency plans).
Output based, local
School disaster management Outcome
H. % of national sector authorities that have resourced and integrated DRR and CCA into all sector development policies and programmes *
Input based, national
I. % of schools incorporating school disaster management into ongoing school management and improvement plans Impact based, local
J. # of countries with sub-national data on disaster/crisis damage and losses (disaggregated by age and sex) Input based, national
K.%ofschoolsthathaveeducationandchildprotectioninemergencyplans,includingfamilyreunificationskillsfollowing a disaster
Output based, local
Disaster risk reduction education and life skills
L. % of schools/learning spaces that have integrated DRR and CCA subjects into school formal or non-formal curricula and teacher professional training to be adapted to the local context
Impact based, local
* Ensuringitaddressesthespecificrisksandvulnerabilitiesfacingchildrenincluding in fragile contexts.
82 Disaster risk ManageMent in Post-2015 DeveloPMent goals | Potential targets and indicators

statistics. For this reason, Table 21 suggests an indicator related to disaster data systems.
The targets proposed in Table 21 can be differentiated into short-, medium- and long-term goals. The proximal, immediate impact of disasters can be death or significant lifestyle changes as a result of loss and damages experienced at household level. By addressing school infrastructure safety and emphasising DRR plans, the proposed targets and indicators mitigate the number of deaths as a result of disasters. Thus, improving access to school, through school and household safety and stability, is a necessary short-term target and foundation that enables the medium- to long-term targets of quality education and improved learning outcomes.
7.11 Challenges and opportunitiesAs the literature review illustrates, discussions regarding DRR and education are still in their infancy. While there are guidelines and frameworks, a comprehensive plan to integrate DRR/education needs to be agreed on and supported by mechanisms for thorough M&E. Fortunately, several governments are already taking action, and momentum is building on this topic. In China, the Ministry of Education is developing a school safety management manual, including checklists, for each school to carry out regular reassessment of risks. The government of Burkina Faso is also undertaking an analysis of the vulnerability of its education system to risks of conflict and natural hazards. In India, the government has launched a National School Safety Programme in 22 states, covering 8,600 schools. This includes the drafting of a National School Safety Policy, as well as structural and non-structural safety measures in the target schools (Children in a Changing Climate, 2013).
This chapter is limited by the fact that much of the research and data regarding education and DRR are slanted towards rapid-onset weather-related crisis events. These events and the subsequent impacts are far better documented than the slow-onset crises that are characterised by a gradual deterioration of livelihoods and assets. Recent work by Save the Children and World Vision (2012)
The education sector is expected to have targets that revolve around building literacy, numeracy and other relevant learning skills (particularly on CCA and future livelihoods prospects). The achievement of these targets is dependent on an enabling and safe school environment, factors that disasters can affect negatively. Physically, schools must be operational, with teachers present, and students must be present in class to learn. Therefore, Table 21 proposes indicators relating to the impact of a disaster on school attendance rates, and the number of teacher/learner contact hours (in relation to global norms). Finally, equipping children with DRR- and CCA-related life skills prepares children for the future.
Since DRR is inherently a cross-sectoral field, it is believed that having education-related DRR concepts in both an education goal and a DRR goal encourages integration and synergy, leading to a more comprehensive approach to DRR. This chapter recognises that sector-specific experts will be engaged in developing and formalising the overarching post-2015 goals, and thus strongly encourages the prioritisation of DRR/CCA/resilience integration into the education goal to avoid the error of setting in place risk-blind goal/targets.
7.10 What it will take to gather and assess dataIn general, education/DRR data are lacking, so building a system must be a priority. It is hoped that the data required for Table 21 can reasonably be gathered by incorporating these indicators into existing educational management information and other data collection systems.15 Data related to school attendance and curricula can be gathered through ongoing monitoring by school officials and ministries of education, and from random sample surveys of changes in risk actions at household, school and community levels. It is necessary to further explore data collection needs and feasibility.
It will be a challenge to determine the direct cause of dropout rates and school attendance, given the causality of interrelated issues of household poverty and social/gender norms. Additionally, any time that data related to a disaster are gathered, it is important to prepare for a lack of reliable
83
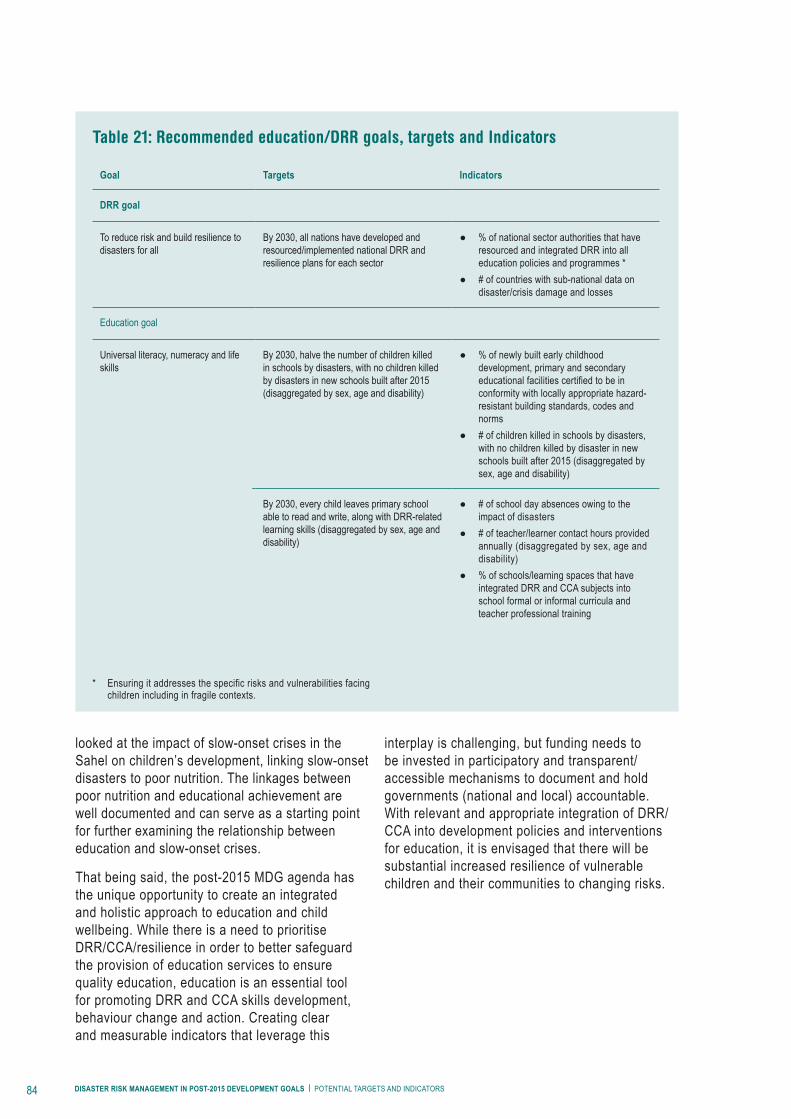
looked at the impact of slow-onset crises in the Sahel on children’s development, linking slow-onset disasters to poor nutrition. The linkages between poor nutrition and educational achievement are well documented and can serve as a starting point for further examining the relationship between education and slow-onset crises.
That being said, the post-2015 MDG agenda has the unique opportunity to create an integrated and holistic approach to education and child wellbeing. While there is a need to prioritise DRR/CCA/resilience in order to better safeguard the provision of education services to ensure quality education, education is an essential tool for promoting DRR and CCA skills development, behaviour change and action. Creating clear and measurable indicators that leverage this
interplay is challenging, but funding needs to be invested in participatory and transparent/accessible mechanisms to document and hold governments (national and local) accountable. With relevant and appropriate integration of DRR/CCA into development policies and interventions for education, it is envisaged that there will be substantial increased resilience of vulnerable children and their communities to changing risks.
Table 21: recommended education/Drr goals, targets and indicators
Goal Targets Indicators
DRR goal
To reduce risk and build resilience to disasters for all
By 2030, all nations have developed and resourced/implemented national DRR and resilience plans for each sector
● % of national sector authorities that have resourced and integrated DRR into all education policies and programmes *
● # of countries with sub-national data on disaster/crisis damage and losses
Education goal
Universal literacy, numeracy and life skills
By 2030, halve the number of children killed in schools by disasters, with no children killed by disasters in new schools built after 2015 (disaggregated by sex, age and disability)
● % of newly built early childhood development, primary and secondary educationalfacilitiescertifiedtobeinconformity with locally appropriate hazard-resistant building standards, codes and norms
● # of children killed in schools by disasters, with no children killed by disaster in new schools built after 2015 (disaggregated by sex, age and disability)
By 2030, every child leaves primary school able to read and write, along with DRR-related learning skills (disaggregated by sex, age and disability)
● # of school day absences owing to the impact of disasters
● # of teacher/learner contact hours provided annually (disaggregated by sex, age and disability)
● % of schools/learning spaces that have integrated DRR and CCA subjects into school formal or informal curricula and teacher professional training
* Ensuring it addresses the specific risks and vulnerabilities facing children including in fragile contexts.
84 Disaster risk ManageMent in Post-2015 DeveloPMent goals | Potential targets and indicators

8 See International Institute for Educational Planning Website. ‘Integrating conflict and disaster risk reduction into education sector planning’. http://www.iiep.unesco.org/news/single-view/hash/705f7a4175.html?tx_ttnews%5BpS%5D=1327481476&tx_ttnews%5Btt_news%5D=973&tx_ttnews%5BbackPid%5D=81
9 See Asia-Pacific Gateway for Disaster Risk Reduction and Development. ‘Mainstreaming DRR into the Education Sector. http://www.drrgateway.net/content/mainstreaming-drr-education-sector
10 See Anderson, A. ‘Youth Empowering Children: Intergenerational Approaches to Climate Action’. http://www.brookings.edu/research/speeches/2011/07/25-youth-empowering-anderson
11 See Right to Education Project Website. http://www.right-to-education.org/node/248
12 (Not exclusive): gender, human rights, young people, health, inequalities, technologies, partnerships, disabilities, child labour, food security and food safety.
13 See www.brookings.edu/universal-education and www.uis.unesco.org14 Ensuring it addresses the specific risks and vulnerabilities facing
children including in fragile contexts. 15 See UNESCO Website. ‘Education Management Information System
(EMIS)’. http://www.unesco.org/new/en/education/themes/planning-and-managing-education/policy-and-planning/emis/
Chapter 7 Endnotes
1 Contributors: Ann Munene, Claire Beck, Jael Shisanya, Alisa Phillips and Salvador Caluyo. A very special thank you to Marla Petal, PhD, for her valuable input into and review of this chapter.
2 For this paper, disaster risk reduction (DRR) refers to the concept and practice of reducing disaster risks through systematic efforts to analyse and manage the causal factors of disasters, including through reduced exposure to hazards, lessened vulnerability of people and property, wise management of land and the environment and improved preparedness for adverse events. Thereby, DRR encompasses disaster risk management and resiliency.
3 The HFA is a 10-year plan to make the world safer from natural hazards, adopted by UN 168 Member States in 2005 at the World Disaster Reduction Conference.
4 See UNESCO Website. ‘Dakar Framework for Action’. http://www.unesco.org/education/efa/fr/ed_for_all/dakfram_eng.shtml
5 See ADPC. ‘A Study on Impact of Disasters on the Education Sector in Cambodia’. (March 2008) Bangkok. http://www.adpc.net/v2007/ikm/ONLINE%20DOCUMENTS/downloads/2008/Mar/MDRDEducationCambodiaFinal_Mar08.pdf
6 See World Bank Website. ‘Adaptation to Climate Change in the Middle East and North Africa Region’ http://go.worldbank.org/B0G53VPB00.
7 See UNESCO Website. ‘Disaster Preparedness’ http://www.unesco.org/new/en/education/themes/leading-the-international-agenda/education-for-sustainable-development/disaster-risk-reduction/
85

synthesis
Lindsey Jones, Tom Mitchell, Emma Lovell and Eva Comba Overseas Development Institute
86 Disaster risk ManageMent in Post-2015 DeveloPMent goals | Potential targets and indicators
The preceding chapters highlight that there are many different options for including DRM in the post-2015 development framework, each with varying levels of ambition, feasibility and measurability. In choosing among them, the post-2015 consultation process will have to consider what types of action the framework should incentivise. It will also have to strike a delicate balance between setting aggressive targets (recognising the scale of technical and institutional change needed) and ensuring they remain attractive and communicable (recognising the inherently political nature of the post-2015 consultation process).
In addition, how DRM is included in the framework depends heavily on the overall structure and architecture of the post-2015 goals framework. Three potential formulations of the goals framework are as follows. First is a collection of many single issue-based objectives that happen to be politically acceptable at the time but without a strong story binding them together. Second is a jigsaw-based approach that tries to mesh poverty reduction objectives with sustainable development objectives. A third is a single, focused objective, such as ending absolute poverty, supported by goals that establish social and environmental minimums, around health, education and access to clean water, for example (Melamed, 2012).
While DRM could be a component of each of these approaches, the strategy for promoting its inclusion would need to be tailored accordingly. If the focus is on ending absolute poverty, then strong evidence would need to be presented that highlights how disastersareasignificantbarriertopovertyreductionandhowDRMcansolvethis.Ifthefocus is on environmental sustainability or inclusive and sustainable economic growth, the argument for including DRM would need to be oriented more towards avoiding economic losses or protecting environmental and economic assets from disasters.
The question of whether the goals should be universal or not remains: whether they should apply equally to all countries and be relevant at global, national and local levels, or whether different countries have different goals based on a principle of common but differentiated responsibilities. Some have also suggested a ‘one world’ approach: a global agreement between North and South, with poverty targets for the South and sustainable consumption targets for the North (e.g. Scott and Shepherd, 2011). Such anapproachfacespoliticalchallenges,giventhedifficultyofsecuringanykindofcommitment to constrain or reduce consumption in some rich countries (Melamed et al.,2012).Inallscenariosdescribedhere,DRMhasthebenefitofbeingaconcernforvirtually every country and, compared with other issues, is reasonably apolitical. Whether it can attract enough passionate support from member states to make it an indispensable part of the framework is another matter.
8787

Nonetheless, many other issues also require agreement. What is the baseline period for the post-2015 MDGs? What should the starting point be – especially given that data for 2015 will not be available in the same year? Will targets be calibrated on the basis of historical progress or on projections of future rates? With such uncertainty about the futureformofthepost-2015agenda,itisimportanttoretainahighdegreeofflexibilityinconsidering options for DRM targets and indicators.
Potential targets and indicatorsEach of the targets and indicators presented here emerge from background studies that consider a broad set of options. Experts have used criteria to recommend their preferred choices. These include whether the target matters for poor people, whether it can be calibrated and is meaningful across scales, whether it reinforces human rights andwhetheritissimpletocommunicate.Thisanalysisalsobenefitsfrompreviousconsideration of DRM targets and indicators resulting from a technical workshop held in London in December 2012 and a study published by ODI in September 2012.
In order to guide the options presented in this report, we propose three possible scenarios for how DRM could be included in post-2015 goals:
Scenario 1: A standalone goal on disasters, supported by targets. The report assesses targets on reducing mortality, reducing economic losses, preventing impoverishment and protecting and improving health systems;
Scenario 2: A target on disasters within a goal on ‘resilience’, ‘security’ or ‘tackling obstacles to development’ for example; drawing on the detailed assessments of the targets mentioned above.
Scenario 3: Integration of DRM into other goals. The report particularly highlights how DRM could be included in poverty reduction and education goals. Thesescenariosarenotmutuallyexclusive,butarenecessarilyflexibleinordertoadaptto the different potential formulations of the overall post-2015 goals framework. The following formulations of targets and indicators under each scenario selectively draw on the content of each chapter to provide a single example. There are many other ways of locking together the different suggestions.
88 Disaster risk ManageMent in Post-2015 DeveloPMent goals | Potential targets and indicators

Scenario 1: A standalone DRM goalDrawing on material in the chapters, an example of a standalone goal, target and indicator set on DRM could be as follows:
Goal Targets Indicators
● Reduce the risk of disasters
● By 2030, reduce by 20% the economic loss from disasters
● By 2030, halve the number of people killed by disasters
● By 2030, no additional people enter poverty
● By 2030, all new hospitals and health facilities are built to withstand local hazards
● Number of men, women, children killed by age, location, hazard type and socioeconomic group as proportion of population exposed (combining actual and modelled data)
● Direct economic losses as a % of gross domestic product (GDP) (combining actual and modelled data)
● % of budget allocated to disaster risk reduction (DRR)/preparedness
● Proportion of people living in poverty in areas exposed to natural hazards (combining actual and modelled data)
● Proportion of new health care facilities built in compliance with building codes and standards to withstand hazards
Scenario 2: DRM within a ‘resilience’-type goalUnderscenario2,thereisinsufficientspaceorlackofprioritisationofDRMforastandalone goal on disasters. Alternatively, consensus emerges that a disasters target could usefully sit alongside targets on violence, food security or environmental degradation for example, as a way of fostering better integration of risk management approaches to development shocks and stresses. One potential formulation is as follows:
Goals Targets Indicators
Enhance community resilience
● By 2030, halve the number of people killed by disasters
● Other resilience-related targets, for example:
● By 2030, halve violence against women and girls
● By 2030, achieve 100% access to adequate food all year round
● Number of men, women, children killed by age, location, hazard type and socioeconomic group as proportion of population exposed (combining actual and modelled data)
● % of budget allocated to DRR/preparedness ● Other indicators relating to non-disasters
target
89
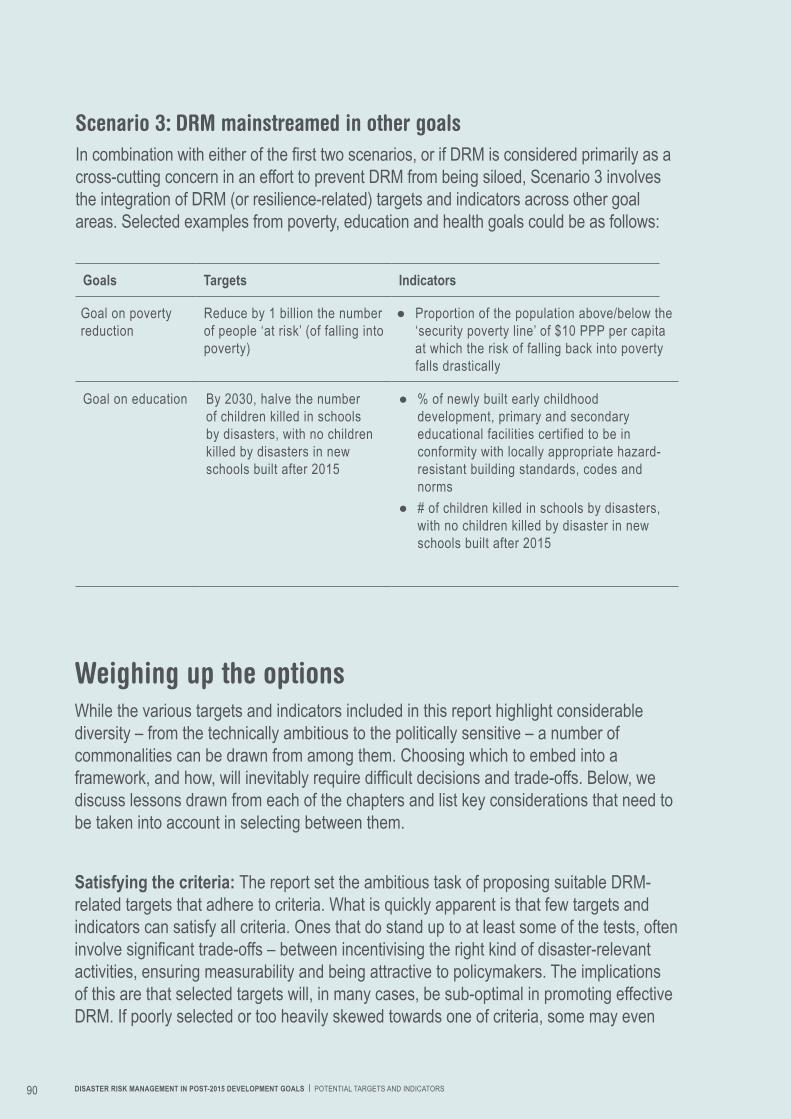
Scenario 3: DRM mainstreamed in other goalsIncombinationwitheitherofthefirsttwoscenarios,orifDRMisconsideredprimarilyasacross-cutting concern in an effort to prevent DRM from being siloed, Scenario 3 involves the integration of DRM (or resilience-related) targets and indicators across other goal areas. Selected examples from poverty, education and health goals could be as follows:
Goals Targets Indicators
Goal on poverty reduction
Reduce by 1 billion the number of people ‘at risk’ (of falling into poverty)
● Proportion of the population above/below the ‘security poverty line’ of $10 PPP per capita at which the risk of falling back into poverty falls drastically
Goal on education By 2030, halve the number of children killed in schools by disasters, with no children killed by disasters in new schools built after 2015
● % of newly built early childhood development, primary and secondary educational facilities certified to be in conformity with locally appropriate hazard-resistant building standards, codes and norms
● # of children killed in schools by disasters, with no children killed by disaster in new schools built after 2015
Weighing up the optionsWhile the various targets and indicators included in this report highlight considerable diversity – from the technically ambitious to the politically sensitive – a number of commonalities can be drawn from among them. Choosing which to embed into a framework,andhow,willinevitablyrequiredifficultdecisionsandtrade-offs.Below,wediscuss lessons drawn from each of the chapters and list key considerations that need to be taken into account in selecting between them.
Satisfying the criteria: The report set the ambitious task of proposing suitable DRM-related targets that adhere to criteria. What is quickly apparent is that few targets and indicators can satisfy all criteria. Ones that do stand up to at least some of the tests, often involvesignificanttrade-offs–betweenincentivisingtherightkindofdisaster-relevantactivities, ensuring measurability and being attractive to policymakers. The implications of this are that selected targets will, in many cases, be sub-optimal in promoting effective DRM. If poorly selected or too heavily skewed towards one of criteria, some may even
90 Disaster risk ManageMent in Post-2015 DeveloPMent goals | Potential targets and indicators

serve to encourage weak practices or perverse incentives. Certainly making these kinds of choices requires delicate handling and analysis of available evidence.
Including disasters within the post-2015 framework will ultimately secure a considerable amount of political momentum and interest in the delivery of DRM. However, given the intense competition between different development priorities, disasters will almost certainlyhavealimitedprofilewithintheframework–whetherasastandalonegoalormainstreamed within others. With this in mind, only a handful of targets (or possible even just one) can be selected for inclusion, and these will need to be considered carefully so they cover or at least encourage a wide spectrum of DRM-related activities.
If the DRM community is comfortable with these trade-offs, then being open and accommodating to the debates involved in engaging with the post-2015 process will be key. More importantly, a post-2015 framework must not be seen as the predominant vehicle for delivering the full range of DRM objectives. Rather, coordination and overlap betweenotherdisaster-relevantframeworksisimportantinfillingthisgap–likethepost-2015 consultative process on a successor to the current HFA (2005-2015). This will help ensure the promotion of a holistic approach to addressing the many facets of DRM across all levels of governance: from the local and community levels through to the national, regional and international.
Choosing the right kind of metrics: Thetypeofindicatorusedhasasignificantbearing on how data are collected, what can be inferred from them and the extent to which annual progress can be charted. Given the political momentum associated with the MDG and post-2015 frameworks, the choice of indictors will also heavily determine what types of DRM activities are incentivised. Four categories of indicators are worth considering within the context of this report: input, output, outcome and impact measures (for details and the pros and cons of each, see Chapter 2). Impact- and outcome-based categories have the advantage of being relatively simple to communicate and often generate strong political motivation. Input- and output-based categories are typically easier to measure and act as a useful guide on how DRM-related activities can be promoted. However, on their own, none can measure the spectrum of activities needed to deliver DRM in a holistic manner. What is clear from across the various chapters is that limiting DRM indicators to one or two categories of indicators will be detrimental. Where possible, a range of indicators from across the typology of indicator categories is therefore needed, ones that monitor and incentivise both ex-ante and ex-post actions and ones that are relevant for both extensive and intensivedisasterriskprofiles.
91

Opportunities and limitations in using models: A number of the report’s proposed targets present the option of using probabilistic risk models in tracking and measuring progress. Such models simulate the losses from thousands of possible events, allowing for an assessment of the damages expected in a given year. These have many advantages, not least of which is the ability to project the impact (and therefore imply the effectivenessofDRMstrategies)ofdisastersonagivenpopulationandoveraspecifictime period. They also offer the opportunity of assessing preparedness for high-impact low-probability events, a factor that observational records may struggle to adequately accountforgiventhatthenextsetofgoalsareunlikelytospanaperiodsignificantlybeyond a 15-year time period.
However, models are not without their limitations. For one, they are heavily dependent onthequalityofdatainputs,whichpresentssignificantchallengesformanydevelopingcountries. Models are also inevitably subjective; modellers make certain assumptions (andsimplifications)acrosstheinteractionsofvariousnatural,socialandeconomicvariables-manyofwhichwillbedifficulttotestempiricallyovershorter-termtimeperiods.Thisisparticularlythecaseforfloodanddroughtevents,forwhichriskmodelsare in their infancy. In addition, issues of trust, transparency and ownership present a number of challenges, especially in the contexts of low technical capacity within many developing country contexts. Nevertheless, models do add value in complementing other observational measures and targets, and their utility in a post-2015 framework should not be discounted. Rather, policymakers may well wish to take advantages of recent progress in the development and application of risk modelling where relevant, particularly with regard to their role in monitoring year-on-year progress and addressing the variable nature of disaster occurrence.
Better Data: Irrespective of which scenario plays out, the need to invest in technical capacity and data collection around disaster impacts and DRM is paramount. Challenges with regard to data availability and collection are common to all chapters. Some issues relatetothedifficultnatureofmeasuringkeyvariables(likevulnerabilityorresilience);others relate to a lack of geographic coverage (as for economic losses in developing countries). However, if disaster-related targets are to be monitored successfully in the context of a post-2015 development framework, two things are necessary.
First is the prioritisation of systematic reporting and collection of disaster-related data. This is not to say that singular datasets for each measured variable are necessary; far from it: diversity in sources and analysis of data (such as economic losses) is important. Rather, standard and systematised procedures for data collection (similar to the systematic methods for reporting mortality) will help ensure that data can be used
92 Disaster risk ManageMent in Post-2015 DeveloPMent goals | Potential targets and indicators

reliably to chart and compare progress in achieving targets across both spatial and geographic scales.
Second is the need to support developing countries in enhancing their capacity for data collection and use. Not only are reliable disaster-relevant data lacking for many countries (particularly in a least development country context), but also a shortage of expertise and technical capacity to compile, validate and make use of such data is apparent. Thus, enhancing investment in research and technical capacity and promoting knowledge sharing and greater access to global datasets, as well as encouraging North–South and South–South collaboration, should go hand in hand with any targets and indicators set under a post-2015 framework.
What next? Securing a place for DRM within the post-2015 goals framework will take continued concerted action on a number of fronts:
Testing which targets and indicators work in practice: Our conclusion is that the target should be outcome-focused and will need to blend a mix of observations and modelling techniques in order to assess annual progress on DRM and to cover both extensive and intensive disaster risk. The target and indicator set should incentivise both ex-ante and ex-post action to reduce disaster risk and the indicators should guide activities by being focused more on inputs and outputs. However, selecting the most appropriate targets and indicators on DRM in the post-2015 framework requires striking a delicate balance between different factors. One of the most important aspects is whether or not they make sense when applied in practice at community and national level. Therefore the next step is to road test the suggestions made in this report, in an exercise thatshouldengagelocalandnationalstakeholdersinfilteringsomeoftheoptions.
A clear narrative, supported by evidence: We know that disasters can hamper economic growth, affect poverty levels and cause human suffering. In addition, disasters present ever-greater obstacles to development progress and can reverse development gains.Withoutsignificantaction,theextentandimpactofeconomicandsocialdamage due to disasters is likely to get worse, largely as a result of growing exposure. Including measures to promote DRM in the post-2015 development goals is needed to incentivise investment in advance of shocks that will protect lives and livelihoods – but
93

also save money. This is a clear story line, but needs to be presented to key decision makers at opportune moments, backed by solid evidence. Given the Sustainable Development Goals Open Working Group has now begun meeting, it will also need to be supplemented with a focus on how DRM shapes sustainable development, including the interplay between environmental protection and disaster risk.
Forging coherence in international policy: With the MDGs, SDGs, HFA and climate change negotiations processes all seeking agreements in 2015, it is vital that DRM is included in each of them, but also when taken together, they provide a coherent message on how DRM should be prioritised and implemented. This will take co-ordinated work by key agencies acting in all these policy processes.
Generating political momentum: DRM will only be included in the post-2015 goals if there are enough member states willing to argue strongly for it being there. Currently this is unclear and more work is needed to secure this type of support.
94 Disaster risk ManageMent in Post-2015 DeveloPMent goals | Potential targets and indicators

95

Table 22: A review of economic indicators of disaster risk and resilience
Name Specific Economic Target and/or indicator Ownership Geographic application
Risk Reduction Index (RRI) RRI analyses the capacities and conditions affecting DRR andCCAthroughtheidentificationoffourdriversofrisk,including a wide range of socio-economic conditions, such as unemployment, poverty, limited access to health and education anddeficienciesinroadinfrastructure.
DARA Central and South America. The second phase of the RRI in the West Africa region is currently underway
Indicators of Disaster Risk and Risk Management / The Americas Indexing Programme
1. DisasterDeficitIndex(DDI) The DDI captures the relationship between the demand for contingent resources to cover the losses caused by the Maximum Considered Event (MCE), and the public sector’s economic resilience (ER) – e.g. availability of internal and external funds for restoring affected inventories (See also below)
2. Local Disaster Index (LDI) The LDI is equal to the sum of three local disaster sub-indicators that are calculated based on data from the DesInventar database for number of deaths (K), number of people affected (A) and economic losses (L) in each municipality
3. Prevalent Vulnerability Index (PVI) The PVI is an average of three types of composite indicators: exposure and physical susceptibility, socio-economic fragility and lack of resilience. All three composites include economic indicators
4. Risk Management Index (RMI) The RMI is constructed by quantifying four public policies:identificationofrisk,riskreduction,disastermanagement,governanceandfinancialprotection
Relevant economic indicators: RR6 (reinforcement and retrofittingofpublicandprivateassets);FP3(budgetallocation and mobilization); FP4 (existence of social safety nets and funds); FP5 (insurance coverage and loss transfer strategies for public assets); FP6 (housing and private sector insurance and reinsurance coverage)
Inter-American Development Bank (IADB-IDEA)
Latin America and the Caribbean
Annex A: A review of economic indicators of disaster risk and resilience
96 Disaster risk ManageMent in Post-2015 DeveloPMent goals | Potential targets and indicators

Name Specific Economic Target and/or indicator Ownership Geographic application
Hyogo indicator 'HFA Monitor'
Contains 3 economic indicators:
(1.2) Dedicated and adequate resources are available to implement
(4.3) Economic and productive sectoral policies and plans have been implemented to reduce the vulnerability of economic activities
(5.3) Financial reserves and contingency mechanisms are in place to support effective response and recovery when required
UNISDR Global
Community Based Risk Index
The total indicator system comprises 47 indicators, several of which have an economic dimension:
● Exposure (E4) Local Gross Domestic Product ● Vulnerability(V10),Localresourcebase,(V11)Diversification,
(V12) Stability, (V13) Accessibility ● Capacity and measures: (C11), Local emergency funds
(C12), Access to national emergency funds (C13), Access to international emergency funds (C14), Insurance markets (C15), Mitigation Loans (C16) Reconstruction loans (C17)Public works
Deutsche Gesellschaft für Technische Zusammenarbeit
(GTZ)
Global. Pilot project Indonesia.
Disaster Risk Index (DRI) Includes indicators of physical exposure and a list of 24 socio-economic variables selected by an expert group to represent: economic status, type of economic activities, environmental quality, demography, etc.
UNDP Global
World Bank Global Hotspots of Risk
Absolute and relative economic losses as a proportion of GDP, calculated for each hazard
Columbia University and Worldbank
Global level with subnational scale of resolution
The International Disaster Database1
Number of events by type of disasters Total estimated economic losses by type of disaster
EM-DAT Global
The Global Risk IdentificationProgramme(GRIP)
Exposedpopulation(floods,tropicalcycloneandearthquakes) ExposedGDP(floods,tropicalcycloneandEarthquakes)
UNDP Global. Applied to about 40 countries
DisasterDeficitIndex(DDI) Economic resilience is estimated in terms of the feasible internal or external funds a government can have access to once the damage has been produced, taking into consideration that the government is responsible for recovering, or is the owner of the affected infrastructure. The assessment of risk and vulnerability applies to the use of a probabilistic tool, the CATSIM model.
Dependingonthespecificmacroeconomicandfinancialconditionsof each country, if the DDI is feasible, internal or external funds are accounted for in terms of the following components:
● Insurance and re-insurance payments ● Available reserves in disaster contingent funds ● Aid funds and donations ● Possible new taxes that could be created in case of a major
disaster event ● Budget reallocation margin, referred to the government’s
discretional expenditure margin ● Feasible external credit that could be obtained from
multilateral bodies or from external capital markets ● Feasible internal credit from commercial banks and, in some
cases, from the Central Bank
Cardona (2007);
Mechler et al., (2009)
The Americas
97

Sour
ce: o
wn an
alysis
and B
andu
ra (2
008)
* Not all indicators apply to each of these levels)
Name Specific Economic Target and/or indicator Ownership Geographic application
Economic Resilience Index (ERI)
Resilienceisdefinedasthenurturedabilityofaneconomytorecover from, or adjust to, the adverse shocks to which it may be inherently exposed. Four components are considered in the computation of a Resilience Index, i.e.: i) macroeconomic stability; ii)microeconomicmarketefficiency;iii)goodgovernance;iv)socialdevelopment. Macroeconomic stability:
● FiscaldeficittoGDPratio ● Sumoftheunemploymentandinflationrates ● External debt to GDP ratio
Microeconomic market efficiency:
● Size of government ● Freedom to trade internationally
Briguglio and Galea (2007)
Global
Economic Vulnerability Index (EVI)
Economic openness can be measured as the ratio of international trade to GDP.
Export concentration can be measured by the United Nations Conference on Trade and Development (UNCTAD) index of merchandise trade (UNCTAD) 2003:section 8), and Briguglio (1997) and Briguglio and Galea (2003) have devised an alternative index which also takes services into account.
Dependence on strategic imports – This variable can be measured as the ratio of the imports of energy, food or industrial supplies to GDP
Briguglio et al, 2002
Global
98 Disaster risk ManageMent in Post-2015 DeveloPMent goals | Potential targets and indicators
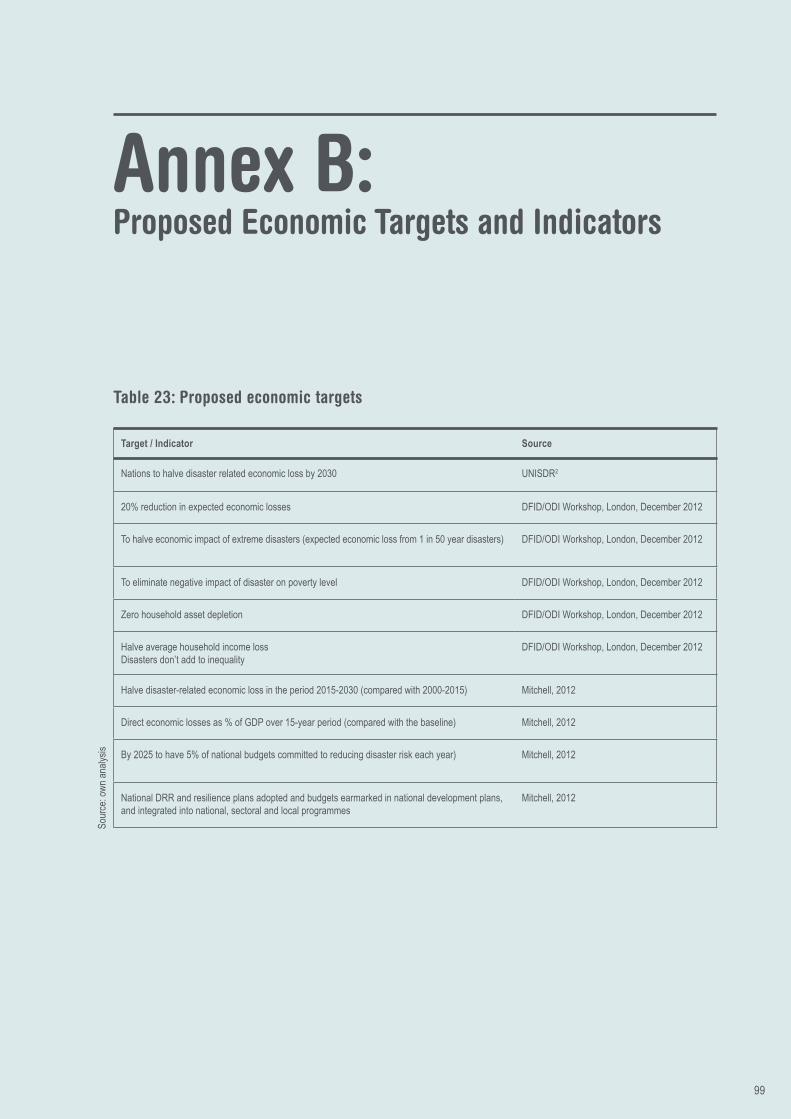
Target / Indicator Source
Nations to halve disaster related economic loss by 2030 UNISDR2
20% reduction in expected economic losses DFID/ODI Workshop, London, December 2012
To halve economic impact of extreme disasters (expected economic loss from 1 in 50 year disasters) DFID/ODI Workshop, London, December 2012
To eliminate negative impact of disaster on poverty level DFID/ODI Workshop, London, December 2012
Zero household asset depletion DFID/ODI Workshop, London, December 2012
Halve average household income loss Disasters don’t add to inequality
DFID/ODI Workshop, London, December 2012
Halve disaster-related economic loss in the period 2015-2030 (compared with 2000-2015) Mitchell, 2012
Direct economic losses as % of GDP over 15-year period (compared with the baseline) Mitchell, 2012
By 2025 to have 5% of national budgets committed to reducing disaster risk each year) Mitchell, 2012
National DRR and resilience plans adopted and budgets earmarked in national development plans, and integrated into national, sectoral and local programmes
Mitchell, 2012
Table 23: Proposed economic targets
Sour
ce: o
wn an
alysis
Annex B: Proposed Economic Targets and indicators
99

Table 24: Proposed indicators by scale
International National Sub-National (e.g., city level)
Local (individual, household and community levels).*
Impact ● Number of people entering poverty due to a disaster
Outcome ● Disaster losses: economic and human, direct and indirect (including secondary/flowlosses)
● Disaster losses: economic and human, direct and indirect (including secondary/flowlosses).
● Direct economic losses as percentage of GDP
● Number of houses damaged / Number of houses damaged per million people per year
● Annual spending on humanitarian relief
● Disaster losses: economic and human, direct and indirect (including secondary/flowlosses)
● Disaster losses: economic and human, direct and indirect (including secondary/flowlosses).
● % loss of agricultural output due to natural hazards
● %ofhousehold/firmassetslost due to natural hazards
Output ● Existence of ‘effective’ regional risk pools
● Effectiveness/ coverage of insurance sector
● Proportion of the population living in areas that are exposed to natural hazards
● Proportion of the population living at an elevation below 5m above sea level
● Proportion of GDP in exposed areas
● % of population with access to formal or informal risk transfer/sharing (including insurance and social safety nets)
● % of area complying with no development or no construction by-laws
● % of buildings complying with building standards aimed at disaster resilience
● Access to formal and informal risk-transfer and – sharing (access and depth)
● Access to and depth of insurance for critical infrastructure, industry, housing social and productive sectors
● % with the ability to access disaster risk information to enable informed choices
● % with access to modern early warning systems
● %offirmsadoptingstandardsfor business continuity and risk management
Input ● Proportion of global economy invested in risk reduction
● Existence of international re-insurance sector willing to cover hazard risks
● Balance between economic maximisation and resilience-based optimisation
● Transnational economic interdependence and susceptibility to contagion
● National levels of inequality andincomepoverty(definedin terms of GDP per capita) and inequality
● Proportion of GDP and of livelihoods reliant on agricultureandfisheries
● Fraction of GDP allocated to disaster risk reduction and preparedness
● Existence of disaster risk reduction legislation, policy and practice
● Proportion of development, planning and investment decisions incorporating consideration of disaster risk
● Proportion of critical infrastructure and housing built to disaster resistant standards
● Sub-national distribution of inequality and income poverty (definedintermsofGDPper capita and limited non-monetary assets e.g. house ownership) and inequality
● Livelihood and employment type
● Diversity or homogeneity of economic sector
● Investment in data management and science to identity disaster losses, and to identify and communicate hazard and vulnerability and capacity, and track this as it changes over time
● Assets (monetary, non-monetary and constraints on saving) e.g. cash savings, seed stores, livestock
● Employment strategies and livelihooddiversification
● Dependence on agriculture (proportion of population with rain-dependent livelihoods at risk from drought)
Sour
ce: b
ased
on M
atyas
and P
elling
2012
, Wor
ld Ba
nk D
ata po
rtal, U
NISD
R 20
09a,
Mitch
ell 20
12 an
d IRD
R 20
12
•Notallindicatorsapplytoeachoftheselevels
100 Disaster risk ManageMent in Post-2015 DeveloPMent goals | Potential targets and indicators

Annex C: Existing severity classification tools
Decription Possible indicator
Hazard Types Severity / Intensity Meausres
Droughts Palmer Drought Severity Index; Standardized Precipitation Index; Palmer Hydrological Drought Index.
Earthquakes Richter(local)MagnitudeScale;MomentMagnitudeScale;ModifiedMercalliIntensityScale.China,Europe,U.S.A,JapanhavetheirownseismicintensityscaleswhilelargecountrieslikeIndiaandRussiahaveafifthcommon scale.
Mass Movements Nocommonlyusedseverityclassificationscaleyet.Landslide-eventsmagnitude(Malamudetal.,2004)andintensity (Piegari et al., 2009) scale were recently developed but poorly diffused.
Floods Presently,thereisnostandardisedmeasuringsystemforfloods.TheDartmouthFloodInventoryusesa3tierseverityclassificationforlargefloodsandtheUSNationalWeatherServiceanother3tierFloodSeverityScale.Recently,StonefieldandJackson(2009)developedaFloodSeverityIndexandKimandChoi(2012)aFlashFlood Index.
Extreme temperatures Climate Extremes Index; Extremes in Maximum Temperatures; Extremes in Minimum Temperature.
Storms Beside the Beaufort Wind Scale, different scales exist for different hazards: the Fujita Tornado Intensity Scale; theSaffir-SimpsonHurricaneCategoryScale;theTorroHailstormIntensityScale;athunderstormscale.BesidetheBeaufortscaleandthe10-minutesustainedwindsscalewhichclassifieswindstrengths,thereareatleastsix different scales to rank tropical cyclones.
Volcanic Eruptions For volcanoes, consensus seems to exist around the Volcanic Explosivity Index.
Wildfires Differentlocalclassificationexists,mostofthemratingthedangeroffireonsetortheseverityofpotentialfiresandnot,expost,fireseverity.
Table 25: Existing severity classification tools
101

Description Possible Indicator
Hazard impacts on human health and wellbeing (whenever possible)
● Crude mortality rate (baseline and in emergency situations) ● Under 5 mortality rate (baseline and in emergency situations) ● Number and rates of hazard-related deaths reported annually at national level, by hazard ● Number and rates of cases or incidence for selected epidemic-related diseases at national level ● %ofthepeoplewhohavedifficultiesinfunctioningwithmoderate,severeorextremedifficultiesinfunction(referto
WHO Disability Assessment Schedule) ● Number and rates of people with new injury-related disabilities reported annually at national level, by hazard ● Prevalence of Global Acute Malnutrition (GAM)
Reporting of disaster data on health impacts at a national level
● Disaster data on the number of events, deaths, injuries, diseases, missing persons, and disabilities are reported by hazard on an annual basis at national level (data disaggregated by sex and age)
International Health Regulations (2005)
● NumberofcountriesmeetingandsustainingInternationalHealthRegulations(2005)(WHO,2005c))identifiedthrough the Global Monitoring framework
National health emergency and disaster risk management programme
● A national programme for all hazards is established for health in emergency and disaster risk management planning, which includes a capacity development strategy, a coordinating body, and a regular budget
● A national capacity assessment, to inform capacity development strategies and action plans, is conducted on a regular basis (Rio+20 Consultation)
Assessment of emergency and disaster-related risks
● Multi-sectoral emergency risk assessments that consider natural, technological, biological, and societal hazards as well as health vulnerabilities and capacities
● Health emergency risk assessments are conducted on a regular basis ● Proportion of land use, building, infrastructure, and economic development plans that incorporate health impact
assessment of disaster-related risks into plans and strategies (Rio+20 Consultation)
All hazards emergency response
● National health emergency response plan is developed as a component of the multi-sectoral response plan ● National level exercises to test health emergency response plans are conducted on a regular basis
Emergency recovery planning
● National emergency recovery plan is developed as component of the multi-sectoral recovery plan
Emergency response coordination
● Multi-hazards emergency response mechanisms are established and functioning (IHR checklist)
Health workforce ● A workforce development or training plan to develop competencies in health emergency and disaster risk management is developed (IHR checklist)
Annex D: Proposed Health indicators
Table 26: Proposed Health indicators
102 Disaster risk ManageMent in Post-2015 DeveloPMent goals | Potential targets and indicators

Health resources available for disaster risk management
● Average population per health unit (usually primary health care facilities offering general health services) by administrative unit or country (benchmark for this indicator is <10 000 people per unit) (Global Health Cluster, Rio+20 Consultation)
● Number of hospital beds per 10, 000 population (inpatients and maternity) by administrative unit or county (Global Health Cluster Guide)
● Number of health workers (medical doctor + nurse + midwife) per 10,000 people by administrative unit or country (% male and female) (Global health Cluster Guide)
● Number of community health workers per 10, 000 people by administrative unit (Global Health Cluster Guide)
Safer, prepared and resilient health-care facilities
● Proportion of existing health-care facilities in hazard-prone areas that have been assessed for levels of safety, security and preparedness
● Number of existing health-care facilities that use sustainable and robust clean energy and water supplies (baseline and in emergencies)
● Proportion of existing health-care facilities which have increased their level of safety through structural and non-structural measures and/or preparedness
● Proportion of new health-care facilities built in compliance with building codes and standards to withstand hazards, and with access to clean energy and water supplies (Rio+20 Consultation, Hyogo Framework for Action, Global Platform Chair’s Summary)
Development planning to reduce health impacts of disasters
● Proportion of residential and commercial buildings in hazard-prone areas that meet building codes (e.g. for earthquakes/flooding)designedtoreducelossoflives(Rio+20Consultation)
Health Services coverage ● Coverage of measles vaccinations (12 months – 23 months) (Global Health Cluster, World Bank, WHO) ● % of births assisted by a skilled attendant (Global Health Cluster)
Water supply ● Proportion of people with less than 15 litres of water per day (Global Health Cluster)
Disease surveillance ● Indicator-based routine surveillance includes an early warning function for the detection of a public health event (i.e. a threat to public health) (IHR Checklist)
● Event based system surveillance is established (IHR Checklist) ● Number of cases or incidence rates for selected diseases relevant to the local context ● Case fatality ratio for most common diseases
103

Annex E: Proposed global Education goals
Basic Education Coalition
Proposed Goal: By 2030, all children and youth should complete primary and lower secondary education which enables them to meet measurable learning standards and acquire relevant skills so they may become responsible, productive members of society.
Progress toward this goal would be tracked by four indicators:
1. Availability of, and enrolment in, pre-primary and other early childhood care and education programmes
2. Completion of primary and lower secondary education, including non-formal education, with completion based on fulfilment of measurable learning standards at each grade or level, and end of cycle, and data disaggregated by gender and other categories of marginalised and vulnerable groups
3. Adult literacy rates, and rates of participation in and completion of continuing education and training
4. Percentage of countries whose national education plans and policies are standards-based and effectively track and measure learning outcomes, skills acquisition, and teacher and other educational staff’s certification and professional development; and which make systematic use of standards-based exams and other tools for assessing continuous learning
Global Campaign for Education – US Chapter
Proposed Goal: By 2030, all children and youth are receiving a quality pre-primary, primary, and lower secondary education.
Proposed Indicators:
1. Proportion of children and youth – disaggregated for girls, children with disabilities, children of ethnic minorities, and children in fragile and conflict-affected areas – enrolled in pre-primary, primary, and lower secondary school and their attendance rates
2. Trained teacher-pupil ratios and textbook-pupil ratios
3. Proportion of children and youth demonstrating adequate abilities in all learning domains
Commonwealth Secretariat
Commonwealth ministers recommend that three core concerns – access, quality, and equity – should run through all education goals, and that EFA and MDGs should be harmonised to avoid overlaps or gaps.3
The Commonwealth is an association of 54 countries, both developed and developing, rich and poor, large and small. Commonwealth ministers of education met in London in December 2012 and developed recommendations for post-2015 which are now feeding into the UN discussion and wider debates.
The Commonwealth ministers propose the following structure for education’s place in the post-2015 development framework:
Principal goal 1: Every child completes a full cycle of a minimum of nine years of continuous, free, basic education and demonstrates learning achievement consistent with national standards.
Principal goal 2: Post-basic education expanded strategically to meet needs for knowledge and skills related to employment and livelihoods.
Principal goal 3: Reduce and seek to eliminate differences in educational outcomes among
104 Disaster risk ManageMent in Post-2015 DeveloPMent goals | Potential targets and indicators

learners associated with household wealth, gender, special needs, location, age and social group.
Six Sub-Goals:
1. Reduce and seek to eliminate early childhood under-nutrition and avoidable childhood disease, and universalise access to community-based early childhood education and development, and pre-school below age 6.
2. Universalise and ‘expanded vision of access’ to a full cycle of a minimum of nine years of continuous basic education.
3. Invest strategically in expanded and equitable access to post-basic and tertiary level education and training linked to wellbeing, livelihoods and employment and the transition to becoming a responsible adult citizenship.
4. Eliminate illiteracy and innumeracy among those under 50.
5. Reduce and seek to eliminate disparities in participation in education at school level linked to wealth, location, special needs, age, gender and social group; and ensure all children have equal educational opportunities and reduce the gaps in measured outcomes.
6. Provide adequate infrastructure for learning according to national norms for buildings,
basic services, safety, learning materials, and learning infrastructure within appropriate distances of households.
Save the Children
Proposed Goal: By 2030 we will ensure all children receive a good-quality education and have good learning outcomes
Proposed Targets:
1. Ensure that all boys and girls are achieving good learning outcomes by the age of 12, with gaps between the poorest and riches significantly reduced
2. Ensure the poorest young children are starting school ready to learn, having already reached good levels of child development
3. Ensure that all young people have basic literacy and numeracy, technical and life skills to give them the chance to become active citizens with decent employment
CIGI
Proposed goal: Appropriate education and skills for full participation in society (see Figure 10)
105

Figure 10: Proposed goal appropriate education and skills for full participation in society
Capacity and accessibility (enrollment + compulsary years)
Financing (public + private)
Equal rights (gender + socio-economic)
Lifelong learning (survival and advancement,
adult and vocational training)
Qualitty (facility + contact)
National capacity building (learning environment,
innovative industrial structure)
Individual capacity building (liberacy, PISA, employment)
Sufficient education system accessible to all at all levels (inputs)
Open participation in education system for all (throughputs)
Yielding education system that leads to better lives of all (outputs)
INDICATORS TARGET GOAL
Productive participation in
society achieved through "high-quality
education for all"
106 Disaster risk ManageMent in Post-2015 DeveloPMent goals | Potential targets and indicators

Annex F: Current education-related DrM indicators and Child Centred Drr outcomes
UNICEF: Education in Emergencies
Core Commitments for Children in Emergencies
Indicators
Promote access to quality learning and education for all children in affected communitieswithaspecificfocusongirls
● % affected children 5-12 with access to learning environments/spaces ● Net enrolment by gender ● Net enrolment by age category ● % of schools and or learning spaces with adequate learning materials ● % of children affected, by age category, enrolled in primary school ● % of schools and or learning spaces that have initiated reading, writing or arithmetic activities
Set up temporary learning structures with minimal infrastructure
● % children 5-12 with access to learning environmental spaces ● # of school or learning environment/spaces established ● # of learning spaces (in tents, plastic poles and sheeting, or any other alternative learning spaces) ● Net enrolment ratio by gender - % of girls and boys enrolled ● Net enrolment by age category - % of age categories enrolled ● Teacher – pupil ratio
Re-open schools and start the integration of teachers and children by providing teaching and learning materials and organising recreational activities
● % of schools reopened ● % of schools or learning spaces with adequate learning materials ● % of schools in tents or other temporary learning shelters ● % of teachers/paraprofessionals trained (by gender)
Re-establish or sustain primary education or both. Provide education and recreation kits and basic learning materials and teacher training
● % of children affected, by age category, enrolled in primary school ● % of teachers/paraprofessionals trained (by gender) ● # of tents set up as temporary learning centre
Promote the resumption of quality educational activities in literacy, numeracy and life skills issues such as HIV/AIDS, prevention of sexual exploitationandabuse,conflictresolutionand hygiene
● % of schools/learning spaces which have initiated reading, writing, and arithmetic activities ● % of schools which have initiated self-expression activities (recreation, sports, music, dancing,
drawing, storytelling, play among other activities) ● % of cognitive and self-expression activities ● % of children (8-18) exposed to high or medium levels of traumatic experiences ● % of schools which have implemented supplementary packages (HIV/AIDS, mine risk, waterborne
diseases, natural disaster preparedness, etc)
Table 27: Current education-related DrM indicators
107

UNICEF: Education in Emergencies
Priorities for Action aligned to Hyogo Framework for Action
Indicators aligned to Hyogo Framework for Action
Ensure that disaster risk reduction is a priority with a strong institutional basis with education authorities nationwide
● Policy and legal framework for disaster risk reduction exists with decentralised responsibilities and capacity in the education sector at all levels
● Dedicated and adequate resources are available to implement DRR and activities at all administrative levels
● Community participation and decentralisation are ensured through the delegation of authority and resources to education authorities at the local level
● A national multi-stakeholder platform for DRR is functioning in the education sector
Identify, assess and monitor disaster risks to schools and enhance early warning for all learning environments
● National and local risk assessments based on hazard data and vulnerability information are available to education authorities and schools
● Systems are in place to monitor, archive and disseminate changing data on school structural, infrastructural and environmental vulnerabilities
● Early warning systems for major and local hazards reach schools, and schools have the opportunity to participate in early warning systems
Use knowledge, innovation and education to build a culture of safety and resilience through curricular and co-curricular activities in schools
● Educational materials on DRR and climate change adaptation are shared internationally, and are available for localisation and contextualisation
● School curricula is holistically-infused to include DRR and recovery concepts and practices ● Researchmethodsandtoolsformulti-riskassessmentsandcost-benefitanalysisaredevelopedand
strengthened for the education sector ● Countrywide public awareness strategy to stimulate a culture of disaster resilience, with outreach to
urban and rural communities, including child-centered and child-led elements
Reduce the underlying risk factors ● DRR is an integral objective of site selection, design, construction, and maintenance of schools ● School disaster management policies and plans are implemented to reduce the vulnerability of
children in and out of school ● Educational continuity plans are in place to reduce disruption of the school year, and protect
individual attainment of educational goals ● Planning and management of school facilities incorporates DRR elements including processes in the
education sector ● Procedures are in place to assure that every new school is a safe school
Strengthen disaster preparedness for effective response in the learning environment
● Strong policy, technical and institutional capacities and mechanisms for DRM, with a DRR perspective, are in place in the education sector
● Disaster and emergency plans are in place at all administrative levels in the education sector and regular training drills and rehearsals are held to test and develop disaster response capacity at all levels
● Insurance and contingency mechanisms are in place to support effective response and recovery when required
● Procedures are in place to exchange relevant information about impacts on schools, during hazard events and disasters, and to undertake post-event reviews
Pillar Key responsibilities
1. Safe school facilities involves education authorities, architects, engineers, builders and school community members, in safe site selection, design, construction and maintenance (including safe and continuous access to the facility)
● Select safe school sites and implement disaster-resilient design and construction to make every new school a safe school
● Implementaprioritisationschemaforretrofitandreplacement(includingrelocation)ofunsafeschools ● Minimise building and facilities non-structural and infrastructural risks from all sources, including
design and interior layout and furnishings safe for survival and evacuation; include disability access in these considerations
The Hyogo Framework for Action – Focus on the Education Sector ADPC, Plan, Save the Children, UNESCO, UNICEF, World Vision
Comprehensive School Safety ADPC, Plan, Save the Children, UNESCO, UNICEF, World Vision
108 Disaster risk ManageMent in Post-2015 DeveloPMent goals | Potential targets and indicators

UNICEF: Education in Emergencies
2. School disaster management is established via national and sub-national education authorities and local school communities (including children); these will work in collaboration with their disaster management counterparts in order to maintain safe learning environments and plan for educational continuity, whilst conforming to international standards.
● Provide policies, guidance at sub-national and school-site levels for ongoing site-based assessment and planning, risk reduction, and response preparedness as part of normal school management and improvement
● Develop, roll-out, institutionalise, monitor and evaluate the establishment or empowerment of school-site disaster risk management committees involving staff, students, parents and community stakeholders
● Adapt standard operating procedures as needed, for hazards, with and without, warnings, including: drop cover and hold, building evacuation, evacuation to safe haven, shelter-in-place and lockdown, and safefamilyreunification
● Practice and improve on response preparedness with regular school-wide and community-linked simulation drills
● Establish national and sub-national contingency plans to support educational continuity, including plans and criteria to limit the use of schools as temporary shelters
● Incorporate the needs of pre-school and out-of-school children, children with disabilities, and both girls and boys
3. Disaster risk reduction education should be designed to develop a culture of safety and resilient communities.
● Develop consensus-based key messages for reducing household and community vulnerabilities, and for preparing for, and responding to, hazard impacts as a foundation for formal and non-formal education
● Develop scope and sequence for teaching about hazards, disasters, and problem-solving for risk reduction
● Infuse risk reduction throughout the curriculum and provide guidelines for integration of DRR into carrier subjects
● Provide teacher training for both teachers and teacher trainees on risk reduction curriculum materials ● Develop strategies to scale-up teacher involvement for effective integration of these topics into formal
curriculum as well as non-formal and extra-curricular approaches with local communities
Child-centered DRR Outcomes Indicators
Policy change: changes to laws, policies, decrees, etc. to integrate risk reduction at local, national, and/or international levels
● Policies are created to formally recognise children and young people (CYPs) participation/representation in DRR structures and local and national government decision-making processes
● Policy, or space is created for mandating local governments to prioritise concerns of CYPs in disaster preparedness, response and recovery activities
Access to public services change: increase in the number of citizens accessing disaster resilient public services (e.g. education, water and sanitation, health, and risk management) as a result of using disasters as an entry point for change
● Increased number of schools with the most vulnerable CYP represented that address DRR issues ● Increased number of CYPs participating in school and community based DRR training and education
activities ● Increase in number of CYPs conducting and/or participating in school and community Hazard,
Vulnerability and Capacity Assessments (HVCA)
Capacity change: increases in programme participants’ DRR knowledge, skills and abilities, as a result of training programs, workshops, awareness campaigns, etc
● Increase in CYPs and community DRR groups’ understanding of relevant DRR legislation, regulation and procedures, and increased awareness of their rights and the obligation of duty holders
● Increased awareness among CYPs about disaster risk and how to manage them
Well-being change: resulting in changes related to risk reduction and improved resilience to support sustainable development and the realisation of child rights
● Increase in child protection services provided in emergencies (child friendly spaces, psychosocial support, education in emergencies)
Citizenship change: citizens become aware of their power and rights, and use this power to effectively participate in decision making processes that reduce risks
● Increase in the number of CYPs, civil society and community groups lobbying external agencies on DRR plans, priorities, and actions
● Increase in the number of CYPs initiating or managing activities to reduce their risks, as well as vulnerabilities at school and at the community level
Children in a Changing Climate (only select indicators, most relevant to Education, are listed here)
109

UNICEF: Education in Emergencies
Institutional or systems change: changes in the decision-making process towards more involvement of young citizens, more transparency, and more accountability of disaster management mechanisms/frameworks
● Increased number of schools and community bodies providing opportunities for CYPs to participate in awareness raising activities in DRR
● # of schools with DRR included and delivered in the school curriculum and # of communities with DRR delivered via non-formal learning activities
● Increase in demonstrated support by local and national governments to participation of children in community based risk assessment
Outcomes/Outputs Indicators
The capacity of schools to prepare for and respond to disasters is improved
● % of schools that have passed the annual disaster safety inspection from the Ministry of Disaster Management
● % of participating schools that have successfully conducted one disaster simulation
Output 1: School Disaster Management plans are developed and tested at participating schools
● # of participating schools that have a new DM Plan tested
Output 2: School Disaster Management Groups are formed in participating schools
● % of DMGs that have at least two teachers/staff, two parents, two students, and conduct regular monthly meetings
Output 3: Disaster risk reduction lessons are included in the curriculum
● % of students in the targeted schools who have received disaster preparedness and disaster risk education
Outcome Results
Children in Save the Children’s emergency responses are ensured continued access to quality education and efforts are made to reduce future risks
● Rapidscale-upofsupporttoeducationinemergenciesbenefitingatleast25%ofthechildrenaffected by emergencies each year
● SignificantincreasesintechnicalcapacityforEiEandDRRineducationwithinSavetheChildrenmembers and at an inter-agency level
● Partnerships, including the Global Education Cluster, are leveraged to ensure a more coordinated response and systematic documentation of innovative approaches and learning
● Awareness and commitment to education in emergencies and DRR in education is strengthened, both within Save the Children and the wider humanitarian community
● % of school-age children and youth not currently attending school/learning space ● % of existing school buildings a) usable; and b)unusable ● % of schools/learning spaces with classes taking place in temporary facilities ● Number of school days disrupted or lost due to the emergency ● % of schools/learning spaces with life skills-based education on crisis-related issues ● % of schools/learning spaces that lost learning materials as a result of the emergency ● % of teaching personnel unable to deliver classes due to emergency ● %ofeducationauthorityofficialsnotworkingduetotheemergency ● %ofgovernmenteducationoffices/facilitiesa)usableandb)unusable ● % of schools/learning spaces offering psychosocial support for a) children and youth and b) teachers
IFRC Community & School Disaster Management Project
A Focused Strategy for Achieving Our Education Goals 2012-2015 Save the Children Strategic objective 2: Children and youth at risk of, or affected by, emergencies have access to quality education as a fundamental part of all humanitarian responses
Education Cluster Needs Assessment Indicators Top 10 Core Indicators As outlined by the Global Education Cluster 30 June 2010s
110 Disaster risk ManageMent in Post-2015 DeveloPMent goals | Potential targets and indicators
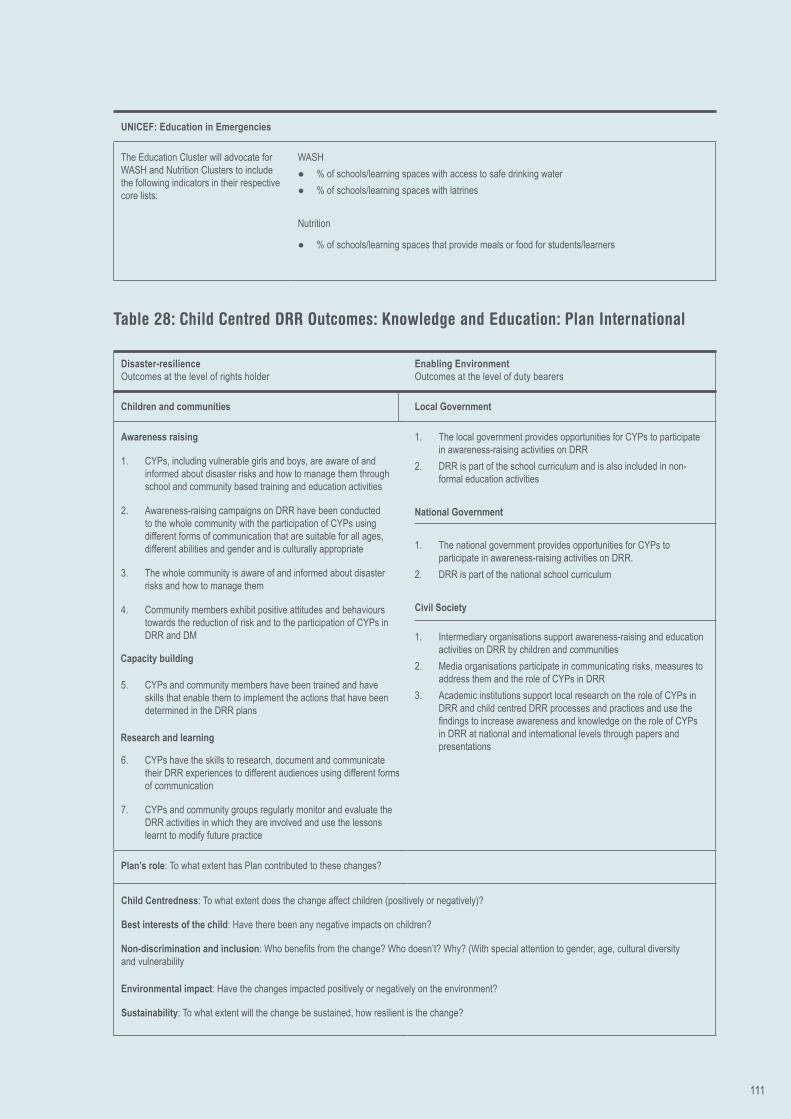
Table 28: Child Centred Drr outcomes: knowledge and Education: Plan international
Child Centredness: To what extent does the change affect children (positively or negatively)?
Best interests of the child: Have there been any negative impacts on children?
Non-discrimination and inclusion:Whobenefitsfromthechange?Whodoesn’t?Why?(Withspecialattentiontogender,age,culturaldiversityand vulnerability
Environmental impact: Have the changes impacted positively or negatively on the environment?
Sustainability: To what extent will the change be sustained, how resilient is the change?
UNICEF: Education in Emergencies
The Education Cluster will advocate for WASH and Nutrition Clusters to include the following indicators in their respective core lists:
WASH ● % of schools/learning spaces with access to safe drinking water ● % of schools/learning spaces with latrines
Nutrition
● % of schools/learning spaces that provide meals or food for students/learners
Disaster-resilience Outcomes at the level of rights holder
Enabling Environment Outcomes at the level of duty bearers
Children and communities Local Government
Awareness raising
1. CYPs, including vulnerable girls and boys, are aware of and informed about disaster risks and how to manage them through school and community based training and education activities
2. Awareness-raising campaigns on DRR have been conducted to the whole community with the participation of CYPs using different forms of communication that are suitable for all ages, different abilities and gender and is culturally appropriate
3. The whole community is aware of and informed about disaster risks and how to manage them
4. Community members exhibit positive attitudes and behaviours towards the reduction of risk and to the participation of CYPs in DRR and DM
5. CYPs and community members have been trained and have skills that enable them to implement the actions that have been determined in the DRR plans
6. CYPs have the skills to research, document and communicate their DRR experiences to different audiences using different forms of communication
7. CYPs and community groups regularly monitor and evaluate the DRR activities in which they are involved and use the lessons learnt to modify future practice
1. The local government provides opportunities for CYPs to participate in awareness-raising activities on DRR
2. DRR is part of the school curriculum and is also included in non-formal education activities
National Government
1. The national government provides opportunities for CYPs to participate in awareness-raising activities on DRR.
2. DRR is part of the national school curriculum
Civil Society
1. Intermediary organisations support awareness-raising and education activities on DRR by children and communities
2. Media organisations participate in communicating risks, measures to address them and the role of CYPs in DRR
3. Academic institutions support local research on the role of CYPs in DRR and child centred DRR processes and practices and use the findingstoincreaseawarenessandknowledgeontheroleofCYPsin DRR at national and international levels through papers and presentations
Plan’s role: To what extent has Plan contributed to these changes?
Capacity building
Research and learning
111

Annex g: Criteria for targets and indicators
The ODI suggests that there are six criteria for an effective target:
1. Is it a priority for poor people?
2. Would concerted action on the target actually make a positive difference?
3. Is there a good basis on which to calibrate the target (ambitious yet achievable)?
4. Is the target meaningful at all scales (local, sub-national, national, regional)?
5. Does it reinforce human rights?
6. Is it simple and easy to understand?
The ODI suggests there are five criteria for an effective indicator:
1. Can progress be measured every year?
2. Do reliable, comparable, disaggregated data already exist or can it be developed?
3. Is measurement likely to be relatively transparent/corruption free?
4. Is there capacity to measure progress everywhere or can it be developed easily?
5. Does the indicator link to the target?
1 The Office of Foreign Disaster Assistance/ Centre for Research on the Epidemiology of Disasters (CRED) (www.em-dat.net). Université Catholique de Louvain, Brussels, Belgium
2 IRDR (2012) ‘Key Risks, Opportunities and Indicators for Sustainable Development, and Potential SDGs, from the Viewpoint of Disaster Risk Management’. Briefing Note. Washington, DC: IDRD.
3 Penson, J. (2013) 'Education after 2015: The Commonwealth perspective'. World Education Blog. Available at: http://efareport.wordpress.com/2013/01/15/education-after-2015-the-commonwealth-perspective/
Annex Endnotes
112 Disaster risk ManageMent in Post-2015 DeveloPMent goals | Potential targets and indicators
ACFID (2005) ‘Tsunami & People With Disabilities: Summary Issues for Consideration’. Canberra: ACFID.
Adams, A.M. (2012) ‘The Education Link: Why Learning is Central to the Post-2015 Global Development Agenda’. Center for Universal Education Working Papers. Washington, DC: The Brookings Institution.
ADEA (2010) ‘Critical Basic Skills for Lifelong Learning’. Concept Note for the ADEA 2011 Triennale.
ADPC, Plan, Save the Children, World Vision, UNICEF and UNESCO (2012) ‘Comprehensive School Safety’. October.
Alderman, H., Hoddinott, J. and Kinsey, B. (2006) ‘Long-term Consequences of Early Childhood Malnutrition’. Oxford Economic Papers 58(3): 450-474.
Alkire, S., Roche, J., Santos, E. and Seth, S. (2011) Multidimensional Poverty Index 2011. Oxford: OPHI.
Anbarci, N., Escaleras, M. and Register, C. (2005) ‘Earthquake fatalities: the interaction of nature and political economy’. Journal of Public Economics 89(9-10): 1907-1933.
Arbon, P. (2012) Building Resilient Communities. Adelaide: Torrens Resilience Institute.
Arif, G. and Bilquees, F. (2006) ‘Chronic and Transitory Poverty in Pakistan: Evidence from a Longitudinal Household Survey’. MIMAP Technical Paper 19. Islamabad: PIDE.
Atlas Alliance (2011) ‘Disability in Conflicts and Emergencies’. Fact Sheet.
Bandura, R. (2008) ‘A Survey of Composite Indexes Measuring Country Performance: 2008 Update’. Working Paper. New York: UNDP/ODS.
Baulch, B. and Hoddinott, J. (2000) ‘Economic Mobility and Poverty Dynamics in Developing Countries’. Journal of Development Studies 36(6): 1-24.
Birdsall, N. (2012) ‘A Note on the Middle Class in Latin America’. Working Paper 303. Washington, DC: CGD.
Bourque, L., Siegel, J., Kano, M. and Wood, M. (2007) ‘Morbidity and Mortality Associated with Disasters’, in Rodríguez, H., Quarantelli, E. and Dynes, R. (eds) Handbook of Disaster Research. Heidelberg: Springer.
Bosch, P. and Gabrielson, P. (2003) ‘Environmental Indicators: Typology and Use in Reporting’. Working Paper. Copenhagen: EEA.
Bowen, A., Cochrane, S. and Fankhauser, S. (2011) ‘Climate Change, Adaptation and Economic Growth’. Climatic Change 113(2): 95-106.
Branigan, T. (2009) ‘China Releases Earthquake Death Toll of Children’. The Guardian, 7 May.
Brauch, H. (2003) ‘Urbanization and Natural Disasters in the Mediterranean: Population Growth and Climate Change in the 21st Century’, in Kreimer, A., Arnold, M. and Carlin, A. (eds) Building Safer Cities: The Future of Disaster Risk. Washington, DC: World Bank.
Briguglio, L. and Galea, W. (2002) ‘Updating and augmenting the Economic Vulnerability Index’. Occasional Paper by the Islands and Small States Institute of the University of Malta. Version 4.
Briguglio, L., Cordina, G., Farrugia, N. and Vela, S. (2008) ‘Economic Vulnerability and Resilience Concepts and Measurements’. Research Paper. Helsinki: UNU.
Cadot, E., Rodwin, V. and Spira, A. (2007) ‘In the Heat of Summer’. Journal of Urban Health 84(4): 466-468.
references Cannon, T. (1994) ‘Vulnerability Analysis and the Explanation of
Natural Disasters’, in A. Varley (ed), Disasters, Development and Environment. Chichester, John Wiley.
Cardona, O. D. (2007) ‘Indicadores de Riesgo de Desastres y de Gestión de Riesgos. Programa para América Latina y El Caribe’. Informe Resumido Actualizado a 2007. Washington, D.C : Banco Interamericano de Desarrollo, Departamento de Desarrollo Sostenible.
Carter, M. (1999) ‘Getting Ahead of Falling Behind? The Dynamics of Poverty in Post-Apartheid South Africa’. University of Wisconsin, Mimeo.
Cas, A., Frankenberg, E., Suriastini, W. and Thomas, D. (2011) ‘The Impact of Parental Death on Child Well-being’. Durham, NC: Duke University
Checchi, F. and Roberts, L. (2005) ‘Interpreting and Using Mortality Data in Humanitarian Emergencies’. London: Humanitarian Practice Network.
Chen, S. and Ravallion, M. (2008) ‘The Developing World Is Poorer than We Thought, but No Less Successful in the Fight against Poverty’. Washington, DC: World Bank.
Chen, S. and Ravallion, M. (2012) ‘An Update to the World Bank’s Estimates of Consumption Poverty in the Developing World’. Washington, DC: World Bank.
Children in a Changing Climate (2010) ‘Children’s Charter for Disaster Risk Reduction’. London, Brighton and Monrovia, CA: Children in a Changing Climate.
Children in a Changing Climate (2013) ‘Towards the Resilient Future Children Want: A Review of Progress in Achieving the Children’s Charter for Disaster Risk Reduction’. London, Brighton and Monrovia, CA: Children in a Changing Climate.
Clarke, D. (2012) ‘Disaster Resilience Development Indicators: A Hybrid Approach’. Discussion Note presented at DfID/ODI workshop ‘Integrating disaster risk in the post-MDG framework’.
Coburn, A. and Spence, R. (2006) ‘Front Matter’, in Coburn, A. and Spence, R. (eds) Earthquake Protection. Second Edition. Chichester: John Wiley & Sons.
CPRC (2009) ‘The Chronic Poverty Report 2008/09: Escaping Poverty Traps’. Manchester: CPRC.
CRED (n.d) The International Disaster Database. The Office of Foreign Disaster Assistance/ Centre for Research on the Epidemiology of Disasters (CRED). Brussels, Belgium: Université Catholique de Louvain. Available at: www.em-dat.net
DARA, (2011). ‘Analyses of the capacities and conditions for Disaster risk reduction. Costa Rica, El Salvador, Guatemala, Honduras, Nicaragua, Panama and the Dominican Republic’. Available at: http://daraint.org/wp-content/uploads/2010/10/RRI.pdf
Dercon, S. (2012) ‘Is Green Growth Good for the Poor?’ Policy Research Paper 06/247. Washington, DC: World Bank.
Dercon, S. and Krishnan, P. (1998) ‘Changes in Poverty in Rural Ethiopia 1989-1995: Measurement, Robustness Tests and Decomposition’. Working Paper 98/7. Oxford: CSAE.
Dercon, S. and Shapiro, J. (2007) ‘Moving on, Staying behind, Getting lost: Lessons on Poverty Mobility from Longitudinal Data’. Global Poverty Research Group Working Paper 75. Oxford and Manchester: ESRC.
Dercon, S., Hoddinott, J. and Woldehanna, T. (2005) ‘Shocks and Consumption in 15 Ethiopian Villages, 1999-2004’. Journal of African Economies 14(4): 559-585.
113

DFID, (2006). ‘Reducing the Risk of Disasters – Helping to Achieve Sustainable Poverty Reduction in a Vulner-able World’. DFID policy paper. London: Department for International Development.
DFID, (2011). ‘Defining Disaster Resilience’. DFID Approach Paper. London: Department for International Development.
Doocy, S., Rofi, A., Moodie, C., Spring, E., Bradley, S., Burnham, G. and Robinson, C. (2007) ‘Tsunami Mortality in Aceh Province, Indonesia’. Bulletin of the World Health Organization 85(2): 146-151.
Duffield, M. (2008) ‘Global Civil War: The Non-Insured, International Containment and Post-Interventionary Society’, Journal of Refugee Studies 21 (2), 145–65.
Edward, P. and Sumner, A. (2013) ‘The Future of Global Poverty in a Multi-speed World’. Mimeo.
Escaleras, M., Anbarci, N. and Register, C. (2007) ‘Public Sector Corruption and Major Earthquakes: A Potentially Deadly Interaction’. Public Choice 132: 209-230.
Foresight (2012) ‘Reducing Risks of Future Disasters: Priorities for Decision Makers’. London: The Government Office for Science
Gaiha, R. (1988). ‘Income Mobility in Rural India’. Economic Development and Cultural Change 36(2): 27-302.
Gaiha, R. and Deolalikar, A. (1993) ‘Persistent, Expected and Innate Poverty: Estimates for Semi-Arid Rural India, 1975-1984’. Cambridge Journal of Economics 17(4): 409-421.
Gale, J. and Varner, B. (2007) ‘Global Warming Increases Malaria, Dengue Fever Threat, UN Says’. Bloomberg, 27 November, Available at: www.bloomberg.com/apps/news?pid=newsarchive&sid=aMKZ0M6en19o
Glassman, A., Duran, D. and Sumner, A. (2011) ‘Global Health and the New Bottom Billion: What Do Shifts in Global Poverty and the Global Disease Burden Mean for GAVI and the Global Fund?’ Working Paper. Washington, DC: CGD.
Global Campaign for Education – US Chapter (2013) ‘Total Reach, Total Learning Education Beyond 2015’. Washington, DC: Global Campaign for Education – US Chapter
Global Education Cluster (2010) ‘Disaster Risk Reduction in Education in Emergencies: A Guidance Note for Education Clusters and Sector Coordination Groups’. Geneva: Global Education Cluster.
Global Thematic Consultation on Health (2013) Health in the Post-2015 Development Agenda. Draft Report, 28 February.
Government Office for Science (2012) Foresight Reducing Risks of Future Disasters: Priorities for Decision Makers. Final Project Report. London: Government Office for Science.
Government of the Republic of Haiti (2010) Haiti Earthquake PDNA: Assessment of Damage, Losses, General and Sectoral Needs. Port-au-Prince: Government of the Republic of Haiti.
Grootaert, C. and Kanbur, R. (1995) ‘The Lucky Few amidst Economic Decline: Distributional Changes in Cote d’Ivoire as Seen through Panel Data Sets, 1985-88’. Journal of Development Studies 31(4): 603-619.
Guha-Sapir, D. and Hoyois, P. (2013) ‘Patterns and Trends in Disasters in Asia’, in Davis, I. (ed.) Disaster Risk Management in Asia. Tokyo: ADB Institute. Forthcoming.
Haddad, L. and Ahmed, A. (2003) ‘Chronic and Transitory Poverty: Evidence from Egypt, 1997–99’. World Development 3(1): 71-85.
Hallegatte, S. (2012) ‘An Exploration of the Link between Development, Economic Growth, and Natural Risks’. Policy Research Working Paper 6216. Washington, DC: World Bank.
Hallegatte, S., Hourcade, J.C. and Dumas, P. (2007) ‘Why Economic Dynamics Matter in Assessing Climate Change Damages: Illustration on Extreme Events’. Ecological Economics 62: 330-340.
Handicap International (2008) ‘Mainstreaming Disability in Community Based Disaster Risk Reduction: A Training Manual for Trainers and Field Practitioners’. Available on www.handicapinternational.ph/docs/drm/India-Training-Manual.pdf
Handmer, J., Honda, Y., Kundzewicz, Z.W., Arnell, N., Benito, G., Hatfield, J., Mohamed, I.F., Peduzzi, P., Wu, S., Sherstyukov, B., Takahashi, K. and Yan, S. (2012) ‘Changes in Impacts of Climate Extremes: Human Systems and Ecosystems’, in Field, C.B. et al. (eds) Managing the Risks of Extreme Events and Disasters to Advance Climate Change Adaptation. A Special Report of Working Groups I and II of the IPCC. Cambridge and New York: Cambridge University Press.
Harris, A. and Enfield, S. (2003) Disability, Equality and Human Rights. A Training Manual for Development and Humanitarian Organisations. Oxford: Oxfam.
Hart, T. (2009) ‘Exploring Definitions of Food Insecurity and Vulnerability: Time to Refocus Assessments’. Agrekon 48(4): 362-383.
Hoddinott, J., Owens, T. and Kinsey, B. (1998) Relief Aid and Development Assistance in Zimbabwe. Report to USAID.
Hoeppe, P. and Gurenko, E. (2006) ‘Scientific and Economic Rationales for Innovative Climate Insurance Solutions’. Climate Policy, Special Issue on Insurance and Climate Change, 6: 607-620.
Hulme, D., Moore, K. and Shepherd, A. (2001) ‘Chronic Poverty: Meanings and Analytical Frameworks’. Working Paper 2. London: CPRC.
IFC (2010) Disaster and Emergency Preparedness: Guidance for Schools. Washington, DC: IFC.
IFRC (2007) Risk Reduction and Disaster Preparedness Indicators. Lima: IFRC.
INEE (2008) Talking Points: Education in Emergencies, INEE and the INEE Minimum Standards. New York: INEE.
IPCC (2001) ‘Statistics on Disasters’, in IPCC Climate Change 2001. Working Group II: Impacts, Adaptation and Vulnerability, Special Issues in Developing Countries. IPCC Third Assessment Report. New York: Cambridge University Press.
IPCC (2007) ‘Climate Change 2007: Synthesis Report. Contribution of Working Groups I, II and III to the Fourth Assessment Report of the Intergovernmental Panel on Climate Change’ [Core Writing Team, Pachauri, R.K and Reisinger, A. (eds.)]. IPCC, Geneva, Switzerland
IPCC (2012) ‘Glossary of Terms’, in Field, C., Barros, V., Stocker, T., Qin, D., Dokken, D., Ebi, K., Mastrandrea, M., Mach, K., Plattner, G., Allen, S., Tignor, M. and Midgley, P. (eds) Managing the Risks of Extreme Events and Disasters to Advance Climate Change Adaptation. Special Report of Working Groups I and II of the IPCC. Cambridge and New York: Cambridge University Press.
Melamed, C., Scott, A. and Mitchell, T. (2012) ‘Separated at Birth, Reunited in Rio? Bringing Development and Environment Back Together’. Background Paper. London: ODI
IRDR (2012) ‘Key Risks, Opportunities and Indicators for Sustainable Development, and Potential SDGs, from the Viewpoint of Disaster Risk Management’. Briefing Note. Washington, DC: IDRD.
Jakubicka, T., Vos, F., Phalkey, R., Marx, M. and Guha-Sapir, D. (2010) Health Impacts of Floods in Europe. EC 6th FP Microdis Report. Brussels and Heidelberg: CRED and Universitätsklinikum Heidelberg.
Jalan. J and Ravallion M. (1998) ‘Transient Poverty in Postreform Rural China’. Journal of Comparative Economics 26: 338-357.
Jalan J. and Ravallion M. (1999) ‘China’s lagging poor areas’. American Economic Review (Papers and Proceedings) 89: 301–305
Jalan, J. and M. Ravallion. (2000) ‘Is Transient Poverty Different? Evidence for Rural China’. Journal of Development Studies 36(6): 83-99.
Jayaraman, A. (2006) ‘Poverty Dynamics and Household Response: Disaster Shocks in Rural Bangladesh’. PhD Dissertation, Pennsylvania State University.
Kahn M. (2005) ‘The death toll from natural disasters: the role of income, geography, and institutions’. The Review of Economics and Statistics, 87 (2): 271-284.
Kanbur, R. and Sumner, A. (2011) ‘Poor Countries or Poor People? Development Assistance and the New Geography of Global
114 Disaster risk ManageMent in Post-2015 DeveloPMent goals | Potential targets and indicators

Poverty’. Working Paper 2011-08. Ithaca, NY: Charles H. Dyson School of Applied Economics and Management, Cornell University.
Kaisin, B. (2012) ‘The Role of Corruption: Earthquake Mortality’. Mémoire/Facultés Universitaires N.D. de la Paix Namur. Sciences économiques et sociales. Namur: FUNDP.
Karver, J., Kenny, C. and Sumner, A. (2012) ‘MDGs 2.0: What Goals, Targets, and Timeframe?’ Working Paper 297. Washington, DC: CGD.
Kedir, A.M. and McKay, A. (2003) ‘Chronic Poverty in Urban Ethiopia: Panel Data Evidence’. Manchester: CPRC.
Keefer, P., Neumayer, E. and Plümper, T. (2011) ‘Earthquake Propensity and the Politics of Mortality Prevention’. World Development 39(9): 1530-1541.
Keim MJ, Abrahams J. (2012) ‘Health and Disaster’ Chapter 44 in The Routledge Handbook of Hazards and Disaster Risk Reduction (Eds): Wisner B, Gaillard JC, Kelman I). Oxford/New York: Routledge.
Kim, E.S. and Choi, H.I. (2012) ‘Estimation of the Relative Severity of Floods in Small Ungauged Catchments for Preliminary Observations on Flash Flood Preparedness: A Case Study in Korea’. Int. J. Environ. Res. Public Health, 9(4): 1507-1522.
Kim, J.J. and Guha-Sapir, D. (2012) ‘Famines in Africa: Is Early Warning Early Enough?’ Global Health Action 5: 18481.
López-Calva, L.F. and Ortiz-Juarez, E. (2011) ‘A Vulnerability Approach to the Definition of the Middle Class’. Washington, DC, and New York: World Bank and UNDP.
Malamud, B., Turcotte, D., Guzzetti, F. and Reichenbach P. (2004) ‘Landslide inventories and their statistical properties’. Earth Surface Processes and Landforms, 29(6): 665-798.
Matyas, D. and Pelling, M. (2012) ‘Disaster Vulnerability and Resilience: Theory, Modelling and Prospective’. Available at: www.bis.gov.uk/assets/foresight/docs/reducing-risk-management/supporting-evidence/12-1298-disaster-vulnerability-resilience-theory.pdf
McCulloch, N. and Baulch, B. (1999) ‘Distinguishing the Chronically from the Transitorily Poor: Evidence from Rural Pakistan’. Working Paper 97. Brighton: IDS.
McGregor, J. A. (1991) ‘Poverty and Patronage: A Study of Credit, Development and Change in Rural Bangladesh’. Unpublished PhD Thesis. Bath: University of Bath.
McGregor, J. A. (1994) ‘Village Credit and the Reproduction of Poverty in Contemporary Rural Bangladesh’, in J. M. Acheson (ed), Anthropology and Institutional Economics. Lanham, MD, University Press of America, 261–81.
McGregor, A. and Sumner, A. (2010) ‘Beyond Business as Usual: What Might 3-D Wellbeing Contribute to MDG Momentum?’ IDS Bulletin 41(1): 104-112.
Mechler, R. (2009) ‘Disasters and Economic Welfare. Can National Savings Help Explain Post-disaster Changes in Consumption?’ Policy Research Working Paper 4988. Washington, DC: World Bank.
Mechler, R., Hochrainer, S., Pflug, G. and Lotsch, A. with Williges, K. (2009) ‘Assessing the Financial Vulnerability to Climate-Related Natural Hazards’. Background Paper for the Development and Climate Change World Development Report 2010.
Melamed, C. (2012) ‘Post-2015: Possible Solutions to the MDG/ SDG Puzzle’, Blog post on post2015.org
Mitchell, T. (2012) ‘Options for Including Disaster Resilience in Post-2015 Development Goals’. Background Note. London: ODI.
Mitchell, T., Mechler, R. and Harris, K. (2012) ‘Tackling Exposure: Placing Disaster Risk Management at the Heart of National Economic and Fiscal Policy’. London: Climate and Development Knowledge Network.
Morduch, J. (1995) ‘Income Smoothing and Consumption Smoothing’. Journal of Economic Perspectives 9(3): 103-114.
Moser, C.O.N. (1998) ‘The Asset Vulnerability Framework: Reassessing Urban Poverty Reduction Strategies’. World Development 26(1): 1-19.
Mroz. T. and Popkin, B. (1995) ‘Poverty and the Economic Transition in the Russian Federation’. Economic Development and Cultural Change 44(1): 1-31.
Muir-Wood, R, (2012) ‘The Use of Catastrophe Loss Modelling Methodologies to Design and Monitor Disaster Resilience Goals and Indicators in a Post-MDG Framework’. Washington, DC: RMS.
Narayan, D. and Petesch, P. (2007) ‘Moving out of Poverty’. Washington, DC: World Bank.
Naude, W., McGillivray, M. and Rossouw, S. (2009a) ‘Measuring the Vulnerability of Subnational Regions in South Africa’. Oxford Development Studies 37(3): 249-275.
Naude, W., Santos-Paulino, A.U. and McGillivray, M. (2009b) ‘Measuring Vulnerability: An Overview and Introduction’. Oxford Development Studies 37(3): 183-191.
Noji, E.K. (2005) ‘Disasters: Introduction and State of the Art’. Epidemiolgic Review 27(1): 3-8.
ODI and Plan International (2012) ‘Climate Extremes and Child Rights in South Asia: A Neglected Priority’. Briefing. London and Woking: ODI and Plan International.
North, D. C. (1995) ‘The New Institutional Economics and Third World Development’, in J. Harriss, J. Hunter and C. M. Lewis (eds), The New Institutional Economics and Third World Development. London, Routledge 17–26.
OECD (2012) Shifting Wealth. Paris: OECD.Oosters, B. (2005) ‘Disability Sensitive Planning for Rehabilitation/
Reconstruction’, in ITDG (ed.) Guidelines for Planning in the Re-building Process. London: ITDG.
Pelling, M. (2003) The Vulnerability of Cities: Natural Disasters and Social Resilience. Abingdon: Earthscan.
Pelling, M. (2006) ‘Review of Global Risk Index Projects: Conclusions for Sub-national and Local Approaches’, in Birkmann, J. (ed.) Measuring Vulnerability to Natural Hazards – Towards Disaster Resilient Societies. Tokyo, New York and Paris: UNU.
Penson, J. (2013) ‘Education after 2015: The Commonwealth perspective’. World Education Blog. Available at: http://efareport.wordpress.com/2013/01/15/education-after-2015-the-commonwealth-perspective/
Piegari, E., Di Maio, R. and Milano, L. (2009) ‘Characteristic scales in landslide modeling’. Nonlin. Processes Geophys.,16: 515–523. Available at www.nonlin-processes-geophys.net/16/515/2009/
Pielke, R. A. and Landsea, C. W. (1998). ‘Normalized hurricane damages in the United States: 1925–95.’ Weather Forecast. 13,3. 621–631.
PISA (2006) Science Competencies for Tomorrow’s World. Volume 1 – Analysis. Paris: OECD.
Plan International (2010) Child-Centred Disaster Risk Reduction Toolkit. Woking: Plan International.
Plan International (2012) Impact of Climate Change on Children in Nepal. Woking: Plan International.
Plan International (2013) Disasters and Girls Education: A Study on the Pakistan 2010-2011 Floods. Woking: Plan International.
Poutrel, M. (2012) ‘Education Thematic Consultation’. Concept Note. Global Thematic Consultation on Education in the Post-2015 Development Agenda.
Pritchett, L. (2006) ‘Who Is Not Poor? Proposing a Higher International Standard for Poverty’. World Bank Research Observer 21(1): 1-23.
Pritchett, L., Suryahadi, A. and Sumarto, S. (2000) ‘Quantifying Vulnerability to Poverty: A Proposed Measure, with Application to Indonesia’. Working Paper. Jakarta: SMERU.
Quarantelli, E. L. (2005) ‘A Social Science Research Agenda for the Disasters of the 21st Century: Theoretical, Methodological and Empirical Issues and their Professional Implementation’, in R. W. Perry and E. L. Quarantelli (eds), What Is a Disaster? New Answers to Old Questions. Philadelphia, PA, Xlibris, 325–96.
115

Raddatz, C. (2009) ‘The Wrath of God: Macroeconomic Costs of Natural Disasters’. Policy Research Working Paper 5039. Washington, DC: World Bank.
Ranger, N., Hallegatte, S., Bhattacharya, S., Bachu, M., Priya, S., Dhore, K., Rafique, F., Mathur, P., Naville, N., Henriet, F., Herweijer, C., Pohit, S. and Corfee-Morlot, J. (2011) ‘A Preliminary Assessment of the Potential Impact of Climate Change on Flood Risk in Mumbai’. Climatic Change, in press.
Ravallion, M. (1996) Issues in Measuring and Modeling Poverty. Washington, DC: World Bank.
Ravallion, M. (2013) ‘How Long Will It Take to Lift One Billion People Out of Poverty?’ Policy Research Working Paper 6325. Washington, DC: World Bank.
République de Djibouti (2011) Evaluation des dommages, pertes et besoins suite à la sécheresse. Djibouti: République de Djibouti.
Risk RED (2008) ‘Disaster Prevention A Safe Foundation for Full Inclusion’. Prepared for the UNISDR Thematic Platform on Knowledge and Education, the Coalition for School Safety and Disaster Prevention Education and the International Conference on Education.
Rodriguez-Llanes, J.M., Ranjan-Dash, S., Degomme, O., Mukhopadhyay, A. and Guha-Sapir, D. (2011) ‘Child Malnutrition and Recurrent Flooding in Rural Eastern India: A Community-based Survey’. BMJ Open 1(2): e00019.
Romero, S. (2010) ‘With Haitian Schools in Ruins, Children in Limbo’. The New York Times, 6 March.
Room, G. (2000) ‘Trajectories of Social Exclusion: The Wider Context for the Third and First Worlds’, in Gordon, D. and Townsend, P. (eds) Breadline Europe: The Measurement of Poverty. Bristol: Policy Press.
Salama, P., Spiegel, P., Talley, L. and Waldman, R. (2004) ‘Lessons Learned from Complex Emergencies over the Past Decade’. The Lancet 364(9447): 1801-1813.
Save the Children and World Vision (2012) Ending the Everyday Emergency: Resilience and Children in the Sahel. London: World Vision and Save the Children.
Sawai, M. (2011) ‘Who Is Vulnerable during Tsunamis? Experiences from the Great East Japan Earthquake 2011 and the Indian Ocean Tsunami 2004’. Working Paper. Bangkok: UNESCAP.
Scott, L. and Shepherd, A. (2011) ‘Climate Change as Part of the Post-2015 Development Agenda’. Background Note. London: ODI
Stonefield, R. and Jackson, J. (2009) ‘Flash Flood/Flood Climatology for the WFO Blacksburg, Virginia County Warning Area’. 2 Aug 2009. Available at http://www.erh.noaa.gov/rnk/Newsletter/Spring_2009/flash_flood_climatology/Flash_Flood_Climatology.html
Sumner, A. (2010) ‘Global Poverty and the New Bottom Billion’. Working Paper 349. Brighton: IDS.
Sumner, A. (2012a) ‘From Deprivation to Distribution: Is Global Poverty Becoming a Matter of National Distribution’. Working Paper 394. Brighton: IDS
Sumner, A. (2012b) ‘Where Do the Poor Live?’ World Development 40(5): 865-877.
Sumner, A. (2012c) ‘Where Do the World’s Poor Live? An Update’. Working Paper 393. Brighton: IDS.
Sumner, A. and Mallet, R. (2013) ‘Capturing Multidimensionality: What Does a “Human Wellbeing” Conceptual Framework Add to the Analysis of Vulnerability?’ Social Indicators Research. London: ODI.
Tatsuki, S. (2013) ‘Old Age, Disability and the East Japan Earthquake’. Forthcoming in Earthquake Spectra.
The Sphere Project (2011) ‘The SPHERE Handbook: Humanitarian Charter and Minimum Standards in Humanitarian Response’. Geneva: The Sphere Project.
Thomalla F, Downing T, Spanger-Siegfried E, Han G, Rockstrom J. (2006) ‘Reducing hazard vulnerability: towards a common approach between disaster risk reduction and climate adaptation’. Disasters 30(1): 39-48.
Tierney, K., Lindell, M. and Perry, R. (2001) Facing the Unexpected: Disaster Preparedness and Response in the United States. Washington, DC: Joseph Henry.
UN (2011) Global Assessment Report on Disaster Risk Reduction Revealing Risk, Redefining Development. New York: UN.
UNDP (2013) ‘Key Conclusions: Global Thematic Consultation on Disaster Risk Reduction and the Post-2015 Development Agenda’. Available at http://www.preventionweb.net/files/31317_sin476887465bel3ub2hd8ir3d6p8b5a6tu.pdf
UNESCO (2012) Youth and Skills: Putting Education to Work. Global Monitoring Report 2012. Paris: UNESCO.
UNFCCC (2012) ‘Current Knowledge on Relevant Methodologies and Data Requirements as well as Lessons Learned and Gaps Identified at Different Levels in Assessing the Risk of Loss and Damage Associated with the Adverse Effects of Climate Change’. UNFCCC Technical Paper FCCC/TP/2012/1.
UNICEF (2009) Education in Emergencies: A Resource Tool Kit. New York: UNICEF.
UNICEF (2011a) State of the World’s Children Report 2011: Children in an Urban World. New York: UNICEF.
UNICEF (2011b) Level and Trends in Child Mortality. New York: UNICEF.
UNISDR (2008a) Indicators of Progress: Guidance on Measuring the Reduction of Disaster Risks and the Implementation of the Hyogo Framework for Action. Geneva: UNISDR.
UNISDR (2008b) Disaster Prevention for Schools: Guidance for Education Sector Decision-Makers. Geneva: UNISDR.
UNISDR (2009a) Global Assessment Report on Disaster Risk Reduction. Geneva: UNISDR.
UNISDR (2009b) ‘Terminology on Disaster Risk Reduction’. Geneva: UNISDR.
UNISDR (2010) One Million Safe Schools and Hospitals Assessment and Mitigation Planning for Risk Reduction Guide. Bangkok: UNISDR AP.
UNISDR (2011a) ‘Proceedings of the 3rd Session of the Global Platform for Disaster Risk Reduction and World Reconstruction Conference’. Geneva, 8-13 May.
UNISDR (2011b) Global Assessment Report on Disaster Risk Reduction. Geneva: UNISDR.
UNISDR (2012) ‘Towards a Post-2015 Framework for Disaster Risk Reduction Search’. Geneva: UNISDR.
UNISDR/WMO (2012) ‘UN system task team on the post-2015 UN development agenda : building resilience to disasters through partnerships’. 2012, 7pp, available online www.unisdr.org/we/inform/publications/27462
Valentine, G. (1989) ‘The Geography of Women’s Fear’, Area 21 (4), 385–90.
Wadugodapitiya, D. and Baulch, B. (2010) ‘The Value of Panel Data in Chronic Poverty Analysis’. Policy Brief 23. Manchester: CPRC.
Wald, J., Worden, B., Earle, P., Quitoriano, V. and Lin, K. (2005) ‘U.S. Geological Survey’s Advanced National Seismic System Shakemap: Ongoing Developments’. Proceedings of the International Symposium for Earthquake Engineering, Kobe, 13-16 January.
Webb, P. and Harinarayan, A. (1999) ‘A Measure of Uncertainty: The Nature of Vulnerability and Its Relationship to Malnutrition’. Disasters 23(4): 292-305.
Webster, P. (2008) ‘Myanmar’s Deadly Daffodil’. Nature Geoscience 1: 488 – 490.
WFP (2011) Fighting Hunger World Wide. Rome: WFP.Wheeler, D. (2011) ‘CGD Quantifying Vulnerability to Climate Change:
Implications for Adaptation Assistance’. Working Paper 240. Washington, DC: CGD.
WHO (2005a). Guidelines for training personnel in developing countries for prosthetics and orthotics services. Geneva, World Health Organization.
116 Disaster risk ManageMent in Post-2015 DeveloPMent goals | Potential targets and indicators

WHO (2005b) ‘Resolution WHA58/17. Disability, including prevention, management and rehabilitation’. In: Fifty-eighth World Health Assembly. Geneva, 16–25 May 2005. Volume 1. Resolutions and decisions. Geneva, World Health Organization (WHA58/2005/REC/1).
WHO (2005c) International health regulations. 2nd Edition. Geneva.WHO (2008a) Older Persons in Emergencies: An Active, Aging
Perspective. Geneva: WHO.WHO (2008b) Global Assessment of National Health Sector Emergency
Preparedness and Response. Geneva: WHO.WHO (2009) ‘Call to Protect Hospitals, Schools from Impact of
Disasters’. News Release, 18 June.WHO (2009b) Manual for the Public Health Management of
Chemical Incident. available at: : http://whqlibdoc.who.int/publications/2009/9789241598149_eng.pdf
WHO (2010) Checklist and Indicators for Monitoring Progress in the Development of IHR Core Capacities in States Parties. Geneva: WHO.
WHO (2011a) Global Status Report on Noncommunicable Diseases 2010. Geneva: WHO.
WHO (2011b) World Report on Disability. Geneva: WHO.WHO (2011c) ‘Disaster Risk Management for Health: Overview’. Global
Platform, May. Geneva: WHO.WHO (2011d) ‘Hospitals: Prepared for Emergencies and Disasters’.
Global Platform, May. Geneva: WHO.WHO, Global Health Workforce Alliance, UNICEF, UNHCR and
IFRC (2011) ‘Scaling up the Community-based Work Force for Emergencies’. Joint Statement.
Wilkinson, E., Lovell, E. and Matheson, S. (2012) ‘Evidence’. Paper on Disasters, Unpublished paper for DFID. London: ODI.
Wisner, B., Blaikie, P., Cannon, T. and Davis, I. (2003) ‘At Risk : Natural Hazards, People’s Vulnerability and Disasters’. Routledge, 2003.
Wood, G. (2003) ‘Staying Secure, Staying Poor: The “Faustian Bargain”’. World Development 31(3): 455-471.
World Bank (2010) World Development Report 2010: Development and Climate Change. Washington, DC: World Bank.
World Bank (2011a) Climate Change, Disaster Risk and the Urban Poor. Washington, DC: World Bank.
World Bank (2011b) World Development Report 2011: Conflict, Security and Development. Washington, DC: World Bank.
117


