discipline drives performance - veritas-institutional.com · high yield market themes ... beginning...
TRANSCRIPT

High Yield Market Themes - Veritas Institutional Conference - Hamburg, May 2017
Discipline Drives Performance®
May 12, 2017

SHENKMAN CAPITAL MANAGEMENT, INC.SHENKMAN CAPITAL MANAGEMENT, INC.
ProPrietary information - Do not DuPlicate confiDential ©2017 SHENKMAN CAPITAL MANAGEMENT, INC. ALL RIGHTS RESERvEd
Presenters
Curt Schibli, CFA Portfolio ManagerCurt “Kip” Schibli manages global and European portfolios and oversees the European High Yield Team at Shenkman Capital. He joined Shenkman Capital in 2014 from Brookfield Investment Management and has 30 years of finance and investment experience in Continental Europe, the UK, and the US, including 17 years of high yield experience. Prior to joining Shenkman, Mr. Schibli was a co-founder and Director of Pall Mall Investment Management in London, where he was Portfolio Manager Head of the European Corporate High Yield Team, a role he continued to pursue with Brookfield following its acquisition of Pall Mall’s European high yield business. Beginning his career as Senior Credit Analyst in corporate lending at Manufacturers Hanover Trust Company, Mr. Schibli began managing international fixed income portfolios with Bankers Trust and later with Schroder Investment Management, where he was a global and European bond portfolio manager. Mr. Schibli earned his BA degree from Boston University and is a CFA charter holder.
Patrick MedleyClient Portfolio ManagerPatrick Medley joined Shenkman Capital in March 2016 as a client portfolio manager. Prior to Shenkman, he spent 7 years as a partner with Sothic Capital, a hedge fund focused on European distressed situations, responsible for marketing and investor relations. From 2008 to 2009, he was in charge of European marketing for Plainfield Asset Mangement, as US distressed hedge fund. Patrick’s previous roles included several years at Bear Stearns, Goldman Sachs and Morgan Stanley. Patrick has a BSc (Hons) in Modern Languages and Marketing from Salford University and an MBA from INSEAD.

SHENKMAN CAPITAL MANAGEMENT, INC.SHENKMAN CAPITAL MANAGEMENT, INC.
ProPrietary information - Do not DuPlicate confiDential ©2017 SHENKMAN CAPITAL MANAGEMENT, INC. ALL RIGHTS RESERvEd
The firm has a 31-year reputation as a pioneer and leader in the leveraged finance market.
Firm Profile
long History
Stable ownership
Depth of team
Performance Goal
conservative Style
■ Independently owned by twenty senior managers and one outside director■ No competing businesses or parent company
■ Bottom up, fundamental credit analysis■ Process driven, rules-based credit decisions■ Risk-averse style under all market cycles
■ Founded 1985 – Pioneer firm in the high yield market■ Offices in New York, NY, Stamford, CT, and London, UK■ Exclusive focus on leveraged companies
*As of March 31, 2017.
■ 129 team members■ 49 investment professionals and 80 support staff■ Collegial environment with low professional turnover
■ Attractive risk-adjusted returns
1

SHENKMAN CAPITAL MANAGEMENT, INC.SHENKMAN CAPITAL MANAGEMENT, INC.
ProPrietary information - Do not DuPlicate confiDential ©2017 SHENKMAN CAPITAL MANAGEMENT, INC. ALL RIGHTS RESERvEd
Product Capabilities
Customized solutions within leveraged finance.
Senior Secured Loans
High Yield Bonds
Convertible Bonds
Asset Type Strategy SeparateAccount
Trad
ition
al C
apita
l Stru
ctur
eAl
tern
ativ
e
Mutual Fund
UCITSFund
Asset information presented represents approximate asset levels as of March 31, 2017.
CLO Debt & Equity
Short Duration
2

SHENKMAN CAPITAL MANAGEMENT, INC.SHENKMAN CAPITAL MANAGEMENT, INC.
ProPrietary information - Do not DuPlicate confiDential ©2017 SHENKMAN CAPITAL MANAGEMENT, INC. ALL RIGHTS RESERvEd
Five Step R esearch Pro cess
We utilize a structured, disciplined process using proprietary analytical tools.
Direct Communication with Management Teams: Prior To and During Investment
Comprehensive Financial Model, Stress Test and Covenant Review
Trading Analytics: Liquidity Score, Volatility Score, Credit Line, Relative Value Analysis
Rigorous In-Depth Credit Analysis: Company and Industry
Proprietary Analytics: C.Scope® Score, Quadrants, Risk Assessment Checklist
in-Depth research
Due Diligence meetings
Proprietary Scoring System
financial modeling
unique analytics
3

SHENKMAN CAPITAL MANAGEMENT, INC.SHENKMAN CAPITAL MANAGEMENT, INC.
ProPrietary information - Do not DuPlicate confiDential ©2017 SHENKMAN CAPITAL MANAGEMENT, INC. ALL RIGHTS RESERvEd
C.S cope S core Versus R ating Agencies
Score Caa1/Caa2/Caa3 B1/B2/B3 Ba1/Ba2/Ba3 Baa3/Baa2/Baa1
70-74 21 60 31 2
75-79 37 105 54 3
80-84 20 105 54 4
85-89 5 74 68 3
90+ 3 55 57 2
Score CCC-/CCC/CCC+ B-/B/B+ BB-/BB/BB+ BBB-/BBB/BBB+
70-74 3 59 51 1
75-79 20 99 71 9
80-84 8 81 79 15
85-89 4 42 100 4
90+ 5 39 71 2
We believe our proprietary C.Scope®score is more reflective of credit quality.
The C.Scope® represents the securities from the Shenkman Capital High Yield Composite as of March 31, 2017. Please see disclaimers for additional important information.
C.Scope® vs. Moody’s Rating
C.Scope® vs. S&P Rating
137
90
90
132
®
4

SHENKMAN CAPITAL MANAGEMENT, INC.SHENKMAN CAPITAL MANAGEMENT, INC.
ProPrietary information - Do not DuPlicate confiDential ©2017 SHENKMAN CAPITAL MANAGEMENT, INC. ALL RIGHTS RESERvEd
Global R eturns Summary
As of 3/31/2017. All returns are in local currency.Source: BofA Merrill Lynch, Bloomberg, eVestment. Past performance is not indicative of futuer results. See disclaimers for additional, important information.
Asset Class 2015 2016 YTD 2017
1 BofA Merrill Lynch DM High Yield Constrained Index (HYDC) -3.09% 15.50% 2.56%
2 BofA Merrill Lynch U.S. High Yield Index (H0A0) -4.64% 17.49% 2.71%
3 BofA Merrill Lynch European Currency High Yield Index (HP00) 1.61% 9.26% 1.93%
4 BofA Merrill Lynch Sterling High Yield (HL00) 5.43% 10.47% 3.28%
5 BofA Merrill Lynch Emerging Markets Non-Fin HY Index (EMHB) 3.16% 17.31% 3.79%
6 S&P/LSTA U.S. Leveraged Loan Index -0.69% 10.16% 1.15%
7 S&P European Leveraged Loan Index (ELLI) 5.50% 3.79% 1.18%
8 BofA Merrill Lynch U.S. Corporate Index (C0A0) -0.63% 5.96% 1.42%
9 BofA Merrill Lynch Euro Corporate Index (ER00) -0.43% 4.75% 0.25%
10 BofA Merrill Lynch U.S. Government Index (G0Q0) 0.83% 1.14% 0.69%
11 BofA Merrill Lynch Euro Government Index (EG00) 1.64% 3.32% -1.55%
12 BofA Merrill Lynch U.K. Government Index (G0L0) 0.47% 10.60% 1.63%
13 S&P 500 Total Return Index 1.37% 11.95% 6.07%
14 STOXX 600 Total Return Index 10.14% 2.38% 6.30%
15 FTSE 100 Total Return Index -1.37% 19.15% 3.67%
After a strong 2016, Global High Yield is off to a good start in 2017, buoyed by post election economic growth expectations.
Despite the U.K. Brexit vote, both Sterling and Euro high yield have performed well.
As of March 31, 2017
5

SHENKMAN CAPITAL MANAGEMENT, INC.SHENKMAN CAPITAL MANAGEMENT, INC.
ProPrietary information - Do not DuPlicate confiDential ©2017 SHENKMAN CAPITAL MANAGEMENT, INC. ALL RIGHTS RESERvEd
Global Statistics
As of 3/31/2017. All returns are hedged Euro. Volatility is based on daily returns for 2016. Source: BofA Merrill Lynch: Developed Markets High Yield Constrained Index (HYDC), U.S. High Yield Index (H0A0), European Currency High Yield Index (HP00), Bloomberg. *Price and other statsitics are always in local currency. Past performance is not a guarantee of future results. See disclaimers for additional, important information.
PerformanceGlobal HY(HYDC)
U.S. HY(H0A0)
European HY (HP00)
1 YTD 2017 Performance (Euro Hedged) 2.22% 2.28% 1.90%
2. BB 1.71% 1.59% 2.01%
3. B 2.15% 2.24% 1.42%
4. CCC 4.09% 4.10% 3.66%
5. 2016 Performance (Euro Hedged) 14.09% 15.69% 9.11%
6. BB 10.54% 11.50% 8.42%
7. B 14.26% 15.18% 11.78%
8. CCC 28.12% 29.97% 7.48%
9. 2016 Volatility (Euro Hedged) 3.50% 3.69% 2.85%
The risk rally was strongest in the U.S.
Spreads look slightly more attractive in the U.S., though there are rating differentials.
Market Statistics as of 3/31/2017*Global HY(HYDC)
U.S. HY(H0A0)
European HY (HP00)
10. Yield to Worst 5.36% 5.88% 3.42%
11. Option Adjusted Spread (bps) 387 392 369
12. Effective Duration 4.06 4.21 3.51
13. Average Price 101.59 100.82 104.43
14. Average Rating B1 B1 BB3
6

SHENKMAN CAPITAL MANAGEMENT, INC.SHENKMAN CAPITAL MANAGEMENT, INC.
ProPrietary information - Do not DuPlicate confiDential ©2017 SHENKMAN CAPITAL MANAGEMENT, INC. ALL RIGHTS RESERvEd
Things to watch in 2017:
■ Election risk returns to Europe and the U.K.
■ Central bank actions’ declining market influence
■ High U.S. expectations may be dampened by the pace of policy implementation
■ Inflation risk
■ Will the U.S. Federal Reserve raise rates too much too soon? For the Fed, the question is “how much?” For the ECB, the question is “when?”
■ China: growth, debt, treasury reserves and currency values
■ Beyond the political risk, Europe will become relatively more attractive as cyclicals gain momentum
Global Year Ahead
As 2017 unfolds, uncertainty around politics will provide opportunities for investors.
7
SHENKMAN CAPITAL MANAGEMENT, INC.SHENKMAN CAPITAL MANAGEMENT, INC.
ProPrietary information - Do not DuPlicate confiDential ©2017 SHENKMAN CAPITAL MANAGEMENT, INC. ALL RIGHTS RESERvEd
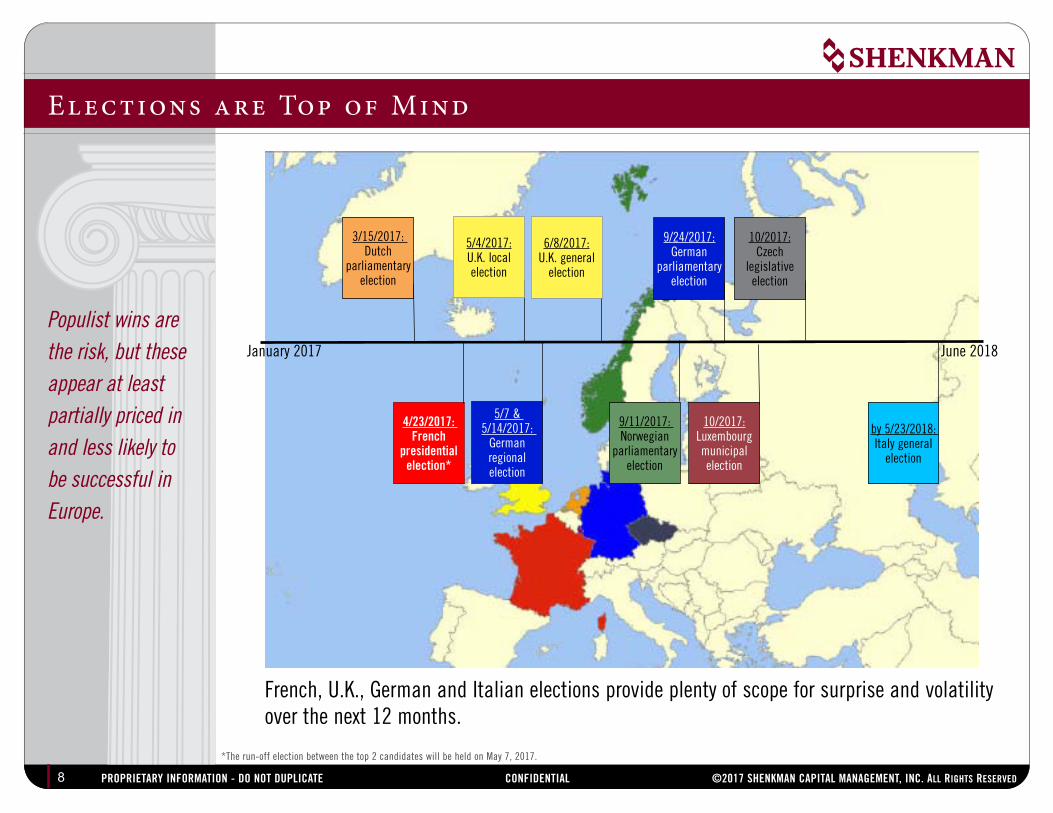
Populist wins are the risk, but these appear at least partially priced in and less likely to be successful in Europe.
Elections are Top of Mind
*The run-off election between the top 2 candidates will be held on May 7, 2017.
French, U.K., German and Italian elections provide plenty of scope for surprise and volatility over the next 12 months.
January 2017 June 2018
3/15/2017: Dutch
parliamentary election
4/23/2017: french
presidential election*
5/4/2017:U.K. local election
9/24/2017:German
parliamentary election
5/7 & 5/14/2017:
German regional election
9/11/2017: Norwegian
parliamentary election
10/2017:Czech
legislative election
10/2017:Luxembourg municipal election
6/8/2017:U.K. general
election
by 5/23/2018: Italy general
election
8

SHENKMAN CAPITAL MANAGEMENT, INC.SHENKMAN CAPITAL MANAGEMENT, INC.
ProPrietary information - Do not DuPlicate confiDential ©2017 SHENKMAN CAPITAL MANAGEMENT, INC. ALL RIGHTS RESERvEd
Investors greeted the pro-business agenda of the new U.S. administration enthusiastically. Now a tug of war is under way to implement “Trumponomics.”
Tug of War
As of 03/31/2017. Source: Corbis.
Battle over the agenda:
Geopolitical
infrastructure
Healthcare
tax reform
congress Presidenttrump
9

SHENKMAN CAPITAL MANAGEMENT, INC.SHENKMAN CAPITAL MANAGEMENT, INC.
ProPrietary information - Do not DuPlicate confiDential ©2017 SHENKMAN CAPITAL MANAGEMENT, INC. ALL RIGHTS RESERvEd
Shift from Monetary to Fiscal Policy
CPI as of 3/31/2017. Trade balance and hourly earnings as of 2/28/2017.Source: Competitive Enterprise Institute, Shenkman.
The 2016 U.S. presidential election signaled the end of monetary stimulus and a new era of fiscal stimulus.
fiscal Policy impacts:
■ inflation
■ trade
■ Wages
■ regulations
Monetary stimulus drove indiscriminate momentum. Fiscal policy will be more targeted in creating winners and losers.
CPI YoY: 2.7%
Trade Balance: ($43.66B)
Hourly EarningsYoY:2.8%
2016 Record Year for Regulations:81,640 pages
10

SHENKMAN CAPITAL MANAGEMENT, INC.SHENKMAN CAPITAL MANAGEMENT, INC.
ProPrietary information - Do not DuPlicate confiDential ©2017 SHENKMAN CAPITAL MANAGEMENT, INC. ALL RIGHTS RESERvEd
Europe - Trump Bump or Slump?
Source: International Trade Center. Data for 2016. World Trade Organization/International Trade Center 2017 update anticipated March 2018.
While Europe has not been a primary focus for Trump’s agenda, it will still meaningfully impact Europe and the U.K.
• Trump pro-growth agenda has boosted sentiment
• A stronger U.S. economy will benefit European companies
• Trade policy likely to be more targeted, rather than blanket deals
• Europe and U.K. may find new trade opportunities, where the U.S. pulls back
• Risks appear more likely to be driven by the U.S. NATO & Russia policy
Top 5 Trading Partners (Import / Export)
U.K. Germany France
Germany / U.S. Netherlands / U.S. Germany / Germany
U.S. / Germany China / France China / Spain
China / France France / U.K. Italy / U.S.
Netherlands / Netherlands Belgium / China U.S. / Italy
France / Ireland Italy / Netherlands Belgium / U.K.
11

SHENKMAN CAPITAL MANAGEMENT, INC.SHENKMAN CAPITAL MANAGEMENT, INC.
ProPrietary information - Do not DuPlicate confiDential ©2017 SHENKMAN CAPITAL MANAGEMENT, INC. ALL RIGHTS RESERvEd
The United Kingd om - Challenging Times
As of 3/31/2017. Source: Shenkman, Bloomberg, OECD. UK GDP growth rate compared to the same quarter of previous year, seasonally adjusted. FTSE return in GBP. New issue volume source: Merrill Lynch Global Research.
While the U.K. is clearly facing a major transition year, it may create opportunities given the post-Brexit market strength thus far.
• So far surprisingly resilient
• Brunt of pain in the currency already being used as an excuse by issuers
• Period of risk accelerating as Brexit moves ahead
• Opportunities may develop as markets across Europe will react as negotiation headlines roll out
Global HY New Issue Volume (USD M)
Quarter GBP Issuance EUR Issuance
1Q2016 0 2,881
2Q2016 570 10,984
3Q2016 2,343 16,075
4Q2016 572 9,698
YTD 2017 2,525 6,366
The U.K. is in uncharted territory
United Kingdom
Quarter GDP FTSE Return
1Q2016 1.61% 0.07%
2Q2016 1.73% 6.54%
3Q2016 1.96% 7.06%
4Q2016 1.93% 4.32%
YTD 2017 1.80% 3.66%
12

SHENKMAN CAPITAL MANAGEMENT, INC.SHENKMAN CAPITAL MANAGEMENT, INC.
ProPrietary information - Do not DuPlicate confiDential ©2017 SHENKMAN CAPITAL MANAGEMENT, INC. ALL RIGHTS RESERvEd
U.S. and European economies are showing healthy signs. While on different cycles, these economies should be supportive of each other.
Global Growth is Holding Up
As of 3/31/2017. Quarterly real GDP (expenditure approach) growth rate compared to the same quarter, previous year, and is updated as soon as the latest GDP numbers are released. 28-member European Union GDP. Source: Bloomberg. OECD.
45
55
65
-1.0%
0.0%
1.0%
2.0%
3.0%
4.0%
5.0%
Sep-
11
Dec-
11
Mar
-12
Jun-
12
Sep-
12
Dec-
12
Mar
-13
Jun-
13
Sep-
13
Dec-
13
Mar
-14
Jun-
14
Sep-
14
Dec-
14
Mar
-15
Jun-
15
Sep-
15
Dec-
15
Mar
-16
Jun-
16
Sep-
16
Dec-
16
U.S. and E.U. Quarterly GDP and PMI
U.S. GDP QoQ (L) E.U. GDP QoQ (L) U.S. Composite PMI (R) Eurozone Composite PMI (R)
-25
-20
-15
-10
-5
0
20
40
60
80
100
120
140
Jan-
11
Apr-
11
Jul-1
1
Oct-
11
Jan-
12
Apr-
12
Jul-1
2
Oct-
12
Jan-
13
Apr-
13
Jul-1
3
Oct-
13
Jan-
14
Apr-
14
Jul-1
4
Oct-
14
Jan-
15
Apr-
15
Jul-1
5
Oct-
15
Jan-
16
Apr-
16
Jul-1
6
Oct-
16
Jan-
17
U.S. and E.U. Consumer Confidence
U.S. Consumer Confidence Index
E.U. 27 Consumer Confidence Index
13

SHENKMAN CAPITAL MANAGEMENT, INC.SHENKMAN CAPITAL MANAGEMENT, INC.
ProPrietary information - Do not DuPlicate confiDential ©2017 SHENKMAN CAPITAL MANAGEMENT, INC. ALL RIGHTS RESERvEd
Interest R ate Differentials Still Pulling Assets to D oll ars
As of 3/31/2017.Average shown above reflects average yield differentials from 12/31/2010-3/31/2017. Source: Bloomberg, BofA ML Global Research. 10-Year US Treasury Constant Maturity, 10-Year German Bund Constant Maturity, 10-Year Japan Constant Maturity.
There continues to be a divergence in rates between the U.S. and other major economies. This continues to attract assets to the U.S. in search of yield.
The Difference in 10-Year Interest Rates In Major Economies
The current rate differentials are well above recent average
-0.5
0
0.5
1
1.5
2
2.5
3
3.5
4
12/31/2010 12/31/2011 12/31/2012 12/31/2013 12/31/2014 12/31/2015 12/31/2016
USA Germany Japan
yield Differentials
US-Japan US-Germany
Average 1.67% 0.99%
Current 2.32% 2.06%
Difference 65 bps 107 bps
14

SHENKMAN CAPITAL MANAGEMENT, INC.SHENKMAN CAPITAL MANAGEMENT, INC.
ProPrietary information - Do not DuPlicate confiDential ©2017 SHENKMAN CAPITAL MANAGEMENT, INC. ALL RIGHTS RESERvEd
Percentage Difference in Forward and Sp ot R ates
As of 3/31/2017.Source: Bloomberg. Past performance is not a guarantee of future results.
The forward to spot relationships have widened.
2.57%
1.98%2.29%
0.92%
-3.00%
-2.00%
-1.00%
0.00%
1.00%
2.00%
3.00%
4.00%
3/00 3/01 3/02 3/03 3/04 3/05 3/06 3/07 3/08 3/09 3/10 3/11 3/12 3/13 3/14 3/15 3/16 3/17
Euro/USD 12M Forward Exchange Rate Divided by Spot
Euro/GBP 12M Forward Exchange Rate Divided by Spot
15

SHENKMAN CAPITAL MANAGEMENT, INC.SHENKMAN CAPITAL MANAGEMENT, INC.
ProPrietary information - Do not DuPlicate confiDential ©2017 SHENKMAN CAPITAL MANAGEMENT, INC. ALL RIGHTS RESERvEd
Credit Cycle - LB O and CCC Global New Issuance
Subdued LBO and CCC new issuance imply we are yet to face excess risk in the current cycle.
As of 3/31/2017.Source: BofA Merrill Lynch Global Research, S&P LCD.
Face
Val
ues
(USD
$m
n eq
uiva
lent
s)
0
10,000
20,000
30,000
40,000
50,000
60,000
70,000
80,000
1985
1986
1987
1988
1989
1990
1991
1992
1993
1994
1995
1996
1997
1998
1999
2000
2001
2002
2003
2004
2005
2006
2007
2008
2009
2010
2011
2012
2013
2014
2015
2016
2017
CCC Global New Issuance
Face
Val
ues
(USD
$m
n eq
uiva
lent
s)
0
10,000
20,000
30,000
40,000
50,000
60,000
1997 1998 1999 2000 2001 2002 2003 2004 2005 2006 2007 2008 2009 2010 2011 2012 2013 2014 2015 2016 2017
LBO Global New Issuance
16

SHENKMAN CAPITAL MANAGEMENT, INC.SHENKMAN CAPITAL MANAGEMENT, INC.
ProPrietary information - Do not DuPlicate confiDential ©2017 SHENKMAN CAPITAL MANAGEMENT, INC. ALL RIGHTS RESERvEd
High
Yie
ld Is
suan
ce ($
B)
Evidence of Credit Cycle Extension
As of 3/31/2017. Source: J.P. Morgan.
Access to capital, as demonstrated by healthy levels of new issuance in both bond and loan markets, is evidence that the gears of liquidity remain well-oiled in this credit cycle.
New Issuance 2012 2013 2014 2015 2016 1Q16 1Q17
Number of New Issues 750 820 671 445 439 68 173
Total New Issue Volume ($b) $368.1 $398.5 $355.7 $293.2 $286.2 $51.2 $98.7
New Issuance 2012 2013 2014 2015 2016 1Q16 1Q17
Number of New Issues 689 1235 1015 645 745 54 410
Total New Issue Volume ($b) $300.5 $669.9 $466.9 $325.8 $485.4 $35.2 $331.0
Ban
k Lo
an Is
suan
ce ($
B)
368399
356
293 286
51
99
-
50
100
150
200
250
300
350
400
450
2012 2013 2014 2015 2016 1Q16 1Q17
301
670
467
326
485
35
331
0
100
200
300
400
500
600
700
800
2012 2013 2014 2015 2016 1Q16 1Q17
17

SHENKMAN CAPITAL MANAGEMENT, INC.SHENKMAN CAPITAL MANAGEMENT, INC.
ProPrietary information - Do not DuPlicate confiDential ©2017 SHENKMAN CAPITAL MANAGEMENT, INC. ALL RIGHTS RESERvEd
The current economic expansion is the 4th longest since World War II.
However, the rate of GDP recovery is exceptionally slow in this cycle, which may allow it to run longer than prior expansions.
How Far Does This Cycle Have To Go?
As of 3/31/2017. Quarterly update. Source: Bloomberg, The National Bureau of Economic Research. Methodology: Percentage of Current Dollar GDP growth over the duration of the economic expansion. The starting value from which % growth is derived is held constant from the first quarter of the expansion.
The economic expansion is one of the longest, but shallowest, in the post WWII era
0%
25%
50%
75%
1 4 7 10 13 16 19 22 25 28 31 34 37 40
GDP
Grow
th
Length of Expansion (in quarters)
Mar '75-Jan '80 Dec '82-July '90 Mar '91-Mar '01
Nov '01-Dec '07
Jun '09-Dec '16
0.0% 10.0% 20.0% 30.0% 40.0% 50.0%
Q2:2009Q4:2001Q1:1991
Q4: 1982Q1:1975Q4:1970Q1:1961
Total Real GDP Growth 25 quarters after recession
18

SHENKMAN CAPITAL MANAGEMENT, INC.SHENKMAN CAPITAL MANAGEMENT, INC.
ProPrietary information - Do not DuPlicate confiDential ©2017 SHENKMAN CAPITAL MANAGEMENT, INC. ALL RIGHTS RESERvEd
As of 3/31/2017.Source: Bloomberg.
The biggest surprise has been the lack of upward movement in U.S. Treasury rates in the face of higher growth and inflation expectations.
Conventional wisdom at the start of the year was to guard against U.S. Treasury rate increases and equity vola-
Conventional Wisd om = Wrong
Neither has happened...yet.
7
8
9
10
11
12
13
14
15
16
17
18
19
20
2-Ja
n
9-Ja
n
16-J
an
23-J
an
30-J
an
6-Fe
b
13-F
eb
20-F
eb
27-F
eb
6-M
ar
13-M
ar
20-M
ar
27-M
ar
VIX
(CBO
E Vo
latil
ity In
dex)
Lev
el
VIX Index
2.0%
2.1%
2.2%
2.3%
2.4%
2.5%
2.6%
2.7%
2.8%
2.9%
3.0%2-
Jan
9-Ja
n
16-J
an
23-J
an
30-J
an
6-Fe
b
13-F
eb
20-F
eb
27-F
eb
6-M
ar
13-M
ar
20-M
ar
27-M
ar
10-Y
ear U
.S. T
reas
ury Y
ield
10-Year U.S. Treasury Yield
The market’s bet on rising rates and volatility was premature, but may still pay off long term.
19

SHENKMAN CAPITAL MANAGEMENT, INC.SHENKMAN CAPITAL MANAGEMENT, INC.
ProPrietary information - Do not DuPlicate confiDential ©2017 SHENKMAN CAPITAL MANAGEMENT, INC. ALL RIGHTS RESERvEd
Convertible B onds - Asset Cl ass Characteristics
The hybrid nature of convertible bonds has historically provided investors with the following
attractive investment characteristics
• Equity like returns with less volatility
• Stable coupon income that is not highly correlated with interest rates
• Strong performance relative to other asset classes in a rising interest rate environment
• Diversification benefits versus a blended portfolio
The long-term performance characteristics of convertible bonds are highly attractive.
As of 3/31/2017. Source: Shenkman Capital.
20

SHENKMAN CAPITAL MANAGEMENT, INC.SHENKMAN CAPITAL MANAGEMENT, INC.
ProPrietary information - Do not DuPlicate confiDential ©2017 SHENKMAN CAPITAL MANAGEMENT, INC. ALL RIGHTS RESERvEd
Global Convertibles Performance in Up & D own Markets
Longest Common Period(November 1995 - March 2017)
MSCI World Positive 1-Year Periods
MSCI World Negative 1-Year Periods
Total Periods 127 69
% of Periods Global Convertible Market (VG00) Outperformed 18.11% 95.65%
Global Convertible Market (VG00) Average Return 12.12% -6.32%
MSCI World Average Return 17.34% -15.10%
Upside / Downside Capture 69.89% 41.85%
One of the ways global convertible bonds provide equity like returns with less volatility is by capturing 70% of the MSCI World’s upside and only 42% of the downside.
As of 3/31/2017. Quarterly update. Information above was calculated using trailing 12-month performance for the MSCI World Index and the VG00.Source: BofA Merrill Lynch, S&P. Past performance is not a guarantee of future results. Please see disclaimers for additional important information.
MSCI World Index vs. BofA ML Global Convertible Bond Index (VG00) - One Year Rolling Monthly
21

SHENKMAN CAPITAL MANAGEMENT, INC.SHENKMAN CAPITAL MANAGEMENT, INC.
ProPrietary information - Do not DuPlicate confiDential ©2017 SHENKMAN CAPITAL MANAGEMENT, INC. ALL RIGHTS RESERvEd
Asset Cl ass Correl ation
Over the long term, global convertible bond returns are negatively correlated with the 10-Year Treasury market.
Correlation Matrix (January 2000 - March 2017)
Global Convert.
High Yield Bonds
Investment Grade Bonds
10-Year Treasury
G7 Government
Small Cap. Equity
Large Cap. Equity
Global Convertible Bonds 1.00
High Yield Bonds 0.79 1.00
Investment Grade Bonds 0.43 0.56 1.00
10-Year Treasury -0.25 -0.17 0.59 1.00
G7 Government -0.24 -0.14 0.55 0.88 1.00
International Equity 0.88 0.70 0.28 -0.30 -0.28 1.00
Small Cap. Equity 0.81 0.65 0.16 -0.34 -0.33 0.83 1.00
Large Cap. Equity 0.83 0.65 0.20 -0.32 -0.28 0.97 0.83 1.00
As of 3/31/2017. Sources: eVestment, BofA Merrill Lynch, MSCI, S&P, Russell.Past performance is not a guarantee of future results. Please see disclaimers for additional important information. Correlation generated using data from the BofA Merrill Lynch Global 300 Convertible Index (Global Convertible Bonds), BofA Merrill Lynch U.S. High Yield Bond Index (High Yield Bonds), BofA Merrill Lynch U.S. Corporate Index (Investment Grade Bonds), BofA Merrill Lynch 10-Year Treausury Index, BofA Merrill Lynch Global Convertible Bonds G7 7-10 Year Index, MSCI World Index (International Equity), Russell 2000 Index (Small Cap. Equity), and the S&P 500 Index (Large Cap. Equity).
22

SHENKMAN CAPITAL MANAGEMENT, INC.SHENKMAN CAPITAL MANAGEMENT, INC.
ProPrietary information - Do not DuPlicate confiDential ©2017 SHENKMAN CAPITAL MANAGEMENT, INC. ALL RIGHTS RESERvEd
Diversification by R egion
Diversification by Region 12/31/2001
Diversification by Region 3/31/2017
As of 3/31/2017. Source: BofA Merrill Lynch Global 300 Convertible Index (VG00).
U.S. issuers have become a greater percentage of the global convertible market.
0% 5%0%
25%
32%
37%
africa & mideast asia
eastern europe europe
Japan north america
2%7%
0%
20%
9%63%
africa & mideast asia
eastern europe europe
Japan north america
23

SHENKMAN CAPITAL MANAGEMENT, INC.SHENKMAN CAPITAL MANAGEMENT, INC.
ProPrietary information - Do not DuPlicate confiDential ©2017 SHENKMAN CAPITAL MANAGEMENT, INC. ALL RIGHTS RESERvEd
Shenkman’s Entry Point vs . Traditional Bal anced
Shenkman’s optimum weighted average entry position captures the relative safety of the bond floor, transitioning to equity sensitivity. “Positive Leverage” is the tendency of a convertible to go up faster than it goes down.
Source: Shenkman Capital, Bloomberg, Credit Suisse, Lipper.
Traditional Balanced Convertible:
40% Investment Premium40% Conversion Premium60% Upside40% Downside1.5X Positive Leverage (estimated)
Shenkman Weighted Avg. Entry Point:
20% Investment Premium60% Conversion Premium40% Upside20% Downside2.0X Positive Leverage (estimated)
+/- Coupon +/- Coupon
Investment Distribution
Distressed Debt
Funds
Fixed Income and High-Yield Investors
Specialized Convertible Funds
Equity Investors and Convertible Arbitrage
Funds
Underlying Common Stock PriceConvertible SecurityInvestment Value
Underlying Common Stock Price“Out of the Money” “Traditional Convertible” “In the Money”
Conv
ertib
le B
ond
Valu
e
Conversion Premium
Investment Premium
24

SHENKMAN CAPITAL MANAGEMENT, INC.SHENKMAN CAPITAL MANAGEMENT, INC.
ProPrietary information - Do not DuPlicate confiDential ©2017 SHENKMAN CAPITAL MANAGEMENT, INC. ALL RIGHTS RESERvEd
Global Convertible Portfolio Characteristics
As of March 31, 2017Shenkman Capital
Global Convertible CompositeBofA Merrill Lynch Global 300
Convertible Index (VG00)
Number of Issues 128 300
Convertible Average Price $112.63 $115.12
Current Yield 1.43% 1.87%
Investment Premium 21.88% 20.42%
Conversion Premium 38.50% 55.42%
Delta 43.50 43.00
Average Issue Size $597 Million $454 Million
Average Quality BB+/Baa3 BBB3
Average C. Scope® Score 85 --
As of 3/31/2017. Source: Kynex, BAML.Source: Geneva/EPIC: Price, Ratings.
Recent issuance has been characterized by higher coupons and shorter maturities, priced closer to the bond floor. Credit quality has also been higher.
25

SHENKMAN CAPITAL MANAGEMENT, INC.SHENKMAN CAPITAL MANAGEMENT, INC.
ProPrietary information - Do not DuPlicate confiDential ©2017 SHENKMAN CAPITAL MANAGEMENT, INC. ALL RIGHTS RESERvEd
The Global High Yield Investment Opp ortunit y
The forward looking opportunity for Global High Yield investors is attractive due to:
■ Expanding global market
■ Enhanced diversification across regions, industries and issuers
■ The changing profile of European issuers
■ Greater spread volatility in Europe and the Emerging Markets
■ Different risk and return profiles across regions
■ Cross currency relative value opportunities across single credits and within
industries
We believe that a historical perspective on Global High Yield is not indicative of the current and future prospects for investors in this strategy.
As of 3/31/2017. Source: Shenkman Capital.
26

SHENKMAN CAPITAL MANAGEMENT, INC.SHENKMAN CAPITAL MANAGEMENT, INC.
ProPrietary information - Do not DuPlicate confiDential ©2017 SHENKMAN CAPITAL MANAGEMENT, INC. ALL RIGHTS RESERvEd
Opp ortunities in Developed Markets
Our global strategy is focused on developed markets, which represent 83% of the benchmark.
We believe that significant opportunities exist in global markets to enhance yields and returns over a U.S. based strategy.
Developed Markets
Market Value YTW OAS
83.63% 5.43% 389
Asia Pacific
CountryMarket Value
YTW OAS
New Zealand 0.37% 3.40% 199
Japan 0.46% 3.45% 247
Australia 0.30% 5.49% 437
total 1.13% 3.98% 282
Europe
CountryMarket Value
YTW OAS
Euro 15.11% 3.81% 335
United Kingdom 4.69% 4.50% 390
Sweden 0.30% 4.62% 415
Switzerland 0.13% 4.12% 460
Norway 0.06% 6.42% 699
Denmark 0.06% 4.53% 355
Jersey C.I. 0.02% 15.80% 1355
total 20.37% 4.00% 352
Americas
CountryMarket Value
YTW OAS
United States 58.07% 5.92% 401
Canada 4.05% 6.11% 425
Puerto Rico 0.02% 6.92% 457
Bermuda N/A N/A N/A
total 62.14% 5.93% 403
Benchmark: BofA ML Global Non-Financial HY Constrained Index
As of 3/31/2017. Source: Shenkman Capital, BofA Merrill Lynch.
27
SHENKMAN CAPITAL MANAGEMENT, INC.SHENKMAN CAPITAL MANAGEMENT, INC.
ProPrietary information - Do not DuPlicate confiDential ©2017 SHENKMAN CAPITAL MANAGEMENT, INC. ALL RIGHTS RESERvEd
0%
1%
2%
3%
4%
5%
6%
7%
8%
9%
Jan-93 Jan-96 Jan-99 Jan-02 Jan-05 Jan-08 Jan-11 Jan-14 Jan-17
10yr US Treasury Yield
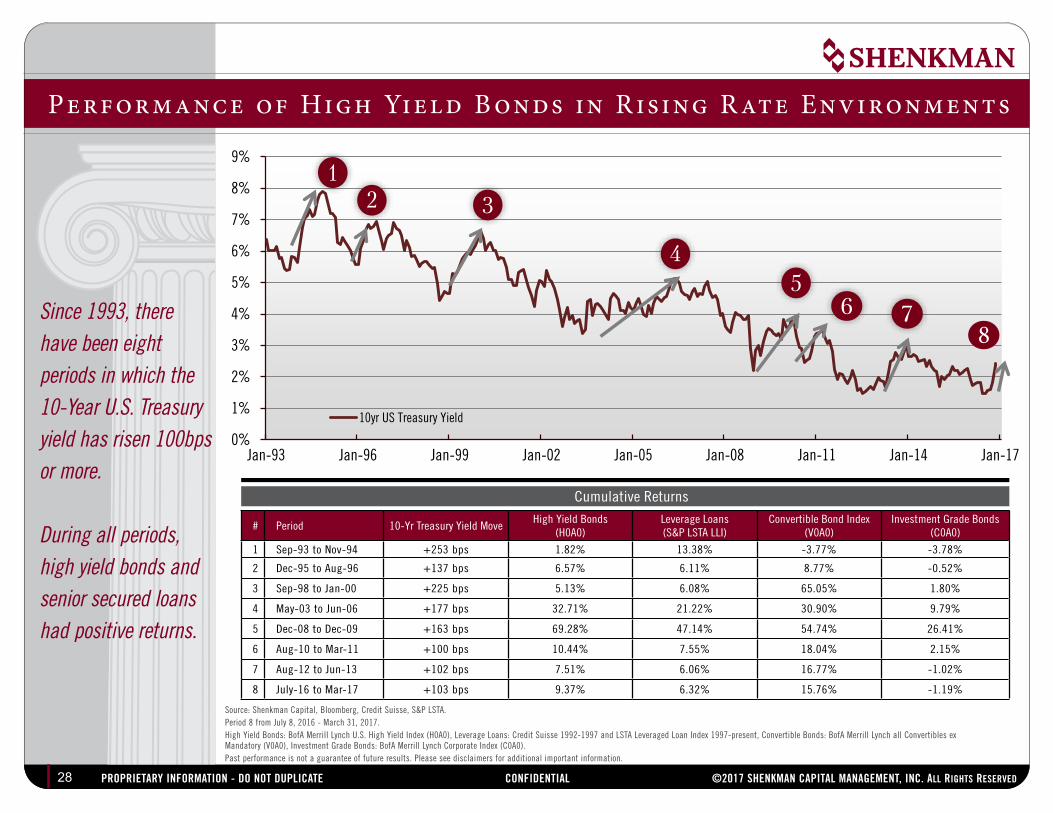
Performance of High Yield B onds in R ising R ate Environments
Source: Shenkman Capital, Bloomberg, Credit Suisse, S&P LSTA. Period 8 from July 8, 2016 - March 31, 2017. High Yield Bonds: BofA Merrill Lynch U.S. High Yield Index (H0A0), Leverage Loans: Credit Suisse 1992-1997 and LSTA Leveraged Loan Index 1997-present, Convertible Bonds: BofA Merrill Lynch all Convertibles ex Mandatory (V0A0), Investment Grade Bonds: BofA Merrill Lynch Corporate Index (C0A0). Past performance is not a guarantee of future results. Please see disclaimers for additional important information.
Cumulative Returns
# Period 10-Yr Treasury Yield MoveHigh Yield Bonds
(H0A0)Leverage Loans(S&P LSTA LLI)
Convertible Bond Index (V0A0)
Investment Grade Bonds(C0A0)
1 Sep-93 to Nov-94 +253 bps 1.82% 13.38% -3.77% -3.78%
2 Dec-95 to Aug-96 +137 bps 6.57% 6.11% 8.77% -0.52%
3 Sep-98 to Jan-00 +225 bps 5.13% 6.08% 65.05% 1.80%
4 May-03 to Jun-06 +177 bps 32.71% 21.22% 30.90% 9.79%
5 Dec-08 to Dec-09 +163 bps 69.28% 47.14% 54.74% 26.41%
6 Aug-10 to Mar-11 +100 bps 10.44% 7.55% 18.04% 2.15%
7 Aug-12 to Jun-13 +102 bps 7.51% 6.06% 16.77% -1.02%
8 July-16 to Mar-17 +103 bps 9.37% 6.32% 15.76% -1.19%
Since 1993, there have been eight periods in which the 10-Year U.S. Treasury yield has risen 100bps or more.
During all periods, high yield bonds and senior secured loans had positive returns.
8
28

SHENKMAN CAPITAL MANAGEMENT, INC.SHENKMAN CAPITAL MANAGEMENT, INC.
ProPrietary information - Do not DuPlicate confiDential ©2017 SHENKMAN CAPITAL MANAGEMENT, INC. ALL RIGHTS RESERvEd
Post Election Tightening
As of 2/28/2017.Source: BofA Merrill Lynch: Developed Markets High Yield Constrained Index (HYDC)(HYDC), U.S. High Yield Index (H0A0), European Currency High Yield Index (HP00), S&P, STOXX, Bloomberg, eVestment. Past performance is not a guarantee of future results. See Disclaimers for additional, important information.
High Yield Average Price 11/7/2016 2/28/2017 % Change LTM Avg Price
U.S. High Yield (H0A0) 98.67 101.60 3.0% 95.94
European High Yield (HP00) 102.97 104.62 1.6% 101.49
Global High Yield (HYDC) 99.62 102.23 2.6% 97.26
Equity Index Value 11/7/2016 2/21/2017 % Change LTM Avg Value
S&P 500 Index 2132 2365 11.0% 2128
STOXX 600 Index 334 373 11.8% 343
Globally leveraged debt assets have a positive correlation with equities and a negative correlation with the 10 year U.S. Treasury.
Improving high yield credit fundamentals typically outweigh the impact of rising rates in a strengthening economy.
Correlation Matrix (January 2007 - December 2016)
Global High Yield
Bloomberg Barclays Global
Agg10 Year U.S.
TreasuryBloomberg
Barclays Euro Gov
FTSE All Share MSCI EAFE S&P 500 Index
Global High Yield 1.00
Bloomberg Barclays Global Agg 0.36 1.00
10 Year U.S. Treasury -0.25 0.52 1.00
Bloomberg Barclays Euro Gov 0.37 0.86 0.24 1.00
FTSE All Share 0.77 0.39 -0.34 0.53 1.00
MSCI EAFE 0.78 0.47 -0.26 0.61 0.96 1.00
S&P 500 Index 0.73 0.29 -0.32 0.44 0.87 0.89 1.00
29

SHENKMAN CAPITAL MANAGEMENT, INC.SHENKMAN CAPITAL MANAGEMENT, INC.
ProPrietary information - Do not DuPlicate confiDential ©2017 SHENKMAN CAPITAL MANAGEMENT, INC. ALL RIGHTS RESERvEd
■ Shenkman is a pioneer in the high yield market, with a long history dating back to 1985, applying independent bottom-up fundamental credit analysis
■ The credit cycle has further to run in an expansionary, low-default environment
■ There is a greater disparity between companies and industries as the market takes its lead from fiscal rather than monetary policy
■ High yield and the equity element of convertibles are historically positively correlated to rising rates
■ Our expansion into global markets over recent years provides our investors with greater diversification and enhanced opportunities to capture yield
Conclusion
Solid credit fundamentals provide a firm foundation for high yield and convertible bonds, while potential volatility stemming from political and monetary/fiscal developments can provide opportunities.
30

SHENKMAN CAPITAL MANAGEMENT, INC.SHENKMAN CAPITAL MANAGEMENT, INC.
ProPrietary information - Do not DuPlicate confiDential ©2017 SHENKMAN CAPITAL MANAGEMENT, INC. ALL RIGHTS RESERvEd
Discl aimers
1. Shenkman and Shenkman Capital are the marketing names for Shenkman Capital Management, Inc. and Shenkman Capital Management Ltd. Shenkman Capital Management, Inc. is registered as an investment adviser with the U.S. Securities and Exchange Commission. Such registration does not imply any specific skill or training. Shenkman Capital Management Ltd is a wholly-owned subsidiary of Shenkman Capital Management, Inc. and is authorized and regulated by the U.K. Financial Conduct Authority. EEA Investors: This material is provided to you because you have been classified as a professional client in accordance with the Markets in Financial Instruments Directive (Directive 2004/39/EC) (known as “MiFID”) or as otherwise defined under applicable local regulations. If you are unsure about your classification, or believe that you may be a retail client under these rules, please contact Shenkman Capital Management Ltd and disregard this information.
2. These materials contain information obtained from third parties, including ratings from credit ratings agencies such as Standard & Poor’s. Reproduction and distribution of third party content in any form is prohibited except with the prior written permission of the related third party. Third-party information contained in this presentation was obtained from sources that Shenkman Capital considers to be reliable; however, no representation is made as to, and no responsibility, warranty or liability is accepted for, the accuracy, completeness, timeliness or availability of such information, including ratings. Neither Shenkman nor any third party content provider is responsible for any errors or omissions (negligent or otherwise), regardless of the cause, or for the results obtained from the use of such content. NEITHER SHENKMAN NOR ANY THIRD PARTY CONTENT PROVIDERS GIVE ANY EXPRESS OR IMPLIED WARRANTIES, INCLUDING, BUT NOT LIMITED TO, ANY WARRANTIES OF MERCHANTABILITY OR FITNESS FOR A PARTICULAR PURPOSE OR USE. NEITHER SHENKMAN NOR ANY THIRD PARTY CONTENT PROVIDERS SHALL BE LIABLE FOR ANY DIRECT, INDIRECT, INCIDENTAL, EXEMPLARY, COMPENSATORY, PUNITIVE, SPECIAL OR CONSEQUENTIAL DAMAGES, COSTS, EXPENSES, LEGAL FEES, OR LOSSES (INCLUDING LOST INCOME OR PROFITS AND OPPORTUNITY COSTS OR LOSSES CAUSED BY NEGLIGENCE) IN CONNECTION WITH ANY USE OF SUCH THIRD PARTY CONTENT, INCLUDING RATINGS. Credit ratings are statements of opinions and are not statements of fact or recommendations to purchase, hold or sell securities. They do not address the suitability of securities or the suitability of securities for investment purposes, and should not be relied on as investment advice.
3. The information and opinions expressed herein are for informational purposes only and do not constitute and should not be construed as investment advice, an offering of investment advisory services or an offer to sell or a solicitation to buy any securities. This material, including the information contained herein, may not be copied, republished or posted in whole or in part, without the prior written consent of Shenkman Capital. PAST PERFORMANCE IS NOT A GUARANTEE OF FUTURE RESULTS.
4. BofA Merrill Lynch Indexes: Source Merrill Lynch, Pierce, Fenner & Smith Incorporated (“BofAML”), used with permission. BofAML PERMITS USE OF THE BofAML INDICES AND RELATED DATA ON AN “AS IS” BASIS, MAKES NO WARRANTIES REGARDING SAME, DOES NOT GUARANTEE THE SUITABILITY, QUALITY, ACCURACY, TIMELINESS, AND/OR COMPLETENESS OF THE BofAML INDICES OR ANY DATA INCLUDED IN, RELATED TO, OR DERIVED THEREFROM, ASSUMES NO LIABILITY IN CONNECTION WITH THE USE OF THE FOREGOING, AND DOES NOT SPONSOR, ENDORSE, OR RECOMMEND SHENKMAN CAPITAL MANAGEMENT, INC., OR ANY OF ITS PRODUCTS OR SERVICES.
The Shenkman Capital High Yield Bond Composite has an inception date of January 1, 1986 and was created on January 1, 1993 for GIPS® purposes. The
Composite consists of comparable high yield bond accounts that employ the quadrant investment style and represents a substantial portion of the total high yield bond assets under Shenkman Capital’s management and excludes multi-sector and structured funds and accounts that are not fully discretionary. As of September 1, 2012, the Composite also excludes accounts that prohibit investments in securities rated below B3/B- by any rating agency. The Shenkman Capital Global Convertible Composite has an inception date of July 1, 2015, and consists of comparable accounts that employ Shenkman Capital’s global convertible bond investment strategy and excludes multi-sector and structured funds and accounts that are not fully discretionary.
31