discover better designs, faster. - mdx · special report 3 discover better designs, faster. ......
TRANSCRIPT

3Special report
Discover better designs, faster.Multidisciplinary simulation and design exploration in the life sciences industry.

4 Special report
STAR-CCM+: Discover better designs, faster.Improved product performance through multidisciplinary design exploration.
Don’t just simulate, innovate! Use multidisciplinary design exploration with STAR-CCM+ and HEEDS to improve the real world performance of your product and account for all of the physics that it is likely to experience during its operational life.
siemens.com/mdx

7Special report
Introduction Kristian Debus - Siemens PLM Software
Virtual abdominal aortic aneurysmDr. Simone Bartesaghi, Prof. Giorgio Colombo - Politecnico di Milano
Pharmaceutical continuous manufacturing Sabine Goodwin, Dr. Kristian Debus - Siemens PLM oftware
Matters of the heartAlain Kassab, Andres Ceballos, Ruben Osorio and Eduardo Divo - University of Central Florida, Ricardo Argueta-Morales - Arnold Palmer Hospital for Children, William DeCampli - UCF College of Medicine/Arnold Palmer Hospital for Children, Prashanth S. Shankara - Siemens PLM Software
Blood flow simulationsTitus Sgro - Siemens PLM Software
Tableting and coatingSabine A. Goodwin, Oleh Baran and Kristian Debus - Siemens PLM Software
Dental cement projectSabine A. Goodwin, Kwok-Hung (Albert) Chung and C. Wadhwani - Siemens PLM Software
Manufacturing vaccinesPhilippe B. Vincent & François Turgeon - Creaform
Damper designManilka Abeysuriya and Richard Wheatley - Pera Technology Ltd, Juanma Belda - Instituto de Biomechanica de Valencia, Antonio Reddavid - Cultraro Automazione Engineering S.r.l., Pedro Fernandez and Leopoldo Fernandez - Especiliades Medico Ortopedicas
High-tech operating roomClemens Bulitta, Franz Magerl, Reinhold Hartwich and Benjamin Russwurm - Technical University of Applied Sciences Amberg-Weiden
Contents2-3
4-7
8-11
12-17
18-21
22-25
26-30
32-37
38-41
42-45
4-7 8-1112-17
32-37
18-2122-25
26-3042-45
38-41

8 Special reportSimulation courtsey of Alister Bates, Imperial College London

9Special report
Introduction
Kristian Debus | Introduction
The Life Sciences Sector is experiencing an unprecedented change in the way new medicines and medical technologies are being developed. Increasingly, visionary companies in the sector are deploying modeling and simulation to reduce costs, mitigate risks and increase innovation. Ultimately, this results in better medicines, superior medical products and significantly improved outcomes for patients.
One big shift in recent years has been that simulation-based product development and virtual prototyping are increasingly being recognized by the FDA as valid tools to supplement experimental testing and clinical trials, and accelerate regulatory approval. Initiatives like the ASME V&V 40, MDIC, or Avicenna, drive and guide these efforts and lobby for the increased usage of simulation for the support of benchtop and clinical trials in the medical device industry. Similarly, in Pharma, the move from batch to continuous manufacturing is being promoted by consortia like CSOPS. This represents a great opportunity to
integrate the use of simulation early when redesigning processes, offering the best possible chance of maximizing ROI.
Yet, with the advancement of simulation technology, and following the buy-in and support by the regulatory bodies, the most essential ingredients — expertise and manpower — must come from the customer. The leading medical device design and pharma companies have realized that investment is critical, in terms of recruitment as well as the technology and they have started integrating simulation into clinical trial studies and are applying it to modernize their manufacturing processes. The life sciences industry is also reaching out to experienced end-users in the automotive and CPI industries to help overhaul process engineering in big pharma and integrate new design and testing modalities within medical device companies. At Siemens, we are fully committed to bringing you our best-in-class solution to help the shared vision of virtual biomed and pharma labs become reality. We
are continuously delivering state-of-the-art technologies and automated workflows to help close the gap between experiments, benchtop tests, clinical trials and engineering design. Our capabilities today allow our customers to look at very complex physics and geometries and enable an application range from medical device design all the way to pharmaceutical manufacturing processes. The articles in this Special Report cover a range of applications from medical device design to pharmaceutical manufacturing processes. We hope they will inspire you to make simulation an integral part of your design and manufacturing processes and we promise to do our part to get you there!
Kristian DebusDirectorLife Sciences
"The Life Sciences Sector is experiencing an unprecedented change..."

10 Special report
Life Sciences | Virtual abdominal aortic aneurysm
As part of his PhD research project under the supervision of Prof. Giorgio Colombo from the Department of Mechanical Engineering of the Politecnico di Milano, Simone Bartesaghi has developed a virtual automated process to aid
Abdominal Aorta Aneurysm (AAA) diagnosis and treatments. Tools such as CFD modeling and simulation are used in the workflow process, which starts with medical images (DICOM) and ends with the 3D visualization of hemodynamic risk.

11Special report
Knowledge-based virtual process to aid abdominal aortic aneurysm diagnosis
Introduction A range of diseases and a stressful lifestyle increase the vulnerability of the human body. Among such disorders, Abdominal Aneurysms (Figure 1) are a serious, often fatal, condition. These are related to the blood circulatory system at the level of the abdomen and affect 5% of men and 1% of women over the age of 65. In particular, an Abdominal Aortic Aneurysm (AAA) weakens the walls of the blood vessels, and can cause a rupture, which leads to the spilling of a large amount of blood into the abdominal cavity. In 80 to 90% of cases (pre-hospital deaths included), such a rupture is fatal, while elective repair should be considered only for any AAA with a maximal diameter of 5.5 cm (men) or 5.0 cm (women). The classical intervention on a pathological AAA is based on geometric characteristics and on the perception of pain by the patient. A physician performs the evaluation of a possible surgery after carrying out analyses on biomedical images of the abdomen obtained through scanning systems. But not always is surgery necessary, whereas in some instances the problem may be underestimated. It follows that surgeons need an index (risk indicator or risk score) to make a decision. Over the past years, a lot of novel diagnostic techniques have been developed, including computational tools such as computational fluid dynamics (CFD), embedded automation and web services. These tools, which are quantitative, objective, repeatable and ethically friendly due to their virtual, non-patient-specific nature, also have limited costs compared to the above-mentioned techniques. The use of computational tools applied to the analysis of blood flow in human arteries has
grown tremendously over the last years. Nowadays, such tools provide detailed and trustworthy information on hemodynamic quantities, enabling researchers to investigate a large number of problems which were almost impossible to tackle with traditional engineering flow measurement techniques. Furthermore, thanks to new imaging techniques, it is now possible to perform computations based on realistic geometries and under real blood flow conditions. As such, fully three-dimensional CFD models have significantly improved. Today, CFD allows studies related to local hemodynamics in the biomechanical processes of the vascular bed to be carried out quickly and accurately, and enables experts to test and validate clinical and surgical procedures more efficiently than ever before. State-of-the-art tools have been developed to perform patient-specific CFD simulations. Using these techniques, novel risk rupture indicators have been developed by using imaging methods from traditional diagnostic tools, such as the Time Average Wall Shear Stress (TAWSS)
and the Oscillatory Shear Index (OSI).
Analysis In this study, simulations were performed in order to extract rules, strategies and procedures to automate the workflow process from pre-processing to post-processing. For the pre-processing phase, a benchmark geometry was used. Figure 2 shows the workflow implemented by using knowledge-based Java scripts to automate STAR-CCM+’s mesher and solver. The Oscillatory Shear Index (OSI) was used as the risk indicator. This index is used to identify regions on the vessel wall which are subjected to highly oscillating WSS values during the cardiac cycle. OSI is defined as:
where s is the wall position and T is the cardiac cycle period.
Figure 1: CT scan with AAA; volumetric visualization. Colors are used only for visualization
Virtual abdominal aortic aneurysm | Life Sciences
Figure 2: Embedded workflow representation
Dr. Simone Bartesaghi, Prof. Giorgio ColomboPolitecnico di Milano

12 Special report
The investigation about grid generation led to the definition of a discretization strategy which is suitable to represent the physics as realistically as possible.
Figure 3: Example of grid topology. A: tetrahedral based; B: polyhedral based; C: hexahedral based.
FIGURE 4: Prism layer influence investigation
Pre-processing Different mesh topologies and grid refinements were assessed (Figure 3) using STAR-CCM+. These were based on polyhedral, non-conformal hexahedral and tetrahedral elements, all with boundary layer extrusion to accurately calculate the velocity gradient near the walls of the vessel. For the sensitivity analysis of the grid, the verification procedure proposed by Roache [1] was followed. The mesh size varied from 300,000 to roughly 1,400,000 cells. In addition, the influence of the boundary layer was taken into account by comparing the solutions obtained with various dimensions of prisms layer, as shown on Figure 4.
Solving The physics and the solver setups had to be determined in order to automate the solving process. Two different types of fluids were compared to model the behavior of the blood: (a) a simple Newtonian fluid with standard properties and (b) a non-Newtonian fluid with Power-law rheology. The influence of the time step and number of inner iterations was assessed using the same systematic approach as adopted for the mesh study.While keeping the physics and the solver parameters unchanged, different numerical schemes were tested and compared:• Solvers: segregated (S), coupled
implicit (Ci) and coupled explicit (Ce)• Pressure/velocity coupling: first-order
and second-order upwind convection schemes (pv1 and pv2 respectively)
• Temporal discretization: first-order and second-order upwind convection scheme (t1 and t2 respectively)
Figure 5 shows a comparison of OSI values computed with the different numerical schemes. In Figure 6, the time history for the benchmark model and the final average value of the velocity magnitude inside the vessel are reported.
Post-processing To visualize the numerical solution, scalar plots that show the variations of a number of parameters were drawn on the surface and inside the vessel. Furthermore, by exporting the solution-in-time, it was possible to integrate the Wall Shear Stress (WSS) components and compute the hemodynamic risk indices. Figure 7 shows a sample of post-processing images.
Conclusion This study assessed how the choice of grid, solver models and features of the fluid (blood) affects the computation of some specific parameters (such as pressure, fluid velocity, tension and stress state of the vessel) in the case of an abdominal aortic aneurysm. The investigation about grid generation led to the definition of a discretization strategy which is suitable to represent the physics as realistically as possible. Non-conformal hexahedral grids allow the representation of the phenomenon with
fewer numerical discretization errors than the other non-structural grids; as a consequence, the use of a polyhedral or tetrahedral mesh implies a more refined grid and therefore a higher number of cells, which in turn requires more computational time and resources . It is also necessary to have a good resolution of the boundary layer to compute the WSS accurately. For the solving phase, a suitable time step and number of inner iterations, numerical scheme and fluid rheology were extracted as parameters for the automation process.
Figure 5: Oscillatory Shear Index (OSI) computed using different numerical schemes
Life Sciences | Virtual abdominal aortic aneurysm

13Special report
Figure 7: Post-processing results and reporting to aid AAA diagnosis and treatments
Figure 6: Transient solution (a-b-c) and average solution for the benchmark geometry
Authors Dr. Simone Bartesaghi, Ph.D in Mechanical Engineering, Milano, Italy. Until 2012, Ph.D candidate at Politecnico di Milano, Department of Mechanics, Italy.email: [email protected]. Giorgio Colombo, Politecnico di Milano, Department of Mechanics, Italy. email: [email protected]
References:[1] Roache, P.J., “Verification and Validation in Computational Science and Engineering,” Hermosa Publishers, pp. 403-412, 1998.
Virtual abdominal aortic aneurysm | Life Sciences

14 Special report
Pharmaceuticals | Pharmaceutical continuous manufacturing
Numerical simulations for continuous manufacturing of active pharmaceutical ingredients
With unprecedented economic pressures and increased global competition, pharmaceutical manufacturing companies are continuously looking to gain a competitive advantage through improving the efficiency of their processes and the
Sabine A. Goodwin and Dr. Kristian DebusSiemens PLM Software
quality of their products. Traditional manufacturing processes, which are batch processes, are no longer sustainable and there is no question that continuous manufacturing is the clear path forward towards leaner processes. Multi-physics
numerical simulation is emerging as a game-changing technology to help continuous manufacturing for Active Pharmaceutical Ingredients (APIs) become a reality through virtual prototyping, optimization and modelling of the complete system.
15Special report
Pharmaceutical continuous manufacturing | Pharmaceuticals
4] and regulatory frameworks such as the Process Analytical Technology (PAT) and Quality by Design (QbD). Each of these encourages the development of new manufacturing technologies by building quality into the process and using a science-based quantified risk approach.
Both the chemical and food processing industries have been improving their productivity by successfully integrating continuous manufacturing into their plants. It is clear that regulatory hurdles and conservative thinking by the pharmaceutical industry can no longer be used as an excuse to avoid taking pharmaceutical manufacturing into the 21st century.
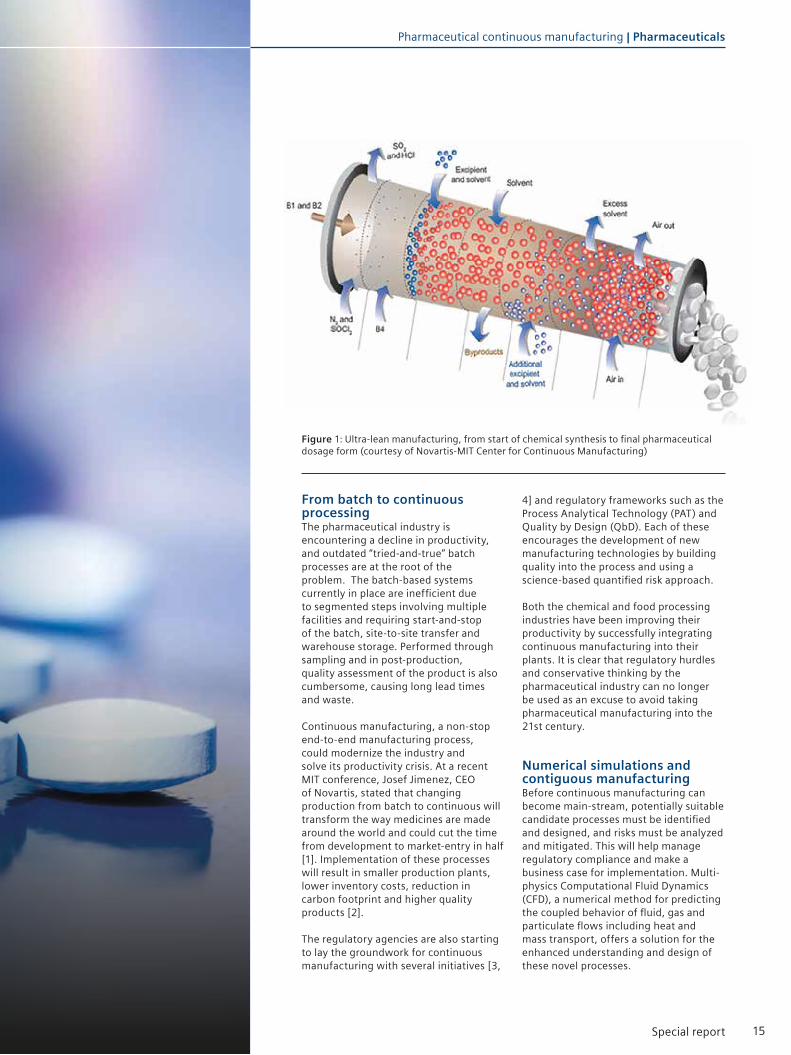
Numerical simulations and contiguous manufacturingBefore continuous manufacturing can become main-stream, potentially suitable candidate processes must be identified and designed, and risks must be analyzed and mitigated. This will help manage regulatory compliance and make a business case for implementation. Multi-physics Computational Fluid Dynamics (CFD), a numerical method for predicting the coupled behavior of fluid, gas and particulate flows including heat and mass transport, offers a solution for the enhanced understanding and design of these novel processes.
From batch to continuous processingThe pharmaceutical industry is encountering a decline in productivity, and outdated “tried-and-true” batch processes are at the root of the problem. The batch-based systems currently in place are inefficient due to segmented steps involving multiple facilities and requiring start-and-stop of the batch, site-to-site transfer and warehouse storage. Performed through sampling and in post-production, quality assessment of the product is also cumbersome, causing long lead times and waste.
Continuous manufacturing, a non-stop end-to-end manufacturing process, could modernize the industry and solve its productivity crisis. At a recent MIT conference, Josef Jimenez, CEO of Novartis, stated that changing production from batch to continuous will transform the way medicines are made around the world and could cut the time from development to market-entry in half [1]. Implementation of these processes will result in smaller production plants, lower inventory costs, reduction in carbon footprint and higher quality products [2].
The regulatory agencies are also starting to lay the groundwork for continuous manufacturing with several initiatives [3,
Figure 1: Ultra-lean manufacturing, from start of chemical synthesis to final pharmaceutical dosage form (courtesy of Novartis-MIT Center for Continuous Manufacturing)

16 Special report
multi-physics CFD can help explore new reactions and molecules for drugs manufactured with a continuous process.
Design exploration and optimization In recent years, the phenomenal increase in computing power and the maturing of robust simulation tools have paved the way for using numerical design optimization in production environments. Parameter studies and optimization will be vitally important for designing and tuning of the new (often smaller) equipment required for continuous manufacturing while ensuring that the operation can efficiently handle fast reactions and remains flexible.
In addition, the CFD-generated responses - obtained through design of experiments over a range of operating conditions and equipment design parameters - can be combined with statistical models to identify risk and implement robust real-time process control. This will ultimately result in reduced variability
and consistent, repeatable processes. Optimate™ (a module in STAR-CCM+ using Red Cedar Technology’s HEEDS software) is an example of a tool that enables intelligent design exploration to easily consider “what if” scenarios and identify the critical manufacturing points that define quality. For example, feeding devices for continuous manufacturing influence all downstream operations and design exploration of parameters such as feed rate will help identify their impact on final blend uniformity.
Simulating the systemSolving complex real-world problems demands an accurate, easy-to-use, multi-disciplinary approach to simulating complete systems. CFD-focused multi-physics engineering simulation tools such as STAR-CCM+ can accurately deliver full spectrum engineering results and the pharmaceutical industry should fully leverage these tools in support of the development of continuous manufacturing processes. Up until now,
DEM simulates the motion of a large number of interacting particles and tracks them in a numerically efficient manner, modeling contact forces and energy transfer due to collision and heat transfer between particles. DEM will be particularly important in the design and optimization of continuous coating processes to help identify the important factors for equipment design (e.g. number of spray guns) and to determine optimal equipment operation conditions (e.g. inlet temperature).
Case study one:Direct element modeling (DEM) for pill coating
Virtual prototypingTraditional manufacturing processes are based on the “design-build-test” principle in which the effects of design changes are quantified by experimental tests on physical prototypes. There are currently very few suppliers who are developing integrated systems for continuous manufacturing and, as a result, physical prototyping is anticipated to be very costly. Numerical simulations enable the engineer to build a virtual laboratory, providing insight into the performance of a product before tests are carried out. This means that the uncertainty resulting from major process and equipment changes can be evaluated up front, leading to a significant risk reduction and cost savings.
Multi-physics CFD and state-of-the-art visualization tools also offer a wealth of detailed information, not always readily available from laboratory or experimental tests. This not only results in an increased level of insight into the details of what is going on inside the processes but also enables innovation. For example,
Figures 2 and 3 show STAR-CCM+ generated solutions for two types of equipment currently used for real-world tablet coating: coating pan (rotating drum) and fluidized bed. In these simulations, DEM is used to analyze the random movement of the particles as layers of coating are applied. Parameters such as particle velocities, residence time and coating thickness are tracked to assess and improve tablet coating uniformity. In addition to tablet coating, DEM can also be used to simulate other steps in manufacturing such as filling, filtering and conveyer processes.
Figure 2: DEM simulation with STAR-CCM+ showing tablet velocity magnitude as they tumble in a coating pan
Figure 3: DEM simulation for tablet coating with STAR-CCM+ showing pill coating thickness in a fluidized bed
Pharmaceuticals | Pharmaceutical continuous manufacturing

17Special report
EMP modeling provides an effective means for studying the interacting streams and randomly dispersed phases in multiphase flows. The EMP model in STAR-CCM+ includes an extensive range of sub-models such as break-up and coalescence models for bubbles and droplets, and a granular flow model for particles. Figure 4 demonstrates an EMP simulation of a gas-liquid mixer with three rotating impellers. Shown are the effects of
Case study two:Eulerian multiphase (EMP) modeling for mixing
integration of numerical simulations in a production environment has required a great deal of specialized knowledge, but this is no longer a showstopper. Automation and ease-of-use are enabling the deployment of CFD for complex multi-physics applications.
For example, STAR-CCM+ offers state-of-the–art meshing, seamless integration with CAD and easy modeling of complex moving parts, all in a single integrated environment. The net result is more time for an engineer to analyze data instead of preparing and setting up the simulations, resulting in engineering success.
Seeing the “big picture” for continuous manufacturing will require a multi-physics approach to solving problems. Be it mixing, coating or drying, multiphase flows lie at the core of the pharmaceutical processing industry. Capabilities such as Discrete Element Modeling (DEM), a numerical method for computing the interaction of a large number of small particles, and Eulerian Multiphase Modeling (EMP), a numerical method for simulating several phases in a system, will be invaluable for implementing continuous manufacturing of APIs. The two case studies in the article nicely demonstrate these capabilities.
Conclusion In today’s competitive climate, manufacturing must become leaner with a focus on building quality into the process. Continuous manufacturing for the pharmaceutical industry will change the way drugs are made and multi-physics CFD simulations offer a cost-effective way to perform rapid prototyping for design of new equipment and processes. In particular, design optimization tools and powerful multiphase models such as DEM and EMP will play an important role, and the pharmaceutical industry should fully leverage these state-to-the-art technologies for the design and implementation of continuous manufacturing processes.
References[1] “A Defining Moment : The Future of Manufacturing in the US”, Presented at The Future of Manufacturing in the US Conference, MIT, May 8-9, 2012
[2] Plumb, K. Continuous Processing in the Pharmaceutical Industry : Changing the Mindset, Chemical Engineering Research and Design, 2005, 83, 730-738
[3] “The FDA Critical Path Initiative and its Influence on New Drug Development”, Woodcock J., Woosley, R. , Annu. Rev. Med. 2008. 59:1–12
[4] “Pharmaceutical cGMPS for the 21st century” - A Risk Based Approach (http://www.fda.gov/ohrms/dockets/ac/03/briefing/3951B1_02_Pharmaceutical%20cGMPs.
pdf)
Figure 4: Mixer model showing the effects of increasing gas injection rate using STAR-CCM+
increasing gas injection rates on gas. The ability to predict gas hold-up, a parameter that governs mass transfer across the phases and consequently rates of reaction, is a key enabler in the design of such reactors. This approach adds valuable scientific insight into the decision-making criteria to develop practical solutions for mixing and other processes in continuous manufacturing.
Pharmaceutical continuous manufacturing | Pharmaceuticals

18 Special report
Life Sciences | Matters of the heart

19Special report
Matters of the heart | Life Sciences
The simulation group at the Mechanical and Aerospace Engineering Department at the University of Central Florida has pushed the boundaries of numerical simulation to new
frontiers as they recently collaborated, under the guidance of Dr. Alain Kassab with Dr. William DeCampli of The Heart Center at Arnold Palmer Hospital for Children and
with support from the American Heart Association to better understand and to investigate potential improvements of surgical techniques for pediatric congenital heart diseases.
Alain Kassab, Andres Ceballos, Ruben Osorio, Eduardo Divo University of Central Florida
Ricardo Argueta-Morales Arnold Palmer Hospital for Children
William DeCampli UCF College of Medicine/Arnold Palmer Hospital for Children
Prashanth S. Shankara Siemens PLM Software
Matters of the heart - The role of simulation in saving lives
20 Special report
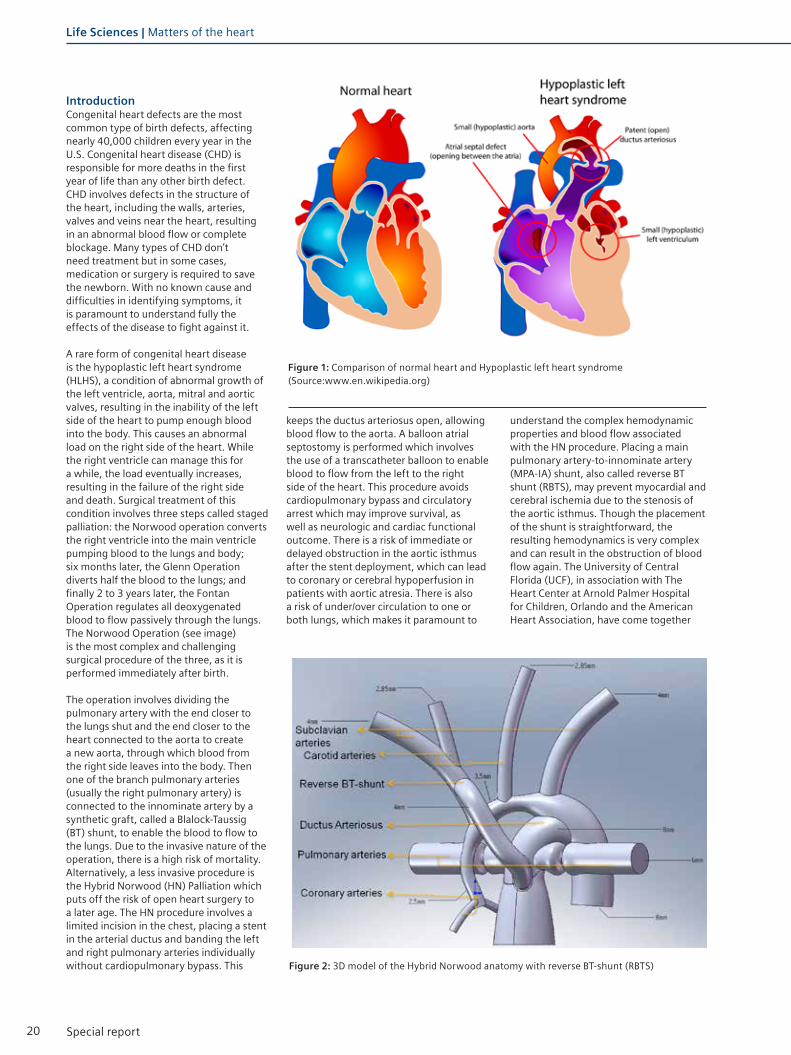
Figure 2: 3D model of the Hybrid Norwood anatomy with reverse BT-shunt (RBTS)
Introduction Congenital heart defects are the most common type of birth defects, affecting nearly 40,000 children every year in the U.S. Congenital heart disease (CHD) is responsible for more deaths in the first year of life than any other birth defect. CHD involves defects in the structure of the heart, including the walls, arteries, valves and veins near the heart, resulting in an abnormal blood flow or complete blockage. Many types of CHD don’t need treatment but in some cases, medication or surgery is required to save the newborn. With no known cause and difficulties in identifying symptoms, it is paramount to understand fully the effects of the disease to fight against it.
A rare form of congenital heart disease is the hypoplastic left heart syndrome (HLHS), a condition of abnormal growth of the left ventricle, aorta, mitral and aortic valves, resulting in the inability of the left side of the heart to pump enough blood into the body. This causes an abnormal load on the right side of the heart. While the right ventricle can manage this for a while, the load eventually increases, resulting in the failure of the right side and death. Surgical treatment of this condition involves three steps called staged palliation: the Norwood operation converts the right ventricle into the main ventricle pumping blood to the lungs and body; six months later, the Glenn Operation diverts half the blood to the lungs; and finally 2 to 3 years later, the Fontan Operation regulates all deoxygenated blood to flow passively through the lungs.The Norwood Operation (see image) is the most complex and challenging surgical procedure of the three, as it is performed immediately after birth.
The operation involves dividing the pulmonary artery with the end closer to the lungs shut and the end closer to the heart connected to the aorta to create a new aorta, through which blood from the right side leaves into the body. Then one of the branch pulmonary arteries (usually the right pulmonary artery) is connected to the innominate artery by a synthetic graft, called a Blalock-Taussig (BT) shunt, to enable the blood to flow to the lungs. Due to the invasive nature of the operation, there is a high risk of mortality. Alternatively, a less invasive procedure is the Hybrid Norwood (HN) Palliation which puts off the risk of open heart surgery to a later age. The HN procedure involves a limited incision in the chest, placing a stent in the arterial ductus and banding the left and right pulmonary arteries individually without cardiopulmonary bypass. This
keeps the ductus arteriosus open, allowing blood flow to the aorta. A balloon atrial septostomy is performed which involves the use of a transcatheter balloon to enable blood to flow from the left to the right side of the heart. This procedure avoids cardiopulmonary bypass and circulatory arrest which may improve survival, as well as neurologic and cardiac functional outcome. There is a risk of immediate or delayed obstruction in the aortic isthmus after the stent deployment, which can lead to coronary or cerebral hypoperfusion in patients with aortic atresia. There is also a risk of under/over circulation to one or both lungs, which makes it paramount to
understand the complex hemodynamic properties and blood flow associated with the HN procedure. Placing a main pulmonary artery-to-innominate artery (MPA-IA) shunt, also called reverse BT shunt (RBTS), may prevent myocardial and cerebral ischemia due to the stenosis of the aortic isthmus. Though the placement of the shunt is straightforward, the resulting hemodynamics is very complex and can result in the obstruction of blood flow again. The University of Central Florida (UCF), in association with The Heart Center at Arnold Palmer Hospital for Children, Orlando and the American Heart Association, have come together
Figure 1: Comparison of normal heart and Hypoplastic left heart syndrome (Source:www.en.wikipedia.org)
Life Sciences | Matters of the heart

21Special report
Figure 3: Anatomical CAD models (clockwise from top-left): Nominal, Nominal + RBTS, Stenosis 90%, Stenosis 90% + RBTS
grid convergence studies were run with different total volume elements to prove the mesh independence of the solution.
The 3-D flow field was obtained by numerically resolving the Navier-Stokes mass and momentum conservation equations. Blood was modeled as an incompressible, Newtonian fluid with a density of 1,060 kg/m3 and a viscosity of 0.004 Pa-s. The simulations were run as an unsteady, implicit case with a time-step of 4.62 ms to provide a time independent solution for 130 beats/min.The multi-scale approach used the LPM to tune the initial circuit and produce flow and pressure waveforms that match the targeted flow splits and pressure variations which are imposed to the CFD model. Unsteady simulations using STAR-CCM+ generated the resulting flow field and pressure waveforms and the LPM resistances were modified to match the CFD pressure waveforms’ mean value over a cycle. The new flow splits from the LPM circuit were fed to the CFD model and iterations were performed until convergence for the final solution was obtained.
Simulation throws light on the effects of RBTS placementThe resulting flow fields (see image) from the multi-scale approach for all models were analyzed in detail. The results indicate that placement of the RBTS in the stenosed configurations is an effective measure to restore flow rate and pressure values to near nominal levels, The velocity flow field showed several zones of recirculation and stagnation in the aortic arch with distal arch obstruction. The flow fields in the RBTS cases showed that these zones were eliminated, resulting in a more orderly flow. Thus, the RBTS may eliminate the risk of thrombotic arch occlusion or thromboembolism from abnormal flow. Different secondary flow structures are present throughout the cardiac cycle. Analyzing the pressure (accompanying image) on the walls showed that a high pressure in the pulmonary root may lead to pulmonary root dilation, which was seen to be alleviated in the models with RBTS. A graphical comparison of the volumetric flow rates shows the increased, orderly flow resulting from 90% RBTS flow.The nominal RBTS model was analyzed to
in an effort to understand the complex global and local hemodynamics of HN circulation. This article details the use of the modern methodology of numerical simulation to assist in understanding the effects of a reverse BT shunt and resulting anomalous flow patterns, which will help with increasing the safety of the procedure
Finding the optimal approach to the staged reconstruction of the HLHS with simulationThe goal of this collaboration was to develop a multi-scale CFD model to better understand the complex hemodynamics resulting from the hybrid Norwood variant of the first stage reconstruction of the HLHS, and in particular to investigate the effects of distal arch stenosis and reverse Blalock Taussig shunt size. A representative anatomical model of the Hybrid Norwood circulation with reverse BT shunt was simulated to understand the following:- Effects of distal arch stenosis and reverse BT shunt implantation on coronary, pulmonary and carotid blood flow;- Anomalous flow patterns, such as recirculation and impingement zones, which may lead to vessel wall remodeling and/or thrombi formation.
The multi-scale approach combined a 1-D lumped parameter model (LPM) of the peripheral circulation coupled with a localized rigid-walled 3-D CFD model (see image) of the Hybrid Norwood anatomy with RBTS. A total of six anatomical models were analyzed to fully understand the effects of different stenosis configurations in comparison to the normal procedures. The models analyzed (shown in accompanying image) were:• Two nominal models, with and
without RBTS, with ‘typical’ hypoplasia of the distal arch;
• Four stenosed models with moderate (70%) and severe (90%) reduction in lumen, with and without RBTS.
The RBTS was of 4 mm diameter in all cases. The simulation approach involved calculating the boundary conditions for the CFD model with the LPM of the circulatory system and then simulating the flow through the HN model using STAR-CCM+. The surface wrapper was used to clean up geometrical imperfections from the CAD model and the resultant surface was remeshed using the surface remesher for improved triangulation. A trimmed mesh consisting of hexahedral elements, in conjunction with prism layers to accurately capture the boundary layer was used to discretize the volume. The final mesh ranged from 1 to 1.2 million elements and
Matters of the heart | Life Sciences

22 Special report
Figure 5: Multiscale coupling of Lumped Parameter Model (LPM) and CFD model
RBTS may increase the risk of thrombosis and occlusion.
ConclusionAdvanced simulation techniques were used to better understand the complex hemodynamics during the Hybrid Norwood procedure for HLHS. Currently, in addition to CFD, a two-way coupling of STAR-CCM+ to Abaqus is being implemented to also analyze the fluid-
structure interaction (FSI) of the model. This work is an excellent example of the benefits and use of numerical simulation to better understand surgical procedures where information is minimal. Long confined to the aerospace and automotive industry, the benefits of numerical simulation are now spreading their wings to a wide variety of innovative new applications and the field of Life Sciences will greatly benefit from CAE technology.
simulate the preventative placement of a RBTS before significant distal arch obstruction develops. The resulting flow field showed that the RBTS did not change the overall hemodynamics substantially; however it led to recirculation zones in the innominate artery and part of the aortic arch as well as chaotic flow within the graft, resulting from low shear stress. Therefore, the preventative placement of a
Figure 4: Volume mesh for CFD simulation
Life Sciences | Matters of the heart

23Special report
Figure 8: Comparison of fluid flow between nominal and severe stenosis (90%) with and without RBTS. Nominal (A), Nominal + RBTS (B), Severe (C), Severe + RBTS (D)
Figure 6: Velocity vectors of flow field for peak, early, mid and late diastole for 90% Stenosis + RBTS
Figure 7: Velocity vectors of flow field for peak, early, mid and late diastole for nominal + RBTS case
This article is based on a collaborative project between the Dept. of Mechanical & Aerospace Engineering at the College of Engineering Technology of the University of Central Florida, The Heart Center at Arnold Palmer Hospital for Children in Orlando with support from a Grant in Aid (11GRNT7940011) from the American Heart Association.
Matters of the heart | Life Sciences
24 Special report
Life Sciences | Blood flow simulations
“We have a warm collaboration of research team members with a unique coincidence of expertise in management of patients with dialysis at the largest UK centre, and excellence in Computational Fluid Dynamics applied in clinically-based models of arterio-venous fistulae. Vascular access is the vital conduit between the patient and the technology of the
dialysis machine, without which many patients will not survive established renal failure. Up to half of arterio-venous fistulae do not mature to use after surgical formation as a result of a biological process in the blood vessel wall called neointimal hyperplasia. STAR-CCM+ has allowed us to obtain a better understanding of flow patterns within fistulae, and their relation
to neointimal hyperplasia. This has paved the way for clinical pilot studies to examine the configuration of arterio-venous fistulae which we hope will result in meaningful improvement in outcomes for patients.”
Dr. Neill Duncan - Renal Consultant and Clinical Lead for Dialysis, Imperial College London, Renal and Transplant Centre and Honorary Senior Lecturer
“Haemodialysis is a predominant modality for the treatment of end-stage kidney failure. It is dependent upon high-quality vascular access to the blood stream to allow effective removal and treatment of patients’ blood through a dialysis machine. The preferred method is through the use of an established native arterio-venous fistula, created by the surgical anastomosis of a patient’s own artery and vein, usually in the arm.
This technique however is hampered by the high failure rate of these fistulae given that up to 50% fail before being used for the first time. In order to improve both clinical outcomes and patient experience, we are looking at new ways to address this important medical problem. It is exciting to be part of a multi-disciplinary research group within Imperial College, working with a wide range of aeronautical engineers, bioengineers,
radiologists, nephrologists and surgeons, translating basic science and engineering concepts through to bedside patient care. Computational Fluid Dynamic simulations look to be central to our approach of understanding both why arterio-venous fistula failure occurs but also to design strategies to overcome this problem.”
Dr. Richard Corbett - Imperial College London, Renal and Transplant Centre

25Special report
Blood flow simulations bring safer and affordable hemodialysis to the masses
Blood flow simulations | Life Sciences
IntroductionChronic Kidney Disease (CKD) is an increasing public health issue affecting more than 8% of the global population. The most severe stage of CKD is End-Stage Renal Disease (ESRD) which is a total failure of the kidneys, requiring either dialysis or a kidney transplant for the patient to live. Statistics show that more than 50% of the patients suffering from ESRD do not meet the requirements for a transplant and hence depend on dialysis. An estimated two million people are currently receiving dialysis treatment worldwide. The majority of patients receiving this treatment are from five countries (US, Japan, Germany, Brazil and Italy) with a major populace of patients from the rest of the world not receiving treatment due to a lack of access to dialysis and the unaffordable cost of this expensive procedure [1].
Improved survival of patients on hemodialysis, coupled with the inability to provide enough renal transplants for the growing ESRD population, have resulted in an increase in the average time and number of patients on dialysis. When ESRD occurs, the kidneys cannot remove harmful substances from the blood. Hemodialysis removes the blood from the body and runs it through a special filter to eliminate the unwanted substances, and pumps the blood back into the body. The key requirement for hemodialysis is to draw the blood from inside the body. Access through a catheter is a short-term solution but longer-term, a connection between the arteries and the veins, known as an Arterio-Venous Fistulae (AVF) is established in the wrist or upper arm of the patients. When the AVF dilates, blood flow through it is increased substantially and this provides an access point to remove blood from the body for purification. Complications associated with vascular access and in particular the stability of AVFs is a major cause of morbidity among ESRD
patients [1]. The patency of AVF is often severely reduced by the inflammatory disease Intimal Hyperplasia (IH) and/or by thrombosis, causing unfavorable clinical outcomes, additional costs for healthcare systems and even death. AVF failures place a heavy cost burden on public-health systems, rendering such treatments expensive. These complications have established a need for a functional, durable and cost-effective vascular access. A team of researchers from Imperial College London are working towards using modern computational tools to develop novel AVF configurations with ‘favorable’ blood flow patterns, providing guidance to surgeons for dialysis treatments, and eventually making the procedure cheaper and less prone to failure due to IH. The team, consisting of researchers from Imperial College Renal and Transplant Centre, the Department of Medicine, the Department
of Bioengineering and the Department of Aeronautics are collaborating with the Academic Health Science Centre and NIHR Comprehensive Biomedical Research Centre to use Computational Fluid Dynamics (CFD) to solve this internationally relevant healthcare problem. This article gives a brief overview of the research currently being undertaken at Imperial College London towards a safer, cost-effective dialysis procedure.
Arterio-venous fistulae and their failureAVF are access points to the blood circulation for hemodialysis, created by a vascular surgeon using the patient’s native vessels. The vessels used - an artery and a vein -are joined (anastomosed) with the end of the vein attached to a 5mm hole made in the side of the artery
Figure 1: A schematic illustration of an AVF in the arm, formed by anastomosing a vein onto an artery
Prashanth S. Shankara Siemens PLM Software

26 Special report
[2]. The blood flow, diverted from the artery into the vein, causes the vein to become enlarged and thicker, allowing placement of a large-gauge needle. In fact, in response to the steep pressure gradient existing between the arterial and the vein, the blood flow rate will increase and eventually the access will be able to deliver a blood flow of 300 to 500 ml/min [3], necessary to perform dialysis. As a comparison, the normal blood flow through this area of the arm is around 50-100 ml/min.
Although AVF represents the gold standard of treatment for eligible patients, they still have a high failure rate of almost 50% [4] within the first month after their creation. Intimal Hyperplasia in the AVF occurs due to an abnormal thickening of the tunica intima of a blood vessel as a complication of the physiological remodeling process, triggered by altered flow conditions. This abnormal expansion
negatively affects the patency of the AVF and eventually leads to its obstruction [5].
Safer AVF design using STAR-CCM+In recent decades, CFD, a numerical simulation technology first developed for aerospace applications, has become a popular alternative to experiments and has been used as a design tool in the Life Sciences industry. Applications of CFD include biomedical device design, as well as numerical diagnostics and pharmaceutical manufacturing. With the use of numerical simulation, the research team at Imperial College London analyzed multiple AVF configurations to understand the impact of the geometry on the blood flow patterns and the likelihood of failure. CFD allows the study of blood flow in the vasculature and any required metrics of the flow, to be calculated based on a definition of the vascular geometry and inflow boundary conditions. Experiments are
often difficult to perform for obtaining flow patterns in AVF configurations and present various limitations in human subjects, resulting in only scant data being available. Metrics of most interest, such as Wall Shear Stress (WSS) and Oscillatory Shear Index (OSI), a measure of time variation of the direction of wall shear stress vector, are not readily available from experiments. Numerical simulation enables researchers to properly visualize such complex flow phenomena in greater detail and is non-invasive, with the ability to analyze multiple designs quickly and efficiently.
The simulation processThe process begins by obtaining a CAD model of the native arteries in the arm. Various AVF configurations are then formed on this native geometry via ‘virtual surgery’ (Figure 2). STAR-CCM+ software, is then used to simulate the blood flow through each AVF configuration. STAR-CCM+ is a single integrated package with a CAD-to-solution approach and optimization capabilities enabling the user to effectively analyze multiple design variants and optimize for best design. The AVF configurations were discretized using the automated polyhedral cell meshing technology of STAR-CCM+ with approximately 10 million polyhedral cells for each design. A close-up view of a volume mesh with prismatic layers at the wall is seen in figure 3. Automated prism layer generation on the walls was used to resolve the boundary layer flow at the wall of the vein, artery and AVF. The computational mesh was properly refined near the connection to capture the fine scale flow features. Incompressible Navier-Stokes equations were solved in the entire domain with
“STAR-CCM+ has played a critical role in our research – allowing us to better understand flow physics within AVF, and helping us work towards improving their design and function. The highly cross-disciplinary research ethos at Imperial, combined with its world-leading clinical centres, provides the perfect environment in which to conduct this type of research.”Dr. Peter Vincent - Lecturer in Aerodynamics, Department of Aeronautics, Imperial College London
Life Sciences | Blood flow simulations
Figure 3: View of the volume mesh at the AVFFigure 2: CAD model of AVF configuration formed in the arm via ‘virtual surgery’

27Special report
References[1] Feldman, H., Kobrin, S., Wasserstein, A. (1996): Hemodialysis vascular
access morbidity, J. Am. Soc. Nephrol., 523–535, 1996.
[2] Loth, F., Fischer, P. F., & Bassiouny, H. S.: Blood Flow in End-to-Side
Anastomoses, Annual Review of Fluid Mechanics, 40(1), 367–393, 2008.
[3] Sivansesan, S., How, T.V., Black, R., Bakran, A.: Flow patterns in the radiocephalic
arteriovenous fistula: an in vitro study, Journal of Biomechanics, 32(9), 915–925, 1999.
[4] Huijbregts, H. J. T., Bots, M. L., Wittens, C. H. a, Schrama, Y. C., Moll, F. L., Blankestijn, P.
J.: Hemodialysis arteriovenous fistula patency revisited: results of a prospective, multicenter
initiative, Clinical journal of the American Society of Nephrology: CJASN, 3(3), 714–9, 2008.
[5] Sivansesan S, How T.V., Bakran A.: Sites of stenosis in AV fistulae for
haemodialysis, Nephrol Dial Transplant 14: 118–120, 1999.
All images courtesy of Imperial College London.
the blood being modeled as a Newtonian fluid with constant viscosity. The inflow conditions for blood flow into the artery were considered to be non-pulsatile in the initial stage with further simulations incorporating transient pulsatile flow as the boundary condition. The walls of the vessel were considered as rigid, no-slip walls.
Expected value of simulation Figure 4 shows the contours of a passive scalar advected with the blood flow on planar sections at constant intervals along the artery, vein and the AVF connection for one of the designs. The concentration of the passive scalar gives a visual indication of how the blood is mixed in the AVF. The results from the simulation enable a qualitative assessment of the blood flow patterns. The non-physiological hemodynamics in this region causes WSS to fluctuate greatly. This behavior could result in the failure of the AVF due to inflammation.
The passive scalar concentration along a centerline plane in the AVF is seen in figure 5, showing uneven mixing of the blood at the junction of the AVF. Figure 6 shows streamlines of the blood flow through the connection. Such results from STAR-CCM+ enabled the research team to clearly identify areas of recirculation, swirl, high vorticity, high velocity and high/low wall shear stress in the fistula area. The hemodynamic parameters can also be studied individually upstream and downstream of the fistula to identify problem areas.
ConclusionThe team of researchers from Imperial College London is undertaking numerical simulations to improve clinical outcomes for dialysis patients and reduce the financial burden for healthcare providers, by developing better designs to decrease the failure rates of AVF. Reduced rates of AVF failure will lead to improved patient experience, survival rate and cost-utility, making dialysis potentially affordable for lower-income populations. It is hoped that results from the study will also help solve a range of other long-standing healthcare problems, such as failure of vascular stents, arterial bypass grafts and organ transplants, due to IH. The ultimate objective of the research team is to provide guidance to the surgeons on the configuration of AVF for healthy flow patterns and reduced potential for failure. This serves as an excellent example of the far-reaching impact of numerical simulation into our daily life, helping save lives with the same ease as which it helps to build products.
Figure 4: Concentration of a passive scalar, advected with blood flow, on different plane sections along the artery, vein and AVF
Figure 5: Concentration of a passive scalar, advected with blood flow, on a centerline plane section in the AVF
Figure 6: Streamlines showing flow features inside the AVF
The Research Team
Dr. Peter VincentDepartment of Aeronautics, Imperial College London - CFD Lead
Prof. Colin CaroDepartment of Bioengineering, Imperial College London - Bioengineering Lead
Dr. Neill DuncanImperial College London, Renal and Transplant Centre, Hammersmith Hospital - Clinical Lead
Miss Lorenza GrechyDepartment of Aeronautics, Imperial College London - CFD
Mr. Francesco LoriDepartment of Bioengineering, Imperial College London - CFD
Dr. Richard CorbettImperial College London, Renal and Transplant Centre, Hammersmith Hospital - Clinical
Prof. Wladyslaw GedroycSt Mary’s Hospital - Clinical
Jeremy Crane Imperial College London, Renal and Transplant Centre, Hammersmith Hospital - Surgical Lead
Dr. Marc ReaImperial College NHS Healthcare Trust - Clinical
Blood flow simulations | Life Sciences
This article is part of a two-series spotlight on the Life Sciences research being conducted at Imperial College London on dialysis treatment. The next edition of Dynamics will feature a follow-up article delving into the details of the research findings.
28 Special report
Life Sciences | Tableting and coating

29Special report
Numerical simulations for tableting and coating
Tableting and coating | Life Sciences
Solid dose tablet manufacturing processes often lack reliability and robustness as a result of errors in production and a shortfall in process control. Facing unprecedented economic pressures, pharmaceutical manufacturing companies are continuously looking to improve on the quality of their products and the productivity of their processes. Multi-physics numerical simulation is emerging as a game-changing technology to help step up efficiency, enhance quality, and shorten time-to-market through virtual prototyping and optimization.
Challenges of solid dose tablet manufacturingTableting (compression from a powder into a solid dose tablet) and tablet coating are two vitally important steps in the tablet manufacturing process that ultimately determine the weight, thickness, density, hardness and coating of the final solid dosage form. Variability in any of these attributes not only negatively impacts the release profile and therapeutic efficacy of the medicine, it alters the disintegration and dissolution properties of the tablet, leads to tablet defects and causes breakage during bulk packaging and transport. With the adoption of novel manufacturing processes such as non-stop end-to-end processing, and the push to build quality and efficiency into production, solid dose tablet manufacturers have a challenging road ahead of them because they must pinpoint the key factors and requirements that will lead to robust and repeatable processes, resulting in superior products.
Why numerical simulations?Multi-physics Computational Fluid Dynamics (CFD) is a numerical method for predicting the coupled behavior of fluid, gas and particulate flows including heat and mass transport. A significant advantage of using numerical
simulations is that it allows for the validation of a design or process before physical tests need to be carried out. For example, the development of a new tablet shape or coating material calls for performing an extensive number of costly and time-consuming experiments to avoid unexpected variations, identify unpredictable process parameters and address scale-up problems. Studying these effects through numerical simulations can greatly reduce time, material and development costs. In addition, numerical visualization tools offer a wealth of detailed information, not always readily available from experimental tests. This not only results in an increased level of insight into the details of what is going on inside the processes, it enables innovation.
STAR-CCM+ provides the solutionsWith its automated polyhedral meshing technology and comprehensive range of physics models, STAR-CCM+ is a complete multi-disciplinary simulation toolkit to tackle a wide range of applications in the pharmaceutical industry. One capability in STAR-CCM+ that is particularly well-suited for the
simulation of tablet manufacturing processes is Discrete Element Modeling (DEM), fully coupled with numerical flow simulations and delivered in a single software environment.
Tableting and coating involve a large number of discrete particles that interact with each other and the fluids surrounding them. DEM accurately tracks these interactions and models contact forces and energy transfer due to collision and heat transfer between particles and fluids. The DEM capability in STAR-CCM+ can predict dense particle flows with
One capability that is particularly well-suited for the simulation of tablet manufacturing processes is DEM, fully coupled with numerical flow simulations and delivered in a single software environment.
Figure 1: STAR-CCM+ simulation with DEM showing a pharmaceutical powder packed and compressed inside a tablet die. Variations in color reflect the non-uniformity of the granule distribution.
Sabine A. Goodwin, Oleh Baran and Kristian DebusSiemens PLM Software

30 Special report
DEM simulations with particle-fluid interactions provide realistic solutions to assess the uniformity of film coating thickness, a critical parameter for tablet quality.
Life Sciences | Tableting and coating
more than one million particles in a reasonable time, making it practical for analyzing real-world tablet manufacturing processes such as filling, compressing/compacting, coating and drying.
Figure 1 shows the results obtained from a STAR-CCM+ simulation of pre-compression in a tablet press to determine how to overcome common tablet defects such as capping (splitting of the tablet’s upper cap) that often occur as a result of entrapment of air and migration of fine particles during the compression process. DEM is used to track the interaction of the particles with each other and with the die as they are re-arranged and move into the empty spaces during pre-compression. This simulation offers a detailed look at the uniformity of the granule distribution and can help determine the optimal pre-compression force and dwell time required to ensure that fine particles will be locked in place before compression starts, greatly reducing the risk of incurring common tablet defects during production.
DEM simulations with particle-fluid interactions also provide realistic solutions to assess the uniformity of film coating thickness, a critical parameter for tablet quality. Figure 2 depicts a simulation performed with STAR-CCM+ for the coating process in a fluidized bed where DEM is used to analyze the random movement of particles as their trajectories change while layers of coating are applied. Parameters such as particle velocities, residence time and coating thickness are monitored during the simulation. These can be fed as objective functions into Optimate, a module in STAR-CCM+ that enables intelligent design, to help identify the important factors for equipment design (e.g. nozzle spacing) and to determine optimal equipment operating conditions.
Figure 2: STAR-CCM+ simulation of the coating process performed in a fluidized bed

31Special report
STAR-CCM+ also has a novel Lagrangian passive scalar capability, enabling the user to easily monitor the coating thickness and other features of tablets. Figure 3 illustrates a case where 70,000+ tablets are tumbled in an industrial coater. The goal of the study is to improve on inter-particle coating uniformity by determining optimal spraying equipment settings in the tumbler. Two Lagrangian passive scalars representing coating thickness are defined: one with source volume confined to one cone above the surface, another with source volume confined to two cones and with an effective spray area identical to the one of the first passive scalar. Using this approach, a single simulation allows for a comparison of the inter-particle coating uniformity for two different spray zones and the result indicates that the two-spray configuration provides a more uniform coating distribution.
ConclusionIn today’s competitive climate, manufacturing of solid dose tablets must have a focus on building quality and efficiency into processes, and multi-physics CFD simulations offer a cost-effective way to achieve this through rapid prototyping and optimization. The complex flow-fields associated with tableting and coating can be addressed with ease by using the high-end physics models delivered by STAR-CCM+, including the powerful DEM and novel passive scalar capabilities. Users in the pharmaceutical industry are fully leveraging these state-of-the art technologies as it opens the door to explore innovative ways to improve quality, reduce cost and shorten time-to-market.
In today’s competitive climate, manufacturing of solid dose tablets must have a focus on building quality and efficiency into the processes. This can be accomplished through rapid prototyping and optimization using multi-physics simulation.
Figure 3: Simulation with STAR-CCM+ comparing coating thickness variation of one and two sprays in a tumbler
Tableting and coating | Life Sciences

32 Special report
Life Sciences | Dental cement project
Global Academic Program – More Than Just Licenses!
Recognizing the importance of supporting the global academic engineering community, Siemens provides students and academic institutions the opportunity to take advantage of its Global Academic Program. Our "More Than Just Licenses!" philosophy is dedicated to ensuring students, professors and graduates have access to the latest info, training and support to guarantee success in academia and beyond. Thousands of academics in hundreds of academic institutions all around the world have implemented STAR-CCM+® into their undergraduate, graduate and postgraduate curriculum and / or research teams.
The Siemens Global Academic Program has produced hundreds of new engineers with STAR-CCM+® experience ready to join your team. Contact your local sales representative today to find out how you can put the Siemens
Academic Program to work for you!

33Special report
Something to smile about: Using simulation to improve dental implants!
Dental cement project | Life Sciences
Sabine A. Goodwin Siemens PLM Software
Kwok-Hung (Albert) Chung and Chandur WadhwaniSiemens PLM Software
IntroductionCements are commonly used in dentistry, but there is very little knowledge of how their flow patterns influence the performance of dental systems. One area in dentistry where shape optimization should be considered is cementing of implant restorations. It has been shown that extrusion of excess cement at the crown-abutment margin during the seating of a cement-retained crown over an implant is a major cause of peri-implant disease [1-4]. Recent advances in simulation are now enabling an increased level of insight into the details of the cement flow in these complex systems, opening the door for addressing the potential health issues associated with them and developing innovative implant designs.
Systems control solutionThe cements used in dentistry are non-Newtonian and shear-thinning in nature [5]. This means that as more stress is applied, the cement starts to flow more readily. The stress in the system and therefore the implant shape is expected to significantly influence the flow patterns of cement including the volume of extrusion of cement into the surrounding tissue and the magnitude of extrusion forces. These parameters have a significant impact on the surrounding periodontal tissue [3, 4] and may lead to long term peri-implant disease, a destructive inflammatory condition affecting the gums. The problem of peri-implant disease as it relates to cement extrusion must be addressed
Figure 1: Parameterized model of implant abutment and crown
from a “systems control” solution. Understanding cement flow patterns, appropriate placement sites and controlling volumes are all critical for finding ways to address the ongoing health issues associated with cement-retained implant restorations. Crude models have been used to gain some understanding of cement flow, including using clear plastic beakers to visualize the behavior and studying implant abutments with cast crowns. Using
a “design-build-test” principle in which the effects of design changes are quantified by experimental tests on physical prototypes is often costly and time-consuming [5, 6]. Simulation, on the other hand, opens the door for virtual prototyping and the dental industry is now beginning to better understand their complex systems by taking advantage of the benefits numerical simulation has to offer. This is destined to result in a paradigm shift within the dental field.
Numerical approachSTAR-CCM+® was used to perform numerical simulations on the complete implant abutment, cement and crown system.
Realistic implant abutment and crown forms from scanned stereo lithographic (STL) files provided data points for parameterization of the implant shape (figure 1) and a polyhedral mesh was developed utilizing the overset meshing technology available in STAR-CCM+ to simulate the relative motion of the crown as it travels over the implant. The Volume of Fluid (VOF) multiphase model was used to simulate the flow of cement in the system as it is particularly well-suited for immiscible fluids (like cement and air) and it enables capturing the position and shape of the interface between the dental cement and surrounding air as the crown is seated. RelyXTM cement (3M ESPE) was chosen for this study and its non-Newtonian properties were simulated using the

34 Special report
Herschel-Bulkley model for non-Newtonian fluids in STAR-CCM+.
Figure 2 depicts a cross-sectional cut through the overset mesh, showing volume fraction of cement at the start of the simulation, with red representing 100% cement and blue representing 100% air. In this case, 35mm3 of cement was loaded near the crown margin, in a ½ toroid shape [7].
Observations in the labRecently, Wadhwani et al [6] have studied how implant abutments can be modified to control cement flow patterns and minimize cement extrusion. The in vitro study was performed on three types of abutments shown in figure 3 (top row):• A Closed Abutment (CA), with the screw
access channel sealed off.• An Open Abutment (OA) with the screw
access channel left open. • An Internal Vent Abutment (IVA) with
two additional round vents placed in the axial walls of the OA, 180º apart.
Figure 4 shows how much cement was
retained in each system in the lab, clearly indicating that the amount of excess cement extruded at the crown-abutment margin was greatest for the CA, followed by the OA and the IVA. The photographs in figure 3 (bottom) also reveal that there is a better infill of the screw access channel with the IVA abutment as compared to the OA abutment.
Simulate the system with STAR-CCM+Numerical simulations enable the engineer to build a virtual laboratory, providing insight into a product’s performance before tests need to be carried out. State-of-the-art visualization tools available in STAR-CCM+® offer a wealth of detailed information not readily available from laboratory tests or from observations in the dentist’s chair, including visualizing the flow of cement in the system (figure 5). Using STAR-CCM+, the effects on the cement flow patterns were studied by varying four variables in the system:1. Implant abutment design,2. Cement application site,
3. Speed of crown seating and4. Amount of cement in the system.
Implant Abutment DesignFirst, the three types of abutments were analyzed and simulation results were compared to the findings from the experimental study [6]. This served as a validation of the numerical methods used. Figure 6 shows the geometry of the three models (CA, OA, IVA) in STAR-CCM+.
Figure 7 depicts the solutions obtained with STAR-CCM+ for each of the abutment modifications, showing the volume fraction of cement at the starting and ending positions for each of the systems. In this simulation, the cement was loaded in the shape of a ½ toroid near the margin of the crown and the crown traveled at a speed of 7 mm/sec. The amount of cement in the system was identical for each of the three abutment modifications shown (~35 mm3).Numerical simulations for each of these geometries showed realistic cement flows and predicted the trends observed in previous studies. As observed in the
Figure 2: Mesh and cement loading for simulations with STAR-CCM+
Figure 3: Abutment modifications (top) and effects of modifications on cement retention (bottom)
Figure 4: Experimental data showing amount of cement retained in each system during laboratory experiments (CA, OA, IVA)
Life Sciences | Dental cement project
35Special report
lab, the simulations predicted that the amount of excess cement extruded from the system is significantly larger with the CA system as compared to the OA or IVA system. The IVA is observed to be the best performer, with almost no cement entering into the surrounding environment. The simulations also support the observation that there is a better infill of the screw access channel with the IVA system compared to the OA system.
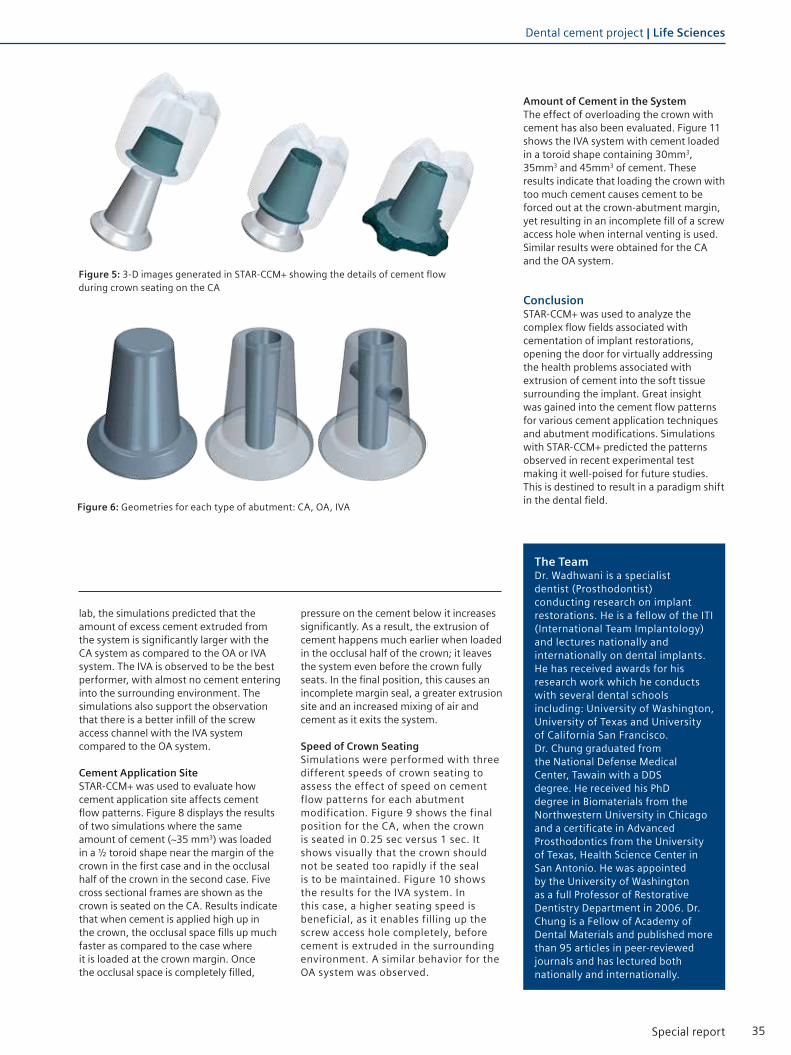
Cement Application SiteSTAR-CCM+ was used to evaluate how cement application site affects cement flow patterns. Figure 8 displays the results of two simulations where the same amount of cement (~35 mm3) was loaded in a ½ toroid shape near the margin of the crown in the first case and in the occlusal half of the crown in the second case. Five cross sectional frames are shown as the crown is seated on the CA. Results indicate that when cement is applied high up in the crown, the occlusal space fills up much faster as compared to the case where it is loaded at the crown margin. Once the occlusal space is completely filled,
Figure 5: 3-D images generated in STAR-CCM+ showing the details of cement flow during crown seating on the CA
Figure 6: Geometries for each type of abutment: CA, OA, IVA
pressure on the cement below it increases significantly. As a result, the extrusion of cement happens much earlier when loaded in the occlusal half of the crown; it leaves the system even before the crown fully seats. In the final position, this causes an incomplete margin seal, a greater extrusion site and an increased mixing of air and cement as it exits the system.
Speed of Crown SeatingSimulations were performed with three different speeds of crown seating to assess the effect of speed on cement flow patterns for each abutment modification. Figure 9 shows the final position for the CA, when the crown is seated in 0.25 sec versus 1 sec. It shows visually that the crown should not be seated too rapidly if the seal is to be maintained. Figure 10 shows the results for the IVA system. In this case, a higher seating speed is beneficial, as it enables filling up the screw access hole completely, before cement is extruded in the surrounding environment. A similar behavior for the OA system was observed.
Amount of Cement in the SystemThe effect of overloading the crown with cement has also been evaluated. Figure 11 shows the IVA system with cement loaded in a toroid shape containing 30mm3, 35mm3 and 45mm3 of cement. These results indicate that loading the crown with too much cement causes cement to be forced out at the crown-abutment margin, yet resulting in an incomplete fill of a screw access hole when internal venting is used. Similar results were obtained for the CA and the OA system.
ConclusionSTAR-CCM+ was used to analyze the complex flow fields associated with cementation of implant restorations, opening the door for virtually addressing the health problems associated with extrusion of cement into the soft tissue surrounding the implant. Great insight was gained into the cement flow patterns for various cement application techniques and abutment modifications. Simulations with STAR-CCM+ predicted the patterns observed in recent experimental test making it well-poised for future studies. This is destined to result in a paradigm shift in the dental field.
The Team Dr. Wadhwani is a specialist dentist (Prosthodontist) conducting research on implant restorations. He is a fellow of the ITI (International Team Implantology) and lectures nationally and internationally on dental implants. He has received awards for his research work which he conducts with several dental schools including: University of Washington, University of Texas and University of California San Francisco. Dr. Chung graduated from the National Defense Medical Center, Tawain with a DDS degree. He received his PhD degree in Biomaterials from the Northwestern University in Chicago and a certificate in Advanced Prosthodontics from the University of Texas, Health Science Center in San Antonio. He was appointed by the University of Washington as a full Professor of Restorative Dentistry Department in 2006. Dr. Chung is a Fellow of Academy of Dental Materials and published more than 95 articles in peer-reviewed journals and has lectured both nationally and internationally.
Dental cement project | Life Sciences

36 Special report
References[1] Pauletto, N.; Lahiffe, B.J.; Walton, J.N.: Complications associated with excess
cement around crowns on osseointegrated implants: A clinical report. Int. J.
Oral Maxillofac Implants 1999; 14: 865-868.
[2] Gapski, R.; Neugeboren, N.; Pomerantz, A.Z.: Reissner M.W.: Endosseous
implant failure influenced by crown cementation: A clinical case report. Int. J. Oral
Maxillofac Implants 2008; 23: 943-946.
[3] Wilson, T.G.: The positive relationship between residual excess cement and
peri-implant disease: prospective clinical endoscopic study. J. Periodont 2009;
80: 1388-1392.
[4] Wadhwani, C.; Rapoport, D.; La Rosa, S.; Hess, T.; Kretschmar, S.:
Radiographic detection and characteristic patterns of residual excess cement
associated with cement-retained implant restorations: A clinical report. J.
Prosthet Dent. 2012 Mar; 107(3): 151-157.
[5] Wadhwani, C.; Chung, KH.: The role of cements in dental implant success,
Part 2. Dent. Today, 2013 Jun; 32(6): 46, 48-51.
[6] Wadhwani. C.; Piñeyro, A.; Hess, T.; Zhang, H.; Chung, K.H.: Effect of
implant abutment modification on the extrusion of excess cement at the
crown-abutment margin for cement-retained implant restoration. Int. J. Oral
Maxillofacial Implants 2011; 26: 1241-1246.
[7] Wadhwani, C.; Hess, T.; Piñeyro, A.; Opler, R.; Chung, K.H.: Cement
application techniques in luting implant-supported crowns: A quantitative and
qualitative survey. Int. J. Oral Maxillofac Implants. 2012; 27(4): 859-864.
Figure 7: Simulations with STAR-CCM+ showing volume fraction of cement in CA, OA and IVA systems
Figure 8: Cross sectional frames showing cement flow for two types of cement loading: near the margin of the crown and near the occlusal surface of the crown
Figure 9: Effect of speed of seating on cement flow in the CA system Figure 10: Effect of speed of seating on cement flow in the IVA system
Figure 11: Effect of amount of cement for the IVA system
“Dentistry as a profession is centuries old and is a combination of art and science. Dental implants require a higher science-based knowledge to be successful. STAR-CCM+ is an effective simulation tool that can be used to predict behavior thus evaluating dental systems like never before. The possibilities are endless!”
Dr. Chandur WadhwaniUniversity of Washington
Life Sciences | Dental cement project
37Special report
STAR-CCM+: Discover better designs, faster.Medical device design: Digital twins for simulation from benchtop to clinical trials.
siemens.com/mdx

38 Special report
Figure 1: Vaccine filling cleanroom
Pharmaceuticals | Manufacturing vaccines

39Special report
When CFD secures the manufacturing process of vaccinesPhilippe B. Vincent and François TurgeonCreaform
Creaform was asked to assist in the design of a cleanroom, by performing a complete 3D reconstruction of the geometry of the room, and using this to carry out detailed CFD simulations. The cleanroom in question is used in the manufacturing of influenza vaccine, and the aim of the study was to design an efficient aerodynamic barrier that would mitigate the risk of contamination. The demonstration was convincing and CFD simulations shed light on phenomena that traditional smoke tests, still used for regulatory compliance of pharmaceutical environments, had never been able to resolve before.
IntroductionThe pharmaceutical cleanroom in this study is a critical environment requiring a high level of protection against contamination. While the cleanroom itself is a grade B environment, the interior of the RABS (Restricted Access Barriers) is protected with screened barriers and HEPA (High-Efficiency Particulate Air) clean-air filtration, such that it is rated as a grade A critical zone. The vaccine filling machine had to be incorporated in the RABS, leading to many specific flow interactions which could not be predicted prior to installation, neither by the manufacturer nor the integrator.
The RABS provide vaccine protection against contamination using a physical and aerodynamic barrier. The extent of separation between the process and the contamination sources, like people, determines the grade level of the protected zone. Grade B environment is already a decent class of cleanroom, and further zoning with restricted access barriers, like the glass doors with gloved access, defines a grade A critical zone.
Bringing Vaccine Manufacturing Validation to the Next Level using CFD: Creaform Upgrades the Regulatory Compliance Process of Pharmaceutical Environments
Manufacturing vaccines | Pharmaceuticals

40 Special report
It was therefore necessary to thoroughly understand the fluid flow behavior in order to ensure proper flow path around non-sterile components of the machine. Not only was the regulatory compliance of the cleanroom at stake, but with the amazing production rate of the line (hundreds of vial fillings per minute), a contamination would represent a considerable financial loss because it leads to the waste of vaccine doses.
In that context, Creaform’s 3D modeling and Computational Fluid Dynamics (CFD) solutions came in very handy. Using basic STL files such as the ones created by 3D scanners, the engineering team numerically reproduced the cleanroom in Computer Aided Design (CAD) software and performed a series of CFD simulations using STAR-CCM+®.
The stakeholdersCreaformCreaform’s mission is to develop, manufacture and market cutting edge portable 3D measurement and analysis technologies that increase productivity. Through its expertise and the passion and commitment of its employees, Creaform helps companies from the manufacturing industry to seamlessly create, simulate,
verify and collaborate in 3D, significantly enhancing their turnaround times and profitability. Through its 3D Engineering Services department, Creaform develops CFD simulation techniques in multiple fields like transport, energy, environment, civil works, electronics and HVAC. For the project discussed here, Creaform was responsible for the CAD reproduction of the entire pharmaceutical production line and surrounding cleanroom, the CFD simulation of the air flow with RABS and HVAC systems in operation, and the assessment of aerodynamic deflectors to optimize flow behavior around non-sterile components.
Laporte Consultants Inc. Laporte is a consulting firm specialized in bio-pharmaceutical, food & beverage and industrial engineering. Its employees have experience in a wide array of services in the process, building and infrastructure, automation, packaging and regulatory compliance fields. In the context of this project, Laporte was in charge of the process design, installation and commissioning for the pharmaceutical facility upgrade. These tasks include the HVAC design and the integration of the filling machine in the RABS system. Laporte was also responsible for the preliminary smoke tests used for regulatory compliance.
Computational GeometryA typical headache when carrying out a CFD analysis is not having the geometry available. An even bigger headache is not having confidence in the numerical geometry because the as-built drawings are incomplete or the geometry has changed over time. This situation brings the engineers to constantly question the CFD results. Creaform, by supplying efficient 3D scanning solutions, ensures high quality numerical reproduction. Creaform also manufactures fast, portable and easy to use scanners that provide metrology-grade accuracy and resolution. For CFD applications in the HVAC industry, it is quite common for Creaform’s engineers to combine the scan of an entire room acquired by a mid-range scanner with the precise scan of specific parts using one of Creaform’s handheld scanners (see figure 2). The result is a clean STL file such as the one built for the pharmaceutical cleanroom.
The numerical geometry of the cleanroom includes the walls and furniture, the HEPA filtration, the HVAC system, the physical barrier with gloved access (windows surrounding the production line), the control panels as well as the RABS itself with the accumulation table for vials, the conveyor, the filling needles, the capping machine and many measurement
Figure 2: Room scan using Creaform's handheld MetraSCAN
Pharmaceuticals | Manufacturing vaccines

41Special report
instruments, all of which were accounted for in the CFD simulations thanks to the wrapping capabilities of STAR-CCM+.
SimulationsPrecise and representative boundary conditions are critical for the cleanroom simulation. They were carefully determined using very recent data acquisition:• Laminar flow equipment performance
evaluation providing air velocity profiles for each diffuser of the HEPA filtration system;
• Ventilation balancing measurements for the HVAC system including return ducts;
• Precise pressure gaging in adjacent rooms for secondary air flow rates through wall openings for conveyor and through the door contour.
Turbulence modeling was achieved with the RANS approach and more specifically with the SST (Menter) k-omega model, thus limiting the results to steady state. The All y+ Wall Treatment was used because many near wall cells fell within the buffer region of the boundary layer. The control over the entire surfaces to force viscous sublayer resolution was computationally expensive and judged unnecessary. Indeed, calculation of viscous forces is not required and flow separation occurs at cutting edges,
so its prediction is trivial. Consequently, the mesh is polyhedral and does not make use of prism layers. The prioritized cell refinement was the one allowing to capture the surface details of the machine components, resulting in a cell count of 5.6 million for initial runs (setup check and initial solution) and of 18.4 million for final runs. Simulations made use of the coupled flow model with a 2nd order discretization.
ResultsOverall Pressure DistributionIdeal flow conditions just above the conveyor level consist of a perfectly vertical flow. Pressure distribution in the horizontal plane is thus very important and must be as uniform as possible inside the RABS. The first CFD simulation of the cleanroom showed a small pressure gradient that was sufficient to induce a longitudinal component to the velocity vectors inside the RABS. Laporte engineers designed deflectors to redistribute the pressure in the capping section and removed the partition that provoked a pressure increase in the vials accumulation section. Combined with the modular adjustment of the HEPA filtration, these modifications significantly improved the pressure distribution in the RABS (see figure 5). The CFD simulation correlates
well with the smoke tests performed with the new design and confirmed the improvement efficiency.
Transverse FlowWith the longitudinal flow corrected, Laporte and Creaform focused on transverse velocity components in the vicinity of non-sterile machine components. The CFD simulations highlighted two similar undesired situations: one around the needles holder and one around the capping arm. Both components are non-sterile and the air draft from underneath the physical barrier induces a significant transverse velocity component. As can be seen in Figure 6 (a), this phenomenon drives particles in contact with the arm directly toward the vials that are conveyed at the level of the toothed plate. The aerodynamic deflector visible on Figure 6 (b) was tested in simulation and provoked the shift of the air draft towards the machine floor. It caused the streamlines in the vicinity of the arm to reach the underside of the conveyor, keeping the potentially contaminated particles far from the vials. A similar defector was used at the level of the needles holder. Once designed by Laporte and outsourced for machining, these deflectors were tested in situ with smoke and turned out to perform very well as predicted by the CFD analysis.
Creaform provides, amongst other services, consultation in numerical simulations and uses STAR-CCM+ in its software arsenal as it allows to quickly treat about any geometry, including raw scans. Our experts can work around with the scans and any other available data to numerically reconstruct the geometry and then perform the CFD simulations, cutting down costs and intermediaries.
Figure 3: Hexahedral mesh of vials conveyor Figure 4: Principal boundary conditions
Manufacturing vaccines | Pharmaceuticals

42 Special report
Figure 5: Pressure distribution in horizontal plane – before (above) and after (below) design adjustments
Figure 6: Velocity vectors in section plane at capping arm elbow - original design (above), modified design with aerodynamic deflectors (below)
(a)
(b)
Pharmaceuticals | Manufacturing vaccines
Impinging FlowA third undesired situation addressed by CFD simulations is the one caused by impinging flow on non-sterile surfaces: the accumulation table and the conveyor discs. In both cases, the parts expose a horizontal surface directly to the vertical flow, inducing stagnation points and undesirable vortices. On the table at the beginning of the production line, opened vials accumulate and form a circular pattern near the exterior edge of the table. This table is designed with a central hole, allowing for a proportion of the impinging flow to evacuate without touching the vials. Nevertheless, some streamlines evacuate through the exterior edge, passing through a series of vials as can be seen on figure 7. Many fixes to decrease head losses for the flow through the central hole have been tested in simulation with mixed success. The attention was then focused on determining the actual risk of contamination for the evacuation through the exterior edge, and a particular simulation of the flow around the vials was performed. This detailed simulation, with actual vials modeled, used the global simulation fields to determine boundary conditions. It showed that in
steady-state, the entire flow in contact with the table would evacuate through the vials’ shoulders (see figure 8), thus limiting the contamination risks. Laporte also proposed a specific cleaning procedure for the accumulation table. As for the non-sterile conveyor discs, they would induce a stagnation point surrounded by vortices that would eventually transport particles over the vials path. Thus, their initial design as solid discs was questioned and Laporte ultimately remanufactured the discs and added holes, allowing for a much better evacuation towards the machine floor. The modification was tested with the CFD model and with smoke ejections and both methods confirmed the suppression of the issue.
ConclusionThe project was a convincing demonstration of the complementarity of the reverse engineering solutions and CFD capabilities of Creaform’s Engineering Services team, equipped with STAR-CCM+. The project was also a clear demonstration of the innovative mind of Laporte, who adopted CFD in its cleanroom commissioning in order to gain predictive insight to
complement the traditional smoke tests. The CFD results presented here are currently used in combination with the smoke test videos to demonstrate the effectiveness of the aerodynamic barrier in front of regulatory agencies. So far, the feedback is very positive as CFD really helps to visualize the flow features. It is Creaform’s will to make CFD a prevalent tool for future pharmaceutical production lines. It was therefore necessary to thoroughly understand the fluid flow behavior in order to ensure proper flow path around non-sterile components of the machine. Not only was the regulatory compliance of the cleanroom at stake, but with the amazing production rate of the line (hundreds of vial fillings per minute), a contamination would represent a considerable financial loss because it leads to the waste of vaccine doses. In that context, Creaform’s 3D modeling and Computational Fluid Dynamics (CFD) solutions came in very handy. Using basic STL files such as the ones created by 3D scanners, the engineering team numerically reproduced the cleanroom in Computer Aided Design (CAD) software and performed a series of CFD simulations using STAR-CCM+.

43Special report
Figure 7: Impinging flow on accumulation table
Figure 8: Streamlines in close contact with the table and evacuating through the vials' shoulders
Manufacturing vaccines | Pharmaceuticals

44 Special report
Life Sciences | Damper design

45Special report
Damper design | Life Sciences
A low-profile orthosis for tremor attenuation: A CFD design optimization of the damping systemManilka Abeysuriya and Richard WheatleyPera Technology Ltd.
Juanma BeldaInstituto de Biomechanica de Valencia
Antonio ReddavidCultraro Automazione Engineering S.r.l.
Pedro Fernandez and Leopoldo FernandezEspeciliades Medico Ortopedicas
Essential tremorMore than 4.25 million people in the EU and approximately ten million people in the US are affected by Essential Tremor (ET) [1]. ET is a progressive neurological disorder of which the most recognizable feature is tremor of the arms [2]. ET is also the most prevalent tremor pathology and it affects the hand in 90% of the cases and as such everyday tasks that require fine motor skills become very difficult for sufferers, drastically reducing their quality of life.
Tremor attenuationCurrent solutions employed to combat ET, such as medication and surgery, are expensive and have side effects [3]. Moreover, these treatments are not effective in approximately 25% of patients and about 50% of pathological tremors cannot be adequately controlled with medication [4]. Various external mechanical solutions have been investigated, but have proven to be largely ineffective due to their physical size. This article describes the development of a fluid dynamic design of a rotary damper for use in a low-
profile and passive tremor attenuation orthosis. This project has received funding from the European Union’s Seventh Framework Programme for research, technological development and demonstration under grant agreement no 262127. ET-related movements fall in the frequency range between 4 and 8 Hz hence movements in this range should be targeted for suppression [2].
Design considerationsThe orthosis design consists of two struts, one strapped to the forearm and the other to the hand at the wrist. The two struts are joined together via the rotary damper at the wrist. Flexion of the hand results in rotation of the damper and damping occurs via fluid pressure and viscous friction. The chosen configuration was originally developed by Cultraro Automazione Engineering S.r.l. for an automotive application. It consists of a paddle and a housing configuration with a small gap between them. The damping torque produced depends on the rate of strain and dynamic viscosity of the working fluid. Further, rate of strain also plays a major role in defining effective viscosity of the non-Newtonian fluid used in the damper.
Simulation approachTremor of the hand can be represented by simplifying the overall motion of the hand to a one degree of freedom, simple harmonic motion which is characterized by patient data. A MATLAB®/Simulink® model was developed considering both the hand and the damping system (Figure 1).

46 Special report
The damping torque depends on the geometry of the damper, dry friction properties of the surface/materials, fluid viscosity-shear strain profile, temperature and frequency of operation. In a rotary damper, the shear rate varies with radial position and requires computational modeling or experimentation for a comprehensive analysis. An experimental approach is costly and time-consuming as it calls for building of multiple prototypes to arrive at a design with the target attenuation characteristics. In this case, STAR-CCM+ enabled a parametric design optimization of the system and was a much more time-cost effective alternative to any empirical method.
For accurate development of the STAR-CCM+ model, the implementation of the correct dynamic viscosity-strain rate profile was critical. Rheological tests were carried out to investigate this behavior of damper-working-fluid and the viscosity, and the resulting strain rate relationship was implemented in STAR-CCM+ as a user-defined function. The critical Reynolds number for a smooth-surface flow through a gap representative of that in the
rotary damper design ranges from about 1500 to 2100 [5]. Considering the likely rotational speeds of the damper, the flow Reynolds number was estimated to fall below this critical range. Discontinuous linear parts were implemented in the model to allow simultaneous contraction and expansion of the mesh to simulate the rotary motion of the damper.
The CFD results were then used in the MATLAB/Simulink system-level model to predict the reduction in amplitude of the tremor.
Design optimizationBy using STAR-CCM+, various geometrical parameters were changed, without much effort, during the design exploration. One of the key considerations in this work was the tolerances that could be achieved with the manufacturing methods considered. The tolerance of the manufactured components and ultimately, the tolerance of the damper geometry after assembly, were of significant concern here. One of the initial designs (Figure
2) had fluid gaps that were similar in size to the manufacturing tolerances, which meant that the damper performance for that design was highly sensitive to the tolerances of the components and the assembly technique. To counter this, the azimuthal angle through which the paddle spans was increased and larger fluid gaps were introduced. The larger surface area resulting from these changes increased the damping whilst reducing the sensitivity to manufacturing tolerances (Figure 3).
PerformanceFigure 4 shows the output from STAR-CCM+ for the initial and the final damper designs. The results for the final design indicated a high damping coefficient and a slightly higher stiffness compared to the initial design. The tremor amplitude reduction is presented in Figure 5. The amplitude reduction with the final damper design was about eight to nine times higher than with the initial design. With the initial damper design, the reduction in amplitude seemed to increase with decreasing frequency contrary to
Figure 1: System view showing the hand and the orthosis
Figure 2: Initial damper design with a smaller-azimuthal angle paddle
Figure 3: Final damper design with a larger-azimuthal angle paddle
By employing design parameters in STAR-CCM+, design exploration and optimization were carried out to produce the prototype with the desired performance in the first design iteration.
Life Sciences | Damper design

47Special report
the target characteristics. With the final damper design, the maximum amplitude reduction was around 2 Hz, and reducing with decreasing frequency below this level.
The OrthosisBy employing the damper prototype based on the output of CFD simulations using STAR-CCM+, an orthosis was developed by Especialidades Médico Ortopédicas (Figure 6). Prototype testing and patient trials carried out at Pera Technology UK and at the Instituto de Biomecánica de Valencia revealed about 30% reduction in tremor. The differences observed between the patient trials and the simulations were
attributed to effects from human skin compliance. Clinical trials also revealed a significant improvement when the orthotic device was worn during activities such as writing. The development of a viscous fluid damper similar to that employed here normally takes over ten design iterations using physical prototypes. By employing a CFD simulation model to optimize the design, the final design was realized with the first prototype, significantly shortening the development time and drastically reducing the costs involved.
ConclusionThis article presents an example of how CFD simulations can be used as an
effective means to fast-forward new product development, allowing progress through concept design, prototyping, clinical trials, and into the market in quick succession. In this case, a product developed for the automotive sector was employed as a starting point for a medical orthotic application. CFD was used in conjunction with a system-level model to simulate the final performance which in turn was mapped back to critical design factors. By employing design parameters in STAR-CCM+, design exploration and optimization was carried out to produce the prototype with the desired performance in the first design iteration. The resulting orthosis can be purchased here: www.ortopediaplus.com [6].
References1. S. Stephens: Essential Facts about Essential Tremor: This "quiet" disease, which affects 10 million Americans, is anything but benign. Neurology
Now, 2011.
2. A. Anouti, W.C. Koller: Tremor disorders. Diagnosis and management. Western Journal of Medicine, June 1995; 162 (6).
3. R.L. Watts, W.C. Koller: Movement disorders: Neurologic principles and practice. McGraw-Hill Professional, 2004.
4. A. Prochazka, J. Elek, M. Javidan: Attenuation of pathological tremors by functional electrical stimulation I: Method. Annals of Biomedical
Engineering, 1992; 20.
5. G. Hetsroni, A. Mosyak, E. Pogrebnyak, L.P. Yarin: Fluid flow in micro-channels. International journal of heat and mass transfer, 2005; 48.
6. http://www.ortopediaplus.com/es/ferulas-para-muneca/4454-ferula-tremend-para-muneca.html
Figure 4: Damping torque produced by the initial and the final damper designs
Figure 5: Tremor amplitude reduction by the initial and the final damper designs
Figure 6: Prototype tremor-attenuation orthosis
Damper design | Life Sciences

48 Special report
Life Sciences | High-tech operating room

49Special report
High-tech operating room | Life Sciences
CFD analysis of a high-tech operating room using STAR-CCM+Clemens Bulitta, Franz Magerl, Reinhold Hartwich and Benjamin RusswurmTechnical University of Applied Sciences Amberg-Weiden
IntroductionA fully functioning high-tech Operating Room (OR) with a sophisticated ventilation system was built recently at the Technical University of Applied Sciences Amberg-Weiden in Germany, for teaching and research purposes. The high-tech OR enhances the university’s Medical Engineering programs and acts as an innovation center for the regional health industry. The OR permits the exploration of a number of health-related R&D issues, including:• Use and application of intraoperative
imaging• Technology integration • Medical engineering planning• Ergonomic concerns and use suitability• Workflow and efficiency• Hygiene and air conditioning / airflow
technologies
With the recent surge in nosocomial infections (i.e. infections contracted in clinics or hospitals), finding new ways to effectively thwart contamination and ensure patient safety has become imperative [1].
Hygiene in medical environments, especially in the operating and procedure rooms, is of vital importance. In an implantation, joint or bone surgery for example, where large areas are exposed and must remain aseptic, there is a very high risk of nosocomial infection, and as such, maintaining a hygienic environment is a fundamental requirement. In order to eliminate the risk of contamination of the patient, OR staff or medical instruments, it is critical that the ingress of foreign particles or agents be reduced to a minimum.
In addition to inadequate hygiene, another risk factor concerns the disruption of airflow in an OR. Laminar AirFlows (LAF) are generated by special air conditioning systems in order to ensure a protective, germ-free air climate around the operating table. However, imaging procedures, OR monitors, or even ineffective OR lighting can adversely impact the protective effect of the laminar airflow. [2]
Ventilation system in the operating roomIn accordance with the German hospital room Class 1 standard DIN 1946-4 ("Ventilation in Healthcare Buildings and Rooms"), the OR must have a Room Ventilation System (RVS) to regulate the inflow, filter the air and control the temperature and humidity in the room. The air goes through a grade H13 (absolute) High-Efficiency Particulate Air (HEPA) filter before being fed back into the OR. The filter, which is located in the ceiling panels directly over the operating and instrument tables, supplies a vertical LAF around the operating area in order to create a protective zone where exposure to germs is limited.
However, the laminar nature of the airflow, which is characterized by its slow and uniform velocity, is disrupted when it encounters lateral turbulence or obstructions such as OR lighting, OR staff, etc. on its way down [2].
A number of designs for the RVS system were considered. Eventually, the decision was made to use a conventional LAF 3200

50 Special report
mm x 3200 mm ceiling in conjunction with the new product Opragon®, developed by the Swedish firm Avidicare, in order to produce a Temperature-controlled Laminar AirFlow (TLAF).
Airflow simulation in the operating roomA number of CFD simulations were performed using STAR-CCM+ in order to analyze the airflow in the OR and assess the effectiveness of various ventilation techniques. After verifying the simulation’s air velocities and temperatures against experimental data, the influence of OR imaging devices and other obstacles on the airflow was assessed.
As a starting point, a detailed CAD model of the OR was designed, including technical devices and personnel (see Figure 1). To this end, the geometry was simplified and unnecessary details which have little influence on the simulation results, such as grooves, edges and curves, were ignored. The entire ventilation system was simplified to include only inflow and outflow, and OR staff members were depicted as cylindrical dummies, which have dimensions in
accordance with DIN 1946-4:2008-12. Windows, doors and the like were also ignored for this purpose.
As mentioned in the previous paragraph, the university’s teaching and research OR adopted Opragon, a revolutionary technology developed by Avidicare, which supplies a TLAF in the OR. The filtered air flows through half-hemispheric-shaped openings ("air showers") into the OR. Two areas, corresponding to two different volumetric flow rates and temperatures are defined (see Figure 2): the Opragon (B1, B2.1 and B2.2), from where "cooled" HEPA-filtered air is blown onto the operating table and immediate surroundings, and the external area (B3), from where room-temperature HEPA-filtered air is emitted. The air emanating from the external air showers controls the room temperature while the air
emanating from the Opragon (being 2 degree Kelvin cooler than the ambient air, and therefore of a higher density) "falls" directly down into the operative zone, forming in the process an ultra-clean air curtain.
Validation of STAR-CCM+ simulation results against experimental dataCFD simulations were performed using the k-epsilon turbulence model in STAR-CCM+. To verify and validate the CFD simulation, air velocity and temperature measurements in the teaching and research OR were conducted. Figure 3 shows the location of the points where the measurements were taken.The difference between simulated (V
simulation = 0.450 m/s) and measured air
velocities (Vmeasurement
= 0.420 m/s) was found to be less than 7% (see Figures
Figure 1: CAD model of the teaching and research OR Figure 2: Simplified graphic representation of the air showers in the OR ceiling plane
Figure 3 (ABOVE): Location of the measurement points in the OR
Figure 4 (RIGHT): Simulated air velocity in the area of the operating table (LTV = low-turbulence velocity)
Figure 5: Comparison of simulated and measured air velocities
2580 - 3000 m5/h (B3)2150 - 2500 m5/h (B1)
2150 - 2500 m5/h (B2.2)
2150 - 2500 m5/h (B2.1)
M15
M19
M20
M16
M25M26
M23
M24
M23
M22 M17M18
M14
M13Entrance
1,2 m
LTV-field
Life Sciences | High-tech operating room

51Special report
High-tech operating room | Life Sciences
4 and 5). The simulated values for the temperature distribution were also found to be in good agreement with the experimental data. A deviation of less than 2 % was achieved (see Figures 6 and 7).
The effect of the OR fixtures on the airflow was also assessed. Figure 8 shows the flow field in the vicinity of the operating table, where a recirculation zone was predicted. A smoke visualization test was also performed and confirmed this finding. Through simulations, the observation was made that most medical devices (X-ray
C-Bow, OR lighting, etc.), being located directly under the LAF ceiling, interrupt the protective TLAF flow, thereby posing an additional contamination risk. Additional turbulence zones introduced by airflow recirculation around the dummies ultimately cause impure air to flow from the outer area to the protected area, which increases the risk of microbiological contamination (see Figure 9).
ConclusionUsing CFD simulation, reliable predictions, both general and
specific, about the airflow behavior and temperature distribution in the OR can be made. Furthermore, ventilation parameters can be optimized and general improvements suggested. The CFD results presented here clearly show that the Opragon ventilation system is a step in the right direction. Nevertheless, they also indicate that ventilation technology in the OR can only function effectively if it is successfully combined with optimized medical devices/fixtures and optimal work procedures.
References[1] Robert Koch-Institut: Krankenhaushygiene Basisdaten stationärer Krankenhausversorgung in Deutschland – nosokomiale Infektionen,
Epidemiologisches Bulletin Nr. 36, 13.09.2010
[2] Rüdiger Külpmann, Kurt Hildebrand: OP-Lüftungssysteme im Vergleich, GI – Gebäude Technik | Innenraum-Klima, Vol. 134, No. 01, pp. 12–29, 2013
Figure 6: Temperature distribution in the area of the operating table (LTV = low-turbulence velocity)
Figure 7: Comparison of simulated and measured temperature distributions
Figure 8: Comparison between simulated flow visualization (left) and smoke visualization test (right)
Figure 9: CFD simulation of a hybrid OR with temperature-controlled directional airflow
LTV-field

52 Special report

6Special report
STAR-CCM+ global academic program.Educating tomorrow's engineers today.
siemens.com/mdx

About Siemens PLM Software Siemens PLM Software, a business unit of the Siemens Digital Factory Division, is a leading global provider of product lifecycle management (PLM) and manufacturing operations management (MOM) software, systems and services with over 15 million licensed seats and more than 140,000 customers worldwide. Headquartered in Plano, Texas, Siemens PLM Software works collaboratively with its customers to provide industry software solutions that help companies everywhere achieve a sustainable competitive advantage by making real the innovations that matter. For more information on Siemens PLM Software products and services, visit www.siemens.com/plm.
Headquarters Granite Park One 5800 Granite Parkway Suite 600 Plano, TX 75024 USA +1 972 987 3000
Americas Granite Park One 5800 Granite Parkway Suite 600 Plano, TX 75024 USA +1 314 264 8499
Europe Stephenson House Sir William Siemens Square Frimley, Camberley Surrey, GU16 8QD +44 (0) 1276 413200
Asia-PacificSuites 4301-4302, 43/F AIA Kowloon Tower, Landmark East 100 How Ming Street Kwun Tong, Kowloon Hong Kong +852 2230 3308
© 2016 Siemens Product Lifecycle Management Software Inc. Siemens and the Siemens logo are registered trademarks of Siemens AG. D-Cubed, Femap, Fibersim, Geolus, GO PLM, I-deas, JT, NX, Parasolid, Solid Edge, Syncrofit, Teamcenter and Tecnomatix are trademarks or registered trademarks of Siemens Product Lifecycle Management Software Inc. or its subsidiaries in the United States and in other countries. All other logos, trademarks, registered trademarks or service marks belong to their respective holders.
LS - SP-11/16