discrete and continuous optimization models for the design
TRANSCRIPT
1
Carnegie Mellon
Discrete and Continuous Optimization Models for the Design and Operation of
Sustainable and Robust Process Systems
Ignacio E. Grossmann Center of Advanced Process Decision-making
Carnegie Mellon University Pittsburgh, PA 15217
U.S.A.
OSE, Abo Akademi, Turku December 8, 2011
2
Carnegie Mellon
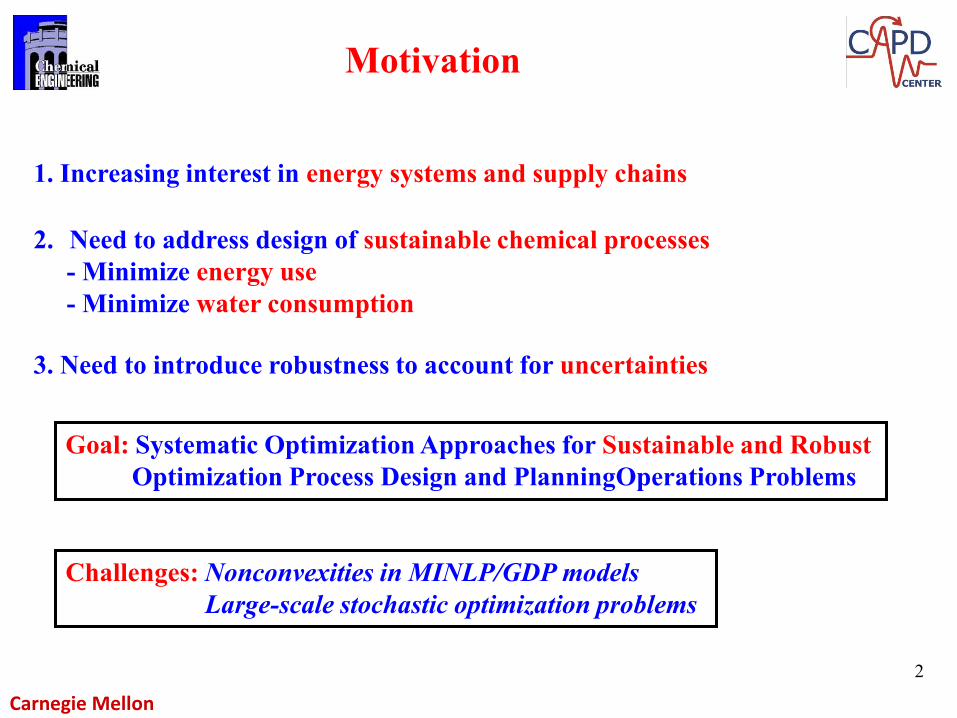
Motivation
2. Need to address design of sustainable chemical processes - Minimize energy use - Minimize water consumption
3. Need to introduce robustness to account for uncertainties
1. Increasing interest in energy systems and supply chains
Challenges: Nonconvexities in MINLP/GDP models Large-scale stochastic optimization problems
Goal: Systematic Optimization Approaches for Sustainable and Robust Optimization Process Design and PlanningOperations Problems

3
Carnegie Mellon
Water scarcity
Two-thirds of the world population will face water stress by year 2025

4
Carnegie Mellon
Water-using unit 1
Water-using unit 2
Water-using unit 3
Raw Water Raw Water Treatment
Boiler Feedwater treatment
Steam System
Wastewater Boiler Blowdown
Steam Condensate Losses
Boiler
Freshwater Wastewater
Cooling Tower
Cooling Tower Blowdown
Water Loss by Evaporation
Discharge
Wastewater Treatment
Storm Water
Other Uses (Housekeeping)
Wastewater
Conventional System

5
Carnegie Mellon
• Given is: – a set of single/multiple water sources with/without contaminants, – a set of water-using, water pre-treatment, and wastewater
treatment operations, sinks and sources of water
• Synthesize an integrated process water network – interconnection of process and treatment units (reuse, recycle) – the flow rates and contaminants concentration of each stream – minimum total annual cost of water network
Approach: Global NLP or MINLP superstructure optimization model
Synthesis of Integrated Process Water Networks
Synthesis Integrated Process Water Networks • Pinch analysis and mathematical programming models • Reviews in Bagajewicz (2000), Ježowski (2008), Bagajewicz and Faria (2009), and Foo (2009).

6
Carnegie Mellon
Superstructure for water networks for water reuse, recycle, treatment, and with sinks/sources water
Freshwater
Process Unit
Treatment Unit
Sink
Source
Ahmetovic, Grossmann (2010)
Main features: - Multiple feeds - Source/Sink units - Local recycles - All possible interconnections -Fixed and variable flows through process units

7
Carnegie Mellon
Objective function: min Cost
Subject to: Splitter mass balances Mixer mass balances (bilinear) Process units mass balances Treatment units mass balances Design constraints
Nonconvex NLP or MINLP
Optimization Model
0-1 variables for piping sections
Model can be solved to global optimality

8
Carnegie Mellon
SWsFITFIDFIPFIFFWTUt
ts
DUd
ds
PUp
psss
,,,
Splitter
linear
SWsyFIFFIFyFIFss FIF
U
ssFIF
L
s
PUpSWsyFIPFIPyFIPpsps FIP
U
pspsFIP
L
ps ,,, ,,,
DUdSWsyFIDFIDyFIDdsds FID
U
dsdsFID
L
ds ,,, ,,,
TUtSWsyFITFITyFITtsts FIT
U
tstsFIT
L
ts ,,, ,,,
0-1 optional
bilinear if the flow treated as cont. variable
PUpFPFPFIPFTPFSPFPU
pp RPUp
pp
RppPUp
pp
SWs
ps
TUt
pt
SUr
pr
in
p
,1
','
0,''
,',,,
jPUpxSPUFPxSPUFP
xWFIPxSTUFTPxSUFSPxPUFPU
out
jp
RPUp
pp
out
jp
RppPUp
pp
in
js
SWsTUt
out
jtpt
out
jr
SUr
pr
in
jp
in
p
pp
,,,'
1'
,','
0,''
,'
,,,,,,
Mixer
bilinear
PUpFPUFPU out
p
in
p
jPUpxPUFPULPUxPUFPU out
jp
out
pjp
in
jp
in
p ,10 ,3
,,linear if flowrate is fixed
Process unit

9
Carnegie Mellon
TUt
out
tt
TUt
out
tts
SWs
s FTUOCHFTUICARCFWFWHZmin
Cost function linear in feedwater, concave in treatment unit, linear in operating cost, pipe section fixed charge (0-1)

10
Carnegie Mellon
Convexification of Non-convex functions
iL
j
iUiiL
j
i
j
iUi
j
iU
j
iLiiU
j
i
j
iLi
j
iU
j
iUiiU
j
i
j
iUi
j
iL
j
iLiiL
j
i
j
iLi
j
CFFCCFf
CFFCCFf
CFFCCFf
CFFCCFf
McCormick (1976 )
Under- and over-estimators ( Linear Inequalities )
FiL ≤ Fi ≤ FiU CjiL ≤ Cj
i ≤ CjiU
C
CL
FL
CU
FU
F
Underestimators
Overestimators
Bilinear term
Convex Envelopes for Bilinear Terms F*C
Underestimation of Concave functions
F
(FL)
FL
(FU)
FU
F
Underestimator
Concave term
iLi
iLiU
iLiUiLi
FFFF
FFFF
FiL ≤ Fi ≤ FiU
( Secant line )

11
Carnegie Mellon
bilinear terms for the treatment units and final mixing points
jxDUFDUxF
xTUFTUxSUFSULPUxWFW
in
jd
DUd
in
d
out
j
out
in
jt
TUt
in
tjtTU
out
jr
SUr
out
r
PUp
jp
in
js
SWs
s
,
,,,3
,, )1(10
Cut is redundant for original problem Non-redundant for relaxation problem
•The cut proposed by Karuppiah and Grossmann (2006) is incorporated to significantly improve the strength of the lower bound for the global optimum: contaminant flow balances for the overall water network system
•Tight bounds on the variables are expressed as general equations obtained by physical inspection of the superstructure and using logic specifications
12
Carnegie Mellon
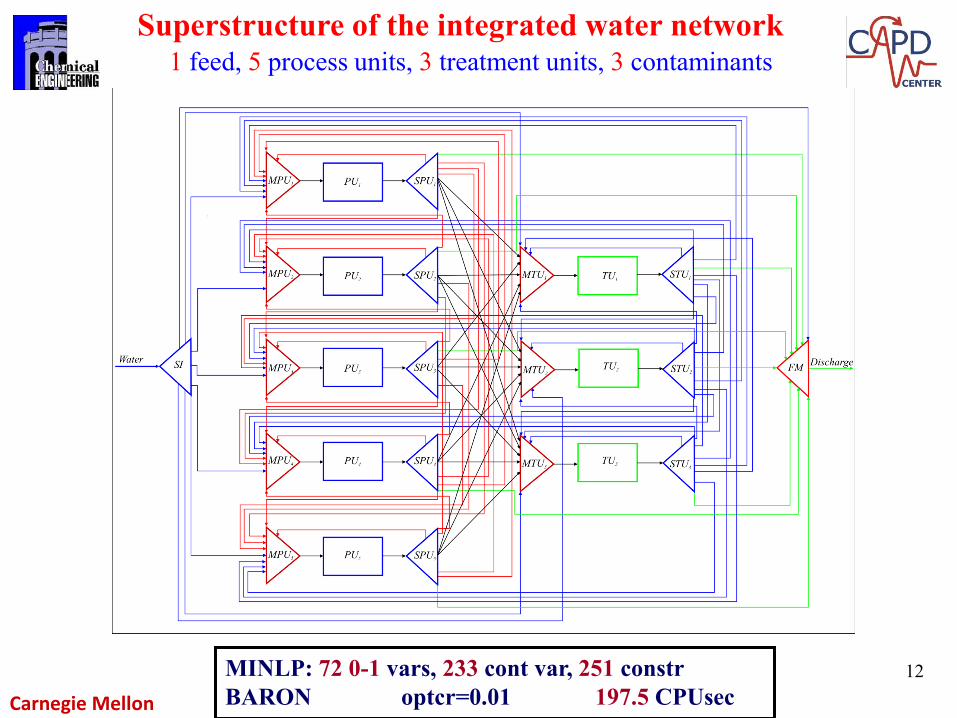
Superstructure of the integrated water network
MINLP: 72 0-1 vars, 233 cont var, 251 constr BARON optcr=0.01 197.5 CPUsec
1 feed, 5 process units, 3 treatment units, 3 contaminants

13
Carnegie Mellon
Optimal design of the simplified water network with 13 removable connections
Optimal Freshwater Consumption
40 t/h vs
300 t/h conventional

14
Carnegie Mellon
US Energy Sources
Biomass emerging as important renewable

15
Carnegie Mellon
Process Design Challenges in Bioethanol Energy consumption corn-based process level:
Water consumption corn based - process level:
Author (year) Energy consumption (Btu/gal)
Pimentel (2001) 75,118 Keeney and DeLuca (1992)
48,470
Wang et al. (1999) 40,850 Shapouri et al. (2002) 51,779 Wang et al (2007) 38,323
Author (year) Water consumption ( gal/gal ethanol)
Gallager (2005) First plants
11
Philips (1998) 5.8
MATP (2008) Old plants in 2006
4.6
MATP (2008) New plants
3.4

16
Carnegie Mellon
Proposed Design Strategy for Energy and Water Optimization
Energy optimization Issue: fermentation reactions at modest temperatures
Multieffect distillation followed by heat integration process streams
=> No source of heat at high temperature as in petrochemicals
Water optimization Issue: cost contribution is currently still very small (freshwater contribution < 0. 1%) => Total cost optimization is unlikely to promote water conservation
Optimal process water networks for minimum energy consumption

17
Carnegie Mellon
Energy Optimization of Corn-based Bioethanol Peschel, Martin, Karuppiah, Grossmann, Zullo, Martinson (2007)
60 M gallon /yr plant
Equipment cost = M$ 18.4 Steam cost = M$ 21/yr Prod. cost = 1.50 $/gal
18
Carnegie Mellon
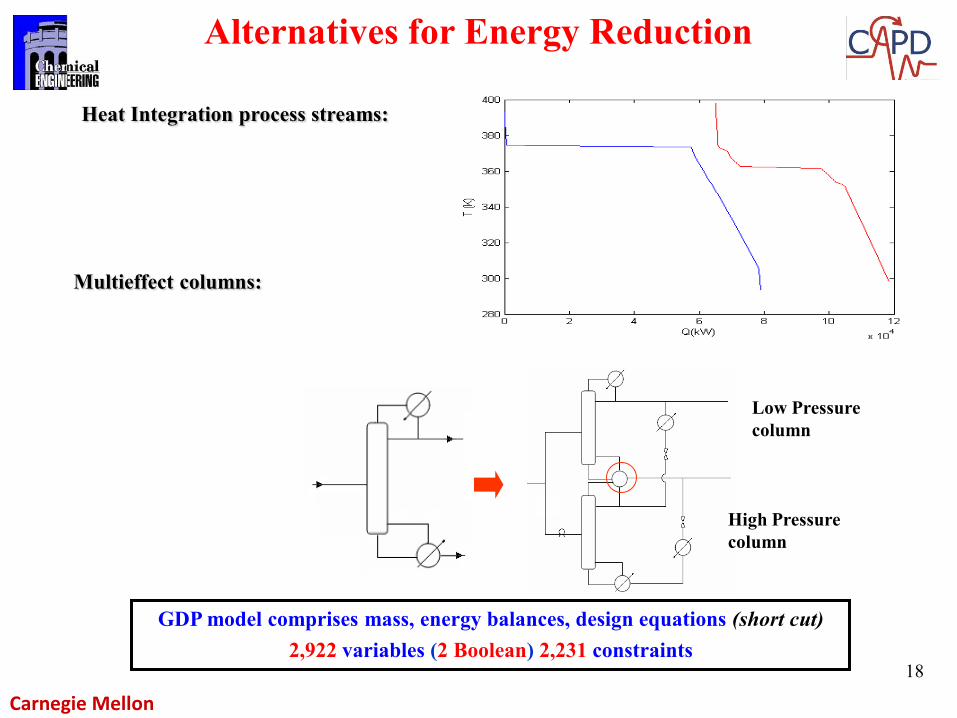
Alternatives for Energy Reduction
Heat Integration process streams:
Multieffect columns:
Low Pressure column
High Pressure column
GDP model comprises mass, energy balances, design equations (short cut) 2,922 variables (2 Boolean) 2,231 constraints

19
Carnegie Mellon
60 M gallon /yr plant
Ethanol losses : 0.5%
Equipment cost = M$ 20.7 Steam cost = M$ 7.1/yr (-66%) Prod. cost = 1.28 $/gal
Wash1 Grind1
Src2
Src1
Feedstock
Washing water
Premix1 Col1 Liq1 Sac1Mix2
Src4
Jet1
HX1 HX2
Superheated steam
Src6Src5
Enzyme Enzyme
Fer1
HX3
Mix3 Src7
Yeast, Urea, Water
Snk1
Vent gasCO2, O2
Str1
Str2
Spl2 Ads1 Spl5
Spl4
Mix7 Snk5
Snk4
Snk3
Ethanol
Adsorbant
Snk2
HX4
Spl1
BC1
WWT1
Water
Spl3
Mix4
Mix5
Mix6
MecP1
HX5Cond1
Spl6
Src9
Adsorbant: Corn grits
HX6
MS1 MS2 Src8
HX7
HX8
HX9
Flot1
Dry1
Snk6Snk7
Snk8
Water Biogas
Dry DDGS Solids
Proteins
Spl7Snk9
HX10
VOC removal
Rec1
To discharge/ re-use
Dry air
Storage tank
Storage tank
Humid air
HX11
Cond2
100% Ethanol
72% Ethanol
95% Ethanol
97.7% Ethanol
10.8% Ethanol
Heat Integration and Multieffect Columns
Reduction from $1.50/gal (base case) to $1.28/gal !
Energy Optimal Design
20
Carnegie Mellon
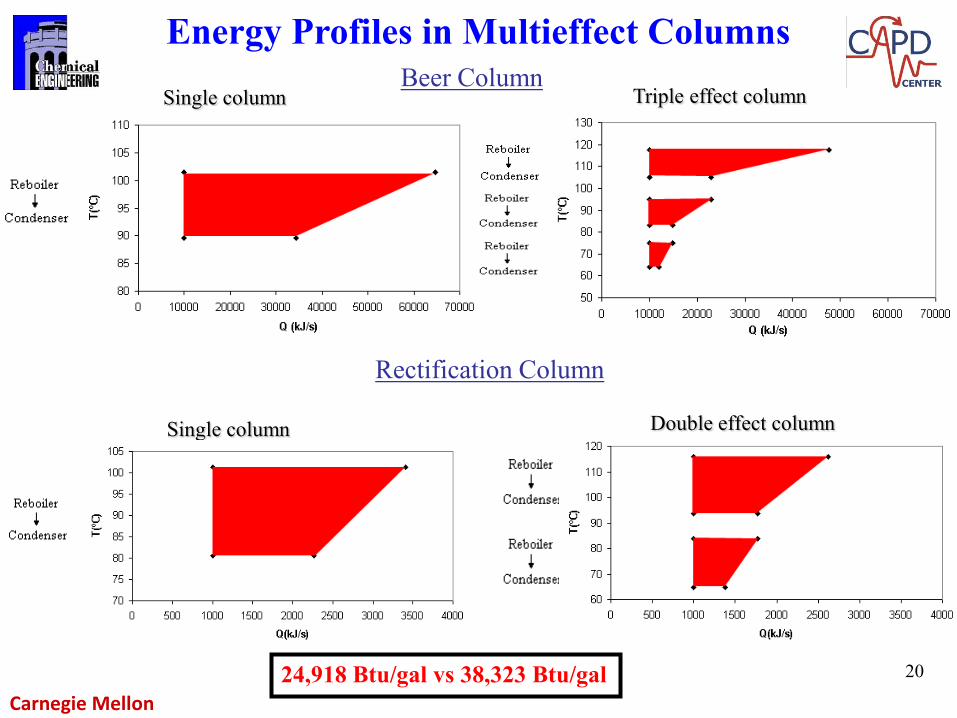
Energy Profiles in Multieffect Columns Beer Column
Rectification Column
Single column
Single column
Triple effect column
Double effect column
24,918 Btu/gal vs 38,323 Btu/gal

21
Carnegie Mellon
Remarks
21
Current ethanol from corn and sugar cane and biodiesel from vegetable oils compete with the food chain.
U.S. Government policies support the production of lignocellulosic based biofuels and the reuse of wastes and new sources (algae)

22
Carnegie Mellon
Challenge: Many alternative flowsheets
b) Hydrolysis Process (fermentation)
Wastewater Power-Heat
Biomass Pretreatment
Cellulosic Hydrolysis
Sugar Fermentation
Ethanol Recovery
Electricity
Feed Ethanol
a) Thermochemical Process (gasification)
Power-Heat Gasification Gas clean-up
Fermentation or Catalytic
Ethanol Recovery
Electricity
Feed Ethanol
Lignocellulosic Bioethanol

23
Carnegie Mellon
Superstructure Thermochemical Bioethanol
Process Design Alternatives: Gasification Indirect Low pressure Direct high Pressure Reforming. Steam reforming Partial oxidation CO/H2 adjustment WGSR Bypass Membrane/PSA Sour gases removal: MEA PSA Membrane Synthesis Fermentation Rectification Adsorption Corn grits Molecular sieves Pervaporation Catalytic Direct Sequence Indirect sequence
Ethanol via gasification
-Martin, M. Grossmann, I. E (2010) Aiche J. Submitted
Gasification Reforming Clean up CO/H2 Adj. Sour gases removal
Fermentation
Catalysis
Martin, Grossmann (2010)

24
Carnegie Mellon
Superstructure
Gasifier 1 Gasifier 2
Partialoxidation
Steam reforming
Partialoxidation
Steam reforming
Catalysis Fermentation Catalysis Fermentation Catalysis Fermentation Catalysis Fermentation
Problem
Subproblem
(A) (B) (C) (D) (E) (F) (G) (H)
Solution Strategy Energy Optimization
Decomposition of GDP in 8 subproblems Decision levels: Gasifier Removal HCs Reaction of Syn Gas
Heat integration and economic evaluation
25
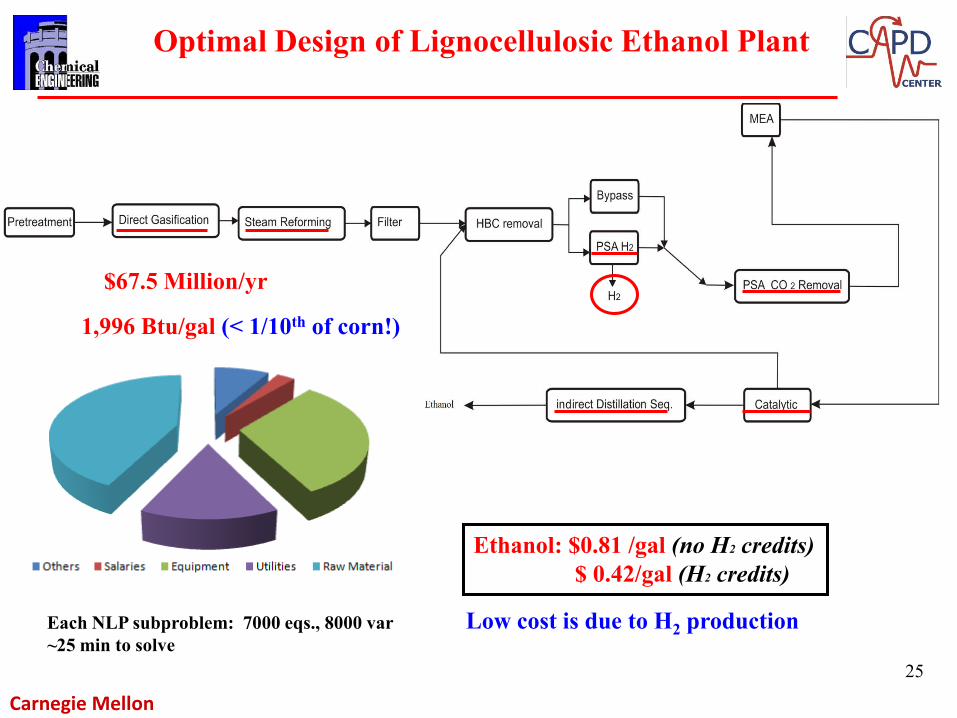
Carnegie Mellon
Ethanol: $0.81 /gal (no H2 credits) $ 0.42/gal (H2 credits)
Optimal Design of Lignocellulosic Ethanol Plant
Low cost is due to H2 production Each NLP subproblem: 7000 eqs., 8000 var ~25 min to solve
$67.5 Million/yr
1,996 Btu/gal (< 1/10th of corn!)

26
Carnegie Mellon
Freshwater
Dist. Colums.
Fermentor
Washing
Discharge
Solids removal
Organics removal
Optimal Water Network: Corn Ethanol
TDS removal
-Ahmetović , E., Martin, M. Grossmann, (2009) I&ECR. 2010, 49, 7972–7982
Gal. Water/Gal. Ethanol = 1.5
1.5 vs 3.4

27
Carnegie Mellon -Martin, M. , Ahmetović, E., Grossmann, I. E (2010) I&ECR ASAP
Cellulosic Bioethanol via Gasification
Freshwater
Wastewater
Gasifier
Washing Solids removal
Organics removal
Optimal Water Network: Lignocellulosic Ethanol
Gal. Water/Gal. Ethanol = 4.2

28
Carnegie Mellon
Table Summary of results [6-10]
A C B D F E
[6] Martín, M., Grossmann, I.E. (2011) AIChE J. DOI: 10.1002/aic.12544 [7] Martín, M., Grossmann, I.E. Energy optimization of Hydrogen production from biomass. Rev. Submited to Comp. Chem. Eng. [8] Martín, M., Grossmann, I.E. Energy optimization of lignocellulosic bioethanol production via Hydrolysis to be submitted AIChE J. [9] Martín, M., Grossmann, I.E. Process optimization of FT- Diesel production from biomass. To be submitted [10] Martín, M., Grossmann, I.E. Process optimization bioDiesel production from cooking oil and Algae. To be submitted
(*) kg instead of gal
29
Carnegie Mellon
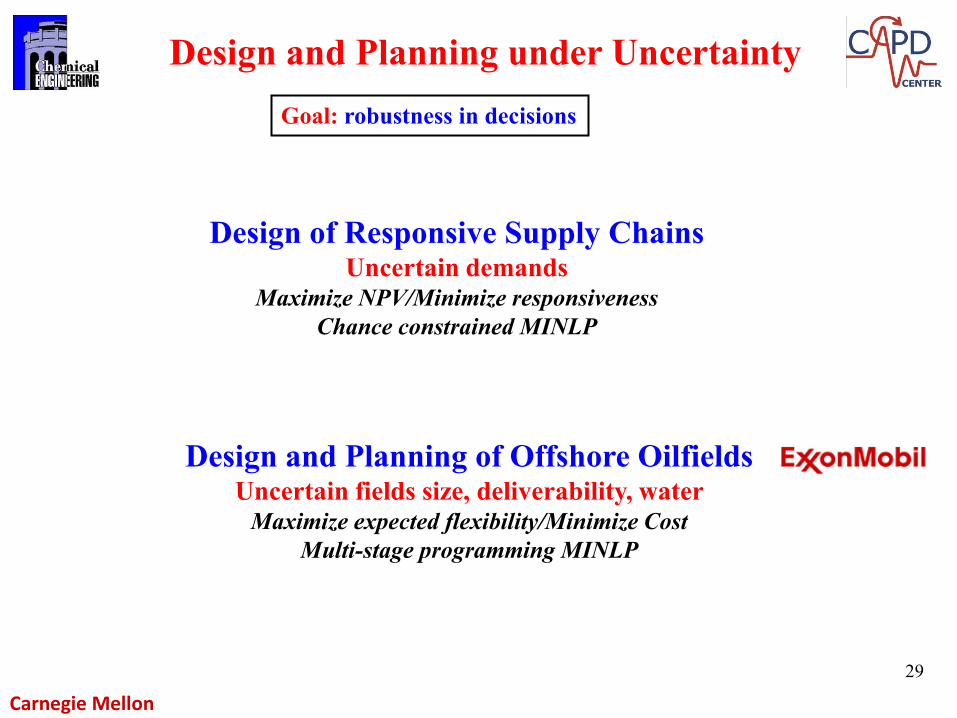
Design and Planning under Uncertainty
Design and Planning of Offshore Oilfields Uncertain fields size, deliverability, water
Maximize expected flexibility/Minimize Cost Multi-stage programming MINLP
Goal: robustness in decisions
Design of Responsive Supply Chains Uncertain demands
Maximize NPV/Minimize responsiveness Chance constrained MINLP

Optimal Design of Responsive Process Supply Chains
Background
Fengqi You
Objective: design supply chains under responsive and economic criteria with consideration of inventory management and demand uncertainty

Problem Statement
Production Network Costs and prices Production and transportation time Demand information
Suppliers Plants DCs Customers
Safety Stock
Target DemandMax: Net present value
Max: Responsiveness
Network Structure
Operational Plan
Production Schedule
Where? What? When?
Background

II
III
SPS - 3
EPS - 1
SPS - 2
SPS - 1
EPS - 2
I
Ethylene
Benzene
Styrene
Production Network of Polystyrene Resins
Source: Data Courtesy Nova Chemical Inc. http://www.novachem.com/
Three types of plants:
Basic Production Network
Single Product
Multi Product
Multi Product
Plant I: Ethylene + Benzene Styrene (1 products)
Plant II: Styrene Solid Polystyrene (SPS) (3 products)
Plant III: Styrene Expandable Polystyrene (EPS) (2 products)
Example

Possible Plant Site Supplier Location
Distribution Center Customer Location
Location Map
Example

IL
TXI
II
III
III
II
I
CAEthylene
Ethylene
Benzene
Benzene
Styrene
Styrene Styrene
SPS
SPS
EPS
EPS
AZ
OK
Plant Site MI
Plant Site TX Plant Site CA
NV
IEthylene
Benzene
Styrene
Plant Site LA
TX
GA
PA
NC
FL
OH
MA
MN
WA
IA
TX
MS
LA
AL
IIIEPS
Suppliers Plant Sites Distribution Centers Customers
Potential Network Superstructure
Example

Responsiveness - Lead Time
Lead Time: The time of a supply chain network to respond to customer demands and preferences in the worst case
Lead Time is a measure of responsiveness in SCs
Model & Algorithm
Responsiveness
Lead Time

• A supply chain network = ∑Linear supply chains Assume information transfer instantaneously
Model & Algorithm
Lead Time for A Linear Supply Chain
Information
Suppliers
Plants Distribution Centers Customers
Supplier ls Plant i1 site k1 Plant i3 site k3 Customer ldDistribution Center m
Plant i2 site k2

Lead Time under Demand Uncertainty
Model & Algorithm
Inventory (Safety Stock)
Production Lead Time (LP) Delivery Lead Time (LD)
Supplier ls Plant i0 site k0
…Plant in site kn Customer ldDistribution Center m
Transporation Transporation TransporationTransporation

Safety Stock
P
• Expected Lead time of a supply chain network (uncertain demand)
The longest expected lead time for all the paths in the network (worst case)
Example: A simple SC with all process are dedicated
Expected Lead Time = max {2.1, 2.0} = 2.1 days
For Path 1: (2 + 1.5 + 0.5 + 1.2 + 1.8)×20% + 0.7 = 2.1 days
For Path 2: (2 + 1.5 + 0.2 + 2.6 + 1.2)×20% + 0.5 = 2.0 days
Expected Lead Time of SCN
P1=20%
Path 2 2.0 days
Path 1 2.1 days
P2=20%
Example
I
II
Supplier2
0.5
0.2
1.8
1.5
1.2
Plant Site 1
Plant Site 2 Customer 1
Customer 2
DC 1
III1.2
2.6
Plant Site 3
DC 2
0.7
0.5

• Objective Function: Max: Net Present Value
Min: Expected Lead time
• Constraints: Network structure constraints
Suppliers – plant sites Relationship Plant sites – Distribution Center Input and output relationship of a plant Distribution Center – Customers Cost constraint
Bi-criterion
Choose Discrete (0-1), continuous variables
Cyclic scheduling constraints Assignment constraint Sequence constraint Demand constraint Production constraint Cost constraint
Probabilistic constraints Chance constraint for stock out (reformulations)
Bi-criterion Multiperiod MINLP Formulation
d Md L d U
Safety Stock
Target Demand
Model & Algorithm
Operation planning constraints Production constraint Capacity constraint Mass balance constraint Demand constraint Upper bound constraint

Possible Plant SiteSupplier Location
Distribution CenterCustomer Location
Possible Plant SiteSupplier Location
Distribution CenterCustomer Location
Possible Plant SiteSupplier Location
Distribution CenterCustomer Location
IL
TXI
II
III
III
II
I
CAEthylene
Ethylene
Benzene
Benzene
Styrene
Styrene Styrene
SPS
SPS
EPS
EPS
AZ
OK
Plant Site MI
Plant Site TX Plant Site CA
NV
IEthylene
Benzene
Styrene
Plant Site LA
TX
GA
PA
NC
FL
OH
MA
MN
WA
IA
TX
MS
LA
AL
IIIEPS
Suppliers Plant Sites Distribution Centers Customers
Case Study
Example
• Problem Size: # of Discrete Variables: 215 # of Continuous Variables: 8126 # of Constraints: 14617
• Solution Time: Solver: GAMS/BARON Direct Solution: > 2 weeks Proposed Algorithm: ~ 4 hours
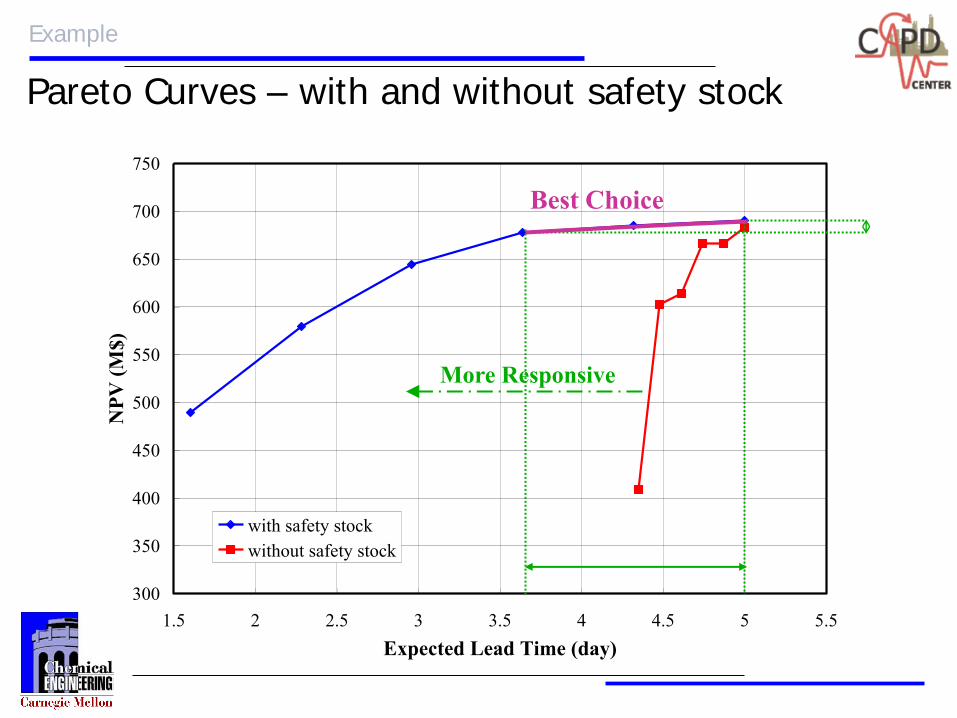
300
350
400
450
500
550
600
650
700
750
1.5 2 2.5 3 3.5 4 4.5 5 5.5Expected Lead Time (day)
NPV
(M$)
with safety stockwithout safety stock
Pareto Curves – with and without safety stock
Example
More Responsive
Best Choice
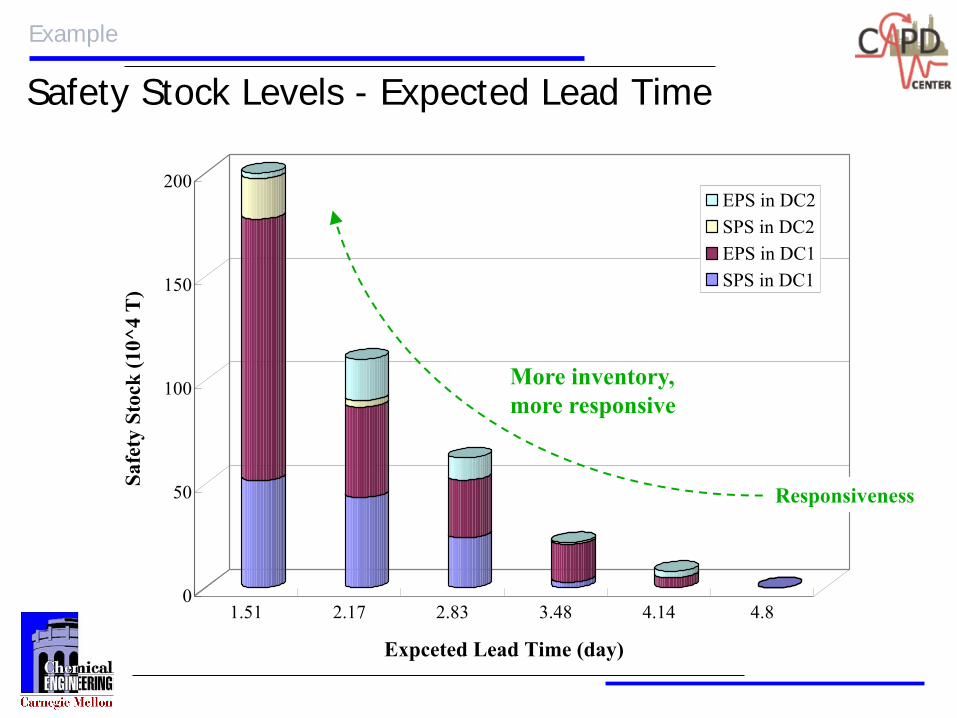
0
50
100
150
200
Safe
ty S
tock
(10^
4 T
)
1.51 2.17 2.83 3.48 4.14 4.8
Expceted Lead Time (day)
EPS in DC2SPS in DC2EPS in DC1SPS in DC1
Safety Stock Levels - Expected Lead Time
Example
More inventory, more responsive
Responsiveness

43
Network Structure at Location Map
Design of Responsive Chemical Supply Chains under Uncertainty

44
Carnegie Mellon
Decisions:
Number and capacity of TLP/FPSO facilities Installation schedule for facilities Number of sub-sea/TLP wells to drill Oil production profile over time
Reservoirs wells
facilities
Offshore oilfield having several reservoirs under uncertainty Maximize the expected net present value (ENPV) of the project
Tarhan, Grossmann (2009)
Optimal Development Planning under Uncertainty
Uncertainty: Initial productivity per well Size of reservoirs Water breakthrough time for reservoirs
TLP FPSO

45
Carnegie Mellon
Tank Cumulative Oil (MBO)
Sing
le W
ell O
il an
d W
ater
Rat
e (k
bd)
Unconstrained Maximum Oil Production
Water Rate
Initial oil production Assumption: All wells in the same reservoir are identical.
Size of the reservoir Uncertainty is represented by discrete distributions functions
Non-linear Reservoir Model

46
Carnegie Mellon
Decision Dependent Scenario Trees
Scenario tree Not unique: Depends on timing of investment at uncertain fields
Central to defining a Stochastic Programming Model
Invest in F in year 1
H
Invest in F
Size of F: M L
Assumption: Uncertainty in a field resolved as soon as WP installed at field
Invest in F in year 5
H Size of F: L
Invest in F
M

47
Carnegie Mellon
1 2 3 4
ξ2=1 p=0.5
ξ2=2 p=0.5
ξ2=1 p=0.5
ξ2=2 p=0.5
ξ1=1 p=0.5
ξ1=2 p=0.5
t=1
t=2
t=3
1 2 3 4
ξ1=1 p=0.25
ξ1=2 p=0.25
ξ1=2 p=0.25
ξ2=2 p=1.00
ξ2=1 p=1.00
ξ1=1 p=0.25
ξ2=2 p=1.00
ξ2=1 p=1.00
t=1
t=2
t=3
Alternative and equivalent scenario tree structure (Ruszczynski, 1997):
scenario tree
Stochastic Programming

48
Carnegie Mellon
1 2 3 4
ξ2=1 p=0.5
ξ2=2 p=0.5
ξ2=1 p=0.5
ξ2=2 p=0.5
ξ1=1 p=0.5
ξ1=2 p=0.5
t=1
t=2
t=3
1 2 3 4
ξ1=1 p=0.25
ξ1=2 p=0.25
ξ1=2 p=0.25
ξ2=2 p=1.00
ξ2=1 p=1.00
ξ1=1 p=0.25
ξ2=2 p=1.00
ξ2=1 p=1.00
t=1
t=2
t=3
Each scenario is represented by a set of unique nodes
Stochastic Programming

49
Carnegie Mellon
1 2 3 4
ξ2=1 p=0.5
ξ2=2 p=0.5
ξ2=1 p=0.5
ξ2=2 p=0.5
ξ1=1 p=0.5
ξ1=2 p=0.5
t=1
t=2
t=3
ξ1=1 p=0.25
ξ1=2 p=0.25
ξ1=2 p=0.25
ξ2=2 p=1.00
ξ2=1 p=1.00
ξ1=1 p=0.25
ξ2=2 p=1.00
ξ2=1 p=1.00
1 2 3 4
t=1
t=2
t=3
Nodes have same amount of information Nodes are indistinguishable
Non-anticipativity constraints
Stochastic Programming

50
Carnegie Mellon
t=1
t=2
t=3
1 2 3 4
t=4
t=1
t=2
t=3
1 2 3 4
t=4
1 2 3 4
1 2 3 4
Representation of Decision-Dependence Using Scenario Tree

51
Carnegie Mellon
Every scenario,
time period
Problem size MINLP increases exponentially with number of time periods
and scenarios
Decomposition algorithm: Lagrangean relaxation & Branch and Bound
MILP Branch and cut: Colvin, Maravelias (2008)
Every pair scenarios,
time period
Multi-stage Stochastic Nonconvex MINLP
Maximize.. Probability weighted average of NPV over uncertainty scenarios subject to
Equations about economics of the model Surface constraints Non-linear equations related to reservoir performance Logic constraints relating decisions
if there is a TLP available, a TLP well can be drilled
Non-anticipativity constraints Non-anticipativity prevents a decision being taken now from using information that will only become available in the future Disjunctions (conditional constraints)

52
Carnegie Mellon
Formulation of Lagrangean dual
Relaxation • Relax disjunctions, logic
constraints • Penalty for equality
constraints

53
Carnegie Mellon
Uncertain Parameters (Discrete Values)
Scenarios
1 2 3 4 5 6 7 8 Initial Productivity per well (kbd) 10 10 20 20 10 10 20 20
Reservoir Size (Mbbl) 300 300 300 300 1500 1500 1500 1500
Water Breakthrough Time Parameter 5 2 5 2 5 2 5 2
Optimize the planning decisions for an oilfield having single reservoir for 10 years. Decisions:
Number, capacity and installation schedule of FPSO/TLP facilities Number and drilling schedule of sub-sea/TLP wells Oil production profile over time
Construction Lead Time
(years)
Wells Facilities
TLP Sub-sea TLP Small FPSO Large FPSO
1 1 1 2 4
Wells are drilled in groups of 3. Maximum number of 12 sub-sea wells per year can be drilled.
Maximum of 6 TLP wells per year per TLP facility can be drilled. Maximum of 30 TLP wells can be connected to a TLP facility.
One Reservoir Example

54
Carnegie Mellon
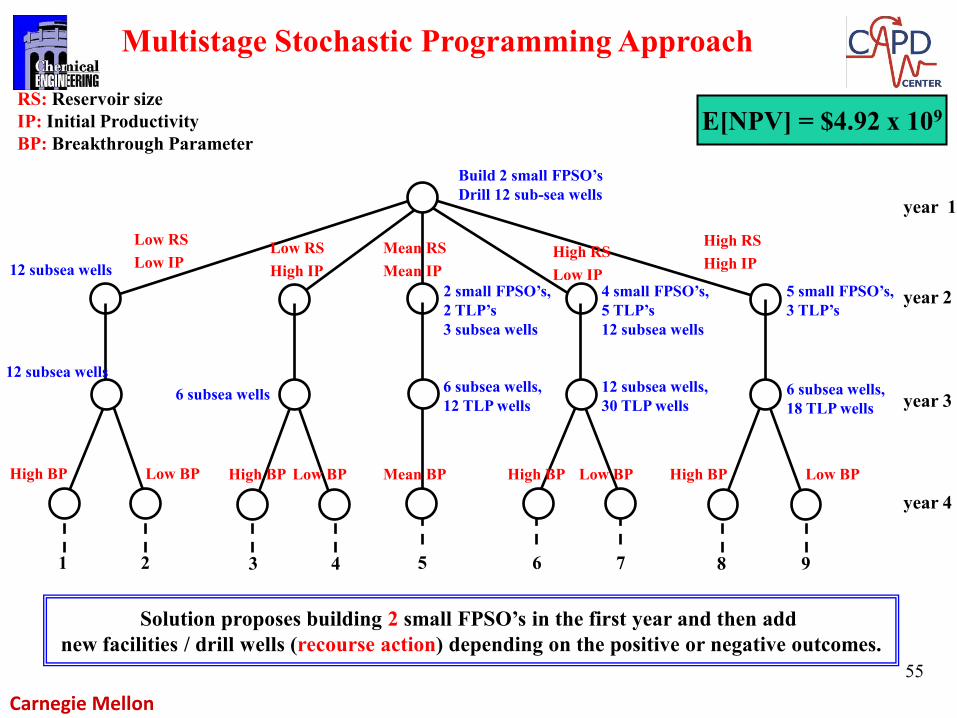
RS: Reservoir size IP: Initial Productivity BP: Breakthrough Parameter
E[NPV] = $4.92 x 10⁹
Solution proposes building 2 small FPSO’s in the first year and then add new facilities / drill wells (recourse action) depending on the positive or negative outcomes.
year 1
Build 2 small FPSO’s Drill 12 sub-sea wells
year 2 12 subsea wells
Low RS Low IP
High RS High IP
High RS Low IP
Low RS High IP
4 small FPSO’s, 5 TLP’s 12 subsea wells
5 small FPSO’s, 3 TLP’s
2 small FPSO’s, 2 TLP’s 3 subsea wells
Mean RS Mean IP
Multistage Stochastic Programming Approach
55
Carnegie Mellon
RS: Reservoir size IP: Initial Productivity BP: Breakthrough Parameter
E[NPV] = $4.92 x 10⁹
Solution proposes building 2 small FPSO’s in the first year and then add new facilities / drill wells (recourse action) depending on the positive or negative outcomes.
year 1
year 2
Build 2 small FPSO’s Drill 12 sub-sea wells
12 subsea wells
Low RS Low IP
High RS High IP
High RS Low IP
Low RS High IP
4 small FPSO’s, 5 TLP’s 12 subsea wells
5 small FPSO’s, 3 TLP’s
2 small FPSO’s, 2 TLP’s 3 subsea wells
Mean RS Mean IP
8 9 1 2 6 7 3 4
year 3
year 4 High BP Low BP
6 subsea wells, 18 TLP wells
High BP Low BP High BP Low BP High BP Low BP
5
12 subsea wells, 30 TLP wells
12 subsea wells 6 subsea wells 6 subsea wells,
12 TLP wells
Mean BP
Multistage Stochastic Programming Approach

56
Carnegie Mellon
-2
0
2
4
6
8
10
1 2 3 4 5 6 7 8 9
Scenarios
Net P
rese
nt V
alue
($ x
109 )
Deterministic Mean Value = $4.38 x 10⁹
Multistage Stoch Progr = $4.92 x 109 => 12% higher and more robust
Computation: Algorithm 1: 120 hrs; Algorithm 2: 5.2 hrs Nonconvex MINLP: 1400 discrete vars, 970 cont vars, 8090 Constraints
Distribution of Net Present Value
57
Carnegie Mellon
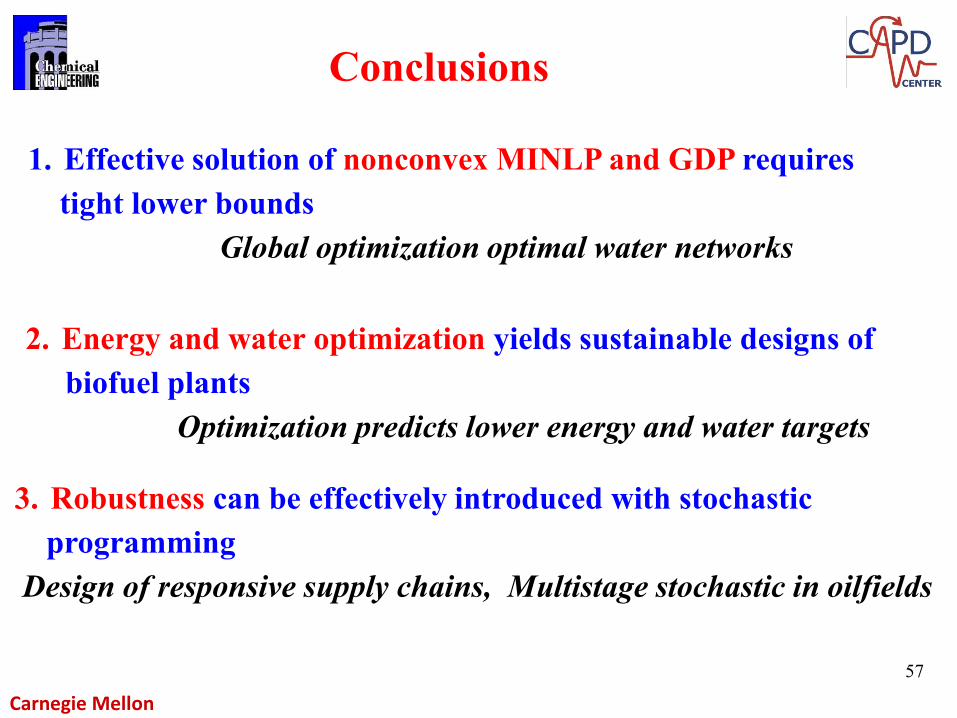
1. Effective solution of nonconvex MINLP and GDP requires tight lower bounds Global optimization optimal water networks
2. Energy and water optimization yields sustainable designs of biofuel plants Optimization predicts lower energy and water targets
3. Robustness can be effectively introduced with stochastic programming Design of responsive supply chains, Multistage stochastic in oilfields
Conclusions