discussion paper series a no - hitotsubashi university
TRANSCRIPT
Discussion Paper Ser ies A No.506
The Loca t ion of J apanese MNCs Affilia tes:
Agglomera t ion Spillovers and Firm Heterogeneity
Tomohiko Inui(College of Economics, Nihon University)
Toshiyuki MatsuuraUniversity)(The Inst itu te of Economic Research , Hitot subashi
and
Sandra Pocet(Cent re d’Economie de la Sorbonne (CES), University of Par is 1,
Par is School of Economics and CEPII)
August , 2008
The Inst itu te of Economic Research
Hitot subashi University
Kunitach i, Tokyo, 186-8603 J apan

1
The location of Japanese MNCs affiliates: agglomeration, spillovers and firm heterogeneityҰ
Tomohiko Inui∇, Toshiyuki Matsuura• and Sandra Poncet♦
Abstract
This study examines the determinants of location choices of foreign affiliates by
manufacturing Japanese firms, using a new data set that matches parents and their affiliates
created over the years 1995-2003. The analysis is based on new economic geography theory
and thus focuses on the effect of market and supplier access, as well as production and trade
costs. Our interest is twofold. First, we investigate the importance of agglomeration and
spillover effects on the firms’ decision through the use of proxies relating to the presence of
Japanese affiliates in the host countries as well as to that of Japanese multinational firms at
home. Overall, our results confirm the economic importance of information sharing and
network effects both at home and in the host country beside traditional determinants
pertaining to production and transaction costs and access and supply access. Second, we
explore whether the effects of key determinants of locational choice vary substantially
depending on the characteristics of the investing firm and the plant. We find less productive
and smaller parents to be more likely to create an affiliate in China rather than in Western
Europe or an OECD country. Moreover less productive firms appear to be more sensitive to
distance-related costs and low institutional quality while being more responsive to the
presence of Japanese firms and JETRO presence in the host country.
Ұ The METI database used in the paper was prepared and analyzed in cooperation with the Research Institute of Economy, Trade and Industry (RIETI). We would like to Isabelle Méjean for helpful comments. Sandra Poncet gratefully acknowledges the financial support from the Nihon University during her stay in Japan. ∇ Corresponding author: College of Economics, Nihon University. Email: [email protected]. • Institute of Economic Research, Hitotsubashi University. E-mail: [email protected]. ♦ Centre d’Economie de la Sorbonne (CES), University of Paris 1, Paris School of Economics and CEPII. Email: [email protected].
2
1-Introduction
A buoyant literature has recently emerged on the FDI-productivity nexus (see Greenaway and
Kneller (2007) and Helpman (2006) for surveys). The causal effect of internationalization on
Japanese firms’ business performance has been the focus of recent studies (Murakami (2007),
Inui and Todo (2007) and Hijzen, Inui and Todo (2006)). So far, the empirical evidence is
somewhat mixed but findings point to the importance of the context. Recent empirical results
(Sakakibara and Yamawaki (2007), Kiyota et al. (2007) and Ito and Fujao (2006)) suggest
that the profitability of Foreign Direct Investment is conditional on the parents’ and host
countries’ features.
Our study builds on previous literature on the determinants of location choices of foreign
affiliates by Japanese firms (Belderbos and Carree, 2002; Head et al., 1995; Fukao et al. 2003;
Kimura and Kiyota, 2006). Our analysis based on the new economic geography theory
assesses the importance of various determinants of FDI profitability. It focuses on the effect
of market and supplier access, as well as production and trade costs and explores whether the
effects of key determinants of locational choice vary substantially depending on the
characteristics of the investing firm and the plant.
The case of foreign direct investment by Japanese manufacturing firms is interesting since
internationalization of Japanese firms has expanded greatly since the mid-1980s. Reflecting
this increase, a large body of literature on Japan’s outbound foreign direct investment (FDI)
has sprung up which provides interesting benchmark for our results. Moreover, detailed
datasets have been built to examine the behavior of Japanese multinational enterprises. This
study relies on a new data set on Japanese firms that matches affiliates and parents during
1995–2003. We are thus able to determine whether heterogeneous firms respond differently to
host countries features (such proximity, wages, institutional quality or access to markets) or to
networks and spillovers.
Our analysis in closer in spirit to Belderbos and Carree (2002)1 who investigate the
determinants of location of Japanese Electronics Investments in China while focusing on
agglomeration effects and investigating potential heterogeneity in the responses of investors
1 They use a conditional logit model to analyze the influence of regional characteristics on the establishment decisions of 229 Japanese plants in the broadly defined electronics industry in 29 Chinese regions and provinces during 1990-1995.
3
to locational determinants, depending on the characteristics of the investing firm and the
plant.
Our motivation is two-fold. First, we expect our results to shed light on the controversial
productivity-internationalization nexus. It has become something of a stylized fact that ex-
ante productivity determines the choice of whether or not to invest abroad (Greenaway and
Kneller, 2007). This feature is coherent with Helpman et al. (2004)’s assumption that the
decision to establish foreign production facilities is based purely on considerations of market
access. In that context, all FDI is horizontally motivated. However new evidence stresses that
the productivity distribution between multinationals and non multinationals is not so clear cut.
Head and Ries (2003) demonstrate that when there are factor price and market size
differentials, firms invest abroad for vertical motives also and the ordering of the productivity
distribution between multinationals and non-multinationals can even be reversed. Further
investigation of the determinants of location choices is thus required.
Our second motivation relates to the identification of potential informational barriers to
internationalization of Japanese firms. We investigate whether Japanese parents of different
productivity and size respond differently to host countries’ features such as distance,
institutional quality or access to markets and to networks and spillovers. Much evidence
suggests that Japanese affiliates tend to cluster in the same regions. We consider three forms
of relatedness. The first two relate to the host location (1) affiliates in the same industry
originating from the same country (Japan) and (2) downstream affiliates originating from the
same country. The third form (3) captures proximity at home (in the same Japanese
prefecture) to parents having affiliates in the same destination country. Clusters of Japanese
affiliates may form regional production networks, selling intermediate inputs to each other,
sharing knowledge and thereby lowering production costs. We also investigate whether
location choices are influenced by the presence of JETRO.
We interpret findings of greater sensibility to distance or institutional quality for less
productive firms as evidence of greater impediments to internationalization when productivity
is low. Alternatively, greater responsiveness by low productivity firms to the presence of
JETRO or strong Japanese community indicates that networks and spillovers may help to
mitigate those impediments. These features would legitimate policies encouraging
collaboration between Japanese firms and dissemination of information targeted to small and
less productive firms.

4
Our paper contributes to a better understanding of the determinants of affiliates’ location and
especially of the importance of agglomeration forces and spillovers. Our empirical estimation
of firm location choice relies on a model directly derived from the new economic geography
model (Krugman, 1991; Fujita et al. 1999). Our results are based on a comprehensive data set
that covers nearly all the affiliates created by Japanese firms across manufacturing sectors in
54 host countries during the period 1995-2003. Using the information on bilateral trade flows,
sales of Japanese affiliates by country and the Japanese national input/output table we
construct measures of market access and supplier access, which we relate to the location
choice of the affiliates each country and year. We also control for a variety of host country
characteristics: proxies for trade costs include transportation costs and tariff, and proxies for
production costs include country specific wage and risks to international business indicators.
Overall, our results confirm the economic importance of information sharing and network
effects both at home and in the host country beside traditional determinants pertaining to
production and transaction costs and access and supply access. The effects of key
determinants of locational choice vary substantially depending on the characteristics of the
investing firm and the plant. We find less productive and smaller parents to be more likely to
create an affiliate in China rather than in Western Europe or an OECD country. This result
suggests that the choice of investing in further away and more competition intensive markets
is positively correlated with the firm’s productivity. It is rather coherent with recent advances
of the literature explaining FDI decisions by firm-specific features (Helpman et al. 2004).
Moreover less productive firms appear to be more sensitive to distance-related costs and low
institutional quality while being more responsive to the presence of Japanese firms and
JETRO presence in the host country.
The remainder of the paper is organized as follows. The next section outlines the theoretical
framework from which the location choice model estimated in the subsequent sections is
derived, and presents the how access to markets is apprehended. Section 3 describes the data
and how explanatory variables (as well as the dependent variable) are measured. Section 4
investigates the extent to which the location of Japanese MNCs affiliates responds to these
measures and how it depends on the parent’s and affiliate’s specific features. Section 5
concludes.

5
2-Theoretical framework and empirical implementation
We derive our estimating equation from a new economic geography model (Krugman, 1991;
Fujita et al. 1999). Our theoretical framework follows that of Mayer et al. (2007), Head and
Mayer (2004) and Amiti and Javorcik (2007) that describe the expected profits of an affiliate
in each of the prospective locations and compare them to get insight about the equilibrium
number of affiliates in each alternative country (Amiti and Javorcik, 2007) or on the
probability for a firm to invest in a given country (Mayer et al. 2007; Head and Mayer, 2004).
One of our empirical contributions is to integrate in this framework results by Head and Ries
(2003) interacting heterogeneity in firm productivity with heterogeneity of potential host
countries.
The underlying model assumes that firms maximize a profit function subject to uncertainty
when choosing a location.2 While the real underlying profit yielded by alternative locations
cannot be observed, what is observed is the actual choice of each firm and the characteristics
of the alternative locations.3
The theoretical framework underlying the empirical analysis is a reduced version of a
standard New Economic Geography model of monopolistic competition based on Dixit and
Stiglitz (1977), similar to that used by Fujita et al. (1999) and Redding and Venables (2004).
We consider a world with R locations, composed of firms operating under increasing returns
to scale and producing differentiated manufactured products. Consumers’ utility increases
with the number of varieties. The demand for differentiated products is modeled in the usual
symmetric constant elasticity of substitution way, with σ (σ > 1) being the elasticity of
substitution between any pair of products.
2 The deterministic component of the profit function consists of the various attributes of locations that can influence the profitability of building a plant in a particular location. The random component consists of maximization errors, unobserved characteristics of choices or measurement errors. 3 As emphasized by Mayer and Mucchielli (1998), the economic decision studied in theoretical location models is by nature a discrete choice among several alternatives made by individual firms. Turning to empirical matters, the econometric model should therefore ideally have these features too. For this reason, models with a qualitative endogenous variable and particularly conditional logit models have been widely used in the preceding empirical work on industrial location.
6
The final demand for goods in location j (destination) is derived from the maximization of
the representative consumer’s CES utility function.4 Country j ’s demand for a variety
produced in r (origin) is:
1j
rj rjj
Edemand p
Gσ
σ−
−= (1)
where jE is location j ’s total expenditure on manufactured goods and rjp is the price of
varieties from location r sold in j (consisting of the mill price rp and iceberg transportation
costs rjT between the two locations: rj r rjp p T= ). jG is the aggregate price index for
manufactured goods, 1 1
11
Rj r rjr
G n pσ
σ/ −⎡ ⎤−
⎢ ⎥=⎢ ⎥⎣ ⎦
= ∑ , with rn being the number of firms in r .
Taking into account that rjT units must be shipped in order for one unit to arrive, we obtain
the effective demand rjx faced by a firm in r from location j :
1 1 1rj rj rj j j rj r j jx T p G E T p G Eσ σ σ σ σ− − − − −= = (2)
As demonstrated by Redding and Venables (2004), the own price elasticity of demand is σ ,
and the term 1j jG Eσ − shows the position of the demand curve faced by each firm in market j .
This latter is referred to as the “market capacity” of country j . It corresponds to local
expenditure jE adjusted for the “market crowding” effect jG , which summarizes the number
of competing firms and the prices they charge. Intuitively, a greater number of competitors
and thus a lower value of jG will reduce the attractiveness of j for any firm exporting there.
Equation (2) underlines that trade costs influence demand more when the elasticity of
substitution is high. We follow the literature in referring to 1rj rjT σφ −= as the “phi-ness” of
trade (see Baldwin et al., 2003). This can take a value between 0 (when trade costs are
prohibitive) and 1 (when trade costs are negligible).
4 See Fujita et al. (1999) for a complete statement of the underlying model.

7
2.1-The profit equation for foreign affiliates
Each firm sets its mill rice to maximize profits. Following the Dixit-Stiglitz-Krugman model,
we obtain the usual marginal revenue equals marginal cost condition, with the resulting mill
price for each origin r as a simple mark-up over marginal costs of production, rc , which is
region-specific (Head and Mayer, 2004):
1
rr
cp σσ
=−
(3)
All varieties produced in a given region r are thus valued at the same price (before transport
costs). The gross profit earned in each market j for a variety produced in region r is given
by rj r rjp xπ σ= / .
Substituting in equation (3), summing up the profits earned in each market and substracting
the fixed costs rf necessary to establish a plant in region r, we obtain the aggregate net profit,
rΠ to be earned in each potential location r :
1 11r r rj r r rj j j r
j jp x f c G E fσ σσ φ
σ− −⎡ ⎤
⎢ ⎥⎣ ⎦Π = / − = −∑ ∑ (4)
Following the literature we write:
1rj j j rj j r
j jG E m MAσφ φ− = =∑ ∑ (5)
where rMA is the “market access” of region r . This is simply the sum of the market
capacities of all destinations j , jm , weighted by the measure of bilateral trade costs, rjφ ,
between r and j . This summarizes how well a location is endowed with access to markets
for the goods it produces.5
5 As pointed out by Head and Mayer (2006), market access bears a close resemblance to Harris (1954)’s market potential. The difference lies in the fact that Harris’ market potential implicitly treats rG , the price index, as a
constant and rjφ is approximated by 1 rjdist/ . In this sense, the rMA is real, not nominal, since it incorporates the notion that large markets that are extremely well-served by existing firms might offer considerably less potential for profits than smaller markets with fewer competitors around them.
8
Let us define the marginal costs of production, rc , as ,r r i rc w P zξ ζ ψ= , where rw is the wage, ,i rP
is the intermediate input price index in sector i and region r and z is the price of other factors
of production (including transaction costs, business impediments and pecuniary externalities).
Taking the natural logs of equation (4) and allowing all variables to be time varying, we have:
1 2 3 , 4ln ln ln ln lnr r r i r rMA w P zα α α αΠ = + + + (6)
Our theoretical framework thus decomposes the operating profits of affiliates into three main
components: i) Access to relevant markets in terms of demand, ii) various components of
production costs among which the price of intermediates and local wages and iii) transaction
costs and agglomeration effects related to networks. We proxy the price of intermediates by
supplier access (SA) measures. Theory suggests that a lower input price index has a positive
effect on profits. The more input varieties available and the lower the cost of accessing those
varieties are, the lower is the price index and the higher is the profitability. Since individual
input prices are unavailable, we follow Amiti and Javorcik (2007) and Mayer et al. (2007) to
construct an inverse measure of the price index (described below), by measuring the
proximity to potential suppliers. We hypothesize that profits are positively related to better
access to intermediate inputs ( 3α >0).
In our empirical analysis, we include beside access to market and supply access, wages
varying by country. The theory predicts a negative coefficient on wages ( 2α <0), that is other
things equal, firms prefer to locate in countries that offer lower wages. As in the model, we
assume that new entrants are too small individually to influence the local wage, so they take it
as given. The other country specific costs, zr, could include any other factors of production
whose costs vary between countries. We will consider factors affecting costs upward such as
transactions costs (proxied by distance to Japan) and impediments to business practices
(proxied by the International Country Risk Guide (ICRG) index) as well as factors affecting
costs downward such as spillover, agglomeration and network effects.

9
2.2-Specification of the location choice model
We estimate the parameters of the profit function (6) using a discrete choice model. As we do
not observe the potential profitability of each location, we rely upon the assumption that firms
choose the country yielding the highest profit. The location choice literature makes extensive
use of the conditional logit model (CLM). This model requires error terms that are
independent across locations. As it seems likely that the unobserved component of
profitability is correlated among countries in the same continent, we use a generalization that
permits such a structure of the random term, the nested logit model (NLM) (Train, 2003).
This method accounts for the possibility that substitution patterns are not the same across all
alternatives. To this aim, it partitions the set of alternatives into several “nests” corresponding
to continents and assumes nest-specific substitution patterns across alternatives. In our
framework, there are six nests relating to Asia, Western Europe, Rest of Europe, Latin
America, North America and Oceania. Under this nested tree structure, the location choice
can be decomposed into two steps, the choice of a nest and the choice of a location inside the
chosen nest.
For estimation purposes it is useful to decompose the nested model into two logit functions.
The profit function can be split into i) a component W that is constant for all alternative
within a nest and ii) a component Y that varies over alternatives within the nest:
r r k rY W εΠ = + + with k(=Asia, WEurope, OEurope, LAmerica, NAmerica and Oceania) an
index designating the nest in which location r belongs and irε an error which marginal
distribution is univariate extreme value. This random term can be seen as a shock to the
marginal cost specific to firm-country pairs. The probability for country r to be chosen as a
location can be expressed as the product of two probabilities, the probability Pk that an
alternative with nest k is chosen and the conditional probability |r kP for location r to be
chosen among the different countries constituting the chosen nest: |r r k kP P P=
McFadden (1978) shows that with the specified logistic error structure, each of those
probabilities can be expressed using the information contained in kW and rY , with nest-
specific variables used to explain the choice of a nest and location-specific ones explaining
the conditional probability: exp( )k k k kP W Z Zρ= + − where [ ]ln exp k k kkZ W IVρ= +∑ and

10
1| exp( )r k k r kP Y Zρ −= − where 1ln expk k rk
Z Yρ−⎡ ⎤= ⎣ ⎦∑ is termed the inclusive value for state k,
and parameters kρ is the “log-sum coefficient” that reflects the degree of independence
among the unobserved portions of expected profits for alternative nest k.
For 0kρ = , countries are perfect substitutes between continents whereas for 1kρ = there is
full independence and patterns of substitution are the same within and between continents. As
a first step, we constraint both log-sum coefficients to equality and estimate it using the
variability of rY within the nests. As shown by Train (2003), the probability of choosing
country r is exp( )r k rP W Y Z= + − and can be estimated by maximum likelihood techniques
using information entering the profit function. The NLM collapses to the CLM. Then in a
second step, we adopt a more rigorous approach and consider differences between
investments depending on the continent of destination in a more structural way. The choice of
continent is modeled as depending on the continent level of development (average GDP per
capita), its dynamics (growth rate of GDP over thee 5 years before the investment) and
average time difference with Japan. We will show that results are only marginally affected
when estimations rely on the nested logit estimator.
Once a continent is selected, the specific country of location is chosen as to maximize profits.
In coherence with the theoretical model, key determinants are market and supply access as
well as agglomeration and spillover effects that mitigate transaction costs. Next section details
how market access is constructed. In section 3, we describe the data sources and the definition
of the various other variables in our model.
2.3-Market Access computation
Summing the effective demand rjx faced by a firm in r from location j over all products
produced in r (equation 2), we obtain the “trade equation” (Redding and Venables, 2004).
The total value of exports of region r to region j is therefore:
1 1r r rj r r rj j jn p x n p G Eσ σφ− −= (7)
As emphasized by Redding and Venables (2003), this equation for bilateral trade flows
provides a basis for the estimation of a gravity trade model. While the last term on the right-

11
hand side of equation (7) reflects the “market capacity” of region j , 1j j jm G Eσ −= , the first
term, 1r rn p σ− , measures what is referred to as the “supply capacity” of the exporting region,
1r r rs n p σ−= . This corresponds to the product of the number of varieties and their price
competitiveness.6
As shown in equation (5), for each country r , market access is defined as 1
r rj j jjMA G Eσφ −=∑ . Since neither market access itself nor its components, market capacity
( 1j jG Eσ − ) and freeness of trade ( rjφ ), are directly observable, we rely on the two-step
procedure that was pioneered by Redding and Venables (2004). In this approach, the market
capacities, m , of international and national trading partners, as well as transport costs, φ , can
be estimated using a gravity equation.
Taking natural logarithms in equation (7) yields the basic econometric specification used for
the trade equation, so the total value of exports to region j from all firms based in region r is
given by:
ln( ) ln ln ln lnrj r r ij r rj j r rj jX n p x s m FX FMφ φ= = + + = + + (8)
The empirical estimation of equation (8) provides us with estimates of the two components of
market access, freeness of trade and market capacity. Importer fixed effects correspond to the
log of the unobserved market capacity of the importer region j , 1ln ln( )j j j jFM m G Eσ −= = ,
while exporter fixed effects (FXr) capture the log of the exporter’s supply capacity, sr.
Assuming transport costs, rjφ , in our gravity equation depend on bilateral distances7, and a
series of dummy variables indicating whether the two partners r and j share a common
language and colonial links, or are contiguous, equation (8) yields the following trade
regression:
ln ln common language
colonial link contiguity
rj r j rj rj
rj rj rj
X FX FM distδ ϕ
ψ ζ ς
= + + +
+ + + (9)
Equation (9) is estimated separately for each year, yielding country specific estimates of
market capacity and transportation costs to construct country market access. This article 6 Redding and Venables (2003) discuss the concepts of market and supply capacity in greater depth. 7 In equation 9, distrj denotes the great circle distance between r and j.

12
employs the BACI dataset8, a cross-country dataset developed in CEPII covering the period
1995-2003. A detailed description of the original sources and procedures to obtain data is in
Gaulier et al. (2007). Dyadic information (common language, distance, colonial links and
contiguity) come from the CEPII Distances database.
3-Data and variables
3.1-The dependent variable: investments abroad
Our dependent variable consists of investments by Japanese firms. Data on Japanese affiliates
abroad are obtained from the basic survey on Overseas Business Activities conducted
annually by the Ministry of Economy, Trade and Industry (METI).9
More than 15,842 Japanese investments in operation in 2001-2003 are listed in our sample
with corresponding data on when operation started, sector, country of location and other
details on the nature and the objective of the investment. The initial selection of 6,084
Japanese investments10 (initiated over the years 1995-2003) was essentially driven by the
availability of host country data and the necessity to cover only affiliates providing consistent
information over time (notably on the sector of operation, date of entry...). Information on the
affiliates’ parent (such as the location in Japan, size and productivity) is incorporated as the
affiliates dataset is then merged to the Basic survey of Japanese Business Structure and
Activity through the Japanese parent identification code. The strength of the survey is its
sample coverage and the reliability of its information as the survey is compulsory for
manufacturing and non-manufacturing firms with more than 50 employees and with capital of
more than 30 million yen. Its limitation is however that it excludes information on financial
matters and institutional arrangements such as keiretsu.11. In coherence with the theoretical
8 BACI aims to provide the international trade database for the largest number of countries (over 200) and years (from 1995), with a special care in the treatment of unit values. Original procedures are developed to reconcile data reported by countries to United Nations COMTRADE. The data is downloadable from http://www.cepii.fr/anglaisgraph/bdd/baci.htm. 9 We obtain access to the answers for three consecutive years 2001, 2002 and 2003. 10 They include 1,458 investments in the wholesale and retail sector, 1,281 in other services, 93 in the primary sector and 3,252 in the manufacturing sector. 11 The results of the Basic Survey of Japanese Business Structure and Activities are prepared annually by the Research and Statistics Department, METI (1994-2003). This survey was first conducted in 1991, then again in 1994, and annually thereafter. The main purpose of the survey is to capture statistically a comprehensive picture of Japanese corporate firms that includes their diversification-, globalization-, R&D- and information technology-related activities. The survey is compulsory for manufacturing and non-manufacturing firms with

13
model, our empirical estimations will only include affiliates operating in manufacturing
activities. Because some affiliates do not report their parent identity or due to different
inconsistency issues (change in the parent identity, unavailability12 or inconsistency in the
parent statistics), our final sample covers 3,252 Japanese manufacturing investments of which
3,124 provide both host country and parent specific information. Since the information on
parents and affiliates is restricted to the period 2001-2003, our empirical estimations will rely
throughout on the average features over that period.13 Our final dataset covers a universe of
possible location choices to 54 countries.
Further details concerning the data used in the estimations can be found in the data appendix
(Appendix A) which includes Tables A-1 and A-2 reporting the number of Japanese firms by
country and manufacturing sectors14 respectively.
Map 1 uses this data to plot the accumulated number and total employees of Japanese
affiliates as of 2003 in the country where they invested between 1995 and 2003. Several
important features of Japanese investment patterns are immediately apparent: the
concentration in Asia (especially China), the strong attractiveness of US and UK as well as
the quasi absence from the non Asia developing world.
more than 50 employees and with capital of more than 30 million yen (some non-manufacturing sectors such as finance, insurance and software services are not included). The sample firms account for about one-third of the total national workforce, 99 percent of total exports, and 69 percent of total imports for Japan in 2002 (Kiyota and Uruta, 2007). 12 One rationale for missing parent is that the affiliates survey has no sample restriction in terms of firm size or in terms of sectors while the Basic survey of Japanese Business Structure and Activity covers firms above 50 employees and excludes some non-manufacturing sectors such as finance, insurance and software services. 13 One would ideally explain the location decision in a year t by information on the parent and on the affiliates for that year. Unfortunately, the unavailability forces us to use the average value between 2001 and 2003 and implicitly assume that the size of parents and affiliates remain constant throughout time. The explanatory variables concerned by this approach are supply access and backward linkages, as they incorporate the sales value of affiliates. 14 The decomposition into sectors follows a 15-sector nomenclature including Textile, Chemical, Basic Metal, Fabricated metal products, Industry machinery and equipment, Office, service industry and household equipment, Household electric appliances, Electronic data processing machines, Communication equipment, Electronic parts and devices, Miscellaneous electrical machinery, Motor vehicles, parts and accessories, Miscellaneous transportation equipment, Precision instruments and Other Manufacturing.
14
3.2-The explanatory variables
3.2.1 Supply Access
The supplier access effect comes through the price indices of intermediate inputs. As explicit
in the theoretical framework of the NEG, a large number of local suppliers of inputs in a host
country reduced the price index of intermediate inputs, and therefore production costs, which
makes the country more attractive (Krugman and Venables, 1995). Since individual input
prices are unavailable, we follow Amiti and Javorcik (2007) who were the first to
approximate this effect relying on information on the relative availability of inputs and its use
by downward sectors. Our measure of supply access is therefore inspired from Amiti and
Javorcik (2007) but incorporates additional hypotheses as in Mayer et al. (2007) to address the
unavailability of sector-specific value of output data. First, we assume that an affiliate abroad
uses intermediate inputs in the same proportion as forms of its industry in Japan, consequently
the Japanese affiliates’ technical coefficients will be proxied by those from the national
Japanese IO table. Second, our measure of the relative availability of inputs will only account
for the location of Japanese affiliates producers of inputs in the host country. Mayer et al.
(2007) argue that this corresponds restricting to the co-location of these foreign affiliates that
usually work together and neglecting any belonging of these foreign affiliates to the same
MNC. This approach implicitly assumes that Japanese affiliates abroad are more likely to buy
intermediate inputs from other Japanese affiliates or that the location patterns of Japanese
affiliates abroad are a good representation of the distribution of other firms one can source
inputs from.
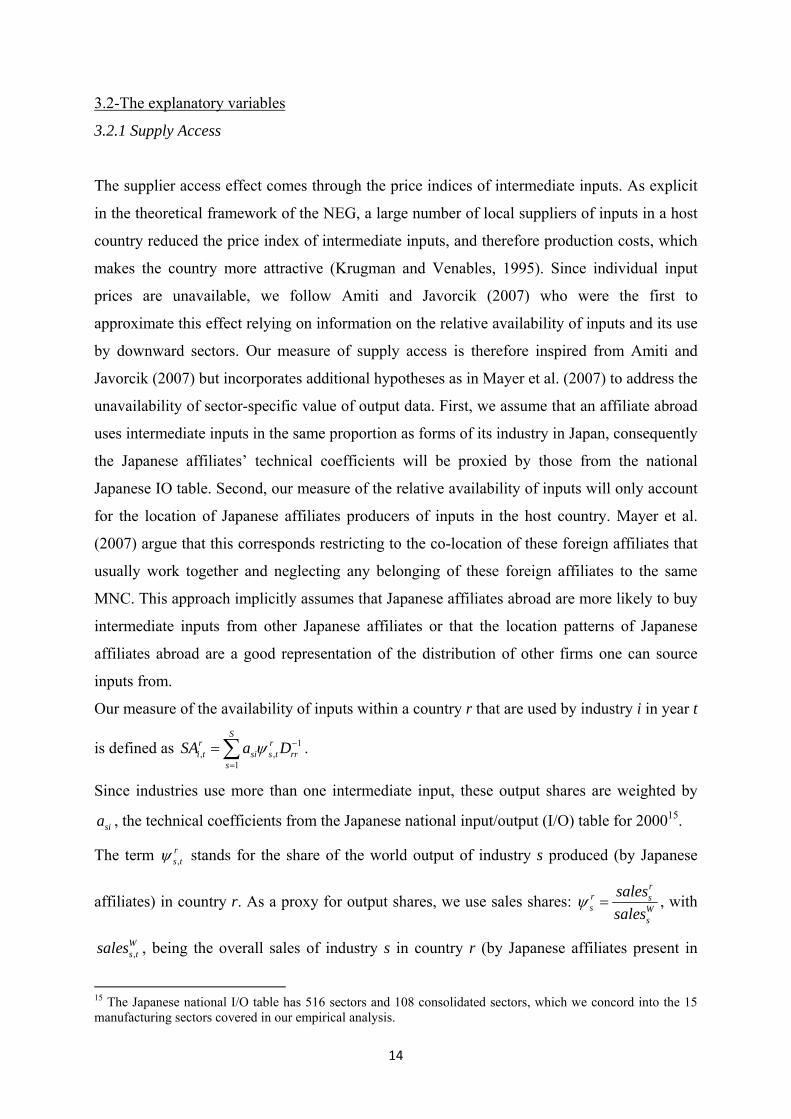
Our measure of the availability of inputs within a country r that are used by industry i in year t
is defined as 1, ,
1
Sr ri t si s t rr
sSA a Dψ −
=
=∑ .
Since industries use more than one intermediate input, these output shares are weighted by
sia , the technical coefficients from the Japanese national input/output (I/O) table for 200015.
The term ,rs tψ stands for the share of the world output of industry s produced (by Japanese
affiliates) in country r. As a proxy for output shares, we use sales shares: r
r ss W
s
salessales
ψ = , with
,Ws tsales , being the overall sales of industry s in country r (by Japanese affiliates present in
15 The Japanese national I/O table has 516 sectors and 108 consolidated sectors, which we concord into the 15 manufacturing sectors covered in our empirical analysis.

15
year t). As argued by Amiti and Javorcik (2007), even though individual prices are
unavailable, the effects should still be well represented since the price index is lower the
higher the share of intermediate inputs produced in close proximity. This measure is divided
by the internal distance of country r, Drr, in order to account for the ease of access to suppliers
inside r. We assume the countries to be circular: as in Leamer (1997), intra national distance
is modeled as the average distance between producers and consumers in a stylized
representation of regional geography, which gives ( )2 /3rr rrD dist area π= = . We lag supplier
access by one year, in order to limit endogeneity. When controlling for other production costs,
supply access is a proxy for a low price index of intermediates in the considered country, and
should therefore enter with a positive sign.
3.2.2 Standard covariates
Our other covariates include the standard determinants of location choice that the theoretical
and empirical literature have found relevant.
The key measure of final demand, industry-level market access 1r rj j jj
MA G Eσφ −=∑ is
computed based on the estimation procedure presented in section (2.3). This variable is
calculated for the year of investment.
Host country distance from Japan and risks to international business (proxied by the index
from the International Country Risk Guide (ICRG)) are also included in order to capture the
extent to which it is easier and cheaper for a Japanese investor to operate its business in a
proximate and business-friendly country. We rely on the composite risk rating for which 0
denotes the highest risk and 100 the lowest risk. The composite index is based on 22 variables
in three subcategories of risk: political, financial, and economic. Those components measure
the level of risk to international business operations present in different countries across the
globe. They include among others government stability, socio-economic conditions, internal
and external conflict, corruption, “law and order” and ethnic tensions.16
16 More information on this data can be found on http://www.prsgroup.com/ICRG_Methodology.aspx.

16
Another key proposed explanation for investing abroad relates to production costs. We follow
the literature and proxy labour costs rw by the level of GDP per capita, which is expected to
enter negatively once demand MAr is controlled for.
Other country/year features relating to agglomeration and spillover effects may have an
impact on the profitability of an affiliate. Global agglomeration effects relating to the number
of producers and suppliers ought to be captured by our MA and SA indicators. They will
account for the effect of positive externalities associated with the proximate location of
downstream and similar manufacturing activities. Such externalities are associated with
greater availability and variety in parts and components (Head and Ries, 1996; Belderbos et
al., 2000).
We investigate the possibility that agglomeration benefits are stronger when the proximate
manufacturers are Japanese-owned. There is some empirical evidence that a Japanese firm
investing in a country where there is already a developed Japanese business “community”
firms will benefit from lower costs there, everything else equal (Belderbos and Carree, 2002).
We construct our indicator of Japanese agglomeration intended to account for the Japanese
presence in a given country at a given period as the total number of affiliates established since
1990 by Japanese firms. It is computed without including information from the affiliate under
scrutiny.
Findings of positive and significant impact of Japanese agglomeration on location choice
benefits may reflect the fact that prospective investors may share useful information on how
to operate manufacturing plants in a country with other experienced Japanese firms.
Belderbos and Carree (2002) argue these greater benefits of clustering can be attributed to
easier information sharing among Japanese firms through joint membership of industry
associations, national preferences for amenities such as schools and restaurants, greater
advantages of proximity due to the use of just-in-time delivery and inventory control systems
(Reid, 1994), and the use of specialized components and intermediates for which the
specifications are developed within long-term supplier–assembler relationships in Japan. One
should note following Mayer et al. (2007) that the count of Japanese firms variable has an
ambiguous effect in theory. While it may capture positive technological spillovers,
agglomeration dynamics as well as unobserved attractive features of countries, a high number
of firms may also mean a high level of local competition for both sales and inputs, which
reduces attractiveness. We anticipate and actually observe that once controlling for country

17
fixed effects that account for previously omitted factors, the negative competition effect
become more powerful, and the coefficient on the variable becomes negative as a
consequence.
We also investigate the economic impact of the presence of a JETRO (Japan External Trade
Organization) agency in the host country17. Findings of a positive impact of the presence of a
JETRO office in the host country on the location choice would suggest positive spillovers
from JETRO services on Japanese investors.
Beside those network effects that are identical for all Japanese investors, there might be some
firm-specific information/transaction costs across countries. In particular, the literature has
highlighted the economic significance of keiretsu networks (Belderdos and Carree, 2002;
Head and Ries, 1996; Smith and Florida, 1994; Mayer and Muchielli, 1998; O’Huallachain
and Reid, 1997; Head et al., 1999; Head and Mayer, 2004; Blonigen et al., 2005).
Unfortunately we have no specific information on whether our affiliates or parents firms
belong to the same vertical keiretsu. We nevertheless attempt to account for linkages between
Japanese firms18 through two indicators relating respectively to the host and home location.
First, we anticipate in line with Venables (1996) that vertical linkages can induce clustering of
suppliers and assemblers in specific locations. It is often argued that numerous suppliers of
Toyota followed the international steps of their downstream partner.
Our strategy to compute a measure of Backward linkages adopts the same hypotheses as for
the Supply Access. It assumes that Japanese affiliates’ technical coefficients can be proxied
by those from the national Japanese IO table and that Japanese affiliates abroad are more
likely to sales their output to other Japanese affiliates (or that the location patterns of Japanese
affiliates abroad are a good representation of the distribution of other firms one can sell
outputs to). Our measure of backward linkages within a country r that apply to firms in
industry i in year t is defined as:
, ,1
Sr ri t si s t
sBL b ψ
=
=∑
17 The list of JETRO offices around the world was taken from http://www.jetro.org/content/97. JETRO provides successful market intelligence information and support to Japanese companies looking for successful entry and expansion abroad. 18 Refer to Kiyota et al. (2007) for a study on the determinants of the backward vertical linkages of Japanese foreign affiliates focusing on the local backward linkages, or local procurements in the host country. While the Market Access indicator should capture demand not only coming from consumers but also from downstream firms, findings of statistically significant backward linkages in the regressions suggest additional effects between Japanese upstream and downstream firms.

18
where sib is the share of output from sector i that is used as an input by sector s taken from the
Japanese national input/output (I/O) table for 2000 and ,rs tψ stands for the share of the world
output of industry s produced (by Japanese affiliates) in country r, defined as in section 3.2.1.
Our second strategy to apprehend firm-specific network effects relates to the presence of FDI
spillovers effects at home in the spirit of what is done in the literature looking at export
behaviour (Bernard and Jensen (2004). Direct evidence of the positive impact of proximity to
other exporters is provided by several papers such as Aitken, Hanson and Harrison (1997),
Greenaway, Sousa and Wakelin (2004), Koenig (2005). Assuming that FDI requires
specialized knowledge of foreign markets that can be shared through employees exchanges or
imitation, one would expect the probability of FDI to be greater for firms surrounded by other
multinationals. We investigate the significance of destination specific FDI spillovers for a
parent investing in a country by the number of surrounding (defined at the prefecture level19)
firms having at least one affiliate in the same host country at the time of entry. The Japanese
prefecture-level FDI spillovers are computed without including information from the parent of
the affiliate under scrutiny, as such it is specific to the FDI project under investigation. We
argue that the FDI spillovers may also help to partially capture spillovers from domestic
kereitsu agglomeration, since kereitsu network firms tend to agglomerate in Japan and thus
that knowledge of foreign market might be shared among kereitsu firms.
We lag our indicators of Japanese agglomeration, backward linkages by one year, in order to
limit endogeneity problems20.
Table A-3 provides summary statistics on our main explanatory variables while Table A-4
reproduces the matrix of their correlation coefficients.
19 The prefectures of Japan are the country's 47 sub-national jurisdictions: one "metropolis" (都), Tokyo; one "circuit" (道), Hokkaidō; two urban prefectures (府), Osaka and Kyoto; and 43 other prefectures (県). A map of the Japanese prefectures can be found on http://en.wikipedia.org/wiki/Prefectures_of_Japan. 20 We investigated the importance of host countries’ infrastructure quality based on indicators taken from the World Bank (http://econ.worldbank.org) such as the density of roads, railways or phone. Results (available upon request) suggest that none of the infrastructure indicators entered in the regression significantly. Since the results for the other determinants remained unmodified but the sample size was reduced due to the limited coverage of infrastructure data we choose not to include these indicators in the paper.

19
4-Empirical estimations
We begin with an investigation of the determinants of the choice of country for locating
Japanese affiliates relying on the conventional specification used in the literature: the
conditional (fixed-effect) logit. We then turn to a nested logit specification in which we first
estimate the choice of country within a given continent and then estimate the choice of
continent taking into account the attractiveness of its constituent countries. Our first main
empirical contribution relates to the investigation of importance of agglomeration forces and
spillovers. Our second contribution corresponds to the analysis of how location determinants
depend on the investing firm and the plant’s features.
4-1 Benchmark estimations
4-1-a Conditional (fixed effect) logit
The first column of Table 1 reports the results of the very simple model of location choice
based on distance to Japan, host country GDP and GDP per capita. Column 2 substitutes
market access to GDP to proxy the demand potential in the destination country while column
3 further includes the proxies for supply access and backward linkages. Our proxy of risks to
international business is further introduced in Column 4.
Colum 5 adds the proxy for Japanese agglomeration, while column 6 further accounts for FDI
spillovers. The coefficients on both variables are positive and significant, also within the same
order of magnitude as other findings in the literature. Results highlight the powerful influence
of Japanese networks both at home and abroad on location choice. Note that introducing these
two indicators simultaneously affects the point estimates of the other motives (possibly
common to firms in the networks) downward which is expected (comparing columns 4 and 6)
though maintaining their respective significance. Column 7, which is our preferred
specification completes the model with a dummy variable aiming at capturing the potential
positive impact of JETRO’s services in the host country. The dummy for the presence of
JETRO in the host country enters with the expected and significant positive sign.
All of the variables have a very significant impact on location choice, explaining 40% of the
difference in location choices of Japanese affiliates between countries. Our results confirm
that profits are negatively related to production and transactions costs. Our proxy for labour
costs (GDP/capita) and the two transaction costs variables (distance and risks to international
20
business) enter in the expected way, negative for the first two and positive for the latter.
Results moreover suggest that location choice is positively related to better access to
intermediate inputs, which are reflected in a lower intermediate input price index, proxied by
rSA ; and that firms are also concerned about good market access, rMA . Market access enters
with the expected sign and its magnitude matches usual findings in the literature. Supply
access always has a significant and positive effect, which is consistent with results by Amiti
and Javorcik (2006) and Mayer et al. (2007): Affiliates tend to be located where it is easier to
find suppliers and outlets. This latter feature is highlighted by the positive and significant
impact of our proxy of Backward Linkages. Findings of positive and significant coefficients
on the three indicators introduced in Columns 5 though 7 provide supportive evidence for the
importance of agglomeration as well as economic spillover effects. With variables taken in
logs (and a large number of location choices), the coefficient on each variable is very close to
elasticities of the probability of choosing a country for the average investor (see Train, 2003).
Estimates in column 7 indicate that a 10% increase in market access and supply access
increases the probability of attracting Japanese investors by about 2 and 1.3% respectively.
The impact of backward linkages, agglomeration and spillover effects is quite similar in
magnitude since a 10% increase in these variables raises the probability of location by 3%.
The probability of investing in a country with a JETRO office is 28%21 higher than that for a
comparable country without JETRO presence.
In the last two columns, we include country fixed effects in the estimation. This accounts for
every characteristic of location countries (some observable, some not) that do not vary over
our time frame, 1995-2003. Distance to Japan and the JETRO variables are naturally dropped
in that specification, which identifies coefficients in the time dimension only. The proxy for
business risks loses its significance possibly due to small time variation of institutions over
the limited period under investigation. We observe an increase in the magnitude of most
coefficients, with the exception of the spillover indicator. However, this does not change the
flavor of our results except concerning the impact of the Japanese agglomeration indicator.22
As anticipated above, we find that once controlling for country fixed effects that account for
previously omitted characteristics that make a country a desirable place to invest for Japanese
21 It corresponds to exp(0.25)-1. 22 As an additional robustness check, we introduced a proxy for the exchange misalignment and/or volatility between the potential affiliate’s location and Japan. We relied on the relative change of the country’s exchange rate with respect to the yen over the 5 years preceding the affiliate creation. It failed to enter significantly in the regressions.

21
investors, the negative competition effect become more powerful, and the coefficient on the
now purged count of Japanese affiliates becomes negative as a consequence.
Comparing the impact of variables should go beyond comparing elasticities (approximated by
coefficients here), since our different variables have different variance as displayed in table
A-3. We follow Head and Mayer (2004) who propose the following thought experiment: Take
a hypothetical country with mean value of explanatory variables and simulate a one standard
deviation shock in the variable of interest (market access say). The ratio of new over baseline
probabilities of being chosen is [1+cv(MA)]βMA, with βMA being the estimated coefficient in
our benchmark estimation (Column 7), and cv(MA) the coefficient of variation of the variable
in question. Carrying this one standard deviation shock exercise gives an increase in the
“mean country”’s probability of being chosen of 27% for market access, 20% for supply
access, 63% for backward linkages, 50% for Japanese agglomeration and 48% for spillovers
at home.
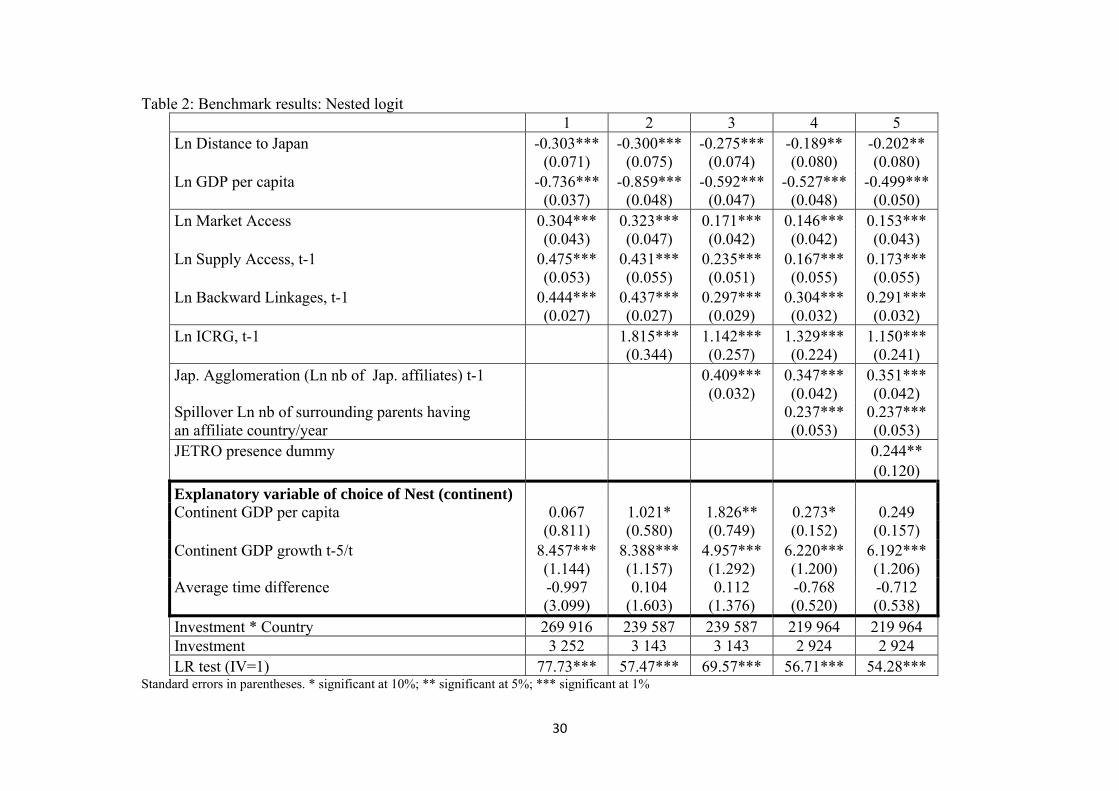
4-1-b Nested logit
We now investigate the problem associated with non-independent errors across nations
belonging to the same region. The use of the country dummies in specifications 8 and 9 in
Table 1 should help to mitigate the problem but it does not resolve problems associated with
cross-industry and inter-temporal differences in the attractiveness of locations. By considering
the choice of continent for a given choice of country, we condition on all aspects of the
continent that do not vary across its constituent countries from the perspective of a given
investor. We consider that the choice of a given region depends on its total size and dynamics
as well as its remoteness. Those three dimensions are proxied by the average continent
development level (GDP per capita), average GDP growth over the 5 year period prior
investment and average time difference with Japan respectively. Results are reported in Table
2. The five columns of the Table 2 reproduce using the nested logit estimator columns 3
though 7 of Table 1. The LR test statistics reported in the last line of the Table reject in all
specifications the null hypothesis of equivalence between nested and conditional logit
specifications. In most specifications, inclusive values are equal to one for all continents while
the reverse is true for the other two nests (Asia and in some cases Other Europe). Nevertheless
signs and magnitude of our coefficients are very similar (compare column 7 of Table 1 and

22
column 5 of Table 2). Overall, our results confirm the economic importance of information
sharing and network effects both at home and in the host country beside traditional
determinants pertaining to production and transaction costs and access and supply access.
4-2 Exploration of location determinants conditionality
One novel contribution of our paper is to explore the possibility that determinants of location
choice are conditional and more specifically depend on the parent’s and affiliate’ s features.
We investigate Helpman et al.’s (2004) argument that FDI decisions depend on firm-specific
features. Preliminary evidence in the case of Japanese firms is provided by Belderbos and
Carree (2002) who investigate the determinants of location of Japanese Electronics
Investments in China and the heterogeneity in the responses of investors to locational
determinants, depending on the characteristics of the investing firm and the plant. We rely on
a two-fold approach to explore the conditionality of location determinants for our much more
complete survey of Japanese overseas business activities.
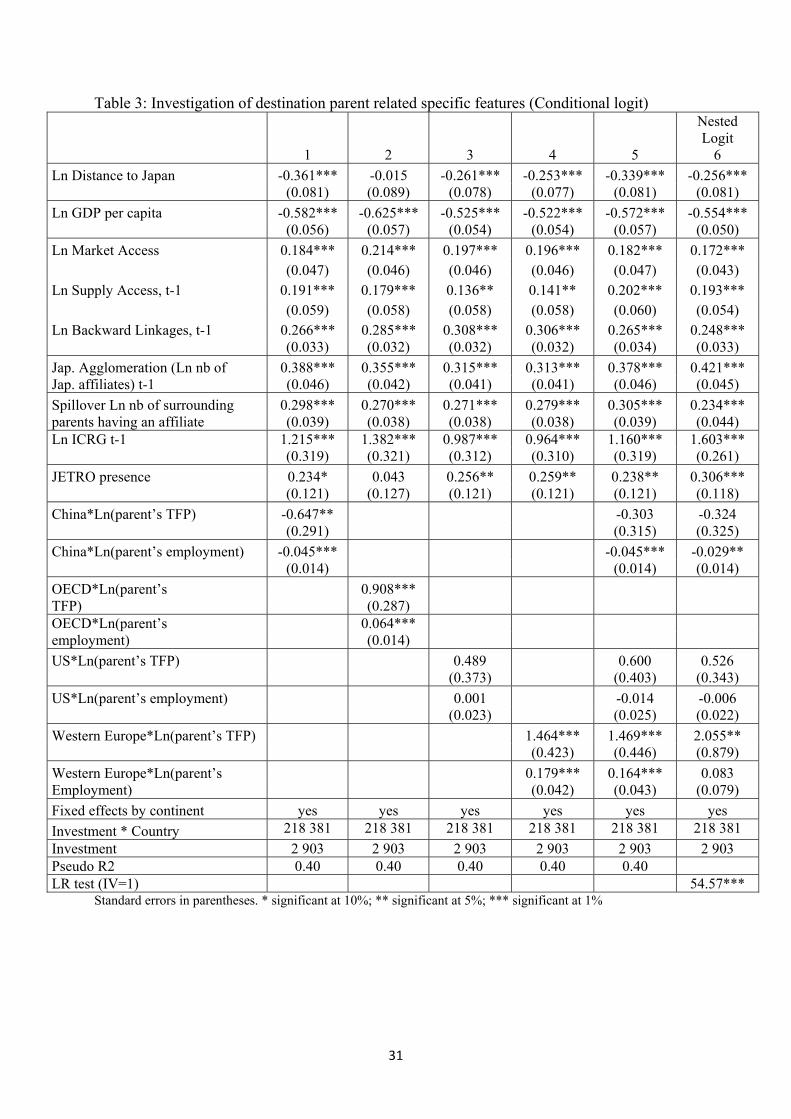
4-2-a Interactive terms between parent’s features and destination
Our first approach is to investigate whether the odds of choosing China, OECD, US or
Western Europe as a destination depend on the parent’s size (proxied by the number of
employees) or TFP. We rely on Hijzen et al (2006) estimates of Japanese firm’s Total Factor
Productivity growth. Their computation follows the method of Good, Nadiri and Sickles
(1997), taking the year 1994 as the base time period. Results displayed in Table 3 suggest that
firms choosing to locate their affiliates in China tend to be less productive and of smaller size.
The picture is exactly opposite as far as location in Western Europe or OECD countries is
concerned. These results suggest that costs associated with Europe and OECD locations are
greater, requiring higher TFP and size to afford them. The US market does not seem to
require higher than average TFP or size. The probability of Japanese firms to investing in
China is much less pronounced when the firm is more productive.
23
4-2-b Sample decomposition depending on affiliate’s and parent’s features
Our second approach corresponds to dividing the sample according to the affiliates’ local
sales ratio and the parent’s size and TFP respectively. These latter two indicators are
measured similarly to the previous sub-section while the local sales ratio of the affiliates
correspond to the average share of sales absorbed in the local market as declared by the
affiliates (over the period 2001-2003). Table 4 displays results based on our benchmark
specification while splitting the dataset between below and above median for the three
affiliate’s and parent’s features enounced above.23 Results are reported successively relying
on the conditional (fixed effects) and nested logit estimators. While coefficients point
estimates are slightly different depending on the estimation method, significant differences
emerge between subsamples that are robust across empirical methodologies. The left hand
side panel of Table 4 explores heterogeneity between affiliates serving local market with a
ratio lower or higher than 92% (the median is rather higher than the mean which is 72%). We
find affiliates with higher local sales ratio to be more sensitive to distance, market access,
supply access and JETRO presence. Greater responsiveness to these four determinants for
affiliates focusing in providing appropriate and cheap products to local customers is quite
logical. Conversely, affiliates with a lower interest in the local market appear to be more
sensitive to Japanese agglomeration. Possibly their activities are mostly in relation with
sourcing from or to other Japanese firms and thus not so dependent on local market (demand
and supply) conditions.
As far as parent’s characteristics are concerned. Limited heterogeneity is found depending on
the size, we nevertheless find below median size parents to respond to a greater extent to the
JETRO presence and to be less sensitive to distance. Turning to TFP cut-off, more productive
parents appear to be less sensitive to almost all determinants than less productive parents,
possibly because their above median productivity mitigates the difficulty pertaining to
distance or outlets constraints. Their location choices seem to valorize to a greater extent
supply access. These findings may relate to the capacity for productive firms to better exploit
competition between suppliers. On the opposite, location decisions by less productive parents
seem to be more sensible to locational advantages such as proximity, market access and
quality of institutions. Moreover, less productive parents are more responsive to Japanese
23 Very similar findings are obtained using the mean as the criteria to split the sample. They are available upon request from the authors.

24
agglomeration as well as the JETRO presence. It is indeed very likely that less productive
firms rely heavily on information networks (from JETRO office and from other Japanese
firms in the host country) to reduce costs of entering and operating in foreign countries.
Overall, our results are quite logical and point to significant heterogeneity in the responses of
investors to locational determinants, depending on the characteristics of the investing firm and
the affiliate. Diversity emanates from the parents’ different strengths and weaknesses: greater
size and TFP appears to mitigate the need for easy outlet (high market access and low
distance) and thus the sensitivity to networks (Japanese agglomeration) and spillovers
(JETRO advices). Conversely, high productive parents seem to make the best out of intense
competition between local suppliers and developed Japanese community.
5-Conclusion
Our study examines the determinants of location choices of foreign affiliates by Japanese
firms, using a new data set that matches affiliates and parents during 1995–2003. The analysis
is based on new economic geography theory thus integrating the effect of market and supplier
access, as well as production and trade costs. We first investigate beside the traditional
determinants of location choice, the importance of agglomeration and spillover effects on the
firms’ decision through the use of proxies relating to the presence of Japanese affiliates in the
host countries as well as to that of Japanese multinational firms at home. The robustness of
out empirical work is ensured through the use of both conditional logit and nested logit
estimations. Our results confirm the economic importance of information sharing and network
effects both at home and in the host country.
Our second contribution corresponds to the exploration of variations in the sensitivity to key
determinants of locational choice depending on the characteristics of the investing firm and
the plant. We find less productive and smaller parents to be more likely to create an affiliate
in China rather than in Western Europe or an OECD country. Moreover less productive
parents appear to be more sensitive to locational advantages such as proximity, market access
and quality of institutions. Also they seem to value more the information networks provided
by JETRO presence and other Japanese affiliates abroad. More productive firms on the

25
opposite tend to be more responsive to supply access. As far as differences pertaining to
affiliates are concerned, our results suggest that affiliates with higher local sales ratio tend to
be more sensitive to distance and also to factors facilitating the provision of products suited to
local customers (market access, supply access and JETRO presence).
26
Reference
Aitken, B, Hanson, G. and Harrison, A (1997), Spillovers, foreign investment and export behavior, Journal of International Economics, vol. 43, pp. 103–32. Amiti Mary and Beata Smarzynska Javorcik, 2007, “Trade Costs and Location of Foreign Firms in China”, Journal of development economics. Forthcoming. Baldwin, Richard, Rikard Forslid, Philippe Martin, Gianmarco Ottaviano, and Frederic Robert-Nicoud, 2003, Economic Geography and Public Policy, Princeton: Princeton University Press. Belderbos René and Martin Carree, 2002, The Location of Japanese Investments in China: Agglomeration Effects, Keiretsu, and Firm Heterogeneity, Journal of the Japanese and International Economies 16, 194–211. Belderbos, R. A., Capannelli, G. and Fukao, K., 2000, Local procurement by Japanese electronics firms in Asia, in “The Role of Foreign Direct Investment in Economic Development” (T. Ito and A. Krueger, Eds.), pp. 9–43, Chicago Univ. Press/NBER, Chicago. Blonigen Bruce A., Christopher L. Ellis and Dietrich Fausten, 2005, Industrial groupings and foreign direct investment, Journal of International Economics, 65, 75-91. Cieślik A. and M. Ryan J., 2004, Explaining Japanese direct investment flows into an enlarged Europe: A comparison of gravity and economic potential approaches, Journal of Japanese International Economies 18, 12–37. Crozet, M., T. Mayer and J.L. Mucchielli, 2004, “How do firms Agglomerate? A Study of FDI in France”, Regional Science and Urban Economics, 34(1): 27-54. Dixit, Avinash K., and Joseph E. Stiglitz, 1977, “Monopolistic Competition and Optimum Product Diversity”, American Economic Review 67, 3, 297-308. Fujita, Masahisa, Paul Krugman, and Anthony J. Venables, 1999, The Spatial Economy: Cities, Regions and International Trade (MIT Press, Cambridge MA. Gaulier, G. et al. (2007), "BACI: A World Database of International Trade Analysis at the Product-level", CEPII Working Paper, 2007. Good, D., M. Nadiri, and R. Sickles (1999), “Index Number and Factor Demand Approaches to the Estimation of Productivity,” in M.H. Pesaran and P. Schmidt eds., Handbook of Applied Econometrics Volume Ⅱ: Microeconomics, pp.14-80. Greenaway D. and R. Kneller, 2007, Firm Heterogeneity, exporting and foreign firect investment, The Economic Journal, 117 (February), F134–F161. Greenaway, D., Sousa, N. and Wakelin, K., 2004, Do domestic firms learn to export from multinationals?, European Journal of Political Economy, vol. 20, pp. 1027–44.
27
Guimarães, P., O. Figueiredo and D. Woodward, 2000, Agglomeration and the Location of Foreign Direct Investment in Portugal, Journal of Urban Economics 47(1): 115-135. Harris, Chauncy D., 1954, “The Market as a Factor in the Localization of Industry in the United States”, Annals of the Association of American Geographers 64, 315-348. Head, K. and T. Mayer, 2006, “Regional Wage and Employment Responses to Market Potential in the EU”, Regional Science and Urban Economics 36(5): 573–594 (lead article). Head, K. and T. Mayer, 2004, “Market Potential and the Location of Japanese Firms in the European Union.” Review of Economics and Statistics 86(4): 959-972. Head, K. and J. Ries, 1996, Inter-city Competition for Foreign Investment: Static and Dynamic effects of China’s Incentive Areas, Journal of Urban Economics 40(1) : 38-60. Head, K. and J. Ries, 2003, "Heterogeneity and the FDI versus Export Decision of Japanese Manufacturers", Journal of the Japanese and International Economies. Head, K., J. Ries and D. Swenson, 1995, “Agglomeration benefits and location choice: Evidence from Japanese manufacturing investments in the United States”, Journal of International Economics 38(3-4): 223-247. Head, K., J. Ries and D. Swenson, 1999, “Attracting foreign manufacturing: Investment promotion and agglomeration”, Regional Science and Urban Economics, 29(2):197-218. Helpman E., 2006, “Trade, FDI, and the Organization of Firms”, Journal of Economic Literature, Vol. XLIV, September, pp. 589–630. Helpman E., M. Melitz and S. Yeaple, 2004, “Export versus FDI with heterogenous firms”, American Economic Review, 94 (1): 300-316. Hijzen A. Tomohiko Inui and Yasuyuki Todo, 2006, The Effects of Multinational Production on Domestic Performance: Evidence from Japanese Firms, RIETI Discussion Paper Series 07-E-006 Ito, Keiko and Kyoji Fukao (2006) “Does Localization Determine the Profitability of Foreign Direct Investment? A Microeconometric Analysis of Japanese Multinational Firms,” mimeo. Kimura F. and K. Kiyota, 2006, “Exports, FDI, and Productivity: Dynamic Evidence from Japanese Firms”, Review of World Economics, Volume 142, Number 4. 695-719. Kiyota K., T. Matsuura, S. Urata and Y. Wei, 2007, “Reconsidering the Backward Vertical Linkages of Foreign Affiliates: Evidence from Japanese Multinationals”, Research seminar in international economics, Gerald R. Ford School of Public Policy, The University of Michigan, Discussion Paper No. 563. Forthcoming in World Development. Kiyota K. and S. Urata, 2007, “The Role of Multinational Firms in International Trade: The Case of Japan”, Japan and the World Economy, forthcoming.

28
Koenig, Pamina, 2005, “Agglomeration and the Export Decision of French Firms”, CREST Discussion Paper 2005-02. Krugman, Paul, 1991, “Increasing Returns and Economic Geography”, Journal of Political Economy 99, 3, 483-499. McFadden, D., 1978, “Modelling the Choice of Residential Location,” in A. Karlquist et al. (eds), Spatial Interaction Theory and Residential Location., pp. 75-96. Amsterdam: North-Holland. Mayer T. and J-L. Mucchielli, 2002, “Hierarchical Location Choice and Multinational Firms’ Strategy: A Nested Logit Model Applied to Japanese Investment in Europe.” in Dunning J. and J-L. Mucchielli eds. Multinational Firms, The Global and Local Dilemma, pp.133-158. London: Routledge. Mayer, T. and J-L. Mucchielli, 1998, “Strategic location behaviour: the case of japanese investments in Europe”, Journal of Transnational Management Development , 3 (3/4): 131-167. Mayer, T., I. Mejean and B. Nefussy, 2007, The location of domestic and foreign production affiliates by French multinational firms, CEPII working paper 2007-07. O’Huallachain, B., and Reid, N., 1997, Acquisition versus Greenfield investment: The location and growth of Japanese manufacturers in the United States, Regional Studies 31(4), 403–416. Redding, Stephen J., and Anthony J. Venables, 2003, “South-East Asian Export Performance: External Market Access And Internal Supply Capacity”, Journal of the Japanese and International Economies 17, 4, 404- 441. Redding, Stephen J., and Anthony J. Venables, 2004, “Economic Geography and International Inequality”, Journal of International Economics 62:1 (2004), 53-82. Reid, N. (1994). Just-in-time inventory control and the economic integration of Japanese-owned manufacturing plants, Reg. Stud. 29, 345–355. Sakakibara, Mariko and Hideki Yamawaki (2007) “What Determines the Profitability of Foreign Direct Investment? A Subsidiary-Level Analysis of Japanese Multinationals,” mimeo, University of California, Los Angeles, forthcoming in Managerial and Decision Economics. Smith, D., and Florida, R. 1994, Agglomeration and industry location: An econometric analysis of Japanese-affiliated manufacturing establishments in automotive-related industries, Journal of Urban Economics 36, 23–41. Venables, A., 1996, Equilibrium locations of vertically linked industries, International Economic Review 80, 465–479.

29
Table 1: Benchmark results: Conditional (fixed-effects) logit 1 2 3 4 5 6 7 8 9 Ln Distance to Japan -0.615*** -1.356*** -0.352*** -0.353*** -0.300*** -0.047 -0.258*** (0.042) (0.041) (0.069) (0.072) (0.074) (0.053) (0.077) Ln GDP per capita -0.287*** -1.442*** -0.777*** -0.897*** -0.654*** -0.396*** -0.525*** -0.940*** -0.866*** (0.017) (0.033) (0.037) (0.043) (0.049) (0.037) (0.053) (0.308) (0.320) Ln GDP 0.838*** (0.019) Ln Market Access 1.329*** 0.361*** 0.371*** 0.244*** 0.058* 0.200*** 1.215*** 1.006*** (0.031) (0.041) (0.043) (0.044) (0.031) (0.046) (0.136) (0.143) Ln Supply Access, t-1 0.434*** 0.384*** 0.175*** 0.219*** 0.134** 0.321*** 0.327*** (0.050) (0.051) (0.055) (0.048) (0.057) (0.080) (0.082) Ln Backward Linkages, t-1 0.441*** 0.440*** 0.317*** 0.308*** 0.308*** 0.281*** 0.285*** (0.027) (0.027) (0.030) (0.029) (0.032) (0.043) (0.046) Ln ICRG, t-1 1.814*** 1.278*** 1.225*** 0.942*** -0.088 0.221 (0.287) (0.284) (0.266) (0.308) (0.430) (0.459) Jap. Agglomeration (Ln nb of Jap. affiliates) t-1 0.406*** 0.350*** 0.322*** -0.586*** (0.037) (0.040) (0.041) (0.143) Spillover Ln nb of surrounding parents having 0.311*** 0.269*** 0.185*** an affiliate country/year (0.036) (0.037) (0.040) JETRO presence dummy 0.252** (0.121) Continent dummies yes yes yes yes yes yes yes n/a n/a Country-specific dummies no no no no no no no yes yes Investment * Country 269 916 269 916 269 916 239 587 239 587 219 964 219 964 239 587 219 964 Investment 3 252 3 252 3 252 3 143 3 141 2 924 2 924 3 143 2 924 Pseudo R2 0.33 0.33 0.39 0.40 0.40 0.40 0.40 0.42 0.41 Standard errors in parentheses. * significant at 10%; ** significant at 5%; *** significant at 1%
30
Table 2: Benchmark results: Nested logit 1 2 3 4 5 Ln Distance to Japan -0.303*** -0.300*** -0.275*** -0.189** -0.202** (0.071) (0.075) (0.074) (0.080) (0.080) Ln GDP per capita -0.736*** -0.859*** -0.592*** -0.527*** -0.499*** (0.037) (0.048) (0.047) (0.048) (0.050) Ln Market Access 0.304*** 0.323*** 0.171*** 0.146*** 0.153*** (0.043) (0.047) (0.042) (0.042) (0.043) Ln Supply Access, t-1 0.475*** 0.431*** 0.235*** 0.167*** 0.173*** (0.053) (0.055) (0.051) (0.055) (0.055) Ln Backward Linkages, t-1 0.444*** 0.437*** 0.297*** 0.304*** 0.291*** (0.027) (0.027) (0.029) (0.032) (0.032) Ln ICRG, t-1 1.815*** 1.142*** 1.329*** 1.150*** (0.344) (0.257) (0.224) (0.241) Jap. Agglomeration (Ln nb of Jap. affiliates) t-1 0.409*** 0.347*** 0.351*** (0.032) (0.042) (0.042) Spillover Ln nb of surrounding parents having 0.237*** 0.237*** an affiliate country/year (0.053) (0.053) JETRO presence dummy 0.244** (0.120) Explanatory variable of choice of Nest (continent) Continent GDP per capita 0.067 1.021* 1.826** 0.273* 0.249 (0.811) (0.580) (0.749) (0.152) (0.157) Continent GDP growth t-5/t 8.457*** 8.388*** 4.957*** 6.220*** 6.192*** (1.144) (1.157) (1.292) (1.200) (1.206) Average time difference -0.997 0.104 0.112 -0.768 -0.712 (3.099) (1.603) (1.376) (0.520) (0.538) Investment * Country 269 916 239 587 239 587 219 964 219 964 Investment 3 252 3 143 3 143 2 924 2 924 LR test (IV=1) 77.73*** 57.47*** 69.57*** 56.71*** 54.28***
Standard errors in parentheses. * significant at 10%; ** significant at 5%; *** significant at 1%
31
Table 3: Investigation of destination parent related specific features (Conditional logit)
1 2 3 4 5
Nested Logit
6 Ln Distance to Japan -0.361*** -0.015 -0.261*** -0.253*** -0.339*** -0.256*** (0.081) (0.089) (0.078) (0.077) (0.081) (0.081) Ln GDP per capita -0.582*** -0.625*** -0.525*** -0.522*** -0.572*** -0.554*** (0.056) (0.057) (0.054) (0.054) (0.057) (0.050) Ln Market Access 0.184*** 0.214*** 0.197*** 0.196*** 0.182*** 0.172*** (0.047) (0.046) (0.046) (0.046) (0.047) (0.043) Ln Supply Access, t-1 0.191*** 0.179*** 0.136** 0.141** 0.202*** 0.193*** (0.059) (0.058) (0.058) (0.058) (0.060) (0.054) Ln Backward Linkages, t-1 0.266*** 0.285*** 0.308*** 0.306*** 0.265*** 0.248*** (0.033) (0.032) (0.032) (0.032) (0.034) (0.033) Jap. Agglomeration (Ln nb of 0.388*** 0.355*** 0.315*** 0.313*** 0.378*** 0.421*** Jap. affiliates) t-1 (0.046) (0.042) (0.041) (0.041) (0.046) (0.045) Spillover Ln nb of surrounding 0.298*** 0.270*** 0.271*** 0.279*** 0.305*** 0.234*** parents having an affiliate (0.039) (0.038) (0.038) (0.038) (0.039) (0.044) Ln ICRG t-1 1.215*** 1.382*** 0.987*** 0.964*** 1.160*** 1.603*** (0.319) (0.321) (0.312) (0.310) (0.319) (0.261) JETRO presence 0.234* 0.043 0.256** 0.259** 0.238** 0.306*** (0.121) (0.127) (0.121) (0.121) (0.121) (0.118) China*Ln(parent’s TFP) -0.647** -0.303 -0.324 (0.291) (0.315) (0.325) China*Ln(parent’s employment) -0.045*** -0.045*** -0.029** (0.014) (0.014) (0.014) OECD*Ln(parent’s 0.908*** TFP) (0.287) OECD*Ln(parent’s 0.064*** employment) (0.014) US*Ln(parent’s TFP) 0.489 0.600 0.526 (0.373) (0.403) (0.343) US*Ln(parent’s employment) 0.001 -0.014 -0.006 (0.023) (0.025) (0.022) Western Europe*Ln(parent’s TFP) 1.464*** 1.469*** 2.055** (0.423) (0.446) (0.879) Western Europe*Ln(parent’s 0.179*** 0.164*** 0.083 Employment) (0.042) (0.043) (0.079) Fixed effects by continent yes yes yes yes yes yes Investment * Country 218 381 218 381 218 381 218 381 218 381 218 381 Investment 2 903 2 903 2 903 2 903 2 903 2 903 Pseudo R2 0.40 0.40 0.40 0.40 0.40 LR test (IV=1) 54.57***
Standard errors in parentheses. * significant at 10%; ** significant at 5%; *** significant at 1%

32
Table 4: Results depending on parents and affiliates features: local sales content of affiliates and size and TFP of parent (Conditional & nested logit)
Affiliates local sale ratio Parent’s size (number of employees) Parent’s Total Factor Productivity Conditional Logit Nested Logit Conditional Logit Nested Logit Conditional Logit Nested Logit
Higher than
median
Lower than
median
Higher than
median
Lower than
median
Higher than
median Lower than
median
Higher than
median
Lower than
median
Higher than
median
Lower than
median
Higher than
median
Lower than
median 1 2 3 4 5 6 7 8 9 10 11 12 Ln distance -0.341*** -0.161 -0.271*** -0.091 -0.282*** -0.201 -0.216** -0.174 -0.207** -0.344*** -0.223** -0.283** (0.098) (0.127) (0.100) (0.113) (0.091) (0.147) (0.095) (0.162) (0.104) (0.116) (0.106) (0.112) Ln GDP per capita -0.555*** -0.498*** -0.520*** -0.577*** -0.550*** -0.467*** -0.503*** -0.476*** -0.509*** -0.547*** -0.488** -0.543*** (0.070) (0.084) (0.064) (0.071) (0.063) (0.102) (0.059) (0.093) (0.070) (0.084) (0.072) (0.073) Ln Market Access 0.274*** 0.098 0.219*** 0.138** 0.207*** 0.179** 0.143*** 0.158** 0.144** 0.270*** 0.121* 0.243*** (0.060) (0.070) (0.056) (0.059) (0.054) (0.086) (0.050) (0.079) (0.061) (0.070) (0.062) (0.063) Ln Supply Access, t-1 0.177** 0.031 0.214*** 0.104 0.103 0.212* 0.142** 0.245** 0.173** 0.074 0.193*** 0.183** (0.073) (0.094) (0.070) (0.070) (0.067) (0.113) (0.065) (0.110) (0.076) (0.0887) (0.074) (0.080) Jap. Agglo (Ln nb of Jap. aff.) t-1 0.268*** 0.435*** 0.261*** 0.531*** 0.330*** 0.273*** 0.365*** 0.292*** 0.275*** 0.403*** 0.330*** 0.394*** (0.051) (0.069) (0.051) (0.052) (0.048) (0.077) (0.052) (0.074) (0.052) (0.066) (0.063) (0.057) Ln Backward Linkages, t-1 0.308*** 0.309*** 0.304*** 0.239*** 0.301*** 0.333*** 0.283*** 0.325*** 0.334*** 0.262*** 0.318*** 0.240*** (0.040) (0.053) (0.041) (0.046) (0.036) (0.064) (0.038) (0.065) (0.041) (0.050) (0.042) (0.049) Spillovers Ln nb of aff created by 0.243*** 0.286*** 0.262*** 0.111*** 0.282*** 0.262*** 0.260*** 0.203** 0.287*** 0.241*** 0.194*** 0.190*** surrounding firms (country/year) (0.048) (0.061) (0.054) (0.034) (0.045) (0.070) (0.067) (0.080) (0.049) (0.058) (0.069) (0.050) Ln ICRG t-1 0.925** 1.071** 1.115*** 1.584*** 1.035*** 0.886 1.185*** 1.165** 0.591 1.461*** 0.478 1.458*** (0.394) (0.501) (0.307) (0.318) (0.360) (0.609) (0.292) (0.521) (0.398) (0.496) (0.403) (0.331) JETRO presence 0.326** 0.099 0.302** 0.080 0.148 0.573** 0.141 0.556** 0.119 0.419** 0.131 0.407** (0.152) (0.198) (0.153) (0.198) (0.139) (0.250) (0.139) (0.250) (0.164) (0.179) (0.164) (0.178)
Observations: Investment* Country 136 165 83 799 136165 83799 157 317 61 064 157317 61064 122 7640 95 617 122 7640 95 617 Investment 1811 1113 1811 1113 2091 812 2091 812 1632 1271 1632 1271 Pseudo R2 0.39 0.42 0.40 0.41 0.39 0.41
Standard errors in parentheses. * significant at 10%; ** significant at 5%; *** significant at 1%

33
APPENDIX A Table A-1 Explanatory variable: creation of affiliates 1995-2003 (by sector)
Sector Name Number of
projects 1 Textile 124 2 Other Manufacturing 553 3 Chemical 467 4 Basic Metal 166 5 Fabricated metal products 100 6 Industry machinery and equipment 306 7 Office, service industry and household eqt 32 8 Household electric appliances 61 9 Electronic data processing machines, 65
10 Communication equipment 166 11 Electronic parts and devices 271 12 Miscellaneous electrical machinery 194 13 Motor vehicles, parts and accessorise 614 14 Miscellaneous transportation equipment 32 15 Precision instruments 101
Total 3,252 Map 1: Cumulated number of affiliates created between 1995 and 2003 and number employees (2002)
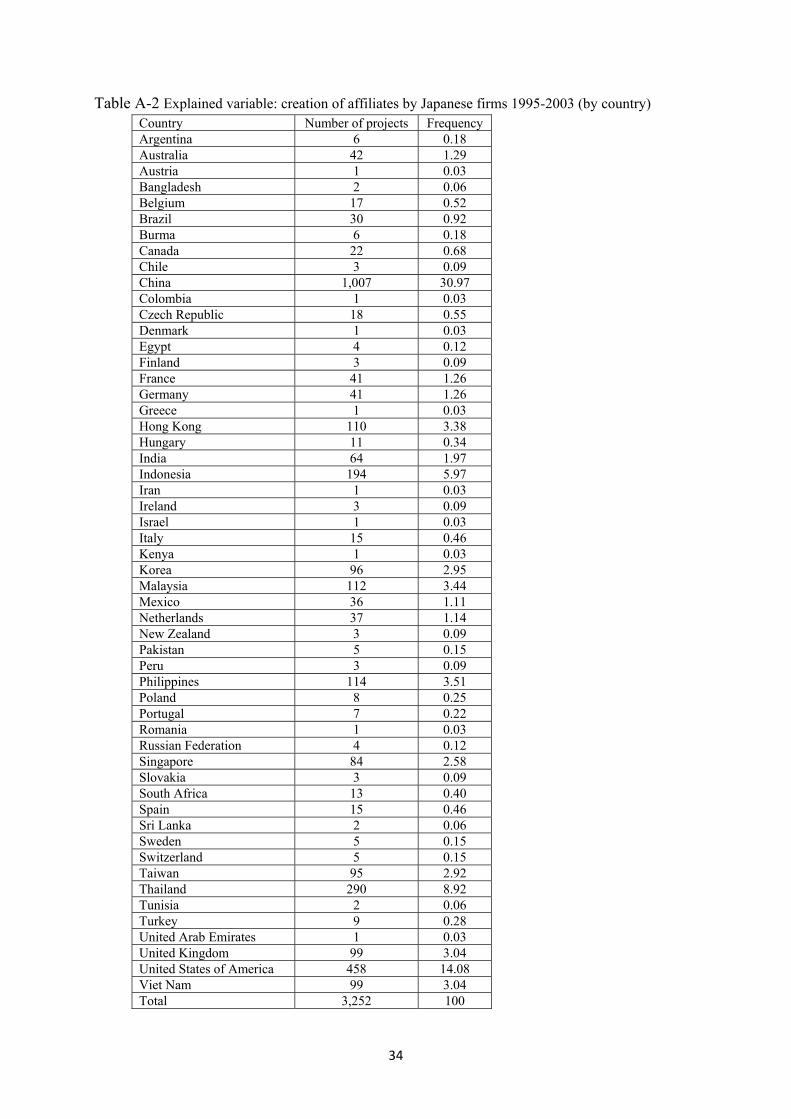
34
Table A-2 Explained variable: creation of affiliates by Japanese firms 1995-2003 (by country) Country Number of projects Frequency Argentina 6 0.18 Australia 42 1.29 Austria 1 0.03 Bangladesh 2 0.06 Belgium 17 0.52 Brazil 30 0.92 Burma 6 0.18 Canada 22 0.68 Chile 3 0.09 China 1,007 30.97 Colombia 1 0.03 Czech Republic 18 0.55 Denmark 1 0.03 Egypt 4 0.12 Finland 3 0.09 France 41 1.26 Germany 41 1.26 Greece 1 0.03 Hong Kong 110 3.38 Hungary 11 0.34 India 64 1.97 Indonesia 194 5.97 Iran 1 0.03 Ireland 3 0.09 Israel 1 0.03 Italy 15 0.46 Kenya 1 0.03 Korea 96 2.95 Malaysia 112 3.44 Mexico 36 1.11 Netherlands 37 1.14 New Zealand 3 0.09 Pakistan 5 0.15 Peru 3 0.09 Philippines 114 3.51 Poland 8 0.25 Portugal 7 0.22 Romania 1 0.03 Russian Federation 4 0.12 Singapore 84 2.58 Slovakia 3 0.09 South Africa 13 0.40 Spain 15 0.46 Sri Lanka 2 0.06 Sweden 5 0.15 Switzerland 5 0.15 Taiwan 95 2.92 Thailand 290 8.92 Tunisia 2 0.06 Turkey 9 0.28 United Arab Emirates 1 0.03 United Kingdom 99 3.04 United States of America 458 14.08 Viet Nam 99 3.04 Total 3,252 100

35
Table A-3: Summary statistics on explanatory variables Variables Mean Standard Error Minimum Maximum Distance to Japan 9 771 3 951 1 157 18 587 GDP per capita 8 678 9 849 212 38 509 Market Access 4.84e+11 1.12e+12 1.63e+09 9.13e+12 Supply Access, t-1 2.29e-06 6.69e-06 0 0.000071 Backward Linkages, t-1 0.013 0.05 0 0.56 Jap. Agglomeration (Ln nb of Jap. affiliates) t-1 79 205 1 2125 Spillover Ln nb of surrounding parents having an affiliate 2.21 7.14 0 91
Table A-4: Correlation Matrix of explanatory variables
Ln distanceLn GDP per
capita Ln Market
Access Ln 1+Supply Access, t-1
Jap. Agglo (Ln nb of Jap. aff.) t-1
Backward linkages
Ln distance 1 Ln GDP per capita 0.6058 1 Ln Market Access 0.2994 0.8061 1 Ln 1+Supply Access, t-1 -0.3954 0.0543 0.3952 1 Jap. Agglo (Ln nb of Jap. aff.) t-1 -0.3898 -0.1174 0.2676 0.8557 1 Backward linkages t-1 0.0333 0.3289 0.5788 0.8034 0.7410 1 Spillover Ln nb of surrounding parents having an affiliate (country/year) -0.2541 -0.1412 0.0630 0.4535 0.4646 0.3578