disobolus from chuska mountain and defiance plateau drainages · dna extraction and data generation...
TRANSCRIPT

A POPULATION GENETIC EVALUATION OF BLUEHEAD SUCKER (CATOSTOMUS
DISOBOLUS) FROM CHUSKA MOUNTAIN AND DEFIANCE PLATEAU DRAINAGES
(AZ/ NM) AND THE ZUNI RIVER (NM)
Final Report
Principal Investigators:
Dr. Marlis R. Douglas1,2
PH: 479-575-4176 Email: [email protected]
Dr. Michael E. Douglas1,2
PH: 479-575-6343 Email: [email protected]
Dr. Whitney J.B. Anthonysamy2
PH: 217-333-6896 Email: [email protected]
Dr. Mark A. Davis2 PH: 217-333-6896
Email: [email protected]
Mr. Max R. Bangs1 PH: 479-575-7413
Email: [email protected]
1Department of Biological Sciences Science-Engineering 601
University of Arkansas Fayetteville AR 72701
2Illinois Natural History Survey Prairie Research Institute
University of Illinois – Urbana/ Champaign Champaign IL 61820
Contact Person: Dr. Marlis R. Douglas

1
TABLE OF CONTENTS
Executive summary ............................................................................................. 2 Introduction .......................................................................................................... 4 Methods ................................................................................................................. 7
Study organism ............................................................................................. 7
Sample collection ........................................................................................... 8
DNA extraction and data generation ............................................................. 9
Mitochondrial (mt)DNA diversity .................................................................... 9
Microsatellite (msat) DNA diversity .............................................................. 10
Assignment tests and derivation of population structure ............................. 10
Results ............................................................................................................. 13
Mitochondrial (mt)DNA diversity and phylogeography ................................ 13
Key results from mtDNA analyses ............................................................... 14
Microsatellite (msat) DNA diversity and population isolation ....................... 14
Assignment tests and population structure .................................................. 15
Key results from msat DNA analyses ........................................................... 16
Data from previous studies .......................................................................... 17
Discussion .......................................................................................................... 18 Results with management implications from mtDNA analyses ..................... 19
Results with management implications from msat DNA analyses ................ 20
Comparison of our results with other studies ................................................ 22
Overall summary and conclusions for management ..................................... 23
Acknowledgments.............................................................................................. 24 Literature Cited ................................................................................................... 25 Tables .................................................................................................................. 28
Figures ................................................................................................................ 35

2
EXECUTIVE SUMMARY
The purpose of this study was to genetically evaluate Bluehead Sucker
(Catostomus discobolus) from drainages on the Navajo Nation (Defiance Plateau and
Chuska Mountains) and in the Zuni River drainage. Bluehead Sucker from the Zuni River
had been recognized as a distinct subspecies (C. d. yarrowi), whereas populations on
the Defiance Plateau and in the Chuska Mountains were considered the nominal
subspecies (C. d. discobolus).
Our objectives in genetically evaluating Bluehead Sucker from the Navajo Nation
and the Zuni River were:
(1) To identify evolutionary lineages (ESUs) and management units (MUs);
(2) To assess levels of gene flow and degree of isolation among populations;
(3) To integrate our results within a range-wide perspective of Bluehead Sucker
and to contrast them with other studies previously completed.
We obtained 340 samples representing Bluehead Sucker in the three study areas
and employed mitochondrial DNA sequence analysis in combination with microsatellite
DNA analysis to identify evolutionary lineages and management units. Results were then
contrasted against our basin-wide data set of Bluehead Sucker.
Key Results from mtDNA analyses:
(1) Zuni River, Defiance Plateau and Chuska Mountain share a common mtDNA
haplotype, which falls within Bluehead Sucker ESU-2 (Colorado River lineage).
(2) Chuska Mountain harbors a second haplotype that is not found elsewhere, but it also
falls within Bluehead Sucker ESU-2.

3
(3) Introgression by Rio Grande Sucker was only detected at the Rio Nutria site, and was
restricted to a single haplotype in a single individual. None of the sites on Navajo
Nation land showed Rio Grande Sucker mtDNA haplotypes.
Key Results from Microsatellite DNA analyses:
(1) The Zuni River, Defiance Plateau and Chuska Mountains each represent a distinct
gene pool, with no gene flow among them.
(2) Sites within the Zuni River and on the Defiance Plateau reflect similar patterns of
genetic diversity. Sites within the Chuska Mountains exhibit among-site genetic
differences, but appear to be connected via gene flow.
(3) Overall, genetic diversity fin all three regions (1) is low-to-moderate, suggesting they
are isolated.
(4) Genotypes from the Rio Nutria (Zuni River) show affinity with the Rio Grande Sucker,
suggesting historic introgression and an admixed origin of this population. No
admixture was detected in the other two sites in the Zuni River.
(5) In summary, all three regions described in (1) are unique, and each represents a
management unit (MU) for Bluehead Sucker. The Zuni River and Chuska Mountains
drainage were previously identified as MUs in Hopken et al. (2013) but samples
representing the Defiance Plateau are new additions to the database and represent a
previously unrecognized MU (i.e. MU10).
(6) Genotypes that define the Zuni Bluehead Sucker [Catostomus (Pantosteus)
discobolus yarrowi] are not found in the Defiance Plateau and Chuska Mountains
drainages and it would be scientifically incorrect to designate those areas on the
Navajo Nation as being components of the Zuni Bluehead Sucker distribution.

4
INTRODUCTION
Threatened and endangered (T&E) species were recognized (Holycross and Douglas
2007) as a series of disjunct and demographically constrained populations with low
numbers and without the gene flow that normally promotes homogenization (i.e., ‘small
population paradigm’; Caughley 1994). The impaired demographic status of T&E
species can propel them into an inbreeding spiral that initially curtails individual survival
and fecundity, and ultimately population sizes. Once this process (i.e., the ‘extinction
vortex’; Gilpin and Soule 1986) is initiated, it becomes self-sustaining and most often
leads to extirpation. Here, one can clearly visualize the conservation importance of
legally protecting these groups as state and/ or federally ‘endangered’ (see below).
For the purposes of adaptive management, federal, state, and tribal biologists
work to group populations of T&E species into cohesive units (Sites and Crandall 1997;
Haig et al. 2003). Implicit to this process is the identification of both historic and
contemporary connectedness amongst these populations, in essence, a network that
was maintained in the past but has subsequently dwindled as their habitats fragmented
(Waser and Strobeck 1998). If prior connectedness for these populations can be
established, their genealogical relationships can be more accurately determined and
their conservation management plans specifically formulated. Yet these tasks are
difficult to accomplish, and for a variety of reasons.
Direct measures of population connectedness, for example, are quite
problematic to derive. Several traditional methods are available, but all can be faulted to
varying degrees. For instance, mark/ recapture studies (particularly those conducted on
fishes) are time-consuming, expensive, and extend over lengthy (multi-year) durations
so as to garner appropriate data for accurate estimates (Douglas and Marsh 1996, 1998).
A second direct measure would be to radio-track individuals so as to ascertain home
ranges and patterns of dispersal by gender. But this technique is also problematic in that
it is surgically invasive, hobbled by small sample sizes, with limited radio frequencies,
and yields data that are both meager and statistically dependent.

5
In addition, none of the traditional measures actually reflect gene flow per se (i.e.,
the level of population connectedness we seek), but rather, depict the generalized
process of dispersal. The major difficulty for this process is that migrant individuals must
not only locate and reproduce in new populations (itself a difficult task), but their progeny
must also survive as well to adulthood, and then be resampled. This often fails, even
when ‘best-case’ scenarios are provided (Douglas and Brunner 2002).
Rather, a more modern and data-rich approach would be to evaluate gene flow
and dispersal within and among populations by directly quantifying distributions of
genetic ‘alleles’ (i.e., alternative forms of the same gene or genetic region) (Berry et al.
2004). Here, microsatellite (msat) DNA has shown great versatility for it has rapid
mutation rates and, given this, often yield large numbers of alleles. Msats are thus well
suited to examine the genetic or demographic structure of wild populations, or to
differentiate (for example) among hatchery vs wild populations and their hybrids
(Douglas and Douglas 2010). This methodology also promotes an enumeration of
abundances by employing mark-recapture methods (as above), but utilizing alleles as
‘genetic tags’ (Palsbøll 1999), rather than the more cumbersome and laborious approach
of artificially injecting into an individual a PIT tag (Douglas and Marsh 1996, 1998), or
surgically inserting within it a radio-transmitter (Reed and Douglas 1998).
Newer approaches to data analysis are also being rapidly and efficiently
invented with regard to genetic analyses, and this in turn promotes the development of
relevant software. For example, Bayesian or coalescent-based analyses are now
available that not only assign individuals to populations (Pritchard et al. 2000), but also
quantify movements by first- or second-generation individuals among populations across
landscapes or riverscapes (Wilson and Rannala 2003).
In this study, we applied coalescent and Bayesian analyses of mitochondrial (mt)
and microsatellite (msat) DNA to infer contemporary vs historic gene flow and
demographic parameters in Bluehead Sucker (Catostomus discobolus discobolus) from

6
two distinct biogeographic regions on the Navajo Nation (i.e., Defiance Plateau drainage
of the upper Little Colorado River; Chuska Mountains drainage of the San Juan River).
We then compared these data with those obtained from Bluehead Sucker (Catostomus
discobolus yarrowi) in the Zuni River drainage (upper Little Colorado River), to test for
presence of evolutionary significant units (ESUs) and management units (MUs) [where
ESUs are recognized as populations with long histories of genetic separation, while MUs
currently exchange so few individuals they are demographically independent regardless
of past connectivity (Avise 2000)]. We were particularly interested in determining the
genetic signatures of these populations and how congruent they are one to another. We
also evaluated our data for evidence of hybridity with other suckers that are (or were)
contemporaneous with Bluehead Sucker in our study basins.
This study is particularly germane given the Zuni Bluehead Sucker (Catostomus
discobolus yarrowi) is currently listed as ‘endangered’ under the 1975 Wildlife
Conservation Act of New Mexico (19 NMAC 33.1; Propst 1999), primarily because its
capacity to persist and reproduce within the state is now impeded as a result of habitat
modifications and predation by non-native fishes (Carman 2004). Furthermore, on 25
January 2013, the U.S. Fish and Wildlife Service (= Service) published a proposed
notice that would elevate the Zuni Bluehead Sucker to ‘endangered status’ under the U.S.
Endangered Species Act (ESA 1973), with an additional proposed designation of its
critical habitat. The Service also contends that Bluehead Sucker found on the Navajo
Nation are actually Zuni Bluehead Sucker (C. discobolus yarrowi) rather than the
nominate form of Bluehead Sucker (C. discobolus discobolus) that is more broadly
distributed within the Colorado River Ecosystem.

7
METHODS
Study organism: The Bluehead Sucker belongs to a clade of specialized suckers
(Family Catostomidae; subgenus Pantosteus) distinguished morphologically by broad
disc-shaped lips and cartilaginous scraping ridges on both jaws (Cope 1874). It is native
to western North America and has a broad distribution spanning multiple river basins
(Smith 1966, Smith et al. 2013). Two subspecies are recognized: C. d. discobolus and C.
d. yarrowi. The former ranges from the headwaters of the Green and Colorado rivers to
the Grand Canyon in Arizona (Figure 1). Disjunct populations exist in the Bear and
Weber rivers of the Bonneville Basin and a few headwater tributaries in the Snake River
Basin (Smith 1966). The second subspecies, C. d. yarrowi (Cope 1874), is restricted to
headwater tributaries of the Zuni River in New Mexico. Baird and Girard (1854) also
described the Rio Grande Sucker (Catostomus plebeius) from the Rio Grande in NM.
Catostomus discobolus is herbivorous, highly adaptable and able to thrive in a
variety of habitats, which likely facilitates its wide distribution (Smith 1966). It generally
prefers higher gradient, cobble substrate streams, but also can exist in low elevation
mainstems (Minckley 1991). Like most indigenous fishes of the Colorado River, C.
discobolus enters tributaries spring-through-summer and spawns April-through-May
(Maddux and Kepner 1988). However, gravid females and newly hatched fry have been
caught as early as February and as late as October (Douglas and Douglas 2000). Adults
mature at 2-4 years and can live up to 20 years in larger rivers (Minckley 1991).
Conversely, individuals in small tributaries, such as the Zuni Bluehead Sucker, mature
within the first year and have a maximum age of five years (Propst et al. 2001).
Despite a widespread distribution, anthropogenic habitat alterations have
provoked population declines and C. d. discobolus currently occupies only 45% of its
historic range (Bezzerides and Bestgen 2002). Impoundments, habitat loss and
introduction of non-native species are the most serious threats. Consequently, C. d.
discobolus is considered a ‘species of special concern’ in Arizona, Colorado, Idaho, Utah,
and Wyoming (Wyoming Game and Fish 2005). In New Mexico, C. d. yarrowi is listed as

8
endangered and occurs as small isolated populations in a few headwater tributaries
comprising a fraction of its historic range (Propst et al. 2001).
Several studies (Smith 1966, Smith et al. 1983, 2013) have argued that the Zuni
Bluehead differs from the Bluehead sucker in possessing a mosaic of traits reflecting
introgression by the Rio Grande Sucker (C. plebeius). These authors concluded that
Zuni Bluehead Sucker is also found further downstream in the upper Little Colorado
River, including Kin Li Chee Creek. Crabtree and Buth (1987) argued that introgression
in the Zuni Bluehead Sucker is isolated solely to the Rio Nutria, and other designated
populations of Zuni Bluehead Sucker in the upper Little Colorado River are not
introgressed but are indeed different from other Bluehead Sucker.
The taxonomic validity of the Zuni Bluehead Sucker remains in question, as does
its distribution not only within the upper Little Colorado River, but across the drainages of
the eastern Colorado Plateau.
Sample Collection: Fin clips were sampled from 368 Bluehead Sucker at 11 sites in the
Zuni River (NM) and on the Navajo Nation (AZ/ NM) (Figure 2, Table 1). Zuni River
samples represent the Zuni Bluehead Sucker (C. discobolus yarrowi) and were collected
from 3 sites: Agua Remora, Rio Nutria and a refuge population maintained at the
BioPark (NM) that was established from individuals captured at Tampico Springs and
from the Rio Nutria. Bluehead Sucker were collected in two geomorphically distinct
locations on the Navajo Nation: Defiance Plateau (three sites): Kin Li Chee Creek, Black
Soil Wash and Bear Canyon; Chuska Mountain drainages (five sites): Tsaile Creek,
Coyote Wash, Wheatfield Creek, Whiskey Creek, and Crystal Creek. Sample sizes and
site acronyms are listed in Table 1 and mapped in Figure 2.
Some of the above samples were also available from previous studies (Douglas
and Douglas 2012, Hopken et al. 2013), and included all 21 samples from Agua Remora
and 65 samples from the Chuska Mountains (referenced as “Canyon de Chelly” in
Hopken et al. 2013).

9
Data from previous studies were used where appropriate, so as to place the
results of this study within a range-wide perspective. This included a large data base of
mitochondrial (mt) DNA sequence data for Bluehead and Mountain sucker (see below),
as well microsatellite (msat) DNA data from select populations of Bluehead Sucker and
other Pantosteus species. The criteria for selecting populations to include in the
microsatellite analysis was a combination of balancing representation (i.e., similar
populations downstream from study drainages) versus the computing time required to
analyze large data sets. The data sets are explained below.
DNA Extraction and Data Generation: Genomic DNA was extracted using Qiagen
DNeasy kits. Mitochondrial DNA ATP8 and ATP6 genes were amplified (as per Hopken
et al. 2013), sequenced using BigDye (ver.3.1) chemistry [Applied Biosystems Inc. (ABI),
Forest City CA] and analyzed on an ABI Prism 3730 Genetic Analyzer. Sequences were
aligned manually using Sequencher (Gene Codes, Ann Arbor MI).
To quantify population structure and genetic diversity, we assessed variation
across 17 fast-evolving microsatellite loci (Tranah et al. 2001) that were partitioned into
four multiplex sets. Details on methodology and evaluation of these loci are described in
Hopken et al. (2013) and Douglas et al. (2008). Forward primers were dye-labeled with
one of four fluorescent dyes (6FAM, VIC, NED and PET, dye set DS-33 by ABI) and loci
amplified using standard protocols on a Geneamp PCR system 9700 [Applied
Biosystems (ABI); California, USA]. Fragment analysis was executed on an ABI Prism
3730 Genetic Analyzer and with standard electrophoretic parameters. An internal size
standard (Liz500 ABI) was run with each sample. Alleles were sized with GeneMapper
4.0 (Life Technologies).
Mitochondrial (mt)DNA diversity: To evaluate mtDNA diversity in Bluehead Sucker
from the Zuni River and Navajo Nation drainages within a broad-scale regional context,
individual sequence data were first collapsed into haplotypes and compared to a

10
range-wide data base containing 147 haplotypes of Bluehead Sucker (Fig. 3) and related
species in the subgenus Pantosteus (Douglas and Douglas 2012). These included Rio
Grande Sucker (C. plebeius); Desert Sucker (C. clarki); and Mountain Sucker (C.
platyrhynchus). From this point, common names are used to designate species.
Microsatellite (msat) DNA diversity: To evaluate genetic diversity within and among
populations, we grouped samples by site, and standard population genetic parameters
were calculated in GenAlEx v6.4 (Peakall & Smouse 2012). For each site, we calculated
mean numbers of alleles per locus, number of effective alleles (which takes frequency of
alleles into consideration), number of private alleles per drainage (i.e., those only
detected in that drainage), and unbiased expected heterozygosities (UHE) (which again
takes sample size into consideration). Pairwise FST estimates were generated (and
significance calculated using 999 permutations) to serve as an estimate of gene flow
among sites and to gauge the isolation of populations.
Assignment tests and derivation of population structure: An “ad hoc” clustering
algorithm in the program Structure (Pritchard et al. 2000) was used to identify distinct
gene pools, and potential admixture between/ among distinct populations. Structure
uses a Bayesian approach (i.e., Markov Chain Monte Carlo) to cluster individuals with
similar genotypes by evaluating all genotypes in the data set. In more technical terms, it
minimizes linkage disequilibrium while optimizing posterior probabilities. The benefit of
the Structure algorithm is the lack of a priori assumptions regarding sampling locations,
population structure or interconnectedness, which in turn should improve the probability
of detecting true genetic structure. Simulation parameters were set at “admixture” and
“allele frequencies correlated among populations.” Exploratory analyses were run with a
burn-in of 100,000 and a chain length of 500,000 so as to determine number of clusters
with the highest posterior probabilities (i.e., K-value). Once an appropriate number for K
was determined, analyses were repeated by increasing burn-in to 500,000 and a chain
length of 1,000,000.

11
We then conducted analyses on several data sets to address the different objectives:
(1) The “8-species” data set contained all 340 Bluehead Sucker from the Zuni River/
Navajo Nation, respectively, as well as representatives of Bluehead Sucker populations
and other Pantosteus species. This amounted to 84 Bluehead Sucker from the upper
Little Colorado River (LCR) representing B-ESU-3 (Hopken et al. 2013); 81 Bluehead
Sucker from the Colorado River representing B-ESU-2 (Hopken et al. 2013), 43 Desert
Sucker, 35 Rio Grande Sucker, and 30 Mountain Sucker. These data were used to test
gene pools, and to evaluate potential levels of introgression among them.
Intraspecific lineages with separate evolutionary trajectories are often
designated as ‘evolutionarily significant units’ (ESUs), a distinction particularly important
for declining species or those shrinking in distribution. ESUs were originally defined as
being reciprocally monophyletic with regard to mtDNA and with significant divergence at
nuclear loci (Moritz 1994). This definition (as followed herein) is objective and
unambiguous, whereas others that invoke the necessity of ‘adaptive variation’ are
deemed less so (Holycross and Douglas 2007). We previously identified three ESUs
within Bluehead Sucker (Hopken et al. 2013, Fig. 4), based on mtDNA clades and
microsatellite DNA analyses. That take-home message (also amplified with MUs below)
is that molecular divergences among endemic fish populations often juxtapose quite well
with drainage histories, and with their concomitant stream hierarchies.
(2) The “11-sites” data set contained only 340 study samples of Bluehead Sucker.
These data were used to test for distinctiveness of gene pools, levels of gene flow
among populations, as well as their degree of isolation and admixture (i.e., if any gene
pools represented ‘management units’ or MUs).
Previously, MUs were characterized by significant differences in allele
frequencies, as gauged by a comparison of pairwise FST values. This approach has
recently been amended to include contemporary dispersal rates, such that MUs are now
defined by demographic independence (i.e. genetic divergence approximating a

12
dispersal rate <10%, Palsbøll et al. 2006). We employed BAYESASS 3 (Wilson and
Rannala 2003) to estimate migration rates for our STRUCTURE-derived groupings,
using 10 million iterations (1 million discarded as burn-in) and 1000 iterations between
MCMC sampling. Mixing parameter for allele frequencies, inbreeding coefficients and
migration rates were iteratively adjusted so as to accrue acceptance rates of 35%, 38%
and 40%, respectively (where values between 20% and 40% are deemed optimal).
Hopken et al. (2013) employed a similar procedure in evaluating Bluehead Sucker MUs
across its range.

13
RESULTS
Mitochondrial (mt)DNA diversity and phylogeography: Sequence analysis of
ATPase 8 and ATPase 6 resulted in 852 base pairs (bp) coalesced into 4 haplotypes
(Table 2); each of these had been previously identified in a range-wide study of
Bluehead Sucker (Douglas and Douglas 2012; Hopken et al. 2013). These data have
been incorporated (as Figure 3) into the Basin-wide haplotype network of Hopken et al.
(2013).
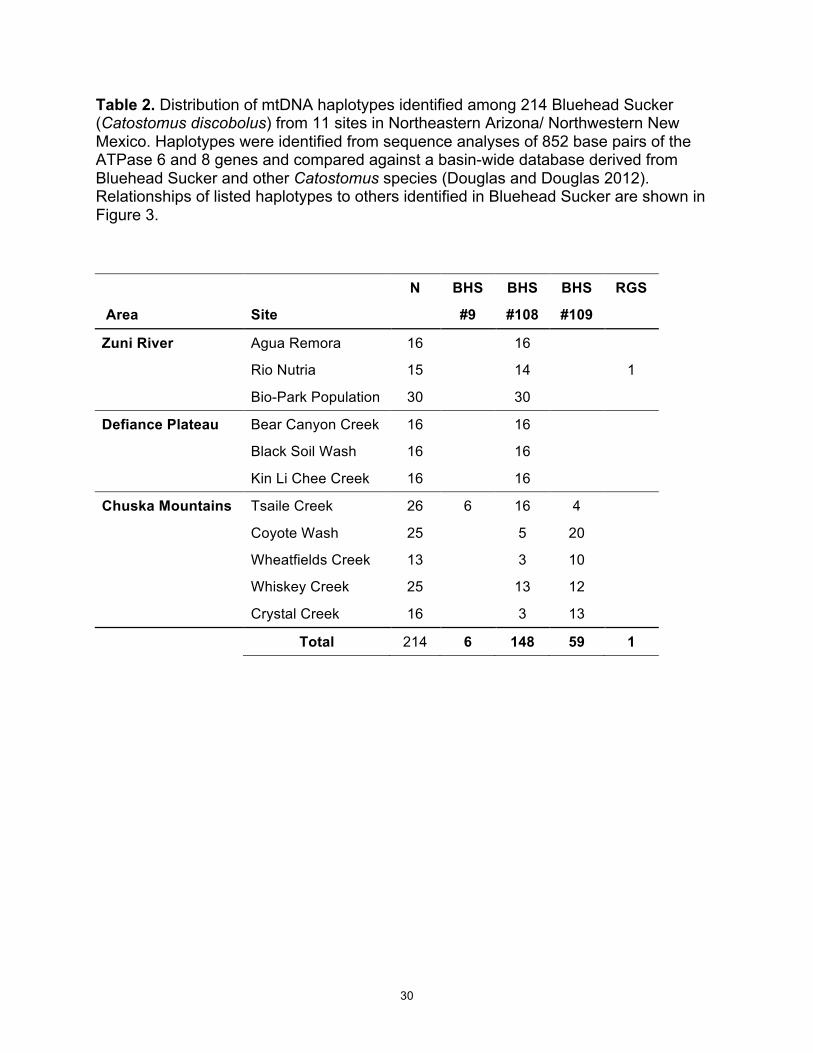
All three areas (Zuni River, Defiance Plateau and Chuska Mountains) shared a
common haplotype (BHS #108) found in the majority of samples (70%), and at all 11
sites. This haplotype is similar to others in Bluehead Sucker from the Colorado River
drainage (Figure 1) and differs from the most common Bluehead Sucker haplotype by
only a single point mutation (i.e., 1 nucleotide difference out of 852 = 0.12%) (Douglas
and Douglas 2012). This haplotype was also detected as well in some populations from
the Upper Little Colorado River (LCR) (Hopken et al. 2013).
Chuska Mountains samples revealed a second haplotype (BHS #109) that was
found at all 5 sites, but is seemingly restricted to the Chuska Mountains and has not
been detected in the remainder of the Colorado River Basin (Hopken et al. 2013).
Overall, haplotype BHS #109 was detected in this area from 59 of 104 samples (57%),
and was at high frequency at Tsaile Creek.
The two other haplotypes were restricted to single populations. The Tsaile Creek
site was the only one that revealed a 3rd Bluehead Sucker haplotype (BHS #9) in 23% of
its samples. This haplotype has been detected throughout the Colorado River Basin in
both Bluehead and Mountain sucker populations. One sample from the Rio Nutria also
revealed a haplotype found in Rio Grande Sucker.
All Bluehead Sucker haplotypes fall within BHS ESU-2 (Hopken et al. 2013), a
lineage that is widespread throughout the Colorado River Basin. Another lineage, BHS

14
ESU-3, is restricted only to the Upper Little Colorado River, and was not detected in any
samples from the Zuni River or from the Navajo Nation.
Key Results from Our mtDNA analyses:
(1) Zuni River, Defiance Plateau and Chuska Mountain drainages share a common
mtDNA haplotype, which falls within Bluehead Sucker ESU-2 (Colorado River lineage).
(2) Chuska Mountain drainages harbor a second haplotype that is not found elsewhere,
but it also falls within Bluehead Sucker ESU-2.
(3) Bluehead Sucker within the Defiance Plateau drainages of the Navajo Nation do not
represent a new ESU, but rather, are components of a previously defined ESU (per
Hopken et al. 2013) that also contains Chuska Mountain drainages, the Zuni River (NM),
and the remainder of the Colorado River Basin, save the upper Little Colorado River.
(4) Introgression by Rio Grande Sucker was detected only at the Rio Nutria site (Zuni
River, NM), and was restricted to a single mtDNA haplotype in a single individual. None
of the Navajo Nation sites contained mtDNA haplotypes of Rio Grande Sucker.
Microsatellite DNA diversity and population isolation: Genetic diversity in 340
Bluehead Sucker from 11 sites in the Zuni River and the Navajo Nation was low to
moderate across the 17 microsatellite loci, particularly when compared to populations
throughout the Colorado River Basin (Hopken et al. 2013). The Zuni River exhibited
lowest values, followed by slightly higher values for the Defiance Plateau, and higher still
for the Chuska Mountain drainages, but still moderate when compared to range wide
values (Table 3).
The Rio Nutria site (Zuni River) was an exception to this general pattern. However,

15
higher diversity in this population is simply the result of introgression by Rio Grande
Sucker (Table 3). Two sites In the Chuska Mountains (i.e., Tsaile Creek and Coyote
Wash) exhibited higher values for genetic diversity than did the other three in that area.
Genetic diversity also reflects population demography (i.e., its fluctuations over
time), as well as the degree of isolation for individual sites. Pairwise FST estimates (Table
4) indicate strong separation among the three biogeographic areas, with substantial
values ranging from 0.25-0.44 and suggesting considerable diversification. Within these
areas, gene flow among sites was variable but generally low, indicating most populations
are relatively isolated.
Several populations showed migration rates <10%, as calculated in BAYESASS 3.
These were: Bio-Park (TAM) = 0.92 (a refugium population for the Zuni River); Bear
Canyon Creek (BCN) = 0.92 (Defiance Plateau); Tsaile Creek (TSA) = 0.91; Coyote
Wash (COY) = 0.89; and Crystal Creek (CYC) = 0.92 (all three within the Chuska
Mountains).
The inbreeding coefficient (Fis) was elevated in five populations, suggesting a
genetic bottleneck at some point in the history of these populations. They were: Agua
Remora (AGR) = 0.38 (Zuni River); Black Soil Wash (BKW) = 0.38 and Kin Li Chee
Creek (KLC) = 0.37 (both in the Defiance Plateau); Wheatfields Creek (WHE) = 0.38 and
Whiskey Creek (WHY) = 0-.25 (both in the Chuska Mountains).
Assignment tests and population structure: Cluster analysis was used to evaluate
levels of introgression with other species of sucker known to hybridize with Bluehead
Sucker (e.g., Rio Grande Sucker), and also to test distinctiveness of the Zuni River and
Navajo Nation when compared with other drainages of the Colorado River Basin.
No introgression by either Desert or Mountain sucker was detected. However, all
samples from the Rio Nutria exhibited genotypes of admixed origin, with roughly a third

16
of the gene pool showing affinity with Rio Grande Sucker (Figure 2; Table 5). The other
two sites in the Zuni River did not show any signs of Rio Grande Sucker introgression.
Also, no admixture with Rio Grande Sucker was detected in any of the sites on the
Defiance Plateau or in the Chuska Mountains (Figure 4).
Populations in downstream areas of the Zuni and San Juan rives were previously
identified by Hopken et al. (2013) as unique MUs (management units) (Figures 4, 5).
Assignment tests in this study also revealed that additional Bluehead Sucker in the Zuni
River, on the Defiance Plateau and in the Chuska Mountains comprised unique gene
pools that were distinct from the Upper LCR or the Colorado River.
Key Results from Our Microsatellite DNA analyses:
(1) The Zuni River, Defiance Plateau and Chuska Mountains each represent a distinct
gene pool, with no gene flow among them.
(2) Sites within the Zuni River and on the Defiance Plateau reflect similar patterns of
genetic diversity. Sites within the Chuska Mountains exhibit among-site genetic
differences, but appear to be connected via gene flow.
(3) Genetic diversity in all three areas is low-to-moderate, suggesting they are isolated.
(4) Genotypes from the Rio Nutria (Zuni River) show affinity with the Rio Grande Sucker,
suggesting historic introgression and an admixed origin of this population. No admixture
was detected in the other two sites in the Zuni River.
(5) In summary, all three regions described in (1) are unique, and each represents a
management unit (MU) for Bluehead Sucker. The Zuni River and Chuska Mountain
drainages were previously identified as MUs in Hopken et al. (2013) but samples
representing the Defiance Plateau are new additions to the database and represent a
previously unrecognized MU (i.e. MU10).

17
(6) Genotypes that define the Zuni Bluehead Sucker [Catostomus discobolus yarrowi]
are not found in the Defiance Plateau and Chuska Mountain drainages and it would be
scientifically incorrect to designate those areas on the Navajo Nation as being
components of the Zuni Bluehead Sucker distribution.
Data from previous studies: Smith et al. (1983) collected Bluehead Sucker from the
Zuni River (NM) and from San Juan River drainages and evaluated them using
starch-gel electrophoresis of allozymes. A map depicting their sampling sites is
represented in Figure 6. The historic stream capture event that could have allowed Rio
Grande Sucker to become part of the fish community in the Zuni River (upper Little
Colorado River) is presented in Figure 7. Crabtree and Buth (1987) resampled these
sites and generated new allozyme data that contradicted aspects of Smith et al. (1983).
A phenogram (Crabtree and Buth 1987) depicting relationships of the study populations
as well as their relationship with Desert and Rio Grande suckers is presented in Figure 8.
The results of our microsatellite DNA study employing samples form the same
populations as above (as well as additional ones) is presented in Figure 9, and is
congruent with the results presented in Figure 8 (Crabtree and Buth 1987).
Our microsatellite analyses that assigned the 340 samples from the three study
areas (data set “11 Sites”) revealed high affinity among sites within areas, and no
admixture among areas (Figure 10, Table 5). Rio Nutria samples, consistent with the
above analyses, showed an admixed origin, whereas the Agua Remora and BioPark
populations were unambiguously assigned to the Zuni River gene pool. Similarly,
samples from all three sites on the Defiance Plateau unambiguously assigned to a single
area-specific cluster (Figure 10). Figure 11 depicts sample sites and geomorphic regions
contrasted with microsatellite data for other Catostomid species. Again, Rio Nutria is
depicted as admixed. Figure 12 depicts scatter plots comparing the three geographic
regions (Zuni River, Defiance Plateau and Chuska Mountains) in pairwise comparisons.
All three are quite distinct.

18
DISCUSSION
The Zuni Bluehead Sucker from the Zuni River in the upper Little Colorado River (LCR)
Basin was recently proposed for Endangered Status under the Endangered Species Act
(ESA 1973) in a notice published by the U.S. Fish and Wildlife Service (25 January 2013;
FWS-R2-ES-2013-0002-0001). Drainages on the Defiance Plateau (also upper LCR)
and the Chuska Mountains (San Juan River Basin) were included as “Areas Occupied at
the Time of Listing.” The Navajo Nation expressed concern over the assertion that
Bluehead Sucker in their drainages represented the C. d. yarrowi subspecies. Various
studies had yielded inconclusive results regarding taxonomic affinity of Bluehead Sucker
on the Navajo Nation. Discrepancies were likely due to locality differences in drainages
examined, methodologies employed (e.g., phenotypic vs genetic, plus utilization of
different molecular markers), as well as types of data analyses (e.g., phylogenetic vs
population genetic), and their interpretations.
The purpose of this study was to genetically evaluate Bluehead Sucker
(Catostomus discobolus) from three geographic areas in northeastern Arizona/
northwestern New Mexico. Two are located on the Navajo Nation: Defiance Plateau and
Chuska Mountains. The third represents the Zuni River drainage, upstream of its
confluence with the upper Little Colorado River. Bluehead Sucker from the Zuni River
had been recognized as a distinct subspecies (C. d. yarrowi), whereas populations on
the Defiance Plateau and in the Chuska Mountains were considered the nominal
subspecies (C. d. discobolus).
Given this, our objectives in genetically evaluating Bluehead Sucker from the
Navajo Nation and the Zuni River were:
(1) To identify evolutionary lineages (ESUs) and management units (MUs);
(2) To assess levels of gene flow and degree of isolation among populations;
(3) To integrate our results within a range-wide perspective of Bluehead Sucker and to
contrast them with other studies previously completed.

19
We obtained 340 samples representing Bluehead Sucker in the three study areas
and employed mitochondrial DNA sequence analysis in combination with microsatellite
DNA analysis to identify evolutionary lineages and management units.
Results with Management Implications from mtDNA analyses: Our mtDNA analyses
revealed that populations from all 3 areas are identical to the Bluehead Sucker lineage
commonly found throughout the Colorado River Basin (BHS ESU-2 of Hopken et al.
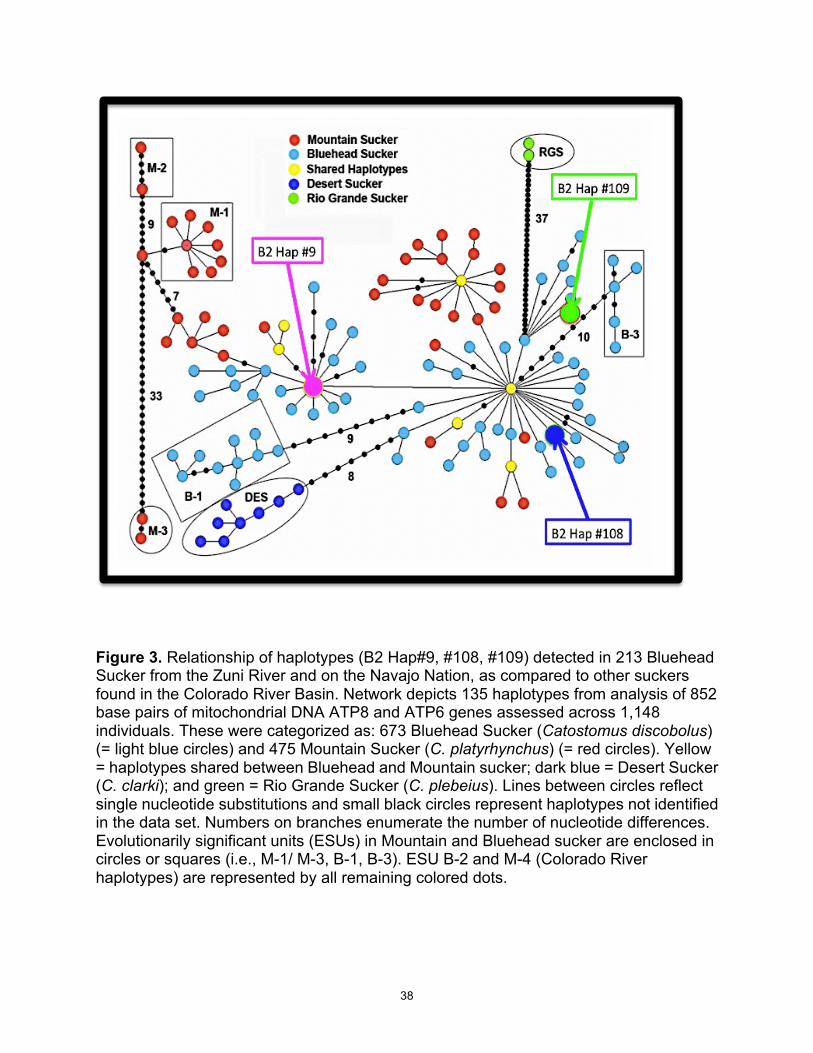
2013). This is illustrated in Figures 3, 4 and 5 and is further supported by the following:
• Zuni River, Defiance Plateau and Chuska Mountain share a mtDNA haplotype
common to the Colorado River lineage (B2 Hap #108; Figure 3).
• Chuska Mountain drainages harbor a second mtDNA haplotype that is unique to
the area, but also a constituent of the Colorado River lineage (B2 Hap #109; Figure
3).
• Tsaile Creek exhibits a third mtDNA haplotype, also part of the Colorado River
lineage (B2 Hap #9; Figure 3) that is, again, distributed throughout the Colorado
River Basin.
The distinct Bluehead Sucker lineage (BHS ESU-3) identified by Hopken et al.
(2013) in north-draining tributaries from the upper LCR basin (Figures 2 and 3) was not
detected from the Defiance Plateau or the Zuni River (both part of the upper LCR basin).
In other words, Navajo Nation Bluehead Sucker (as well as the Zuni River populations) are components of the same evolutionary lineage recognized as C. discobolus, found throughout Green and upper Colorado River drainages, as well as Grand Canyon.
One pertinent result from our mtDNA analysis is the relative low levels of genetic
diversity in Zuni River and Defiance Plateau populations, and to a lesser extent, the

20
Chuska Mountains as well. This indicates the isolation of these areas from the mainstem
Colorado River, a larger, genetically more diverse array of populations. It also identifies
them as numerically smaller populations that likely experienced genetic bottlenecks over
time, reducing their mtDNA diversity to a few common haplotypes.
Our mtDNA analysis identified a single individual from the Rio Nutria that
maintained a Rio Grande Sucker haplotype (Table 2, Figure 3). None of the sites on the
Defiance Plateau or the Chuska Mountains revealed haplotypes found in other sucker
species. Thus, based on our analyses of 215 samples, introgression by Rio Grande Sucker appears restricted to a single location in the Zuni River.
Results with Management Implications from Microsatellite DNA analyses: Analysis
of microsatellite loci allowed us to further examine potential introgression by Rio Grand
Sucker as a defining characteristic of the Zuni Bluehead Sucker subspecies, as well as
population connectivity and levels of isolation within and among the study areas.
• Consistent with our mtDNA analysis, the genetic introgression of Rio Grande Sucker alleles was only detected in the Rio Nutria population (Tan color of
Figure 2 and 11; Green color in Figure 10; Table 5), and was recorded at
approximately 36%, with most individuals showing admixed ancestry.
Interestingly, neither Agua Remora nor the BioPark samples of Zuni Bluehead
Sucker exhibited signs of admixture (Table 5).
• Navajo Nation samples exhibited microsatellite genotypes that clearly represent Colorado River lineage Bluehead Sucker, with no evidence of
Mountain Sucker (C. platyrhynchus) or the Upper LCR lineage Bluehead Sucker
(Figures 2 and 11).
• In addition, our results revealed that Navajo Nation Bluehead Sucker is genetically distinct from the C. d. yarrowi subspecies (Figures 9-12). The
21
Zuni River, Defiance Plateau and Chuska Mountain drainages each represent separate and distinct gene pools, with no gene flow among them
(Tables 4, 5; Figures 10-12). Each geographic area is isolated and no population
connectivity exists among them. Given the geomorphology of drainage
relationships, this likely reflects an historic pattern rather than the result of
contemporary (anthropogenic) alterations.
• However, because genetic diversity is low-to-moderate (Table 3) as compared to
other Bluehead Sucker populations in the Colorado River Basin (Hopken et al.
2013, Douglas and Douglas 2012), bottlenecks or founder events likely occurred
in each area and, consequently, genetic drift could have contributed to the
population divergence we now find among geographic areas.
• Populations within each area demonstrate various levels of connectivity
(Table 4 and 5; Figure 10). Sites within the Zuni River and on the Defiance
Plateau reflect similar patterns of genetic diversity. High genetic similarity
suggests potential source-sink relationships, with one population providing
founders or migrants for another that, in turn, is smaller in size, declining in
numbers, or had previously become locally extirpated.
• In contrast, sites within the Chuska Mountains exhibit among-site genetic differences, but appear to be connected via gene flow. Unique genetic diversity
was detected in the Tsaile Creek and the Coyote Wash populations that is not
replicated within the other 3 sites. Based on available data to date, we cannot
determine if these patterns in Wheatfield, Whisky and Crystal creeks reflect traces
of ancestral polymorphism that had been largely lost due to genetic drift (i.e., the
random loss of alleles due to population fluctuations), or if the pattern indeed
reflects a genetic divergence due to local adaptation.
22
Comparison of our Results with Other Studies: Our results are mostly consistent with
findings by Turner and Wilson (2009), whose study was restricted to the Zuni River
drainage in New Mexico. These researchers also reported Rio Grande mtDNA
haplotypes as being restricted to the Rio Nutria, albeit at higher frequency (24.0%) than
in our samples (6.6%). As with our findings, Turner and Wilson (2009) detected
Bluehead Sucker mtDNA haplotypes only in the Agua Remora or Tampico Springs
locations (represented in our study by samples from the BioPark). Similarly, their
analyses of two nuclear loci (Xt4 and Rag) showed Rio Grande Sucker as being admixed
at ~36% in the Rio Nutria, but not in the other two populations. Again, these data are
consistent with our analyses of 17 nuclear microsatellite loci. The study by Schwemm
and Dowling (cited in Turner and Wilson) employed the same two nuclear loci across a
wider set of samples but this study is not published and thus was not available to us.
A comparison with earlier “genetic” studies that examined populations from Zuni
River, Defiance Plateau and Chuska Mountains is a little more difficult, since the earlier
studies employed protein-coding (allozyme) markers. Smith et al. (1983) examined
morphometric and allozymic patterns in Bluehead Sucker from the Little Colorado River
drainage and Chuska Mountains (Figures 6 and 7). They assayed three sites in the Zuni
River (i.e., Nutria Creek, Rio Pescado and Radosevich) and detected introgression by
Rio Grande Sucker in the Nutria Creek population (as did Crabtree and Buth 1983,
Turner and Wilson 2009, and our study).
Their results were more ambiguous regarding the other two Zuni River
populations and their assertion was that all Zuni River populations were introgressed.
However, Buth and Crabtree (1986), Turner and Wilson (2009), and our study identified
two of the three populations as lacking introgression by Rio Grande Sucker.
Furthermore, Smith et al. (1983) concluded that the Defiance Plateau population
(i.e., Kin Li Chee Creek) was not biochemically different from the Chuska Mountain
population (i.e., Whiskey Creek), a result that was contradicted by Buth and Crabtree
(1986) and our microsatellite analysis. However, protein-coding loci (represented by
23
allozymes) are slower evolving than are microsatellite loci, and reflect evolutionary
lineages (i.e., ESUs) rather than demographically independent populations (i.e., MUs).
Thus, the conclusion by Smith et al. (1983) that Defiance Plateau and Chuska Mountain
populations were genetically the same is consistent with results from our mtDNA
analysis that indicate populations in Navajo Nation drainages and the Zuni River are all
part of the Colorado River Bluehead Sucker ESU (Figure 5).
Overall Summary and Conclusions for Management: Bluehead Sucker from the
three study regions is unique, and each area represents a management unit (MU) (Table
6; Figures 10, 11). The Zuni River and Chuska Mountain drainage were previously
identified as such in Hopken et al. (2013) (i.e., MU9 and MU6, respectively; Figures 4, 5).
However, samples representing the Defiance Plateau are new additions to the database
and thus represent a previously unrecognized MU (i.e., MU10; Figures 10, 11).
Genotypes that define the Zuni Bluehead Sucker [Catostomus discobolus yarrowi] are not found in the Defiance Plateau and Chuska Mountain drainages
and each geographic area harbors a genetically distinct group of Bluehead Sucker
(Figures 10-12). Based on our data, it would be scientifically incorrect to designate those areas on the Navajo Nation as new components of a distribution traditionally identified for the Zuni Bluehead Sucker.
Bluehead Sucker in Northeastern Arizona/Northwestern New Mexico show a
puzzling of array of diversity that includes distinct gene pools in drainages of the Chuska
Mountains, the Defiance Plateau, the Zuni River, as well as the upper Little Colorado
River. This reflects a complex evolutionary history, with periods of isolation punctuated
by drainage re-arrangements and potential stream captures, as already outlined ~50
years ago by Smith (1966, 1978), and again in Smith et al. (2013). While fascinating from
an evolutionary stance, it is challenging to appropriately manage these fishes from a
conservation stance, as numerous anthropogenic pressures threaten their unique and
endemic aquatic habitats in the arid southwest. We hope our study will aid USFWS and
the Navajo Nation in their endeavors to manage Bluehead Sucker.

24
ACKNOWLEDGMENTS
The Basin-wide perspective on Bluehead Sucker was initially supported by the
3-Species Conservation Agreement, a multi-state consortium of agencies that coordinate
efforts to manage native fishes range-wide. Navajo Game and Fish, specifically J. Cole
and his field assistants, supported the extension of this research into drainages of the
Navajo Nation. The U.S. Fish & Wildlife Service, particularly M. Mata and the
Albuquerque (NM) office, facilitated acquisition of additional Zuni Bluehead Sucker
samples and provided funding for generation of additional genotypes data.
The completion of earlier research provided the baseline for the current investigation and
in that regard, numerous agencies contributed field expertise, specimens, technical
assistance, collecting permits, funding or comments. Their guidance for project planning,
coordination of logistics, confidence in our abilities and enthusiasm for the study
organisms made studying Bluehead Sucker a very enjoyable collaboration. Particular
thanks also go natural resource agencies in Arizona, Colorado, New Mexico, Utah and
Wyoming as well as the Navajo Nation Department of Fish and Wildlife, National Park
Service, U.S. Bureau of Reclamation and U.S. Fish and Wildlife Service. We specifically
acknowledge: M. Anderson, R. Anderson, M. Ault, R. K. Beidinger, M. Breen, Brunson, S.
Carman, P. Cavalli, K. Gelwicks, G. Gustina, T. Hedrick, M. Hudson, J. Jackson, J.
Jimenez, S. Jones, R. Keith, J. Logan, M. Lopez, P. Martin, S. McKay, C. Melon, S.
Meisner, D. Miller, M. T. Moody, Morvilius, B. Persons, S. Ross, G. Selby, D. Speas, K.
Terry, P. Thompson, R. Timmons, M. Trammel, C. Walker, A. Webber, K. Wilson, J.
Wood, and B. Zimmermann. We are also in debt to the students, postdoctorals and
faculty who contributed to the development of our research: A. Albores, P. Brunner, T.
Dowling, R. Cooper, J. Cotter, E. Fetherman, M. Hopken, K. Huyvaert, M. Kwiatkowski,
S. Mussmann, A. Reynolds, J. Reynolds, C. Secor, and P. Unmack. Sampling
procedures were approved under IACUC permit 98-456R (Arizona State University) and
01-036A-01 (Colorado State University). Funding was provided by grants from UDNR
and WGFD to MRD and MED.

25
LITERATURE CITED Avise JC (2000) Phylogeography: the history and formation of species. Harvard
University Press, Cambridge, MA. Baird SF, Girard C (1854) Descriptions of some new fishes from the River Zuni.
Proceedings of the Academy of Natural Sciences, Philadelphia 6, 368—369. Berry O, Tocher MD, Sarre SD (2004) Can assignment tests measure dispersal?
Molecular Ecology 13, 551—561. Carman SM (2004) Zuni Bluehead Sucker (Catostomus discobolus yarrowi) Recovery
Plan. Conservation Services Division, New Mexico Department of Game and Fish, Santa Fe, New Mexico, 40 pp.
Caughley G (1994) Directions in conservation biology. Journal of Animal Ecology 63,
215—244. Crabtree CB, Buth DG (1987) Biochemical systematics of the catostomid genus
Catostomus: Assessment of C. clarki, C. plebeius, and C. discobolus including the Zuni sucker, C. d. yarrowi. Copeia 1987, 843—854.
Cope ED (1872) Recent reptiles and fishes: report on the reptiles and fishes obtained by
the naturalists of the expedition. Pages 432—442 in Preliminary report of the U.S. Geological Survey of Wyoming and portions of contiguous territories in Part IV, Special Report (F.V. Hayden).
Cope ED (1874) On the Plagopterinae and the ichthyology of Utah. Transactions of the
American Philosophical Society 14, 129—139. Douglas ME, Marsh PC (1996) Population estimates/ population movements of Gila
cypha, an endangered cyprinid fish in the Grand Canyon region of Arizona. Copeia 1996, 15—28.
Douglas ME, Marsh PC (1998) Population and survival estimates for Catostomus
latipinnis in northern Grand Canyon, with distribution and abundance of hybrids with Xyrauchen texanus. Copeia 1998, 915—925.
Douglas MR, Brunner PC (2002) Biodiversity of Central Alpine Coregonus
(Salmoniformes): impact of one-hundred years of management. Ecological Applications 12, 154—172.
Douglas MR, Douglas ME (2010) Molecular approaches to stream fish ecology.
American Fisheries Society Symposium 73, 157—195.

26
Douglas MR, Douglas ME, Hopken MW (2008) Genetic structure of Bluehead Sucker [Catostomus (Pantosteus) discobolus] across the Colorado River Basin, with emphasis on drainages in the state of Wyoming. Report to Wyoming Department of Game and Fish. Department of Fish, Wildlife and Conservation Biology, Colorado State University, Fort Collins. 64 pp.
Douglas MR, Douglas ME (2012) Mountain sucker (Catostomus platyrhynchus)
population genetic analysis within and among river drainages in Utah. Report to Utah Division of Natural Resources. Illinois Natural History Survey, University of Illinois/ Urbana-Champaign IL. 77 pp.
ESA (1973) Endangered Species Act; Title 16 United States Code, Sections
1531—1544. Gilpin ME, Soule ME (1986) Minimum viable populations: processes of species
extinction. In: Soule ME (Ed), Conservation Biology: The Science of Scarcity and Diversity. Sinauer Press, Sunderland, MA, pp. 19—34.
Haig SM, Beever EA, Chambers SM, Draheim HM, Dugger BD, Dunham S, Elliott-Smith
E, Fontaine JB, Kesler DC, Knaus BJ, Lopes IF, Loschl P, Mullins TD, Sheffield LM (2003) Taxonomic considerations in listing subspecies under the US Endangered Species Act. Conservation Biology 20,1584—1594.
Holycross AT, Douglas ME (2007) Geographic isolation, genetic divergence, and
ecological non-exchangeability define ESUs in a threatened sky-island rattlesnake. Biological Conservation 134, 142—154.
Hopken MA, Douglas MR, Douglas ME (2013) Stream Hierarchy Defines Riverscape
Genetics of a North American Desert Fish. Molecular Ecology 22, 956—971. Moritz C (1994) Defining evolutionarily significant units for conservation. Trends in
Ecology and Evolution 9, 373—375. Palsbøll PJ (1999) Genetic tagging: contemporary molecular ecology. Biological Journal
of the Linnean Society 68, 3—22. Palsbøll PJ, Berube M, Allendorf FW (2006) Identification of management units using
population genetic data. Trends in Ecology and Evolution 22, 11—16. Peakall R, Smouse PE (2012) GenAlEx 6.5: Genetic analysis in Excel. Population
genetic software for teaching and research-an update. Bioinformatics 28, 2537—2539.
Pritchard JK, Stephens M, Donnelly P (2000) Inference of population structure using
multilocus genotype data. Genetics 155, 945—959.

27
Propst DL (1999) Threatened and Endangered Fishes of New Mexico, Technical Report No.1. New Mexico Department of Game and Fish, Conservation Services Division, Santa Fe, New Mexico.
Propst DL, Hobbes AL, Stroh TL (2001) Distribution and notes on the biology of Zuni
bluehead sucker, Catostomus discobolus yarrowi, in New Mexico. The Southwestern Naturalist 46, 158—170.
Reed RN, Douglas ME (2002) Ecology of the Grand Canyon Rattlesnake (Croalus viridis
abyssus) in the Little Colorado River Canyon, Arizona. The Southwestern Naturalist 47, 130—139.
Sites Jr JW, Crandall KA (1997) Testing species boundaries in biodiversity studies.
Conservation Biology 11, 1289—1297. Smith GR (1966) Distribution and Evolution of the North American Catostomid Fishes of
the Subgenus Pantosteus, Genus Catostomus. Miscellaneous Publications, Museum of Zoology, University of Michigan 129, 1—132.
Smith GR (1978) Biogeography of Intermountain fishes, pp. 17—42. In: Intermountain
Biogeography, a Symposium. (Harper KT, Reveal JL, eds.). Great Basin Naturalist Memoirs 2.
Smith GR, Stewart JD, Carpenter NE (2013) Fossil and recent Mountain Suckers,
Pantosteus, and significance of introgression of Catostomin fishes of western United States. Occasional Papers, Museum of Zoology, University of Michigan 743, 1—59.
Smith GR, Hall JG, Koehn RK, Innes DJ (1983) Taxonomic relationships of the Zuni
Mountain sucker, Catostomus discobolus yarrowi. Copeia 1983, 37—48. Tranah GJ, Agresti JJ, May B (2001) New microsatellites for suckers (Catostomidae):
primer homology in Catostomus, Chasmistes, and Deltistes. Molecular Ecology Notes 1, 55—60.
Turner TF, Wilson WD (2009) Conservation genetics of Zuni Bluehead Sucker
(Catostomus discobolus yarrowi) in New Mexico. Conservation Services Division, New Mexico Department of Game and Fish, Santa Fe, New Mexico, 18 pp.
Waser PM, Strobeck C (1998) Genetic signatures of interpopulation dispersal. Trends in
Ecology and Evolution 13, 43—44. Wilson GA, Rannala B (2003) Bayesian inference of recent migration rates using
multilocus genotypes. Genetics 163, 1177—1191.

28
TABLES

29
Table 1. Overview of Bluehead Sucker (Catostomus discobolus) sampled from 11 sites in Northeastern Arizona/ Northwestern New Mexico. Sites listed under Zuni River represent the subspecies C. d. yarrowi (Zuni Bluehead Sucker), whereas sites from the Defiance Plateau and Chuska Mountains are on the Navajo Nation. Listed for each site are: Locality name and acronym (Code). Sample sizes (N) are provided for Total= all samples available, mtDNA= numbers of samples used for sequence analysis, msat= numbers of samples used for microsatellite analysis. Sampling localities are depicted in Figures 2 and 10. Samples N N N
Area Site Code Total mtDNA msat
Zuni River Agua Remora AGR 21 16 21
Rio Nutria RNU 30 15 30
Bio-Park Population TAM 30 30 30
Defiance Plateau Bear Canyon Creek BCN 31 16 30
Black Soil Wash BKW 31 16 30
Kin Li Chee Creek KLC 31 16 31
Chuska Mountains Tsaile Creek TSA 40 26 39
Coyote Wash COY 42 25 41
Wheatfields Creek WHE 15 13 15
Whiskey Creek WHY 64 25 40
Crystal Creek CYC 33 16 33
Total 368 214 340
30
Table 2. Distribution of mtDNA haplotypes identified among 214 Bluehead Sucker (Catostomus discobolus) from 11 sites in Northeastern Arizona/ Northwestern New Mexico. Haplotypes were identified from sequence analyses of 852 base pairs of the ATPase 6 and 8 genes and compared against a basin-wide database derived from Bluehead Sucker and other Catostomus species (Douglas and Douglas 2012). Relationships of listed haplotypes to others identified in Bluehead Sucker are shown in Figure 3.
N BHS BHS BHS RGS
Area Site #9 #108 #109
Zuni River Agua Remora 16 16
Rio Nutria 15 14 1
Bio-Park Population 30 30 Defiance Plateau Bear Canyon Creek 16 16
Black Soil Wash 16 16 Kin Li Chee Creek 16 16
Chuska Mountains Tsaile Creek 26 6 16 4
Coyote Wash 25 5 20
Wheatfields Creek 13 3 10
Whiskey Creek 25 13 12 Crystal Creek 16 3 13
Total 214 6 148 59 1

31
Table 3. Genetic diversity assessed over 17 microsatellite loci in 340 Bluehead Sucker (Catostomus discobolus) from 11 sites in Northeastern Arizona/ Northwestern New Mexico. Listed for site are: N= sample size, Na= mean number of alleles, Ne= effective number of alleles, and UHe= unbiased heterozygosity (adjusted for sample size); se= standard error for each parameter. Sampling localities are depicted in Figures 2 and 10. N Na Ne UHe
Area Site se se se
Zuni River Agua Remora 21 2.5 0.3 1.9 0.2 0.37 0.06
Rio Nutria 30 5.8 0.5 3.2 0.3 0.66 0.03
Bio-Park Population 30 2.6 0.3 1.9 0.2 0.37 0.06
Defiance Plateau Bear Canyon Creek 30 3.2 0.4 2.3 0.3 0.45 0.07
Black Soil Wash 30 3.0 0.5 2.0 0.2 0.39 0.07
Kin Li Chee Creek 31 3.2 0.5 2.3 0.3 0.46 0.07
Chuska Mountains Tsaile Creek 39 6.9 0.9 3.9 0.5 0.68 0.03
Coyote Wash 41 6.6 0.9 3.6 0.4 0.67 0.04
Wheatfields Creek 15 3.8 0.3 2.6 0.2 0.59 0.04
Whiskey Creek 40 4.9 0.6 2.9 0.3 0.59 0.04
Crystal Creek 33 4.2 0.5 2.4 0.3 0.50 0.06
30.5 4.3 0.2 2.6 0.1 0.52 0.02

32
Table 4. Levels of gene flow among Bluehead Sucker (Catostomus discobolus) from 11 sites in Northeastern Arizona/ Northwestern New Mexico. Listed are pairwise FST estimates derived from 17 microsatellite DNA loci screened across 340 samples. Site acronyms are listed in Table 1. Sampling localities are depicted in Figures 2 and 10.
Pairwise FST
AGR RNU TAM BCN BKW KLC TSA COY WHE WHY CYC
AGR 0.00 RNU 0.09 0.00 TAM 0.02 0.10 0.00 BCN 0.41 0.26 0.41 0.00 BKW 0.44 0.28 0.43 0.06 0.00 KLC 0.40 0.25 0.40 0.01 0.06 0.00 TSA 0.30 0.19 0.30 0.21 0.24 0.21 0.00 COY 0.32 0.20 0.32 0.25 0.27 0.25 0.06 0.00 WHE 0.35 0.23 0.35 0.28 0.32 0.27 0.07 0.09 0.00 WHY 0.35 0.23 0.35 0.29 0.32 0.28 0.05 0.07 0.05 0.00 CYC 0.40 0.27 0.40 0.34 0.37 0.34 0.09 0.10 0.09 0.03 0.00

33
Table 5. Assignment of 340 Bluehead Sucker (Catostomus discobolus) sampled from 11 sites to gene pools as determined by program STRUCUTRE at K=6. Analysis was conducted on genotypes derived from 17 microsatellite DNA loci. Site acronyms are defined in Table 1 and clusters are depicted in Figures 2 and 10. Membership of populations within clusters is indicated by color, with multiple cells marked indicating ambiguous assignment of a populations to a particular cluster. Gene pool colors (selected arbitrarily by STRUCTURE) are consistent with color scheme in Figure 10, but not Figures 2 and 11.
Inferred Cluster
Site N 1 2 3 4 5 6 AGR 21 0.001 0.000 0.998 0.000 0.000 0.000
RNU 30 0.000 0.386 0.606 0.000 0.007 0.001
TAM 30 0.000 0.001 0.998 0.000 0.000 0.001
BCN 30 0.000 0.001 0.000 0.001 0.997 0.000
BKW 30 0.001 0.001 0.001 0.001 0.996 0.000
KLC 31 0.001 0.001 0.000 0.000 0.998 0.000
TSA 39 0.222 0.000 0.000 0.748 0.000 0.029
COY 41 0.352 0.000 0.000 0.033 0.002 0.613
WHE 15 0.776 0.001 0.001 0.106 0.001 0.116
WHY 40 0.931 0.000 0.000 0.068 0.000 0.000
CYC 33 0.996 0.000 0.001 0.001 0.000 0.001

34
Table 6. Allocation of Bluehead Sucker sampled from the Zuni River and Navajo Nation to ESUs (= Evolutionarily Significant Units) and MUs (= Management Units) as identified in Douglas and Douglas (2012) and Hopken et al. (2013). Site acronyms are defined in Table 1 and sampling sites depicted in Figures 2 and 10. ESUs are depicted in Figure 5 and MUs in Figures 4, 5, and 10.
ESU MU
Area Site Code mtDNA msat
Zuni River Agua Remora AGR B-ESU2 B-MU9
Rio Nutria RNU B-ESU2 B-MU-9
Bio-Park Population TAM B-ESU2 B-MU9
Defiance Plateau Bear Canyon Creek BCN B-ESU2 B-MU10
Black Soil Wash BKW B-ESU2 B-MU10
Kin Li Chee Creek KLC B-ESU2 B-MU10 Chuska Mountains Tsaile Creek TSA B-ESU2 B-MU8
Coyote Wash COY B-ESU2 B-MU8
Wheatfields Creek WHE B-ESU2 B-MU8
Whiskey Creek WHY B-ESU2 B-MU8
Crystal Creek CYC B-ESU2 B-MU8

35
FIGURES

36
3 Figure 1. Sampling locations in four drainage basins of western North America from which Bluehead Sucker (Catostomus discobolus) was sampled (Douglas and Douglas 2012). Geographic extent of basins is depicted as colored areas (see insert Box for basin designations) and collection sites are shown as green dots. Many of these samples were evaluated in Hopken et al. (2013) and are referenced in Figure 2.
0 140 28070 Kilometers
¯
LegendBluehead Sucker
BasinsBonneville
Columbia
Lower Colorado
Missouri
Upper Colorado

37
Figure 2. Sites in the Colorado River Basin of western North America from which Bluehead Sucker (Catostomus discobolus) was sampled for this study. Locations are indicated by dots: Red = Zuni River (orange halo = Rio Nutria); Green = Defiance Plateau; Blue = Chuska Mountains, with the latter two located on the Navajo Nation. References populations (Hopken et al. 2013) are: Yellow = Upper Little Colorado River (LCR); Pink = Colorado River in Grand Canyon + San Juan River + Upper Colorado River drainages. Details on sampling sites are provided in Table 1. Horizontal lines in bar plot = Individuals. Colors = Location dots = gene pools. Multiple colors (Zuni River, Upper LCR) = genotypes of admixed origin.
38
Figure 3. Relationship of haplotypes (B2 Hap#9, #108, #109) detected in 213 Bluehead Sucker from the Zuni River and on the Navajo Nation, as compared to other suckers found in the Colorado River Basin. Network depicts 135 haplotypes from analysis of 852 base pairs of mitochondrial DNA ATP8 and ATP6 genes assessed across 1,148 individuals. These were categorized as: 673 Bluehead Sucker (Catostomus discobolus) (= light blue circles) and 475 Mountain Sucker (C. platyrhynchus) (= red circles). Yellow = haplotypes shared between Bluehead and Mountain sucker; dark blue = Desert Sucker (C. clarki); and green = Rio Grande Sucker (C. plebeius). Lines between circles reflect single nucleotide substitutions and small black circles represent haplotypes not identified in the data set. Numbers on branches enumerate the number of nucleotide differences. Evolutionarily significant units (ESUs) in Mountain and Bluehead sucker are enclosed in circles or squares (i.e., M-1/ M-3, B-1, B-3). ESU B-2 and M-4 (Colorado River haplotypes) are represented by all remaining colored dots.

39
Figure 4. Management units (MUs) identified via assignment test of 1092 Bluehead Sucker (Catostomus discobolus) genotypes derived from 17 microsatellite DNA loci. Bar plot depicts assignment of individuals to gene pools (= colors) derived from STRUCTURE. Map shows geographic distribution of 9 MUs, with sampling site reflecting as color of the respective gene pool. MU-1 (green) = Bonneville Basin/ Snake River; MU-2 (light brown) = Ringdahl Reservoir; MU-3 (yellow-to-blue = Green/Colorado River; MU-4 (grey) = San Rafael River; MU-5 (dark brown) = Dirty Devil River; MU-6 (orange) = Canyon de Chelly; MU- 7 (light blue) = Grand Canyon; MU-9 (bright green) = Zuni River; MU-8 (purple) = Little Colorado River. Evolutionarily significant units (ESUs) that contain the MUs are also designated. See Hopken et al. (2013: table 1) for detailed information on sampling sites.

40
Figure 5. Geographic distribution of three evolutionarily significant units (ESUs) and nine management units (MUs) for Bluehead Sucker (Catostomus discobolus). ESUs (left figure) were derived from 836 bp of ATP-8 and ATP-6 mitochondrial DNA genes. ESU-1 (green) = Bonneville Basin/ Snake River; ESU-2 (blue) = Colorado River; ESU-3 (purple) = Upper Little Colorado River. Two MUs (right) correspond to ESUs (i.e., ESU-1 = MU-1, ESU- 3 = MU-8), whereas ESU-2 subdivides into seven MUs (MU-2 through MU-7, and MU-9). See Hopken et al. (2013: table 1) for detailed information on ESUs and Figure 4 for MUs.

41
Figure 6. Sample locations (Smith et al. 1983) in the San Juan River (Blue Circle: D1 = Whiskey Creek; D2 = Kin Li Chee Creek); the Rio Grande (Red Circle: P = Wells Springs); and the Zuni River (upper Little Colorado River) [Red Circle: Rio Pescado, near confluence. lower left dot; Nutria Creek, middle dot; and Radosevich, upper dot). Only specimens from Kin Li Chee Creek, Nutria Creek, and the Rio Pescado were suitable for biochemical analyses. Modified after Smith et al. 1983: figure 2)

42
Figure 7. Details of upper Zuni River and Rio Grande River drainages (Smith et al. 1983) showing sample locations. The Rio Grande (P = Cottonwood Creek at Wells Springs); and the upper Zuni (open triangle = Rio Pescado, near confluence; closed circle = Nutria Creek; open circle = Radosevich). Only specimens from Nutria Creek, and the Rio Pescado were suitable for biochemical analyses. The proximity of upper Cottonwood Creek (Rio Grande) and upper Nutria Creek (Zuni River) suggests the probability of an historic stream capture event (red box). Modified after Smith et al. (1983: figure 3)

43
Figure 8. Phenogram (Crabtree and Buth 1987) depicting relationships among 12 geographic samples of Catostomus, as determined using Nei’s genetic similarity measure. C. d. yarrowi (Nutria Creek and Rio Pescado) are Zuni River locations; C.d. yarrowi (Kin Li Chee Creek) is a San Juan River drainage; C. d. discobolus (Whiskey Creek and Animas River) also represent San Juan River drainages. Modified after Crabtree and Buth (1987: figure 2).

44
Figure 9. Neighbor-joining tree depicting relationships among 20 geographic samples of Catostomus, derived from 17 microsatellite DNA loci and summarized using Nei’s genetic similarity measure (derived from our “8 Species” data set). RGS = Rio Grande Sucker; DES = Desert Sucker; 1 = ESU 2 & 3 (Hopken et al. 2013); 2 = Zuni River Bluehead Sucker; 3 = Defiance Plateau Bluehead Sucker; 4 = Chuska Mountain Bluehead Sucker. Sample abbreviations for representatives of other sucker species are: RGS = Rio Grande Sucker, and DES = Desert Sucker; for samples from the upper Little Colorado River drainage: EFL = East Fork, NUT = Nutrioso Creek, SIC = Silver Creek, WEN = Wenigma, and WIL = Willow Creek; for Colorado River mainstem samples: GCN = Grand Canyon, and UCR = Upper Colorado River; for Zuni River samples: AGR = Agua Remora, RNU = Rio Nutria, and TAM = BioPark population (includes Tampico Springs samples); for samples from the Defiance Plateau: BCN = Bear Canyon, BKW = Black Soils Wash, and KLC = Kin Li Chee Creek; for samples from the Chuska Mountains: COY = Coyote Canyon, CYC = Crystal Creek, TSA = Tsaile Creek, WHE = Wheatfields Creek, and WHY = Whiskey Creek.

45
Figure 10. Distribution of distinct gene pools across 11 sampling sites in Northeastern Arizona/ Western New Mexico spanning the Zuni River drainage as well as the Defiance Plateau and Chuska Mountains on the Navajo Nation, and from which Bluehead Sucker (Catostomus discobolus) was sampled. Details on samples collected from each site are listed in Table 1. Colors reflect distinct gene pool as identified by Bayesian Assignment test of 17 microsatellite loci. Sites (to right of bar) are defined in Table 1 and Figure 2. Zuni River samples (MU9) = Zuni Bluehead Sucker, whereas Defiance Plateau (MU10) and Chuska Mountain samples (MU6) = Navajo Nation. Horizontal lines in bar plot = Individuals; colors = gene pools. Multiple colors (i.e., MU9, MU6) = genotypes of admixed origin. Boxes on right reflect designation to Management Units (MUs) as defined in Hopken et al. (2013), except for MU10 (Defiance Plateau), which was not included in that analysis. MU10 thus represents a new Management Unit for Bluehead Sucker.

46
Figure 11. Allocation of 612 sucker [Catostomus (Pantosteus)] into distinct gene pools based on Bayesian Assignment test of genotypes derived from 17 microsatellite DNA loci. Sampling areas on left of bar plot are defined in Table 1 and Figure 10. Zuni River samples = Zuni Bluehead Sucker; samples from the Defiance Plateau and Chuska Mountains = Navajo Nation. Individuals = horizontal bars; colors = gene pools; multiple colors = introgression. Samples from the Upper LCR and Colorado River represent BHS ESU-3 and ESU-2, respectively (Hopken et al. (2013).

47
Figure 12. Pairwise population assignment of Bluehead Sucker (Catostomus discobolus) samples from the Zuni River (= Zuni) versus Defiance Plateau (= Nav1) and Chuska Mountains (= Nav2). Assignments are based on analyses using 17 microsatellite DNA loci as data. Sampling from each area is defined in Table 1 and depicted in Figures 2 and 10. Zuni River samples represent the Zuni Bluehead Sucker (NM), whereas samples from the Defiance Plateau and Chuska Mountains were collected on the Navajo Nation (AZ/ NM).