dispersion effects on ocdma system performance832861/fulltext01.pdfmee09:51 dispersion effects on...
TRANSCRIPT
MEE09:51
Dispersion Effects on
OCDMA System Performance
Abdul Gafur
This thesis is submitted in partial fulfillment of the
Degree of Master of Science in Electrical Engineering
Blekinge Institute of Technology
September 2009
Blekinge Institute of Technology School of Computing Supervisor: Dr. Doru Constantinescu Examiner: Dr. Doru Constantinescu

MEE09:51
ii

MEE09:51
Abstract
This thesis presents the effect of dispersion and Multi Access Interference (MAI) of opti-
cal fiber on the Bit Error Rate (BER) performance of a Direct Sequence Optical Code
Division Multiple Access (DS-OCDMA) network by means of intensity modulation and
optical receiver correlators.
By using Matlab simulations, Signal-to-Noise Ratio (SNR) versus Received Optical
Power (ROP) of an OCDMA transmission system can be evaluated with a so-called 7-
chip m-sequence for different numbers of system users. This can be done for the ROP
versus BER for various lengths of single mode optical fiber by taking into consideration
the dispersion effect in the optical fiber.
Matlab simulations can be performed in order to illustrate the reduction of the dispersion
index gamma, or to visualize different scenarios, e.g., what amount of transmitted power
is required in order to obtain a BER of 10-9 when the length of the optical fiber is in-
creased.
iii

MEE09:51
iv

MEE09:51
Acknowledgements
All my gratitude and thanks to ALLAH, who is the heavenly power of the Earth and the
store of every information and knowledge.
It is my pleasure to state the delight earnest admiration and philosophical esteem to my
respectable supervisor and examiner, Dr. Doru Constantinescu at School of Computing,
at Blekinge Institute of Technology, Sweden, for his help, pedagogic supervision, steady
encouragement, precious advices and collaboration for doing well with my thesis work.
I expand my earnest thanks to my family members and particularly to my beloved par-
ents. Furthermore, I want to thank all of my associates who assisted me during this pe-
riod of the thesis research work.
v

MEE09:51
vi

MEE09:51
vii
3.5.3 Value‐added Services ........................................................................................................ 26 3.5.4 Security ................................................................................................................................... 26
Table of Contents 1. Introduction ........................................................................................................................................... 1 1.1 Introduction .................................................................................................................................... 1 1.2 Related Work .................................................................................................................................. 2 1.3 Thesis Motivation .......................................................................................................................... 3 1.4 Objectives of the Thesis .............................................................................................................. 3 1.5 Outline of the Thesis .................................................................................................................... 4
2. Optical Fibers ......................................................................................................................................... 5 2.1. Advantages of Optical Fiber Transmission ....................................................................... 5 2.1.1 Distance .................................................................................................................................... 5 2.1.2 Bandwidth ............................................................................................................................... 5 2.1.3 Electrical Isolation ............................................................................................................... 6 2.1.4 Reliability ................................................................................................................................. 6
2.2. Shortcomings of Optical Fiber Transmission ................................................................... 6 2.3 Characteristics of Optical Fibers ............................................................................................. 7
2.3.1 Linear Characteristics ......................................................................................................... 7 2.3.2 Non Linear Characteristics ............................................................................................. 12
2.4 Coupling of Light ......................................................................................................................... 14 2.5 Intensity Modulation and Optical Amplification ........................................................... 16 2.5.1 Erbium Doped Fiber Amplifier ..................................................................................... 17
3. System Description ............................................................................................................................ 19 3.1. Future of OCDMA Systems ..................................................................................................... 19 3.2. System Description.................................................................................................................... 19 3.3 Noise in OCDMA ........................................................................................................................... 21 3.3.1 Dark Current Noise ............................................................................................................ 22 3.3.2 Thermal Noise ...................................................................................................................... 22 3.3.3 Quantum Shot Noise .......................................................................................................... 22
3.4. System Analysis .......................................................................................................................... 23 3.5. Advantages of OCDMA ............................................................................................................. 25 3.5.1 Bandwidth ............................................................................................................................. 25 3.5.2 Network Control ................................................................................................................. 26
MEE09:51
3.6. Drawbacks of OCDMA .............................................................................................................. 27 3.6.1 Noise ......................................................................................................................................... 27 3.6.2 Error Correction .................................................................................................................. 27 3.6.3 Encoding/Decoding ........................................................................................................... 28 3.6.4 Security Integration ........................................................................................................... 28
4. System Performance ......................................................................................................................... 29 5. Conclusion and Future Work ......................................................................................................... 41 Appendix A: Acronyms .......................................................................................................................... 43 References .................................................................................................................................................. 45
viii
MEE09:51
List of Figures
Figure 1: Light path in optical fiber .................................................................................................................. 7
Figure 2: Attenuation of light in single mode ............................................................................................... 8
Figure 3: Chromatic dispersion in optical fiber ........................................................................................ 10
Figure 4: Polarization dispersion ................................................................................................................... 11
Figure 5: Cross‐phase modulation ................................................................................................................. 13
Figure 6: Four wave mixing .............................................................................................................................. 14
Figure 7: Acceptance cone ................................................................................................................................. 15
Figure 8: Stimulated emission ......................................................................................................................... 17
Figure 9: OCDMA transmitter .......................................................................................................................... 20
Figure 12: BER vs. ROP performance for 12/17 users .......................................................................... 31
Figure 13: Performance comparison ‐ BER vs. ROP ............................................................................... 32
Figure 14: SNR vs. ROP performance for 3/6 users ............................................................................... 33
Figure 15: SNR vs. ROP performance for 12/17 ...................................................................................... 34
Figure 16: Performance comparison ‐ SNR vs. ROP ............................................................................... 35
Figure 17: Eye‐diagram ‐ gamma = 0.1 ........................................................................................................ 36
Figure 18: Eye‐diagram ‐ gamma = 0.2 ........................................................................................................ 37
Figure 19: Eye‐diagram for 70 km fiber length ........................................................................................ 38
Figure 21: Eye‐diagram for 100 km fiber length ..................................................................................... 40
ix

MEE09:51
x

MEE09:51
1
1. Introduction
1.1 Introduction
In the decade 1985-1995, four significant events heralded the possibility of optical net-
working namely that both transmission and switching could be based on fiber optic
communication. This was realized due to four main factors:
1. Realization of optical amplifiers.
2. Economic deployment of Wavelength Division Multiplexing (WDM).
3. Introduction of an Optical Cross Connect (OXC) enabling rapid reconfiguration of
light paths based on the wavelength channels.
4. Convergence of services and transport transmission rates [6].
Most up to date WDM transmission technologies realize optical link capacities exceed-
ing 10 Tbit/s per fiber based on 40 Gbit/s per wavelength channel [11]. Through optical
fiber, light propagates using a so-called total internal reflection technology, i.e., the car-
rier signal is the light.
However, the transmission signal may become mixed due to several reasons. Among
these, we mention optical amplifier noise, which creates amplified spontaneous emis-
sions and the effect of nonlinear and chromatic dispersion to optical fibers.
Our main objective in this thesis is to analyze Optical Code Division Multiple Access
(OCDMA) networks. We analyze the main causes for Multiple Access Interference
(MAI) which may reduce the performance of OCDMA networks. We also analyze the
limitations that occur due to dispersion in OCDMA networks. Dispersion can also reduce
the performance of the passive optical network.
Furthermore, we present in this report our simulations results for BER versus received
power for a multiple users system. We present the simulation results of the effects of

MEE09:51
dispersion for various scenarios, e.g., different received optical power for multiple users
and various optical fiber lengths in OCDMA systems.
Development of the optical fiber communications technology has evolved rapidly in or-
der to achieve larger transmission capacity and longer transmission distances [12]. No-
wadays, OCDMA systems are highly interesting as they offer several sought-after fea-
tures such as asynchronous access, privacy, secure transmissions, and ability to sup-
port variable bit rates and busy traffic and provide high scalability of the optical network
[3].
In OCDMA, one great feature is that all subscribers can access the network asynchron-
ously. In this case, a great advantage is that no conversion of optical to electrical sig-
nals is needed nor use of timing devices is required.
1.2 Related Work
Current research on OCDMA focuses on direct time spread OCDMA, spectral encoding-
decoding, pulse-position modulation OCDMA, asynchronous phase encoding OCDMA
and frequency hopping OCDMA [5]. However, in [5] chromatic dispersion of fiber is not
considered. Chromatic dispersion can reduce system performance and occurs when
increasing the inter-chip interference and decreasing the receiver optical power.
At present, the performance of an asynchronous phase encoded OCDMA system con-
sidering fiber chromatic dispersion has been reported in [13] in the case of standard
single mode optical fiber, while systems with dispersion shifted optical fiber are pre-
sented in [5].
2
Intensity modulation with direct detection On-Off Keying (OOK) OCDMA and Pulse Po-
sition Modulation (PPM) OCDMA systems are analyzed in [1]. The capacity of these
networks is limited because the number of signature sequences available with good cor-
relation properties for a given sequence length is small [2].

MEE09:51
1.3 Thesis Motivation
There are three windows of wavelength used in optical fiber communications. These
windows of wavelength are as follows: 850 nm, 1300 nm and 1550 nm. Among these,
the 1550 nm wavelength is considered in our thesis work because of its low attenuation,
around 0.25 dB/km.
Furthermore, recent developments in coherent OCDMA encoders/decoders allow for
the efficient separation of large number of simultaneously users providing thus a feasi-
ble solution for low-cost applications in multi-user Local Area Networks (LAN) environ-
ments [6].
In this thesis, the analysis is carried out for direct sequence OCDMA system with inten-
sity modulation and direct detection sequence inversion keyed receiver [14] considering
both MAI and chromatic dispersion. OCDMA is one promising candidate for the next
generation broadband multiple access technique due to full asynchronous transmission,
low latency access as well as soft capacity on demand [15].
MAI may be seen as a kind of noise. The MAI noise is minimized in this thesis work by
using the so-called m-sequence signature code. In case of practical OCDMA network
applications, the capacity of asynchronous multiuser access is essential [15].
In addition, an aspect of dispersion, namely the limitation of the OCDMA system is also
presented here. The main focus of the thesis is to do research on what can be done in
order to reduce the dispersion of the OCDMA network such as to obtain a given BER.
1.4 Objectives of the Thesis
The main objectives of this thesis work are as follows:
• Carry out the analysis of an OCDMA system based on a star coupler.
3
• Carry out a MAI analysis of the OCDMA network.

MEE09:51
• Determine optimum system parameters in the design of an OCDMA system.
• Find out the BER versus received optical power for various numbers of users
with the help of m-sequences.
• Find out the SNR versus received power of an OCDMA transmission system with
m-sequence and different numbers of system users.
• Find out the penalty of the eye diagram of power for various values of dispersion
fiber indexes and various lengths of fiber.
1.5 Outline of the Thesis
This thesis report consists of five chapters. Chapter 1 gives an introduction of the
OCDMA system and presents the motivation and the objectives of this thesis.
Chapter 2 describes the light propagation mechanisms through optical fiber. This chap-
ter also presents the characteristics of optical fibers and describes linear and nonlinear
phenomenon in optical fibers. We also present here the optical modulation and the opti-
cal amplification.
In Chapter 3 we introduce the OCDMA system analysis and derive the mathematical
formulas that we will simulate later on by using the Matlab software.
Chapter 4 is dedicated to the simulation results. In this chapter, we present the results
for different parameters that improved the performance of the OCDMA network.
Finally, Chapter 5 concludes this thesis work. This chapter presents several recommen-
dations that should be taken into consideration by companies providing OCDMA system
access in order to improve their systems.
4

MEE09:51
2. Optical Fibers
The aim of this chapter is to describe the system of optical fiber communications and to
also describe how light propagates through optical fibers. This chapter presents the
characteristics of optical fiber as well as various concepts and techniques which may be
of help in the design of optical transmission lines.
2.1. Advantages of Optical Fiber Transmission
2.1.1 Distance
Without a passive or active optical repeater, we can transmit the light signal in optical
fibers for a distance of about 100 km. Such distances are easily achieved in optical fiber
communications. This is to compare with copper and metallic based cables, where we
can transmit the electrical signal for only a few kilometers without the need of repeaters.
2.1.2 Bandwidth
In optical fiber communications, infrared light is used. The frequency of infrared light is
expressed in Hertz (Hz). Also, it is a known fact that the frequency depends on the
available bandwidth. In addition, there is no Electromagnetic Interference (EMI) in opti-
cal fibers.
The main reason for this is that the optical fiber has three layers. The layers in optical
fibers are the core, the cladding and the jacket. The core and the cladding consist of the
same type of materials.
A mechanism called total internal reflection is employed for propagating the light
through optical fibers. Further, metallic components are not used at all in optical fibers.
For these reasons, optical fibers have no electrical conductivity.
5
MEE09:51
2.1.3 Electrical Isolation
The manufacturing process of optical fiber use polymers of either plastic or glass. This
is also the reason why optical fibers do not maintain an earth loop. Here earth loop or
ground loop means an unwanted electrical current. Two terminals in an electrical con-
ductor are adjusted to the same potential while the ground is connected to the opposite
potential. Consequently, when current flows through the conductor an electromagnetic
field is produced. As a result, EMI occurs in the electrical conductor.
On the other hand, as stated before, the optical fiber has three layers. The refractive
density of the core and the cladding is different. As a result, crosstalk or EMI is minimal
in optical fiber. For this reason, optical fiber communication is perfect for use in hazard-
ous electrically conditions since optical fibers cannot produce electrical short circuits.
The manufacturing medium for optical fiber is primarily glass. The glass, in turn, is pro-
duced from sand, which is a widely available natural resource. Consequently, the manu-
facturing process for optical fiber allows for low potential cost when compared to the
manufacturing process of copper conductors.
2.1.4 Reliability
Reliability is very high in optical fibers and losses are very low in optical fiber transmis-
sions. For boosting transmitted signal, line amplifiers and repeaters are often used. That
is why the reliability of optical transmission systems is higher than in the case of elec-
trical conductors.
2.2. Shortcomings of Optical Fiber Transmission
6
Optical fiber transmissions have two fundamental shortcomings: transmission angles
and bandwidth limitations. Furthermore, impurities and the phenomenon of glass ab-
sorption also create losses in optical fibers.

MEE09:51
Losses occur in optical fibers mainly when the fiber is bended at an angle. As a result,
the light can leak out from the cladding. There are three windows of wavelengths used
in optical communications.
In addition, losses are also related to the wavelength. For instance, the 850 nm wave-
length has a loss of 4-5 dB/km. For the 1310 nm wavelength, the loss is 3 dB/km and
for 1550 nm wavelength the loss is 1 dB/km.
Figure 1: Light path in optical fiber
The loss depends on the light paths because light may have different paths within an
optical fiber. Figure 1 illustrates the loss for different light paths.
2.3 Characteristics of Optical Fibers
The characteristics of optical fiber communications are divided into two main categories,
namely linear and nonlinear.
2.3.1 Linear Characteristics
The main linear characteristics of optical fibers are: attenuation, chromatic dispersion,
polarization mode dispersion and optical SNR.
7
MEE09:51
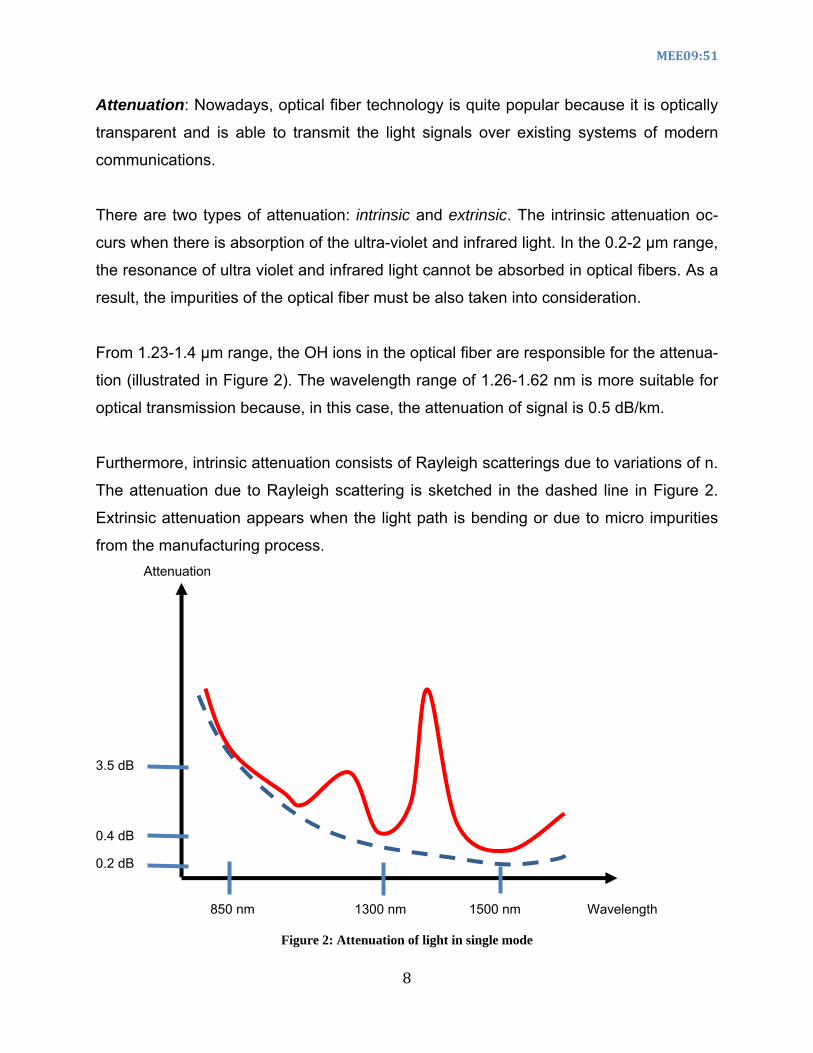
Attenuation: Nowadays, optical fiber technology is quite popular because it is optically
transparent and is able to transmit the light signals over existing systems of modern
communications.
There are two types of attenuation: intrinsic and extrinsic. The intrinsic attenuation oc-
curs when there is absorption of the ultra-violet and infrared light. In the 0.2-2 µm range,
the resonance of ultra violet and infrared light cannot be absorbed in optical fibers. As a
result, the impurities of the optical fiber must be also taken into consideration.
From 1.23-1.4 µm range, the OH ions in the optical fiber are responsible for the attenua-
tion (illustrated in Figure 2). The wavelength range of 1.26-1.62 nm is more suitable for
optical transmission because, in this case, the attenuation of signal is 0.5 dB/km.
Furthermore, intrinsic attenuation consists of Rayleigh scatterings due to variations of n.
The attenuation due to Rayleigh scattering is sketched in the dashed line in Figure 2.
Extrinsic attenuation appears when the light path is bending or due to micro impurities
from the manufacturing process. Attenuation
8
3.5 dB
0.4 dB
0.2 dB
850 nm 1300 nm 1500 nm Wavelength
Figure 2: Attenuation of light in single mode

MEE09:51
Figure 2 illustrates the attenuation of three wavelength windows. These windows are
the following: 850 nm, 1300 nm and 1500 nm.
The attenuation (measured in decibels (dB)) for the 850 nm, 1300 nm and 1500 nm
window is 3.5 dB, 0.4 dB and 0.2 dB respectively.
In our thesis we use the 1500 nm wavelength. In the above figure there are two lines.
One solid line and one dashed line. The solid line illustrates the typical shape which is
followed in the 1990’s. The dashed line shows the actual shape of the attenuation of the
single mode fiber.
Chromatic Dispersion: There are several reasons for the reduced performance of opt-
ical fiber communications. Chromatic dispersion is such an effect which can reduce the
performance of passive optical networks.
Chromatic dispersion is the combinations of mainly two factors: dispersion of material
and dispersion of the waveguide. Mathematically we can write
)1(wgMT DDD +=
where denotes the total dispersion, while and defines the material and the
waveguide dispersion respectively [7].
TD MD wgD
Chromatic dispersion is the effect of pulse spreading (or broadening) and can reduce
the integrity of a received signal unless appropriate dispersion modules are included in
the optical communication system [7].
Simulated results of the power at the input and output of the optical fiber are shown in
Figure 3 [8].
9

MEE09:51
Figure 3: Chromatic dispersion in optical fiber
Here is the power of the optical fiber per chip. From the figure we can see that data is
not uniformly changed. The reason for this is that the power is increased when coding of
two data streams are superimposed for the same duration in the chip. As a result, more
superimposed coded data spreads the available data per chip.
cT
This phenomenon interferes with adjacent chips. For this reason, errors are also in-
creased which in turn, reduces optical system performance. Mainly, this effect occurs
when multiple users are using the system.
Consequently, we can conclude that data spreading adversely affects the OCDMA sys-
tem and shortens the light pulses. In such cases, it is necessary to take into account the
fiber dispersion effects and compare them to MAI limitations [8].
Polarization Mode Dispersion: Polarization mode dispersion occurs when various light
planes propagates through the optical fiber at slightly various speeds. Consequently,
polarization mode dispersion reduces the performance of the optical network at higher
data rates.
10
MEE09:51
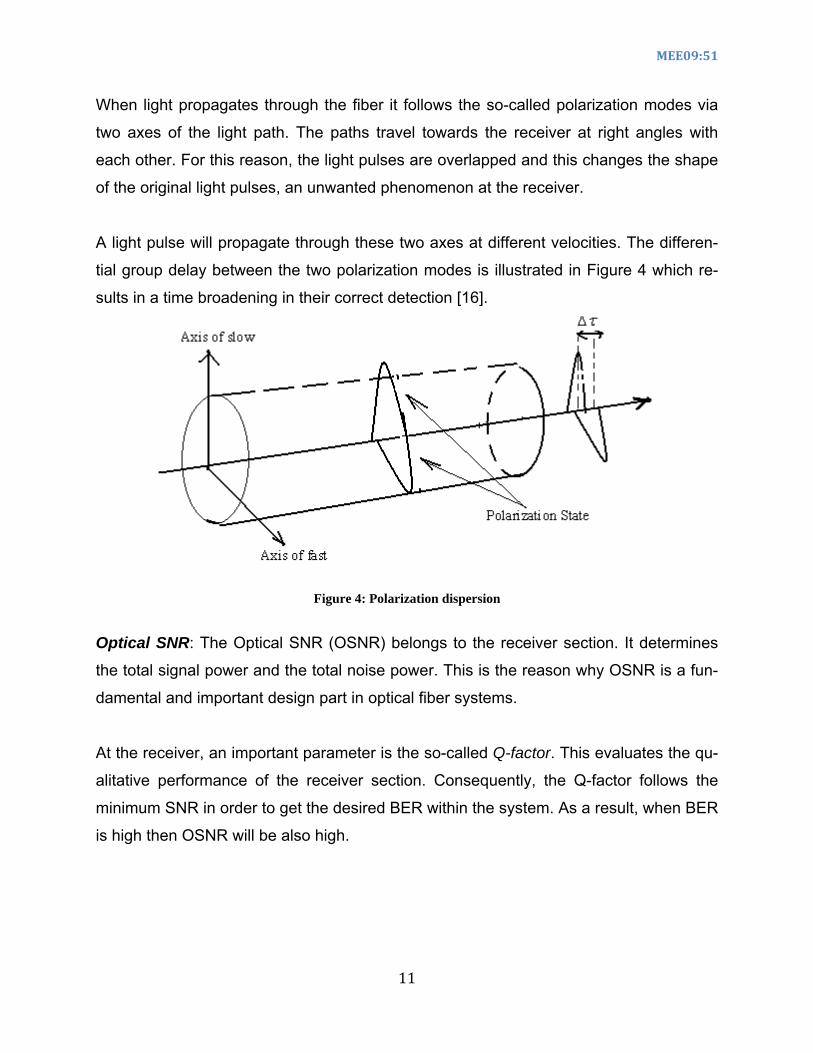
When light propagates through the fiber it follows the so-called polarization modes via
two axes of the light path. The paths travel towards the receiver at right angles with
each other. For this reason, the light pulses are overlapped and this changes the shape
of the original light pulses, an unwanted phenomenon at the receiver.
A light pulse will propagate through these two axes at different velocities. The differen-
tial group delay between the two polarization modes is illustrated in Figure 4 which re-
sults in a time broadening in their correct detection [16].
Figure 4: Polarization dispersion
Optical SNR: The Optical SNR (OSNR) belongs to the receiver section. It determines
the total signal power and the total noise power. This is the reason why OSNR is a fun-
damental and important design part in optical fiber systems.
At the receiver, an important parameter is the so-called Q-factor. This evaluates the qu-
alitative performance of the receiver section. Consequently, the Q-factor follows the
minimum SNR in order to get the desired BER within the system. As a result, when BER
is high then OSNR will be also high.
11

MEE09:51
2.3.2 Non Linear Characteristics
The scope of the non linear effects is to describe various characteristics of the optical
fiber that occur when the power of the optical fiber is defined between 50-65 µm. For
this reason, the intensity of the electromagnetic field behaves nonlinear.
In this section we will try to differentiate between several nonlinearities, both elastic and
inelastic and as a result, the energy is exchanged in the medium. The major non linear
characteristics in optical fibers are as follows:
• Cross Phase Modulation
• Self Phase Modulation
• Four Wave Mixing
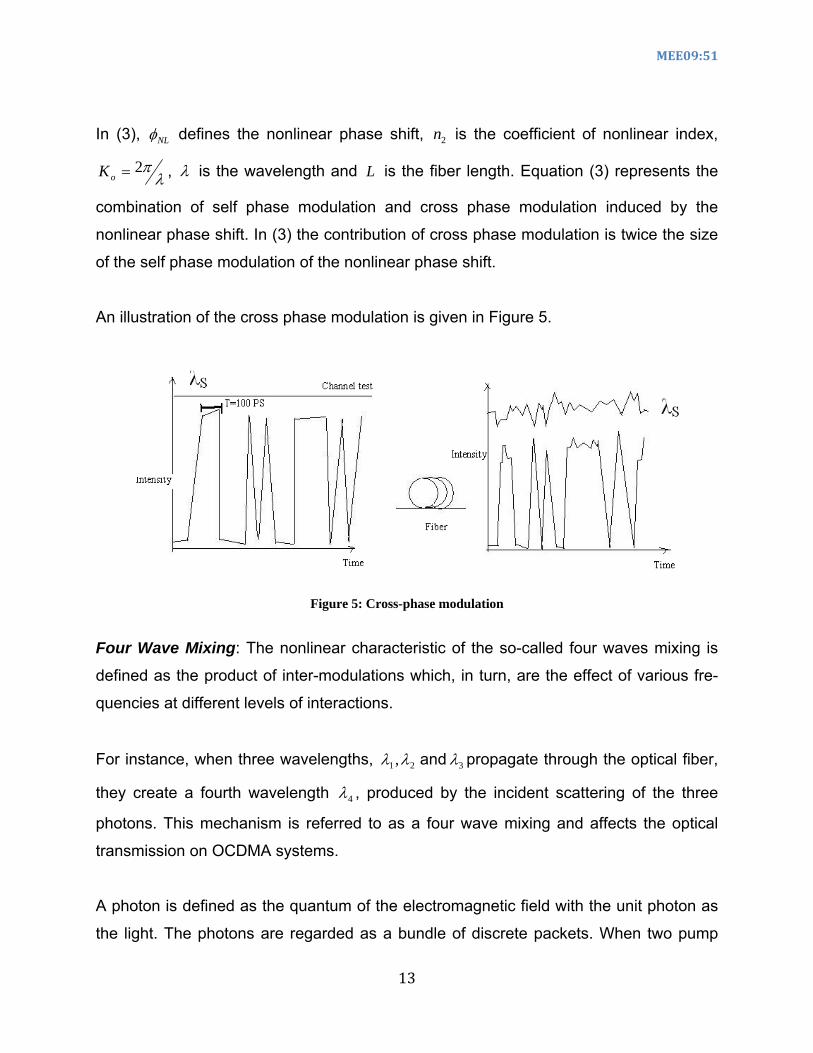
Cross Phase and Self Phase Modulation: Are the most significant parts of nonlinear
characteristics and are derived from the refractive index of the optical fiber. Self phase
modulation is defined as the phase shift of light self induction when propagating through
the optical fiber. Cross phase shift modulation is defined as the nonlinear phase shift
originating from the optical field for various wavelengths.
When two optical fields, with frequencies are polarized along the x axis, they
propagate simultaneously inside the fiber as
21 WW and
( ) ( )[ ] ( )2.expexp21
2211 cctiwEtiwExE +−+−=
This formula, expressed through self phase and cross phase modulation becomes [16]:
)2( 2202 EELKnNL +=φ (3)
12
In (2), E is defined as the envelope of the frequency, x is the polarization direction,
is the envelope of frequency of cross phase modulation, is the envelope of fre-
quency of self phase modulation, and is the counter clockwise direction. Further,
is the exponential function where is the angular frequency, is the time
period and is the imaginary part of the complex function.
1E
2E
cc.
( iwt)−exp w t
i
MEE09:51
In (3), NLφ defines the nonlinear phase shift, is the coefficient of nonlinear index,2n
λπ2=oK , λ is the wavelength and L is the fiber length. Equation (3) represents the
combination of self phase modulation and cross phase modulation induced by the
nonlinear phase shift. In (3) the contribution of cross phase modulation is twice the size
of the self phase modulation of the nonlinear phase shift.
An illustration of the cross phase modulation is given in Figure 5.
Figure 5: Cross-phase modulation
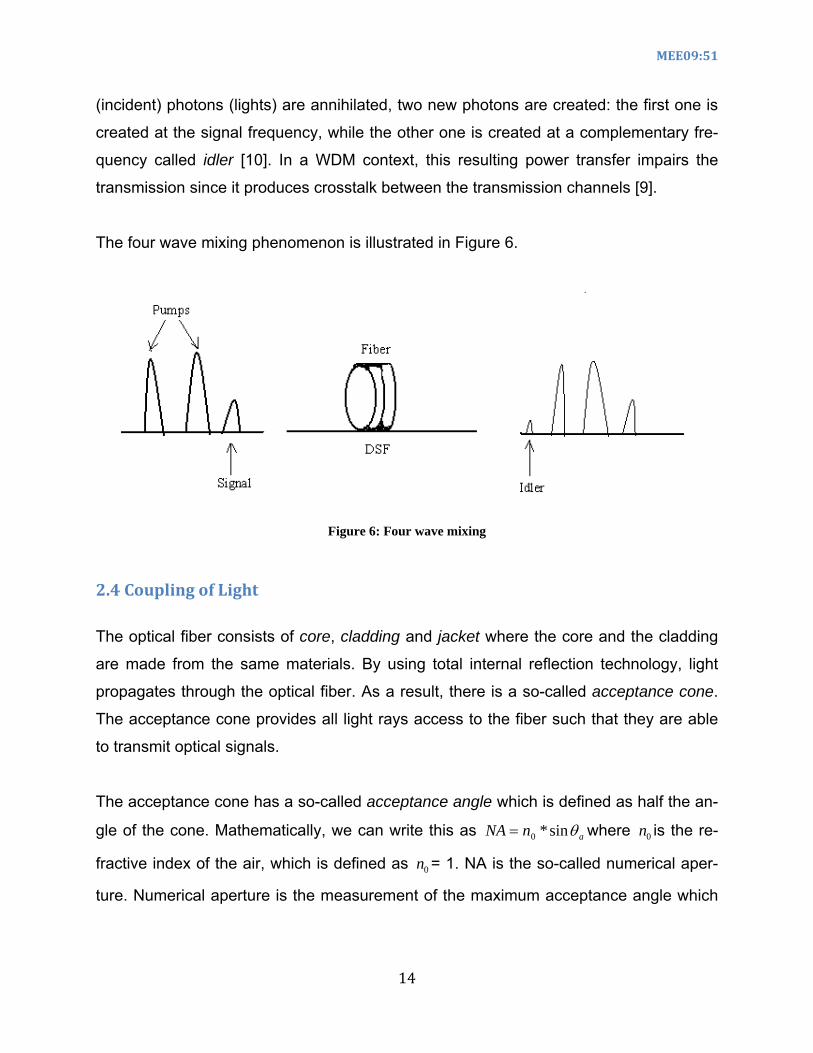
Four Wave Mixing: The nonlinear characteristic of the so-called four waves mixing is
defined as the product of inter-modulations which, in turn, are the effect of various fre-
quencies at different levels of interactions.
For instance, when three wavelengths, 321 , λλλ and propagate through the optical fiber,
they create a fourth wavelength 4λ , produced by the incident scattering of the three
photons. This mechanism is referred to as a four wave mixing and affects the optical
transmission on OCDMA systems.
13
A photon is defined as the quantum of the electromagnetic field with the unit photon as
the light. The photons are regarded as a bundle of discrete packets. When two pump
MEE09:51
(incident) photons (lights) are annihilated, two new photons are created: the first one is
created at the signal frequency, while the other one is created at a complementary fre-
quency called idler [10]. In a WDM context, this resulting power transfer impairs the
transmission since it produces crosstalk between the transmission channels [9].
The four wave mixing phenomenon is illustrated in Figure 6.
Figure 6: Four wave mixing
2.4 Coupling of Light The optical fiber consists of core, cladding and jacket where the core and the cladding
are made from the same materials. By using total internal reflection technology, light
propagates through the optical fiber. As a result, there is a so-called acceptance cone.
The acceptance cone provides all light rays access to the fiber such that they are able
to transmit optical signals.
The acceptance cone has a so-called acceptance angle which is defined as half the an-
gle of the cone. Mathematically, we can write this as anNA θsin*0= where is the re-
fractive index of the air, which is defined as = 1. NA is the so-called numerical aper-
ture. Numerical aperture is the measurement of the maximum acceptance angle which
0n
0n
14

MEE09:51
adjusts the light and transmits the light through a fiber. Consequently, NA is equivalent
to the sine of the acceptance angle.
The acceptance cone is illustrated in Figure 7.
Figure 7: Acceptance cone In Figure 7, (1) indicates the accepted light ray and (2) indicates the light ray that was
not accepted. Consequently, we can define the range for the propagating light through
the optical fiber as where is the refractive index of the air, is the re-
fractive index of the core and is the refractive index of the cladding.
120 nnn ∠∠
n
0n 1n
2
Furthermore, there are two light propagation modes in optical fibers. These propagation
modes depend on the size of the core. These are:
• Single Mode Fiber
• Multimode Fiber
The diameter size of the core in single mode fiber is usually small. That is why light
coupling with single mode fiber is difficult when using as a transmitter source a Light
Emitting Diode (LED).
15
For this reason, in order to compensate the coupling losses, LASER is used as trans-
mitting source in single mode optical fibers. This is also the reason why, single mode
fiber is used for transmissions over long distances.
MEE09:51
2.5 Intensity Modulation and Optical Amplification
There are three physical characteristics of the optical fibers that allow transmitting in-
formation. These are:
1. Polarization
2. Phase
3. Intensity
However, several characteristics of the optical fibers such as linearity and nonlinearity
directly affect the performance of OCDMA. These are Polarization Mode Dispersion
(PMD), Group Velocity Dispersion (GVD), Four Wave Mixing (FWM) and Cross Phase
Modulation (XPM).
We know light travels towards the receiver through the optical fiber with each other at
right angles. As a result, for the PMD, the pulses of light are overlapped and change the
original shape of the light pulses.
GVD appears due to various velocities of the various frequency parts of the pulse prop-
agating through the optical fiber. GVD spreads the short pulse of light in time. FWM is
the result of different frequencies at various levels of interactions. XPM appears for dif-
ferent wavelengths in the optical field.
To overcome these impairments, cost effectiveness and efficient transport of the spec-
tral optical system must be realized. When OSNR is decreased, the optical signal power
is increased due to the nonlinear effects of the optical fiber. This reduces the perfor-
mance of a passive optical network.
To limit this problem, we need to compensate the effects of dispersion with intensity
modulations in order to achieve higher transmissions per channel. Consequently, in or-
der to overcome the physical limitations of the optical fiber we need various technical
solutions such as optical signal amplifiers.
16

MEE09:51
2.5.1 Erbium Doped Fiber Amplifier
One such technical solution to the problem of optical amplifiers is the Erbium Doped Fi-
ber Amplifier (EDFA). This particular amplifier is able to amplify the signal without first
conversion of the signal from the electrical domain to the optical domain. By doing so,
there is less noise produced in the signal than when an amplifier needs to do conver-
sion of the electrical signal.
Among the three wavelength windows, EDFA uses only the 1550 nm window. EDFA is
made of solid state material and the Erbium ion is doped in the optical fiber´s
core. When transition occurs, there are two types of emissions that take place here.
These are the spontaneous emission and the stimulated emission.
)3( +rE
An illustration of the stimulated emission is depicted in Figure 8.
Figure 8: Stimulated emission
17

MEE09:51
18
MEE09:51
3. System Description
3.1. Future of OCDMA Systems
Although in the Code Division Multiple Access (CDMA) system soft capacity is obtained,
the system faces interference in case of two users simultaneously access the communi-
cation channel which, in turn, degrades the performance of the CDMA system. Conse-
quently, the main shortcoming of the CDMA system is multiple users’ access of the
communication channel.
For this reason, scientists and researchers are looking at systems that enable transmis-
sion without interference when considering multiple users. That’s why scientists turned
their attention on the Optical CDMA, a system that tries to improve the shortcoming of
the classic CDMA system.
Nevertheless, there are several differences between the electrical and the optical
CDMA. The optical CDMA is very important and becoming increasingly popular due to
its high available bandwidth and elimination of cross talks. In the OCDMA system, mul-
tiple users can access the same channel with help of various coding techniques. These
codes help maintaining low correlation between users and also help maintain low inter-
ference for each user.
3.2. System Description
The OCDMA technology is a relatively new, that emerged and gained focus for the re-
search community during the last twenty years. The OCDMA implementation depends
on several factors such as for instance the desired number of users.
In OCDMA, the transmission signal may be subjected to conversion from electrical-to-
optical, optical-to-optical or optical-to-electrical signal domain.
19
MEE09:51
In this thesis, the OCDMA system consists of five main sections:
1. Data source (i.e., transmitting computer).
2. Optical CDMA encoder.
3. Optical star coupler: Device that accepts one input signal and is able to output to
several. At last, using the PN sequence receiver can receive his desired signal.
However star coupler has a loss. But this is very poor.
4. The 4th section is the optical CDMA decoder.
5. Data sink (i.e., receiving computer).
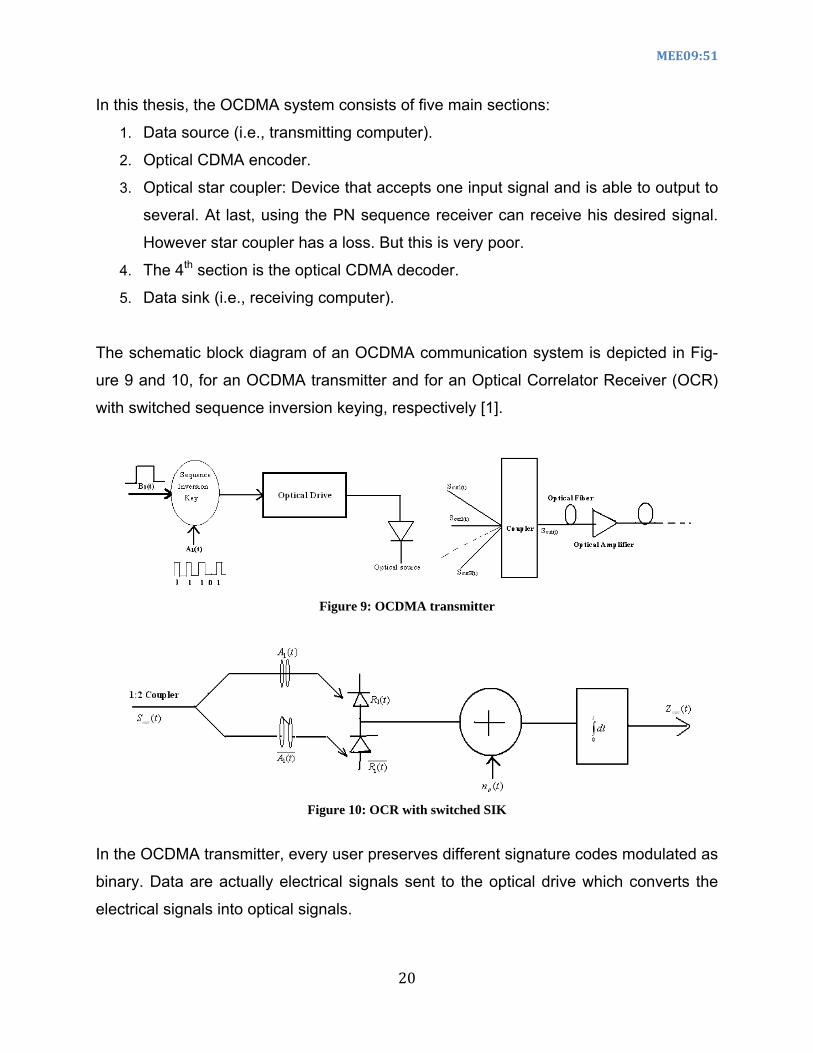
The schematic block diagram of an OCDMA communication system is depicted in Fig-
ure 9 and 10, for an OCDMA transmitter and for an Optical Correlator Receiver (OCR)
with switched sequence inversion keying, respectively [1].
Figure 9: OCDMA transmitter
Figure 10: OCR with switched SIK
In the OCDMA transmitter, every user preserves different signature codes modulated as
binary. Data are actually electrical signals sent to the optical drive which converts the
electrical signals into optical signals.
20

MEE09:51
The encoded signal is further sent to the star coupler. The star coupler used depends
on the topology of the network which can be either a LAN or an access network.
In case of a LAN, the star coupler is N:N, while in an access network, the star coupler is
1:N. Further, in OCDMA every user shares the same channel. For this reason, crosstalk
which is interference due to multiple accesses is introduced here. In order to reduce this
unwanted interference, every user uses various signature sequences.
On the other hand, in the OCR with switched sequence inversion keying, an optical
switched correlator is used. Consequently, a bipolar reference sequence is correlated
directly with the channel’s unipolar signature sequence in order to recover the original
data [1].
The unipolar-bipolar correlation is practically realized in an optical correlator, by spread-
ing the bipolar reference sequence into two complementary unipolar reference se-
quences. In addition, the optical correlator provides unipolar switching functions for de-
spreading the optical channel signal [5].
The PIN photodiode is also known as the p-i-n photo-receiver. Here, i is the intrinsic re-
gion which is un-doped between the doped regions of n and p. Finally, the PIN photodi-
ode cancels the de-spreaded signal integrated with the periodic data. This occurs be-
fore the detection of the zero threshold voltage.
3.3 Noise in OCDMA
In OCDMA systems there are various noises creating spontaneous fluctuation, namely:
• Dark current noise.
• Thermal noise.
• Quantum shot noise.
21
MEE09:51
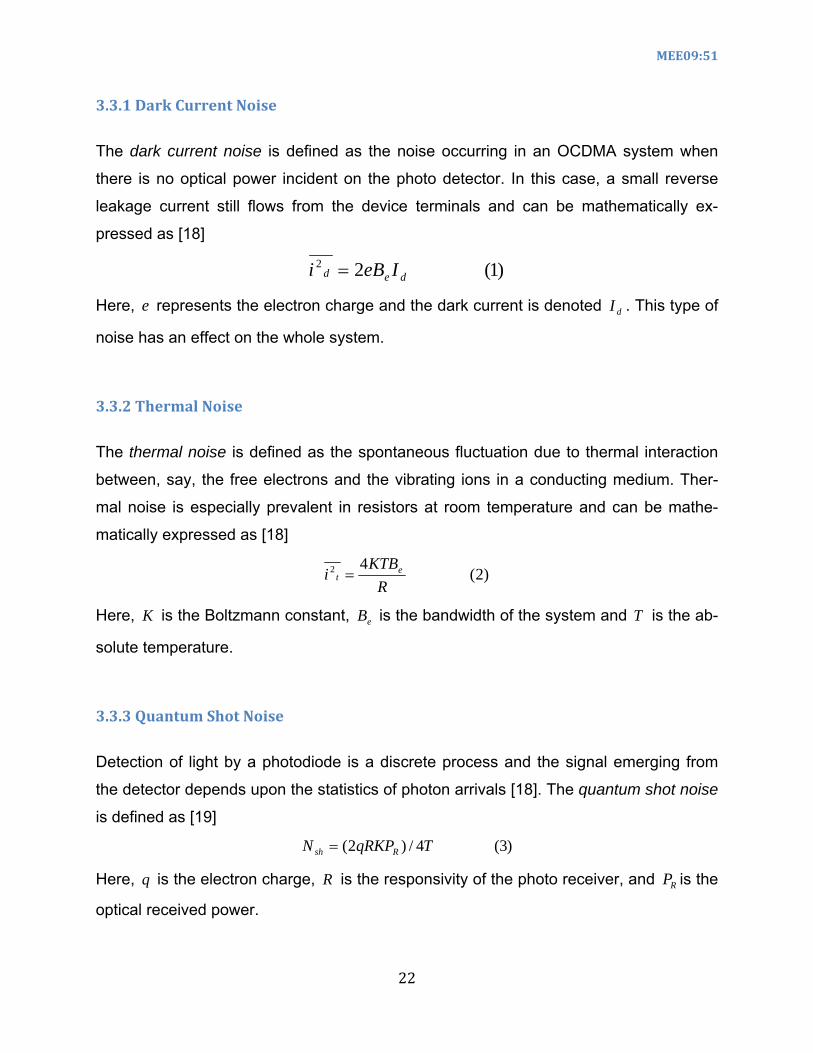
3.3.1 Dark Current Noise
The dark current noise is defined as the noise occurring in an OCDMA system when
there is no optical power incident on the photo detector. In this case, a small reverse
leakage current still flows from the device terminals and can be mathematically ex-
pressed as [18]
)1(22ded IeBi =
Here, represents the electron charge and the dark current is denoted . This type of
noise has an effect on the whole system.
e dI
3.3.2 Thermal Noise
The thermal noise is defined as the spontaneous fluctuation due to thermal interaction
between, say, the free electrons and the vibrating ions in a conducting medium. Ther-
mal noise is especially prevalent in resistors at room temperature and can be mathe-
matically expressed as [18]
)2(42
RKTB
i et =
Here, K is the Boltzmann constant, is the bandwidth of the system and T is the ab-
solute temperature.
eB
3.3.3 Quantum Shot Noise
Detection of light by a photodiode is a discrete process and the signal emerging from
the detector depends upon the statistics of photon arrivals [18]. The quantum shot noise
is defined as [19]
)3(4/)2( TqRKPN Rsh =
Here, is the electron charge, q R is the responsivity of the photo receiver, and is the
optical received power.
RP
22

MEE09:51
3.4. System Analysis
At the OCDMA transmitter, the SIK (Sequence Inversion Keying) modulated signal is
sent to the optical drives through a laser diode. Consequently, the output for thK users
can be mathematically expressed as [3]
)4()()()(1
0c
N
lkkTk lTtAtBPtS −⊗= ∑
−
=
In (4), represents the transmitted output pulse shape for different users in single
mode fiber while l represents the period of the chip and is the optical power of the
chip. Furthermore, and represent the user´s binary signal and signature codes,
respectively.
)(tSk
TP
kB kA
The operator ⊗ represents the sequence inversion key modulation so that when is
transmitted for a ”1”,
kA
kA is transmitted for a ”0”, respectively. Furthermore, is the
pulse interval.
cT
In the OCR with switched sequence inversion keying, due to chromatic dispersion of the
optical fiber, the output can be expressed mathematically as [3]
)5()(
sin*1)()
4(
)()1(1
0
2
c
csign
TlTt
jn
loutput T
lTtcetS c
c
πγπγ
γπ
γ −=
⎥⎥
⎦
⎤
⎢⎢
⎣
⎡−⎥
⎦
⎤⎢⎣
⎡ −−−
=∑
Here, γ represents the index of chromatic dispersion of the optical fiber which, in turn,
can be expressed mathematically as [5]
)6())((
)( 22
LDbc cπ
λγ =
In (6), λ represents the wavelength of the optical carrier, is the light velocity and c L is
the fiber length. Further, describes the coefficient of chromatic dispersion of the opti-
cal fiber while the rate of the chip is .
D
cb
23

MEE09:51
Consequently, we can state that when the fiber length is increased, the index of chro-
matic dispersion in the fiber is also increased.
The receiver section handles the de-spreaded signal. The signal is sent to the photo de-
tector and is integrated in the output of the correlator for the ith user. This can be ma-
thematically expressed as [3]
)7()(*)()(*)()()(2
)(0 1
1
0 00∫∑∑ ∫
=
−
=
+−−−−⊗=T K
K
N
l
T
cicicKoutKR
i dttndtlTtAlTtAlTtAtStBRPtZ
Here, the photodiode´s responsivity is given by R, K represent the concurrent number of
users, is the noise of the channel which as seen in the output of the optical correla-
tor. represents the optical received power given by [5]
0n
RP
)8(fTR PPP −=
In (8), is the transmitted optical power while the loss in the optical fiber is . TP fP
The first part of the output signal described by (4) is compensated by considering the
mean of the signature code, denoted as U while the remaining part represents the noise
occurring in the channel due to multiple accesses of the channel, chromatic dispersion
and various noises for the spontaneous signal fluctuations in the receiver.
This is described by the variance of the system, denoted as . The mean of is
given by [3]
2σ )(tZi
)9()(4 0
1
0∫∑
−
=
−=T N
lcout
R dtlTtST
RPU
The interference variance due to multiple accesses is given by [20]
)10(3
)1(222
NKU −
=σ
The noise of the variance , is a combination of thermal noise and noise of the shot
power and is given by
)(0 tn
)11(THSHo NNN +=
24

MEE09:51
The thermal noise and the shot noise of the photo detector are given by [5] THN
)12(*)4(
L
rrBTH R
BTKN =
)13(4
2T
qRKPN RSH =
In (9) and (10), represents the Boltzmann constant while the bandwidth of the re-
ceiver is given by . Further, the temperature of the receiver is and the charge of the
electron is q. The resistance of the receiver load is denoted .
BK
rB rT
LR
The SNR and BER of the OCDMA system are given by [1]
)14(0
2
2
NUSNR+
=σ
)15()2
()21( SNRerfcBER =
3.5. Advantages of OCDMA
Some of the main advantages of using OCDMA systems can be summarized as follows:
• Equal distribution of available bandwidth.
• Control and organization of the network.
• Provisioning of value-added services.
• Security.
3.5.1 Bandwidth
25
In OCDMA, users can access equal portions of the available channel bandwidth. Here,
the bandwidth is equally shared by all active users and can be divided into virtual chan-

MEE09:51
nels. Consequently, the OCDMA system users can equally share access of the availa-
ble resources of the network.
Further, this is also the reason why, no single user one can block another from access-
ing the optical channel, one major advantage of OCDMA networks.
3.5.2 Network Control
In OCDMA technology, the optical codes of optical are distributed in such a way that,
the peak autocorrelation for the shifted and non shifted optical signals can be alterna-
tively small or large. Consequently, the optical receivers can manipulate asynchronously
these signals without the need of global clock synchronization between them. In this
way, the OCDMA technology can properly manipulate and control the signal transmitted
within the whole system.
3.5.3 Valueadded Services
OCDMA uses different types of optical codes. In this way, various services for different
types of traffic can be easily introduced. For example, the code rate for high and low
importance traffic can be set different such that transfer of e.g., real time audio/video
signals and electronic mail can be give different priorities. Consequently, OCDMA plays
an important role in providing customized or value-added services to its users.
3.5.4 Security
If we consider an OCDMA system with 41 wavelengths and 961 time chips, it will re-
quire 1350 years trying all possible combinations before the code could be broken.
26
Meanwhile, in one second, the OCDMA system can have more than 107 such codes
are used. For this reason, the security of the OCDMA system is inherent within the
OCDMA technology, which is a major advantage of OCDMA-enabled networks.
MEE09:51
3.6. Drawbacks of OCDMA In spite of their many advantages, OCDMA systems suffer from several drawbacks
which may be summarized as follows:
• Noise.
• Error correction.
• Encoding/Decoding.
• Security integration.
3.6.1 Noise
Beat and shot noise are both technological barriers of the physical channel which de-
grade the performance of the OCDMA network. Beat and shot noise are not appearing
on the same wavelengths in case of multiple accesses. This is why, for a fixed receiver,
the energy is used for a single channel wavelength. On the other hand in OCDMA sys-
tems, the total bandwidth is distributed.
That’s why beat and shot noise may be introduced in the wavelengths of the same
transmission channel. In OCDMA with the same wavelengths the channel bandwidth is
allocated which is the optical power from other user which guide o the shot noise.
Shot noise is defined as the optical root square of the received power and is direct pro-
portional to the number of users. This type of noise reduces the scalability of the OCD-
MA network.
3.6.2 Error Correction
27
Forward error correction is costly and unusable in OCDMA because the speed for carry-
ing the information in electrical cables and optical fiber is not same. For this reason, we
have to design specialized encoding and/or decoding devices in order to correct the er-
rors in case of optical signal transmissions.
MEE09:51
It is possible to design codes for forward error correction devices which exclusively de-
pend on optical signal processing, such as optical multiplexing and wavelength shifting.
As a result of such codes, we can manage error free transmissions in case of optical
signal processing.
3.6.3 Encoding/Decoding
The optical signal follows two dimensional codes. Fiber Bragg Grating (FBG) is a peri-
odic perturbation of the refractive index along the fiber length which is formed by expo-
sure of the core to an intense optical interference pattern [21]. The optical encoder sup-
ports FBG and has a predefined center frequency and temperature. For this reason a
wavelength control loops or robust encoding device is required in order to ease this ef-
fect.
3.6.4 Security Integration
Integration of hybrid laser technology represents a monetary cost barrier in optical
communication technologies. As a waveguide based encoder and as a waveguide
modulator, an array of tunable lasers integrated on the same substrate. Substrate refers
to the manufacturing materials. Semiconductor devices (i.e., glass) are manufactured
from this material. Consequently, a waveguide modulator and demodulator are cheaper
to manufacture than a monolithic LASER integration.
28
MEE09:51
4. System Performance
The OCDMA system performance is validated with a rate of 10*109 chips per second.
We evaluate the OCDMA system performance by looking at the BER for various users
and at the eye diagram penalty for 7 chip m-sequence signature (m-signature chip used
in our simulations was 1110010).
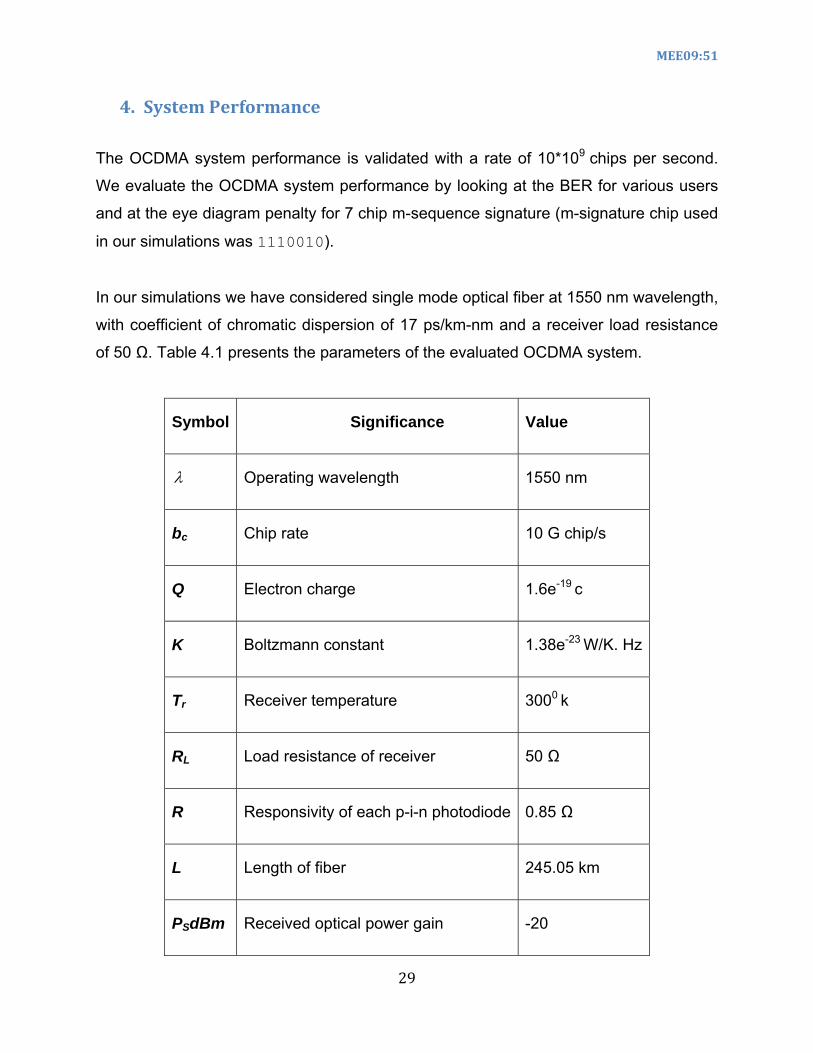
In our simulations we have considered single mode optical fiber at 1550 nm wavelength,
with coefficient of chromatic dispersion of 17 ps/km-nm and a receiver load resistance
of 50 Ω. Table 4.1 presents the parameters of the evaluated OCDMA system.
29
Symbol Significance Value
λ Operating wavelength 1550 nm
bc Chip rate 10 G chip/s
Q Electron charge 1.6e-19 c
K Boltzmann constant 1.38e-23 W/K. Hz
Tr Receiver temperature 3000 k
RL Load resistance of receiver 50 Ω
R Responsivity of each p-i-n photodiode 0.85 Ω
L Length of fiber 245.05 km
PSdBm Received optical power gain -20
MEE09:51
Idk Dark current 10 nA
Nth Thermal current 1 pA2Hz-1
D Coefficient of chromatic dispersion 17 ps/km-nm
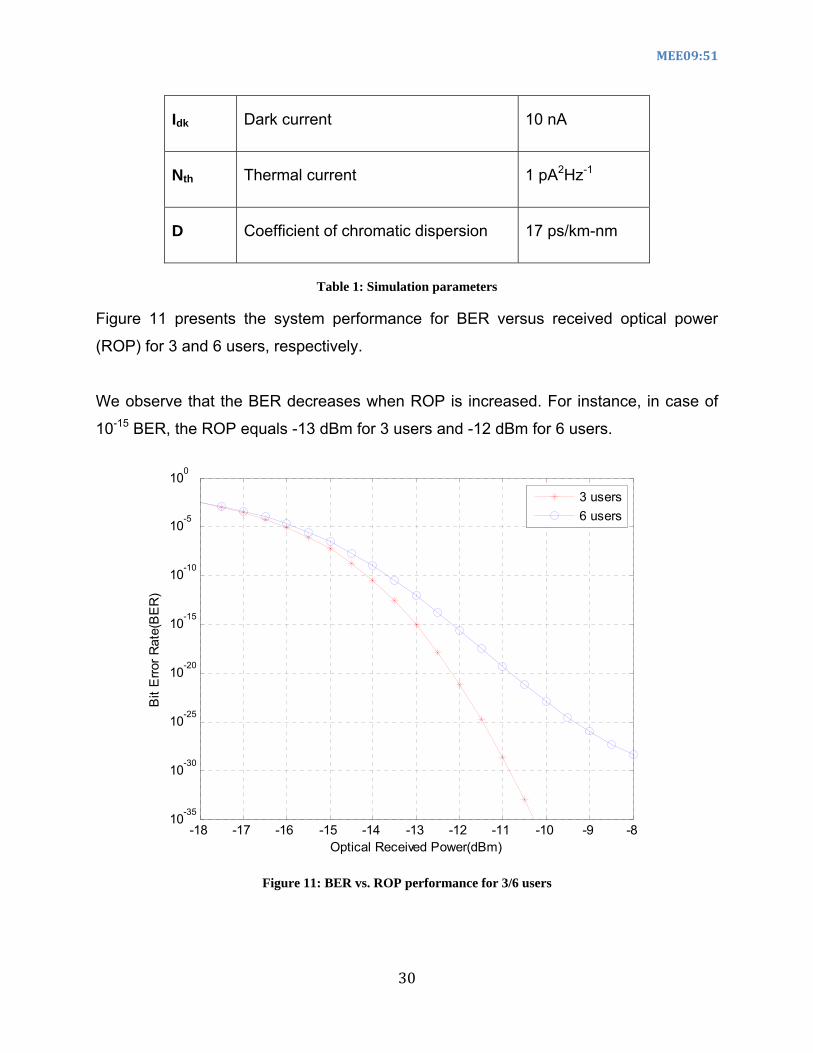
Table 1: Simulation parameters
Figure 11 presents the system performance for BER versus received optical power
(ROP) for 3 and 6 users, respectively.
We observe that the BER decreases when ROP is increased. For instance, in case of
10-15 BER, the ROP equals -13 dBm for 3 users and -12 dBm for 6 users.
-18 -17 -16 -15 -14 -13 -12 -11 -10 -9 -810-35
10-30
10-25
10-20
10-15
10-10
10-5
100
Optical Received Power(dBm)
Bit
Erro
r Rat
e(B
ER
)
3 users6 users
Figure 11: BER vs. ROP performance for 3/6 users
30

MEE09:51
Figure 12 illustrates the BER performance versus optical received power for 12 and 17
users, respectively.
For instance, in case of 10-10 BER, the optical received power is -12 dBm and -10 dBm
for 12 and 17 users, respectively.
-18 -17 -16 -15 -14 -13 -12 -11 -10 -9 -810-35
10-30
10-25
10-20
10-15
10-10
10-5
100
Optical Received Power(dBm)
Bit
Erro
r Rat
e(B
ER
)
12 users17 users
Figure 12: BER vs. ROP performance for 12/17 users
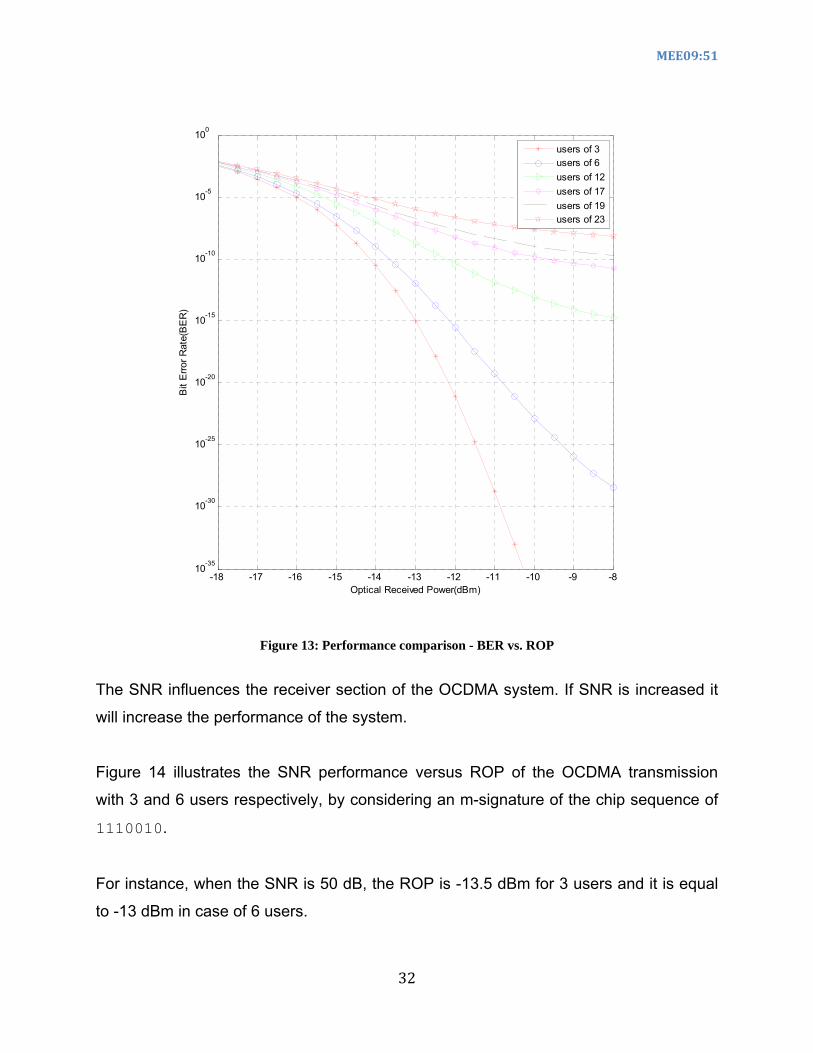
Figure 13 illustrates the BER performance versus ROP for up to 23 users. We observe
again that BER decreases when the ORP and the number of users is increased.
For instance, when we consider a 10-5 BER, the ROP is -14.8 dBm for 19 users while
for 23 users, this becomes -14.2 dBm.
31
MEE09:51
-18 -17 -16 -15 -14 -13 -12 -11 -10 -9 -810-35
10-30
10-25
10-20
10-15
10-10
10-5
100
Optical Received Power(dBm)
Bit
Erro
r Rat
e(B
ER
)
users of 3users of 6users of 12users of 17users of 19users of 23
Figure 13: Performance comparison - BER vs. ROP
The SNR influences the receiver section of the OCDMA system. If SNR is increased it
will increase the performance of the system.
Figure 14 illustrates the SNR performance versus ROP of the OCDMA transmission
with 3 and 6 users respectively, by considering an m-signature of the chip sequence of
1110010.
For instance, when the SNR is 50 dB, the ROP is -13.5 dBm for 3 users and it is equal
to -13 dBm in case of 6 users.
32

MEE09:51
-20 -18 -16 -14 -12 -10 -80
10
20
30
40
50
60
70
80
90
100
SN
R
Received optical power(dBm)
k=3k=6
Figure 14: SNR vs. ROP performance for 3/6 users
Figure 15 shows the SNR performance as simulated in Matlab of the SNR versus ROP
for 12 and 17 users, respectively.
For instance, when the SNR is 60 dB, the ROP is -9 and -8 for 12 and 17 users, respec-
tively.
33

MEE09:51
-20 -18 -16 -14 -12 -10 -80
10
20
30
40
50
60
70
80
90
100
SN
R
Received optical power(dBm)
k=12k=17
Figure 15: SNR vs. ROP performance for 12/17
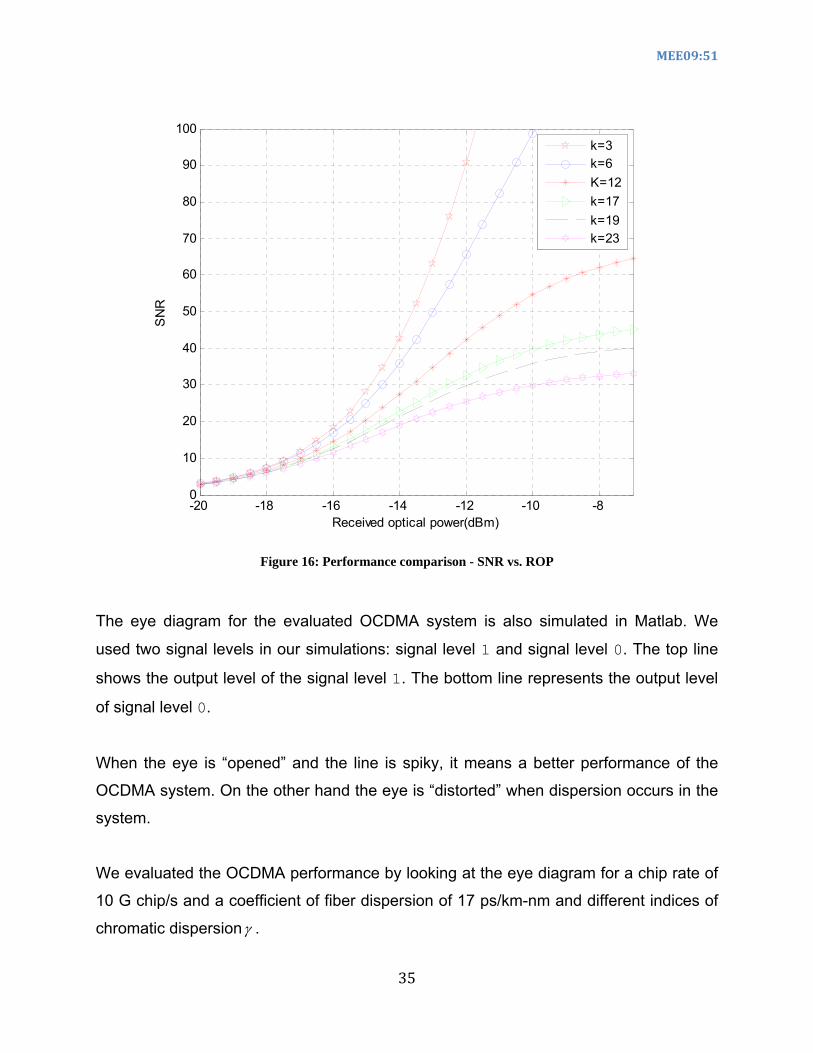
Figure 16 presents the SNR versus ROP of the OCDMA system for up to 23 users.
For instance, it is observed, that when the SNR is 30 dB, the ROP is -12 and -10 dBm
for 19 and 23 users, respectively.
34
MEE09:51
-20 -18 -16 -14 -12 -10 -80
10
20
30
40
50
60
70
80
90
100
SN
R
Received optical power(dBm)
k=3k=6K=12k=17k=19k=23
Figure 16: Performance comparison - SNR vs. ROP
The eye diagram for the evaluated OCDMA system is also simulated in Matlab. We
used two signal levels in our simulations: signal level 1 and signal level 0. The top line
shows the output level of the signal level 1. The bottom line represents the output level
of signal level 0.
When the eye is “opened” and the line is spiky, it means a better performance of the
OCDMA system. On the other hand the eye is “distorted” when dispersion occurs in the
system.
35
We evaluated the OCDMA performance by looking at the eye diagram for a chip rate of
10 G chip/s and a coefficient of fiber dispersion of 17 ps/km-nm and different indices of
chromatic dispersionγ .

MEE09:51
Figure 17 depicts the eye-diagram of the OCDMA system when γ = 0.1.
50 100 150 200 250 300 3500
0.2
0.4
0.6
0.8
1
1.2
1.4
1.6
number of samples in the chip
The
outp
ut o
f cur
rent
Eye diagram of index of chromaticdispersion=0.1 and rate of chip=10Gc/scoefficient of dispersion=17ps/km-nm
Figure 17: Eye-diagram - gamma = 0.1
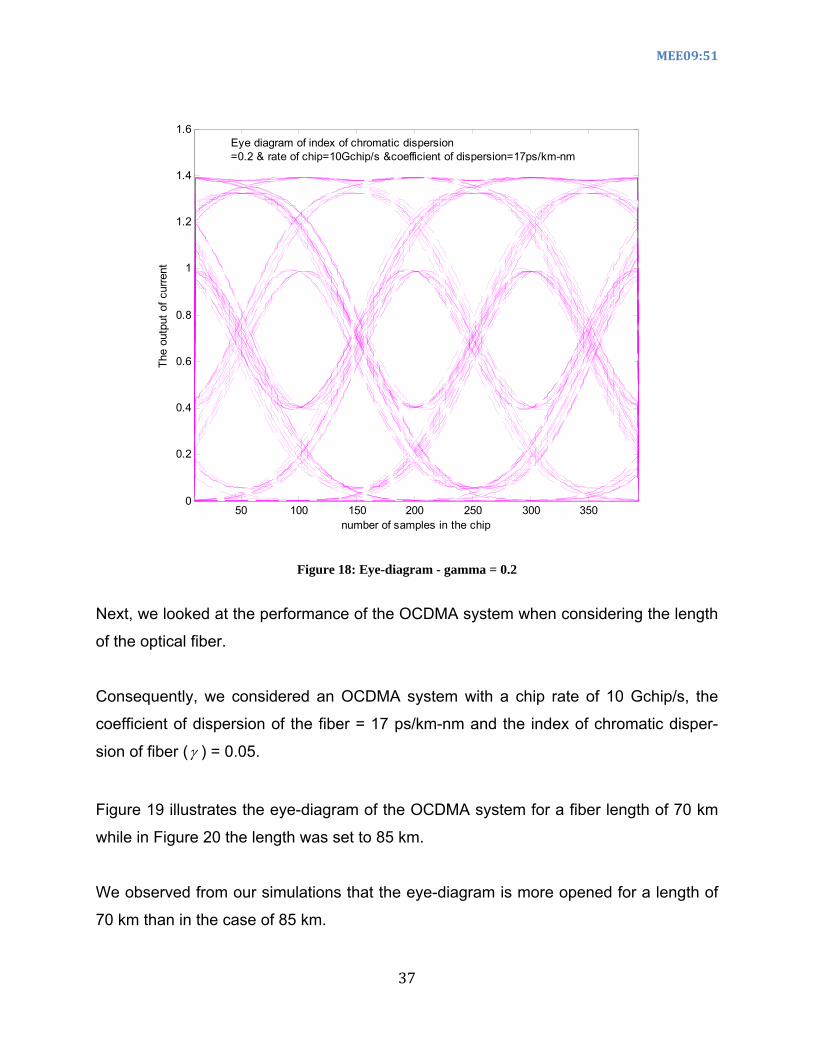
Figure 18 represents the eye-diagram of OCDMA when γ = 0.2.
We observe in figures 17 and 18, that the eye is more closed when the index of chro-
matic dispersion of fiber, γ = 0.2 than when this is 0.1.
We conclude that in order to obtain a good performance of the OCDMA system we
need to reduce the value of the index of chromatic dispersion in the optical fiber.
36
MEE09:51
50 100 150 200 250 300 3500
0.2
0.4
0.6
0.8
1
1.2
1.4
1.6
number of samples in the chip
The
outp
ut o
f cur
rent
Eye diagram of index of chromatic dispersion=0.2 & rate of chip=10Gchip/s &coefficient of dispersion=17ps/km-nm
Figure 18: Eye-diagram - gamma = 0.2
Next, we looked at the performance of the OCDMA system when considering the length
of the optical fiber.
Consequently, we considered an OCDMA system with a chip rate of 10 Gchip/s, the
coefficient of dispersion of the fiber = 17 ps/km-nm and the index of chromatic disper-
sion of fiber (γ ) = 0.05.
Figure 19 illustrates the eye-diagram of the OCDMA system for a fiber length of 70 km
while in Figure 20 the length was set to 85 km.
We observed from our simulations that the eye-diagram is more opened for a length of
70 km than in the case of 85 km.
37

MEE09:51
50 100 150 200 250 300 3500
0.2
0.4
0.6
0.8
1
1.2
1.4
1.6
number of samples in the chip
The
outp
ut o
f cur
rent
Eye diagram of of index of chromaticdispersion=0.05 &Chip rate=10Gchip/sCoefficient of dispersion=17ps/km-nmLength of fiber is 70km
Figure 19: Eye-diagram for 70 km fiber length
38

MEE09:51
50 100 150 200 250 300 3500
0.2
0.4
0.6
0.8
1
1.2
1.4
1.6
number of samples in the chip
The
outp
ut o
f cur
rent
Eye diagram of index of chromatic dispersion=0.05Chip rate is 10Gch/s & coefficient of dispersion is 17ps/km-nmLengths of fiber is 85 km
Figure 20: Eye-diagram for 85 km fiber length
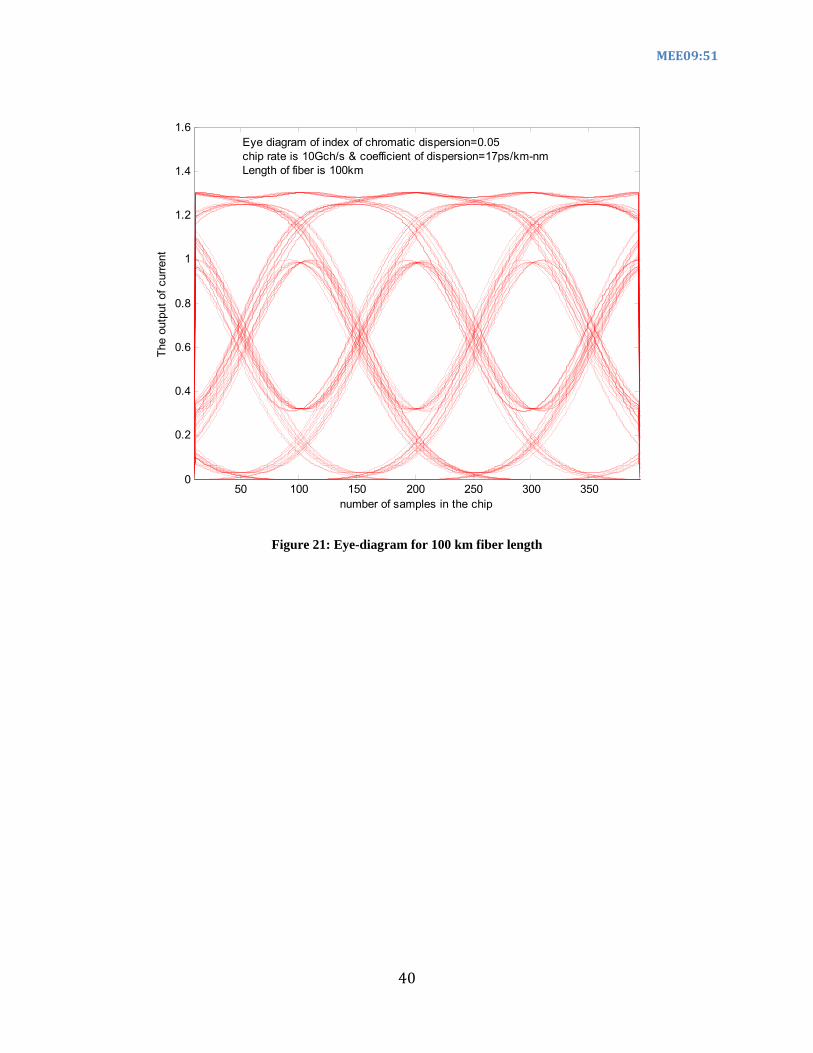
Furthermore, we also looked at the eye-diagram of the OCDMA system for a fiber
length of 100 km (Figure 21).
We observed from all our simulations that the eye is more closed for longer fiber lengths
with the same index of chromatic dispersion.
We also observed that, in order to maintain a better performance of the OCDMA system
we need also to reduce the index of the chromatic dispersion of the optical fiber.
39
MEE09:51
50 100 150 200 250 300 3500
0.2
0.4
0.6
0.8
1
1.2
1.4
1.6
number of samples in the chip
The
outp
ut o
f cur
rent
Eye diagram of index of chromatic dispersion=0.05chip rate is 10Gch/s & coefficient of dispersion=17ps/km-nmLength of fiber is 100km
Figure 21: Eye-diagram for 100 km fiber length
40
MEE09:51
5. Conclusion and Future Work
According to our OCDMA system analysis, the performance of BER is evaluated at an
operating wavelength of 1550 nm, a chip rate of 10*109 chip/s and for different numbers
of users.
We also considered the shot and the thermal noise with MAI. We observed that a higher
power of the optical transmitter is required in order to maintain a 10-9 BER for increasing
number of users.
We also observed the behavior of the OCDMA system by looking at the eye diagram of
the OCDMA network with a coefficient of fiber dispersion of 17 ps/km-nm and an index
of chromatic dispersion of the optical fiber γ = 0.05 and when considering different
lengths of the optical fiber.
The more closed the eye-diagram is, the worse performance the OCDMA system has.
For instance, we found that for an index of chromatic dispersion of 0.05 and a coeffi-
cient of fiber dispersion equal to 17 ps/km, the eye-diagram is more opened at 70 km
than at 100 km.
We noticed also that when the fiber length is decreased, the index of chromatic disper-
sion of the optical fiber increases. In addition, BER performance degrades due to dis-
persion effects in the OCDMA system. The BER be reduced by adding the chips while
the effect of the chromatic dispersion is reduced by sinking the power of the optical
transmitter.
It is further observed that in order to advance development of OCDMA networks, opti-
mum transmitting power is needed, due to the sensitivity of the optical receiver.
41

MEE09:51
As future work, we suggest a performance analysis of the effect of chromatic dispersion
of OCDMA networks for different number of system users while varying the signature
sequence code of the Pseudo Random Number Generator (PRNG), for the gold and m-
chip sequence.
42
MEE09:51
Appendix A: Acronyms BER Bit Error Rate
CDMA Code Division Multiple Access
EDFA Erbium Doped Fiber Amplifiers
EMI Electromagnetic Interference
FBG Fiber Bragg Grating
FWM Four Wave Mixing
GVD Group Velocity Dispersion
LASER Light Amplification by Stimulated Emission of Radiation
LED Light Emitting Diode
MAI Multiple Access Interference
OCDMA Optical CDMA
OOK On-Off Keying
OSNR Optical SNR
OXC Optical Cross Connect
PMD Polarization Mode Dispersion
PPM Pulse Position Modulation
PRNG Pseudo Random Number Generator
SIK Sequence Inversion Keying
SNR Signal to Noise Ratio
WDM Wavelength Division Multiplexing
WDM Wavelength Division Multiplexing
XPM Cross Phase Modulation
43

MEE09:51
44

MEE09:51
References [1] S.P. Majumder and Md. Forkan Uddin, “The effect of four wave mixing on bit error
rate performance of a direct sequence optical code division multiple access system”,
2005 Asia-Pacific Conference on Communications, Perth, Western Australia, 3-5
October 2005.
[2] T.O. Farrell and S. Lochmann, “Performance analysis of an optical correlator receiv-
er for SIK DS-CDMA communications systems”, Electronics Lett., Vol.30, No.1, pp.
63-64, 6th January 1994.
[3] S.P.Majumder, Member, IEEE, Afreen Azhari, and F.M. Abbou, “Impact of fiber
chromatic dispersion on the BER performance of an Optical CDMA IM/DD transmis-
sion system”, IEEE Photonics Technology Letters, Vol.17, No. 6, June 2005.
[4] David D. Sampson, Mark Calleja, and Robert A. Griffin, “Crosstalk Performance of
Coherent Time-Addressed Photonic CDMA Networks”, IEEE transactions on com-
munications, Vol. 46, No. 3, March 1998.
[5] S. P. Majumder, Afreen Azhari, “Performance Limitations of an Optical CDMA Sys-
tem Impaired by Fiber Chromatic Dispersion”, 0-7803-8783-X/O4/$20.00 0 2004
IEEE.
[6] Michael J. O’Mahony, Christina Politi, Dimitrios Klonidis, Reza Nejabati and Dimitra
Simeonidou, “Future Optical Networks” Journal of Light wave Technology, Vol.24,
No.12, December 2006.
[7] L.N. Binh and Y.L. Cheung, “DWDM Optically Amplified Transmission Systems –
SIMULINK Models and Test-Bed: Part III –DPSK”, ECSE Monash university 2005.
http://www.ds.eng.monash.edu.au/techrep/reports/2005/MECSE-4-2005.pdf
[8] “Fiber Optic Chromatic Dispersion Effects on High Speed Optical Code Division Mul-
tiplexing Access (OCDMA) ”
http://www.ee.kent.ac.uk/research/theme_project.aspx?pid=94
[9] S. Song, “High-order four-wave mixing and its effect in WDM systems”, Optics Ex-
press, vol. 7, pp. 166–171, August 2000.
45
[10] David Boivin, “Optical phase-modulated systems: numerical estimation and experi-
mental measurement of phase jitter”, Georgia Institute of Technology, 9-Nov-2006.

MEE09:51
http://smartech.gatech.edu/handle/1853/14130
[11] Kohsuke NISHIMURA, Ryo INOHARA, Masashi USAMI, and Shigeyuki AKIBA,
“All-Optical Regeneration by Electro-Absorption Modulator”, IEICE TRANS. ELEC-
TRON., VOL.E88–C, NO.3 MARCH 2005.
[12] Ng Wai Ling, F.M. Abbou, A. Abid, and H. T. Chuah, “Performance evaluation of
FH-OCDMA in the presence of GVD and SPM”, IEICE Electronics Express, Vol.2,
No 23, pp. 583-588.
[13] C. H. Chua, F.M. Abbou, H.T. Chuah and S.P. Majumder, "Performance analysis
on phase-encoded OCDMA communication system in dispersive fiber medium",
IEEE Photon. Techno/. Letts, vol. 16, pp. 668-670, Feb. 2002.
[14] T. O. Farrell and S. I. Lochmann, "Switched Correlator receiver architecture for opt-
ical CDMA networks with bipolar capacity”, Electron. Lett. vol. 31, pp. 905-906, May
1995.
[15] Xu Wang and Naoya Wada, Taro Hamanaka and Ken-ichi Kitayama, Akihiko Nishi-
ki, “10-user, truly-asynchronous OCDMA experiment with 511-chip SSFBG
en/decoder and SC-based optical thresholder”
http://www.ofcnfoec.org/materials/PDP33.pdf
[16] Muhammad Haris, “Advanced modulation formats for high bit rate optical networks”,
School of Electrical and computer engineering, Georgia Institute of Technology, Au-
gust, 2008.
[17] Abdul Gafur, Md. Humayun Kabir, and Waqas Ahmad, “Optical CDMA Network
Based on Star Coupler Aspects of BER, Received Optical Power and Number of
Users”, BTH transaction on Engineering Research Methodology , Karlskrona, Swe-
den, November 2008.
[18] Dr.Yuliya Semenova, “Optical Communications Systems”, Dublin Institute of Tech-
nology, School of Electronics and Communication engineering
http://www.electronics.dit.ie/staff/ysemenova/OCS/Optical%20Receivers.pdf
[19] S. P. Majumder, Afreen Azhari, “Performance Analysis of an Optical CDMA in the
Presence of Fiber Chromatic Dispersion”, Bangladesh University of Engineering and
Technology.
46

MEE09:51
47
[20] T. O'Farrell and S. I. Lochmann, “Switched correlator receiver architecture for opti-
cal CDMA networks with Bipolar capacity”, Electron. Lett, vol. 31, pp. 905-906, May.
1995.
[21] Kenneth O. Hill and Gerald Meltz, “Fiber Bragg Grating Technology Fundamentals
and Overview”, Journal of Lightwave Technology, Vol.15, No.8, August 1997.