disponibilidad del azufre del suelo sobre la …
TRANSCRIPT

Universidad de Concepción
Dirección de Postgrado
Facultad de Agronomía -Programa de Magister en Ciencias Agronómicas
DISPONIBILIDAD DEL AZUFRE DEL SUELO SOBRE LA
ABSORCIÓN DE NITRÓGENO Y LA PRODUCCION DEL CULTIVO
DE BALLICA (LOLIUM MULTIFLORUM L.)
SOIL SULFUR AVAILABILITY OVER THE NITROGEN UPTAKE AND
PRODUCTIVITY OF RYE GRASS (Lolium multiflorum L.)
Tesis para optar al grado de Magister en Ciencias Agronómicas con Mención
en Ciencias del Suelo y Recursos Naturales
ANA MARÍA MARTÍNEZ PÉREZ
CHILLÁN-CHILE
2019
Profesor Guía: Carolin Guillermina Córdova Sáez
Dpto. Suelos y Recursos Naturales, Facultad de Agronomía
Universidad de Concepción.

ii
iii
DISPONIBILIDAD DEL AZUFRE DEL SUELO SOBRE LA
ABSORCIÓN DE NITRÓGENO Y LA PRODUCCION DEL
CULTIVO DE BALLICA (LOLIUM MULTIFLORUM L.
Aprobada por:
Carolin Guillermina Córdova Sáez ______________________
Ing. Agrónomo, Mg. Cs., Ph.D. Profesora Guía
Erick Zagal Venegas ______________________
Ing. Agrónomo, M.Sc., Ph.D. Evaluador Interno
Susana Fischer Ganzoni ______________________
Ing. Agrónomo, Mg.Sc., Dr. Evaluadora Interna
Ángela Machuca Herrera ______________________
BQ, Mg. Cs., Dr. Evaluadora Externa
Macarena Gerding González ______________________
Ing. Agrónomo, Ph.D. Directora de Programa

iv
AGRADECIMIENTOS / ACKNOWLEDGMENT
Agradezco a Dios y la Virgen María por guiarme en todo momento.
Al proyecto Fondecyt 11130447 por el apoyo económico.
A Carolin Guillermina Córdova Ph.D, profesora guía de esta investigación, por la
orientación y supervisión de la misma, pero sobre todo por la motivación y apoyo
profesional y personal brindado durante estos dos años.
A los profesores asesores, Dr. Erick Zagal, Dra. Susana Fischer, y Dra. Ángela Machuca,
por su valioso aporte en el desarrollo de este trabajo de tesis.
A los profesores Manuel Zapata y José Cuevas por su aporte en la calibración del equipo
utilizado para el riego del cultivo, y al Dr. Mauricio Schoebitz por la ayuda en la medición
de biomasa radicular.
Al personal del Laboratorio de servicios de análisis de suelos y al de investigación
integrado por Katherine Rebolledo, Sra Gloria Sepúlveda. Gracias a todos por su
colaboración en el proceso metodológico de laboratorio. Así mismo a la Sra. Yudith
Guillen (Campus los Ángeles).
A la Sra. Claudia Garrido, María Alcivar, Carlos Fuentealba, Iván Urrea, Felipe Noriega
y Matías Betancur por ayudar en la recolección de la muestras de suelo y a don Manuel
Parra por el traslado del campo hacia los lugares de preparación de muestras e
invernaderos.
A la Dra. Inés Figueroa y Dra.Macarena Gerding, por su apoyo incondicional y
comprensión como directoras del programa de Magíster.
A Clarita Castro por su cariño y apoyo brindado en todo el período del Magíster.
Al departamento de Ingeniería Agrícola por su colaboración en la obtención del suelo
usado en este estudio.
A mi madre, abuela, hermanos y familiares que siempre me apoyaron de forma
incondicional y que fue clave para el logro de este objetivo y A sor Nohemí Reta, por su
apoyo incondicional en el logro de mis objetivos profesionales y desarrollo personal.
Al Dr. Adolfo Martínez (Director General de la Fundación Hondureña de Investigación
Agrícola FHIA, por el apoyo económico y brindarme la licencia laboral para realizar este
Programa de Magíster y sobre todo por su confianza depositada en mí.
A mis amigos de Honduras y a los que conocí en Chile, con quienes compartí momentos y
experiencias increíbles y enriquecedoras para mi vida personal. De forma especial a Sra
Delina Sepúlveda, Claudia Garrido y Yudith Guillen por acogerme en su casa y ayudarme.
Al Ing Elec. Manuel Zamorano por su constante apoyo y escucharme en todo momento.

v
TABLA DE CONTENIDOS
Página
Índice de figuras y tablas …………………………………………… Vi
Resumen .............................................................................................. Viii
Summary…………………………………………............... ix
Capítulo 1. Introducción General ………….…………….…............. 1
Hipótesis ….……………………….................................................... 6
Objetivo general………………………........................................... 6
Objetivos específicos .…………….……........................................... 6
Literatura citada..……………………………………………............. 7
Capítulo 2. Increasing soil Sulphur availability towards to a
sustainable management of nitrogen use.
11
Abstract ……………………………………………………………... 12
Introduction …………………………………………………………. 12
Materials and methods ……………………………………………… 14
Results and discusion……………………………………………..... 16
Conclusion…………………………………………………………... 20
Acknowledgements………………………………………………… 20
References …………………………………………………………... 20
Capítulo 3. Calibración de un sensor de humedad WET-2 en un suelo
franco arcilloso disturbado
29
Abstract 30
Resumen 30
Introducción 31
Materiales y métodos 32
Resultados y discusión 33
Agradecimientos 34
Literatura citada 34
Capítulo 4. Conclusiones generales 38
vi
ÍNDICE DE TABLAS Y FIGURAS
Página
Table 1 Selected chemical soil properties of two cropped soils of
restricted nitrogen and sulphur availability
23
Table 2 Equivalent rates of the combined application of sulphur (S)
and nitrogen (S) to the soil, to test the effect of S application
on plant N recovery in a pot experiment.
23
Table 3 Rates of carbon, nitrogen and sulphur mineralization from two
cropped soils of different levels of soil organic matter at
different periods within 112 days of soil incubation.
24
Table 4 Soil indicators of nitrogen availability for two cropped soils
with different levels of soil organic matter.
24
Table 5 Plant height (Lollium multiflorum L.) evaluated through the
cropped season of sixteen weeks under the effect of S (rates of
0 and 30 kg ha-1
) and N (rates of 0 and 100 kg ha-1
) application
to the soil in a pot experiment.
25
Tabla 6 Crop yield, N foliage concentration, and root growth
parameters after cropping Lollium multiflorum L. in a pot
experiment for sixteen weeks under S (rates of 0 and 30 kg ha-
1) and N (rates of 0 and 100 kg ha
-1) application.
26
Tabla 7 Nitrogen recovery efficiency measured in a Lollium
multiflorum L. grown in a pot experiment for sixteen weeks
under S (rates of 0 and 30 kg ha-1
) and N (rates of 0 and 100 kg
ha-1
) application.
26
Tabla 8 Residual soil available nitrogen (N) and sulphur (S) after
cropping Lollium multiflorum L. in a pot experiment for
sixteen weeks under S and N application
27
Figure 1 Partial (left side, A, C, E) and accumulated (right side, B, D, F)
mineralisation of carbon, nitrogen and sulphur from Andisol
and Mollisol soils.
28

vii
Figure 1 . Curvas de calibración de un sensor de humedad WET-2 en
suelos Mollisol y Andisol disturbados para un experimento de
macetas. (P < 0, 05).
36
Cuadro 1 . Contenido de agua medido con un sensor WET-2 y con la
técnica gravimétrica en un suelo Mollisol y Andisol.
37

viii
DISPONIBILIDAD DEL AZUFRE DEL SUELO SOBRE LA ABSORCIÓN DE
NITRÓGENO Y LA PRODUCCIÓN DEL CULTIVO DE BALLICA (LOLIUM
MULTIFLORUM L.
SOIL SULFUR AVAILABILITY OVER THE NITROGEN UPTAKE AND
PRODUCTIVITY OF RYE GRASS (Lolium multiflorum L.)
RESUMEN
El nitrógeno (N) y azufre (S) son elementos esenciales en la producción de cultivos, sin
embargo, en las últimas décadas se ha reportado bajos rendimientos que se atribuyen a
deficiencias de S en el suelo. El objetivo de este estudio fue determinar el efecto del
aumento del suministro de S de un suelo Mollisol sobre la absorción de N, rendimiento y
calidad productiva de un cultivo. Para ello, se midió la mineralización de N y S mediante
incubación en condiciones controladas durante períodos parciales de 0-7, 7-14, 14-28, 28-
56 y 56-112 días en dos suelos Mollisol y Andisol. Se estableció un experimento en
macetas en condiciones de invernadero con el suelo Mollisol de bajo contenido de N y S
con plantas de ballica anual (Lolium multiflorum L) variedad Winter Star II. En un diseño
completamente al azar, con 4 tratamientos (dosis de S y N) y 3 repeticiones (N0S0, N0S30,
N100S0, N100S30 kg ha-1
). Para programar el riego a manera de satisfacer un criterio del
50% del agua disponible, se calibró un sensor de humedad portátil WET-2. La
mineralización de N-NO3-del Mollisol resultó de 8,47 a 56,58 mg kg
-1en y Andisol de 12,19
a 55,1 mg kg-1
. La mineralización de S-SO4-2
fue estadísticamente diferente en los primeros
7 y 28 días. Por su parte el rendimiento de materia seca fue de 1,53; 1,66; 4,92 y 6,39 g
maceta-1
de los tratamientos N0S0, N0S30, N100S0, N100S30 kg ha-1.
, respectivamente.
Se concluyó que el suministro de N del suelo fue alto después de 14 días de incubación, sin
embargo la capacidad de suministro de S fue insuficiente en ambos suelos. La aplicación
conjunta de N y S no aumentó la biomasa ni el contenido de proteínas que mide en parte la
calidad y la absorción de N, ya que mostró valores similares al tratamiento solo con N.
Palabras clave: Mineralización de N y S; deficiencias de S; sinergismo N y S; calidad
productiva.

ix
SUMMARY
Nitrogen (N) and sulfur (S) are essential elements for production of crops, however, in the
last decades low yields have been reported that are attributed to S deficiencies in soil. The
objective of this study was to determine the effect of increased S supply of a Mollisol soil
on the uptake of N, yield and productive quality of a crop. For this, N and S mineralization
was measured by incubation under controlled conditions during partial periods of 0-7, 7-14,
14-28, 28-56 and 56-112 days in Mollisol and Andisol soils. An experiment was to
established in pots under greenhouse conditions with Mollisol soil with low N and S
content, with plants of rye grass (Lolium multiflorum L.) variety Winter Star II. In a
completely randomized design, with four treatments (doses of S and N) and three
repetitions (N0S0, N0S30, N100S0, N100S30 kg ha-1
). To program the irrigation to satisfy
a criterion of 50% of the available water, a WET-2 portable moisture sensor was to
calibrated. The N-NO3-mineralization of Mollisol was from 8.47 to 56.58 mg kg
-1en and
Andisol from 12.19 to 55.1 mg kg-1
. The mineralization of S-SO4-2
was statistically
different in the first 7 and 28 days. The yield of dry matter was 1.53; 1.66; 4.92 and 6.39 g
pot-1
of the treatments N0S0, N0S30, N100S0, N100S30 kg ha-1
, respectively.
It was to concluded that the N supply of the soil was high after 14 days of incubation,
however the S supply capacity was insufficient in both soils. The joint application of N and
S did not increase the biomass or the protein content that partly measures the quality and
the absorption of N, since it showed similar values to the treatment only with N.
Key words: Mineralization of N and S; S deficiencies; synergism N and S; productive
quality.
1
CAPÍTULO 1
INTRODUCCIÓN GENERAL
El nitrógeno (N) y azufre (S) son nutrientes esenciales en los sistemas de producción agrícola,
y los cultivos dependiendo de la especie y la edad generalmente contienen de 2,5 a 4,0% de
N, y de 0,15 a 0,4% de S, aproximadamente una décima parte del N (Brady y Weil, 2008).
Estos nutrientes favorecen la formación y el crecimiento de hojas, tallos y raíces, y son
imprescindibles en la etapa reproductiva para la formación y desarrollo de las yemas florales.
En efecto, la ausencia de estos elementos en los tejidos foliares produce que las plantas no
logren completar su ciclo vital, y con ello se cumple uno de los criterios de esencialidad.
Respecto a la función directa de estos elementos en el metabolismo vegetal, concepto también
asociado a la esencialidad, es conocido que el N es componente integral de todos los
aminoácidos que forman las proteínas, enzimas, ácidos nucleicos, y clorofila molécula
responsable de la fotosíntesis, mientras que el S es un constituyente de las proteínas y tiene un
papel fundamental en la síntesis de los aminoácidos cisteína y metionina, y además participa
en la síntesis de clorofila (Marschner, 1995). La deficiencia de estos nutrientes en los cultivos
induce sintomatologías específicas como la marchitez en tejidos nuevos en el caso del S y en
tejidos maduros en el caso del N, relacionadas a sus funciones metabólicas, que muestran
respuesta a la aplicación del elemento a través de la recuperación de la función metabólica
(Eaton, 1951). En condiciones de campo, los cultivos generalmente están expuestos a
condiciones de baja fertilidad del suelo, y por lo tanto la disponibilidad de estos nutrientes en
el suelo es baja. La aplicación de fertilizantes corrige y/o mejora la disponibilidad de
nutrientes para la absorción por los cultivos (Sager, 2012).
Por otro lado, la fertilización de cultivos constituye cerca de un 50-60% de los costos de
producción agrícola (Velasco, 2008; Espinoza, 2009), donde el nutriente más limitante suele
ser el N, ya que los requerimientos de los cultivos son altos. Respecto al uso de fertilizantes,
USDA (2009) indica que la tendencia en la aplicación de fertilizantes nitrogenados en Estados
Unidos ha aumentado más rápidamente que otros fertilizantes (fosforados y potásicos), debido
al desarrollo de variedades con mayor respuesta de rendimiento. En el escenario actual de
producción agrícola, se busca responder a la demanda global creciente por alimentos y
aumentar la producción de cultivos, donde las deficiencias de N y otros elementos necesitan
ser cubiertas para lograr este objetivo. Una vía rápida para alcanzar esta meta, es la aplicación
de fertilizantes minerales (Arshad et al., 2010). En particular, Espinoza (2009) afirma que

2
Chile es un importador neto de fertilizantes, con aproximadamente 1,1 millones de toneladas,
de los cuales la urea (fertilizante nitrogenado) corresponde al mayor volumen de importación
e indica que el consumo de los fertilizantes nitrogenados incrementó en un 60,8 % entre los
años 2007 y 2008, mientras que el consumo de fertilizantes azufrados disminuyó en un 11,4
% en el mismo período.
Los fertilizantes nitrogenados han sido un factor clave para aumentar la producción de
alimentos en países en desarrollo y también en muchos industrializados (Grinsven et al.,
2014). Sin embargo, las ganancias, pérdidas y transformaciones de N dentro del sistema
suelo/planta afectan la disponibilidad para las plantas. En los sistemas agrícolas, el mineral-N
esta propenso principalmente a pérdidas por volatilización del amoníaco; desnitrificación
(transformaciones en formas gaseosas) y lixiviación (eliminación en agua de drenaje)
(Cameron et al., 2013). Esta última pérdida se puede disminuir dividiendo los campos en
áreas que responden de manera más uniforme de acuerdo a las características del suelo y el
paisaje, y de esta forma se tendrá un mejor uso de fertilizantes nitrogenados (Jaynes et a.,
2011), también el riego parcial de la zona de raíces se ha convertido en una de las formas más
prometedoras de riego definitivo que alternada con aplicaciones de N aumenta el
rendimiento, disminuyen las pérdidas de N y aumenta la eficiencia de su uso (Han et al.,
2016). Otra técnica usada para mejorar la eficiencia de uso de nitrógeno es la urea de
liberación controlada (Zheng et al., 2016), y también la aplicación en conjunto de N con S,
que por sus similitudes a nivel de suelo y cultivo génera una mejor absorción de N por los
cultivos (Aguilera et, al 2002).
Respecto a las formas minerales del N y S en el suelo se sabe que son parte de la materia
orgánica (MO), ya que usualmente alrededor de un 90-95% se encuentra en formas orgánicas
(Brady y Weil, 2008). El hecho de que ambos nutrientes minerales esenciales para el
crecimiento de los cultivos están contenidos en la MO, les confiere una función fundamental
para la mantención de la sustentabilidad de un agro-ecosistema, y muchas de las técnicas
agronómicas aplicadas al suelo influyen directamente sobre el contenido y la dinámica de los
componentes de esta MO (Córdova et al., 2014). El componente mayoritario en la MO es el
carbono orgánico (CO), el cual es esencial para la actividad biológica del suelo como recurso
energético, por lo que está vinculado con la cantidad y disponibilidad de nutrientes del suelo
(Martínez et al., 2008). En ausencia de fertilización la mineralización de compuestos
orgánicos a formas inorgánicas constituye la principal fuente de suministro a la solución del
suelo para ser asimilado por las plantas (Eriksen, 2009). Es así, que toma importancia conocer
el aporte natural del suelo de los nutrientes N y S para ajustar los programas de fertilización y

3
evitar contaminaciones ambientales. También es necesario conocer y entender lo que ocurre
con estos elementos en el suelo partiendo de que las formas minerales o inorgánicas del N,
absorbibles por las raíces de plantas cultivables, amonio (NH4+) y nitrato (NO3
-), que una vez
absorbidos se reducen a formas orgánicas como las proteínas, aminoácidos y ácidos nucleicos
como parte del metabolismo vegetal (Boudsocq et al., 2012).
La disminución de este pool soluble a niveles bajos de acuerdo al requerimiento particular de
cada cultivo provoca una deficiencia de N. La forma N-NH4+
puede sufrir posibles pérdidas
debido a la erosión y escorrentía superficial, a la inmovilización llevada a cabo por
microorganismos del suelo, la oxidación anaeróbica, la volatilización después de
transformarse en amoniaco gaseoso (NH3); nitrificación por la oxidación microbiana de NH4+
a NO2- y posteriormente a NO3
-, y por la fijación mineral en la matriz del suelo, donde el
NH4+ es retenido por las cargas negativas de las partículas coloidales del suelo (arcillas y
humus) (Brady y Weil, 2008).
Por su parte el S del suelo se encuentra en forma orgánica e inorgánica, y desde el punto de
vista nutricional de la planta, la forma inorgánica es la más importante, ya que es la que
absorben las raíces. Sin embargo, el SO4-2
que es la forma estable de S inorgánico en los
suelos aeróbicos, constituye sólo una pequeña parte del S total en los suelos y las plantas no
pueden asimilarlo como tal, por lo que a través del proceso de reducción asimiladora del SO4-2
absorbido del suelo, es transportado en las plantas, donde posteriormente es metabolizado al
aminoácido cisteína a partir del cual se forma otro importante aminoácido la metionina,
proteínas y glutatión (Buchner et al., 2004; Stevenson y Cole 1996). Las formas orgánicas de
S comprenden los compuestos unidos al carbono (sulfitos, disulfuros y thioles), y las formas
en ésteres sulfatos (enlaces con el oxígeno) (Brady y Weil, 2008), las cuales son
mineralizadas por los organismos del suelo y la velocidad a la que ocurre depende de los
factores ambientales como humedad, aireación, temperatura y pH (Eriksen, 2009). La
mineralización del S tiene la particularidad respecto al N, que puede ser biológica cuando la
descomposición de la materia orgánica es realizada por la biomasa microbiana, y bioquímica
cuando es realizada por enzimas como la arilsulfatasa que cataliza la hidrólisis de ésteres de
sulfatos orgánicos y los mineraliza a SO4-2
(Eriksen, 2009; Tabatabai y Bremner, 1970).
El S a pesar de ser considerado un macronutriente, generalmente no está incluido en los
planes de fertilización, dado que en el pasado las deficiencias de este nutriente no habían sido
observadas. Sin embargo, mundialmente, en las últimas dos décadas con frecuencia se ha
reportado deficiencia de este nutriente (Eriksen, 2010), lo que reduce los rendimientos y
afecta la calidad de los productos cosechados (Scherer, 2009; Eriksen, 2009; Arshad et al.,

4
2010). Las principales causas de disminución de S en el suelo son, (i) el control ambiental de
las emisiones de dióxido de azufre en las áreas industriales, (ii) el uso creciente de
fertilizantes con bajo contenido de azufre, (iii) el aumento de los rendimientos obtenidos
como resultado de otros avances tecnológicos, (iv) el uso decreciente de plaguicidas y
fungicidas que contienen S (Eriksen, 2010). En suelos del sur de Chile el S es frecuentemente
deficitario mostrando niveles bajos a muy bajos (≤ 12 mg S kg-1
), debido a que no se aplican
fertilizantes azufrados y se siembran cultivos forrajeros, de mayor potencial de rendimiento
(Alfaro et al., 2006). Además, estudios realizados por Córdova et al. (2017) muestran bajos
contenidos de S disponible en algunos suelos del sur de Chile con niveles de 0,06 mg kg-¹ en
el secano, región centro-sur y 7,16 mg kg-¹ en valle Simpson, zona intermedia de la región
Patagonia Occidental y moderadamente bajos en la pre-cordillera de Los Andes de 15,12 mg
kg-¹. En consecuencia, la baja disponibilidad de S disminuye el rendimiento de los cultivos,
reduce la absorción de N, influye en la calidad de la producción (proteínas y ácidos grasos)
teniendo así, un rol fundamental en la salud humana.
El S tiene un rol protagónico en la producción de cultivos y alimentos (Eriksen, 2009), ya que
es un constituyente de los aminoácidos cisteína y metionina (Jezierny et al., 2010), que son
esenciales en la alimentación humana por lo que su contenido mejora la calidad nutricional de
los cultivos. La baja disponibilidad de S que conduce a una sub-absorción del elemento por el
cultivo, limitaría la producción de proteína debido a la escasez de los aminoácidos-azufrados.
También tiene un papel fundamental en la síntesis de la coenzima A que tiene participación en
la producción de ácidos grasos, forma parte de las vitaminas biotina, tiamina, y también del
glutatión, este último necesario en las plantas para defensa contra plagas y enfermedades.
Además el S participa en la síntesis de clorofila por lo que es un elemento clave en la
fotosíntesis. También forma parte del grupos prostético ferredoxina (Marschner, 1995).
Varios estudios en cultivos de oleaginosas, leguminosas y cereales han encontrado
interacciones sinérgicas entre el N y S. En los cultivos se mide generalmente en términos de
respuesta de crecimiento y cambio en la concentración de nutrientes. Al agregar dos
nutrientes, se produce mayor rendimiento del cultivo que cuando se agrega solo uno (Fageria,
2006). Debido a ello, la disponibilidad de estos elementos en el suelo puede influir
significativamente en el resultado final de un sistema de producción agrícola, ya que muestran
fuertes interacciones en sus efectos nutricionales sobre el crecimiento y calidad de los cultivos
porque ambos nutrientes forman parte de aminoácidos y proteínas (Arshad et al., 2010). En
tanto, que Salvagiotti et al. (2009) encontraron un aumento en la absorción de N con la
adición de azufre como respuesta a la aplicación combinada de S (30 kg ha-1
) y N (100 kg ha-

5
1), lo que reveló una sinergia entre ambos nutrientes. Esta interacción también se observó en
la biomasa y el rendimiento de grano en el cultivo de trigo. La naturaleza de esta interacción
reside en la similitud de comportamiento de estos nutrientes en suelo y en la planta a través de
la cantidad de procesos fisiológicos comunes en los que intervienen (Aguilera et al, 2002).
Otro aspecto importante de similitud del N y S son las formas aniónicas (NO3– y SO4
2–) de
ambos elementos que son móviles y están sujetas a pérdidas por lixiviación en suelos de
climas con intensas precipitaciones (Aguilera et al., 2002).
Respecto al papel que desempeñan el N y S en la síntesis de proteínas estos nutrientes están
estrechamente relacionados, ya que la baja disponibilidad de S limita la eficiencia de
absorción de N, por lo cual, es necesaria la adición de S para lograr la máxima eficiencia del
fertilizante nitrogenado aplicado (Fazili et al., 2008). La relación N/S como respuesta al
suministro de S y para lograr un desarrollo normal de los cultivos es de aproximadamente 15:
1 a 17: 1 en la mayoría de las plantas (Till, 2010; Fazili et al., 2008).
Además del estudio de la interacción de N y S en esta investigación, entre los varios métodos
aplicados, se desarrolló la calibración de un sensor de humedad para mantener el contenido de
agua ideal en uno de los experimentos realizados utilizando macetas de cultivo. El suministro
de riego oportuno con la cantidad deseable se realiza mediante la programación del riego
(Kumar et al., 2017). Para ello, se necesita conocer el contenido de humedad del suelo, el cual
se puede medir mediante técnicas indirectas como el sensor de humedad WET-2, que requiere
de calibración con la técnica gravimétrica estándar. Dado que el principio de medición de esta
técnica se basa en los cambios de la constante dieléctrica en el suelo y, la precisión depende
de las propiedades físicas, mecánicas y químicas del mismo (Mohsen et al., 2018). Por ello, su
uso está sujeto a la calibración para las condiciones particulares de cada sitio, y se presenta un
manuscrito enviado a publicación describiendo los resultados de la calibración del sensor
WET-2 utilizado en esta investigación.

6
HIPÓTESIS
La absorción del N por el cultivo de ballica se incrementa con una disponibilidad adecuada de
S. La productividad de sitio en suelos de baja capacidad de suministro de N y S, se beneficia
de las aplicaciones al suelo, aumentando el rendimiento, calidad productiva y la eficiencia de
absorción de N de los cultivos.
OBJETIVO GENERAL
Determinar el efecto del aumento del suministro de azufre de un suelo Mollisol sobre la
absorción de N, rendimiento y calidad productiva de un cultivo de ballica.
OBJETIVOS ESPECÍFICOS
1- Estudiar el suministro natural de nitrógeno y azufre de suelos con contenido suficiente de
materia orgánica.
2- Evaluar el efecto de la aplicación de azufre al suelo sobre el mejoramiento del rendimiento
productivo, calidad y absorción de nitrógeno de un cultivo de ballica anual (Lolium
multiflorum L.).

7
LITERATURA CITADA
Aguilera, M., Mora, M.L., Borie, G., Periano, P., Zunino, H. 2002. Balance and distribution
of sulphur in volcanic ash-derived soils in Chile, Soil Biology & Biochemistry. 43, 1355-136.
Alfaro, M., Bernier, R., Iraira, S. 2006. Efecto de fuentes de azufre sobre el rendimiento y
calidad de trigo y pradera en dos Andisoles. Agricultura Técnica. 66, 283-294.
Arshad, J., Moom, S., Zainul, M. 2010. Sulphur a general overview and interaction with
nitrogen. Australian Journal of Crop Science. 4 (7), 523-529.
Boudsocq, S., Niboyet, A., Lata, J.C., Raynaud, X., Loeuille, N., Mathieu, J., Blouin, M.,
Barot, S. 2012. Plant preference for ammonium versus nitrate: A neglected determinant of
ecosystem functioning? The American Naturalist. 180, 60-69.
Brady, N., Weil, R. 2008. The nature and properties on soil. Roles of sulphur in plants and
animals. (14a Ed.). Pearson Prentice Hall. Columbus, Ohio. pp 578.
Bushner, P., Stuiver, C.E., Esterman, S., Wirtz, M., Hell, R., Hawkesford, M.J., Kok, L. J.
2004. Regulation of sulfate uptake and expression of sulfate transporter genes in Brassica
oleracea as affected by atmospheric H2S and pedospheric sulfate nutrition. Plant Physiology.
136, 3396-3408
Cameron, K.C., Di, H.J., Moir, J.L. 2013. Nitrogen losses from the soil/plant system: a
review. Annals of Applied Biology.162, 145-173.
Córdova, C., Zagal, E., Hepp, C., Barattini, B. 2014. Aspectos de la materia orgánica en
suelos volcánicos del valle simpson y su impacto en la transformación del azufre y del
nitrógeno. pp 11-133. En: Hepp, C., Stolpe, N. (Eds.), Caracterización y propiedades de los
suelos de la Patagonia occidental (Aysén). Instituto de investigaciones agropecuarias. Boletín
INIA-No 298. Coyhaique, Chile
Córdova, C., Hepp, C., Luna, G., Sepúlveda, G., Baratinni, P., Zagal, E., Bonilla, A., Parra, F.
2017. An alternative method to measure available sulphur by ion chromatograhy in volcanic
soils. Chilean Journal of Agricultural and Animal Science, ex Agro-Ciencia, 33, 117-123.

8
Eaton, S.V. 1951. Effects of sulfur deficiency on growth and metabolism of tomato. Botanical
Gazette. 112 (3), 300-307.
Eriksen, J. 2009. Soil sulfur cycling in temperature agricultural system. In: Donald L. Sparks,
Editor(s). Advances in Agronomy, Academic Press, USA. 102, 55-89.
Eriksen, J. 2010. Sulphur cycling in agroecosystems. Dr. Scient. Thesis, Aarthus University,
Faculty of Agricultural Sciences, Denmark.
Espinoza, J. 2009. Fertilizantes en Chile: Coyuntura y perspectivas. Mercados agropecuarios.
No 205. Oficina de Estudios y Políticas Agrarias (ODEPA), Santiago, Chile.
Fageria,V.D. 2006. Nutrient interactions in crop plants. Journal of Plant Nutrition. 24 (8),
1269-1290.
Fazili, I.S., Jamal, A., Ahmad, S., Masoodi, M., Khan, J.S., Abdin, M.Z., 2008. Interactive
effect of sulphur and nitrogen on nitrogen accumulation and harvest in oilseed crops differing
in nitrogen assimilation potential. Journal of Plant Nutrition. 31, 1203-1220.
Grinsven, H., Spiertz, J., Westhoek, H., Bouwan, A. 2014. Nitrogen use and food production
in European regions from a global perspective. Journal and Agricultural Science. 152, 9-19.
Han, K., Han, X., Curtis, D., Kleinman, P., Wang, D., Wang, L. 2016. Impact or irrigation,
nitrogen fertilization, and spatial management on maize. Agronomy, Soils and Enviromental
Quality. 108, 1794-1804
Jaynes, D., Kaspar, T., Colvin, T. 2011. Economically optimal nitrogen rates of corn:
management zones delineated from soil and terrain. Agronomy Journal. 103, 1026-1035.
Jezierny, D., Mosenthin, R., Bauer, E. 2010. The use of grain legumes as a protein source in
pig nutrition: A review. Animal Feed Science and Technology. 157, 111-128.

9
Kumar, R., Singh, P., Upadhyay, A. 2017. Irrigation Scheduling. In: Kumar, R., Singh, P.,
Upadhyay, A (Eds.), Planning and evaluation of irrigation projects. Academic Press, pp 385-
412.
Marschner, H. 1995. Functions of mineral nutrients; macronutrients. pp: 229-312. Mineral
Nutrition of Higher Plants. (2ª. Ed.). Acedemic Press. Germany.
Martínez, E., Fuentes, J.P., Acevedo, E. 2008. Carbono orgánico y propiedades del suelo.
Revista de la Ciencia del Suelo y Nutrición Vegetal. 8 (3), 10-29.
Mohsen, A., Mohamed, O., Paleologos, E.K., 2018. Dielectric permittivity and moisture
content. In J., Hayton (ed.), Fundamentals of geoenviromental engineering. Elsevier Inc.,
Cambridge, United States, pp. 581-637
Sager, M. 2012. Levels of sulfur as an essential nutrient element in the soil crop food system
in Austria. Agriculture. 2, 1-11.
Salvagiotti, F., Castellarín, J.M., Mirayes, D.J., Pedrol, H.M. 2009. Sulfur fertilization
improves nitrogen use efficiency in wheat by increasing nitrogen uptake. Field Crops
Research. 113, 170–177.
Scherer, H. 2009. Sulphur in soil. Plant Nutrition and Soil Science, 172: 326–335.
Stevenson, F.J., Cole, M.A. 1996. Cycles of soil (2a. Ed.). John Wiley and Son, Inc. New
York. pp. 427.
Till, A.R. 2010. Sulphur and sustainable agriculture. International Fertilizer Industry
Association. Paris, France. pp 74.
Tabatabai, M. A., Bremner, J. M. 1970. Arylsulfatase activity of soils. Soil Science Society of
American Journal, 34:225-229.

10
United States Department of Agriculture (USDA). 2009. Fertilizer Use and Markets. [en
línea]. Economic Research Service. <https://www.ers.usda.gov/topics/farm-practices-
management/chemical-inputs/fertilizer-use-markets>. [Consulta: 04 abril 2017].
Velasco, R. 2008. Análisis económico de la producción de canola, lupino y arveja. pp:144-
166. En: Urbina, J. (Ed.). Producción de canola, lupino y arveja en la precordillera del Bíobío
y el secano costero de la provincia de Arauco. Instituto de investigación Agropecuaria.
Boletín INIA-No 188. Quilamapu. Chillán.
Zheng, W., Zhang, M., Liu, Z., Zhou, H., Lu, H., Zhang, W., Yan, Y., Li, C., Chen, B. 2016.
Combining controlled-release urea and normal urea to improve the nitrogen use efficiency
and yield under wheat-maize double cropping system. Field Crops Research. 197, 52-62.

11
CAPÍTULO 2
INCREASING SOIL SULPHUR AVAILABILITY TOWARDS TO A SUSTAINABLE
MANAGEMENT OF NITROGEN USE
C. Córdova1*
, A.M. Martínez1, E. Zagal
1, S. Fischer
2, A. Machuca
3
1Department of Soils and Natural Resources. Faculty of Agronomy. University of
Concepción. Chillán, Chile.
2Department of Plant Science. Faculty of Agronomy. University of Concepción.
Chillán, Chile.
3Departament of Science and Technology. School of Science and Technology.
University of Concepción. Los Ángeles. Chile.
*email: [email protected]
This paper has been sent to the journal: Eurasian Soil Science

12
Abstract
Nitrogen (N) supply is usually limited in the soil, but soil sulphur (S) deficiencies have been
also detected lately, affecting crop production and N uptake. The objective of this study was
to assess the crop recovery efficiency of N due to a S application. Two soils with high levels
of organic matter were studied, Andisol and Mollisol soils, and N and S mineralization,
potentially available N, and urease activity, were measured in order to determine their
potential to supply N and S. Differences (P< 0.05) between soils in microbiological
parameters were not found, but soil mineralization kinetic in Andisol showed a small increase
over time. Mollisol soil was used to carry out a pot assay applying a rate of 30 kg S ha-1
over
a control treatment and an application of 100 kg N ha-1
. Biomass dry matter and N
concentration was measured after sixteen weeks, and the recovery N efficiency was
calculated. An increment of 26 % was registered in the recovery of N from the S application,
but this was not significantly different from the control treatment (P< 0.05). A higher rate of
N than the one applied here might show the effect of S, as large residual soil S evidenced a
low S plant uptake.
Keywords: nitrogen recovery efficiency, sulphur mineralisation, nitrogen mineralisation
INTRODUCTION
Soil sulphur (S) is an essential nutrient for crop growth because it is part of essential amino
acids, important not only for plant development [1] but also for animal nutrition [2].
Furthermore, S plays a significant role in plant nutrition through the synthesis of: coenzime A,
biotin, thiamine, and gluthatione, chlorophyll, and secondary sulphur compounds, as well as
N fixation in leguminous crops [3]. Therefore, crop production benefit from an adequate S
supply, which can also improve plant nitrogen (N) metabolism [4] because S catalyses the
chlorophyll molecule production, allowing efficiency in photosynthesis process. An adequate
plant S nutritional status not only may improve the crop yield [5], but also can increase some
quality aspects of the production, such as protein and amino acid contents[4], hordeins
composition [6], and gluten content [7], all these globally appreciated under the currently food
security scenario [8].
Deficiencies of soil S have been reported in the last decades [9] due to the reduction of S-
atmospheric emissions (SO2), fertilisers have been manufactured using less -or none S units to
gain concentration in specific nutrients, and the introduction of improved crop varieties, with

13
larger requirement of nutrients. As a reference: to achieve a reasonable yield (75-100 qqm ha-
1) S-uptake must be around 15 to 25 kg ha
-1 [10]. Thus, soil S was reported as a restrictive
factor for crop production in many countries in Europe [11] and despite the lack of
information regarding crop production in the last years, recent research [12] has highlighted
the importance of S in crop nutrition by improving varieties less S demanding. In particular, S
fertility in Chile has not been widely investigated, but from early reports Schenkel et al.
(1973) [13] informing S as the second more available element in local volcanic soils, to
Alfaro et al. (2006) [2006] reporting soil S deficiencies, seems plausible to conclude that in a
period of 30 years S has become deficient in volcanic soils of the South of Chile.
Besides the importance of S in crop development, this element can also influence the N
uptake due to the essentially of both elements in the protein synthesis [15, 16, 17]. For
example, established relationship between N and S as protein content are N/S=40 in cereals
and N/S=30 in legumes, therefore crop production benefit from the effect of sulphur, which is
usually also linked to nitrogen N [4]. Therefore, an adequate supply of available S in the soil
might benefit the N use by the crop. Cycles of S and N in the soil have common
characteristics, such as the larger proportion of organic over mineral forms in the soil (around
95% of total S and N is contained in the organic matter), and within these, the anionic
available chemical form as sulphate (S) and nitrate (N) [3, 18]. Thus, the natural supply of
these nutrients depends on the mineralisation of the soil organic matter, which is particularly
relevant for the S supply due to soil deficiency. However, most farmers are not aware of the
benefit of S application to the soil to improve crop yield and N use efficiency.
Soils of large organic matter content are desirable for crop production due to their high
chemical and physical fertility, such as Andisol and Mollisol soils. However, this does not
guaranteed enough supply of plant nutrients from the organic matter through the
mineralisation process, and the application of fertilisers is usually needed to match crop
requirements. As in the current global scenario, efficiency of N application in the
agroecosystems is required due to plant nutrition and environmental concerns; the
fundamental of this research recalls the influence of S over N plant metabolism as a way to
improve the efficiency of the applied N. Specifically, the objective of this research was to
assess the effect of an improved availability of soil S on crop N uptake. This was tested
calculating the efficiency of N recovery using a short term growth crop over a soil of low S
supply.

14
MATERIALS AND METHODS
1. Experimental site, soil sampling and conditioning.
The soils under study were located at the experimental research station of the Universidad de
Concepción in Chile (36°35’44’’S, 72°04’36.25’’W). The site has been previously described
by Sanchez-Hernandez et al. (2017) [19]. Two soils were sampled, an Andisol and a Mollisol
soil (Table 1), at 0-20 cm depth, the arable layer. The Andisol soil was under crop rotation
consisting of wheat-maize, whilst over the Mollisol soil an alfalfa pasture was established in
the last four years.
The field areas were divided in small plots of 30 m by 30 m using google earth satelite
images, and three plots were randomly sampled (n=3). Soil samples were composited within
the plots, transported to the lab and sieved at 10 mm for a pot assay and at 2 mm for
microbiological soil analyses. The samples were adjusted to 60% of water filled pore
saturation (WFPS), using soil bulk and real density data and gravimetric water content. Then,
they were storage at 4oC until analysis.
Soil microbiological measurements were first tested in order to contrast the capacity of N and
S supply from the soils, and then an N and S application assay was carried out.
2. Microbiological soil indicators.
Soil mineralisation. Carbon (C) and N mineralisation was measured by soil incubation in an
enclosed system [20], whilst for S mineralisation an open incubation system was used [21].
Soils were incubated at 22oC for 112 days, but partial evaluations were done at 3, 7, 14, 28,
and 56 days, respectively. Field replicates were worked in triplicated in the lab, and a control
treatment was used for all measured parameters.
The mineralisation of soil C was measured as CO2–C produced by microbial respiration,
using 25g of soil incubated with a tramp of 10 ml of NaOH (0.01 M), which was replaced at
each evaluation period. The excess of NaOH was titrated with a HCl solution (0.1 N) using an
autotitrator equipment [22].
Soil N mineralisation was assessed by measuring the NH4+-N content from 7 g of soil
extracted with KCl (1 M) at ratio of 1:5 soil: solution and shaked for 1 hour , at each stage of
the temporal evaluation. Colourimetric analysis was done after addition of 3 ml NaOH (3 M)
and 2 ml of Nessler reactive, by spectrophotometry (490 nm wave-length). Linear regression
for calibration was done using 0, 1, 2, 3, 5, and 10 mg l-1
NH4+-N.

15
The S mineralisation was quantified in a 150 ml CaCl2 solution (10 mM) applied to a open
system, consisting of a Büchner funnel containing 30 g of soil [21]. The sulphate
concentration was measured through ion chromatography using 1 ml of the extracting
solution.
Potentially available nitrogen. This indicator of the seasonal provision of soil available N
for crop growth was determined by measuring the difference between the initial soil
ammonium content, and that measured at the end of 7 days soil incubation at 40oC under
anaerobic conditions. The soil ammonium content was extracted on 5 g of dry soil and 25 ml
KCl (2 M), followed by colorimetric analysis and spectrophotometry, as described above.
Urease activity. A solution of 4 ml of phosphate buffer solution, and urea (6.4%) were added
to fresh samples of 1 g of soil, to be shaken and then the system was incubated for 2 hours at
37oC using a temperature controlled water bath. After cooling down, 5 ml of KCl (2 M)
solution was added and from the filtered extract 2 ml were combined with EDTA reactive, 2
ml of phenol-nitroprusside, 4 ml of hypochlorite buffer and deionised water up to complete 25
ml. This was incubated at 40oC for 30 minutes, and then the absorbance at 636 nm
wavelengths was determined by spectrophotometry, and NH3-N concentration was obtained
from calibration using standard solutions of 0, 25, 50, 100 and 150 µg NH3-N
3. Crop growth assay.
Mollisol soil was selected to establish a pot experiment and measure the effect of S
application on plant N recovery. Two levels of N application combined with a rate of S
equivalent to 30 kg ha-1
were allocated in pots containing 1 kg of soil (Table 1), and applied
as NH4NO3, K2SO4, and KCl. Each pot was sown with 1 g of Lollium multiflorum L. The soil
moisture was kept at 50% of the total water availability, monitored using a calibrated moisture
sensor, and weeds were manually removed every week.
The total number of experimental units were n=36 (4 treatments, three field replicates, three
greenhouse replicates), arranged in a random design. They were kept in a greenhouse for 16
weeks.
Soil available N. The soil nitrate was measured at the beginning and at the end of the crop
growth period. Nitrate content was determined by soil extraction using deionised water in a
ratio of 1:4 soil:solution, shaken, and the concentration was obtained by ion chromatography.
Soil available S. As soil available N, the available soil sulphate was also measured two times.
A solution of Ca (H2PO4)2 (0.01 M) was applied to a dry soil sample, and the mixture was

16
shaken for 30 minutes. After filtration, an aliquot of 1 ml was used to measure the sulphate
concentration by ion chromatography.
Crop growth. The crop height (cm) was weekly registered.
Crop yield. The biomass produced by the crop was harvested at the end of the growth period,
and foliage was separated from roots, cleaned and kept in disposable bags. The bags were
introduced in an oven at 65oC to register the weight (mg) after 24 hours (constant weight).
Foliage total N. After weighting the foliage dry matter, the samples were milled and sieved at
1 mm to determine over a sample of 0.5 g the N concentration [23]. A composite solution
using sulphuric acid, salicylic acid, and hydrogen peroxide, was added to the foliage dry
matter and was left over night. Each sample was heat up until digestion, and afterwards the
NH4+-N was determined by distillation and titration.
Protein content
It was calculated by means of the standard conversion factor 6.25 from the total N in the
tissues.
Nitrogen efficiency recovery. This was calculated as the ratio between the difference of
fertilised pots (N100S0, N100S30) and controls (N0S0, N0S30), and the plant available N
estimated from initial nitrate content and the applied N.
4. Data analysis. The soil and crop variables from the experimental random design applied
were analysed using the F test (P< 0.05), after tested for normality and homogeneity of
variances. The statistical differences between treatments were assessed applied the Tukey test.
When data did not show a normal distribution (besides transformations), the Kruskal-Wallis
non-parametric analysis was applied instead. The data was analysed using SAS Windows v8
package.
RESULTS AND DISCUSION
Soil S and N supply
Andisol and Mollisol soils were contrasted in their chemical properties and the capacity to
provide N and S to the soil solution. Soil pH was identical for both soils, but Andisol showed
better fertility as the level of organic matter was larger, as well as N and S availability (Table
1). However, these initial values of soil S and N are low, and therefore they seemed to
respond to the application of S and N.

17
The analysis of the mineralisation process allows finding the potential of soils to supply these
nutrients. In general, the C mineralised from Andisol and Mollisol did not showed difference
(P< 0.05) up to 56 days of soil incubation, but the Andisol registered a larger value (P< 0.05)
at the end of the evaluation period (112 days) (Figure 1). The C mineralization reached a
maximum rate between 14 to 28 days of incubation (P< 0.05), whilst the Andisol soil did not
showed significant differences (P< 0.05) between its C mineralization temporal rates (Table
3). This might be explained by the larger organic matter content in the Andisol soil (Table 3).
The trend of C mineralisation was better matched by the mineralisation of N in Andisol than
in Mollisol soil, since the latter showed a quadratic trend instead of the linear one obtained by
the Andisol soil (Figure 1), which would represent a more active mineralisation process in the
Andisol soil, contrasted with the Mollisol soil where the process reaches a peak and then a
depleted activity is observed around day 56th
. Nevertheless, for both soils the N mineralisation
rate was temporally more dynamic compared to C mineralization, showing the more active
period of microbial activity within the first two weeks (Table 3).
The soil S mineralization showed larger release of sulphate at the beginning of the experiment
(first 7 days), that then decreased over the observed period (Figure 1). Partial differences in S
mineralisation were statistically significant (P< 0.05) between incubation periods and
consequently, the accumulated S mineralised over time showed a consistent difference
between soils, where the Andisol soil showed larger potential to release S than the Mollisol
soil (P< 0.05) (Figure 1). The temporal rate of soil S mineralisation showed marked
progressive decline during the incubation period (Table 3). In particular, the rate of S
mineralisation dropped consistently after 14 days of soil incubation. The pattern of S
mineralisation was coincident with that of N mineralisation from the Mollisol soil.
Additionally, the specific parameters regarding the N organic release, such as the activity of
urease and the potentially available N (PAN) did not showed statistical difference (P< 0.05)
between Andisol and Mollisol soils (Table 4). The urease activity was greater than another
Andisol soil [19] in the same site, possibly due to the historical fertiliser application
contrasted with the organic management. In turn, the PAN values registered in this study were
within the ranges informed for other soils [24].
Under the light of the results, the soils in this study have not shown statistical differences (P<
0.05) on the microbiological parameters analysed, but in S mineralisation. Therefore, the
Mollisol soil was used to carry out the assay testing the influence of S application on N crop
use, because the greater potential that the S deficiency can show a better response to S and
consequently N application.
18
As such, the available N and S in the soil were low (Table 1) reflecting the soil capacity to
provide these nutrients through the mineralisation process, and so additional inputs are
applied to improve the presence of these nutrients in the soil solution for plant uptake.
Effect of S application on crop development
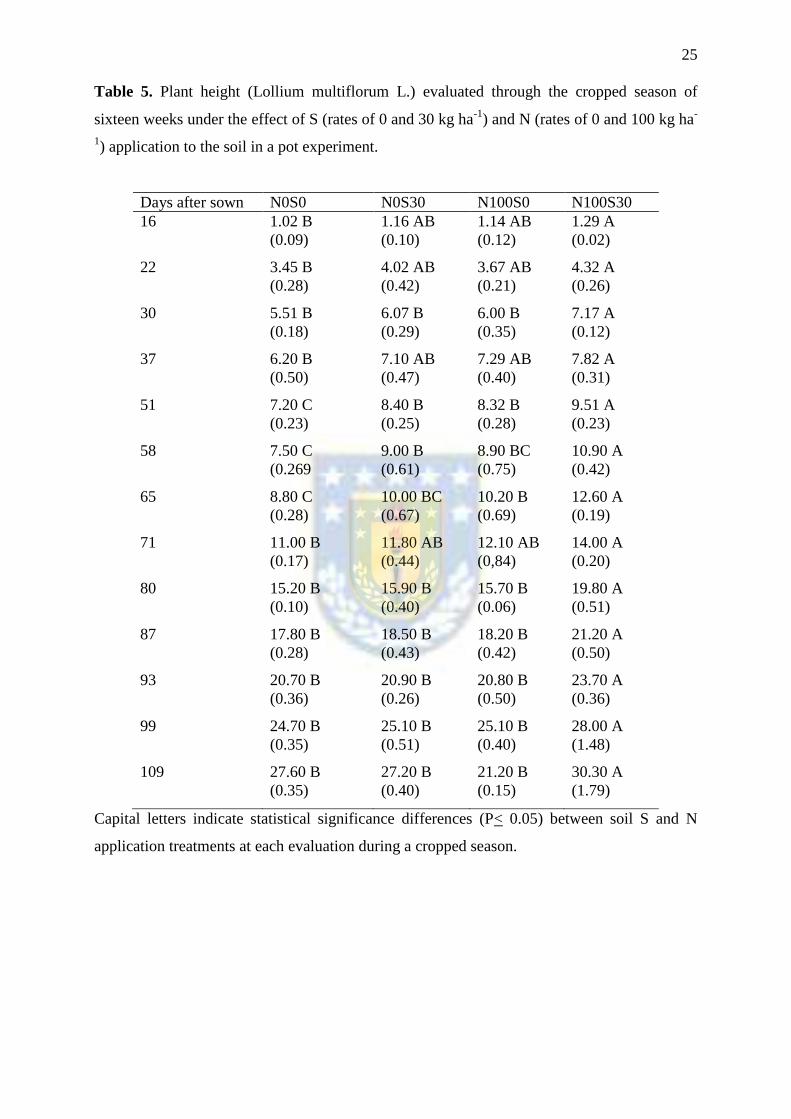
The crop height over time was measured as a growth index to assess the response of N and S
application (Table 5). The combined application of N and S showed the better growth
response (P< 0.05) than a single application of S or N, particularly when the crop was more
developed, after day-80, as during the first month the differences between treatments were
less evident. Visually, the crop height registered per pot showed correspondence with the
intensity of the green colour in the leaves. This would support the hypothesis of the role of S
improving photosynthesis in the presence of N. Nevertheless, the results also showed that
after an initial growth, the exclusive application of S can improve the crop height, as there is
no significant difference observed with N100S0 treatment. However, this pattern was not
replicated by the biomass production, as only the application of N showed a significant effect
over the dry matter yield (P< 0.05) (Table 6). This is, the dry matter increment from the
control treatment to N100 was 69%, and 5% over from the control treatment with 30 kg S ha-1
to the combined N and S application treatment (Table 6). In turn, the application of S did not
show statistical significance (P< 0.05) when contrasting comparison is made within no N
application, and within N100 application, although the registered increments in dry matter
production were 8 and 23%, under N restriction and N100 application, respectively (Table 6).
The dry matter from the root system evaluated at the end of the assay showed the same trend
as the foliage dry matter (Table 6), and it seems that the combination of N and S induced a
larger volume of plant roots, but shorter than the control treatment and single nutrient
application-treatments (Table 6).
The values of the total N content in the foliage ranged from 1.39% to 2.63%, and as well as
the dry matter production, showed only the effect of the N application (Table 6). Thus,
contrary to the stated working hypothesis, the rate of 30 kg ha-1
of S did not improve the
quality of the crop under the circumstances of this study. However essential amino acids
containing S, like methionine and cysteine were not measured here, where S is part of their
structure, particularly in the thiol group which is crucial to act at all levels of biochemical
systems [25]. Plants are exclusively the only organisms that can take up inorganic S (as
sulphate) and reduce it to this thiol group and then into the essential amino acids, therefore
human beings are depending on the vegetal consumption in order to incorporate these

19
essential amino acids into the diet. The measurement of these amino acids might have
indicated whether S was taken up by the crop and improved the quality of the production.
The results indicate that the applied N to increase the soluble available N for plant uptake had
a greater impact on crop biomass yield, than the S application, perhaps due to the very low
initial N availability. The experiment might have benefited from the inclusion of a larger N
application rate than the N100 utilised. We acknowledge the low number of treatments
combining N and S dose used here in this first approach, but this would have implied a larger
experimental assay, more difficult to manage. The treatments selected for this study were
thought as an initial research start, using N and S rates that could represent an economy
alternative for crop fertilisation, based on recommendation provided by a study in 1997 [10].
However, the suggested rates of S application might have to be revised due to the higher
nutrient requirements from improved current crop varieties. Therefore, further research is
recommended to be carried out including more rates of N and S, the application of isotope
techniques, and the measurement of the foliage area index (missed data in this study), which
would explain the lack of consistency between height growth and crop yield production,
Effect of S application on N recovery efficiency
The N content in the produced biomass was used to calculate the recovery efficiency of N at
the end of the study period related to the available and added N in the soil (Table 7). Besides
the increase of over 25% in the N recovery due to the S application, the values between
treatments showed no statistical difference (P< 0.05). This increase seems to follow that of the
dry matter increment from the S rate application of 30 kg ha-1
at the N fertilised pots, as the N
concentration was almost the same between N100S0 and N100S30 treatments (Table 7).
Therefore, an improving in N uptake was not observed from the S application at the rates used
here. However, it has been pointed out that the synergy between S and N works better when
the soil available N is high [17], and perhaps the N rate applied in this study was under the
dose required by the crop and so the S applied did not fill the expected function. This can be
supported by the increased residual soil available S, around three times the initial S status
(Table 8), whilst residual N was almost twice the initial soil available N. As pointed out
above, the analysis of essential S-containing amino acids in the produced biomass could
provide a probe of the S fate within the soil-plant system.
20
CONCLUSION
The studied andisol and mollisol soils showed large organic matter contents, but the N and S
availability, as well as their capacity to supply mineral N and S to the soil solution was low.
The natural supply from the Mollisol through N and S mineralization was lower than the
Andisol. The response to a medium dose of S application in the Mollisol soil did not increase
significantly (P< 0.05) the recovery of N in the tested crop of short term growth. A wider
combination of N and S application rates are recommended in order to prove the interaction of
S with higher N availability for the crop.
ACKNOWLEDGEMENTS
This research was granted by Conicyt-Fondecyt 11140441, and supported by the Universidad
de Concepción (Department of Soil Science and Natural Resources, Program of Magister en
Ciencias Agronómicas from Facultad de Agronomía, and the Subdirection of Research and
Development-VRID).
REFERENCES
1. S.G Thomas, T.J Hocking, and P.E Bilsborrow, “Effect of sulphur fertilisation on the growth
and metabolism of sugar beet grown on soils of differing sulphur status,” Field Crops
Research, 83, 223-235 (2003).
2. W. H. Allaway, and J. F. Thompson, “Sulfur in the nutrition of plants and animals,” Soil Sci.,
101, 240-247 (1966).
3. J. Eriksen, “Soil Sulfur Cycling in Temperate Agricultural Systems,” In: Donald L. Sparks,
Editor(s), Advances in Agronomy, Academic Press, USA, 102, 55-89 (2009).
4. M. Hawkesford, W. Horst, T. Kichey, H. Lambers, J. Schjoerring, I.S. Møller, and P. White,
Chapter 6 – “Functions of Macronutrients,” In Marschner's Mineral Nutrition of Higher
Plants (Third Edition), edited by Petra Marschner, Academic Press, San Diego, pp.135-189,
ISBN 9780123849052 (2012).
5. M.A. Raza, L.Y. Feng, A. Manaf, A. Wasaya, M. Ansar, A. Hussain, M.H.B. Khalid, N.
Iqbal, Z.J. Xi, Y.K. Chen, J.X. Chen, F. Yang, and W. Yang, “Sulphur application increases
seed yield and oil content in sesame seeds under rainfed conditions,” Field Crops Research,
218, 51-58 (2018).
6. P. Prystupa, A. Peton, E. Pagano, and F.H. Gutierrez Gutierrez-Boem, “Sulphur fertilization
of barley crops improves malt extract and fermentability,” Journal of Cereal Science, 85, 228-
235 (2019).

21
7. Z. Tao, X. Chang, D. Wang, Y. Wang, S. Ma, Y. Yang, and G. Zhao, “Effects of sulfur
fertilization and short-term high temperature on wheat grain production and wheat flour
proteins,” The Crop Journal, 6 (4), 413-425 (2018).
8. A.Y. Prosekov, and S.A. Ivanova, “Food security: The challenge of the present,” Geoforum,
91, 73-77 (2018)
9. H.W. Scherer, “Sulphur in crop production,” European Journal of Agronomy, 14, 81-111
(2001).
10. F.J. Zhao, S.P. McGrath, S.E. Salmon, P.R. Shewry, R. Quayle, P.J.A. Withers, E.J. Evans,
and J. Monahan,”Optimising sulphur inputs for bread making quality of bread,” Aspects of
Applied Biology, 50,199-205 (1997).
11. F.J Zhao,S.P. McGrath, M.M.A. Blake-Kalff, A. Link, and M. Tucker, “Crop responses to
sulphur fertilisation in Europe,” Proceedings No 504. International Fertiliser Society, New
York, UK, p.27 (2002).
12. Koprivova, and S. Kopriva, “Sulfur metabolism and its manipulation in crops,” Journal of
Genetics and Genomics, 43, 623-629 (2016).
13. G. Schenkel, P. Baherle, H. Floody, and M. Gajardo, “Exploración de deficiencias nutritivas
con suelos en macetas. XVIII. Macronutrientes, provincia de Aisén,” Agricultura Técnica, 34,
189-200 (1973).
14. M. Alfaro, M. Bernier, and S. Iraira, “Effect of sulphur source effect on yield and quality of
wheat and pasture in two Andisols,” Agricultura Técnica, 66 (3), 283-294 (2006).
15. M. Aguilera, M.L. Mora, G. Borie, P. Peirano, and H. Zunino, “Balance and distribution of
sulphur in volcanic ash-derived soils in Chile,” Soil Biology & Bioch., 34 (9), 1355-1361
(2002).
16. J. Arshad, M. Yong-Sun, and Z. Malik, “Sulphur-a general overview and interaction with
nitrogen,” Australian Journal of Crop Science. 4(7), 523-529 (2010).
17. F. Salvagiotti, J.M. Castellarín, D.J. Millares, and H.M. Pedrol, “Sufur fertilization improves
nitrogen use efficiency in wheat by increasing nitrogen uptake,” Field Crops Research, 113,
170-177 (2009).
18. F.J. Stevenson, and M.A. Cole, “Cycles of soil: carbon, nitrogen, phosphorus, sulfur,
micronutrients,” (2nd. ed.). John Wiley & Sons. New York, USA (1999).
19. J.C. Sanchez-Hernandez, M. Sandoval, A. Pierart, "Short-term response of soil enzyme
activities in a chlorpyrifos-treated mesocosm: Use of enzyme-based indexes,” Ecological
Indicators, 73, 525-535 (2017).

22
20. J.P. Anderson, Soil respiration. p. 831-871. Number 9. In A.L. Page, R H. Miller and D.R.
Keeney (eds.) Methods of soil analysis, Part 2. Chemical and microbiological properties. 2nd
ed. Soil Science Society of America, Madison, Wisconsin, USA. (1982).
21. D. Maynard, J. Stewart, and J.R. Bettany, “Sulfur and nitrogen mineralization in soils
compared using two incubation techniques,” Soil Biology & Biochemistry, 15, 251-256
(1983).
22. D.L. Rowell, “Soil Science, methods and applications,” New York, United States. pp. 350
(1994).
23. Sadzawka, M.A. Carrasco, R.R. Demanet, H. Flores, R. Grez, M.L. Mora, and A. Neaman,
“Métodos de análisis de tejidos vegetales,” Serie Actas INIA Nº40. INIA La Platina.
Santiago, Chile (2007).
24. S.J. Baxter, and M.A. Oliver, "The spatial prediction of soil mineral N and potentially
available N using elevation," Geoderma, 128 (3-4), 325-339 (2005).
25. M. Wirtz, and M. Droux, “Synthesis of the sulfur amino acids: cysteine and methionine,”
Photosynth Research, 86, 345- 362 (2005).

23
Table 1. Selected chemical soil properties of two cropped soils of restricted nitrogen and
sulphur availability.
Soil properties Mollisol Andisol
Value Level Value Level
Soil pH 5.9 Low 5.9 Low
Soil organic matter (%) 3.5 Medium 5.7 Medium
Available phosphorous (mg kg-1
) 28.3 High 18.6 Medium
Available potasium (mg kg-1
) 79.23 Low 411.3 High
Available N-NO3- (mg kg
-1) 7.5 Low 14.0 Low
Available N-NH4+
(mg kg-1
) 2.8 Low 3.2 Low
Available sulphur (mg kg-1
) 4.0 Low 8.7 Low
Table 2. Equivalent rates of the combined application of sulphur (S) and nitrogen (S) to the
soil, to test the effect of S application on plant N recovery in a pot experiment.
Treatments S application (kg ha-1
) N application (kg ha-1
)
N0S0 0 0
N0S30 30 0
N100S0 0 100
N100S30 30 100

24
Table 3. Rates of carbon, nitrogen and sulphur mineralization from two cropped soils of
different levels of soil organic matter at different periods within 112 days of soil incubation.
Evaluated
period (days)
Carbon mineralisation
(µg CO2-C g soil-1
day-1
)
Nitrogen mineralisation
(µg NH4+-N g soil
-1 day
-1)
Sulphur mineralisation
(µg SO4-2
-S g soil-1
day-1
)
Andisol Mollisol Andisol Mollisol Andisol Mollisol
0-7 4.94 A
(2.20)
3.86 B
(1.70)
0.47 A
(0.14)
0.52 A
(0.12)
0.12 A
(0.03)
0.07A
(0.01)
7-14 4.87 A
(1.91)
4.19 B
(0.99)
0.51 A
(0.09)
0.52 A
(0.08)
0.08 AB
(0.02)
0.06A
(0.02)
14-28 5.98 A
(2.53)
6.07 A
(1.38)
0.21 B
(0.03)
0.20 B
(0.05)
0.04 BC
(0.01)
0.02B
(0.003)
28-56 3.79 A
(1.23)
4.08 B
(0.61)
0.12 C
(0.01)
0.11 B
(0.01)
0.01 C
(0.004)
0.01B
(0.004)
56-112 4.98 A
(1.13)
3.88 B
(0.87)
0.18 BC
(0.01)
0.04 C
(0.01)
Capital letters indicate statistical significance differences (P< 0.05) between mineralisation
rates evaluated within a soil.
Standard deviation values of the variables are shown in brackets.
Table 4. Soil indicators of nitrogen availability for two cropped soils with different levels of
soil organic matter.
Potentially available nitrogen*
(µg N-NH4+ g soil
-1)
Urease activity*
(µg N-NH3+ g soil
-1 h
-1)
Andisol 11.38
(4.33)
36.3
(1.66)
Mollisol 15.89
(7.55 )
37.79
(3.80)
*No statistical significance (P< 0.05) for these variables between soils.
25
Table 5. Plant height (Lollium multiflorum L.) evaluated through the cropped season of
sixteen weeks under the effect of S (rates of 0 and 30 kg ha-1
) and N (rates of 0 and 100 kg ha-
1) application to the soil in a pot experiment.
Days after sown N0S0 N0S30 N100S0 N100S30
16 1.02 B
(0.09)
1.16 AB
(0.10)
1.14 AB
(0.12)
1.29 A
(0.02)
22 3.45 B
(0.28)
4.02 AB
(0.42)
3.67 AB
(0.21)
4.32 A
(0.26)
30 5.51 B
(0.18)
6.07 B
(0.29)
6.00 B
(0.35)
7.17 A
(0.12)
37 6.20 B
(0.50)
7.10 AB
(0.47)
7.29 AB
(0.40)
7.82 A
(0.31)
51 7.20 C
(0.23)
8.40 B
(0.25)
8.32 B
(0.28)
9.51 A
(0.23)
58 7.50 C
(0.269
9.00 B
(0.61)
8.90 BC
(0.75)
10.90 A
(0.42)
65 8.80 C
(0.28)
10.00 BC
(0.67)
10.20 B
(0.69)
12.60 A
(0.19)
71 11.00 B
(0.17)
11.80 AB
(0.44)
12.10 AB
(0,84)
14.00 A
(0.20)
80 15.20 B
(0.10)
15.90 B
(0.40)
15.70 B
(0.06)
19.80 A
(0.51)
87 17.80 B
(0.28)
18.50 B
(0.43)
18.20 B
(0.42)
21.20 A
(0.50)
93 20.70 B
(0.36)
20.90 B
(0.26)
20.80 B
(0.50)
23.70 A
(0.36)
99 24.70 B
(0.35)
25.10 B
(0.51)
25.10 B
(0.40)
28.00 A
(1.48)
109 27.60 B
(0.35)
27.20 B
(0.40)
21.20 B
(0.15)
30.30 A
(1.79)
Capital letters indicate statistical significance differences (P< 0.05) between soil S and N
application treatments at each evaluation during a cropped season.

26
Table 6. Crop yield, N foliage concentration, and root growth parameters after cropping
Lollium multiflorum L. in a pot experiment for sixteen weeks under S (rates of 0 and 30 kg ha-
1) and N (rates of 0 and 100 kg ha
-1) application.
Biomass Root system
Dry matter
(g pot-1
)
N concentration
(%)
Dry matter
(g pot-1
)
Area
(cm-2
)
Length
(cm)
Volume
(cm-3
)
N0S0 1.53 B
(0.10)
1.57 B
(0.36)
2.01 B
(0.19)
248.24 AB
(21.37)
1867.96 AB
(382.40)
12.17 AB
(2.37)
N0S30 1.66 B
(0.19)
1.39 B
(0.28)
2.11 B
(0.16)
267.21 A
(45.10)
2258.05 A
(178.50)
13.05 AB
(1.83)
N100S0 4.92 A
(1.00)
2.61 A
(0.91)
9.99 A
(2.43)
251.17 AB
(26.63)
2171.10 A
(340.10)
10.63 B
(1.64)
N100S30 6.39 A
(0.94)
2.63 A
(0.99)
10.11 A
(2.17)
222.13 B
(38.52)
1676.90 B
(304.10)
13.08 A
(2.95)
Capital letters indicate statistical significance differences (P< 0.05) between crop variables
harvested at the end of the cropped season.
Standard deviation values of the variables are shown in brackets.
Table 7. Nitrogen recovery efficiency measured in a Lollium multiflorum L. grown in a pot
experiment for sixteen weeks under S (rates of 0 and 30 kg ha-1
) and N (rates of 0 and 100 kg
ha-1
) application.
Nitrogen recovery efficiency*
N100S0 230.5
(114.2)
N100S30 312.0
(114.5)
*No statistical differences were registered between treatments (P< 0.05).

27
Table 8. Residual soil available nitrogen (N) and sulphur (S) after cropping Lollium
multiflorum L. in a pot experiment for sixteen weeks under S and N application.
Soil available nitrogen
(mg NO3-1
-N kg soil-1
)
Soil available sulphur
(mg SO4-2
-S kg soil-1
)
Initial soil content 5.28 B
(0.30)
4.75 B
(1.07)
N0S0 4.38 B
(2.49)
2.64 B
(0.71)
N0S30 5.33 B
(2.95)
7.81 A
(0.88)
N100S0 10.62 A
(4.19)
2.76 B
(0.51)
N100S30 10.79 A
(6.80)
6.80 A
(0.88)
Capital letters indicate statistical significance differences (P< 0.05) between soil available S
and N during a cropped season. Standard deviation values of the variables are shown in
brackets.

28
Figure 1. Partial (left side, A, C, E) and accumulated (right side, B, D, F) mineralisation of
carbon, nitrogen and sulphur from Andisol and Mollisol soils.

29
CAPÍTULO 3
CALIBRACION DE UN SENSOR DE HUMEDAD WET-2 EN UN SUELO FRANCO-
ARCILLOSO DISTURBADO
MARTÍNEZ, A. 1*
, ZAPATA, M.2, CUEVAS, J.
2 CÓRDOVA,C.
2
1 Programa de Magíster en Ciencias Agronómicas, Facultad de Agronomía, Universidad de
Concepción, Casilla 537, Chillán, Chile. 2
Departamento de Suelos y Recursos Naturales, Facultad de Agronomía, Universidad de
Concepción, Casilla 537, Chillán, Chile. *Autor para correspondencia E-mail:
CALIBRATION OF A WET-2 MOISTURE SENSOR IN A DISTURBED FRANCO-
ARCILLOSO SOIL
Funciones de calibración de un sensor WET-2en suelos disturbados
Este artículo en calidad de nota corta fue enviado a la revista AGROSUR

30
Key words: volumetric moisture, dielectric constant of soil, irrigation Scheduling, irrigation
criterion
ABSTRACT
The measurement of the soil water content is essential to schedule crop irrigation, and
such measurements can be obtained using dielectric sensors, but this is soil-specific and
requires calibration. The objective of this study was to establish calibration equations of
a frequency domain reflectometry sensor (FDR) for two soils, in order to monitor soil
moisture content matching an application of water that maintains 50% of available soil
moisture. Disturbed samples from clay loam soils were collected from the field (n=3), at
0-20 cm depth. A pot experiment was set to measure the volumetric soil moisture
content (m3 m
-3) using the sensor and the gravimetric technique. Measurements were
taken on saturated soil condition (day-1) and subsequent measurements were done after
2, 5 and 6 days. Mollisol soil showed a range between 17 to 35% Ɵ, and 0.12 to 0.47 m3
m-3
according to the sensor (R2 = 0.95). Andisol soil showed moisture values between 14
to 35% Ɵ and 0.25 to 0.56 m3 m
-3 according to the sensor (R
2 = 0.95). Therefore, by
using the WET-2 sensor, adequate programming and monitoring of crop irrigation is
feasible.
RESUMEN
La medición del contenido de agua del suelo es esencial para programar el riego de un
cultivo, y se puede llevar a cabo usando sensores dieléctricos, pero éstos requieren
calibración en el suelo de interés. El objetivo de este estudio fue establecer ecuaciones de
calibración de un sensor de reflectometría de dominio de frecuencia (FDR) en dos suelos
(Mollisol y Andisol) disturbados, para programar el riego que satisfaga el 50% del agua
disponible (HA). Para ello se trabajó con muestras provenientes de tres repeticiones de
campo para cada suelo, tomadas a una profundidad de 0-20 cm. Se midió la humedad
volumétrica (m3
m-3
) con el sensor y mediante la técnica gravimétrica, desde saturación
hasta punto de marchitez permanente. El suelo Mollisol presentó un rango de 17 a
35%Ɵ y de 0,12 a 0,47 m3
m-3
según el sensor (R2
= 0,95), y el Andisol mostró valores de
humedad de 14 a 35% Ɵ y de 0,25 a 0,56 m3
m-3
(R2 = 0,97). Por lo tanto, mediante el uso
del sensor WET-2 se puede lograr una adecuada programación y monitoreo del riego.
Palabras clave: humedad volumétrica, constante dieléctrica del suelo, manejo del riego.

31
INTRODUCCIÓN
La medición del contenido de agua en el suelo es esencial para mejorar el balance hídrico del
sistema suelo-cultivo-atmósfera (Nols y Kammerer, 2017), ya que afecta a la
evapotranspiración y consecuentemente a la producción de materia seca de cultivos y frutales
(Lekshmi et al., 2014). La precisión de estas mediciones mejoran la comprensión de la
respuesta del cultivo al estrés hídrico y a la programación de riego (Mwale et al., 2005).
La humedad del suelo puede expresarse en porcentaje (% hbss), ya sea como humedad
gravimétrica (w) o volumétrica (Ɵ). La w se define como la relación entre la masa de agua
presente en la muestra de suelo y la masa seca de la misma, mientras que Ɵ relaciona el
volumen de agua presente en el suelo y el volumen total del mismo (Lekshmi et al., 2014),
que se obtiene multiplicando w por la densidad aparente (Dap). La técnica estándar para medir
la humedad del suelo es el método gravimétrico (Rezaei et al., 2012), que requiere de tiempo
en el procedimiento y es destructivo, lo que significa que no se puede usar para mediciones
repetitivas en el mismo lugar (Lekshmi et al., 2014). Sin embargo, es indispensable como
método de calibración y evaluación (Rudnick et al., 2015). En contraste, las técnicas
modernas representan una buena alternativa de uso para el monitoreo de la humedad en el
suelo y la programación del riego para los cultivos (Lekshmi et al., 2014). Al respecto, los
sensores dieléctricos se han usado ampliamente Y su funcionamiento se basa en la detección
de los cambios en la constante dieléctrica en el suelo. Las principales técnicas utilizadas por
estos sensores son la reflectometría en el dominio del tiempo (TDR) y reflectometría en el
dominio de la frecuencia (FDR) o capacitancia (Jeewantinie y Lu, 2017), y su ventaja es que
constituyen un método no destructivo (Lekshmi et al., 2014). Sin embargo, la precisión
depende de las propiedades físicas, mecánicas y químicas del suelo (Mohsen et al., 2018), por
ello, su uso está sujeto a la calibración según las condiciones particulares de cada sitio.
Dentro de los sensores FDR, se encuentra el tipo WET-2, que es multiparamétrico,
relativamente nuevo y económico (Kargas et al., 2013) por lo que su aplicación requiere ser
validada. Por ello, el objetivo de este estudio fue establecer ecuaciones de calibración de un
sensor de reflectometría de dominio de frecuencia (FDR) en dos tipos de suelo para un
monitoreo adecuado de la humedad cuando se aplica un riego que satisfaga el 50% del agua
disponible (HA).
32
MATERIALES Y MÉTODOS
Sitio experimental y características de los suelos
Los suelos fueron muestreados en la Estación Experimental “El Nogal” de la Universidad de
Concepción ((36°35’44,00’’ S; 72°04’36,25’’ O), y pertenecen al orden Mollisol y Andisol.
El Mollisol es de la serie Mebuca (Fine, mixed,thermic Aquic Palexeroll) es un suelo
desarrollado sobre la unidad geomorfológica denominada abanico aluvial de Chillán,
moderadamente profundo, con drenaje imperfecto, color pardo rojizo oscuro, bien
estructurado, y de capacidad de uso IIW2. El suelo Andisol es de la serie Arrayán (medial,
thermic Typic Haploxerands) de origen de cenizas volcánicas, de buena profundidad y con
Capacidad de Uso I (ortofoto Chillán 3634-7200 CIREN, 1990).
Características físicas e hídricas de los suelos
La textura (USDA) del suelo Mollisol es de tipo franco arcillosa (30,46% arcilla, 31,02%
limo y 38,5% arena). El contenido de humedad (Ɵ) registrada a capacidad de campo (CC) fue
30,0% y el punto de marchitez permanente (PMP) de 17,0% según el método de la olla a
presión (Sandoval et al., 2012), y la densidad aparente (Dap) fue de 1,26 g cm-3
. El suelo
Andisol tiene textura (USDA) franco arcillosa (28,2% arcilla, 29,9% limo, y 42% arena), CC
y PMP corresponden a 25%(Ɵ) y 14%(Ɵ), y Dap= 0,7 g cm-3
.
Diseño experimental, procedimiento de la calibración y análisis de datos
Se utilizó macetas con aproximadamente 1 kg de suelo (n=3) provenientes de tres parcelas de
30 x 30 m, muestreadas a una profundidad de 0-20 cm. Las muestras fueron tamizadas a 10
mm. Los parámetros de CC y PMP aproximados fueron determinados en las macetas,
combinando saturación de agua y tiempo de percolación (días). Se midió la humedad en la
maceta y se dejó drenar por dos días para alcanzar el punto de CC. A medida que el suelo fue
drenado se registró el contenido de humedad gravimétrica (% hbss) y también se realizaron
lecturas con el sensor WET-2. . Para la determinación de la humedad gravimétrica en base a
volumen (Ɵ) se midió la Dap de los suelos en las macetas por el método del cilindro
(Sandoval et al., 2012), para relacionarla con la medición del sensor WET-2 (m3 m
-3) a través
de una curva de calibración.
Los valores de humedad del suelo obtenidos por la metodología estándar y a través del sensor
WET-2, fueron analizados mediante una regresión lineal (P < 0,05) con el programa
estadístico SAS Windows 8.0 (Castillo, 2007).

33
RESULTADOS Y DISCUSIÓN
En la Fig. 1 se presenta la relación entre el contenido de agua volumétrico (Ɵ) determinado
con el método gravimétrico y el medido con el sensor WET-2 (m3
m-3
) para ambos suelos. Se
observó una relación lineal con alta precisión (R2
= 0,95 y R2
= 0,97). El suelo Mollisol
mostró valores de humedad Ɵ en el rango de 17 a 35%, y de 0,12 a 0,47 m3 m
-3 según el
sensor. La calibración del suelo Andisol (Fig. 2) registró valores de 14 a 35% de humedad Ɵ
y 0,25 a 0,5 m3 m
-3 medidos con el sensor
El agua disponible (HA Ɵ) del suelo Mollisol fue de 13,0% (CC-PMP) y la humedad Ɵ
correspondiente al criterio de riego del 50% de HA, es de 23,5%, en tanto que en el Andisol la
HA fue 11% y la humedad según el criterio de riego es 19,5%, que considera la base del PMP
más el 50% de la HA. En el cuadro 1 se muestra la comparación de esta condición, del punto
de CC, y PMP obtenidos por las dos técnicas utilizadas. Se observa que para el caso del CC
en Mollisol en términos de humedad Ɵ los valores fueron similares entre la medición del
sensor interpolado de la función lineal obtenida de la curva (31%) con respecto al medido en
el laboratorio (30%), mientras que el contenido de humedad al PMP fue de 21% según el
sensor y de 17% con el método gravimétrico, lo que representa una variación de 4%, la misma
situación se presentó en el suelo Andisol (diferencia del 2% y de 4% CC y el PMP,
respectivamente. Esto se puede deber a la dificultad que presenta el suelo para alcanzar el
nivel simulado de tensión por la olla, bajo las condiciones ambientales del experimento de
maceta (Asgarzadeh et al., 2014), ya que en PMP la retención de agua a nivel de partículas de
suelo es muy fuerte, y por eso el método de la olla a presión genera la fuerza suficiente para
remover esta humedad desde la matriz del suelo y la sonda como no aplica fuerza, mide el
agua que está en la matriz, la que al no ser retirada en su totalidad, genera el delta de 4% de
humedad).
Las curvas de calibración obtenidas muestran la necesidad de la calibración de los sensores de
humedad FDR en cada suelo en particular (Lekshmi et al., 2014), dado que el suelo es un
material formado por minerales, aire y agua, y la permitividad o constante dieléctrica se
componen de la contribución relativa de cada uno de estos factores (Carpena, 2004). En este
estudio, tanto el suelo Mollisol como el Andisol tienen la misma textura, pero difieren en la
proporción de partículas finas, así como el contenido de materia orgánica (3,5% Mollisol y
5,7% Andisol), lo que genera la diferencia entre las curvas.
Las curvas de calibración de los suelos estudiados determinaron que las lecturas del sensor
WET-2 del suelo Mollisol debían alcanzar los 0,23 m3 m
-3, para asegurar el criterio de riego
de 50% del agua disponible. Por su parte, en el suelo Andisol la humedad correspondiente al

34
criterio de riego debía ser de 0,33 m3 m
-3, Valores menores a éste implicaron reposición del
agua, según lo interpolado de la curva de regresión estimada.
AGRADECIMIENTOS
Los autores agradecen a la Facultad de Ingeniería Agrícola de la Universidad de Concepción,
campus Chillán, por facilitar el sitio de estudio, y la ayuda en la recolección de las muestras
de suelo prestada por los Sres. Carlos Fuentealba, Matías Betancur y la Sra. Claudia Garrido
Ruiz.
LITERATURA CITADA
Asgarzadeh, H., Mosaddeghi, M.R., Dexter, A.R., Mahboubi, A.A., Neyshabouri, M.R., 2014.
Determination of soil available water for plants: Consistency between laboratory and field
measurements. Geoderma 226-227, 8-20. https://doi.org/10.1016/j.geoderma.2014.02.020.
Carpena, M.R., 2004. Field Devices For Monitoring Soil Water Content. Agricultural and
Biological Engineering Department, Florida Cooperative Extension Service, Institute of Food
and Agricultural Sciences, University of Florida.
Castillo, L.E., 2007. Introducción al SAS para Windows. 3th ed. Universidad Autónoma
Chapingo, México.
Centro de Investigaciones de Recursos Naturales (CIREN), 1990. Estudio agrológico Itata I:
Descripciones de suelos, materiales y símbolos VIII Región. Publicación. No 89, Santiago,
Chile, pp. 269.
Jeewantinie, R., Lu, M., 2017. Automated general temperature correction method for
dielectric soil moisture sensors. Journal of Hydrology 551(4), 203-216.
doi.org/10.1016/j.jhydrol.2017.05.050.
Kargas, G., Ntoulas, N., Nektarios, P.A., 2013. Moisture content measurements of green roof
substrates using two dielectric sensors. HortTechnology 23(2), 177-186.
Lekshmi, S.U., Maryam, D.N., Baghini, M.S., 2014. A critical review of soil moisture
measurement. Measurement 54, 92-105. doi.org/10.1016/j.measurement.2014.04.007 0.
35
Mohsen, A., Mohamed, O., Paleologos, E.K., 2018. Dielectric permittivity and moisture
content. In J., Hayton (ed.), Fundamentals of geoenviromental engineering. Elsevier Inc.,
Cambridge, United States, pp. 581-637.
Mwale, S.S., Azamali, S.N., Sparkers, D.L., 2005. Can the PR1 capacitance probe replace the
neutron probe for routine soil-water measurements? Soil Use and Management 21, 340-347.
doi.10.1079/SUM2005332.
Nolz, R., Kammerer, G., 2017. Evaluating a sensor setup with respect to near-surface soil
water monitoring and determination of in-situ water retention functions. Journal of Hydrology
549, 301-212. doi.org/10.1016/j.jhydrol.2017.04.011.
Rezaei, M., Ebrahimi, E., Naseh, S., Mohajerpour, M., 2012. A new 1.4-GHz soil moisture
sensor. Measurement 45, 1723–1728. doi.org/10.1016/j.measurement.2012.04.014.
Rudnick, D.R., Djaman, K., Irmak, S., 2015. Performance analysis of capacitance and
electrical resistance-type soil moisture sensors in a silt loam soil. American Society of
Agricultural and Biological Engineer 58(3), 649–665. doi: 10.13031/trans.58.10761.
Sandoval, M., Dörner, J., Seguel, O., Cuevas, J., Rivera, D., 2012. Métodos de análisis físicos
de suelos. Departamento de Suelos y Recursos Naturales Universidad de Concepción.
Publicación N° 5, Chillán, Chile, pp. 29-34.

36
Figura 1. Curvas de calibración de un sensor de humedad WET-2 en suelos Mollisol y
Andisol disturbados para un experimento de macetas. (P < 0, 05).
Figure 1. Calibration curves of a WET-2 moisture sensor in disturbed Mollisol and Andisol
soils for a pot experiment. (P <0.05).

37
Cuadro 1. Contenido de agua medido con un sensor WET-2 y con la técnica gravimétrica en
un suelo Mollisol y Andisol.
Table 1. Water content measured with a WET-2 sensor and with the gravimetric technique in
a Mollisol and Andisol soils.
CC: capacidad de campo, PMP: punto de marchitez permanente, CR: criterio de riego.
Contenido de agua según método de medición
WET-2 Gravimétrico estándar
Mollisol Andisol Mollisol Andisol
(m3
m-3
) (%) (m3
m-3
) (%) (m3
m-3
) (%) (m3
m-3
) (%)
CC 0,32 31 0.39 27 0,35 30,0 0,41 25
PMP 0,22 21 0.19 18 0,11 17,0 0,25 14
CR (50%) 0,27 26 0,29 23 0,23 24 0,33 20
38
CAPÍTULO 4
CONCLUSIONES GENERALES
1- Los suelos estudiados Andisol y Mollisol mostraron altos contenidos de materia
orgánica, pero la disponibilidad de N y S, así como su capacidad para suministrar
estos minerales a la solución del suelo fue baja. El suministro natural de Mollisol a
través de la mineralización de N y S fue menor que el de Andisol.
2- La respuesta a una dosis media de aplicación de S en el suelo de Mollisol no
incrementó significativamente (P <0.05) la recuperación de N en el cultivo evaluado
en un período de crecimiento a corto plazo. Se recomienda una combinación más
amplia de tasas de aplicación de N y S para probar la interacción de S con una mayor
disponibilidad de N para el cultivo.
3- La respuesta a la aplicación conjunta de N y S en el suelo no aumentó el rendimiento
de la biomasa ni mejoró la calidad del cultivo en el contenido de proteínas, dado que
mostró resultados similares al tratamiento solo con N.