disruption of yeast forkhead-associated …genie.weizmann.ac.il/pubs/forkhead.pdf · disruption of...
TRANSCRIPT

1
DISRUPTION OF YEAST FORKHEAD-ASSOCIATED CELL CYCLE TRANSCRIPTION BY OXIDATIVE STRESS
Michael Shapira1* Eran Segal2 and David Botstein3*
1Genetics Department, Stanford University School of Medicine, Stanford CA 94305-
5120 2 Computer Science Department, Stanford University, Stanford CA, 94305
3 Current address: Lewis-Sigler Institute for Integrative Genomics, Princeton University, Princeton, NJ 08544
*To whom correspondence should be addressed. E-mail: [email protected]; [email protected].
Key words: oxidative stress, cell cycle, genomic, forkhead proteins, microarrays ABSTRACT
The effects of oxidative stress on yeast cell cycle depend on the stress-exerting agent. We studied the effects of two oxidative stress agents, hydrogen peroxide (HP) and the superoxide-generating agent Menadione (MD). We found that two small co-expressed groups of genes regulated by the Mcm1-Fkh2-Ndd1 transcription regulatory complex are sufficient to account for the difference in the effects of HP and MD on the progress of the cell cycle, namely G1 arrest with MD and an S phase delay followed by a G2/M arrest with HP. Support for this hypothesis is provided by fkh1fkh2 double mutants, which are affected by MD as we find HP affects wild type cells. The apparent involvement of a forkhead protein in HP-induced cell cycle arrest, similar to that reported for C. elegans and human, describes a potentially novel stress-response pathway in yeast. INTRODUCTION
Reactive oxygen species (ROS) are by-products of aerobic metabolism, but are also attributes of the extracellular environment. They pose a threat to organisms by damaging a variety of cellular macromolecules including DNA, membrane lipids and proteins, and are implicated with carcinogenesis, aging, and numerous degenerative diseases (Finkel and Holbrook, 2000; Neumann et al., 2003). The major ROS derived from oxygen are superoxide ions, hydrogen peroxide (HP) and hydroxy radicals, ordered here by increasing reactivity (reviewed in (Shackelford et al., 2000).
Oxidative stress in yeast has been studied by exposing cells to agents that are already reactive, typically HP, or drugs that cause the intracellular accumulation of reactive oxygen species (Godon et al., 1998; Dumond et al., 2000; Gasch et al., 2000). Menadione (MD) is such a drug, generating reactive superoxide ions, which can be further oxidized to give HP (Monks et al., 1992; Shackelford et al., 2000). It has been

2
previously reported that exposure to HP or MD results in a cell cycle arrest (Flattery-O'Brien and Dawes, 1998; Leroy et al., 2001). However, the arrest points are not similar for the two agents. MD was reported to arrest cells at the G1 phase of the cell cycle whereas HP was suggested to cause a G2 arrest by an alternate mechanism from that affected by MD (Flattery-O'Brien and Dawes, 1998); others reported that HP exposure causes a delay in the S phase (Leroy et al., 2001).
Hundreds of genes are regulated so that they are expressed at specific times in the cell cycle and not at others (Cho et al., 1998; Spellman et al., 1998). The major part of this coordination is achieved by the sequential activation of a small number of transcription regulators (reviewed in (Mendenhall and Hodge, 1998): MBF (a complex of Mbp1p and Swi6p) and SBF (a complex of Swi4p and Swi6p) are responsible for activating G1 transcription (Koch et al., 1993); Fkh1p and a complex formed by the cooperative promoter binding of Mcm1p and Fkh2p and a later recruitment of Ndd1p are responsible for activating G2/M transcription (Koranda et al., 2000; Kumar et al., 2000; Pic et al., 2000; Hollenhorst et al., 2001); Swi5p and Ace2p, which are themselves expressed during G2/M, are the transcription factors responsible for activating the greater part of the next wave of M/G1 transcription (Dohrmann et al., 1992; Toyn et al., 1997); Mcm1p, this time alone, is additionally responsible for activating transcription of several other M/G1 genes (McInerny et al., 1997).
The highest degree of conservation (sequence-wise) is displayed by the transcription factors responsible for G2/M transcription, Mcm1p, and the two forkhead proteins Fkh1p and Fkh2p. In S. cerevisiae, only these latter two (out of 4 forkhead homologs) are implicated in cell cycle regulation. In mammals, within which this family has expanded to include ca. 40 members (Carlsson and Mahlapuu, 2002), there are at least 2 subfamilies, FOXO (including 4 members) and FOXM (including only FOXM1), that are involved in cell cycle regulation (Medema et al., 2000; Alvarez et al., 2001; Tran et al., 2002; Wang et al., 2002). The FOXO proteins, much like their C. elegans homolog Daf-16, are known to respond to oxidative stress and are crucial for cellular protection from oxidative stress (Kops et al., 2002; Nemoto and Finkel, 2002; Murphy et al., 2003; Brunet et al., 2004).
In this study we attempted to gain better understanding and higher resolution of yeast cell cycle responses to oxidative stress by following cell cycle progression and genome-scale transcriptional responses under oxidative stress caused by MD and HP. Our results help to shed more light on possible mechanisms mediating cell cycle effects of oxidative stress. Most importantly, they suggest the participation of a transcription regulatory complex containing a yeast forkhead protein in mediating these effects. This describes a potentially novel oxidative stress mechanism in yeast and expands the known functional conservation of such responses. MATERIALS AND METHODS Strains

3
Saccharomyces cerevisiae strains used in this study are listed in Table I. All share the S288C genetic background, except DBY8834 and DBY8781 that have the W303 background. Unless mentioned otherwise, experiments were carried out using strain DBY8724. Growth Conditions
Cells were grown with shaking (295 rpm) in YPD at 30°C. Early exponential phase cultures (OD600 0.2-0.4, or 6-12X106 cells/ml) were synchronized by an α factor- induced G1 arrest and a subsequent release in pre-warmed fresh YPD medium, to a density of 1X10⁷ cells/ml. Culture volumes were 600-800 ml for microarray experiments or 150 ml for all other experiments. Alpha factor (Sigma) final concentration was 7 nM for DBY8724 and DBY8834, or 0.8 µM for all other strains; incubation time was 90 minutes.
Menadione or hydrogen peroxide (Sigma) were added at the designated times after release. We maintained the concentration of HP essentially constant by dripping-in fresh medium containing 9 mM HP at a rate of ca. 0.1 ml/min (using a Bio-rad peristaltic pump equipped with masterflex tubing #13) while monitoring HP concentrations as described elsewhere (Green and Hill, 1984). Stopping the drip-in of HP-containing medium, resulted in a fall of its concentration by half within 15 minutes. Cell cycle phase determination
Cells in samples were counted under the microscope, 200-400 cells per time point. Unbudded cells were considered G1 cells; small budded cells, with buds smaller than 50% of the mother cell size, S phase cells; and large-budded cells, G2 or M phase cells. The percentage of each of these variants was calculated out of the total cells counted. DNA content determination
Flow cytometric analyses were performed as described elsewhere (Haase and
Lew, 1997) using a Beckman FACScan workstation. Briefly, cells were fixed in 70% EtOH, washed once with water, and incubated for 1-2 hours, at 37°C, in 2 mg/ml boiled RNase A (Sigma) in 50 mM Tris-Hcl pH 7.5. Cells were then spun down and resuspended in a 5 mg/ml pepsin (Sigma), 55 mM HCl solution for 30-60 minutes at 37°C. This was followed by a 1 hour incubation at RT with 75 mM Propidium Iodide (PI; Sigma) dissolved in 180 mM NaCl, 70mM MgCl2, 100 mM Tris HCl, pH 7.5 (1 X PI solution). Following PI staining, ~1 X 10⁶ cells were placed in a 6-ml polystyrene tube (BD Biosciences, San Jose CA) containing 0.1 X PI solution diluted in 50 mM Tris, pH 7.5, lightly sonicated and analyzed. HP and MD concentrations

4
We probed a range of concentrations for both agents to select the minimal doses sufficient for affecting cell cycle (0.2 mM for HP; 2 mM for MD). Reducing HP concentration to 0.1 mM resulted in growth rates close to normal. Increasing MD concentration to 4 mM produced similar cell cycle effects but appeared to compromise cell viability. Sampling cultures for microarray analyses
For all microarray experiments, aliquots of 25-35 ml were drawn out for extracting total RNA; cells were vacuum-collected onto a 45 micron filter (Osmonics, Minnetonka MN), snap-frozen in liquid nitrogen and kept at -80°C until use. Sampling times were: HP1 ([HP] = 0.23 ± 0.04 mM): 0, 14, 20, 30, 40, 55, 63, 70, 77, 85, 105, 112, 120, 140, 155, 170, 190, 230, 250 and 275 minutes after release from G1 arrest. HP2 ([HP] = 0.28 ± 0.05 mM) : 0, 7, 14, 21, 28, 35, 42, 49, 56, 63, 70, 77, 100, 120, 140, 160, 180 minutes after release. MD1: 0, 14, 20, 30, 40, 55, 70, 77, 85, 100, 120, 140, 170, 210 minutes after release. MD2: 0, 7, 14, 21, 28, 35, 42, 49, 56, 63, 77, 85, 100, 120, 130, 140 minutes after release. RNA Preparation and Hybridization
Total RNA was isolated using the hot acid phenol method, followed by ethanol precipitation (Spellman et al., 1998). Poly-(A)+ mRNA, used for all cDNA microarray analyses, was extracted from total RNA using the Oligotex midi kit (Qiagen, Valencia CA). One to two micrograms were used for each labeling reaction. cDNA probes were labeled using a 3’ anchored oligo dT primer, essentially as described elsewhere (Spellman et al., 1998). Experimental samples were used to generate Cy5-labeled cDNA probes, whereas mRNA reference pools extracted from unsynchronized cultures grown to early log phase under normal conditions, were used to generate Cy3-labeled cDNA probes. Three different reference RNA preparations were used for hybridization: one for each of the time courses HP1 and MD1, and a third preparation for both HP2 and MD2. Cy5- and Cy3-labeled probes were hybridized together to microarrays printed with PCR-amplified fragments (DeRisi et al., 1997), ultimately allowing us to follow expression (after application of data quality filters, see below) of 4772 S. cerevisiae genes. Data Acquisition and Analysis.
Image acquisition and analysis were performed using the GenePix 4000 microarray scanner (Axon instruments, Union City, CA) and GenePix Pro 3.0, respectively. Data was subjected to quality control filters, normalized, and stored at the Stanford Microarray Database (Sherlock et al., 2001)(http://genome-www5.stanford.edu/MicroArray/SMD/). Raw data could be downloaded from this site. Subsequent analyses of data from this study only used spots representing successfully amplified genes, with fluorescent intensities that were either >1.2-fold greater than the local background in one channel and >1.05 in the other, or vice versa. For each individual time course, only ORFs for which more than 80% of spots followed the rule above were

5
selected. The genes from the 4 time courses were then grouped. Sequences represented only in HP2 and MD2 were filtered-out to remove the many intergenic regions printed on these arrays, and similarly were those represented only in one time course. This produced a final list of 4772 genes. Log-transformed (base 2) ratios were used for subsequent analysis (see Web Supplement). Statistical Analyses
For each time course we applied a non-parametric t-test (Troyanskaya et al., 2002) to compare time points before and after the appearance of a stress-induced response. The time points in the ‘before’ and ‘after’ groups were: HP1, before: 14 minutes after release from G1 arrest, 20, 20/redo (subsequently averaged for presentation); after: 40, 49, 55, 63, 63/redo (subsequently averaged for presentation), 70, 77, 85, 105. HP2, before: 7,14, 21, 28; after: 35, 42, 49, 56, 63, 70, 77. MD1, before: 14, 20 , 30; after: 40, 55, 70, 77, 85, 100, 120, 140. MD2, before: 14, 21, 28; after: 42, 49, 56, 63, 77, 85, 100, 120, 130, 140. Genes with p<0.05 from the t-test were considered as responding. Since genes that responded weakly to stress sometimes showed p-values as high as 0.15, we considered as not responding only those with p-values >0.15. Genes considered as responding to one agent but not to the other were those obtained by applying the following rule to the designated gene lists: ((agent1_response1 ∪ agent1_response2) ∩ (agent2_noresponse1 ∩ agent2_noresponse2)). Data arrangement and visualization
All manipulation of pre-clustering files was achieved using the PCL_Analysis program package (Murray et al., 2004)(http://pcl-analysis.sourceforge.net/). Following hierarchical clustering, data was visualized using Java treeview (Saldanha, 2004)(http://jtreeview.sourceforge.net/). Since our interest was in the pattern of expression rather than in absolute values, all figures show data that were median centered for each time course separately. This facilitates comparison of time courses for which different reference RNA samples were used. Promoter and functional annotations analyses
For each sub-cluster, we searched for cis-regulatory motifs (represented as PSSMs), within 500bp upstream of each gene in the sub-cluster (sequences were retrieved from SGD (Cherry et al., 1998) on July 2nd, 2002). We used a discriminative motif finder (Segal et al., 2003), based on Bayesian networks, which attempts to discover motifs that are over-represented in the upstream sequences of cluster genes compared to the upstream sequences of genes in all other clusters. During the motif finding phase, motifs are evaluated by their ability to discriminate the upstream sequences of clustered genes from upstream sequences of the other genes. Motifs are selected based on their discriminatory power. Overall, we discovered 11 potentially novel motifs using this approach. We used the GeneXPress statistical analysis and visualization tool (Segal et al.,

6
2003) to assign p-values for the enrichment of these motifs, as well as known fungi motifs from Version 6.2 of TRANSFAC (Wingender et al., 2001), in sub-clusters of interest compared to the relevant cell cycle phase grouping. This p-value represents the discriminatory power that each motif has.
Searches for GO annotations enriched in gene groups compared to the entire yeast genome was performed with GOTermFinder (http://db.yeastgenome.org/cgi-bin/SGD/GO/goTermFinder). Comparing those groups to subparts of the genome was achieved with GeneXPress using version 1.311 of the GO annotations. RESULTS Cell cycle effects of HP and MD
In order to define better the differences in cell cycle arrest between oxidative stress caused by HP and MD, we exposed synchronized cultures to HP or MD at different points in the cell cycle. Cells were synchronized at G1 with α factor as described previously (Spellman et al., 1998), and exposed to a constant concentration of HP (see Materials and Methods) for 110 minutes beginning at two times after release from arrest: 25 minutes and 58 minutes (Figure 1). As can be seen by comparing Figure 1A and 1C, the cells arrested differently depending upon the time of addition of HP. When HP was added at 25 minutes, after the onset of S phase (Figure 1A), cells accumulated as large-budded cells after a considerable delay in S phase (for a comparison with normal cell cycle progression of synchronized cultures see Web Supplement Figure i). This is consistent with a block at the immediately subsequent G2 or M phases. Figure 1B shows the results of DNA content analysis, which documents the onset of S phase, the S phase delay and the G2/M arrest seen in Figure 1A. However, when HP was added at 58 minutes, after bud emergence (Figure 1C) and completion of DNA synthesis (Figure 1D), there was no arrest in the same cell cycle; instead, cells continued through to the next cycle. The G2/M arrest does not depend on the cessation of HP exposure; essentially the same results were obtained when HP exposure was continued (our unpublished results).
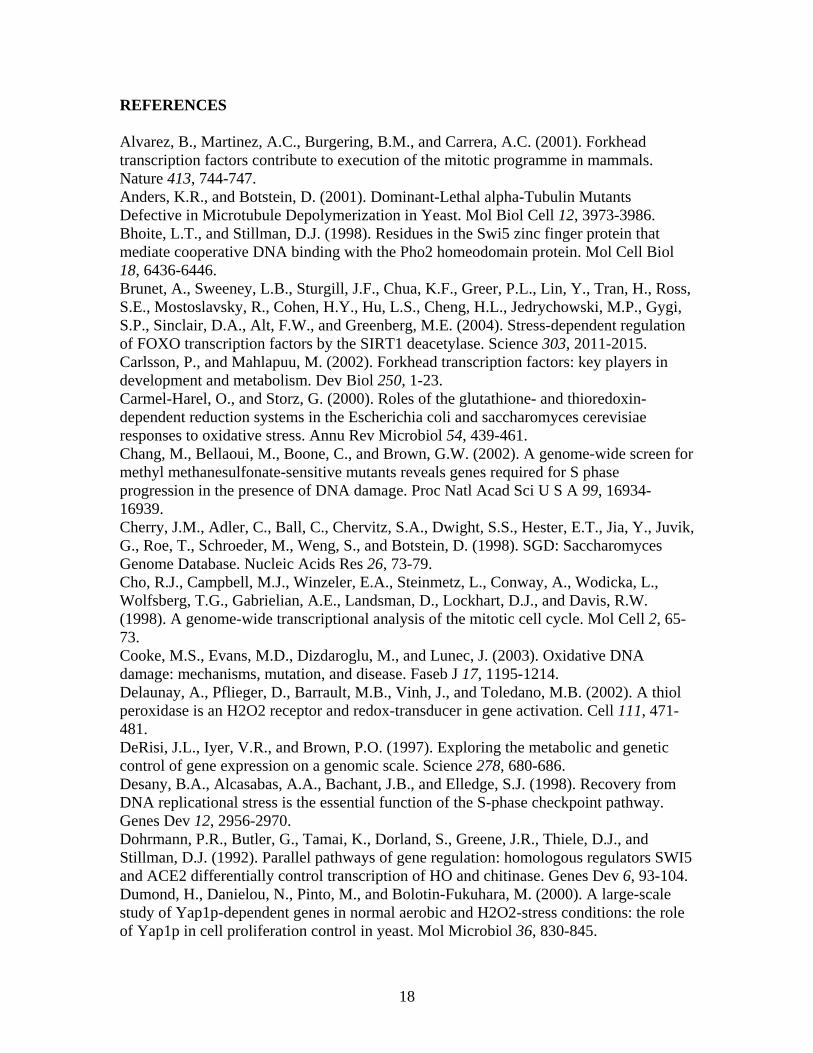
When synchronized cells were exposed to MD, a different result was obtained. Figure 2A shows just the unbudded (G1) cell counts for a time-series of exposures beginning at 25, 40, 60 and 70 minutes after release from G1 arrest. It is clear from these results, as well as from DNA content measurements (Figure 2B), that in all of these cases MD induced a G1 arrest in the next cell cycle, regardless of the timing of its addition relative to the S phase. The oxidative stress response cluster
To study the transcriptional responses underlying the cell cycle effects of HP and MD, we used DNA microarrays to follow changes in abundance of mRNAs for all the yeast genes. We performed duplicate time courses in which HP or MD were added at 25 minutes after release from G1 (i.e. before the completion of S phase) as above. Figure 4 shows the robust oxidative stress response (Gasch et al., 2000) for each of the

7
experiments; no major difference between HP and MD was observed in this respect. The figure is the result of clustering of data for the 4,772 genes that passed quality filters—only the stress response clusters (459 induced genes and 664 repressed genes) are shown (see Web supplement Figure ii for the entire data set). We searched these clusters for enriched GO process annotations using the GO-term finder program as described in Materials and Methods. We found, for both HP and MD, the major features previously reported (e.g. induction of antioxidants and heat shock proteins and repression of the translation apparatus; Gasch et al., 2000). We did not observe enrichment, under any type of oxidative stress, for genes involved in DNA repair or DNA metabolism, although DNA damage is believed to play a significant role in the deleterious effects of oxidative stress (Shackelford et al., 2000; Cooke et al., 2003); only a few DNA repair genes were significantly induced, namely DDR48, CAC2 and MAG1. This is in agreement with previous studies of DNA damage responses in yeast showing a relatively minor transcriptional component (Gasch et al., 2001; Chang et al., 2002). Differential cell cycle transcriptional effects of HP and MD
In the absence of striking differences in the massive transcriptional oxidative stress responses to HP and MD, we looked specifically for differences in cell-cycle-related transcription. To this end, we examined the expression of 674 genes with good data out of ca. 800 genes previously shown to be cell cycle regulated (Spellman et al., 1998). Following the initiation of treatment, most of these transcripts appeared to be plainly misregulated, showing basal level transcription, or fluctuations, rather than a clear periodic pattern (Figure 5). This is in contrast to a possible scenario in which HP-treated cells present an accumulation of S or G2 transcripts and MD-treated cells present accumulation of G1 transcripts. Not all cell cycle expression was halted. Smaller, sometimes delayed, peaks were apparent under MD exposure for S/G2, G2/M, M/G1 and G1 genes (Figure 5 and Figure 6). In addition, for all gene groups, small clusters existed that responded to the stress signal (indicated with arrowheads in Figure 5). Figure 6 plots the average gene expression for the principal cell cycle subclusters (indicated with arrows in Figure 5). The G2/M cluster was composed of 13 genes which included the two mitotic cyclin genes, CLB1 and CLB2, and the gene encoding the Swi5p transcription factor (Fig. 6A). The M/G1 cluster was composed of 18 genes including the Pho85 cyclin gene PCL9, the gene for the cyclin dependent kinase inhibitor Sic1p, and several genes important for cell wall organization and cytokinesis (Fig. 6B). The G1 cluster consisted of 8 genes that included cytokinesis and cell wall organization genes. This latter group of genes showed expression patterns that greatly resembled those of the M/G1 cluster, with genes known to perform functions similar to the M/G1 genes, together suggesting that the two clusters are actually one (Fig. 6B and C). A full depiction of subclusters, gene lists and enriched promoter binding motifs is presented in Web supplement Figure iii and its accompanying Table i.

8
The residual cell cycle clusters that maintained periodic expression under MD (but not HP) treatment included many genes previously associated with regulation by the yeast forkhead homologs Fkh1p and Fkh2p (Zhu et al., 2000); see also Web supplement Figure iv). The G2/M cluster corresponds to the Clb1 cluster, which is directly regulated by these proteins, whereas the M/G1 and G1 clusters correspond to the Sic1 cluster, which is regulated by a member of the Clb1 cluster, encoding the Swi5p transcription factor. To exhaustively identify similarly regulated genes, we sorted all the genes by Pearson correlation with the values for either CLB1 or PIR1, genes which are at the heart of the G2/M and M/G1 clusters. This resulted in the identification of 2 additional genes in the G2/M cluster, not reported in Zhu et al., encoding a putative integral membrane protein, Sur7p, and an RNA-binding and localizing protein, Hek2p, suggesting that they may have roles in cell cycle FKH-regulated processes. HEK2 was previously reported as FKH-regulated (Pic et al., 2000). Further examination of the G1 cluster in Figure 6 similarly implicated a few additional genes: GIC2, encoding a small GTPase interacting protein which localizes to the incipient bud site, RME1, encoding a transcription regulator that is regulated by Swi5p (Frenz et al., 2001), SHQ1, a gene important for small nucleolar ribonucleoprotein particles stability, and YJL217W, encoding a hypothetical protein.
We also studied the upstream sequences of all the implicated genes for enriched motifs (Table II), and found several associated with forkhead-protein-regulated transcription. Notable among these are the Mcm1p binding site in promoters of genes of the G2/M cluster and the Swi5p binding site in promoters of genes of the M/G1 and G1 clusters. Mcm1p is part of the active complex that includes Fkh2p, and Swi5p is the actual target of this complex and the regulator of the M/G1 cluster members. Fkh1p is not as likely as Fkh2p to be implicated in the difference between HP and MD response, because, as shown in Table II, the majority of promoters of genes in the G2/M cluster (40-60%) were previously shown to be bound by components of the Mcm1p-Fkh2p-Ndd1p complex whereas only 23% were shown to be bound by Fkh1p (Simon et al., 2001). The promoter binding data presented in Table II fortifies the connection between the forkhead homologs, particularly Fkh2p (as part of the Mcm1p-Fkh2p-Ndd1p complex), and residual cell-cycle-regulated gene expression. Testing the Role of Forkhead homologs after MD exposure.
The experiments and analysis described above implicate the Mcm1p-Fkh2p-Ndd1p complex in maintaining the ability to continue the cell cycle after introduction of MD and the expression of a full-blown oxidative stress response. The experiments also raise the possibility that this function of the complex is inhibited in HP-treated cells. We reasoned that Mcm1p is probably not affected by HP, since several genes of the pheromone pathway, which are known to be regulated by this protein alone, i.e. MFA2, AGA1, AGA2 (Simon et al., 2001), were properly regulated in both MD and HP treated cells (see web supplement). This suggested that it is the activity of the assembled complex that may be affected by HP.
9
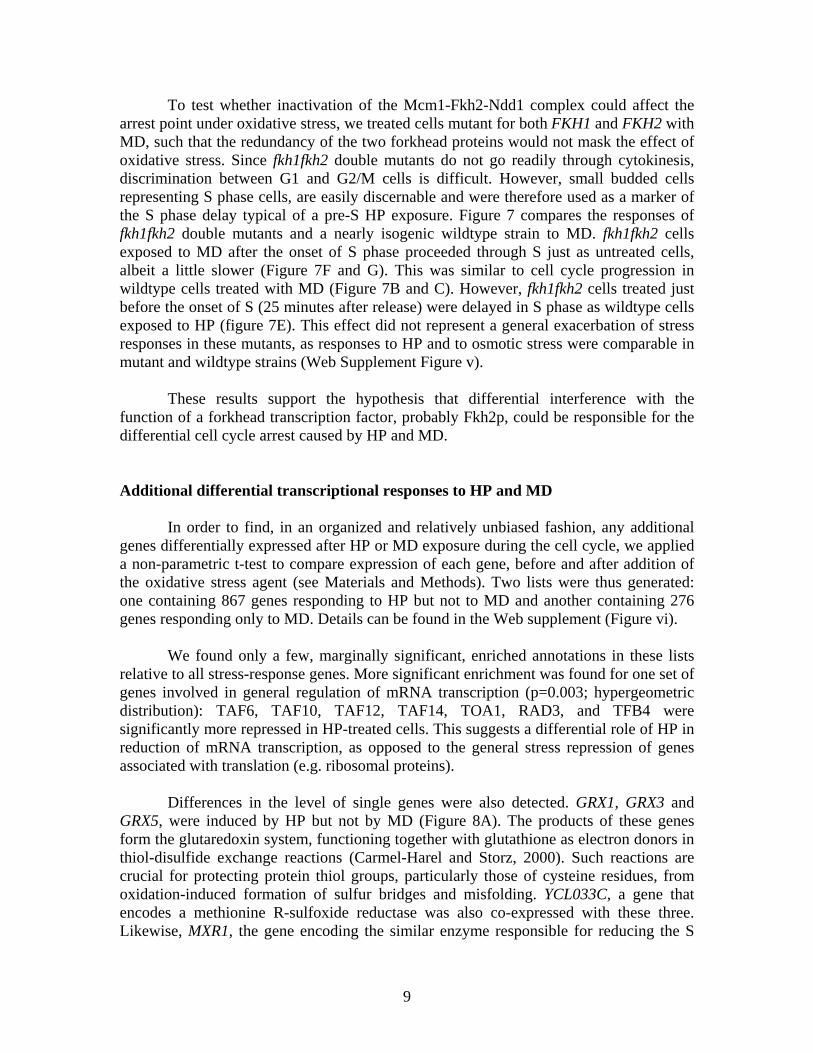
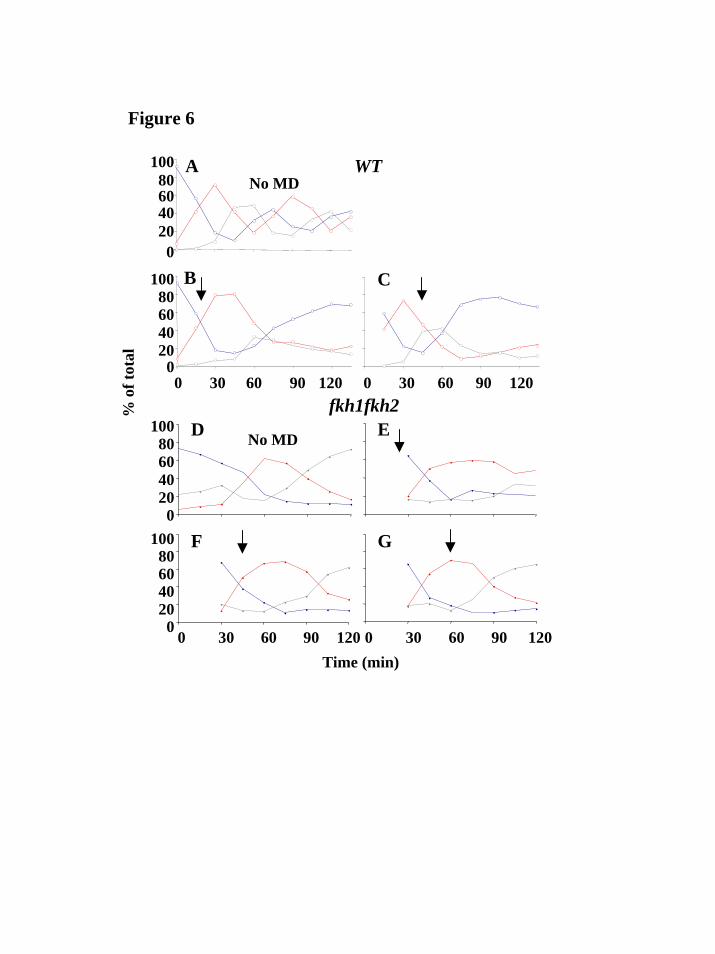
To test whether inactivation of the Mcm1-Fkh2-Ndd1 complex could affect the arrest point under oxidative stress, we treated cells mutant for both FKH1 and FKH2 with MD, such that the redundancy of the two forkhead proteins would not mask the effect of oxidative stress. Since fkh1fkh2 double mutants do not go readily through cytokinesis, discrimination between G1 and G2/M cells is difficult. However, small budded cells representing S phase cells, are easily discernable and were therefore used as a marker of the S phase delay typical of a pre-S HP exposure. Figure 7 compares the responses of fkh1fkh2 double mutants and a nearly isogenic wildtype strain to MD. fkh1fkh2 cells exposed to MD after the onset of S phase proceeded through S just as untreated cells, albeit a little slower (Figure 7F and G). This was similar to cell cycle progression in wildtype cells treated with MD (Figure 7B and C). However, fkh1fkh2 cells treated just before the onset of S (25 minutes after release) were delayed in S phase as wildtype cells exposed to HP (figure 7E). This effect did not represent a general exacerbation of stress responses in these mutants, as responses to HP and to osmotic stress were comparable in mutant and wildtype strains (Web Supplement Figure v).
These results support the hypothesis that differential interference with the function of a forkhead transcription factor, probably Fkh2p, could be responsible for the differential cell cycle arrest caused by HP and MD.
Additional differential transcriptional responses to HP and MD
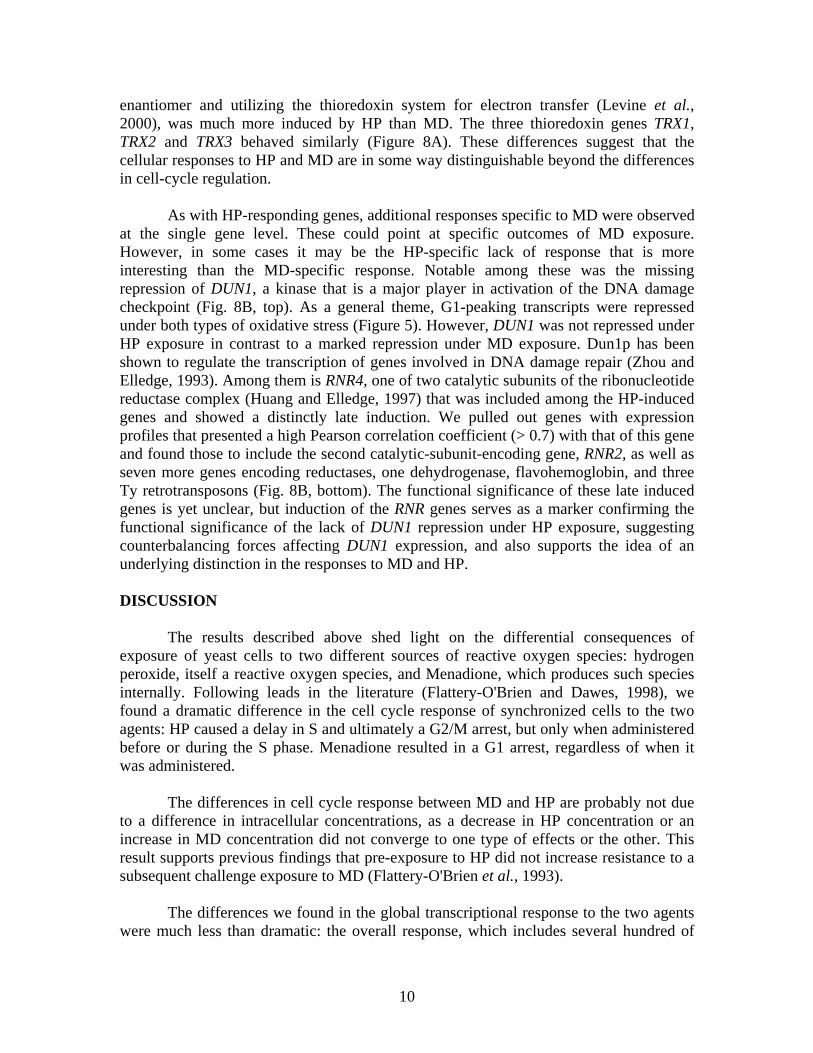
In order to find, in an organized and relatively unbiased fashion, any additional genes differentially expressed after HP or MD exposure during the cell cycle, we applied a non-parametric t-test to compare expression of each gene, before and after addition of the oxidative stress agent (see Materials and Methods). Two lists were thus generated: one containing 867 genes responding to HP but not to MD and another containing 276 genes responding only to MD. Details can be found in the Web supplement (Figure vi).
We found only a few, marginally significant, enriched annotations in these lists relative to all stress-response genes. More significant enrichment was found for one set of genes involved in general regulation of mRNA transcription (p=0.003; hypergeometric distribution): TAF6, TAF10, TAF12, TAF14, TOA1, RAD3, and TFB4 were significantly more repressed in HP-treated cells. This suggests a differential role of HP in reduction of mRNA transcription, as opposed to the general stress repression of genes associated with translation (e.g. ribosomal proteins). Differences in the level of single genes were also detected. GRX1, GRX3 and GRX5, were induced by HP but not by MD (Figure 8A). The products of these genes form the glutaredoxin system, functioning together with glutathione as electron donors in thiol-disulfide exchange reactions (Carmel-Harel and Storz, 2000). Such reactions are crucial for protecting protein thiol groups, particularly those of cysteine residues, from oxidation-induced formation of sulfur bridges and misfolding. YCL033C, a gene that encodes a methionine R-sulfoxide reductase was also co-expressed with these three. Likewise, MXR1, the gene encoding the similar enzyme responsible for reducing the S
10
enantiomer and utilizing the thioredoxin system for electron transfer (Levine et al., 2000), was much more induced by HP than MD. The three thioredoxin genes TRX1, TRX2 and TRX3 behaved similarly (Figure 8A). These differences suggest that the cellular responses to HP and MD are in some way distinguishable beyond the differences in cell-cycle regulation.
As with HP-responding genes, additional responses specific to MD were observed at the single gene level. These could point at specific outcomes of MD exposure. However, in some cases it may be the HP-specific lack of response that is more interesting than the MD-specific response. Notable among these was the missing repression of DUN1, a kinase that is a major player in activation of the DNA damage checkpoint (Fig. 8B, top). As a general theme, G1-peaking transcripts were repressed under both types of oxidative stress (Figure 5). However, DUN1 was not repressed under HP exposure in contrast to a marked repression under MD exposure. Dun1p has been shown to regulate the transcription of genes involved in DNA damage repair (Zhou and Elledge, 1993). Among them is RNR4, one of two catalytic subunits of the ribonucleotide reductase complex (Huang and Elledge, 1997) that was included among the HP-induced genes and showed a distinctly late induction. We pulled out genes with expression profiles that presented a high Pearson correlation coefficient (> 0.7) with that of this gene and found those to include the second catalytic-subunit-encoding gene, RNR2, as well as seven more genes encoding reductases, one dehydrogenase, flavohemoglobin, and three Ty retrotransposons (Fig. 8B, bottom). The functional significance of these late induced genes is yet unclear, but induction of the RNR genes serves as a marker confirming the functional significance of the lack of DUN1 repression under HP exposure, suggesting counterbalancing forces affecting DUN1 expression, and also supports the idea of an underlying distinction in the responses to MD and HP. DISCUSSION
The results described above shed light on the differential consequences of exposure of yeast cells to two different sources of reactive oxygen species: hydrogen peroxide, itself a reactive oxygen species, and Menadione, which produces such species internally. Following leads in the literature (Flattery-O'Brien and Dawes, 1998), we found a dramatic difference in the cell cycle response of synchronized cells to the two agents: HP caused a delay in S and ultimately a G2/M arrest, but only when administered before or during the S phase. Menadione resulted in a G1 arrest, regardless of when it was administered.
The differences in cell cycle response between MD and HP are probably not due to a difference in intracellular concentrations, as a decrease in HP concentration or an increase in MD concentration did not converge to one type of effects or the other. This result supports previous findings that pre-exposure to HP did not increase resistance to a subsequent challenge exposure to MD (Flattery-O'Brien et al., 1993).
The differences we found in the global transcriptional response to the two agents were much less than dramatic: the overall response, which includes several hundred of

11
genes whose expression is increased and several hundreds of genes whose expression is decreased is grossly similar, as was previously observed (Gasch et al., 2000). Additional, less conspicuous, agent-specific transcriptional responses also exist, but mostly fail to reveal underlying functional differences.
Several approaches to a more detailed analysis did reveal some differences, the major one of which is that MD treatment does not cause complete misregulation of cell-cycle-regulated transcription, whereas HP treatment causes an almost complete loss of the periodic transcription patterns reported previously (Cho et al., 1998; Spellman et al., 1998). Specifically, two small gene clusters, which are essential for cell cycle progression through G2 and M (Fitch et al., 1992; Toyn et al., 1997), maintain normal transcription patterns under MD treatment but not HP.
We were able to trace this difference to the activity of the yeast forkhead homologues by noting first that the forkhead transcription signature reported by Zhu et al. corresponded with the residual periodic transcription pattern left after MD treatment. This suggests that forkhead-protein-associated transcription is responsible for driving MD treated cells through G2 and M. Supporting this hypothesis, we observed that fkh1fkh2 double mutants, when treated with MD, now altered the cell cycle similar to wild type HP-treated cells. Specifically, when MD was applied early in S, cells delayed considerably as small-budded cells, whereas when MD was applied later, cells progressed to become large-budded cells. This mimicked the arrest phenotype of HP-treated cells both with regards to the initial arrest point as well as to the timing requirements of the treatment.
Based on motif analysis and promoter binding data (Simon et al., 2001), it is likely that Fkh2p is the key player in regulating the misregulated genes rather than Fkh1p. Mcm1p and Fkh2p cooperatively bind the promoters of target genes, and subsequently recruit Ndd1p (Koranda et al., 2000; Hollenhorst et al., 2001). We were able to rule out inactivation of Mcm1p by HP, as the expression of several M/G1 genes, which are known targets of Mcm1p alone, showed normal expression. This suggests that HP specifically affects gene regulation associated with the assembled complex.
One feature which we could not fully explore, because of loss of synchrony over time, is the behavior of HP-treated wild type cells (or MD-treated fkh1fkh2 double-mutants) in the subsequent cell cycles. We have preliminary indications that the arrest, in these cases, will be in the next G2/M, as opposed to the next G1 (Figure 1; see also Web supplement Figure vii, which shows morphological details of arrested cells). This is consistent with the idea that it is an S phase function that is lost in HP- but not MD-treated cells and causes the G2/M arrest.
The putative S phase function could be the assembly of the Mcm1p-Fkh2p-Ndd1p complex subunits on promoters of target genes. This assembly is completed during S phase (Koranda et al., 2000; Simon et al., 2001). We have shown that misregulation of the complex target genes is correlated with the arrest of HP-treated cells first in S, and later in G2/M. We further showed that inactivation of this complex by forkhead gene

12
disruption is sufficient to change the cell cycle arrest in MD cells from G1 to the S phase arrest observed normally in HP-treated cells. Altogether, this evidence suggest that Mcm1p-Fkh2p-Ndd1p complex inactivation may occur during treatment with HP, and could play a causative role in the cell cycle arrest, possibly together with other factors.
It was previously reported that the DNA damage checkpoint protein Rad9p contributes to a G2/M arrest in response to HP treatment (Flattery-O'Brien and Dawes, 1998). However, this does not explain the S phase delay we observe after HP treatment. Another mechanism which was found by others to be activated by HP might be more relevant to the cell cycle arrest phenotype we observe. Transcriptional activation of the RNR genes, which are responsible for the rate limiting step of dNTP and DNA synthesis (Huang and Elledge, 1997), and induction of the MAG1 gene, which encodes a DNA dealkylating enzyme, are markers of the activation of the DNA replication checkpoint (Zhu and Xiao, 2001). This pathway senses blocks in DNA replication and transmits the signal through Mec1p, Rad53p and Dun1p, delaying mitotic entry (Weinert et al., 1994; Navas et al., 1995; Paulovich and Hartwell, 1995; Desany et al., 1998). The occurrence of RNR and MAG1 gene activation that we observe following exposure to HP, and the dependence of the cell cycle arrest in treatment initiation before S suggests that activation of the replication checkpoint is among the first events occurring during HP-induced oxidative stress and may be responsible for inactivating forkhead-associated transcription. Two lines of evidence support this hypothesis: first, Rad53p phosphorylation was shown to be induced following exposure to HP during S, but not after, and to lead to an S phase delay (Leroy et al., 2001); second, ionizing radiation was shown to cause a G2/M arrest accompanied by repression of forkhead-associated transcription in wildtype cells, but not in MEC1 mutants (Gasch et al., 2001).
How might HP lead to different cell cycle effects than MD? One possibility,
discussed above, relates HP exposure to interference with DNA replication. Other possibilities, perhaps related, are suggested by the remarkably few individual genes that are differentially expressed after treatment with the two oxidative stress agents and represent functional categories which are distinct between MD and HP. Several of these are known as important for protecting cells from oxidation of thiol groups and generation of aberrant disulfide bonds (e.g. GRX1, GRX4, GRX5, TRX1, TRX2, TRX3, MXR1 and YCL033C). There is ample precedent in the literature pointing to protein modification by thiol group oxidation as a specific outcome of HP exposure (reviewed in (Rhee et al., 2000). Both HP and superoxide ions can potently modify thiol groups in various molecules in vitro. However, HP is able to directly react with glutathione, unlike superoxide ions, thus potentially perturbing this important antioxidant system and affecting its protective capacities (Winterbourn and Metodiewa, 1999). Some of the genes shown in our study to be induced by HP were identified in previous studies as well. Such was the glutaredoxin-encoding GRX1 gene that was reported to respond primarily to HP (Grant et al., 2000). In addition, YCL033C, which encodes a methionine R-sulfoxide reductase, and is co-expressed with GRX1, was previously reported to protect cells from oxidative protein damage, specifically that caused by HP (Kryukov et al., 2002). Together with GRX3 and GRX5, these genes define a small HP-specific regulon.

13
It therefore is tempting to speculate that HP might cause a distinct cell cycle arrest due to its ability to modify protein cysteines or methionines. There is evidence in the literature for such regulatory modifications caused by HP. In E. coli, the mechanism by which HP exposure causes induction of the HP-regulon is through the formation of an intramolecular disulfide bond within the product of the oxyR gene, which converts it to a transcriptional activator (Zheng et al., 1998). In yeast, the transcriptional regulator Yap1p is modified by the glutathione peroxidase-like enzyme Gpx3p in response to HP exposure (Delaunay et al., 2002). Functional conservation of forkhead protein roles in oxidative stress responses in yeast and mammals In mammals, members of the FOXO protein subfamily, are the orthologs of C. elegans Daf-16 longevity transcription factor (Lin et al., 1997; Ogg et al., 1997). Both Daf-16 and the FOXO proteins are known to protect cells from oxidative stress (Kops et al., 2002; Nemoto and Finkel, 2002; Murphy et al., 2003). Their mode of response to oxidative stress, however, is still unclear. Reports exist showing both that HP decreases nuclear localization of FOXO proteins (Nemoto and Finkel, 2002), or increases it (Brunet et al., 2004). Similarly, the effects of FOXO proteins on cell cycle progression are conflicting. Whereas most reports suggest that active FOXO proteins cause a cell cycle arrest (either a G1 arrest (Medema et al., 2000) or a G2/M arrest (Furukawa-Hibi et al., 2002; Tran et al., 2002)), one study showed that an active FOXO protein actually facilitates the M/G1 transition (Alvarez et al., 2001). For another forkhead protein, FOXM1b, such a cell cycle promoting affect is the accepted mode of action (Wang et al., 2002). The apparent involvement of yeast Fkh2p in cell cycle regulation and in responses to oxidative stress presents a striking similarity to combined properties of mammalian forkhead proteins and suggests functional conservation. This presents opportunities for further study of this involvement, which might shed light on the conserved functions of forkhead proteins in higher organisms and vice versa. Regulatory mechanisms, or even structural features of the proteins relevant to oxidative stress might be conserved as well.
The results presented in this paper allow for a better understanding of the varied effects of oxidative stress. We have provided evidence suggesting that the Mcm1p-Fkh2p-Ndd1p G2/M transcriptional complex is involved in mediating the effects of oxidative stress on the yeast cell cycle. Unraveling this mechanism expands the known conservation in the cellular responses toward oxidative stress, and the roles of forkhead proteins in them, from C. elegans to S. cerevisiae. ACKNOWLEDGMENTS
We thank Katja Schwartz and Kirk Anders for supplying several of the strains used in this study; we also thank Alok Saldanha, Michal Ronen and Anne Brunet for critical reviewing of the manuscript. We thank Man-Wah Tan for his hospitality and help during the preparation of the manuscript. M.S. and D.B. were supported by NIH
14
(GM46406). M.S was also supported by the Stanford University School of Medicine Dean’s Fellowship. E.S. was supported by a Stanford Graduate Fellowship (SGF). FIGURES Figure 1. Hydrogen peroxide induces a biphasic cell cycle arrest. A, C, Shown are cell cycle time courses with percentages of G1 cells (blue line), S phase cells (red line) and G2/M cells (grey line), out of the total number of cells counted. Synchronized cultures of DBY8724 were released from G1-arrest at time 0 and subsequently treated with HP for the time designated by a horizontal line (25 minutes after release to 135 minutes in A; 58-165 in C). B, D, FACS analysis using the DNA-binding dye propidium iodide to measure DNA content (designated as N for haploid, pre-replication, DNA content or 2N for diploid DNA content). Cell samples were taken from the same time courses shown in Fig. 1A and C. Side bars designate incubation times with HP. Figure 2. Menadione induces a G1 arrest independent of time of addition. A, Shown are results from 4 time courses showing percentages of G1 cells out of all counted cells per time point. MD was added at time points designated with arrows following release from a G1 arrest: red line, 25 minutes after release; black line, 40 minutes; green line, 60 minutes; blue line, 70 minutes. B, FACS analysis using propidium iodide to measure DNA content of cell samples from a time course in which MD was added 25 minutes after release from a G1 arrest. Side bar designates the incubation time with MD. Figure 3. The oxidative stress cluster. Top, cell cycle progression of treated cultures used for expression analyses. Shown are percentages of G1 (blue), S (red) and G2/M (grey) cells out of the total counted. Bottom, overview of the shared oxidative stress transcriptional response. Genes included (see Web supplement) are those chosen based on hierarchical clustering and visual inspection of the entire filtered data set, that respond both to MD and to HP. For each gene in each time course, separately, expression values were median-centered to bring out the expression patterns and to assist visual comparison between different time courses in which different reference mRNA batches were used. HP1 is the same time-course experiment presented in Fig. 1A. The color scale used to represent variations in transcript abundance is shown in the key at the bottom of the figure. Grey represents missing values. Figure 4. Cell cycle transcription is mostly misregulated under both types of oxidative stress. Shown is an overview of cell cycle regulated transcription during both types of oxidative stress (4 leftmost time courses), as well as under normal conditions (rightmost time course; Spellman et al., 1998). Genes are grouped according to cell phase in which their transcription peaks (shown on the left) and clustered separately in each of these groups. The corresponding physiological time courses are presented on top. Arrowheads designate stress response subclusters. Arrows designate subclusters which maintained periodic transcription under MD exposure. The color scale used to represent variations in transcript abundance is shown in the key at the bottom of the figure. Grey represents missing values.

15
Figure 5. Minimal Gene clusters continue cycling under MD exposure but not under HP exposure. Shown are average expression time courses for small clusters of genes presenting a close to normal expression patterns under MD treatment, but not HP. Black lines represent normal cell cycle expression (Spellman et al., 1998); red and magenta lines, HP1 and HP2 time courses, respectively; blue and light blue lines, MD1 and MD2 time courses, respectively. A, G2/M cluster, comprised of SUR7, BUD3, YOR315W, ALK1, HST3, SWI5, CLB1, CLB2, YNL058C, YNL057W, IQG1, CHS2, SRC1 and HEK2; B, M/G1 cluster, SIC1, YNL046W, CYK3, YLR194C, ASH1, AMN1, NIS1, TEC1, DSE4 , YPL158C, PCL9, DSE3, EGT2, PST1, PIR3, PIR1, HSP150 and GPA1; C, G1 cluster, YJL217W, GIC2, SHQ1, DSE2, DSE1, SCW11, CTS1, RME1. Figure 6. MD mimics HP-induced S phase arrest in fkh1fkh2 double mutants. Shown are cell cycle time courses, with percentages of G1 cells (blue line), S phase cells (red line) and G2/M cells (grey line), out of the total number of cells counted, of the nearly isogenic strains DBY8781 (wildtype; open circles) and DBY8834 (fkh1fkh2bar1). The only non-fkh difference in these strains (bar1) required the use of different concentrations of alpha factor for synchronization (see Materials and Methods). Cultures synchronized at G1 were divided into equal volumes, released from arrest at time zero, and treated with 2 mM MD at times designated with arrows. Wildtype cells were either not treated with MD (A), or exposed to MD starting at 21 minutes after release (prior to completion of S phase; B); or starting at 45 minutes after release (at the end of S phase; C). fkh1fkh2 cells were either not treated (D), treated prior to initiation of S phase (25 minutes after release; E), or treated after initiation of S phase, starting at 40 minutes (F) or 60 minutes (G) after release. Figure 7. Single gene differences between HP and MD responses. A, HP-specific induction of thiol protein reduction systems. Expression profiles of genes involved in thiol-disulfide exchange reactions. Horizontal lines represent times of exposures to HP (red and magenta lines) and MD (blue and light blue lines). B, Differential expression of DUN1 and its targets. Expression profiles of DUN1 (top) and its targets (bottom) during HP and MD time courses. HP1 and HP2 are designated with red and magenta lines, respectively; MD1 and MD2 are designated with blue and light blue lines, respectively. The color scale used to represent variations in transcript abundance is shown in the key at the bottom of the figure. Grey represents missing values. SUPPLEMENTARY FIGURES Figure i. Culture synchronization with α factor. Shown are typical cell cycle time courses with percentages of G1 cells (blue lines), S phase cells (red lines) and G2/M cells (grey lines), out of the total number of cells counted. Cultures were synchronized by a 90-minute incubation with 7 nM (DBY8724; A), or 0.8 µM (DBY8781; B) α factor. Both strains show comparable synchronization, regardless of their genetic background (S288C for A, W303 for B), and whether they posses an intact copy of the BAR1 gene which encodes an α factor-hydrolyzing enzyme (B), or not (A). In both cases, synchronization starts weakening after the first cell cycle.

16
Figure ii. Hierarchical clustering of the entire gene expression data set. Top, cell cycle progression of treated cultures used for expression analyses. Shown are percentages of G1 (blue), S (red) and G2/M (grey) cells out of the total counted. Bottom, overview of the entire data set (4772 genes) following hierarchical clustering. The color scale used to represent variations in transcript abundance is shown in the key at the bottom of the figure. Figure iii. Cell cycle regulons fragment under oxidative stress, resulting in smaller regulatory modules which either continue cycling or respond to stress. Shown are average expression time courses of genes which are normally cell cycle regulated and either maintain some degree of cell cycle regulation (two left columns), or respond to oxidative stress (two right columns). Cell cycle phase in which these transcripts normally peak is designated. Black lines represent normal cell cycle expression (Spellman et al., 1998); red and magenta lines, HP1 and HP2 time courses, respectively; blue and light blue lines, MD1 and MD2 time courses, respectively. Genes included in each of the clusters are shown in Web Supplement Table i. For each cluster, all genes were used to obtain the averaged expression pattern. Figure iv. Cell cycle and oxidative stress expression patterns of the full Clb1 and Sic1 clusters. Top, Cell cycle progression of treated cultures used for expression analyses. Shown are percentages of G1 (blue), S (red) and G2/M (grey) cells out of the total counted. Bottom, Expression profiles of genes of the previously reported Clb1 and Sic1 clusters (Zhu et al., 2000) under oxidative stress (four left time courses) and normal conditions (rightmost time course; Spellman et al., 1998). The color scale used to represent variations in transcript abundance is shown in the key at the bottom of the figure. Grey represents missing values. Members of the Clb1 cluster correspond to the G2/M cluster described in this paper; members of the Sic1 cluster correspond to the M/G1 and G1 clusters. A blue bar represents a group of genes which presented a delayed induction in MD-treated cells, as well as a response in one of the HP time courses, suggesting that it may be regulated by a mechanism distinct from other Clb1 cluster members. More of these genes are bound by Ace2p than by Swi5p (Simon et al., 2001), suggesting that Ace2p may carry out cell cycle regulatory tasks that are slightly different from those of Swi5p. Figure v. fkh1fkh2 and isogenic wildtype cells show similar responses to HP and osmotic stress. A,B,D,E, Time course experiments of cell cycle progression in synchronized cultures of strains DBY8781 (wildtype; A and D) and DBY8834 (fkh1fkh2 double mutants; B and E). Cultures synchronized at G1 were divided into equal volumes, released from arrest at time zero, and treated with the designated treatments starting at the time points indicated by arrows. A, B, HP treatment before completion of S phase (25 and 38 minutes after release, respectively; following addition, HP concentration was not monitored). D, E, Mild osmotic stress starting before completion of S phase (25 minutes after release). Note the lack of S phase delay in fkh1fkh2 cells, which progressed in the cell cycle essentially as did wildtype cells. A moderate osmotic stress (0.7 M NaCl), caused an immediate growth arrest in both wildtype and mutant strain cultures (our unpublished results). Shown are percentages of G1 cells (blue lines), S phase cells (red
17
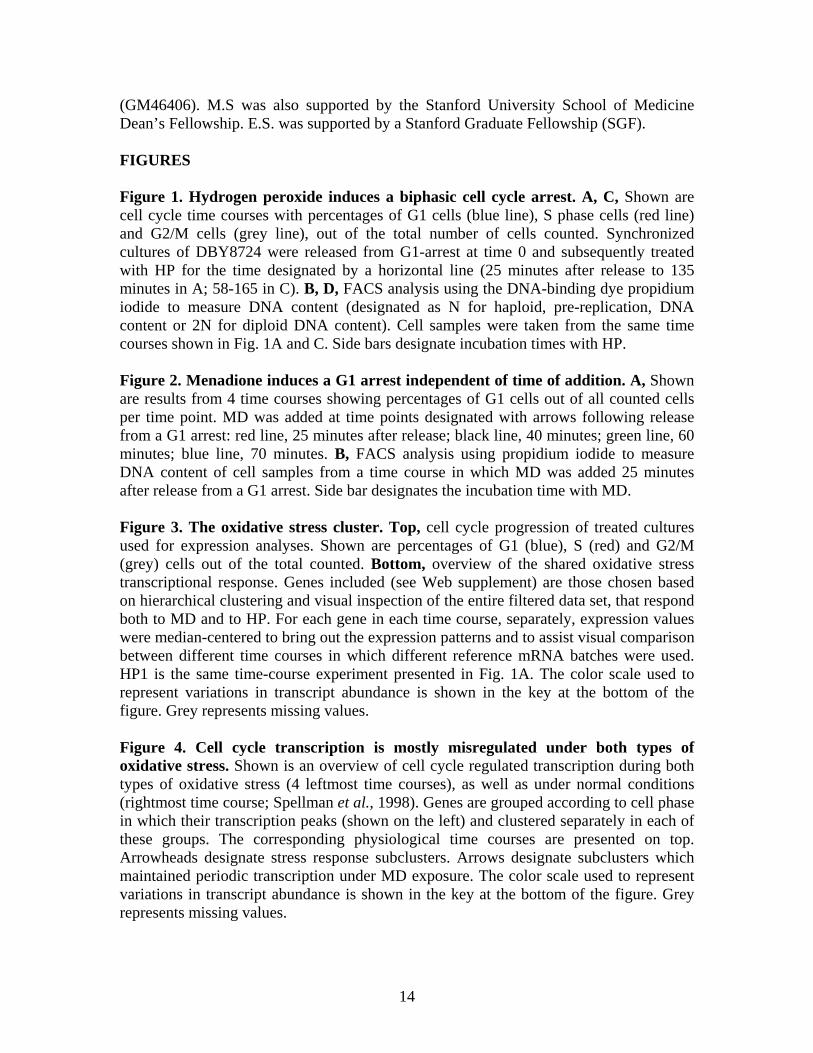
lines) and G2/M cells (grey lines) out of the total number of cells counted. C, Cell viability under exposure to HP. Exponentially growing cultures were exposed to 2.4 mM HP for 1 hour (or left untreated), serially diluted (1:10) and spotted onto a YPD plate. Strains shown (top to bottom) are DBY8781 and DBY8834. Note that fkh1fkh2 cells (strain DBY8834) are not more sensitive to HP than the isogenic wildtype strain (DBY8781). Figure vi. Differential transcriptional responses to HP and MD. Overview of genes differentially responding to HP and MD. A, genes that respond to HP but not to MD; 414 were induced and 453 repressed. B, genes that respond to MD but not to HP; 98 were induced and 178 were repressed. Time course experiments are marked with red lines for MD, or with blue lines for HP. Genes are hierachically clustered. The color scale used to represent variations in transcript abundance is shown in the key at the bottom of the figure. Grey represents missing values. Data files used to create this figure are found in the web supplement. Figure vii. HP-treated cells arrest eventually around metaphase. Shown are fluorescence or light microscopy images of DBY9997 cells (expressing a GFP-Tubulin1 fusion protein) treated with HP, as in Fig. 1A, 240 minutes after release from a G1-arrest. A, Differential interference contrast images; B, DNA staining; C, GFP-tubulin1, localized to mitotic spindles; D, Actin labeling. Arrowhead designate affected cells. These analyses showed that the majority of HP-arrested large-budded cells (70%) had nuclei localized at the bud neck, short mitotic spindles, and lacked the contractile actomyosin ring characteristic of mitosis exit (Lee et al., 2001), suggesting that these cells are arrested near or at metaphase. In cells treated with HP after completion of S (Fig. 1C), no arrest was observed at the first cell cycle. However, DNA staining followed by a microscope analysis showed that 67% of large-budded cells in late time points were affected, suggesting that these cells arrested around the next metaphase.
18
REFERENCES Alvarez, B., Martinez, A.C., Burgering, B.M., and Carrera, A.C. (2001). Forkhead transcription factors contribute to execution of the mitotic programme in mammals. Nature 413, 744-747. Anders, K.R., and Botstein, D. (2001). Dominant-Lethal alpha-Tubulin Mutants Defective in Microtubule Depolymerization in Yeast. Mol Biol Cell 12, 3973-3986. Bhoite, L.T., and Stillman, D.J. (1998). Residues in the Swi5 zinc finger protein that mediate cooperative DNA binding with the Pho2 homeodomain protein. Mol Cell Biol 18, 6436-6446. Brunet, A., Sweeney, L.B., Sturgill, J.F., Chua, K.F., Greer, P.L., Lin, Y., Tran, H., Ross, S.E., Mostoslavsky, R., Cohen, H.Y., Hu, L.S., Cheng, H.L., Jedrychowski, M.P., Gygi, S.P., Sinclair, D.A., Alt, F.W., and Greenberg, M.E. (2004). Stress-dependent regulation of FOXO transcription factors by the SIRT1 deacetylase. Science 303, 2011-2015. Carlsson, P., and Mahlapuu, M. (2002). Forkhead transcription factors: key players in development and metabolism. Dev Biol 250, 1-23. Carmel-Harel, O., and Storz, G. (2000). Roles of the glutathione- and thioredoxin-dependent reduction systems in the Escherichia coli and saccharomyces cerevisiae responses to oxidative stress. Annu Rev Microbiol 54, 439-461. Chang, M., Bellaoui, M., Boone, C., and Brown, G.W. (2002). A genome-wide screen for methyl methanesulfonate-sensitive mutants reveals genes required for S phase progression in the presence of DNA damage. Proc Natl Acad Sci U S A 99, 16934-16939. Cherry, J.M., Adler, C., Ball, C., Chervitz, S.A., Dwight, S.S., Hester, E.T., Jia, Y., Juvik, G., Roe, T., Schroeder, M., Weng, S., and Botstein, D. (1998). SGD: Saccharomyces Genome Database. Nucleic Acids Res 26, 73-79. Cho, R.J., Campbell, M.J., Winzeler, E.A., Steinmetz, L., Conway, A., Wodicka, L., Wolfsberg, T.G., Gabrielian, A.E., Landsman, D., Lockhart, D.J., and Davis, R.W. (1998). A genome-wide transcriptional analysis of the mitotic cell cycle. Mol Cell 2, 65-73. Cooke, M.S., Evans, M.D., Dizdaroglu, M., and Lunec, J. (2003). Oxidative DNA damage: mechanisms, mutation, and disease. Faseb J 17, 1195-1214. Delaunay, A., Pflieger, D., Barrault, M.B., Vinh, J., and Toledano, M.B. (2002). A thiol peroxidase is an H2O2 receptor and redox-transducer in gene activation. Cell 111, 471-481. DeRisi, J.L., Iyer, V.R., and Brown, P.O. (1997). Exploring the metabolic and genetic control of gene expression on a genomic scale. Science 278, 680-686. Desany, B.A., Alcasabas, A.A., Bachant, J.B., and Elledge, S.J. (1998). Recovery from DNA replicational stress is the essential function of the S-phase checkpoint pathway. Genes Dev 12, 2956-2970. Dohrmann, P.R., Butler, G., Tamai, K., Dorland, S., Greene, J.R., Thiele, D.J., and Stillman, D.J. (1992). Parallel pathways of gene regulation: homologous regulators SWI5 and ACE2 differentially control transcription of HO and chitinase. Genes Dev 6, 93-104. Dumond, H., Danielou, N., Pinto, M., and Bolotin-Fukuhara, M. (2000). A large-scale study of Yap1p-dependent genes in normal aerobic and H2O2-stress conditions: the role of Yap1p in cell proliferation control in yeast. Mol Microbiol 36, 830-845.
19
Finkel, T., and Holbrook, N.J. (2000). Oxidants, oxidative stress and the biology of ageing. Nature 408, 239-247. Fitch, I., Dahmann, C., Surana, U., Amon, A., Nasmyth, K., Goetsch, L., Byers, B., and Futcher, B. (1992). Characterization of four B-type cyclin genes of the budding yeast Saccharomyces cerevisiae. Mol Biol Cell 3, 805-818. Flattery-O'Brien, J., Collinson, L.P., and Dawes, I.W. (1993). Saccharomyces cerevisiae has an inducible response to menadione which differs from that to hydrogen peroxide. J Gen Microbiol 139 ( Pt 3), 501-507. Flattery-O'Brien, J.A., and Dawes, I.W. (1998). Hydrogen peroxide causes RAD9-dependent cell cycle arrest in G2 in Saccharomyces cerevisiae whereas menadione causes G1 arrest independent of RAD9 function. J Biol Chem 273, 8564-8571. Frenz, L.M., Johnson, A.L., and Johnston, L.H. (2001). Rme1, which controls CLN2 expression in Saccharomyces cerevisiae, is a nuclear protein that is cell cycle regulated. Mol Genet Genomics 266, 374-384. Furukawa-Hibi, Y., Yoshida-Araki, K., Ohta, T., Ikeda, K., and Motoyama, N. (2002). FOXO forkhead transcription factors induce G(2)-M checkpoint in response to oxidative stress. J Biol Chem 277, 26729-26732. Gasch, A.P., Huang, M., Metzner, S., Botstein, D., Elledge, S.J., and Brown, P.O. (2001). Genomic expression responses to DNA-damaging agents and the regulatory role of the yeast ATR homolog Mec1p. Mol Biol Cell 12, 2987-3003. Gasch, A.P., Spellman, P.T., Kao, C.M., Carmel-Harel, O., Eisen, M.B., Storz, G., Botstein, D., and Brown, P.O. (2000). Genomic expression programs in the response of yeast cells to environmental changes. Mol Biol Cell 11, 4241-4257. Godon, C., Lagniel, G., Lee, J., Buhler, J.M., Kieffer, S., Perrot, M., Boucherie, H., Toledano, M.B., and Labarre, J. (1998). The H2O2 stimulon in Saccharomyces cerevisiae. J Biol Chem 273, 22480-22489. Grant, C.M., Luikenhuis, S., Beckhouse, A., Soderbergh, M., and Dawes, I.W. (2000). Differential regulation of glutaredoxin gene expression in response to stress conditions in the yeast Saccharomyces cerevisiae. Biochim Biophys Acta 1490, 33-42. Green, M.J., and Hill, H.A. (1984). Chemistry of dioxygen. Methods Enzymol 105, 3-22. Haase, S.B., and Lew, D.J. (1997). Flow cytometric analysis of DNA content in budding yeast. Methods Enzymol 283, 322-332. Hollenhorst, P.C., Pietz, G., and Fox, C.A. (2001). Mechanisms controlling differential promoter-occupancy by the yeast forkhead proteins Fkh1p and Fkh2p: implications for regulating the cell cycle and differentiation. Genes Dev 15, 2445-2456. Huang, M., and Elledge, S.J. (1997). Identification of RNR4, encoding a second essential small subunit of ribonucleotide reductase in Saccharomyces cerevisiae. Mol Cell Biol 17, 6105-6113. Koch, C., Moll, T., Neuberg, M., Ahorn, H., and Nasmyth, K. (1993). A role for the transcription factors Mbp1 and Swi4 in progression from G1 to S phase. Science 261, 1551-1557. Kops, G.J., Dansen, T.B., Polderman, P.E., Saarloos, I., Wirtz, K.W., Coffer, P.J., Huang, T.T., Bos, J.L., Medema, R.H., and Burgering, B.M. (2002). Forkhead transcription factor FOXO3a protects quiescent cells from oxidative stress. Nature 419, 316-321.
20
Koranda, M., Schleiffer, A., Endler, L., and Ammerer, G. (2000). Forkhead-like transcription factors recruit Ndd1 to the chromatin of G2/M-specific promoters. Nature 406, 94-98. Kryukov, G.V., Kumar, R.A., Koc, A., Sun, Z., and Gladyshev, V.N. (2002). Selenoprotein R is a zinc-containing stereo-specific methionine sulfoxide reductase. Proc Natl Acad Sci U S A 99, 4245-4250. Kumar, R., Reynolds, D.M., Shevchenko, A., Goldstone, S.D., and Dalton, S. (2000). Forkhead transcription factors, Fkh1p and Fkh2p, collaborate with Mcm1p to control transcription required for M-phase. Curr Biol 10, 896-906. Lee, S.E., Frenz, L.M., Wells, N.J., Johnson, A.L., and Johnston, L.H. (2001). Order of function of the budding-yeast mitotic exit-network proteins Tem1, Cdc15, Mob1, Dbf2, and Cdc5. Curr Biol 11, 784-788. Leroy, C., Mann, C., and Marsolier, M.C. (2001). Silent repair accounts for cell cycle specificity in the signaling of oxidative DNA lesions. Embo J 20, 2896-2906. Levine, R.L., Moskovitz, J., and Stadtman, E.R. (2000). Oxidation of methionine in proteins: roles in antioxidant defense and cellular regulation. IUBMB Life 50, 301-307. Lin, K., Dorman, J.B., Rodan, A., and Kenyon, C. (1997). daf-16: An HNF-3/forkhead family member that can function to double the life-span of Caenorhabditis elegans. Science 278, 1319-1322. McInerny, C.J., Partridge, J.F., Mikesell, G.E., Creemer, D.P., and Breeden, L.L. (1997). A novel Mcm1-dependent element in the SWI4, CLN3, CDC6, and CDC47 promoters activates M/G1-specific transcription. Genes Dev 11, 1277-1288. Medema, R.H., Kops, G.J., Bos, J.L., and Burgering, B.M. (2000). AFX-like Forkhead transcription factors mediate cell-cycle regulation by Ras and PKB through p27kip1. Nature 404, 782-787. Mendenhall, M.D., and Hodge, A.E. (1998). Regulation of Cdc28 cyclin-dependent protein kinase activity during the cell cycle of the yeast Saccharomyces cerevisiae. Microbiol Mol Biol Rev 62, 1191-1243. Monks, T.J., Hanzlik, R.P., Cohen, G.M., Ross, D., and Graham, D.G. (1992). Quinone chemistry and toxicity. Toxicol Appl Pharmacol 112, 2-16. Murphy, C.T., McCarroll, S.A., Bargmann, C.I., Fraser, A., Kamath, R.S., Ahringer, J., Li, H., and Kenyon, C. (2003). Genes that act downstream of DAF-16 to influence the lifespan of Caenorhabditis elegans. Nature 424, 277-283. Murray, J.I., Whitfield, M.L., Trinklein, N.D., Myers, R.M., Brown, P.O., and Botstein, D. (2004). Diverse and specific gene expression responses to stresses in cultured human cells. Mol Biol Cell 15, 2361-2374. Navas, T.A., Zhou, Z., and Elledge, S.J. (1995). DNA polymerase epsilon links the DNA replication machinery to the S phase checkpoint. Cell 80, 29-39. Nemoto, S., and Finkel, T. (2002). Redox regulation of forkhead proteins through a p66shc-dependent signaling pathway. Science 295, 2450-2452. Neumann, C.A., Krause, D.S., Carman, C.V., Das, S., Dubey, D.P., Abraham, J.L., Bronson, R.T., Fujiwara, Y., Orkin, S.H., and Van Etten, R.A. (2003). Essential role for the peroxiredoxin Prdx1 in erythrocyte antioxidant defence and tumour suppression. Nature 424, 561-565.

21
Ogg, S., Paradis, S., Gottlieb, S., Patterson, G.I., Lee, L., Tissenbaum, H.A., and Ruvkun, G. (1997). The Fork head transcription factor DAF-16 transduces insulin-like metabolic and longevity signals in C. elegans. Nature 389, 994-999. Paulovich, A.G., and Hartwell, L.H. (1995). A checkpoint regulates the rate of progression through S phase in S. cerevisiae in response to DNA damage. Cell 82, 841-847. Pic, A., Lim, F.L., Ross, S.J., Veal, E.A., Johnson, A.L., Sultan, M.R., West, A.G., Johnston, L.H., Sharrocks, A.D., and Morgan, B.A. (2000). The forkhead protein Fkh2 is a component of the yeast cell cycle transcription factor SFF. Embo J 19, 3750-3761. Rhee, S.G., Bae, Y.S., Lee, S.R., and Kwon, J. (2000). Hydrogen peroxide: a key messenger that modulates protein phosphorylation through cysteine oxidation. Sci STKE 2000, PE1. Saldanha, A.J. (2004). Java treeview--extensible visualization of microarray data. Bioinformatics. Segal, E., Shapira, M., Regev, A., Pe'er, D., Botstein, D., Koller, D., and Friedman, N. (2003). Module networks: identifying regulatory modules and their condition-specific regulators from gene expression data. Nat Genet 34, 166-176. Shackelford, R.E., Kaufmann, W.K., and Paules, R.S. (2000). Oxidative stress and cell cycle checkpoint function. Free Radic Biol Med 28, 1387-1404. Sherlock, G., Hernandez-Boussard, T., Kasarskis, A., Binkley, G., Matese, J.C., Dwight, S.S., Kaloper, M., Weng, S., Jin, H., Ball, C.A., Eisen, M.B., Spellman, P.T., Brown, P.O., Botstein, D., and Cherry, J.M. (2001). The Stanford Microarray Database. Nucleic Acids Res 29, 152-155. Simon, I., Barnett, J., Hannett, N., Harbison, C.T., Rinaldi, N.J., Volkert, T.L., Wyrick, J.J., Zeitlinger, J., Gifford, D.K., Jaakkola, T.S., and Young, R.A. (2001). Serial regulation of transcriptional regulators in the yeast cell cycle. Cell 106, 697-708. Spellman, P.T., Sherlock, G., Zhang, M.Q., Iyer, V.R., Anders, K., Eisen, M.B., Brown, P.O., Botstein, D., and Futcher, B. (1998). Comprehensive identification of cell cycle-regulated genes of the yeast Saccharomyces cerevisiae by microarray hybridization. Mol Biol Cell 9, 3273-3297. Toyn, J.H., Johnson, A.L., Donovan, J.D., Toone, W.M., and Johnston, L.H. (1997). The Swi5 transcription factor of Saccharomyces cerevisiae has a role in exit from mitosis through induction of the cdk-inhibitor Sic1 in telophase. Genetics 145, 85-96. Tran, H., Brunet, A., Grenier, J.M., Datta, S.R., Fornace, A.J., Jr., DiStefano, P.S., Chiang, L.W., and Greenberg, M.E. (2002). DNA repair pathway stimulated by the forkhead transcription factor FOXO3a through the Gadd45 protein. Science 296, 530-534. Troyanskaya, O.G., Garber, M.E., Brown, P.O., Botstein, D., and Altman, R.B. (2002). Nonparametric methods for identifying differentially expressed genes in microarray data. Bioinformatics 18, 1454-1461. Wang, X., Kiyokawa, H., Dennewitz, M.B., and Costa, R.H. (2002). The Forkhead Box m1b transcription factor is essential for hepatocyte DNA replication and mitosis during mouse liver regeneration. Proc Natl Acad Sci U S A 99, 16881-16886. Weinert, T.A., Kiser, G.L., and Hartwell, L.H. (1994). Mitotic checkpoint genes in budding yeast and the dependence of mitosis on DNA replication and repair. Genes Dev 8, 652-665.

22
Wingender, E., Chen, X., Fricke, E., Geffers, R., Hehl, R., Liebich, I., Krull, M., Matys, V., Michael, H., Ohnhauser, R., Pruss, M., Schacherer, F., Thiele, S., and Urbach, S. (2001). The TRANSFAC system on gene expression regulation. Nucleic Acids Res 29, 281-283. Winterbourn, C.C., and Metodiewa, D. (1999). Reactivity of biologically important thiol compounds with superoxide and hydrogen peroxide. Free Radic Biol Med 27, 322-328. Zheng, M., Aslund, F., and Storz, G. (1998). Activation of the OxyR transcription factor by reversible disulfide bond formation. Science 279, 1718-1721. Zhou, Z., and Elledge, S.J. (1993). DUN1 encodes a protein kinase that controls the DNA damage response in yeast. Cell 75, 1119-1127. Zhu, G., Spellman, P.T., Volpe, T., Brown, P.O., Botstein, D., Davis, T.N., and Futcher, B. (2000). Two yeast forkhead genes regulate the cell cycle and pseudohyphal growth [In Process Citation]. Nature 406, 90-94. Zhu, Y., and Xiao, W. (2001). Two alternative cell cycle checkpoint pathways differentially control DNA damage-dependent induction of MAG1 and DDI1 expression in yeast. Mol Genet Genomics 266, 436-444.

Table I. Strains used in this study Name Genotype Source or reference DBY8724 MATa ura3∆(EcoRV-StuI) bar1::URA3 (Spellman et al.,
1998) DBY8781 (DY150)
MATa ade2-1 trp-1 leu2-3,112 his3-11,15 ura3 can1-100
(Bhoite and Stillman, 1998)
DBY8834 MATa ade2-1 trp-1 leu2-3,112 his3-11,15 ura3 can1-100 bar1∆ fkh1∆ fkh2∆
This laboratory

A
Figure 1
C
Time (min)
0
20
40
60
80
100
0 30 60 90 120 150 180 210 240
% o
f tot
al 0
20
40
60
80
100
0 30 60 90 120 150 180 210 240 270
D
0304560
90105135165180210
255
75
N 2N
N 2N
75
180135
30
225290
Time(min)
B Time(min)
Figure 2
Time (min)
%un
budd
ed c
ells
(G1)
A
0
20
40
60
80
100
0 30 60 90 120 150 180 210
70
100
400
140
210
N 2N
BTime(min)
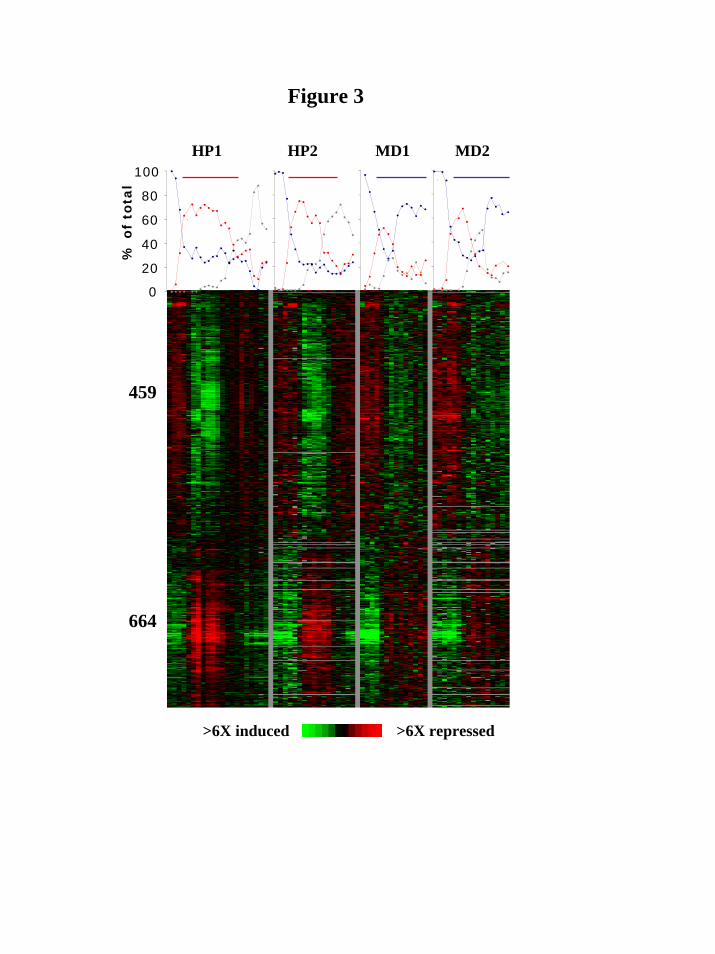
Figure 3
HP1 MD1HP2 MD2
>6X induced >6X repressed
664
459
0
20
40
60
80
100
% o
f to
tal
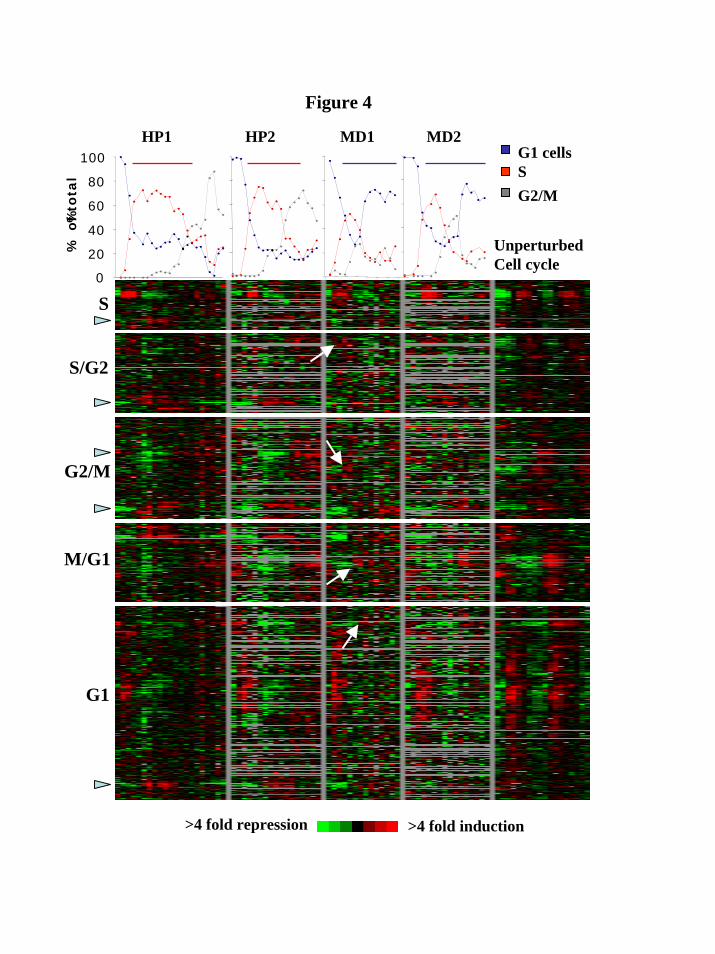
Figure 4
G1 cells SG2/M
S
S/G2
G2/M
M/G1
G1
HP1 MD1HP2 MD2
0
20
40
60
80
100
%
UnperturbedCell cycle
>4 fold repression >4 fold induction
% o
f to
tal

Figure 5
Ave
rage
log2
(R/G
)
Time (min)
A
B
-2-1012
60 120 180 240 300
C
-3-2-101
60 120 180 240 300
-1
0
1
60 120 180 240 300
60 120 180
60 120 180
60 120 180
HP MD G2/M(13)
M/G1(18)
G1(8)

Table II. Promoter binding and enriched cis-regulatory motifs
bPromoter Binding aCell cycle sub-
cluster Fkh1 Fkh2 Mcm1 Ndd1 Swi5 Ace2
cEnriched Motifs (Name, #/total, P-value)
dGenes with Motif
G2/M (13)
SUR7 YOR315W CLB2
SUR7 YOR315W ALK1 SWI5 CLB2
SUR7 YOR315W ALK1 SWI5 CLB2 YNL058C
SUR7 YOR315W HST3 SWI5 CLB2 YNL058C IQG1 CHS2
SUR7 YOR315W
G2/M_cell_cycle, 12/13, 6.7E-5
STRE, 8/13, 0.02
MCM1, 7/13, 0.03
SUR7 BUD3 YOR315W ALK1 HST3 SWI5 CLB1 CLB2 YNL057W IQG1 CHS2 SRC1 (but not YNL058C) SUR7 HST3 CLB2 YNL058C YNL057W IQG1 CHS2 SRC1 ALK1 HST3 SWI5 CLB2 YNL058C CHS2 SRC1
M/G1 (18)
AMN1 AMN1 PIR3 PIR1
SIC1 YLR194C ASH1 AMN1 JIP1 TEC1 YPL158C PCL9 EGT2 PST1 PIR3 PIR1 HSP150
AMN1 NIS1TEC1 DSE4 EGT2 HSP150
M/G1_cell_cycle (SWI5), 18/18, 2.5E-6
SIC1 YNL046W CYK3 YLR194C ASH1 AMN1 NIS1 TEC1 DSE4 YPL158C PCL9 DSE3 EGT2 PST1 PIR3 PIR1 HSP150 GPA1
G1 (8) DSE2 CTS1
GIC2 DSE2 DSE1 CTS1
SCW11 CTS1 DSE2 DSE1 SCW11 CTS1
G1_cell_cycle, 8/8, 7.6E-7
(SWI5), 7/8, 5E-5
YJL217W GIC2 SHQ1 DSE2 DSE1 SCW11 CTS1 RME1 YJL217W GIC2 SHQ1 DSE2 DSE1 SCW11 RME1
a Sub-clusters are designated by the cell cycle phase in which their expression normally peaks. Number of genes in each sub-cluster is shown in parentheses. b Promoter binding by transcription factors, shown below (based on promoter localization data; Simon et al., 2001). Genes shown are those for which binding by the designated transcription factor was considered statistically significant (p<0.002) c Motif logos. Shown are those that were shared and enriched in promoters of the clustered genes. Novel motifs are designated with the respective subcluster name; known motifs are designated with TRANSFAC identifiers. Motif name is followed by the number of genes with motif out of the total number of genes in the subcluster, and the p-value describing the significance of motif enrichment in the subcluster compared with the entire cell cycle phase cluster. d Genes containing the presented motifs in their promoter.
% o
f tot
alFigure 6
No MD
020406080
100
0 30 60 90 1200
20406080
100
0 30 60 90 120Time (min)
B C
D E
020406080
100
0 30 60 90 120 0 30 60 90 120
WT
fkh1fkh2
F G
No MDA
20406080
100
0

YHR214C-B
Figure 7
A
B
> 4 X repressed > 4 X induced
MXR1
TRX2TRX1
TRX3
YCL033C
GRX1GRX5
GRX3
LYS1
ERG4LYS9
YHB1
RNR4
YJR029WYER160C
RNR2
DUN1
>2 X induced>2 X repressed