dissemination of heat wave alerts using spatial mashup...
TRANSCRIPT

Journal of Geomatics Vol 11 No. 2 October 2017
© Indian Society of Geomatics
Dissemination of heat wave alerts using spatial mashup technology and open source GIS
Neha Sharma and Shweta Mishra
Space Applications Centre, Ahmedabad – 380015
Email: [email protected]
(Received: Jul 24, 2017; in final form: Sep 28, 2017)
Abstract: Web GIS based applications and systems are becoming popular with the advancement of internet and
related technologies and efforts of the open source community. Planners and decision makers are seeking web
GIS based solutions as they are efficient at satisfying the needs of users in terms of availability of associated
collateral information. The standards and specifications developed by the Open Geospatial Consortium (OGC)
for geospatial data and services is leading to positive developments in web GIS. GIS services defined by the OGC
are part of a larger effort to build distributed systems around the principles of Service. Web 2.0 technologies,
particularly Asynchronous JavaScript and XML (AJAX) open APIs, XML, XHTML/CSS etc. leads towards
realization of spatial mashups for GIS data and services. In this study, the spatial mashup technology has been
used to disseminate near real-time heat wave alerts through a rich Graphical User Interface (GUI) based web GIS
application. Further, GeoServer is used as a GIS server and Apache Tomcat version 8.0.12 is used for delivering
the web services. Java and java script are used in web application development and database connectivity.
Keywords: Open source GIS, Web-based GIS, Heat wave, Spatial mashup, GeoServer, OpenLayers
1. Introduction
Web-based GIS combines the power of the internet
and GIS. Internet GIS uses ‘a Web browser where
geographic data are displayed as maps and graphs
based on user-selected criteria’ (Milson and Earle,
2007). The drop in computer prices and the
increased popularity of internet mapping in recent
years has sparked the development of many open
source GIS projects with the aim of bringing GIS
technology to the general public at little or no cost
(Caldeweyher et al., 2006). Development of web
GIS based applications aid in decision making and
planning activities, and the integration of near real
time information components into the system is very
essential. An application that uses and combines
data or functionality from different sources to form
a new service is known as web mashup. The role of
web mashup technology is very important to
develop further value added applications at the user
end by integrating the GIS data and services from
diverse sources (Karnatak et al., 2011).
The mashup architecture integrates data,
information and functionality from different sources
like open APIs, web services, etc. and demonstrates
it as a new application. In the present study, a use of
spatial mashup technology is demonstrated for
disseminating heat wave alerts.
A heat wave is a period of abnormally high
temperatures more than the normal maximum
temperature that occurs during the summer season in
India. Due to global climate change, instances of
heat waves are becoming more intense in nature.
Climate extremes like heat waves are of great
interest due to their high impact on various sectors
including health, agriculture, ecosystems and
national economies. The health impacts of heat wave
typically involve dehydration, heat cramps, heat
exhaustion and/or heat stroke. Other impacts due to
heat waves could be agricultural crop failures and
power outages due to excess consumption.
The Indian landmass was struck by a severe heat
wave in May-June 2015. It resulted in the death of
more than 2,500 people in multiple regions. The
2015 heat wave had the highest recorded
temperature since 1995. Therefore, this study was
taken up to disseminate heat wave related
information to users in a timely and cost effective
manner so that decision makers and planners or end
users can take necessary actions. Heat wave alerts
which include maximum surface temperature
forecasts for the next 24 and 48 hours, changes in
extreme heat condition from 24 to 48 hours, and
maximum surface temperature predicted from
Weather Research Forecast (WRF) models are used
as input in the development of a web GIS based
application using spatial mashup technology. Spatial
resolution of heat wave data is 5 km. GIS layers such
as state, district and taluka (region) boundary,
district roads, national highway, railway tracks,
rivers, district headquarters, district population (as
per census of 2011) etc. are used as overlay layers.
Basic GIS functionality such as pan, zoom, distance
and area calculation are also made available in the
web application.
268

Journal of Geomatics Vol 11 No. 2 October 2017
2. Inputs for the heat wave alert dissemination
system
The Indian Meteorological Department (IMD) has
given the following criteria for heat waves:
‘Departure of maximum temperature from normal is
+4°C to +5°C or more for the regions where the
normal maximum temperature is more than 40 °C
and departure of maximum temperature from normal
is +5°C to +6°C for regions where the normal
maximum temperature is 40°C or less (IMD –
Terminologies and Glossary). A heat wave is
declared only when the maximum temperature of a
station reaches at least 40°C for plains and at least
30°C for hilly regions. In this context, it is also
measured as a heat wave if the actual maximum
temperature remains 45°C or more irrespective of
the normal maximum temperature’.
Severe heat wave conditions are declared when the
maximum temperature deviate up to +6°C from the
normal for regions where the normal maximum
temperature is more than 40°C, and +7°C or more
for regions where the normal maximum temperature
is 40°C or less.
WRF model version 3.7 has been used for the
generation of maximum surface temperature
forecasts. For the assimilation of the WRF model,
the INSAT-3D sounder and imager radiances,
Sounder for Probing Vertical Profiles of Humidity
(SAPHIR) radiances and INSAT-3D atmospheric
motion vectors are used in this study. More details
of the implementation of the WRF model can be
found from Kumar et al. (2015).
The maximum temperature observations during
1981 to 2014 from IMD, India are used to generate
daily climatology of maximum temperature. If the
difference between the WRF model predicted
maximum temperature and daily climatology
(maximum temperature occurred within +5 days of
reference day) of maximum temperature following
the IMD guidelines, maximum temperature forecast
is plotted for those regions (Kumar and Kishtwal,
2016). Model predicted 24-hour maximum surface
temperatures, heat wave conditions for different
forecast lengths (24 and 48 hours), and changes in
heat wave conditions from 24 to 48 hours are
disseminated using Web GIS based application.
3. System architecture solutions for web GIS
based visualization system
Extreme weather related data dissemination with
associated spatial data is more user-friendly for
general public and decision makers, but the handling
of spatial data is quite difficult as compared to non-
spatial data. The emergence of new technologies and
knowledge in open source has given impetus to the
web GIS based visualization system (Sanchez et al.,
2014, Karnatak et al., 2010, Sharma and Mishra,
2012). Open source software are programs whose
licences allow users to use, modify and freely
redistribute the software either the original or
modified program without further limitations or
royalty payments (Sanchez et al., 2014, Sharma and
Mishra, 2012, Karnatak et al., 2010). It facilitates
users to use and distribute geospatial data at
affordable pricing with increased access. After
detailed review and study, the software and libraries
listed in Table 1 are used for carrying out this work.
Table 1: Open source tools used for development
Software / Tool
/ Library Task / Activity
GeoExt, ExtJS
Web-GIS development
libraries <http://geoext.org>
<www.sencha.com
OpenLayers
Open-source, JavaScript library for light-weight interactive maps. <http://openlayers.org>
GeoServer
OGC compliant Open-source
WebGIS Server for hosting
and managing of geospatial
data <http://geoserver.org>
Apache Tomcat
An open-source Web application server <http://tomcat.apache.org>
MapProxy
An open source tiling server used for caching, acceleration of map service <https://mapproxy.org>
Standard image or data formats (or non-spatial data)
such as .png, .jpeg, .tiff, .html, .xml etc. can be
displayed easily with the help of standard web
browsers and servers. But to depict or publish GIS
data (spatially enabled data) into a web browser, a
special software package or program is used known
as GIS or map server. Many proprietary as well as
open-source products are available as GIS servers
for publishing geospatial data in a web environment.
Various GIS/Map servers available are GeoServer,
UMN Mapserver, Mapguide, Degree (Open source),
ArcGIS Server, Skyline Globe, ERDAS APOLLO
Server, Intergraph and Geo web server (Proprietary
software). After study and detailed review of various
WebGIS Servers, GeoServer is selected for
publishing GIS data as OGC Web Services. Among
these available GIS servers, GeoServer was used in
this study as it is OGC compliant open source
WebGIS software, has both raster and vector support
and is superior in performance, security, vector
support and OGC web services
269

Journal of Geomatics Vol 11 No. 2 October 2017
(http://docs.geoserver.org/2.8.x/en/user/index.html)
. GeoServer is an open source software server
written in Java that allows users to share and edit
geospatial data. It publishes data from any major
spatial data source using open standards. GeoServer
is the reference implementation of the Open
Geospatial Consortium (OGC), Web Feature
Service (WFS) and Web Coverage Service (WCS)
standards, as well as a high performance certified
compliant Web Map Service (WMS). GeoServer
forms a core component of the Geospatial Web
(http://geoserver.org). GeoServer allows the loading
and serving of the following data formats by default:
Vector data formats such as Shapefile,
PostGIS databases, External WFS layers, Java
Properties files etc.
Raster data formats such as ArcGrid,
Geotiff, Gtopo30, Image Mosaic, WorldImage etc.
Apache-Tomcat version 8.0.12 server is used as a
web server whose primary function is to deliver web
pages as per the user’s request in the client’s
browser. It is an open source, Java-based web
application container that was created to run servlet
and Java Server Page (JSP) based web applications
(http://tomcat.apache.org). Tomcat server has
become the reference implementation for both the
servlet and JSP specifications. It is stable and has all
of the features of a commercial Web application
container.
An open source tiling server MapProxy is used for
caching and acceleration of map service. MapProxy
accelerates existing web map service 10 to 100
times. Pre-generation of tile cache of collateral
datasets has been done to obtain better performance.
Open source API’s (Application Programming
Interface) such as OpenLayers and GeoExt have
been used for making interactive web maps.
OpenLayers is a client side JavaScript library that
requires no special server side software or settings
(Kulawiak et al., 2010). It provides tools to develop
customized web maps (http://openlayers.org). Using
OpenLayers one can customize every aspect of the
map—layers, controls, events, etc. It makes creating
map 'mashups' relatively easy. There is a Client /
Server Model and it is, essentially, the core of how
all web applications operate (Hazzard, 2011). In the
case of a web map application, a map client (e.g.
OpenLayers) communicates with web map server
(e.g. a WMS server or the Google Maps backend).
GeoExt is used for building rich, web-based GIS
applications (http://geoext.org). This rapidly-
developing library is built upon ExtJS and
OpenLayers. It provides user interface components
for building web applications along with solid
underlying data components while OpenLayers is
used for making interactive web maps. UI
components provided by GeoExt make the web-
based GIS applications extremely rich and user
friendly. It can access information from OGC
services, OpenLayers objects and other data sources.
4. Approach and development process
Heat wave data and associated thematic layers are
stored in a GIS server i.e. GeoServer. Pre-caching of
large size overlay layers was done using MapProxy
tile server for fast rendering and improved
performance. A web application that has been
developed using JavaScript, OpenLayers API,
GeoExt and ExtJS is deployed in the web server i.e.
Apache. Clients interact with the web server by
sending HTTP requests through the web application.
The primary task of the client is to get map images
from the GeoServer. OpenLayers handles the
interactive GIS operations like pan and zoom via
asynchronous JavaScript (AJAX) calls to
GeoServer. The Web server sends a GetMap request
to GeoServer, then the GeoServer sends back a
response containing the map image (WMS layer).
Web server sends a HTTP response to the client;
finally, output is displayed in the browser. A mashup
has been implemented by integrating various data
layers from different sources to disseminate through
a common platform. The overall methodology and
system flow diagram is shown in Figure 1.
Figure 1: System flow diagram
270
Journal of Geomatics Vol 11 No. 2 October 2017
Data downloading from FTP
WRF model generates heat wave forecast on daily
basis at predefined FTP area. A data downloading
script has been prepared by using the java
programming which automatically downloads the data
from a predefined FTP area into the data directory of
GIS server.
Preparation of GIS database
Thematic layers such as administrative boundaries like
state, district and taluka, district roads, national
highways, railway tracks, airports, district
headquarters and rivers (Source: NRDB (Natural
Resource Data Base)) at 1:250000 scale, were added
as WMS layer in web application. GTOPO digital
elevation model (DEM) with horizontal grid spacing
of 30 arc seconds (approximately 1 km) was published
on GeoServer as a WMS service. The WMS service
generates map images and makes them available in
different formats, for example GIF (Graphic
Interchange Format) files, JPEG (Joint Photographic
Experts Group) or PNG (Portable Network graphics)
(picture case) or as a series of graphical elements,
typically pre-determined projection and given
reference and coordinate systems and with predefined
associated symbols and colors. The service is
composed of three basic functions, supported by three
WMS interfaces: human-and computer-
understandable descriptions of the available data and
the parameters related to the requests accepted by the
service (GetCapabilities), supply of the requested data
(GetMap), request of other information (map content
and attributes of map features) (GetFeaturesInfo). The
data is in GCS WGS 84 projection.
Geospatial data has no intrinsic visual component. In
order to see the data, it must be styled which means to
specify the color, thickness, and other visible
attributes. For the better visualization of datasets in
GeoServer, this styling is accomplished by using a
markup language called Styled Layer Descriptor, or
SLD. SLD is an XML-based markup language and is
a very powerful technique for preparing illustrative
visual map depictions.
All India Land Use/ Land Cover layers for 2012-13
have also been added in the application as WMS layers
from the Bhuvan (bhuvan.nrsc.gov.in) website.
Seeding of all overlay layers were done using
MapProxy for fast rendering.
Publishing heat wave alert data on GIS server
Heat wave alert data is available through the WRF
model in .tiff format, the main challenge was to
publish it in GeoServer as a WMS service, for which
data should be spatially enabled. For publishing these
images, which are not georeferenced as a layer in
GeoServer, WorldImage format was used.
A world file is a plain text file used to georeferenced
raster map images. This file (with an extension of. jgw
or. tfw) accompanies an associated image file (.jpg or
.tif). Together, the world file and the corresponding
image file are known as WorldImage in GeoServer.
According to the extent of the image and its spatial
resolution the tfw file was generated and heat wave
alert data was published automatically as WMS layer
in GeoServer using RESTful service. The heat wave
alert data is in raster format which contains
temperature values for India. The data is stored in
EPSG:4326 (WGS 84-LatLong) projection system.
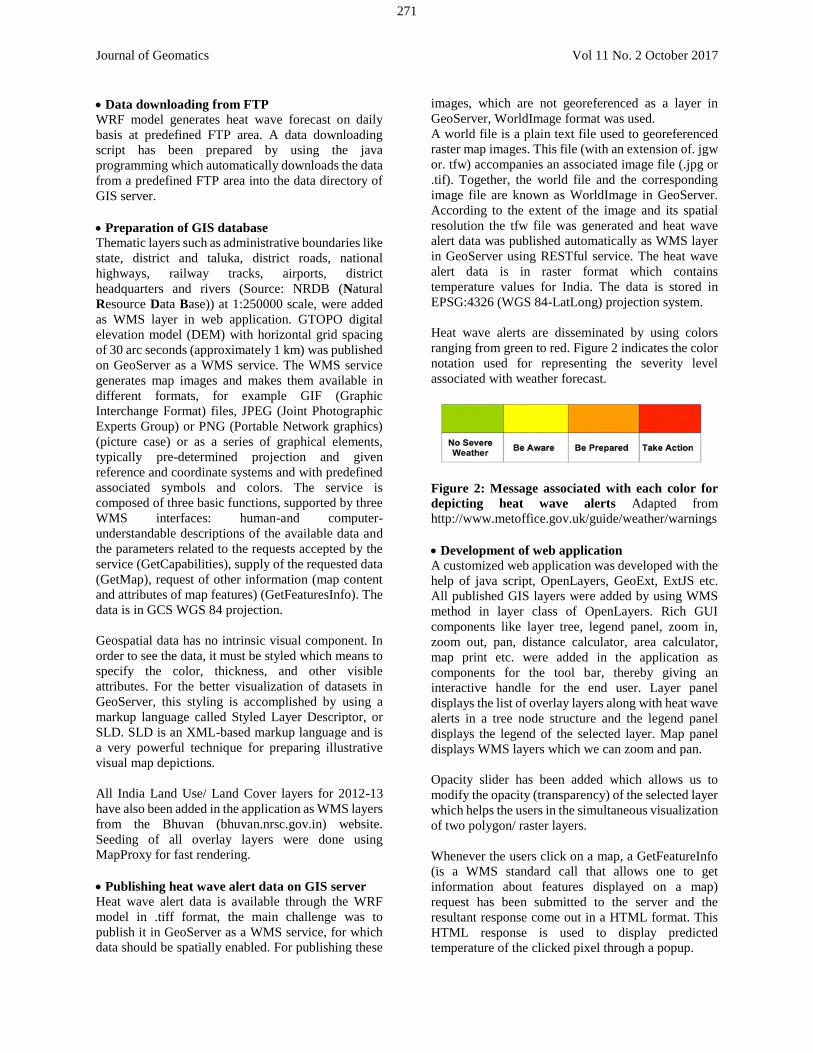
Heat wave alerts are disseminated by using colors
ranging from green to red. Figure 2 indicates the color
notation used for representing the severity level
associated with weather forecast.
Figure 2: Message associated with each color for
depicting heat wave alerts Adapted from
http://www.metoffice.gov.uk/guide/weather/warnings
Development of web application
A customized web application was developed with the
help of java script, OpenLayers, GeoExt, ExtJS etc.
All published GIS layers were added by using WMS
method in layer class of OpenLayers. Rich GUI
components like layer tree, legend panel, zoom in,
zoom out, pan, distance calculator, area calculator,
map print etc. were added in the application as
components for the tool bar, thereby giving an
interactive handle for the end user. Layer panel
displays the list of overlay layers along with heat wave
alerts in a tree node structure and the legend panel
displays the legend of the selected layer. Map panel
displays WMS layers which we can zoom and pan.
Opacity slider has been added which allows us to
modify the opacity (transparency) of the selected layer
which helps the users in the simultaneous visualization
of two polygon/ raster layers.
Whenever the users click on a map, a GetFeatureInfo
(is a WMS standard call that allows one to get
information about features displayed on a map)
request has been submitted to the server and the
resultant response come out in a HTML format. This
HTML response is used to display predicted
temperature of the clicked pixel through a popup.
271

Journal of Geomatics Vol 11 No. 2 October 2017
5. Results and discussions
Web GIS based near real-time heat wave alerts
dissemination will be useful for the end users or
decision makers for taking necessary actions. In this
endeavour, the role of open software system
architecture is very important to provide an
interoperable and cost effective solutions.
Overlay layers such as land use/land cover help in
understanding the spatial relationship between
anthropogenic activities and extreme heat affected
areas. Residential areas under the influence of extreme
heat waves can be easily identified by using this
application. A DEM layer gave insight about the effect
of topography on temperature. Through this
application, users can get information about the state/
national highways which are affected by the
severe heat waves, so that users/ stakeholders can take
necessary preventive measures to avoid serious health
consequences.
The user interface of the web GIS based application
for the dissemination of heat wave alerts is shown in
Figure 3. Users can zoom, pan and calculate distance/
area using the tools given in the application. Users can
also add other thematic layers such as administrative
boundaries, district wise population (as per census of
2011) etc. along with Heat wave predictions which
will aid in identifying affected area upto the large scale
(taluka level) (Figures 4 and 5). Changes in extreme
heat conditions from 24 to 48 hours and the predicted
maximum surface temperature layer gives insight
about the current status and very near future scenario
of the heat wave over India.
Figure 3: User interface of web GIS based application showing heat wave forecast for 29-June-2015
272

Journal of Geomatics Vol 11 No. 2 October 2017
Figure 4: Heat wave forecast for 24 hour overlaid with taluka boundary and popup displaying predicted
temperature of clicked pixel
Figure 5: Heat wave forecast for 48 hours overlaid with district population and national highway
This paper demonstrates the architecture, functionality
and applications of web GIS based visualization
system for disseminating extreme weather related
products in near real time. This visualization system
includes automatic update, integration of collateral
data from various sources to create a mashup and
visualization in the Web environment which enables
remote sharing of geospatial information in an
understandable way. It is planned to provide heat wave
alerts as notifications on Android based handheld
273

Journal of Geomatics Vol 11 No. 2 October 2017
devices and extend the theme for cold wave
conditions.
6. Conclusion
The geo-visualization of heat waves events presents a
simple/ user-friendly way to demonstrate the complex
results of algorithms which are beyond the
understanding of users. The present study also shows
the use of spatial mashup technology and capability of
open source GIS technology in the development of a
near real-time web GIS based visualization system. It
demonstrates the practical usage of tools and
techniques of open source utilities to make available
geographic information to the end users in a cost-
effective manner. For a country like India where
severe heat wave incidents occur frequently, the
above-developed web GIS based application will be
useful for decision makers and planners. This study
also shows that the web based technology is emerging
as a platform where various technological and
applications oriented solutions can be provided
without any software, data or hardware dependency at
the user end.
Acknowledgements
The authors express their sincere gratitude to Mrs.
Pushplata B. Shah, former Head, DWD/MRG/EPSA
for her guidance and advice which proved to be very
effective. Sincere thanks to Shri. Tapan Misra,
Director, Space Applications Centre and Dr. Raj
Kumar, Deputy Director, EPSA/SAC for their support
and encouragement. The authors would also like to
acknowledge Dr. Prashant for providing heat wave
forecast.
References
Caldeweyher, D., J. Zhang and B. Pham (2006).
OpenCIS—Open Source GIS‐based web community
information system. International Journal of
Geographical Information Science, 20:8, 885-898.
Hazzard, E. (2011). OpenLayers 2.10 beginner's
guide. Packt Publishing Ltd, Birmingham, B27 6PA,
UK, ISBN 978-1-849514-12-5
http://docs.geoserver.org/2.8.x/en/user/index.html
http://geoext.org
http://geoserver.org
http://openlayers.org
http://tomcat.apache.org
India Meteorological Department -Terminologies and
Glossary, Available at
http://imd.gov.in/section/nhac/termglossary.pdf
Karnatak, H.C., R. Shukla, V.K. Sharma, Y.V.S.
Murthy and V. Bhanumurthy (2011). Spatial mashup
technology and real time data integration in geo-web
application using open source GIS – A case study for
disaster management. Geocarto International, 27:6,
499-514.
Karnatak, H.C., S. Saran, K. Bhatia and P.S. Roy
(2010). Geospatial database organization and spatial
decision analysis for biodiversity databases in Web
GIS environment. Geocarto International, 25:1, 3-23.
Kulawiak, M., A. Chybicki and M. Moszynski (2010).
Web-based GIS as a tool for supporting marine
research. Marine Geodesy, 33:2-3,
DOI:10.1080/01490419.2010.492280, 135-153.
Kumar, P., B.K. Bhattacharya and P.K. Pal (2015).
Evaluation of Weather Research and Forecasting
model predictions using micrometeorological tower
observations. Boundary-Layer Meteorology 157, no.
2, 293-308.
Kumar, P. and C.M. Kishtawal (2016). Heat wave
predictions over Indian landmass using Weather
Research and Forecasting model. Scientific report,
SAC/EPSA/AOSG/ASD/SR/08/2016.
Milson, A.J. and B.D. Earle (2007). Internet-based
GIS in an inductive learning environment: A case
study of ninth grade geography students. Journal of
Geography, 106 (6):227–237.
Sanchez, R.M., G. Anderson, J. Cruz and M. Hayden
(2014). The potential for the use of open source
software and open specifications in creating Web‐based cross‐border health spatial information systems.
International Journal of Geographical Information
Science, 21:10, DOI: 10.1080/13658810701300113,
1135-1163.
Sharma, S.A. and S. Mishra (2012). Web-GIS based
monitoring of vegetation using NDVI profiles. Journal
of Geomatics, Vol.6 No.2, 109-112.
274