distance measuring based on stereoscopic pictures - …dsc.ijs.si/files/papers/s101 mrovlje.pdf ·...
TRANSCRIPT

Abstract— Stereoscopy is a technique used for recording and
representing stereoscopic (3D) images. It can create an illusion
of depth using two pictures taken at slightly different positions.
There are two possible way of taking stereoscopic pictures: by
using special two-lens stereo cameras or systems with two
single-lens cameras joined together. Stereoscopic pictures allow
us to calculate the distance from the camera(s) to the chosen
object within the picture. The distance is calculated from
differences between the pictures and additional technical data
like focal length and distance between the cameras. The certain
object is selected on the left picture, while the same object on
the right picture is automatically detected by means of
optimisation algorithm which searches for minimum difference
between both pictures. The calculation of object’s position can
be calculated by doing some geometrical derivations. The
accuracy of the position depends on picture resolution, optical
distortions and distance between the cameras. The results
showed that the calculated distance to the subject is relatively
accurate.
I. INTRODUCTION
Methods for measuring the distance to some objects can
be divided into active and passive ones. The active methods
are measuring the distance by sending some signals to the
object [2, 4] (e.g. laser beam, radio signals, ultra-sound, etc.)
while passive ones only receive information about object’s
position (usually by light). Among passive ones, the most
popular are those relying on stereoscopic measuring method.
The main characteristic of the method is to use two cameras.
The object’s distance can be calculated from relative
difference of object’s position on both cameras [6].
The paper shows implementation of such algorithm within
program package Matlab and gives results of experiments
based on some stereoscopic pictures taken in various
locations in space.
II. STEREOSCOPIC MEASUREMENT METHOD
Stereoscopy is a technique used for recording and
representing stereoscopic (3D) images. It can create an
illusion of depth using two pictures taken at slightly different
positions. In 1838, British scientist Charles Wheatstone
invented stereoscopic pictures and viewing devices [1, 5, 7].
Stereoscopic picture can be taken with a pair of cameras,
1 Jernej Morvlje is with the Faculty of Electrical Engineering, University
of Ljubljana, Slovenia; (e-mail: [email protected]).
2 Damir Vrančić is was with Department of Systems and Control, J.
Stefan Institute, Jamova 39, 1000 Ljubljana, Slovenia (e-mail:
similarly to our own eyes. The most important restrictions in
taking a pair of stereoscopic pictures are the following:
• cameras should be horizontally aligned (see
Figure 1), and
• the pictures should be taken at the same instant
[3].
Note that the latest requirement is not so important for
static pictures (where no object is moving).
( )c
( )b
( )a
vertical
error
vertical
error
horizontal
Fig. 1. Proper alignment of the cameras (a) and alignments with vertical
errors (b) and (c).
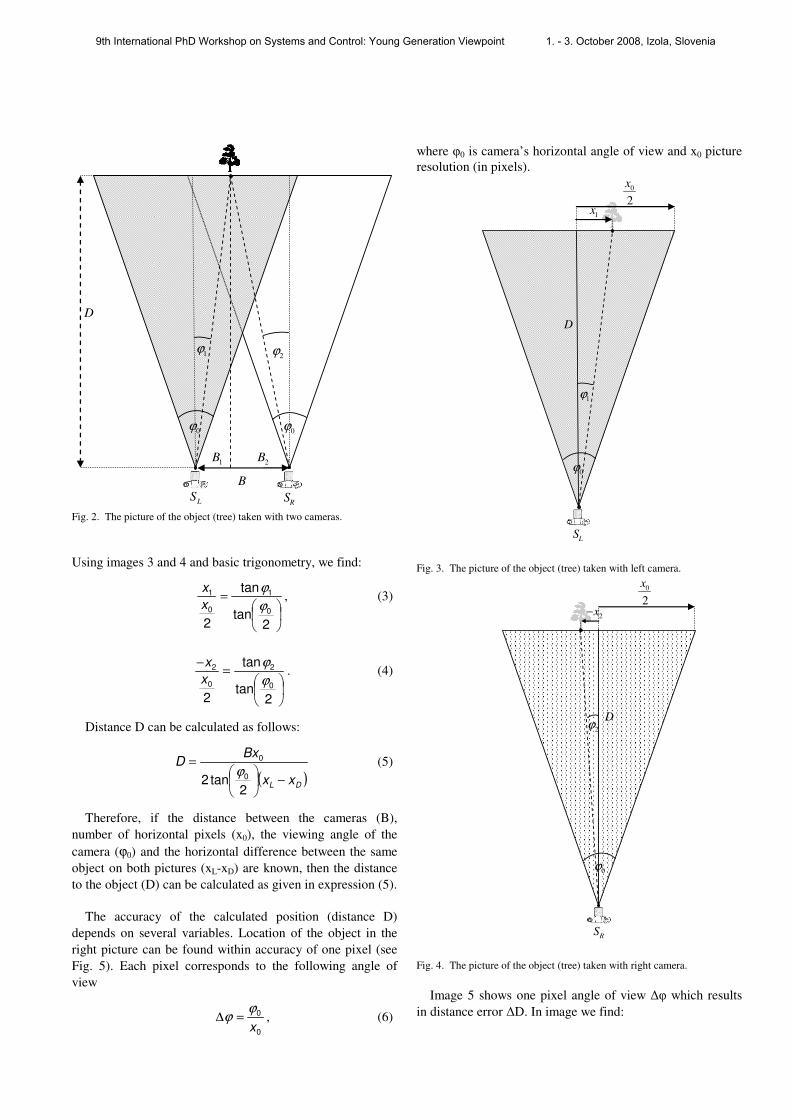
Stereoscopic pictures allow us to calculate the distance
between the camera(s) and the chosen object within the
picture. Let the right picture be taken in location SR and the
left picture in location SL. B represents the distance between
the cameras and φ0 is camera’s horizontal angle of view (see
Figure 2). Object’s position (distance D) can be calculated
by doing some geometrical derivations.
We can express distance B as a sum of distances B1 and B2:
2121 tantan ϕϕ DDBBB +=+= , (1)
if optical axes of the cameras are parallel, where φ1 and φ2
are angles between optical axis of camera lens and the
chosen object.
Distance D is as follows:
21 tantan ϕϕ +
=B
D (2)
Distance measuring based on stereoscopic pictures
Jernej Mrovlje1 and Damir Vrančić
2
9th International PhD Workshop on Systems and Control: Young Generation Viewpoint 1. - 3. October 2008, Izola, Slovenia
0ϕ0ϕ
B
1ϕ2ϕ
D
RSL
S
1B 2B
Fig. 2. The picture of the object (tree) taken with two cameras.
Using images 3 and 4 and basic trigonometry, we find:
=
2tan
tan
20
1
0
1
ϕ
ϕ
x
x, (3)
=
−
2tan
tan
20
2
0
2
ϕ
ϕ
x
x. (4)
Distance D can be calculated as follows:
( )DL
xx
BxD
−
=
2tan2 0
0
ϕ (5)
Therefore, if the distance between the cameras (B),
number of horizontal pixels (x0), the viewing angle of the
camera (ϕ0) and the horizontal difference between the same
object on both pictures (xL-xD) are known, then the distance
to the object (D) can be calculated as given in expression (5).
The accuracy of the calculated position (distance D)
depends on several variables. Location of the object in the
right picture can be found within accuracy of one pixel (see
Fig. 5). Each pixel corresponds to the following angle of
view
0
0
x
ϕϕ =∆ , (6)
where φ0 is camera’s horizontal angle of view and x0 picture
resolution (in pixels).
0ϕ
1ϕ
D
1x
0
2
x
LS
Fig. 3. The picture of the object (tree) taken with left camera.
0ϕ
2ϕ
0
2
x
2x−
D
RS
Fig. 4. The picture of the object (tree) taken with right camera.
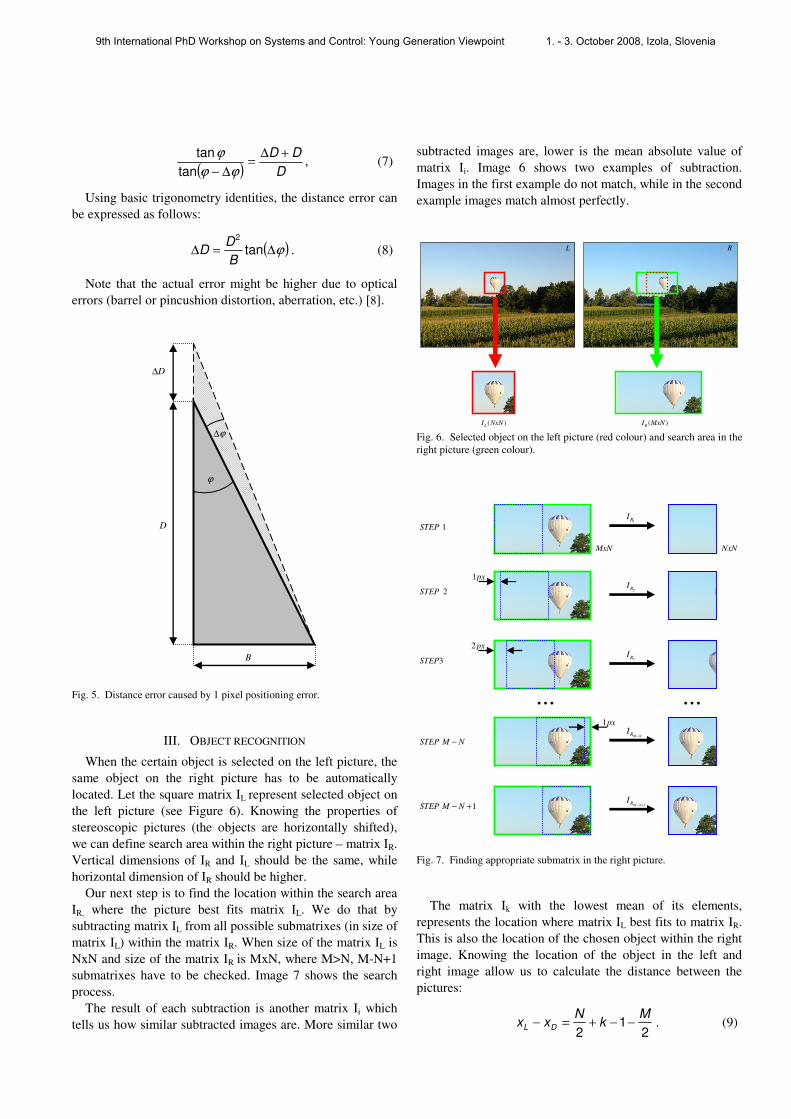
Image 5 shows one pixel angle of view ∆φ which results
in distance error ∆D. In image we find:
9th International PhD Workshop on Systems and Control: Young Generation Viewpoint 1. - 3. October 2008, Izola, Slovenia
( ) D
DD +∆=
∆− ϕϕ
ϕ
tan
tan, (7)
Using basic trigonometry identities, the distance error can
be expressed as follows:
( )ϕ∆=∆ tan2
B
DD . (8)
Note that the actual error might be higher due to optical
errors (barrel or pincushion distortion, aberration, etc.) [8].
D
D∆
ϕ
ϕ∆
B
Fig. 5. Distance error caused by 1 pixel positioning error.
III. OBJECT RECOGNITION
When the certain object is selected on the left picture, the
same object on the right picture has to be automatically
located. Let the square matrix IL represent selected object on
the left picture (see Figure 6). Knowing the properties of
stereoscopic pictures (the objects are horizontally shifted),
we can define search area within the right picture – matrix IR.
Vertical dimensions of IR and IL should be the same, while
horizontal dimension of IR should be higher.
Our next step is to find the location within the search area
IR, where the picture best fits matrix IL. We do that by
subtracting matrix IL from all possible submatrixes (in size of
matrix IL) within the matrix IR. When size of the matrix IL is
NxN and size of the matrix IR is MxN, where M>N, M-N+1
submatrixes have to be checked. Image 7 shows the search
process.
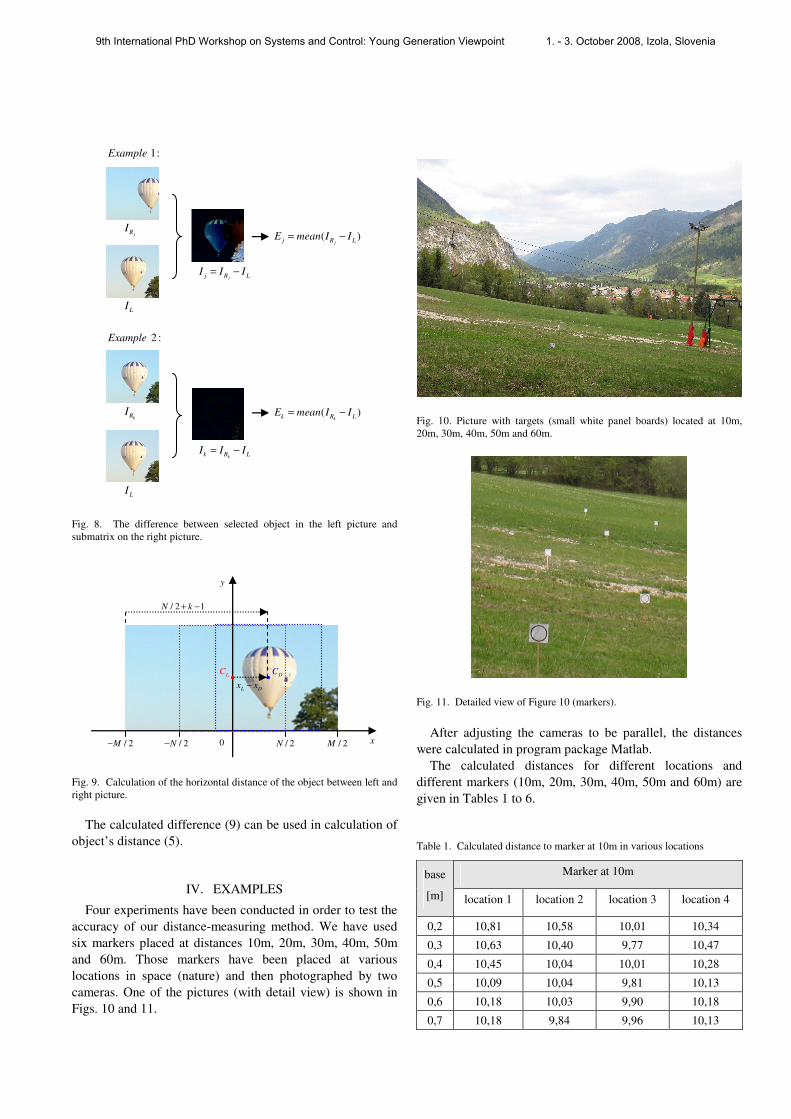
The result of each subtraction is another matrix Ii which
tells us how similar subtracted images are. More similar two
subtracted images are, lower is the mean absolute value of
matrix Ii. Image 6 shows two examples of subtraction.
Images in the first example do not match, while in the second
example images match almost perfectly.
( )LI NxN ( )R
I MxN
RL
Fig. 6. Selected object on the left picture (red colour) and search area in the
right picture (green colour).
...1px
1px
2 px
1STEP M N− +
STEP M N−
2STEP
3STEP
1STEP
...
1RI
2RI
3RI
M NRI−
1M NRI− +
NxNMxN
Fig. 7. Finding appropriate submatrix in the right picture.
The matrix Ik with the lowest mean of its elements,
represents the location where matrix IL best fits to matrix IR.
This is also the location of the chosen object within the right
image. Knowing the location of the object in the left and
right image allow us to calculate the distance between the
pictures:
2
12
Mk
Nxx
DL−−+=− . (9)
9th International PhD Workshop on Systems and Control: Young Generation Viewpoint 1. - 3. October 2008, Izola, Slovenia
jj R LI I I= −
jRI
LI
kk R LI I I= −
kRI
LI
( )jj R LE mean I I= −
( )kk R L
E mean I I= −
2 :Example
1:Example
Fig. 8. The difference between selected object in the left picture and
submatrix on the right picture.
0 / 2M
LC
DC
L Dx x−
/ 2M− / 2N/ 2N−
/ 2 1N k+ −
x
y
Fig. 9. Calculation of the horizontal distance of the object between left and
right picture.
The calculated difference (9) can be used in calculation of
object’s distance (5).
IV. EXAMPLES
Four experiments have been conducted in order to test the
accuracy of our distance-measuring method. We have used
six markers placed at distances 10m, 20m, 30m, 40m, 50m
and 60m. Those markers have been placed at various
locations in space (nature) and then photographed by two
cameras. One of the pictures (with detail view) is shown in
Figs. 10 and 11.
Fig. 10. Picture with targets (small white panel boards) located at 10m,
20m, 30m, 40m, 50m and 60m.
Fig. 11. Detailed view of Figure 10 (markers).
After adjusting the cameras to be parallel, the distances
were calculated in program package Matlab.
The calculated distances for different locations and
different markers (10m, 20m, 30m, 40m, 50m and 60m) are
given in Tables 1 to 6.
Table 1. Calculated distance to marker at 10m in various locations
Marker at 10m base
[m] location 1 location 2 location 3 location 4
0,2 10,81 10,58 10,01 10,34
0,3 10,63 10,40 9,77 10,47
0,4 10,45 10,04 10,01 10,28
0,5 10,09 10,04 9,81 10,13
0,6 10,18 10,03 9,90 10,18
0,7 10,18 9,84 9,96 10,13
9th International PhD Workshop on Systems and Control: Young Generation Viewpoint 1. - 3. October 2008, Izola, Slovenia
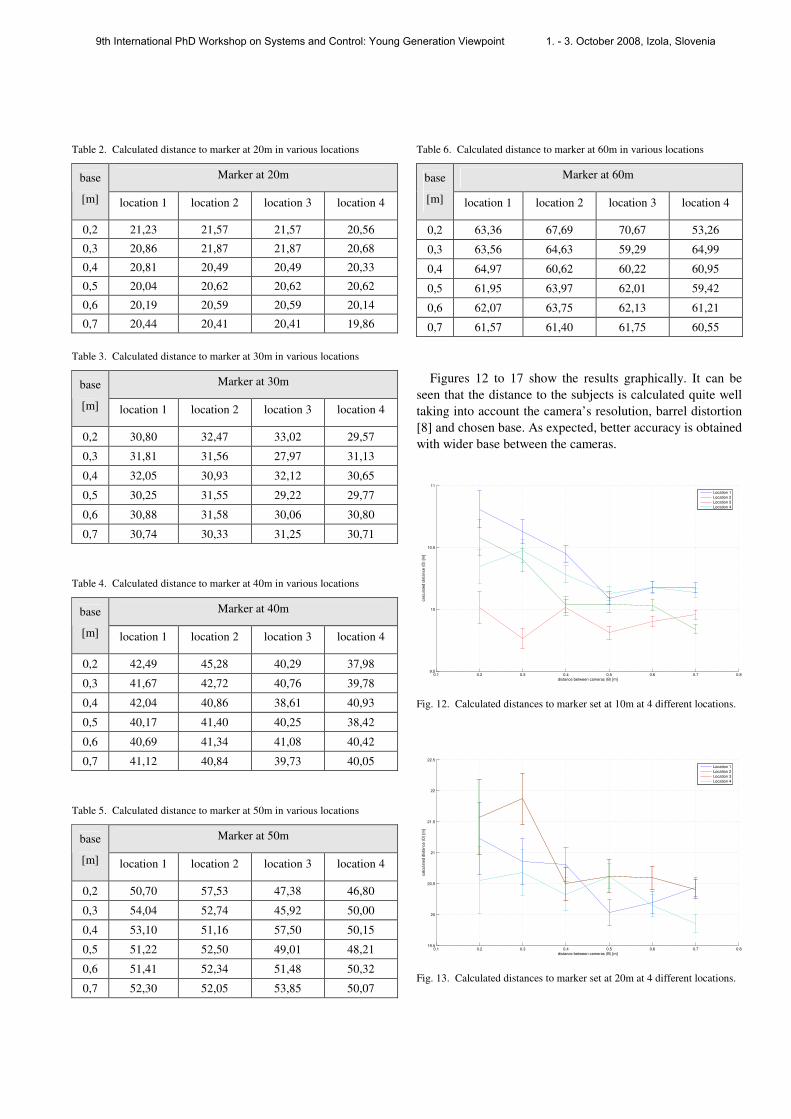
Table 2. Calculated distance to marker at 20m in various locations
Marker at 20m base
[m] location 1 location 2 location 3 location 4
0,2 21,23 21,57 21,57 20,56
0,3 20,86 21,87 21,87 20,68
0,4 20,81 20,49 20,49 20,33
0,5 20,04 20,62 20,62 20,62
0,6 20,19 20,59 20,59 20,14
0,7 20,44 20,41 20,41 19,86
Table 3. Calculated distance to marker at 30m in various locations
Marker at 30m base
[m] location 1 location 2 location 3 location 4
0,2 30,80 32,47 33,02 29,57
0,3 31,81 31,56 27,97 31,13
0,4 32,05 30,93 32,12 30,65
0,5 30,25 31,55 29,22 29,77
0,6 30,88 31,58 30,06 30,80
0,7 30,74 30,33 31,25 30,71
Table 4. Calculated distance to marker at 40m in various locations
Marker at 40m base
[m] location 1 location 2 location 3 location 4
0,2 42,49 45,28 40,29 37,98
0,3 41,67 42,72 40,76 39,78
0,4 42,04 40,86 38,61 40,93
0,5 40,17 41,40 40,25 38,42
0,6 40,69 41,34 41,08 40,42
0,7 41,12 40,84 39,73 40,05
Table 5. Calculated distance to marker at 50m in various locations
Marker at 50m base
[m] location 1 location 2 location 3 location 4
0,2 50,70 57,53 47,38 46,80
0,3 54,04 52,74 45,92 50,00
0,4 53,10 51,16 57,50 50,15
0,5 51,22 52,50 49,01 48,21
0,6 51,41 52,34 51,48 50,32
0,7 52,30 52,05 53,85 50,07
Table 6. Calculated distance to marker at 60m in various locations
Marker at 60m base
[m] location 1 location 2 location 3 location 4
0,2 63,36 67,69 70,67 53,26
0,3 63,56 64,63 59,29 64,99
0,4 64,97 60,62 60,22 60,95
0,5 61,95 63,97 62,01 59,42
0,6 62,07 63,75 62,13 61,21
0,7 61,57 61,40 61,75 60,55
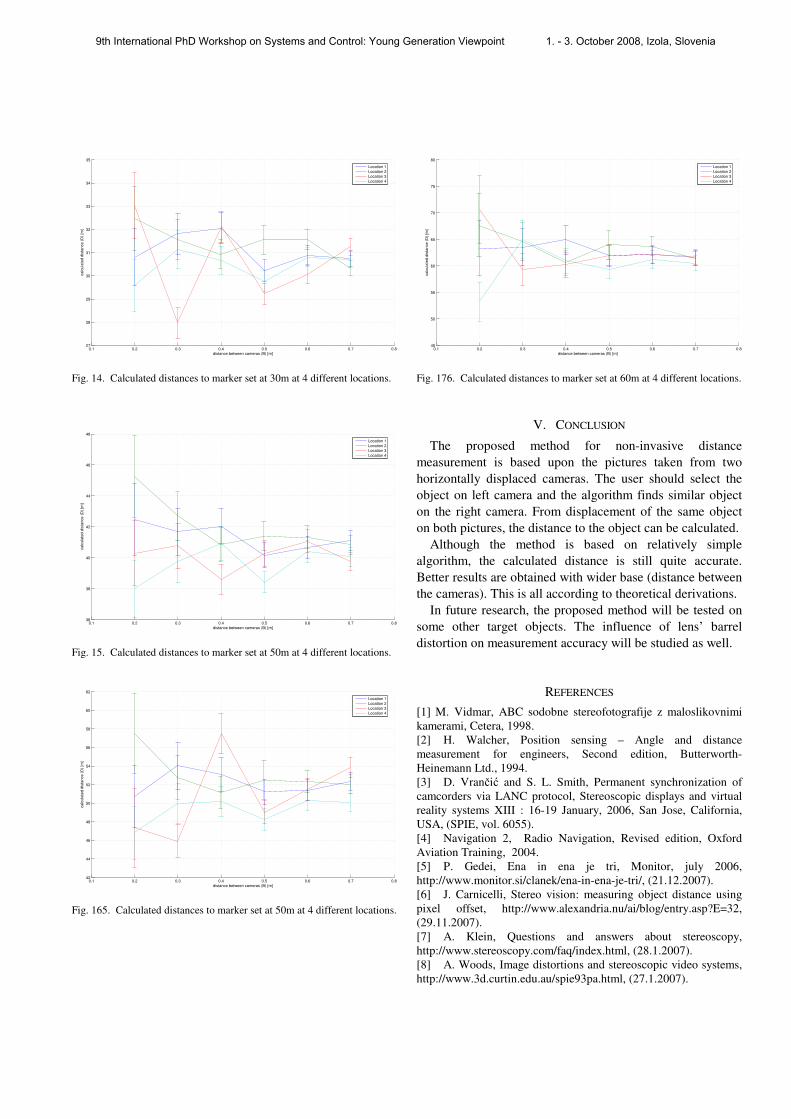
Figures 12 to 17 show the results graphically. It can be
seen that the distance to the subjects is calculated quite well
taking into account the camera’s resolution, barrel distortion
[8] and chosen base. As expected, better accuracy is obtained
with wider base between the cameras.
0.1 0.2 0.3 0.4 0.5 0.6 0.7 0.89.5
10
10.5
11
distance between cameras (B) [m]
calc
ula
ted d
ista
nce (
D)
[m]
Location 1
Location 2
Location 3
Location 4
Fig. 12. Calculated distances to marker set at 10m at 4 different locations.
0.1 0.2 0.3 0.4 0.5 0.6 0.7 0.819.5
20
20.5
21
21.5
22
22.5
distance between cameras (B) [m]
calc
ula
ted d
ista
nce (
D)
[m]
Location 1
Location 2
Location 3
Location 4
Fig. 13. Calculated distances to marker set at 20m at 4 different locations.
9th International PhD Workshop on Systems and Control: Young Generation Viewpoint 1. - 3. October 2008, Izola, Slovenia
0.1 0.2 0.3 0.4 0.5 0.6 0.7 0.827
28
29
30
31
32
33
34
35
distance between cameras (B) [m]
ca
lcu
late
d d
ista
nce
(D
) [m
]
Location 1
Location 2
Location 3
Location 4
Fig. 14. Calculated distances to marker set at 30m at 4 different locations.
0.1 0.2 0.3 0.4 0.5 0.6 0.7 0.836
38
40
42
44
46
48
distance between cameras (B) [m]
ca
lcu
late
d d
ista
nce
(D
) [m
]
Location 1
Location 2
Location 3
Location 4
Fig. 15. Calculated distances to marker set at 50m at 4 different locations.
0.1 0.2 0.3 0.4 0.5 0.6 0.7 0.842
44
46
48
50
52
54
56
58
60
62
distance between cameras (B) [m]
ca
lcu
late
d d
ista
nce
(D
) [m
]
Location 1
Location 2
Location 3
Location 4
Fig. 165. Calculated distances to marker set at 50m at 4 different locations.
0.1 0.2 0.3 0.4 0.5 0.6 0.7 0.845
50
55
60
65
70
75
80
distance between cameras (B) [m]
calc
ula
ted d
ista
nce (
D)
[m]
Location 1
Location 2
Location 3
Location 4
Fig. 176. Calculated distances to marker set at 60m at 4 different locations.
V. CONCLUSION
The proposed method for non-invasive distance
measurement is based upon the pictures taken from two
horizontally displaced cameras. The user should select the
object on left camera and the algorithm finds similar object
on the right camera. From displacement of the same object
on both pictures, the distance to the object can be calculated.
Although the method is based on relatively simple
algorithm, the calculated distance is still quite accurate.
Better results are obtained with wider base (distance between
the cameras). This is all according to theoretical derivations.
In future research, the proposed method will be tested on
some other target objects. The influence of lens’ barrel
distortion on measurement accuracy will be studied as well.
REFERENCES
[1] M. Vidmar, ABC sodobne stereofotografije z maloslikovnimi
kamerami, Cetera, 1998.
[2] H. Walcher, Position sensing – Angle and distance
measurement for engineers, Second edition, Butterworth-
Heinemann Ltd., 1994.
[3] D. Vrančić and S. L. Smith, Permanent synchronization of
camcorders via LANC protocol, Stereoscopic displays and virtual
reality systems XIII : 16-19 January, 2006, San Jose, California,
USA, (SPIE, vol. 6055).
[4] Navigation 2, Radio Navigation, Revised edition, Oxford
Aviation Training, 2004.
[5] P. Gedei, Ena in ena je tri, Monitor, july 2006,
http://www.monitor.si/clanek/ena-in-ena-je-tri/, (21.12.2007).
[6] J. Carnicelli, Stereo vision: measuring object distance using
pixel offset, http://www.alexandria.nu/ai/blog/entry.asp?E=32,
(29.11.2007).
[7] A. Klein, Questions and answers about stereoscopy,
http://www.stereoscopy.com/faq/index.html, (28.1.2007).
[8] A. Woods, Image distortions and stereoscopic video systems,
http://www.3d.curtin.edu.au/spie93pa.html, (27.1.2007).
9th International PhD Workshop on Systems and Control: Young Generation Viewpoint 1. - 3. October 2008, Izola, Slovenia