distance to default – volume 3 · volume 3 distance to default. 2 ... more likely to default if...
TRANSCRIPT

Short, engaging headlineShort descriptionSectors and themes
Date 20XX
kpmg.com.au
May 2018
KPMG.com.au
A default indicator for Australian listed companies
Volume 3
Distance to default

2 Distance to default
© 2018 KPMG, an Australian partnership and a member firm of the KPMG network of independent member firms affiliated with KPMG International Cooperative (“KPMG International”), a Swiss entity. All rights reserved. The KPMG name and logo are registered trademarks or trademarks of KPMG International. Liability limited by a scheme approved under Professional Standards Legislation.
ForewordIn this third edition of our bi-annual Distance to Default (D2D) publication we comment on the changing state of corporate health across all ASX sectors following the end of the reporting season for the six months to December 2017.
Since our last publication in November 2017, Australian companies have continued to operate in a period of low interest rates and low wage growth.
Consistent with our last report, our analysis indicates that the Financial Services and Real Estate sectors continue to display the highest D2D scores (furthest from default), with Energy and Materials displaying the lowest D2D scores.
In this edition of D2D we delve deeper into the largest movers by industry sectors, and analyse the proportion of companies consistently displaying low D2D scores (otherwise known as ‘D2D Zombies’). We also provide commentary regarding new Ipso facto legislative changes commencing on 1 July 2018 that will impact all company contracts entered into after this date. These changes are relevant for companies managing their supply chain risk and distressed companies evaluating strategic options available to them in any restructure.
We hope you find this third edition of KPMG Restructuring Services’ D2D publication useful in providing meaningful insights into trends in corporate health across the ASX.
Gayle Dickerson Partner, Restructuring Services, KPMG Australia
Carl Gunther Partner, Restructuring Services, KPMG Australia
Contents
Key findings
Why use a D2D score
06
04
08
09
12
14
16
D2D scores across the ASX
D2D score movements by sector
D2D movements by industry group
Across the ASX – Zombies
Ready, steady, go with KPMG
© 2018 KPMG, an Australian partnership and a member firm of the KPMG network of independent member firms affiliated with KPMG International Cooperative (“KPMG International”), a Swiss entity. All rights reserved. The KPMG name and logo are registered trademarks or trademarks of KPMG International. Liability limited by a scheme approved under Professional Standards Legislation.

4 Distance to default
© 2018 KPMG, an Australian partnership and a member firm of the KPMG network of independent member firms affiliated with KPMG International Cooperative (“KPMG International”), a Swiss entity. All rights reserved. The KPMG name and logo are registered trademarks or trademarks of KPMG International. Liability limited by a scheme approved under Professional Standards Legislation.
D2D score inputsD2D is a metric used to assess a company’s
Market capitalisation
Short term debt and long term debt
Stock volatility
The D2D score serves as a useful metric for benchmarking company performance across different industries, irrespective of company size.
Default risk (or insolvency) stems from the uncertainty surrounding a company’s ability to service its debt as and when it falls due. Prior to default, there is no way to easily discriminate unambiguously between companies that will default and those that will not. At best we can only make probability based assessments of the likelihood of default. With this in mind, KPMG sought to identify an effective financial metric to determine the industry sectors with higher default risk as compared to their peers.
Analysis of companies listed on the ASX using market data-points can help detect deteriorating corporate health, and hence increasing default risk, because such analysis incorporates forward-looking market perception rather than backward looking data sources, such as financial statements.
This report is prepared using a Distance to Default metric, an indicator of financial health used by the Reserve Bank of Australia which is based on the Merton model. This analysis has been prepared using the Moody’s Kealhofer, McQuown and Vasicek (KMV) D2D formula, and relies on source data from the Capital IQ database.
The D2D score incorporates information relating to debt (from financial statements), a company’s market capitalisation, and stock volatility, to assess credit risk. The key assumption underpinning the D2D score is that a company is more likely to default if the book value of its liabilities exceeds the market value of its assets.
In summary, the D2D score combines both financial information and market information to determine a company’s relative ‘Distance to Default’ (or D2D score). KPMG Restructuring believes that combining the two types of information detects deteriorating corporate health more effectively than either source alone.
About D2DD2D is a metric used to assess a company’s ‘distance-to-default’. The metric takes into account financial information and market data.
The closer to zero, the more likely a company is to default. In contrast, the further a company is from zero, the less likely it is to default.
In this analysis, released every 6 months, we analyse the D2D score movements of ASX listed companies (following reporting season of full year and half year results) to draw insight as to corporate health across the Australian economy.
Why use a D2D score?
Value of the company’s assets
Leverage
Business and industry risk
Credit issues addressed
!

5Distance to default
© 2018 KPMG, an Australian partnership and a member firm of the KPMG network of independent member firms affiliated with KPMG International Cooperative (“KPMG International”), a Swiss entity. All rights reserved. The KPMG name and logo are registered trademarks or trademarks of KPMG International. Liability limited by a scheme approved under Professional Standards Legislation.
Summary
Whilst the ASX average D2D score was stable from June 2017 to December 2017 (moving from 1.96 to 1.97), there was significant underlying change in the scores of the companies making up this analysis. Half of the companies analysed displayed an improved D2D score and the other half of companies showed a decline in D2D score.
Real Estate continues to be a strong performing sector (highest D2D score) and also displayed the greatest improvement in D2D score (increase by 8.9 percent), while Utilities recorded the largest deterioration in D2D score (decline by 9.2 percent).
For the six months to December 2017.This analysis is based on:
Key findings
Industry group performance
The industries with the largest D2D score movements were:
– Insurance (within Financials) companies, whose average D2D score improved by 17.5 percent; and
– Household and Personal Products (within Consumer Staples) companies, whose average D2D score declined by 16.5 percent.
The five industry groups with the largest D2D score declines were:
– Household and personal products – decline of (16.5 percent) to 1.76.
– Consumer Services – decline of (9.8 percent) to 2.58.
– Utilities – decline of (9.2 percent) to 2.38.
– Media – decline of (8.6 percent) to 2.14.
– Software and Software Services – decline of (6.4 percent) to 1.39.
Of the above-five industry groups, Media had the largest proportion of companies with a decline in revenue from HY17 to HY18 (62 percent of companies had a decline in revenue). Personal and Household Products companies had the largest proportion of companies with a decline in EBITDA, Negative Operating Cash Flow, and an increase in Net Debt (57 percent, 71 percent, and 71 percent respectively).
1,779 ASX listed companies reviewed (with complete information) across;
11 industry sectors;
24 industry groups.
Sector performance
– 62.2 percent of companies displaying a D2D score above 3.0 (furthest from default) were in financials, real estate, and consumer discretionary.
– 74.3 percent of companies with a D2D score below 1.0 were in Materials, Energy, and Information Technology.

6 Distance to default
© 2018 KPMG, an Australian partnership and a member firm of the KPMG network of independent member firms affiliated with KPMG International Cooperative (“KPMG International”), a Swiss entity. All rights reserved. The KPMG name and logo are registered trademarks or trademarks of KPMG International. Liability limited by a scheme approved under Professional Standards Legislation.
Key findings (Continued)
Zombies’ make up 20.3 percent of ASX companies analysed, 1 in 5 companies
There were 641 companies with a D2D score below 1. Of these, there were 361 ‘Zombie’ companies displaying a score below 1 for three or more half year periods on the ASX representing 20.3 percent of total companies analysed.
The average D2D score of Zombie companies was 0.64 at December 2017, with the majority of companies displaying persistently low scores operating in Materials (49 percent), Energy (20 percent), and Information Technology (11 percent).
The Information Technology sector (comprising industries such as software, and technology hardware) displayed a 27 percent increase in the number of participants displaying a D2D score below 1.0 for 3 or more consecutive half-year periods (from 30 to 38 companies).
The Energy sector (comprising industries such as oil, gas, consumable fuels, and energy equipment) displayed a 15 percent decrease in the number of participants displaying a D2D score below 1.0 for 3 or more half-year periods (from 207 to 177 companies).
Total market capitalisation, or stranded capital, for Zombie companies was c.$8.8 billion. See page 12 for more details.
Forced to perform?
Knowing your counterparty is becoming even more important from 1 July 2018. Reforms to ipso facto clauses from that date will mean that companies dealing with an insolvent company may be forced (by law) to perform under their contract rather than terminate because of insolvency.
On page 13 we provide a high level summary of the proposed 1 July 2018 ipso facto changes, impacts for contracting parties, and what companies can be doing now to ensure they are ready to contract in this new environment.

7Distance to default
© 2018 KPMG, an Australian partnership and a member firm of the KPMG network of independent member firms affiliated with KPMG International Cooperative (“KPMG International”), a Swiss entity. All rights reserved. The KPMG name and logo are registered trademarks or trademarks of KPMG International. Liability limited by a scheme approved under Professional Standards Legislation.
The ASX D2D score was stable at 1.97 (as compared to 1.96 as at June 2017).
The stability in the average ASX D2D score was underpinned by a divergence amongst companies:
36% of companies analysed displayed D2D scores below 1.0, closest to default
44%of companies analysed displayed D2D scores between 1.0 and 3.0, indicating that they are in the ‘safe zone’
20%of companies analysed displayed D2D scores above 3.0, furthest from default
1.00
0.50
0.00
1.50
2.00
2.50
3.50
4.00
4.50
5.00
3.00
Default
1.97 - ASX AVERAGE D2D SCORE AS AT DECEMBER 2017
1.96 - ASX AVERAGE D2D SCORE AS AT JUNE 2017
D2D scores across the ASX(20% Jun 2017)
(43% Jun 2017)
(37% Jun 2017)
50% of companies had an increase in their D2D score;
46% of companies had a decrease in their D2D score; and
the remaining companies had no movement or were newly listed.

8 Distance to default
© 2018 KPMG, an Australian partnership and a member firm of the KPMG network of independent member firms affiliated with KPMG International Cooperative (“KPMG International”), a Swiss entity. All rights reserved. The KPMG name and logo are registered trademarks or trademarks of KPMG International. Liability limited by a scheme approved under Professional Standards Legislation.
D2D movements by sectorThe Financials, Utilities, Consumer Discretionary, Industrials, and Information Technology sectors moved closer to default in the 6 months to 31 December 2017. Financials and Real Estate continue to display the highest D2D scores, each delivering a score above 3. Information Technology, Materials, and Energy continue to display the lowest D2D scores, or the scores closest to default.
2.33
1.00
0.50
0.00
1.50
2.00
2.50
3.50
4.00
2.41
1.161.15
1.711.69
2.152.20
1.381.47
1.251.22
2.20
2.38
2.62
2.12
2.46
2.33
3.92
3.89
4.12
4.494.50
5.00
June 2017
3.00
Default
MaterialsEnergy
Financials
Healthcare
Industrials
Information Technology
Consumer Staples
Real Estate
Utilities
ASX AVERAGE 2017 1.96
ASX AVERAGE 2018 1.97
Telecommunication Services
Consumer Discretionary
December 2017
Over the past 6 months:
– the largest sector improvement was in real estate, improving by 8.9%, with the strongest D2D score of 4.49
– the largest sector decline was in the utilities sector, declining 9.2% to 2.38
– 5 of the 11 sectors had a decrease in their D2D score
9Distance to default
© 2018 KPMG, an Australian partnership and a member firm of the KPMG network of independent member firms affiliated with KPMG International Cooperative (“KPMG International”), a Swiss entity. All rights reserved. The KPMG name and logo are registered trademarks or trademarks of KPMG International. Liability limited by a scheme approved under Professional Standards Legislation.
June 2017
December 2017
EnergyUtilities
InformationTechnology
MaterialsIndustrialsConsumerDiscretionary
Consumer Staples
Real Estate
TelecomunicationServices
120 122
53 46
2318
3023
1421
96 89 4 5
35 30
55 56
Healthcare
19 17
Financials
June 2017
December 2017Energy
Utilities
InformationTechnology
Materials
Healthcare
Industrials
106 94
13 11
89 86
5 5 4 5
285 296
28 25
36 37
12 1130 31
44 40
Consumer Discretionary
Financials
Consumer Staples
Real Estate
TelecomunicationServices
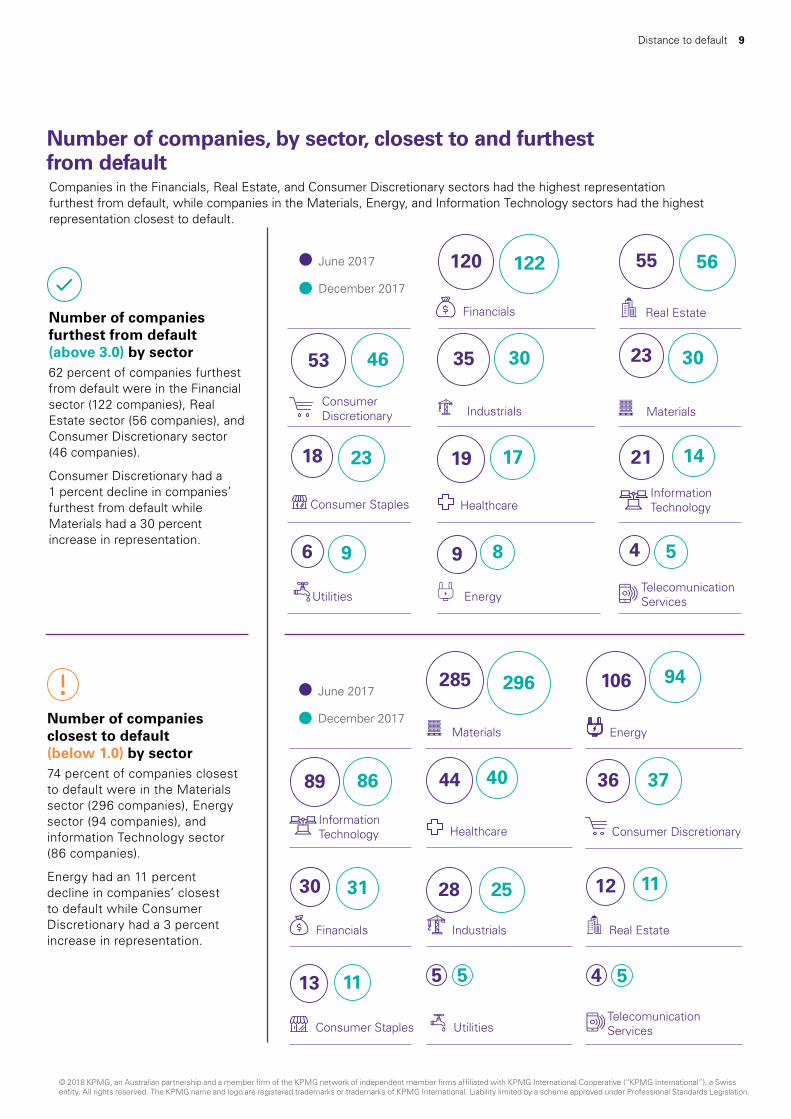
Number of companies closest to default (below 1.0) by sector74 percent of companies closest to default were in the Materials sector (296 companies), Energy sector (94 companies), and information Technology sector (86 companies).
Energy had an 11 percent decline in companies’ closest to default while Consumer Discretionary had a 3 percent increase in representation.
Number of companies furthest from default (above 3.0) by sector62 percent of companies furthest from default were in the Financial sector (122 companies), Real Estate sector (56 companies), and Consumer Discretionary sector (46 companies).
Consumer Discretionary had a 1 percent decline in companies’ furthest from default while Materials had a 30 percent increase in representation.
Number of companies, by sector, closest to and furthest from defaultCompanies in the Financials, Real Estate, and Consumer Discretionary sectors had the highest representation furthest from default, while companies in the Materials, Energy, and Information Technology sectors had the highest representation closest to default.

10 Distance to default
© 2018 KPMG, an Australian partnership and a member firm of the KPMG network of independent member firms affiliated with KPMG International Cooperative (“KPMG International”), a Swiss entity. All rights reserved. The KPMG name and logo are registered trademarks or trademarks of KPMG International. Liability limited by a scheme approved under Professional Standards Legislation.
– Insurance companies had the largest improvement in D2D score increasing by 17.5%, with an average D2D score of 4.23 (up from 3.60 six months prior)
– Household and Personal Products companies recorded the largest decline in D2D score of 16.5%, with an average D2D score of 1.76 (down from 2.10 six months prior)
D2D movements by industry group
17.5%
0.8%
0.1%
1.3%
2.4%3.1% 3.2%
4.4%
6.2%6.4%
8.6%9.2%
9.8%
16.5%
2.5%2.7%2.8%
3.8% 3.8%
7.9%
8.9%9.2%9.9%
12.1%
Insu
ran
ce
Ban
ks
Co
nsu
mer
Du
rab
les
and
Ap
par
el
Foo
d, B
ever
age
and
Tob
acco
Rea
l Est
ate
Hea
lth
care
Eq
uip
men
t an
d S
ervi
ces
Sem
ico
nd
uct
ors
an
d S
emic
on
du
cto
r E
qu
ipm
ent
Tele
com
mu
nic
atio
n S
ervi
ces
Foo
d a
nd
Sta
ple
s R
etai
ling
Ret
ailin
g
Mat
eria
ls
En
ergy
Tran
spo
rtat
ion
Au
tom
ob
iles
and
Co
mp
on
ents
Cap
ital
Go
od
s
Co
mm
erci
al a
nd
Pro
fess
ion
al S
ervi
ces
Div
ersi
fied
Fin
anci
als
Tech
no
logy
Har
dw
are
and
Eq
uip
men
t
Ph
arm
aceu
tica
ls, B
iote
chn
olo
gy a
nd
Life
Sci
ence
s
So
ftw
are
and
Ser
vice
s
Med
ia
Uti
litie
s
Co
nsu
mer
Ser
vice
s
Ho
use
ho
ld a
nd
Per
son
al P
rod
uct
s
4.23
4.56
2.16
2.374.49
2.14
1.45 2.20
4.78 2.31 1.25
1.163.63
2.21
1.812.23 3.80
1.31
1.32 1.39
2.142.38 2.58
1.76
Industry group with D2D % increases
Industry group with D2D % decreases
On the following page we dive deeper into the financial performance of the five industries with the largest decline in D2D score

11Distance to default
© 2018 KPMG, an Australian partnership and a member firm of the KPMG network of independent member firms affiliated with KPMG International Cooperative (“KPMG International”), a Swiss entity. All rights reserved. The KPMG name and logo are registered trademarks or trademarks of KPMG International. Liability limited by a scheme approved under Professional Standards Legislation.© 2018 KPMG, an Australian partnership and a member firm of the KPMG network of independent member firms affiliated with KPMG International Cooperative (“KPMG International”), a Swiss entity. All rights reserved. The KPMG name and logo are registered trademarks or trademarks of KPMG International. Liability limited by a scheme approved under Professional Standards Legislation.
Spotlight on the financial performance of industry groups with the largest decline in D2D score
Of the 5 industries with the largest D2D score declines, we reviewed their financial performance from HY17 to HY18 for signs of pressure.
Revenue change Change in EBITDANet Operating Cash
FlowChange in Net Debt
Personal and Household Products
(7 company financials reviewed)
D2D HY 18: 1.76 Change: (16.5)%
29%had a decrease in
revenue
57%had a decrease in
EBITDA
71%had a negative
Operational Cash Flow
71%had a increase in net
debt
Consumer Services
(49 company financials reviewed)
D2D HY 18: 2.58 Change: (9.8)%
24%had a decrease in
revenue
47%had a decrease in
EBITDA
20%had a negative
Operational Cash Flow
57%had a increase in net
debt
Utilities
(25 company financials reviewed)
D2D HY 18: 2.38 Change: (9.2)%
31%had a decrease in
revenue
37%had a decrease in
EBITDA
31%had a negative
Operational Cash Flow
46%had a increase in net
debt
Media
(24 company financials reviewed)
D2D HY 18: 2.14 Change: (8.6)%
62%had a decrease in
revenue
44%had a decrease in
EBITDA
32%had a negative
Operational Cash Flow
44%had a increase in net
debt
Software and Services
(74 company financials reviewed)
D2D HY 18: 1.39 Change: (6.4)%
21%had a decrease in
revenue
46%had a decrease in
EBITDA
67%had a negative
Operational Cash Flow
56%had a increase in net
debt

12 Distance to default
© 2018 KPMG, an Australian partnership and a member firm of the KPMG network of independent member firms affiliated with KPMG International Cooperative (“KPMG International”), a Swiss entity. All rights reserved. The KPMG name and logo are registered trademarks or trademarks of KPMG International. Liability limited by a scheme approved under Professional Standards Legislation.
Across the ASX – ZombiesMaterials, Energy, and Information Technology companies still make up the majority of ‘Zombie’ companies (80 percent this period vs 81 percent at FY17).
The pressure point – a D2D score below 1.0
Companies closest to default (D2D score below 1.0) for 3 or more consecutive half-year periods are considered ‘zombies’ in this analysis. We consider these companies to be most at risk of default due to their persistent proximity to the default line (D2D score of 0). These companies may already be experiencing financial distress or working through restructuring strategies.
As mentioned earlier in this publication, 641 (36 percent) of companies analysed displayed a D2D score below 1.0. Of that more than half fall within our definition of ‘Zombies’ (361 companies).
$8.8 billion in stranded shareholder funds?
These companies have a combined market capitalisation of $8.8 billion. Whilst this represents but a fraction of the total ASX market capitalisation, one conclusion is that $8.8 billion in shareholder funds remains stranded until capital providers are able to restructure this capital and deploy it for better or higher return use.
49 percent of ‘Zombies’ are in Materials
The majority of Zombie companies continue to be explorers in materials and mining making up 49 percent of Zombie companies.
Many of these companies rely on capital raising via equity markets to continue operations / exploration and do not carry debt. Our analysis indicates that only 21 percent of Materials companies carry Net Debt. This indicates that to the extent that Zombie Materials companies are able to continue to raise equity to fund operations they will likely remain Zombies since, for the majority, an impending debt refinance (often the cause of a default) is unlikely to be required.
32 percent of ‘Zombie’ market capitalisation relates to Information Technology companies
Information Technology had a 26.7 percent increase in the number of companies displaying a D2D score below 1.0 for 3 or more half-year periods (from 30 to 38 companies). These companies now make up 10.5 percent of ‘Zombie’ companies and represent 32.3 percent of the potentially stranded capital that is ‘Zombie’ market capitalisation.
Materials
Energy
InformationTechnology
Healthcare
Financials
ConsumerDiscretionary
Industrials
Real Estate
Consumer Staples
Utilities
Telecommunication
Services
177 4.0
0.7
0.4
0.2
0.3
0.1
0.0
0.0
0.0
0.1
2.8
73
38
18
16
16
10
4
4
3
2
Companies(361 total)
Market capitalisation of ($8.8bn total)
Number of Zombie companies by sector and total market capitalisation

13Distance to default
© 2018 KPMG, an Australian partnership and a member firm of the KPMG network of independent member firms affiliated with KPMG International Cooperative (“KPMG International”), a Swiss entity. All rights reserved. The KPMG name and logo are registered trademarks or trademarks of KPMG International. Liability limited by a scheme approved under Professional Standards Legislation.
From 1 July 2018 ipso facto changes will have an impact on contract performance obligations when contracting with a distressed counterparty.
Ipso facto clauses are provisions in contracts that allow one party to terminate or modify the operation of a contract on the occurrence of an insolvency event, such as the appointment of an administrator.
Due to the potential value destruction by the enforcement of ipso facto clauses in any restructure, the Australian Government has introduced reforms, commencing on 1 July 2018, which limit the enforceability of ipso facto clauses in certain insolvency events.
Will your contracts be impacted?
The new provisions will only apply to contracts entered into or amended after 1 July 2018. Under these changes, an express right in a contract is not enforceable if the sole reason for the enforcement is that either:
– the company enters voluntary administration;
– the company has a receiver appointed over substantially all of its assets;
– the company is undertaking a creditors scheme of arrangement.
These changes, in effect, implement a stay on enforcement under the above scenarios. At the time of writing, legislators were seeking submissions on draft regulations and declarations concerning the application of the legislation. According to the Explanatory Memorandum to the Act, the stay is not intended to restrict a counter-party from enforcing a right for any other reason such as a breach of non payment or non performance.
What can companies do prior to 1 July 2018 to reduce their exposure to being forced to perform?
Companies should review and amend their contracts to ensure they are adequately protected in the event of a default, including appropriately managing their counterparty risk. Directors should be aware of their obligations and the impact that this reform will have on options available in the event that their counterparties seek insolvency protection.
How KPMG can assist
We can assist you with counterparty risk assessments prior to entering into contracts and amendments and provide advice on measures to mitigate risks and improve outcomes. Now more than ever due to these changes it is highly important to ‘Know your counterparty’.
Forced to perform?

© 2018 KPMG, an Australian partnership and a member firm of the KPMG network of independent member firms affiliated with KPMG International Cooperative (“KPMG International”), a Swiss entity. All rights reserved. The KPMG name and logo are registered trademarks or trademarks of KPMG International. Liability limited by a scheme approved under Professional Standards Legislation.
Ready to go with KPMGInspire a turnaround, execute a financial restructure, or understand options using solvency strategies with KPMG Restructuring Services.
14 Distance to default

15Distance to default
© 2018 KPMG, an Australian partnership and a member firm of the KPMG network of independent member firms affiliated with KPMG International Cooperative (“KPMG International”), a Swiss entity. All rights reserved. The KPMG name and logo are registered trademarks or trademarks of KPMG International. Liability limited by a scheme approved under Professional Standards Legislation.
In this rapidly changing environment, every company faces challenges. A step in the wrong direction can have significant effects on corporate performance and company value. KPMG’s integrated team of specialists guides you through difficult times to help deliver real results for your stakeholders.
Inspire a turnaround – view the eBook
To assist in overcoming operational or financial challenges and improve performance, you need to quickly stabilise your cash and liquidity positions and take a realistic view of current options. We can support your transformation with services that help you move from crisis to value realisation.
1 Option identification: How can I quickly and effectively assess all my options? (Fixing, selling or closing the company can all provide pockets of value). We frequently employ a Rapid Opportunity Diagnostic tool to facilitate discussions at the option identification stage to identify enterprise value uplift and cash release opportunities at deal speed. Our unique approach is focussed on identifying cash improvement, revenue upside and cost reduction opportunities in a risk-adjusted way.
2 Stabilisation: How can I stabilise the business and assess its financial position? (Transformation begins by identifying what needs to be done and who needs to do it).
3 Transformation Strategy: What financial impact might I realise through the various options? (A strong plan recognises stakeholder concerns and needs).
4 Execution: How can I execute my turnaround plan? (Rebuilding trust between the company and its stakeholders can be a key benefit of a well-executed plan).
5 Value Realisation: How can I make sure my plan delivers value? (Significant value can be realised – or lost – at this stage).
Financial restructuring: meet challenges head on – view the eBook
When a company is experiencing financial difficulties, stakeholders often look for additional information or resources to help rebuild their confidence. We can help you master financial restructuring with services designed to enhance value for both borrowers and lenders.
1 Appraisal and stabilisation: Do I have enough funding to keep operating while a solution is being developed and implemented? (Effective stakeholder communications is essential at each step to help ensure a successful outcome).
2 Options assessment: What do I need to do and when?
3 Stakeholder negotiations: How can I keep everyone fully engaged in negotiations? (Tolerable compromises should be considered on both sides of the table).
4 Development of solutions: What is the new capital structure? (Develop more than one plan to address possible contingencies).
5 Implementation: How can I implement the deal according to plan? (Make sure the new capital structure supports tax efficiency).
6 Ongoing monitoring: Am I out of the problem zone? (Sometimes more than one deal is needed to ‘get it right’).
Solvency strategies: make the complex manageable – view the eBook
When a company is in distress, the management team faces many competing challenges. We help create clear solvency strategies by assisting insolvent companies and providing support at every phase of insolvency.
1 Distressed corporates: How serious is the problem? (Now is the time to ask the hard questions).
2 Insolvency planning: What are my options? (Consider the relative merits of each option or combination of options).
3 Commencement: What needs to happen if/when my company is in a formal protection process? (The right communication can help you anticipate issues before they become problems).
4 Implementation: How can I maximise value? (Insolvency often requires a number of plans executed concurrently).
5 Exiting a Formal Process: How do I get back to normal? (For an insolvency company with limited funds, settlements are often preferable to expensive litigation).

The information contained in this document is of a general nature and is not intended to address the objectives, financial situation or needs of any particular individual or entity. It is provided for information purposes only and does not constitute, nor should it be regarded in any manner whatsoever, as advice and is not intended to influence a person in making a decision, including, if applicable, in relation to any financial product or an interest in a financial product. Although we endeavour to provide accurate and timely information, there can be no guarantee that such information is accurate as of the date it is received or that it will continue to be accurate in the future. No one should act on such information without appropriate professional advice after a thorough examination of the particular situation.
To the extent permissible by law, KPMG and its associated entities shall not be liable for any errors, omissions, defects or misrepresentations in the information or for any loss or damage suffered by persons who use or rely on such information (including for reasons of negligence, negligent misstatement or otherwise).
© 2018 KPMG, an Australian partnership and a member firm of the KPMG network of independent member firms affiliated with KPMG International Cooperative (“KPMG International”), a Swiss entity. All rights reserved.
The KPMG name and logo are registered trademarks or trademarks of KPMG International.
Liability limited by a scheme approved under Professional Standards Legislation.
May 2018. N16649MC.
KPMG.com.au
Contact us
Perth
Matthew WoodsPartner in Charge, Restructuring Services E: [email protected]: +61 8 9263 7515
Hayden WhitePartner, Restructuring ServicesE: [email protected]: +61 8 9263 4887
Clint Joseph Director, Restructuring Services
E: [email protected]: +61 8 9263 7126
Steve McCabe Director, Restructuring ServicesE: [email protected]: +61 8 9263 7294
Brendon Rew Director, Restructuring ServicesE: [email protected]: +61 8 9263 7147
Sydney
Carl GuntherPartner, Restructuring ServicesE: [email protected] P: +61 2 9335 7381
Gayle DickersonPartner, Restructuring Services
E: [email protected] P: +61 2 9295 3982
Stephen VaughanDirector, Restructuring ServicesE: [email protected] P: +61 2 9295 3899
Ben Brokken Director, Restructuring ServicesE: [email protected] P: +61 2 9346 6378
Angela Haynes Director, Restructuring ServicesE: [email protected] P: +61 2 8841 2150
Melbourne
Guy Edwards Partner, Restructuring ServicesE: [email protected] P: +61 3 9288 5665
Brendan Richards Partner, Restructuring ServicesE: [email protected] P: +61 3 9288 6484
David HardyDirector, Restructuring Services
E: [email protected] P: +61 3 9288 6928
Vince DimasiDirector, Restructuring ServicesE: [email protected] P: +61 3 8663 8974
Brisbane
Chris GiddensPartner, Restructuring ServicesE: [email protected] P: +61 7 3233 9419
James DicksonDirector, Restructuring ServicesE: [email protected] P: +61 7 3233 9508