distilleries company of sri lanka plc | annual report 2014
TRANSCRIPT

Distilleries C
ompany of Sri Lanka PLC
| Annual Report 2014 / 15
www.dcslgroup.com
110, Norris Canal Road, Colombo 10, Sri Lanka.Tel. +94 11 5507000 / 2695295-7
Fax: +94 11 2696360 Distilleries Company of Sri Lanka PLC l Annual Report 2014 / 15
DCSL is a legendary company with a heritage of over a hundred years; years we spent fine tuning and refining our classic range of arracks. Over the last two decades, we have diversified our business to include key growth sectors such as plantations, telecommunication, insurance, finance, textiles, power generation, leisure, logistics and media.
Today, as the market leader in the beverage industry, we continue to improve and expand our range of products to suit the changing tastes of consumers, while retaining the traditional flavour of pure coconut arrack.
We are proud of our reputation for quality and excellence, and we pledge to build on our distinguished history to create a distinctive future for the company and its stakeholders.
A distinguished
A distinctive
history.future.

Dist i l ler ies Company of Sr i Lanka PLC2
Contents
3 Highlights of the Year
4 Financial Highlights
6 A Diversified Portfolio of Business Operations
12 Historical Perspectives
14 The Story of Arrack
16 What’s behind Our Continuing Success?
22 Chairman’s Message
26 Board of Directors
30 Group Management
32 DCSL Management
34 Management Discussion & Analysis
43 Sustainability Report
55 Corporate Governance
67 Enterprise Risk Management
71 Audit Committee Report
73 Remuneration Committee Report
74 Annual Report of the Board of Directors
78 Statement of Directors Responsibility
79 Independent Auditors’ Report
Scan the QR code with your smart deviceto view this report online.
80 Statement of Profit or Loss and Other Comprehensive Income
81 Statement of Financial Position
82 Statement of Changes in Equity
85 Statement of Cash Flows
86 Notes to the Financial Statements
161 Statement of Value Added
162 Details of Real Estate
163 Shareholder Information
165 Ten Year Summary
166 DCSL Management Team
167 Group Directory
173 Notice of Meeting
175 Form of Proxy
177 Attendance Slip

Annual Report 2014/15 3
HighlightsOf The Year
May2014
November 2014
March 2015
November 2014
July 2014
December2014
July2014
Continental Insurance Lanka was assigned ‘A-(lka)’ / Stable by Fitch.
Melsta Regal won the bronze in SLIRTAD People Development Award 2014.
Fitch Rating reaffirmed DCSL a national long term Rating of AAA (lka) / stable outlook - the best & highest entity credit rating for a corporate in Sri Lanka.
DCSL was ranked No. 06 in the Business Today ‘Top Twenty Five’. This was the 16th consecutive year DCSL was listed among corporate heavy weights in the rankings.
Melsta Regal Finance was reaffirmedA+ (lka) / Stable by Fitch, thus signifying a very high credit rating for a finance company.
Melsta Regal Finance opened its Branch in Negombo.
DCSL’s ultra modern state-of-the-art fully automated plant in Seeduwa was declared open by his Excellency Dr. Jürgen Morhard the Ambassador of the Federal Republic of Germany to Sri Lanka
May2014
November 2014
March 2015
November 2014
July 2014
December2014
July2014
Dist i l ler ies Company of Sr i Lanka PLC4
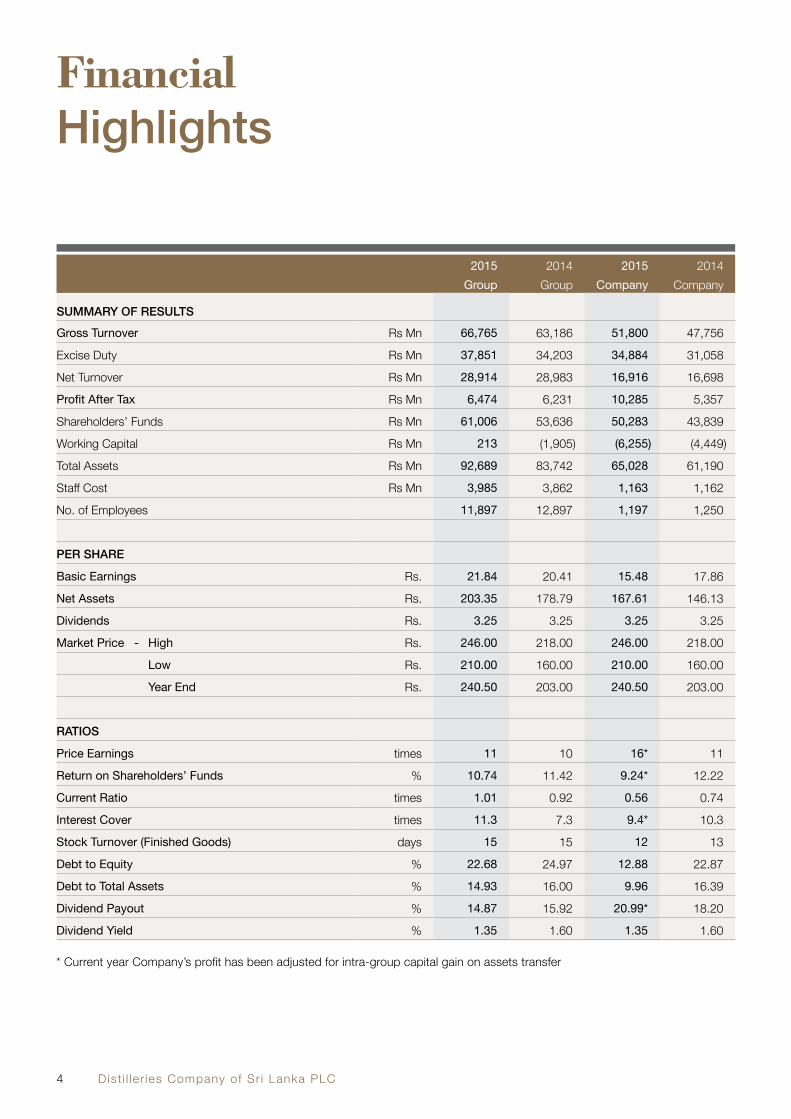
FinancialHighlights
2015 2014 2015 2014Group Group Company Company
SUMMARY OF RESULTS
Gross Turnover Rs Mn 66,765 63,186 51,800 47,756
Excise Duty Rs Mn 37,851 34,203 34,884 31,058
Net Turnover Rs Mn 28,914 28,983 16,916 16,698
Profit After Tax Rs Mn 6,474 6,231 10,285 5,357
Shareholders’ Funds Rs Mn 61,006 53,636 50,283 43,839
Working Capital Rs Mn 213 (1,905) (6,255) (4,449)
Total Assets Rs Mn 92,689 83,742 65,028 61,190
Staff Cost Rs Mn 3,985 3,862 1,163 1,162
No. of Employees 11,897 12,897 1,197 1,250
PER SHARE
Basic Earnings Rs. 21.84 20.41 15.48 17.86
Net Assets Rs. 203.35 178.79 167.61 146.13
Dividends Rs. 3.25 3.25 3.25 3.25
Market Price - High Rs. 246.00 218.00 246.00 218.00
Low Rs. 210.00 160.00 210.00 160.00
Year End Rs. 240.50 203.00 240.50 203.00
RATIOS
Price Earnings times 11 10 16* 11
Return on Shareholders’ Funds % 10.74 11.42 9.24* 12.22
Current Ratio times 1.01 0.92 0.56 0.74
Interest Cover times 11.3 7.3 9.4* 10.3
Stock Turnover (Finished Goods) days 15 15 12 13
Debt to Equity % 22.68 24.97 12.88 22.87
Debt to Total Assets % 14.93 16.00 9.96 16.39
Dividend Payout % 14.87 15.92 20.99* 18.20
Dividend Yield % 1.35 1.60 1.35 1.60
* Current year Company’s profit has been adjusted for intra-group capital gain on assets transfer

Annual Report 2014/15 5
46,451 63,125 65,790 63,186 66,765(Rs. Mn)Gross Turnover - Group
2010/11 2011/12 2012/13 2013/14 2014/15
8,337 6,052 5,258 6,231 6,474(Rs. Mn)Profit After Tax - Group
2010/11 2011/12 2012/13 2013/14 2014/15
59,616 73,355 78,547 83,742 92,689Total Assets - Group(Rs. Mn)
2010/11 2011/12 2012/13 2013/14 2014/15
29,004 39,076 39,850 37,466 41,106Taxes Paid - Group(Rs. Mn)
2010/11 2011/12 2012/13 2013/14 2014/15

Dist i l ler ies Company of Sr i Lanka PLC6
A Diversified Portfolio ofBusiness Operations
Beverages
Plantations
Distillation, Manufactureand Distribution of Liquor Products
Cultivation & Processing of Tea & Rubber

Annual Report 2014/15 7
Telecommunication
InsuranceGeneral Insurance Services - Property, Motor, Marine, General Accident
Voice, Data, Broadband, Hardware, Software andNetworking Solutions

Dist i l ler ies Company of Sr i Lanka PLC8
A Diversified Portfolio ofBusiness Operations
Power GenerationHydro Power Generation
Financial ServicesVariety of innovative Financial Solutions under one roof.
Bogo Power (Pvt) Ltd.

Annual Report 2014/15 9
LogisticsAutomobile Servicing and Logistics
TextilesDyeing and Printing Fabric

Dist i l ler ies Company of Sr i Lanka PLC10
MediaMedia Buying & Creative Services
BPO ServicesBPO, KPO & Call Centre Services
A Diversified Portfolio ofBusiness Operations

Annual Report 2014/15 11
LeisureHotels & Hospitality
BeveragesWines & Spirits

Dist i l ler ies Company of Sr i Lanka PLC12
HistoricalPerspectiveTouching lives for over a century…Present in Sri Lanka for over a century, The Distilleries Company of Sri Lanka PLC (DCSL), is one of the most profitable and well respected corporate entities in the country. Its proud tradition, rich heritage and proven credentials have made the Company a beacon of inspiration for others. Over the past 100 years, our corporate DNA has been strengthened with our values of experience, maturity, innovation, resilience and the determination to succeed.
DCSL’s roots can be traced back to 1913, when the Excise Department of Ceylon, which was initially created as the enforcement authority to distribute and sell liquor products in Sri Lanka, branched out into the distillation and manufacture of liquor products. In 1974, the State Distilleries Corporation was incorporated by statute, to take over this venture, while the Excise Department realigned its operations as a monitoring body. Thus, DCSL has the distinction of being the pioneer distiller in Sri Lanka.
In 1989, under a government policy decision, the State Distilleries Corporation was converted into a limited company. This transfer of ownership took place at the Colombo Stock Exchange (CSE) in 1992, making it the largest transaction in the history of the CSE.
Under its new private management, the Company entered an era of modernisation that witnessed upgrading of machinery and equipment and the introduction of modern management systems and processes. Plant and machinery were upgraded to modern international standards and new technology developed by world renowned experts was introduced. Large investments have also been made in Research and Development (R&D) and in upgrading laboratories.

Annual Report 2014/15 13
These improvements have equipped the Company with top of the line facilities enabling it to produce beverages of international standard. Furthermore, storage facilities and product distribution systems have been upgraded to modern standards with fully computerised systems. A fleet of modern vehicles ensures that customers in even the remotest areas are able to enjoy the best DCSL products delivered island wide. These improvements contributed towards higher production efficiencies across the supply chain. Our people are regularly trained in the best international practices in locations famed for high quality alcohol, such as France, Scotland and Ireland.
Over the years, we have not only grown to become Sri Lanka’s largest distiller, but have been recognised as a leading corporate with the highest quality standards. Despite these achievements and our strong position of business leadership, we continue to look for ways to improve and grow. Since 1992, the Company has not only expanded production, but has also diversified into other non-alcohol related activities.
Today, we are present in all parts of the country, operating under the principle of providing the highest standard of products and services for the people of Sri Lanka, imbued with a vision of uplifting the quality of life of our people. We aim to expand our presence into international markets to render our brand an internationally recognised one.
The newly installed ultra modern state-of-the-art fully automated plant (pictured below) will ensure that only products of the highest quality reach the consumer.

Dist i l ler ies Company of Sr i Lanka PLC14
The Storyof Arrack
The Sri Lankan flavour that lingers on…
The pristine ambrosia-like qualities of Sri Lanka’s unique coconut arrack can be traced back thousands of centuries earlier, finding mention in early literature - “…liquor drawn from the coconut flower”. This delectable beverage is steeped in legend and tradition, making it one of the most prised offerings from Sri Lanka to the world.
The Sri Lankan coconut arrack is believed to be one of the purest, naturally derived alcoholic beverages in the world distilled through a natural fermentation process. Sri Lanka has perfected the technique of making coconut arrack through the years. Today, it has acquired the perfect balance for the discerning palate and coconut arrack reigns as the alcoholic beverage of choice in the country.
The initial step in the process of making coconut arrack is toddy tapping, an age-old vocation which is lovingly passed down from father to son. Toddy Tapping is as much an intricate art as it is a science. Toddy tappers manually extract the toddy from coconut trees which are coupled and girdled by deftly rappelling from tree to tree. Coconut sap or toddy
is obtained by tapping the unopened coconut flower for its nectar. Thereafter, the toddy is collected in earthenware pots. This toddy when fresh contains much sugar, but yeasts, microscopic vegetable organisms soon find their way into it, act on the sugar present and produce alcohol. This process of converting the sugar into alcohol is called fermentation. After a minute filtration process, this liquor is poured into massive casks made of Halmilla wood and are gently transported to our factories for distillation.
The process of distillation comprises of two stages; continuous distillation (patent still distillation) and pot distillation. This distillation process is usually completed within 24 hours. The purified spirit comes out with the distinctive flavour of arrack, ready to be savoured.
The contents of the wooden vats are mixed artfully every fortnight for better aeration and to increase contact with the wood. Herbs and spices from ancient recipes are also added at particular stages, to enhance flavour and mellow the liquor during the crucial maturation process. The maturation process is completed after flavour enhancing and smoothening while ageing in the wooden vats.

Annual Report 2014/15 15
“Sri Lankan coconut arrack, acknowledged as one of the purest alcoholic beverages in the world is extracted by an all-natural fermentation process.”
Finally, spirits of different ages and flavours are blended to create the various DCSL brands, all under the careful supervision of an experienced connoisseur and Master Blender. As the largest coconut arrack distillery in Sri Lanka, possibly even in the world, this golden brew remains our pride and flagship product.
“This delectable beverage is steeped in legend and tradition, making it one of the most prised offerings from Sri Lanka to the world.”
“This delectable beverage is steeped in legend and tradition, making it one of the most prised offerings from Sri Lanka to the world.”

Dist i l ler ies Company of Sr i Lanka PLC16
What’s behindOur ContinuingSuccess?
A 100% coconut spirit, refined, aged and matured in Halmilla vats - giving a woody & natural vanilla flavour
Superior blend of mellow 100% coconut arrack full of character and a distinctive flavour stemming from the traditional process of maturing
Twice distilledin pot stills andmatured slowly inHalmilla vats givinga remarkable tasteand aroma
A blend of coconut spirits and imported neutral spirits bringing herbal flavours with a distinctively rich taste and smooth aroma
Tradition Served with Pride
A blend of 100% aged coconut spirits, well-matured in Halmilla vats to give a taste of oak

Annual Report 2014/15 17
A 100% coconut spirit, matured in Halmilla vats, producing a woody character and exceptional smoothness
A 100% pure coconut spirit, which brings out the full-bodied taste and aroma of desiccated coconut with a subtle sweetness. Best served as a cocktail mixer
Crystal clear and an absolutely pure blend of coconut arrack and neutral spirits giving a tint of fresh lime with a slight burning sensation on your tongue
Finest blend of matured coconut arrack and neutral spirits giving a rich and smooth flavour
A blend of coconut and imported neutral spirits bringing a distinctively rich and smooth flavour

Dist i l ler ies Company of Sr i Lanka PLC18
What’s behindOur ContinuingSuccess?
Exceptional selection of spirits blended to create a great rum, matching international standards
A combination of scotch and fine spirits to produce a rich blend of whisky
Unique premium blended arrack, smooth on the palate with pleasant aromas
Premium blend of malts and fine spirits to produce this classic whisky
Unique variety of imported spirits that combines together to produce an international standard vodka
World Class Blends, Distinctly Sri Lankan

Annual Report 2014/15 19
Flavour of apple with fine imported spirits which provides a rich apple aroma with a smooth apple flavour on the palate
Aged fine French brandy blended with fine spirits matured in vats to enhance the smooth characters of a superior brandy
A blend of finest French brandy merged with fine spirits to bring out a unique flavour that is incomparable
Fine spirits blended with a rich recipe flavoured with lemon
Flavour of mango with fine imported spirits that combines tempting aromas and flavours of rich mango

Dist i l ler ies Company of Sr i Lanka PLC20
GRAND CHAIS DE FRANCE
Founded in 1979, our family company “Les Grand Chais de France” has built its reputation upon the simple motto… “Des Hommes, des terriors, une passion” As the owners of over 30 domains and chateaux in some of the greatest French appellations, as well as being an influential player in the Bordeaux market for Grand Crus Classe, we hope that our customers will benefit from our 20 years experience in wines and spirits
ALBERT BICHOT
“THE EPIC STORY” OF A GREAT HOUSEFrom 1350, the Bichot family was established in Burgundy, with a deer as a symbol. It was only in the XIXth century that the family ventured into the wine business, when Bernard Bichot found in 1831, a wine brokerage. The family heritage has been passed down from father to son until now. Since 1996, Albéric Bichot has represented the 6th generation to run the House.
SOMERTON
The Somerton range reflects the bright fruit flavours that are the hallmark of Australia’s sunny climate regions at incredible value for money.
NAPOLÉON 1875
French traditional brandy is made from the finest wine eaux-de-vie, rigorously selected by the master and aged for a minimum of 12 months in oak casks, until perfectly matured. Its beautiful amber colour, unique woody bouquet, full and soft palate and communicative warmth at the finish, are all thanks to the oak ageing. Can be drunk as an aperitif or after-dinner.
WINCARNIS - TONIC WINE
First produced in 1887, Wincarnis Tonic Wine is a natural tonic, incorporating an unique infusion of herbs and spices. It is also rich in vitamins, especially energy-giving Vitamins. Usually enjoyed straight, Wincarnis Tonic Wine can also be mixed with gin to make a ‘Gin and Win’.
What’s behindOur ContinuingSuccess?Premium Brands from Around the World
Annual Report 2014/15 21
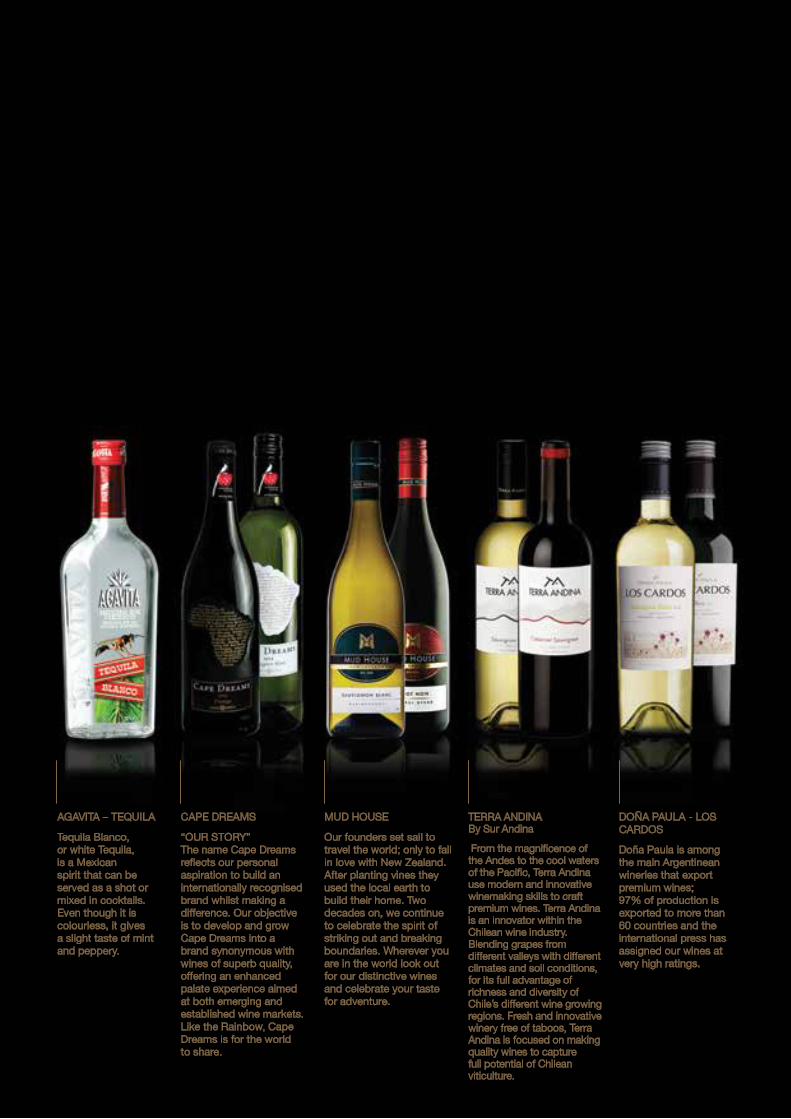
AGAVITA – TEQUILA
Tequila Blanco, or white Tequila, is a Mexican spirit that can be served as a shot or mixed in cocktails. Even though it is colourless, it gives a slight taste of mint and peppery.
CAPE DREAMS
“OUR STORY”The name Cape Dreams reflects our personal aspiration to build an internationally recognised brand whilst making a difference. Our objective is to develop and grow Cape Dreams into a brand synonymous with wines of superb quality, offering an enhanced palate experience aimed at both emerging and established wine markets. Like the Rainbow, Cape Dreams is for the world to share.
MUD HOUSE
Our founders set sail to travel the world; only to fall in love with New Zealand. After planting vines they used the local earth to build their home. Two decades on, we continue to celebrate the spirit of striking out and breaking boundaries. Wherever you are in the world look out for our distinctive wines and celebrate your taste for adventure.
TERRA ANDINABy Sur Andina
From the magnificence of the Andes to the cool waters of the Pacific, Terra Andina use modern and innovative winemaking skills to craft premium wines. Terra Andina is an innovator within the Chilean wine industry. Blending grapes from different valleys with different climates and soil conditions, for its full advantage of richness and diversity of Chile’s different wine growing regions. Fresh and innovative winery free of taboos, Terra Andina is focused on making quality wines to capture full potential of Chilean viticulture.
DOÑA PAULA - LOS CARDOS
Doña Paula is among the main Argentinean wineries that export premium wines; 97% of production is exported to more than 60 countries and the international press has assigned our wines at very high ratings.

Dist i l ler ies Company of Sr i Lanka PLC22
Chairman’sMessageI am pleased to share with you, our valued shareholders, the company’s annual report and audited financial statements for the year ended 31st March 2015.
During this period, your company continued its pursuit of growth and expansion. In the face of persisting unfair practices favouring a few unscrupulous elements, we continue to operate in an industry which has not offered a level playing field in years. With the determination and hard work of our staff, we have managed to deliver value to our shareholders and other stakeholders without compromising on our credo of fair play and ethical operations.
Although key indicators of the economy were favourable for growth, due to these reasons your company was unable to maximise the potential we know we can deliver.
Macro Economic ClimateDespite an uncertain global economy and rising geo political tension in the Middle-East, Sri Lanka exhibited a strong performance against key economic indicators. GDP growth rate maintained its steady momentum, making ours one of the few economies displaying consistent growth in the region. All sectors of the economy performed strongly except for agriculture, which was adversely impacted by erratic weather patterns. Meanwhile, the regulators continued to ease monetary policy, resulting in low interest rates and record low inflation levels during the period. Sri Lanka’s economic growth forecast for the next year seems optimistic, alongside a favourable uptick in the global economy as well.
Group Financial Performance During the financial year under consideration, Gross Revenue of the Group was Rs. 66.8 Bn, while the Group Profit after Tax for the year was Rs. 6.5 Bn. The Group contributed Rs. 41.1 Bn in taxes to the national exchequer during this financial year.
Persistent Obstacles in our PathAs the market leader in our segment and a company in existence for over 100 years, DCSL’s credentials as a responsible corporate citizen are beyond question. However, we are sorry to witness the continuation of unfair and illegal practices in the industry, taking place under the very nose of the enforcement authorities despite our repeated efforts to bring these to their notice. Although all our representations to authorities seem to be falling on deaf ears, we will continue to spotlight these negative practices which are harming the industry and preventing it from achieving the status of an industry that is a key contributor to the state revenue.
DCSL adheres to all the laws and tenets imposed on the alcoholic beverage business and is one of the largest tax payers in the country. However, when it comes to some others in the industry, the opposite holds true. Malpractices such as non-invoiced and tax unpaid alcohol abound, negating the rules and regulations on which a legitimate alcoholic beverage businesses is based. Although this business might be looked at negatively by certain socio-religious quarters, it is a legitimate industry, licensed by the state. However, some unscrupulous elements bring infamy and allegations of corruption to the industry, due to their illegal practices, which impact legitimate businesses such as ours, which pay all taxes in accordance with the laws of the land. What is perplexing is the fact that the state refuses to intervene, despite losing millions of rupees in excise taxes due to these players who evade such taxes through various devious means.
A new breed of unscrupulous traders has emerged in the recent past. With the help of law makers, they import ethanol under the guise of other products and thereby flood the market. Law makers also became producers, and sadly, the department tasked with policing the industry also helps such people to produce tax unpaid liquor. Licenses were granted to a few law makers to import ethanol under the guise of eau de cologne which leaked into the market, while DCSL maintained its quality and price. These imports went into unlawful hands and the market was flooded with low retail price products which could not have been possible had all the legitimate duties been paid.
The industry as a whole is highly regulated and as a legitimate entity, we comply with all the rules and regulations laid down by the National Authority on Tobacco and Alcohol (NATA) Act. The act mandates that companies will not advertise or promote their products in any form and in any medium; that they will not directly or indirectly lure young people into alcoholism; and never, under any circumstance, target children. However, most of the players in the industry openly flout the NATA Act by indulging in various barely disguised advertising and promotional activities while authorities repeatedly turn a Nelsonian eye to such illegal practices.
Rs. 41 BnTaxes paid
11,897Employees

Annual Report 2014/15 23
D. H. S. JayawardenaChairman / Managing Director
Dist i l ler ies Company of Sr i Lanka PLC24
Chairman’sMessageA unique and traditional Sri Lankan industry which has been passed down generation to generation over the centuries is today an endangered industry. This sorry state of affairs is the direct result of the proliferation of illegal, artificial toddy manufacturers, who feed the illegal alcoholic beverage business by producing cheap artificial toddy, unfit for human consumption. As a result, traditional toddy suppliers, who are unable to compete with such low cost artificial toddy, are finding that their rich legacy is becoming unsustainable. Amidst the barren wasteland of illegal practices and disregard for tradition, DCSL remains the only company producing 100% natural coconut arrack using 100% pure coconut toddy distilled at our own distilleries, providing consumers a 100% natural product. DCSL has strengthened procedures by appointing qualified personnel to inspect every barrel of toddy, in order to detect any form of adulteration and extraneous matter in the toddy. We are single-handedly nurturing the traditional toddy tapping custom although only a handful of such genuine tappers remain in existence. Even though we lack trained toddy tappers, the Department of Excise is not focusing on this issue to help the industry and to ensure the production of genuine coconut toddy.
All around us we see that the rest of the toddy market is transforming into an artificial one, where vast quantities of sugar, ammonia, yeast, salt, rotten potatoes, sugar syrup and remnants of toddy sludge are being used in the manufacture of artificial toddy. The addition of these unhealthy and artificial ingredients renders the natural form of fermentation extinct, putting consumers at risk. This is a calamity in the industry and it is high time that the generations old Excise Ordinance is evaluated and modified to meet the challenges of the present day.
While one may overlook the responses from the Government bodies, it is not possible for responsible corporate citizens in the country to remain silent and watch the open transgression of the law by those who should be protecting and upholding the law. The enactment of Excise Notification 926, whereby a transferor could transfer a FL(4) license to a transferee for Rs. 1,500,000/- and Rs. 200,000/- for other types of licenses, opened the flood gates for unprincipled manufacturers who embraced this unfortunate regulation and obtained licenses in the names of their kith and kin, thereby finding a channel to dispose of their non-invoiced, tax unpaid liquor with ease. It is pathetic to observe that although the conditions of the manufacturing license indicate that a manufacturer is prohibited from holding any interest in the retail sale of liquor, this condition is blatantly violated under the very noses of the excise authorities. Some manufacturers have taken over 233 retail licenses out of a total of 1000, approximately 23%, which indicates how rampant corruption has spread like a disease in the sector. It has come to light
that some unscrupulous manufacturers are planning to purchase the remaining retail licenses at exorbitant prices which will further impact state revenue from excise earnings. It is disheartening to note that although this industry provides the state with enormous revenue, the Government does little or nothing to prevent such abuses.
It is observed that in the North and East tax unpaid and non invoiced liquor is largely available in the market, at prices 30% to 40% less than a product on which all taxes have been paid. Such businesses are carried out with the help of the officers of the state acting on behalf of these criminal parties instead of defending state laws. DCSL has brought these issues to the notice of the regulator who turns a blind eye and is yet to take any measured steps to bring wrongdoers to book.
In the recent past, a shocking disclosure surfaced-when perusing the price list of some players. The wholesale price of a 750ml bottle of Extra Special Arrack is Rs. 688/- . This is not credible when the excise duty component alone is Rs. 658/- leaving only Rs. 29/- to cover the cost of spirits, label, bottle, cap, labour, transport, overheads and profit. Obviously these products have not been declared for excise duties and eventually find their way to the retail liquor shops run by these unscrupulous manufacturers, depriving billions of rupees of revenue to state coffers. In addition to this fraud, in order to maximise their profit, these parties channel such products to the market offering very attractive incentives to licensees.
Considering that we have successfully sustained our operations for over 100 years, your company remains invested in and upbeat about the prospects for the alcoholic beverage sector. During this year, our Rs. 6 Bn investment in a state-of-the-art blending and bottling plant has resulted in improved capacity, modern packaging and presentation and greater prevention of the possibility of adulteration of our products. This ultra modern plant has fully automated manufacturing operations resulting in higher productivity and greater efficiency at reduced cost to meet current demand.
DCSL complies with stringent quality controls along its product chain. The company has installed advanced R&D capability in modern fully-equipped laboratories to ensure that its products are at the cutting edge of the industry. We continue to enjoy Fitch Ratings assigned long term rating of AAA (lka) with a stable outlook, the highest possible credit rating, which places your company amongst the few exclusive corporates in Sri Lanka who enjoy such ratings. Our fully-owned subsidiary, Periceyl, is working tirelessly to provide customers with the trendiest portfolio of brands, both local and foreign.

Annual Report 2014/15 25
Diversified PerformanceWith regard to other Group business interests, our telecommunication arm Lanka Bell recorded a loss due to challenges experienced in the sector. However, Lanka Bell has a positive EBITDA despite many companies reporting negative growth. We have already taken initiatives to break-even and have established foreign collaboration to enhance the product. We are buoyed by future prospects for the business as we have acquired 4G LTE technology, which will propel the company to the forefront of the country’s data revolution. I expect the company to make a positive contribution to Group revenue in the future by becoming a front runner in the data sector.
Meanwhile, Balangoda Plantations experienced a drop in revenue to Rs. 3 Bn and had an adverse effect on the profitability contributing to a pre-tax loss of Rs. 106 Mn against a backdrop of wage increases and drop in revenue. We are glad to state that our hydro power project, Bogo Power, which was commissioned in December 2011, is now yielding encouraging results for the Group. DCSL Group is also encouraged by the progressive results achieved by our key associate company, Aitken Spence during the financial year.
In July 2014, the Group increased its investment in Continental Insurance to Rs. 750 Mn Established as one of the most innovative and dynamic insurance companies in Sri Lanka, Continental Insurance holds great potential for the future and its (A-) Fitch rating reflects the financial stability of the Company. The insurance industry is a fiercely contested space. However, companies that can position themselves perfectly have much potential for growth.
Melsta Regal Finance embarked on its second year of operations with a focus on penetrating the market with innovative financial solutions. Melsta Regal, A+(lka) rated finance house, achieved noteworthy milestones in terms of asset size and achieved a balance sheet size of Rs 5 Bn and earned pre-tax profit of Rs. 100 Mn during the year.
The uncertainties surrounding the status of our subsidiary, Pelwatte Sugar Industries continues to weigh upon the Group. Following the occupation of the factory by state officials, the ownership of this property remains unresolved. The Group has not changed its position, advocated since the occurrence of this unfortunate incident, of being the legal owner of the property and as such we have communicated our views to the Treasury. However, as a precautionary measure, the Group has also lodged an official claim with the Compensation Tribunal appointed by the State. We hope that some clarity regarding this untoward situation would be forthcoming during the new financial year, after the General Election.
With regard to Sri Lanka Insurance Corporation Ltd. (SLIC), even after a lapse of 6 years, we still await the payment of profit earned during DCSL Group’s tenure at the helm of SLIC. We are hopeful that the profit earned, which has to be paid to us as per the Supreme Court directive, will be reimbursed to us as early as possible.
DCSL has complied with the Listing Rules of the Colombo Stock Exchange and the Code of Best Practices on Corporate Governance issued by the Securities and Exchange Commission and the Institute of Chartered Accountants of Sri Lanka. We are committed to the furtherance of best Corporate Governance principles. The measures taken in this regard are set out in the Corporate Governance Report.
AppreciationI take this opportunity to thank the Board of Directors for their unstinted support and the management and staff for their single-minded pursuit of profitability for the Group against all odds.
During the year, the Board was deeply saddened at the passing away of our fellow director Mr. C. F. Fernando who was the chairman of the Audit Committee too. His tenure on the Board was of much value to the Company.
We also lost a valued team member with the demise of Maj. Gen. Siri Peiris (Retd.), Head of Southern Region who was with us over 15 years and who performed a wonderful job to keep the DCSL flag flying despite the stiff competition from the illegal operators.
I would also like to thank our valued shareholders for placing their confidence in the Group. Our strength lies in the loyalty shown by our customer base and other stakeholders, who continue to inspire us to retain our position as one of the most valuable and respected corporate entities in the country.
D. H. S. Jayawardena Chairman / Managing Director
25 August 2015

Dist i l ler ies Company of Sr i Lanka PLC26
Board ofDirectors
1. Mr. D. H. S. Jayawardena Chairman / Managing Director
2. Mr. C. R. Jansz Executive Director
3. Mr. N. de S. Deva Aditya DL, FRSA Independent Non-Executive Director
4. Capt. K. J. Kahanda (Retd.) Executive Director
1.
3.
2.
4.
1. Mr. D. H. S. Jayawardena Chairman / Managing Director
2. Mr. C. R. Jansz Executive Director
3. Mr. N. de S. Deva Aditya DL, FRSA Independent Non-Executive Director
4. Capt. K. J. Kahanda (Retd.) Executive Director

Annual Report 2014/15 27
5. Dr. Naomal Balasuriya MBBS [Sri Lanka], MBA [Sri.J], CIM [UK], MCGP
[SL], MSLIM, MIMSL Independent Non-Executive Director
6. Mr. D. Hasitha S. Jayawardena BBA (Hons) (UK) Non-Independent Non-Executive Director
7. Ms. V. J. Senaratne Attorney-At-Law, Notary Public, Solicitor (Eng.& Wales) Alternate Director to K. J. Kahanda / Company
Secretary and Chief Legal Officer
8. Mr. Amitha Gooneratne FCA (SL), FCA (Eng. & Wales) Alternate Director to N. de S. Deva Aditya
5.
7. 8.
6.
5. Dr. Naomal Balasuriya MBBS [Sri Lanka], MBA [Sri.J], CIM [UK], MCGP
[SL], MSLIM, MIMSL Independent Non-Executive Director
6. Mr. D. Hasitha S. Jayawardena BBA (Hons) (UK) Non-Independent Non-Executive Director
7. Ms. V. J. Senaratne Attorney-At-Law, Notary Public, Solicitor (Eng.& Wales) Alternate Director to K. J. Kahanda / Company
Secretary and Chief Legal Officer
8. Mr. Amitha Gooneratne FCA (SL), FCA (Eng. & Wales) Alternate Director to N. de S. Deva Aditya
Dist i l ler ies Company of Sr i Lanka PLC28
Board ofDirectors1. Mr. D. H. S. Jayawardena Chairman / Managing Director
Mr. Harry Jayawardena is one the most successful and prominent business magnates in Sri Lanka. He was elected Chairman of the DCSL Group in 2006 after serving as its Managing Director for almost two decades. He heads many successful ventures in diversified fields of business. He is the founder Director and the present Chairman / Managing Director of the Stassen Group of Companies.
He is the Chairman of Aitken Spence PLC., Aitken Spence Hotel Holding PLC., Lanka Milk Foods (CWE) PLC., Madulsima Plantations PLC., Milford Exports (Ceylon) (Pvt) Ltd., Ceylon Garden Coir (Pvt) Ltd., Ambewela Products (Pvt) Ltd., Ambewela Livestock Co. Ltd., Danish Dairy Products Lanka (Pvt) Ltd., Lanka Dairies (Pvt) Ltd., Melstacorp Ltd. and its subsidiaries; Balangoda Plantations PLC., Browns Beach Hotels PLC., Lanka Bell Ltd., Periceyl (Pvt) Ltd., Bogo Power (Pvt) Ltd. and Texpro Industries Ltd.
He is a former Director of Hatton National Bank PLC., the largest listed bank in Sri Lanka and former Chairman of Ceylon Petroleum Corporation and SriLankan Airlines.
Mr. Jayawardena is the Honorary Consul for Denmark and was the only Sri Lankan honoured with the prestigious “Knight’s Cross of Dannebrog’ by Her Majesty, Queen Margrethe II of Denmark, for his significant contribution to the Danish arts, sciences and business life.
He has also been awarded the title, “Deshamanya” in recognition of his services to the Motherland, since November 2005.
2. Mr. C. R. Jansz Executive Director
Mr. C. R. Jansz has many years of experience in Logistics and in Documentation, Insurance, Banking and Finance relating to international trade.
He is the Chairman of DFCC Bank PLC and DFCC Vardhana Bank. He serves on the Board of Melstacorp Limited, Balangoda Plantations PLC., Lanka Bell Limited and several other companies of the Distilleries Group. He is also a Director of Lanka Milk Foods (CWE) PLC. and its subsidiaries.
He was the former Chairman of Sri Lanka Shippers Council and former member of the National Trade Facilitation Committee of Sri Lanka. Mr. Jansz holds a Diploma in Banking and Finance from the London Guildhall University – UK. He is a Chevening Scholar and a UN-ESCAP Certified Training Manager on Maritime Transport for Shippers.
3. Mr. N. de S. Deva Aditya DL, FRSA Independent Non-Executive Director
Mr. Niranjan Deva Aditya, is an aeronautical engineer, scientist and economist, is a Conservative Member of the European Parliament elected from the SE England. He is the Vice President of the Development Committee; ECR Coordinator and Conservative Spokesman for Overseas’ Development and Co-operation.
He was the Co Leader of the Parliamentary Delegation to the UN World Summit and General Assembly 2006, Chairman Working Group A of Development Committee overseeing Asia, Central Asia and Far East; - Co Co-ordinator Assembly of 79 Parliaments of the EU-ACP 2004 and the President EU India Chamber of Commerce from 2005. In 2012 he stood for and came runner up, beating the Liberal candidate into 3rd place to be the President (Speaker) to the European Parliament. He was the first Asian to be elected as a Conservative Member of British Parliament, first Asian MP to serve in the British Government as PPS in the Scottish Office and first Asian born MP to be elected to the European Parliament. He was nominated as a candidate to succeed Kofi Annan as Secretary General to the UN in 2006.
He is a Hon. Ambassador without portfolio for Sri Lanka; the first Asian to be appointed as Her Majesty’s Deputy Lord Lieutenant for Greater London, representing The Queen on official occasions since 1985; awarded the honour “ViswaKirthi Sri Lanka Abhimani“ by the Buddhist Clergy for his Services to Sri Lanka and given the Knighthood with Merit of the Sacred Constantinian Military Order of St. George for his global work on poverty eradication. He is a Fellow of the Royal Society for Arts, Manufacture and Commerce (Est: 1765).
4. Capt. K. J. Kahanda (Retd.) Executive Director
Captain Kahanda joined the Company in 1993 as Regional Manager (Central Region) and was appointed a Director in December 2006. Being a former officer of the Sri Lanka Army, he spearheaded the re-organisation of the operations of the Central Region since privatisation. He specialises in logistics, distribution and security matters, and is also a Director of G4S Security Services (Pvt) Ltd. and Pelwatte Distilleries (Pvt) Ltd., a subsidiary of the Group.

Annual Report 2014/15 29
5. Dr. Naomal Balasuriya MBBS [Sri Lanka], MBA [Sri.J], CIM [UK], MCGP [SL], MSLIM, MIMSL Independent Non-Executive Director
Dr. Naomal Balasuriya, a medical doctor turned-entrepreneur is internationally sought after as a life changing motivational speaker. His professional expertise ranges from medicine, military, management, marketing, mentoring to motivational speaking. He holds both the Master of Business Administration (MBA) and CIM (UK) qualifications. Having worked in the government sector, private sector and the Sri Lanka Air Force as a medical doctor, he now leads his entrepreneurial training company, Success Factory. He is also a Director of Melstacorp Ltd., a subsidiary of the Group.
6. Mr. D. Hasitha S. JayawardenaBBA (Hons) (UK)Non-Independent Non-Executive Director
Mr. Hasitha Jayawardena holds a Bachelor’s Degree in Business Administration BBA (Hons) from the University of Kent in the United Kingdom.
Mr. Jayawardena joined Stassen Group in February 2013. He is a Director of Stassen Exports (Pvt) Ltd., Milford Exports (Ceylon) (Pvt) Ltd., Stassen International (Pvt) Ltd., Stassen Natural Foods (Pvt) Ltd., Ceylon Garden Coir (Pvt). Ltd., Milford Developers (Pvt) Ltd., Stassen Foods (Pvt) Ltd., C. B. D. Exports (Pvt) Ltd., Zahra Exports (Pvt) Ltd. and Mcsen Range (Private) Ltd. He was appointed to the Board of Meltsacorp Ltd. in January 2015 and Periceyl (Pvt) Ltd. in April 2015.
Mr. Jayawardena has also worked as an Intern at the Clinton Global Initiative programme (CGI) in New York in 2007.
7. Ms. V. J. Senaratne Attorney-At-Law, Notary Public, Solicitor (Eng.& Wales) Alternate Director to K. J. Kahanda / Company Secretary and Chief Legal Officer
Ms. Senaratne was appointed as the Company Secretary in 1993. She was admitted to the Bar in 1977 and was enrolled as a Solicitor (England & Wales) in June 1990. She also holds the position as Company Secretary of Periceyl (Pvt) Ltd
She also currently serves as a director on the Board of Paradise Resort Pasikudah (Private) Limited, Amethyst Leisure Limited, DFCC Bank PLC and as an alternate Director of MelstaCorp Limited and Distilleries Company of Sri Lanka PLC.
8. Mr. Amitha Gooneratne FCA (SL), FCA (Eng. & Wales)Alternate Director to N. de S. Deva Aditya
Mr. Amitha Gooneratne has held several senior positions at Commercial Bank of Ceylon PLC and served as the Managing Director from 1996 to April 2012. He is a Fellow member of the Institute of Chartered Accountants, United Kingdom and Wales and a Fellow member of the Institute of Chartered Accountants, Sri Lanka. He was the Founder Chairman of the Financial Ombudsman Sri Lanka (Guarantee) Ltd., and former Chairman of the Sri Lanka Banks’ Association (Guarantee) Ltd. He was also the Managing Director of Commercial Development Company PLC, a Public Quoted Company listed in the CSE and was the Chairman of Commercial Insurance Brokers (Pvt.) Limited. He was also nominated to the Board of SriLankan Airlines during 2002–2004 by the Government of Sri Lanka.
On his retirement, Mr. Gooneratne, assumed duties as Managing Director of Melstacorp Limited, which is the strategic investment arm of the Distilleries Company of Sri Lanka PLC. He is the Chairman of Melsta Regal Finance Limited, Melsta Logistics (Pvt.) Limited and Bellvantage (Pvt.) Limited; Board Member of Periceyl (Pvt.) Limited, Balangoda Plantation PLC, Lanka Bell Limited, Telecom Frontier (Pvt.) Limited, Bell Solutions (Pvt.) Limited, Timpex (Pvt.) Limited Texpro Industries Limited, Bogo Power Limited., Continental Insurance Limited and Browns Beach Hotel PLC., which are subsidiary companies of Melstacorp Limited.
He is an independent Director of Lanka IOC, Textured Jersey and Commercial Development Company Limited.
He is also the Alternate Director to Mr N. de S. Deva Aditiya on the Board of Distilleries Company of Sri Lanka and Aitken Spence PLC.

Dist i l ler ies Company of Sr i Lanka PLC30
GroupManagement
1. Amitha Gooneratne: Managing Director - Melstacorp Ltd. / Chairman - Melsta Regal Finance Ltd., Melsta Logistics (Pvt) Ltd., Bellvantage (Pvt) Ltd., Melsta Tower (Pvt) Ltd. / Director - Continental Insurance Lanka Ltd., Periceyl (Pvt) Ltd., Lanka Bell Ltd., Texpro Industries Ltd., Bogo Power (Pvt) Ltd.
2. Capt. Jagath Kahanda (Retd.): Managing Director - Pelwatte Sugar Distilleries (Pvt) Ltd. / Director - Distilleries Company of Sri Lanka PLC, Melstacorp Ltd., Pelwatte Sugar Industries PLC, Melsta Properties (Pvt) Ltd., Milford Holdings (Pvt) Ltd.
3. Ms. Stasshani Jayawardena: Chairperson - Splendor Media, Director - Aitken Spence PLC
4. Maximus R. Peries: CEO - Distilleries Company of Sri Lanka PLC / Director - Pelwatte Sugar Industries PLC, Lanka Bell Ltd., Melsta Logistics (Pvt) Ltd., Melsta Tower (Pvt) Ltd.
5. Lalith Obeyesekere: Director / CEO - Balangoda Plantations PLC, Madulsima Plantations PLC
6. Capt. Ranjith Wettewa SLN (Retd.): Director - Pelwatte Sugar Industries PLC
7. Asoka Abeyewardene: Director - Continental Insurance Lanka Ltd.
8. Senaka Amarathunga: Director / General Manager - Periceyl (Pvt) Ltd.
1.
4.
7.
2.
5.
8.
3.
6.

Annual Report 2014/15 31
9. Dinal Peiris: Managing Director - Texpro Industries Ltd.
10. Chaminda De Silva: Managing Director - Continental Insurance Lanka Ltd.
11. Dr. Prasad Samarasinghe: Managing Director - Lanka Bell Ltd.
12. Janaka Abeysinghe: Director - Melsta Logistics (Pvt) Ltd.
13. Nishaman Karunapala: Director / CEO - Melsta Regal Finance Ltd.
14. Palitha Rodrigo: Managing Director - Melsta Technologies (Pvt) Ltd.
15. Ms. Farzana Sulaiman: Chief Operating Officer - Bellvantage (Pvt) Ltd.
9.
12.
15.
10.
13.
11.
14.

Dist i l ler ies Company of Sr i Lanka PLC32
DCSLManagement
Left to RightBrig. Aruna Wijewickrama (Retd.) : Head of Central Region
Lalith Ratnayake : Head of Inventory Management
Nimal Nagahawatte : Head of Finance
Ms. V. J. Senaratne : Company Secretary & Chief Legal Officer
Col. Ranjith Rupasinghe (Retd.) : Head of Extra Special Heritage Arena
S. Rajanathan : Head of Procurement

Annual Report 2014/15 33
Left to RightMaj. Roshan Cabraal (Retd.) : Head of Northern Region
Maj. Gen. Jagath Rambukpotha (Retd.) : Head of Southern Region
Ms. Gayathri Chakravarthy : Head of Human Resources
Maximus R. Peries : Chief Executive Officer
Premasiri Liyanaarachchi : Chief Internal Auditor
Roshanth Kumar Perera : Head of Transport & Logistics
Capt. Ranjith Wettewa SLN (Retd.) : Head of Uva Region

Dist i l ler ies Company of Sr i Lanka PLC34
ManagementDiscussion & AnalysisThe DCSL Group epitomises one of Sri Lanka’s reputed diversified conglomerates, holding a portfolio encompassing beverages, plantations, telecommunication, insurance, finance, power generation, textiles, leisure, logistics and media and creative services. The group is synonymous with dynamism and professionalism, and has carved a unique niche for itself in the sectors in which it operates. Having long established its credentials as a respected corporate entity over a period of a century, DCSL embodies state-of-the-art systems and processes led by an inspired and distinguished senior management board and a professional team of employees dedicated to deliver maximum value to shareholders and other valued stakeholders.
Group Overview Our flagship company, which is engaged in the alcohol beverage sector, was impacted by a host of challenges which carried over from the preceding year, providing neither relief nor a level playing field in which to operate. The illegal practices rampant in the industry succeeded in yet again adversely affecting the overall performance of the Group. The beverage sector represents the majority of the Group’s revenue and profitability while DCSL remains as the dominant market leader in the industry.
In order to offer superior products, DCSL has invested in a state-of-the-art fully automated blending and bottling plant to enhance efficiency and quality. DCSL remains committed and strongly believes that such high value investments will ensure the sustainability of its operations.
In order to offer superior products, DCSL has invested in a state-of-the-art fully automated blending and bottling plant to enhance efficiency and quality. DCSL remains committed and strongly believes that such high value investments will ensure the sustainability of its operations.
Melstacorp Group of Companies, under which falls the other diversified sectors of the Group, succeeded in expanding its sphere of influence and in creating a distinct identity for itself. Our focused efforts to build the Melstacorp brand yielded positive results, with greater
brand awareness and recall amongst key stakeholders. While heightened brand equity and an increased presence were achieved during the year, recent investments are yet to yield commensurate returns. Melsta Regal Finance Limited, during its second year of operations, achieved several financial milestones while steadily consolidating its presence as one of the newest and most dynamic players in the financial services sector.
Buoyed by the infusion of capital in mid 2014, our insurance venture, Continental Insurance, recorded its highest-ever profitability in the financial year under consideration, supported by establishing a wider geographical reach.
Unfortunately, the expropriation of Pelwatte Sugar Industries PLC (PSIP), under the Revival of Under-Performing Enterprises and Under-Utilised Assets Act (Act) in November 2011, was an issue that remained unresolved during the financial year under review. Despite being listed as an ‘under-utilised asset’ under the Act, we remain emphatic that we are the legal owners of PSIP. We remain hopeful that this issue will be resolved in a transparent manner at the earliest instance.
Furthermore, despite a lapse of six years, we have still not been reimbursed the profit earned during the DCSL Group’s tenure at the helm of Sri Lanka Insurance Corporation Ltd., (SLIC). We are hopeful that the profit earned, which is rightfully ours, will be paid soon, as per the Supreme Court directive.
The Group’s gross revenue recorded Rs. 66.8 Bn in the current year. The Group’s profit before tax was Rs. 9.7 Bn and a profit after tax of Rs. 6.5 Bn. The contribution to total revenue from the alcoholic beverage sector was Rs. 57 Bn and continues to be the largest contributor to the

Annual Report 2014/15 35
bottom line. The Group’s plantations business, contributed a revenue of Rs. 3 Bn, with telecommunication at Rs. 3.4 Bn and diversified businesses at Rs. 3.4 Bn. Share of associate investees contributed Rs. 1.4 Bn to the Group’s profitability. The Group’s total assets increased to Rs. 92.7 Bn from Rs. 83.7 Bn and the net assets per share rose to Rs. 203.35 from Rs. 178.80. DCSL’s share price gained by 18% during the year, reaching Rs. 240.00 as at end of March 2015.
The DCSL Group strived hard to generate social and economic gains in order to make a significant contribution to the prosperity of the country. As a market leader in the beverage sector and one of the most valued corporate entities in the county, we consider it our responsibility to deliver sustainability across all our operations, while ensuring that our activities have a favourable impact on social, environmental and economic pillars.
Beverage Sector DCSL sustained its status as the Flagship Company and highest revenue generator for the Group in the year under review. The challenges faced in the preceding year persisted despite aggressive lobbying efforts on our part to ensure a level playing field.
The fact that DCSL continues to maintain market leader status despite operating in such a challenging eco system in the legal alcohol industry is a reflection of the loyal customer base and brand loyalty we have succeeded in generating. Despite the infusion of cheaper priced alcohol in the market, DCSL consumers uphold their trust in DCSL brands. Considering that the excise duty component is over 65%, it is impossible for legal producers to retain competitiveness in such markets.
Gross Turnover - Group(Rs. Mn)
56,9932015 2014
Beverage Sector3,002 Plantations Sector3,372 Telecommunication Sector3,398
66,765
53,1373,1723,6343,244
63,186Diversified Sector
Profit Before Tax - Group(Rs. Mn)
8,3982015 2014
Beverage Sector(106) Plantations Sector(692) Telecommunication Sector
737
9,728
8,027130
(639)536
9,494
Diversified Sector1,391 1,440 Share of Associate Companies Profit

Dist i l ler ies Company of Sr i Lanka PLC36
ManagementDiscussion & Analysis
Further, a high tax regime and escalating cost of living serve to render consumers no choice but to opt for cheaper products, despite their dubious quality.
It must be duly noted that we adhere strictly to the NATA Act which prohibits advertising and promoting alcoholic brands. The fact that DCSL has sustained and grown its market share despite these severe restrictions is a reflection of the superior quality of our products which are appreciated by discerning consumers. Therefore, our ongoing success can be attributed to our management skills and consumer loyalty.
Unfortunately, unscrupulous operators do not pursue the same sustainable goals as DCSL does, since they focus on earning high profits with a short term view of the business, resulting in a high social cost. In contrast, the DCSL Group pays all taxes as per the laws of the land, making the Group one of the largest contributors to state coffers.
In October 2014, the beverage sector experienced a significant change in the tax structure in October 2014, wherein the Value Added Tax and Nation Building Tax
component were added to the excise duty. As a result, Value Added Tax on purchases became unrecoverable and added to the cost. Further, customs duty on imported products was increased and taxes such as cess for bulk spirit/finished goods were increased substantially.
During the current financial year, both DCSL and Periceyl continued to maintain profitability despite the challenges posed to the legal alcohol business in the country as a result of a skewed playing field. Gross turnover of DCSL was recorded at Rs. 51.8 Bn. DCSL recorded profit after tax of Rs. 4.7 Bn (adjusted for intra-group capital gain on structuring of investments and properties) as against profit after tax of Rs. 5.4 Bn in the previous year. The beverage sector contributed Rs. 41 Bn to the State by way of taxes.
Periceyl (Pvt) Ltd., achieved greater brand building success during the year, sustaining its profitability. Its brands - Black Opal Arrack, Franklin Brandy, Galerie Brandy and Tillsider Whisky - performed convincingly. Further, Periceyl introduced
new agency lines from Australia (Somerton wines), South Africa (Cape Dreams wines), New Zealand (Riverby and Mudhouse wines), Spain (Viejo Marchante wines) and Scotland (Queens Seal Whisky) and hopes to expand its spirit portfolio in the near future.
However, the year proved to be a challenging one in more ways than one, with some of the local manufacturers distributing finished products, mainly Arrack, at a lower price. Such products were supplied to retailers at a lesser cost and these same products were offered by the manufacturers with a larger margin to retailers, which encouraged the retailers to sell the products over DCSL/Periceyl products
Artificial toddy being supplied at a cheaper price has also created a difficult situation for manufacturers such as DCSL/Periceyl, who are using 100% genuine coconut toddy to
2013/14
53,13756,993
2014/15
Gross TurnoverBeverage Sector(Rs. Mn)
2013/14
8,0278,398
2014/15
Profit Before TaxBeverage Sector(Rs. Mn)
92.7 BnTotal Assets (Rs)
61.0 BnShare Holders’
Funds (Rs.)
Group
21.84Earnings per Share (Rs.)
203.35Net Assets per
Share (Rs.)
Group

Annual Report 2014/15 37
produce coconut spirits. 100% Coconut Old Arrack is a flagship product which is endemic to Sri Lanka and is similar to Scotch whisky in Scotland and Cognac in France. However, due to the weak monitoring framework in the country to crack down artificial toddy suppliers, the country will lose the edge for authentic 100% Coconut Arrack.
Future Outlook Despite the challenges in the sector, we remain optimistic about the prospects for the beverage industry and for DCSL to further secure even greater market share in the future. Our massive investment in the ultra-modern blending and bottling factory will enhance our capacity and ensure that DCSL products can be accessed across the length and breadth of the country. DCSL is reputed for its innovation and our R & D team perseveres in innovating new products to ensure that our products evolve and change with the times. Periceyl remains in constant pursuit of new and emerging opportunities emanating from the country’s leisure and tourism sectors. In conclusion, we remain hopeful that the relevant authorities will exert greater control to curb the illegal liquor industry for the benefit of consumer.
Melstacorp Limited Melstacorp holds 19 direct and indirect subsidiaries and two associate companies under its wing as a result of our Group restructuring plan put into effect during the previous year. Under the new arrangement, DCSL’s shareholdings of subsidiaries and associates were realigned to Melstacorp Limited, enabling Melstacorp to provide greater focus and attention to the diversified investments of the DCSL Group.
In a bid to ingrain the Group philosophy, a series of measures were taken to infuse Group culture and strengthen the shared services framework. Some of the key areas of the shared services such as treasury, finance, audit and control and human resources, were put in place. Our efforts to strengthen shared services and build a common brand under the ‘Melsta’ umbrella will be sustained into the future.
Melstacorp is striving to combine the Group companies’ synergies in a manner that will drive optimum resource utilisation and financial benefits. We have envisioned that Melstacorp will emerge as a diversified conglomerate, enhancing the contribution from the non-alcohol sector whilst reducing the Group’s dependence on the alcohol sector.

Dist i l ler ies Company of Sr i Lanka PLC38
ManagementDiscussion & Analysis
Plantations Sector The 2014 financial year proved to be a challenging one for the plantations sector as adverse weather conditions and labour wage increases accelerate cost of production which in turn served to erode profitability in the sector. Balangoda Plantations (BPL) recorded a pre tax loss of Rs. 106 Mn. The turnover of the company decreased from Rs. 3.2 billion in 2013 to Rs. 3.0 billion in 2014, reflecting a drop of 6.25%. The tea industry as a whole experienced an unfavourable year, posting a decline of 2.20 Mn Kgs in output. The shortfall is mainly due to the deficit shown by the medium grown sector, notwithstanding the positive crops recorded from both high and low grown sectors.
The decline in the rubber segment experienced in the previous year continued in the year under review as well. The BPL’s rubber production decreased by 18% to 98 Mn Kgs over the previous year due to adverse weather conditions which disrupted harvesting. Rubber prices continued to fall in 2014 due to built up stocks and slow growth in emerging markets. BPL sustained its momentum in replanting programmes in tea and rubber in order to position the company on a stronger platform for future growth. The company also invested in selected factories to reduce cost of production and to improve efficiency.
Future Outlook The future for the plantations sector seems challenging due to a variety of factors, such as a slow global growth impacting export markets, geo-political tensions in export markets and the drop in world tea and rubber prices. Locally, the sector remains vulnerable to inclement weather patterns as it does to wage increases which push the cost of production to a non viable extent. Extension of the fertilizer subsidy and its availability will further play an
important role in an industry beset by aging bushes and depleted soils. We are optimistic that the authorities will resolve some of the issues facing the plantation industry such that Sri Lanka’s tea and rubber exports remain competitive in the global arena. BPL is leveraging on a slew of strategic measures to improve its positioning by exercising greater cost controls and enhancing output. We believe that our adoption of sustainable practices will strengthen us in the long term.
Telecommunication Sector Despite the rise of operational costs during the year, the Group’s telecommunication arm, Lanka Bell, was able to sustain a reasonable EBITDA margin in line with the industry.
Lanka Bell is now equipped with the latest in technology to propel itself to the forefront of the industry. The launch of 4G positions the company as one of only two leaders in the sector, thereby ensuring it takes a quantum leap into the future of wireless telephony and connectivity in its tradition of pioneering technology such as introducing CDMA technology to Sri Lanka in 2005.
2013/14
3,172 3,002
2014/15
Gross TurnoverPlantations Sector(Rs. Mn)
2013/14
130
(106)
2014/15
Profit / (Loss)Before Tax Plantations Sector(Rs. Mn)
Annual Report 2014/15 39
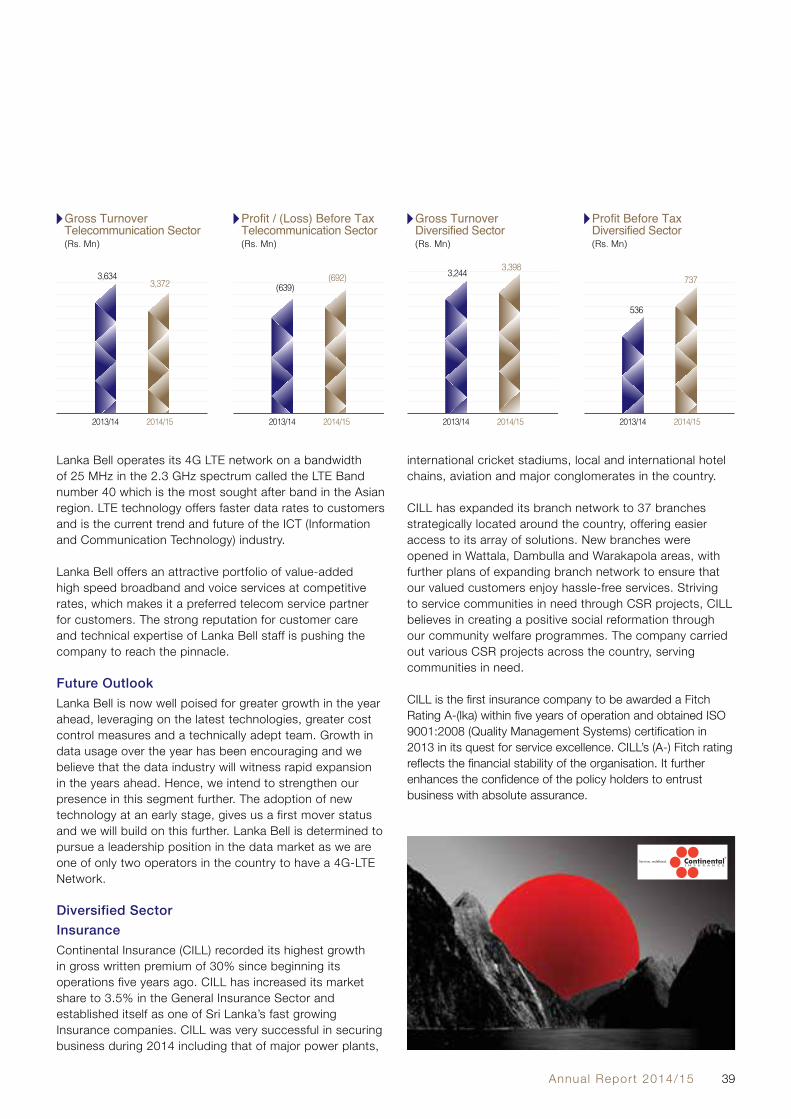
Lanka Bell operates its 4G LTE network on a bandwidth of 25 MHz in the 2.3 GHz spectrum called the LTE Band number 40 which is the most sought after band in the Asian region. LTE technology offers faster data rates to customers and is the current trend and future of the ICT (Information and Communication Technology) industry.
Lanka Bell offers an attractive portfolio of value-added high speed broadband and voice services at competitive rates, which makes it a preferred telecom service partner for customers. The strong reputation for customer care and technical expertise of Lanka Bell staff is pushing the company to reach the pinnacle.
Future Outlook Lanka Bell is now well poised for greater growth in the year ahead, leveraging on the latest technologies, greater cost control measures and a technically adept team. Growth in data usage over the year has been encouraging and we believe that the data industry will witness rapid expansion in the years ahead. Hence, we intend to strengthen our presence in this segment further. The adoption of new technology at an early stage, gives us a first mover status and we will build on this further. Lanka Bell is determined to pursue a leadership position in the data market as we are one of only two operators in the country to have a 4G-LTE Network.
Diversified Sector InsuranceContinental Insurance (CILL) recorded its highest growth in gross written premium of 30% since beginning its operations five years ago. CILL has increased its market share to 3.5% in the General Insurance Sector and established itself as one of Sri Lanka’s fast growing Insurance companies. CILL was very successful in securing business during 2014 including that of major power plants,
international cricket stadiums, local and international hotel chains, aviation and major conglomerates in the country.
CILL has expanded its branch network to 37 branches strategically located around the country, offering easier access to its array of solutions. New branches were opened in Wattala, Dambulla and Warakapola areas, with further plans of expanding branch network to ensure that our valued customers enjoy hassle-free services. Striving to service communities in need through CSR projects, CILL believes in creating a positive social reformation through our community welfare programmes. The company carried out various CSR projects across the country, serving communities in need.
CILL is the first insurance company to be awarded a Fitch Rating A-(lka) within five years of operation and obtained ISO 9001:2008 (Quality Management Systems) certification in 2013 in its quest for service excellence. CILL’s (A-) Fitch rating reflects the financial stability of the organisation. It further enhances the confidence of the policy holders to entrust business with absolute assurance.
2013/14
3,634 3,372
2014/15
Gross Turnover Telecommunication Sector(Rs. Mn)
2013/14
(639)(692)
2014/15
Profit / (Loss) Before Tax Telecommunication Sector(Rs. Mn)
2013/14
3,244 3,398
2014/15
Gross Turnover Diversified Sector(Rs. Mn)
2013/14
536
737
2014/15
Profit Before Tax Diversified Sector(Rs. Mn)

Dist i l ler ies Company of Sr i Lanka PLC40
CILL offers a diverse product portfolio to its customers encompassing property, motor, marine and general insurance. The company is committed to constantly innovate and update its product portfolio to meet the ever-changing business landscape. The newest addition to the product portfolio is the company’s health insurance plans, which focuses on making quality health care affordable and ensures financial stability even during unforeseen events of sickness.
The company has enhanced its focus on internet and mobile banking in a proactive effort in anticipation of an exponential increase in usage across the country. Further, in order to offer customer convenience through strategic partnerships, CILL has partnered with eZ cash to pay premiums using mobile telephones.
CILL is on a mission to provide reliable, innovative, customer-friendly insurance services through state-of-the-art technology, and focuses continuously on product improvement to ensure customer confidence in the brand’s value proposition, thereby living up to its promise of “Service, Redefined”. Financial Services Melsta Regal Finance Ltd embarked on the second year of operation with a focus on penetrating the market with innovative financial solutions. The company achieved noteworthy milestones in terms of asset size and achieved a balance sheet size of Rs 5 Bn and earned NBT of Rs. 100 Mn.The company was successful in introducing innovative financial solutions such as the 360° trade finance facility, which proved to be a breakthrough product in the financial services arena. This service, which optimises the capacities of the Group, encompasses a wide ranging financial solution including clearing of imports, warehousing, logistics and
financing. The company has a formidable competitive advantage as this product is offered in partnership with the Group Companies, who possess the relevant expertise. The company is recognised in the financial services industry as a Finance Company with the widest product range.Recognising the importance of expanding the Company’s regional footprint, the company laid the initial foundation for its branch network. Its presence was expanded to the key cities of Kurunegala, Kandy, Matara and Negombo. The Company has also chartered an aggressive regional penetration strategy, which will be implemented in the ensuing months.Another key milestone achieved by the Company was when it successfully negotiated and obtained a USD 10 Mn foreign currency funding line. This is a significant achievement given the short span of history of the Company. Fitch Rating (Lanka) Ltd reaffirmed its A+(lka) rating of Melsta Regal Finance Ltd.During the year, Melsta Regal Finance focused on Human Resources (HR) development, which is a critical success factor in the financial services sector. The HR initiatives implemented and practiced by the Company were recognised with a Bronze Award at the SLITAD People Development Awards Ceremony in 2014.
Future Outlook Melsta Regal Finance is laying strong foundations for future growth, expanding its branch network, and widening its portfolio of products and services, backed strongly by a unique brand of customer care which caters to the evolving needs of its customers. In the short period since its establishment, the company has demonstrated its innovative streak by pioneering one-of-a-kind financial solutions and building a customer centric team.
Collision Repair & Logistics The Collision Repair Centre at Melsta Logistics performed well during the year, and enabled the Group to add value for both internal and external clients. The Centre offers state-of-the-art technology, machinery, equipment and unparalleled know-how on treating vehicles based on the manufacturer’s specifications. These specialised facilities have served to create a distinctive niche for Melsta Logistics. The newly-formed logistics operation continues to accrue gains for Melsta Logistics. Melsta Logistics is now focused on expanding this facility beyond the Group, while investing in superior technology to enhance efficiency.
ManagementDiscussion & Analysis

Annual Report 2014/15 41
Textiles During the year under review, sales volumes increased by 30% with significant improvements to gross profit margins arising from better pricing. Significant cost savings were made on energy due to the use of biomass thermic fluid heaters as an alternative to furnace oil to generate hot air.
Demand for high-quality woven fabrics, which had fallen significantly since 2008, is now starting to pick up, especially for high-end export and local consumption. Well-known international and European brands such as Marks & Spencer, Next, George, C&A, Metalan, etc, appear to be buying more garments manufactured in Sri Lanka which is an encouraging sign.
The textile industry is expecting a remarkable improvement in market conditions in the next year with the reinstatement of GSP+ in Sri Lanka. The industry has already witnessed encouraging signs with enquiries from the European buyers as well as the reactivation of the buying offices in the country. Further, Texpro plans to generate our own steam using bio-mass during the second half of this year, which would result in a further reduction in cost.
Future OutlookIn the new financial year, the company’s results should reflect the full effect of the biomass conversion which we expect will reduce the energy cost by over 30%. We are continuing to convert more of the fossil fuel consuming equipment which will further reduce our operating cost, enabling Texpro to become very competitive in pricing with regional players, thereby increasing profitability. We will sustain our strategy to be an efficient, flexible niche market printer and dyer and provide value added services to discerning customers. We are optimistic of the future and expect a good turnaround in performance in the coming year.
Power Generation Bogo Power (Pvt) Ltd was formed to set up a Mini Hydro Plant at Kirkoswald Group, Bogowantalawa. Bogo Power (Pvt) Ltd is registered with the Board of Investment of Sri Lanka (BOI) and has obtained necessary approvals from the Sustainable Energy Authority of Sri Lanka and the Public Utilities Commission of Sri Lanka. A Power Purchase Agreement has been entered into with the Ceylon Electricity Board for the sale of electricity generated for a period of 20 years. The project was fully commissioned in December 2011 and power capacity of the project is 4 MW and the average annual energy that is expected to be generated is 15.2 GWH. During the year 2014/2015, the project delivered 21.2 GWH, thus exceeding the projected value.
Business Process Outsourcing Bellvantage (Pvt) Ltd delivered an excellent year with expansion of its service portfolio. The Contact Centre continues to offer a host of services including call centre, chat, hosting, data entry, and customised voice and service solutions. The current year’s growth focused on the Banking and the Food chain industries, enabling it to be the pioneer in handling multinational brands by capitalising on adopting further efficiencies in these segments. Beyond industry-based efficiencies, the Bellvantage Contact Centre as a whole is optimised by continuous expansion into existing and new accounts offering 24/7 service.
ICT solutions were further enhanced by investing in the world-renowned latest version of the Contact Centre solution, enabling Bellvantage to keep in pace with the latest technology in providing the best services to the clientele by having a competitive edge in the global marketplace. We successfully launched international projects and still continue to be the leader in the market, having the best brands and names managed locally and internationally in the BPO sector.

Dist i l ler ies Company of Sr i Lanka PLC42
Future Outlook Our leisure arm is poised to unveil a signature hospitality experience as denoted by the Heritance brand, and we expect the new property to rapidly accelerate to the forefront of the country’s hospitality market. Overseas tour operators and industry partners have already expressed a keen interest in the property, and we are extremely bullish about the prospects for Heritance Negombo once it commences operations.
Apart from our established competencies, we created a new ICT arm this year, focusing on Contact centre hosting, Customer Relationship Management (CRM), Hardware and software solutions services to face the most demanding of industries to cater to their requirements.
Melsta Technologies (Pvt) Ltd was established in March 2015 with a vision to “Deliver technology solutions people can depend on”. To this end, it is envisaged that Melsta Technologies will play a strategic role and specialise in niche verticals within the fast evolving Information and Communication Technology (ICT) industry. This coupled with the ever-increasing demand for robust ICT solutions within the highly diversified Group, contributed to our strategic decision to establish Melsta Technologies Private Limited.
Since its inception in March 2015, Melsta Technologies has obtained the Oracle Gold Partner Status and has established an Oracle E‐Business Suite (EBS) implementation practice. Additionally, Melsta Technologies offers advisory services on Oracle Licensing, Oracle Premier Support renewal services, implementation services on Oracle Applications and Technologies and Local Support Services.
Leisure Sri Lanka’s tourism industry crossed the 1.5 million tourist mark in 2014 and is strongly moving towards achieving its target of 2.5 million tourists by 2016. A number of high profile global hotel brands are setting up operations in the country, which indicates the prosperous outlook for the industry in the months and years ahead. The Group’s leisure arm is also gearing up to position itself in this rapidly evolving scenario. The erstwhile Browns Beach Hotels PLC is in the process of completing its extensive reconstruction and will soon be re-launched as Heritance Negombo, offering a state-of-the-art luxury experience. Negombo’s rich culture and sandy beaches and its strategic location and proximity to the airport lend it a unique advantage and Heritance Negombo will spearhead the area’s tourism with its luxury signature hospitality.
ManagementDiscussion & Analysis
Media & Creative Services Recent changes in Sri Lanka’s economic landscape have given rise to unprecedented opportunities. This in turn has informed the scope of various business units within the organisation and we are in the process of diversifying our product portfolio to more proactively meet these changes.
By expanding service offering from a media-centric agency to a full-service advertising agency, Splendor Media continues to gain momentum as a tour de force within the local industry. The company’s expansion into a number of brand related activities and recent investment in digital media solutions will help augment Splendor Media’s current core offering, while helping clients leverage on the latest digital media trends and more sophisticated performance media techniques. This in turn, marks an adventurous move towards a brave new frontier, with possible partnerships and collaborations lined up for the immediate future.
Future OutlookSplendor Media remains committed to nurturing a culture of creativity, passion and effectiveness, one that adds real value to the client and their brand, while doing work that remains true to the spirit of free enterprise and contributes positively towards social change.

Annual Report 2014/15 43
SustainabilityReportTouching LivesOur Sustainability Motto in ActionWe understand that, globally, stakeholders at large are demanding that companies they associate with demonstrate non-financial metrics to define sustainability and sustainable operations. Financial profitability as the sole criteria of a company’s success is an outdated concept and outrightly rejected by most right-thinking stakeholders and the organisations they support. More importantly, being an environmentally, economic and socially sustainable organisation is helping companies earn corporate respect and drive customer loyalty, not to mention earning respect from peers and industry. In an era of growing global competition, climate change and diminishing resources, companies that put sustainability as their foremost goal are winning the race.
As one of the oldest, diversified, blue chip conglomerates in existence in Sri Lanka, we are living proof of continuous improvement and sustainable business practices. While we celebrate over-a-century of existence in the year 2015, we consider this an opportunity to strengthen our conceptions of business practices that are environmentally and socially sustainable, while also being financially sustainable, the key requirement of any commercial entity
In our journey over the decades within the corporate arena of Sri Lanka, an overarching tenet has always been to ensure that our decisions, actions and impacts are sustainable and positive at all times. We are extremely cognisant that as a corporate steward involved in numerous business and industry areas, we must set an example to others, while making our stakeholders a part of our journey of progress.
In this Sustainability Report, we set out the measures we take to ensure that sustainability is infused along the length and breadth of our value chain. Simultaneously, we continue to invest time and resources in understanding how we can enhance our proud track record as one of the most sustainable organisations in the country.
The DCSL StoryHistory, Ownership and Legal FrameworkThe roots of DCSL hark back to 1913, when the Excise Department of Ceylon, which was originally established as an enforcement authority, was mandated to distribute and sell liquor in Sri Lanka and also began the distillation and manufacture of liquor products. Much later, in 1974, the State Distilleries Corporation was incorporated by statute to
take over this role. In 1989, the state agency was converted to a limited company and DCSL took on the mantle of a pioneer in distillation and is now positioned as the largest distiller in the country.
DCSL is quoted on the Colombo Bourse since 1992 and is a modernised entity, working on a sophisticated knowledge base built on technology, experience, skill and acumen. Its large investments in R & D, infrastructure, plants and machinery and the diversification into key economic sectors in the country, places DCSL today unequivocally as an industry captain and one of Sri Lanka’s blue chip conglomerates.
DCSL’s business areas are diverse and penetrative, ranging from hospitality to telecommunication, BPO to textiles, plantations to hydropower and insurance to finance and its largest and most influential business contributor – beverages, encompassing alcohol.
Significant Events during the Reporting PeriodThe global rating agency, Fitch, reaffirmed DCSL’s National Long-term Rating of AAA (lka) with a Stable outlook. This is the best and highest entity credit rating for a corporate in Sri Lanka. Today, DCSL remains one of the most preferred corporate among bankers, overseas lenders, suppliers and stock analysts. In fact, consequent to the rating announcement, DCSL was able to significantly reduce its interest costs.
DCSL’s ultra modern state-of-the-art fully automated plant in Seeduwa was declared open in March 2015.
Report Scope We believe that we have a responsibility towards our stakeholders to ensure that they are given a clear insight into how we have managed their business and how we intend to work in the future. This, therefore, is our honest effort in sustainability reporting. While we do know that this report is work in progress and requires to be developed comprehensively, this attempt helps us to put our results, both positive and negative, down on paper and work on plans that would ensure that our presence as a corporate leader will surely be advantageous to all our stakeholders. The report presents a balanced analysis of our sustainability performance strategy in relation to issues that are relevant and material to the Company and to our stakeholders, while complementing our ongoing engagement with stakeholders.

Dist i l ler ies Company of Sr i Lanka PLC44
This report focuses on key developments and includes only the most pertinent indicators in order to provide stakeholders with an integrated and succinct view of our sustainability performance. Unless otherwise indicated, facts and figures refer to the DCSL Group. Sustainability in our business is built on natural capital, social capital and economic capital, all of which must be taken together rather than in isolation for a true picture of sustainability. It is these capital segments that run through as themes of this report.
MaterialityHaving embarked on this sustainability reporting process, we must confess that in documenting the necessary areas, we may not yet have a clear idea or focus on the extent of materiality involved. However, we have focused on earmarked areas and platforms that have formed the foundation for our sustainability programme and hence, we have used those as the guideline to report on the arising issues. We have also been able to identify shortcomings and gaps in data gathering, which is now being documented and acted upon to ensure that we bridge those gaps in future. We initially garnered the information from all our business sectors on a common questionnaire and began mapping the categories that were most common. Once charted, the categories were placed in perspective and we were able to consider the materiality of our findings, positioning them in priority order and only focus on those that our stakeholders felt were crucial or important.
Reporting PeriodThis report supports the DCSL Group’s Annual Report and presents our sustainability performance for the year ended 31 March 2015. It covers company activities, including the subsidiaries’ reporting period (for example, fiscal/calendar year) for information provided 01 April 2014 to 31 March 2015. Data measurement techniques and the bases of calculations applied for compilation and other information in the report is disclosed wherever applicable. We invite feedback from our stakeholders on this report and the way we approach our sustainability priorities in order to continue improving our performance, transparency and accountability practices.
Governance, Commitments and EngagementBoard of DirectorsCollectively, the DCSL Board has significant corporate acumen, skill, knowledge and experience aided by astute and knowledgeable support and information from senior
management and external specialists when the need arises to be sufficiently informed and be independent. Board governance ensures that the Group discloses related party transactions periodically and if any director has a direct or leading interest in any matter being discussed, they will abstain from opining, discussing and voting, all of which could influence the outcome. This avoids conflict of interest and ensures independence of the Board.
DCSL has established a governance structure that remains aligned to the laws of the land and ensures compliance to various regulatory mandates. The governance structure therefore includes committees responsible for specific tasks and setting strategy and future direction for the Group. The Board structure and committees are detailed on page 57 in this report.
DCSL’s Board comprises Six Directors (3 Executive, 2 Independent Non-Executive, 1 Non-Independent Non-Executive), meeting regularly to map strategy and for speedy decision making which require Board intervention. The Board sub committees are a vital conduit in identifying and managing economic, environmental and social performance, including relevant risks and opportunities, as well as compliance.
Ongoing Board education is an imperative at DCSL to ensure that Directors remain abreast of all applicable legislation and regulations, changes to rules, standards and codes, as well as relevant sector developments, which could potentially impact the Group and its operations. During the year, all Board Members and Committee Members were reviewed for compliance with the Colombo Stock Exchange requirements for a listed company.
The DCSL Sustainability ApproachVisionTo be an industry leader who will practice the tenets of a ‘green company’ and be upheld as a true proponent of sustainable development.
MissionTo truly ‘walk the talk’ in becoming green and espouse upward momentum for people, planet and profit
Philosophy• Infusing innovation, value addition, quality and service
excellence to give our customers the best
SustainabilityReport

Annual Report 2014/15 45
• Create a knowledge gaining culture where our team grows and develops as individuals, while honing the entrepreneurial spark to contribute towards macro development
• Continue giving our shareholders the confidence and trust that we will always do what’s best, thus ensuring consistent growth in shareholder value and returns
• Make our planet healthy and green by contributing social dividends that will translate towards sustainable development for society and the environment
• Ensure that everything we do will always keep us ahead and at the helm, collating the facets of economic, social and environmental features into our business dimensions. We integrate this three-pronged approach to sustainability, so that the journey with our stakeholders will remain one in which we grow together, forging and strengthening long-term relationships.
Sustainability PolicyOur Sustainability Policy is based upon the following principles:• We will continue to comply with and exceed wherever
practicable, all applicable and related legislation, regulations and codes of practice
• We will integrate the principles and tenets of sustainability into all our business decisions
• We will strive to minimise any negative impacts that may ensue while engaging in our day to day activities
• We will integrate a sustainability mind-set among our team, making them fully aware of our sustainability policy and empower them with a sense of ownership and commitment to implement, practice and improve it
• We will cascade our Sustainability Policy among our valued business partners, encouraging them and assisting them to adopt sound sustainable management practices
• We intend to review and annually report and to continually strive towards improving our sustainable performance
At DCSL, we are committed to promoting sustainability. We remain extremely concerned for the environment and for
promoting a broader sustainability agenda, both of which are integral to our professional activities and the management of the organisation. We aim to follow and to promote good sustainability practice to reduce the negative environmental impacts of all our activities and to help our stakeholders to join in this journey that will surely benefit our future generations.
The FrameworkThe DCSL Sustainability Framework, which incorporates our Sustainability Philosophy, Policy and Principles, articulates our strategic commitment to sustainable development and remains integral to risk management. This framework assists our stakeholders in imbuing a similar sustainability approach, promotes sound environmental and social practices, encourages transparency and accountability, and contributes to positive development impacts. We ensure that this framework reflects good practice for sustainability and risk mitigation, keeping abreast with trends that bring up challenging issues, which remain at the core to managing a sustainable business. These include supply chain management, resource efficiency, climate change and human rights.
Key Challenges and OpportunitiesRisks and challenges go hand in hand in the business of running an organisation, whether the risk may be from environmental problems, social discontent, political and social unrest or even natural disasters. These can be termed costly, have negative publicity, threaten operating frameworks and also prompt unforeseen expenditure. Reputational damage too can far exceed the immediate cost impacts. While we seek to proactively reduce and manage these risks, challenges have never been a deterrent for us at DCSL; rather, they have been a means of directing us towards opportunity and improving business performance over time. These opportunities have driven us to enhance business growth, while ensuring that we remain within compliance benchmarks, while ensuring that our stakeholders are empowered and remain inclusive to our end goal. Over the year, we identified some challenges and risks that eventually saw an opportunity emerge, and which, through the inherent pragmatic and astute business acumen possessed within DCSL, was transformed and included into the strategic way forward of the Group.
Stakeholder EngagementWe are extremely committed to engaging all of our stakeholders, both internally and externally, to become the

Dist i l ler ies Company of Sr i Lanka PLC46
SustainabilityReport
most sustainable, responsible company we can possibly be. By listening to, partnering with and considering the perspectives of our associates, customers, shareholders, academic leaders, government, value business partners and sometimes, even our competitors, we can truly ensure that quantifiable and qualitative returns are assured. Stakeholder engagement is a crucial element to sustainable development as it is this engagement process that prompts the two-way dialogue and communication process which eventually aligns the strong relationships among our stakeholders and forms the foundation to our sustainability journey. Having identified our stakeholder groups, as given below, we engage with them at various forums related to their interests and expectations, in an effort to adapt to changing needs and issues, which continue to evolve. As we pursue our corporate sustainability goals, we intend to further strengthen these relationships. Together, we are establishing transparency and enhancing our relevancy with the customers and communities we serve. We have created more formal channels for interacting with stakeholders both to learn from their expertise and to provide a forum for them to provide us with feedback.
Key StakeholdersShareholdersQuarterly and annual financial reporting, annual meeting of shareholders, periodic individualised mailings and conference calls between senior management and investors and/or analysts when necessary, serve to deepen shareholder engagement in an ongoing manner through the financial year.
CustomersListening and engaging with customers on a one-to-one basis and through other select channels such as customer satisfaction surveys has helped us understand them better.
EmployeesWe adopt numerous routes, such as regular communications and engagement on one to one basis, monthly or quarterly forums, opinion surveys, internal newsletters and an open door policy.
Government/RegulatorsRegular meetings with relevant government authorities and regulators to discuss impending legal mandates are held to find solutions where necessary. This may involve discussions on challenges, risks, strategy development, execution of such laws and regulations and best practice permeation.
SuppliersRegularly engage with suppliers to promote and institute sustainability solutions
DisclosuresThe purpose of our sustainability reporting is to create greater transparency and accountability and to allow for better informed and more robust decision-making as it is becoming more important than ever to manage both positive and negative impacts of our business activities. Our consumers are increasingly developing an ethical conscience, using sustainability information to identify their chosen brands. Customers want transparency, clarity and accessibility to information and disclosures on social, environmental and economic performance. Needless to say, this information needs to be consistent and presented in a standardised approach, therefore, it is imperative that disclosures are succinct, clear, and truthful and hold fast to the underlying ethos of a principled ethical well governed business entity, which is what DCSL espouses to be.
Economic DisclosuresThe company ensures that both positive and negative information about itself is conveyed as fairly as possible to all stakeholders, especially shareholders. DCSL ensures its shareholders and other interested parties are given accurate information to help them make an informed choice when investing. Our investors have proof of our consistent performance in our financials and share performance, as well as our astute business strategies including restructuring and acquisitions. Given our status as an industry leader, we also remain a strong partner in ensuring that the country meets its vision and objectives, generating direct and indirect employment and thus improving lifestyles, investing in infrastructure, upping quality and standards within the industry and thus setting benchmarks to develop these industries and imbuing best practices.
We practice an environment of zero tolerance on bribery and corruption and eschew ethically unsound or corrupt practices among any stakeholder segment. In this context, we have had no incidences of bribery and corruption, unethical practices or anti-competitive behaviour stemming from our Group brought to our notice. Our business dealings remain transparent and sincere in action, while accountability remains a top priority.

Annual Report 2014/15 47
We remain strictly compliant with all mandatory and regulatory mandates that are prevalent in our business even though the regulatory environment in some of our businesses may be seen as unfair and unjust, We do not make contributions to political parties; no member of the Board of Directors is actively involved or an office bearer of any political party in Sri Lanka.
Product DisclosureAs a company engaged in the business of alcoholic beverages, we ensure that our products, if used in a responsible manner, and by the target age groups it is meant to be used by, will not have an ill-effect or increase risks to health. The processes that cover our supply chain including the sourcing and use of ingredients, resources and raw materials are aligned to stringent quality standards that are initially tested repeatedly before product manufacture.
We work with experts and specialists in the field both locally and internationally, who may also conduct their independent analysis and research, which assists us in manufacturing our final product. This would include the use of science, technology, experience and skill to determine the acceptability of not only the ingredients but also permitted levels of these ingredients. Using the available scientific evidence, these expert opinions have repeatedly concluded that our products, used responsibly by adults in the case of alcohol and spirits, do not increase health risks. There’s also a cohesive group that monitors legislation pertinent to the product and individual ingredients which helps us in our decision making.
In the beverages industry, we work in a ‘dark’ market where all advertising and promotions are prohibited by law. We remain very cognisant that our product in this industry is to be sold and consumed by adults and our responsibility is to always ensure that this is the overarching tenet of our marketing initiatives. We communicate all product information comprehensively either through the labelling or through product information available on numerous channels.
We do not condone or agree to sell any of our products that are meant to be consumed by an adult, to any underage consumer under any circumstances. This is very strictly adhered to, not only within the immediate Company and the team, but is a message that is cascaded very emphatically to our entire value chain and retailers. Any deviation from this, is dealt with severely and may result in DCSL terminating its business relationship with the offender.
Environmental DisclosureWe have never knowingly harmed the environment through any process that we have engaged in. We ensure that in all our processes and systems, we implement as many environmentally friendly initiatives as possible as is seen in the waste water treatment, energy management, recycling initiatives, decrease in emissions and increase in forest cover that we have strategically embarked upon. We also constantly engage our valued business partners, suppliers and wherever possible our customers, to permeate environmental best practices among them.
Human Rights and HR Practice DisclosuresThe DCSL Group espouses and commits itself as an equal opportunity employer, stringently applying a slew of non-discriminatory policies vis a vis gender, age, religion, ethnicity, social, cultural and economic backgrounds on the foundation of meritocracy. We unwaveringly uphold and support the tenets mandated by the International Labour Organisation and other prevalent regulatory bodies pertaining to human rights and child labour. We adhere to a strict policy of ‘zero tolerance to child labour’, a mandate that is permeated to our valued business partners including retailers and the supply chain.
Community DisclosureOur philosophy is to partner the community in its sustainable development journey, which in turn gains us considerable advantage. We are inextricably entwined with our communities and we intend to ensure that our presence within these communities will benefit them and us. This year, our social focus was based on ‘Education & Training and Health, Sanitation & Housing’ and by sustaining social initiatives in these key areas of interest, we believe that we can empower these communities.
Environmental• Better waste and energy management in our
manufacturing processes
• Reducing our carbon footprint by introducing more ‘green’ initiatives
• Reducing dependency on fossil fuels
• Enhancing forest cover and food security through planting of hard wood and fruit trees

Dist i l ler ies Company of Sr i Lanka PLC48
Sustainability FocusSocial• Enhancing entrepreneurial skills among estate youth
• Assisting educational initiatives from childcare to university level students
• Creating awareness of preventable diseases among lesser affluent communities
Economic• Ensuring that shareholder wealth is optimised without
compromising on standards or principles
• Permeating best practices to valued business partners
• Setting an example of ethical leadership through a well governed accountable entity
• Creating benchmarks for industry.
Sustainability PerformanceEnvironmental ImpactOur business interests are wide-ranging and diverse, ranging from manufacturing, plantations, telecommunication, financial services, logistics, textiles, hydro power, to business process outsourcing (BPO) and media. These, in different dimensions and levels, do impact the environment. The DCSL Group, having conformed and remain strictly compliant with the Central Environmental Authority standards, is additionally subjected to regular audits to ensure full transparency. This ensures that we remain conscious of the impacts our actions would have on the environment and have through the years, worked on improving our processes and systems that would eventually help us to reduce the negative impact we have on the environment, while minimising climate change.
Energy, Waste & Water ManagementEnergy and waste management are crucial features in our environmental management focus, especially in our manufacturing processes. A sophisticated distilling system using French technology which is totally environmentally-friendly embeds energy saving features into our plants, as low evaporation during distillation aids the saving of energy. This technology has also helped in decreasing emission levels. Waste water treatment plants and an environmentally friendly zero-harm effluent management system ensures that waste, water and effluents are all managed well within the compliance norms. While the waste water is treated to neutralise acidity and released for further use once deemed
100% safe, the methane which is discharged during the purification process is used for factory consumption.
In our bid to reduce the country’s dependence on fossil fuels and thereby reduce the expenditure of foreign exchange, we embarked on a mini-hydro power project. The Kirkoswald Mini-Hydro Power Project, under the umbrella of Bogo Power (Pvt) Limited and located within Madulsima Plantation’s land, has gained approval from the Sustainable Energy Authority of Sri Lanka, generating an average of 21.1 GwH of power to the national grid. The water required for the hydropower project is diverted and returned to the river within a short distance from the point of diversion. The channel, weir and power house are small structures, which have minimum impact on the natural eco-system and the communities around the area.
The companies of the DCSL Group have all initiated in-house modes of energy, waste and water management, as part of the Group’s holistic vision of environmental impact mitigation.
Continental Insurance (CILL) has commenced emphatically working on a better waste and energy management practices in its journey with a view to become a carbon neutral company. As a way forward, the company places the preservation of nature as a top priority taking the initiative to give back to the environment to sustain our planet’s greenery and fertility. Continental Insurance has tied up with Neptune Recyclers since 2011 for the recycling of all waste papers.
The Company experienced a saving of 10 fully grown trees and total of 19,068 litres of water, while electricity usage decreased by 2,400 kwh and 1,053 litres of oil was also saved which meant lesser usage of fossil fuels during the year 2014, In addition, 2 cubic metres of landfill were conserved and Green House Gas Emission was reduced by 601 kg’s of Carbon Environment.
While creating economic value within the organisation, CILL strives to develop social value as a responsible corporate citizen. Being a benefactor to the society and communities in which it operates, CILL believes in giving something back to different segments of the society especially to those who are under privileged and isolated in the society. Hence, as a matter of priority they have made a firm a consistent commitment every year as one family volunteering to spend quality time with differently able children thus providing them with their basic needs for their daily sustenance.
SustainabilityReport

Annual Report 2014/15 49
Going further, CILL organised a blood donation campaign and distributed water for drought victims in north central province during the year.
The Collision Repair Centre, which comes under Melsta Logistics Limited, remains very compliant with environmental regulations and in fact, has ensured that its entire facility is eco-friendly. Waste disposal is managed efficiently, with disposable waste being recycled and organic waste converted to compost, which is used to nurture vegetation within the premises. In addition, a waste water treatment plant maximised the usage of water. Melsta Logistics also took on the responsibility of managing the Group’s fleet of vehicles to ensure that measures are taken to monitor and control emission levels and usage of fossil fuels and thus reduce its carbon footprint.
The fact that Texpro Industries is certified with a Global Organic Textile Standard ensures that the entire value chain must conform to globally accepted waste management practices in addition to its sourcing and manufacturing processes. Texpro is subjected to continuous audits, which keeps compliance levels above the required norm. At present, Texpro is using biomass thermic fluid heaters instead of fossil fuel consuming equipment, as a result the Company managed to reduce the energy cost by 30%.
RecyclingPackaging gained emphasis to mitigate environmental impact with over 50% of the bottles used for alcohol and spirits being recycled and crates used for transport, being reused. Cellophane, glass, aluminium and plastic generated by the factory were outsourced to an external party for reuse, while used labels were transformed into pulp. This also reduced the number of trees being felled.
Continental Insurance imbued the 3R concept and engaged in recycling of waste paper, which resulted in the saving of ten trees for the year, which though may be considerably small, certainly lays the footprint for the Company to increase its recycling initiatives and reduce the number of trees even further.
Sustainable AgricultureWe are proud to report that the Balangoda Plantation’s accreditation process of the Rain Forest Alliance Certification (RAC) was finalised during the period under review. This move will be a new milestone of Balangoda Plantations in its commitment towards adding value and a greater emphasis on
environmental management and community development. This exercise is also a testament to our continued commitment in stepping into the growing market of enlightened consumers who make conscious choices about supporting sustainable agricultural practices through their purchases and would be a baseline to benchmark us with players in the Industry with clear goals and targets to be achieved.
As a part of its pledge to continually improve environmental and social sustainability, many initiatives were launched by Balangoda Plantations to protect and conserve the natural environment through the prevention of pollution, efficient utilisation of resources, effective waste management practices, promotion of environmental awareness and sensitivity amongst the plantation community.
Balangoda Plantations always espoused sustainable agricultural standards and good manufacturing practices. The company ensured that nearly all its manufacturing facilities have gained ISO and HACCP certifications, which ensured that it remained within the stringent guidelines required for conducting business, manufacturing processes and systems.
In order to retain these standard certifications, the facilities are also continuously subjected to audits. The larger result however is that with the infusion of best practices in agriculture, we are not only enhancing our end product, but also ensuring that our practices are governed by a green ethos. Further augmenting this green ethos, Balangoda Plantations embarked on a re-forestation drive, which, while increasing our forest cover, also significantly impacted the challenges the country will face in the future of food security. In addition, the estates began implementing a composting programme, which converted non-usable materials into compost, deemed for use in the three hectares that are being replanted with tea.
Organic Best PracticesTexpro Industries, (a specialty dye and print business of woven fabric) as a backward integration to the apparel industry, stringently conforms to the Global Organic Textile Standard (GOTS), which ensures that the end product remains true to the tenets of an organic product. GOTS is the worldwide leading textile processing standard for organic fibre and includes ecological and social criteria, backed by independent certification pertaining to the entire textile supply chain. This standard gives the product international recognition in organic textile manufacture, from harvesting

Dist i l ler ies Company of Sr i Lanka PLC50
of raw materials, through environmentally and socially responsible manufacturing, until the labelling process, providing a credible assurance to the end consumer.
Social: Diversity in Our TeamOur longevity and culture of achievement is rooted in the motivation and mind-set of our people, who are committed and dedicated towards achieving greater heights of performance and raising the benchmark. Given that the DCSL Group has grown into a diversified conglomerate encompassing a number of diverse industries and yet is unequivocally positioned with a leadership status, evidences that our team is a winning one. The dynamism, motivation and ‘overzealous’ attitude they always espouse has enabled this Group to take on challenges, some deemed insurmountable and win against the odds
HR Philosophy• To provide and promote an encouraging and professional
working environment for our team.
• Believe that the prosperity of our business depends on successfully developing an integrated group of motivated and innovative employees. Hence we facilitate positive employee relations and inspire employees by offering opportunities for challenging work, personal development and growth.
• Committed to hire, develop and retain the most talented people in order to achieve a committed pool of talent.
Recruitment & RetentionA range of processes have been instilled within the Group to ensure that recruitment is non-discriminatory, unbiased and driven by meritocracy. In addition, in a bid to streamline our recruitment processes, a recruitment requisition form was introduced, which is the base upon which recruitment is effected and a comprehensive interview evaluation form was brought in, to streamline the interview process from initial screening to final interview stage.
The Group companies follow HR best practices ensuring consistency in HR Policy approach and fair playing field for potential employees. For instance, Continental Insurance strives to follow best practices in human resource management as well as the development of human resource. As a growing business, Continental Insurance is in need of regular fresh blood from the outside, while growing talent from within. Hence, Continental Insurance ensures a healthy mix of both. As an organisation is
nothing more than the collective capacity of its people to create value, organisational culture is an important element in any organisation’s make up and success. Therefore, at Continental Insurance new recruitment is based on alignment with the Company’s internal culture, in addition to knowledge, skills and attitudes required for the role.
Bellvantage is offering more than 50% part-time job opportunities for undergraduates with flexible hours. This will enable them to balance their studies and earn some extra cash to fund their expenses. As part of increasing employment opportunities, Bellvantage has been providing home-based working hours on both full time and part time basis. This scheme concentrates on senior citizens and housewives. This has enabled them to save expenses on travelling and time. Furthermore, special arrangements have been made for visually handicapped citizens to carry on their responsibilities without any difficulty.
Training & DevelopmentTraining and development forms the axis to the sustainability of our business and into this we have instilled a knowledge gaining culture, which enables individuals to attain their personal goals while working towards the company’s aspirations. Melstacorp is facilitating all the training programmes for the Group. The training programmes span on the job, off the job, external, hands on and internal programmes, all designed to enhance knowledge, update skill and create an empowered workforce
At Continental Insurance, the HR Department is responsible for the recruitment of suitably qualified employees and retaining talent. Training requirements would be identified for respective functional areas through a systematic performance appraisal system in order to develop the training plan, which ultimately will increase individual performance up to the expected level.
At Balangoda Plantations, training programmes are conducted for senior managers, superintendents and assistant superintendents to enhance their managerial skills, to ensure higher productivity and better management of the large plantation workforce.
Recognition & Staff Well-BeingThe DCSL HR policy is based on the belief that a satisfied employee is a motivated employee who will contribute towards achieving company goals voluntarily, while being more productive. We have continuously infused numerous
SustainabilityReport

Annual Report 2014/15 51
rewards and remuneration schemes, while adding welfare initiatives that would add value to our employees to better their lifestyles. Given below briefly are some of the more important initiatives currently in place:
DCSL• Continuous remuneration reviews and increases
according to predetermined scales, which could also be tied to performance incentives and bonus scheme.
• A range of insurance policies are in effect including Workmen’s Compensation and Personal Accident Insurance. DCSL PLC offers all employees this 24 hour insurance cover which includes a natural death cover.
• The DCSL Quiz Competition 2014/15 was held with the enthusiastic participation of the regions and divisions at the Colombo Office, Periceyl and Melstacorp. Over 100 employees participated in the quiz programme.
• DCSL holds annual staff get-together, sports days and children’s parties to build team spirit and facilitate fun and friendships
PericeylA continuous chain of performance related incentives including social activities, training initiatives and excursions/trips are extended to high achievers.
Continental InsuranceThe Continental Insurance HR policy aligns remuneration with employee performance and the reward strategy not only focuses on monetary rewards, which will have a short term impact on employee behaviour, but also timely appreciation and recognition of employees. All employees and their immediate family members are covered under the staff medical scheme which will ease the financial burden when hospitalisation is required.
Melsta Logistics LimitedThe Melsta Logistics team is covered under a comprehensive medical scheme and other facilities include cafeteria, resting areas and lockers.
Occupational Health & SafetyAs a diversified conglomerate with interests in wide-ranging economic activities including manufacturing, it is imperative that we make our workplaces safe. Occupational Health and Safety remains a high priority for the DCSL Group and
we have taken numerous steps to ensure, to the best of our ability, that the workplace is safe, hygienic and not harmful to our team’s health. Our manufacturing processes conform to accepted industry guidelines and practices in safety management and we have set for ourselves a target of ‘a zero accident workplace’. By being proactive, conscious and focused, we have inculcated a conscience and culture of prevention, while team members have been trained to remain alert to any gaps and hazards that may arise.
Giving back to the CommunityBalangoda Plantation contributes towards community development by providing financial support to workers including short term loans, housing loans and distress assistance, facilitating purchase of goods and equipment on easy payment schemes and so on, through the Estate Worker Housing Cooperatives, which are actively functioning on Balangoda Plantation. Community development efforts of Balangoda Plantations have not been limited to its own estate populations. The Company has always affirmed its commitment to its surroundings outside the plantation, by actively participating in estate village integration programmes and by extending certain facilities provided to the plantation community, to the villagers as well.
We have maintained cordial and mutually supportive community relations throughout the century of our existence on the basis that our surrounding communities are also stakeholders of the business. We continue to make an unwavering effort to closely identify with the communities in which we operate our businesses to ensure positive impacts through our presence and to make these communities an inherent part of our sustainable development process. We have thus identified two platforms as the focus for our community social initiatives, namely health, housing and sanitation and education and training.
Health, Housing and SanitationBalangoda Plantations has been actively involved in uplifting the lifestyles of its estate community by facilitating new housing and better working conditions. In addition, numerous awareness programmes were undertaken towards improving the socio economic growth and health and nutritional status, and living environment, youth empowerment and community capacity building, of the resident plantation population.

Dist i l ler ies Company of Sr i Lanka PLC52
Housing FacilitiesDuring the current year too, Balangoda Plantations continued its efforts at upgrading living standards of plantation communities by building 10 housing units for estate families. These new, modern housing units are built to high construction standards, enabling hygienic and healthy life styles for plantation families with the benefits of essential amenities and conducted a re-roofing programme for 23 housing units
Health CareBalangoda Plantation manages a number of child care centres and pre-schools within the plantations. The child care centres are supported by full-time trained teachers and nutritional feeding programmes. Regular child immunisation programmes are also conducted at the child care centres, ensuring access to proper child immunisation for estate children. Further, dental clinics, eye clinics, awareness programmes on alcohol abuse prevention, infectious/contagious diseases such as dengue, T.B. programmes on oral cancer prevention, de-worming and so on, are some of the many activities carried out to create a healthy community.
Economic ContributionToday, although our core business is beverages, our scope of business is diverse transcending different spheres across the national economy. Over the year, we have made inroads in telecommunications, plantations, apparel, BPO, logistics, hospitality, financial services, insurance, media and hydro-power, committing ourselves to add economic value to all these industry sectors, while being responsible for our actions and the decisions we make. Therefore, as a leading corporate, we will strive towards building continuous sustainable value, generating returns for our shareholders, while ensuring that we consciously do the right thing not only for our stakeholders, but for the environment as well. It is this holistic outlook that allows us to work proactively with all our stakeholders, creating shareholder wealth and social value, inspiring our team and permeating best practices among our suppliers.
Given our leadership status in the beverages industry, the company has been subjected to numerous actions, diktats and mandates that has continually stifled the legal alcohol and spirits industry, which have only served to allow the illegal trade to flourish. We believe that this situation will eventually take a toll on the nation’s health, both economically and socially. We are by far one of the
largest contributors to the national treasury, having paid Rs. 41 Bn at Group level this year. It is these funds that are eventually used by the state for meeting its development goals. Therefore, we are proud to be a major contributor to national development, as a legal, law abiding corporate citizen with future potential to contribute toward the nation’s development agenda.
The diversification of the DCSL Group into various industries has benefited the national economy through investments in human capital and on infrastructure, employment opportunities, uplifting industry standards and wider consumer choices. Our infrastructure investments into plant and machinery conform to stringent standards that naturally add value to the overall economy.
Similarly, all companies in the Group conform to numerous and relevant international standards and have gained certifications of compliance, which means that the entire industry is being improved through the setting of higher benchmarks.
Currently, the DCSL Group provides employment to 11,897 people while indirectly granting employment to many others. The benefits, remuneration, rewards and welfare gained by our employees also ensures that their families gain an improvement in their lifestyles, while additional education and training adds to elevating knowledge levels amongst our team
Industry LeadershipDCSL Group has contributed to industry development in different spheres of operations through knowledge sharing, innovative solutions and the latest technologies. Our companies embrace international best practices, standards and quality certifications that have contributed towards setting new standards within the industries we operate in. However, we have also shared our knowledge, skills and expertise with other corporates and like-minded individuals, as we believe knowledge sharing among the industry is vital for sustained growth and ultimately national development.
Investor RelationsDCSL continued to attract high level interest from foreign investors during the current financial year. We have conducted many meetings with current and prospective shareholders locally and overseas during the year. Such interest in the Company is symptomatic of positive external perceptions regarding the Company’s future potential towards growth in shareholder value.
SustainabilityReport

Annual Report 2014/15 53
Supplier EngagementForging strong supplier relationships offers a comprehensive way for DCSL to assess and streamline the processes between our organisation and our suppliers for an effective partnership. In reality, suppliers are people as well and we believe in emotionally engaging with our suppliers so that they work harder for us and help us cover potential risk areas.
Whatever the size or category of supplier, the DCSL’s Supplier Policy ensures a level playing field and equal opportunities for all our suppliers. We have procedures in place to ensure responsible behaviour towards all our suppliers, while committing our suppliers towards reciprocity in responsible behaviour towards the Company. This ensures our stringent quality and standards are understood and met by all our suppliers.
We believe strongly in positioning our supplier philosophy on good corporate conduct, sourcing and producing responsible quality products and influencing a win-win relationship worked on a platform of mutual benefit. Just as we position ourselves as a responsible industry leader, we strongly believe that we must permeate the best practices we have within our business, the standards and integrity and compliance initiatives to our entire supply chain. This in effect cascades to quality, productivity and standards overall being improved.
DCSL has a widespread and diverse supply chain spanning the full range of businesses from micro entrepreneurs, to SMEs to large corporates. We also emphasise among our supply chain and valued business partners the need to implement and promote business practices that not only encourage a safe workplace, but also request them ‘to do right’ by the environment, their employees and communities. In other words, we want them to, in turn, be responsible entities and individuals. Suppliers and business partners, once among the DCSL Group, are provided with further support and guidance, enabling improvement against these principles as the business relationship develops.
Our suppliers are selected on pre-determined criteria that would position them and align them to our standards and principles. This conformance goes beyond compliance and would by no means involve us in engaging or aiding and abetting illegal or hazardous and dangerous activities. We want our suppliers to be partners with us, in joining us in our journey that will truly be one of mutual respect, understanding and trust.
We Seek Suppliers into Our Value Chain who:• will proactively support our efforts to combat illegal and
illicit trade practices
• comply with laws and regulations pertaining to conducting business and environmental performance, occupational health and safety, do not support or condone child labour, slavery, harassment, corporal punishment or discrimination of gender or any other denominator
• are cognisant of human rights and the rights of workers
• do not engage in any fraudulent or corrupt practices
• provide their teams with a safe and healthy work environment
• actively engage to empower the communities in which they operate
Customer InteractionWe believe that nurturing our customers is an ongoing dialogue and not a one-off event. Nurturing an ongoing and genuine relationship with customers will have a major impact on the way they perceive our brand but also serve to strengthen our operations through focused customer feedback. We engage our customers in numerous ways, nurturing and strengthening relationships to ensure strong loyalty to brand and product. From face to face ad hoc conversations, to conducting customer surveys, to formal gatherings and informal events, we are constantly engaged with our consumer. It is this feedback and varied dialogue and communication channels we have created that have assuredly enabled us to charter our future plans.
Our beverage business is fundamentally about offering adult consumers a range of high quality products and brands with the necessary knowledge to make informed choices. We do not in any way coerce or inveigle our customers to stay with us and our portfolio of products by any illegal or unscrupulous means.
Moreover, though engaged in a legal industry forced to work in a dark market, prohibitive excise duties and constant taxation, our products have remained at the helm, which has thus driven us to continually exceed our customers’ demands. We do believe it is our responsibility to ensure that consuming alcohol must be done responsibly, knowing that the product is manufactured to high standards and is

Dist i l ler ies Company of Sr i Lanka PLC54
a proven brand of quality. Therefore, we are vociferous in numerous forums to curb and annihilate the illicit and illegal liquor trade. We work on education and awareness initiatives among various forums to take the message of the hazards and dangers posed to the eventual consumer in drinking illicit brew or illegal liquor, given that the latter too has no guarantee of quality.
Our subsidiary companies have continued to gain the trust and loyalty of their customers through their customer centric policies, innovative solutions and technology applications for increased cost savings and higher customer value creation.
Lanka Bell, the Group’s telecommunications subsidiary, commenced rolling out its 4G LTE network during the previous financial year in line with its planned schedule. Following a successful test run, LB formally launched its 4G connectivity in February 2014, becoming one of the three operators in the country to have a 4G-LTE network. The introduction of this latest technology is to offer world class data solutions to customers, while providing access to greater bandwidth capacity at faster speeds.
Continental Insurance provides comprehensive policies to large hotel chains operating luxury properties in Sri Lanka and the Maldives. CILL introduced an Android mobile application to all technical assessors to facilitate efficiency in the processing of claims. In addition, payments of premiums online were also introduced in order to cater to the growing market of online users, thereby giving customers an enhanced service with greater convenience and ease.
During its short period of operations, Melsta Regal Finance Ltd (MRF) introduced a wide spectrum of financial solutions in leasing, hire purchase, factoring, trade finance, corporate loans, personal loans and savings products for a client portfolio ranging from corporates to SMEs to consumers. The key focus of the current financial year was market expansion and product development. The geographical footprint of MRF was expanded to the key cities of Kurunegala, Matara, Kandy and Negombo.
Awards & Recognitions• DCSL was ranked No. 06 in Business Today’s ‘Top
Twenty Five’ edition. This was the 16th consecutive year DCSL was listed among corporate heavy weights in the ranking.
• Melsta Regal Finance won the bronze in SLIRTAD People Development Award 2014
Long term Sustainability Goals1. Be known as the preferred employer having the ability
to attract and retain talented people, inducting them in a knowledge-based corporate culture, while assuring them of career enhancement in a responsible company they will be proud to be a part of.
2. Retain market leadership by ensuring that we work on high quality sustainable competitive advantages to infuse trust and loyalty among our customer base by evolving the business to be ahead of customer expectations, which in turn will deliver qualitative and quantitative sustainable returns.
3. Never lose sight of the tenets of corporate stewardship; instil governance and regulatory best practices, while demonstrating our commitment to being an ethical, transparent, accountable Group of companies.
4. Create economic and social value among the communities we work with, supporting both the rural and urban economies and key industries that are earmarked to be drivers in national development.
5. Be a Green Ideologue; an advocate who will address environmental issues and ‘change’ the direction of climate change, walking the talk to spread the need to reduce our carbon footprint and ensure a better planet for future generations.
SustainabilityReport

Annual Report 2014/15 55
Corporate
GovernanceEnterprise GovernanceWorking on an integrated approach for applying governance throughout the organisation, DCSL practices the key principle of infusing the tenet that everyone is responsible for the performance of the Group, the management of risk and value creation. We strongly recommend and commit ourselves to ensuring that Enterprise Governance operates through people, processes, policy, procedure, culture and ethics.
The principles of governance are applied effectively by the Board of Directors and are seen in the consistent growth performance of the Group, while also improving the long term return to stakeholders. Beyond the Board, the application of governance methodologies and the integration of governance into other organisational functions, we strongly believe that it has significantly benefited the long term performance of DCSL. To further augment our effective governance strategies, we have implemented the following:
• Strive to achieve corporate objectives of managing strategy, risk and compliance to ensure long term returns to shareholders and other stakeholders.
• Oversee business objectives including management of IT, sustainability, finance and project portfolio management to ensure sustainable consistent results.
• Board of Directors remain emphatic on due diligence to ensure accountability, transparency and sincerity of action.
• Implemented an environment of responsible and balanced corporate governance that enhances integrity and respect for the Company and ensures the Company’s stewardship and stability in the industry and market.
• Introduced a culture in which the entire organisation takes ownership for risk, compliance and performance.
We infuse governance tenets that continue to hold us in high esteem and as a spearhead among our shareholders, stakeholders and peers. This is further augmented with our Board’s adherence to the highest standard of corporate behaviour and ethics at all times. To remain at the helm of Sri Lanka’s corporate landscape, we realise that we must incorporate new dimensions into our core decision-making
processes and practice due diligence to protect the interests of our shareholders, while maintaining an unrelenting focus on the expectations of other stakeholder segments.
DCSL has a strong and sound foundation of sustainability principles that remain the overarching fundamentals in instituting and maintaining uncompromising governance practices and principles. The section of the report details the governance structure and the practices and guidelines DCSL has adopted in ensuring that we remain within the parameters of the numerous regulatory and authorised bodies that govern the industry and the Company. We stringently adhere to and comply with the mandates of the Colombo Stock Exchange and Securities & Exchange Commission of Sri Lanka, NATA, Excise Department, Central Bank of Sri Lanka and the Government Treasury, Institute of Chartered Accountants of Sri Lanka, Telecommunication Regulatory Commission of Sri Lanka, Insurance Board of Sri Lanka, Central Environmental Authority, relevant Ministry and departmental authorisations and regulations and numerous Codes introduced by Professional Associations and the Chamber of Commerce from time to time.
This corporate governance statement defines in detail the structures and processes that we use in our organisation to balance the interests of our stakeholders, reviewed at regular intervals to ensure that Group’s expectations are met and are aligned with evolving growth strategies.
The Board of DirectorsRole of the Board of DirectorsThe Board of Directors is responsible to the Company’s shareholders to ensure at all times that the activities of the Company are conducted to the highest ethical standards and in the best interest of all stakeholders.
The key responsibilities of the Board are;
• To enhance shareholder value.
• Provide direction and guidance in formulating corporate strategies.
• Monitor systems and procedures especially with regard to internal controls and risk management.
• Approve major investments.
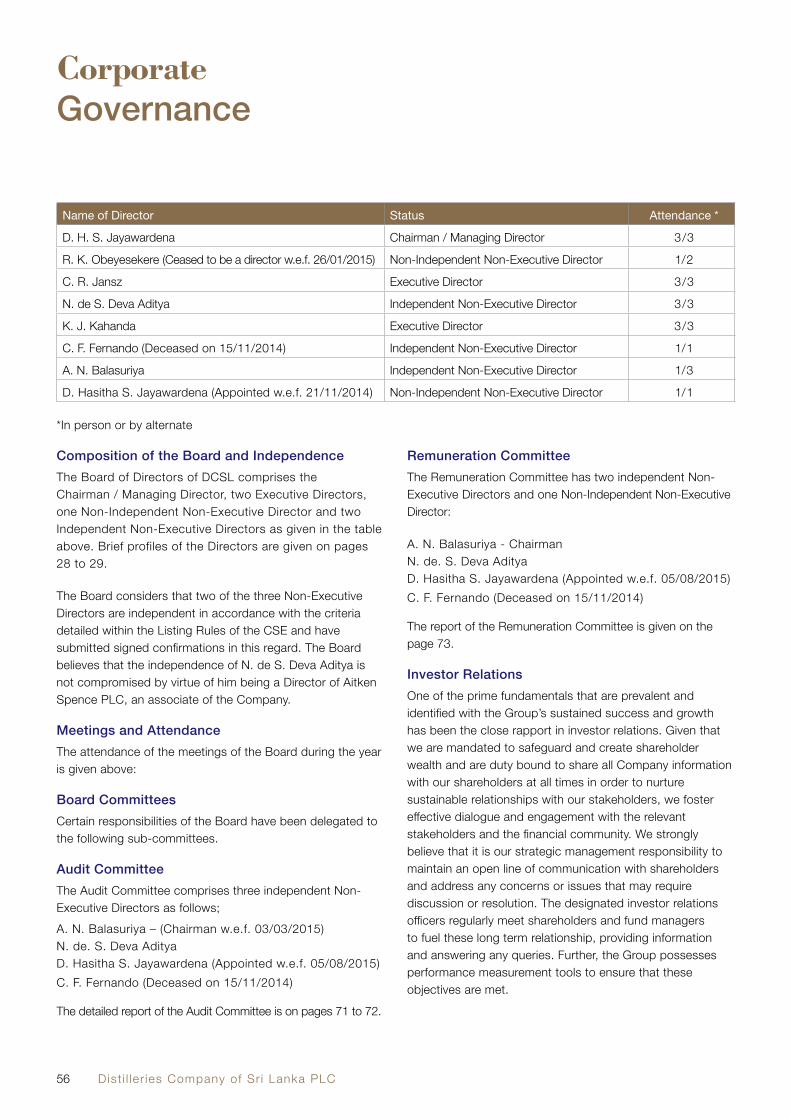
Dist i l ler ies Company of Sr i Lanka PLC56
Name of Director Status Attendance *
D. H. S. Jayawardena Chairman / Managing Director 3/3
R. K. Obeyesekere (Ceased to be a director w.e.f. 26/01/2015) Non-Independent Non-Executive Director 1/2
C. R. Jansz Executive Director 3/3
N. de S. Deva Aditya Independent Non-Executive Director 3/3
K. J. Kahanda Executive Director 3/3
C. F. Fernando (Deceased on 15/11/2014) Independent Non-Executive Director 1/1
A. N. Balasuriya Independent Non-Executive Director 1/3
D. Hasitha S. Jayawardena (Appointed w.e.f. 21/11/2014) Non-Independent Non-Executive Director 1/1
*In person or by alternate
Composition of the Board and IndependenceThe Board of Directors of DCSL comprises the Chairman / Managing Director, two Executive Directors, one Non-Independent Non-Executive Director and two Independent Non-Executive Directors as given in the table above. Brief profiles of the Directors are given on pages 28 to 29.
The Board considers that two of the three Non-Executive Directors are independent in accordance with the criteria detailed within the Listing Rules of the CSE and have submitted signed confirmations in this regard. The Board believes that the independence of N. de S. Deva Aditya is not compromised by virtue of him being a Director of Aitken Spence PLC, an associate of the Company.
Meetings and AttendanceThe attendance of the meetings of the Board during the year is given above:
Board CommitteesCertain responsibilities of the Board have been delegated to the following sub-committees.
Audit CommitteeThe Audit Committee comprises three independent Non-Executive Directors as follows;A. N. Balasuriya – (Chairman w.e.f. 03/03/2015)N. de. S. Deva AdityaD. Hasitha S. Jayawardena (Appointed w.e.f. 05/08/2015)C. F. Fernando (Deceased on 15/11/2014)
The detailed report of the Audit Committee is on pages 71 to 72.
Remuneration CommitteeThe Remuneration Committee has two independent Non-Executive Directors and one Non-Independent Non-Executive Director:
A. N. Balasuriya - ChairmanN. de. S. Deva AdityaD. Hasitha S. Jayawardena (Appointed w.e.f. 05/08/2015)C. F. Fernando (Deceased on 15/11/2014)
The report of the Remuneration Committee is given on the page 73.
Investor RelationsOne of the prime fundamentals that are prevalent and identified with the Group’s sustained success and growth has been the close rapport in investor relations. Given that we are mandated to safeguard and create shareholder wealth and are duty bound to share all Company information with our shareholders at all times in order to nurture sustainable relationships with our stakeholders, we foster effective dialogue and engagement with the relevant stakeholders and the financial community. We strongly believe that it is our strategic management responsibility to maintain an open line of communication with shareholders and address any concerns or issues that may require discussion or resolution. The designated investor relations officers regularly meet shareholders and fund managers to fuel these long term relationship, providing information and answering any queries. Further, the Group possesses performance measurement tools to ensure that these objectives are met.
Corporate Governance

Annual Report 2014/15 57
Apart from personal interaction with stakeholders, our quarterly financial statements and the Annual Report offer a comprehensive canvas of the Group’s performance, constituting the principal means of communication with the shareholders.
Internal ControlsThe Board instills and maintains a strong set of internal controls to safeguard shareholder wealth. The responsibility of the Board has been clearly stated as one where it is in charge of the Group’s internal control systems and will regularly review if they are adequately safeguarding Company and shareholder assets while supplying precise and timely information for informed decision making. The responsibility of the Board covers financial, operational and compliance related activities and risk management.
The main companies in the Group have established internal audit divisions that are controlled by the annual internal audit plans approved by the respective Boards. The Audit Committee reviews and monitors the activities and the findings of the internal audit divisions at regular intervals.
Going ConcernAfter an extensive review of the Group’s corporate plan, budgets, capital expenditure requirements and future cash flows, the Board has taken a decision to apply the Going Concern principle in the preparation of the Financial Statements for 2014 /15. Further, the Board is satisfied that the Group possesses the necessary funds for adequate liquidity and to sustain its operations for the foreseeable future
The Company’s compliance with the CSE Listing Rules and the best practices set out in the Code of Best Practice on Corporate Governance issued jointly by ICASL and SEC is set out in the following table:

Dist i l ler ies Company of Sr i Lanka PLC58
The Company’s compliance with the CSE Listing Rules
Section Applicable Rule Compliance Status Details
7.10.1 Non-Executive DirectorsAt least one third of the total number of Directors should be Non-Executive Directors.
Complied Three of the six Directors are Non-Executive Directors
7.10.2(a) Independent DirectorsTwo or one third of Non-Executive Directors, whichever is higher, should be Independent.
Complied Two of the three Non-Executive Directors are Independent
7.10.2(b) Independent Director’s Declaration each Non-Executive Director should submit a declaration of independence/ non-independence in the prescribed format
Complied
7.10.3(a) Disclosure relating to DirectorsThe Board shall annually make a determination as to the independence or otherwise of the Non-Executive Directors and names of Independent Directors should be disclosed in the Annual Report.
Complied Please refer page 56
7.10.3(b) Disclosure relating to DirectorsThe basis for the Board to determine a Director is Independent, if criteria specified for Independence is not met.
Complied Please refer page 56
7.10.3(c) Disclosure relating to DirectorsA brief resume of each Director should be included in the Annual Report and should include the Director’s areas of expertise.
Complied Please refer pages 28 to 29
7.10.3(d) Disclosure relating to DirectorsForthwith provide a brief resume of new Directors appointed to the Board with details specified in 7.10.3(a), (b) and (c) to the Exchange.
Complied A new Director was appointed during the year.Please refer pages 29 and page 56
7.10.4 Criteria for Defining ‘Independence’Selection criteria of Independent Directors of a listed company
Complied
7.10.5 Remuneration CommitteeA listed Company shall have a Remuneration Committee.
Complied Please refer page 73
7.10.5(a) Composition of Remuneration CommitteeShall comprise of Non-Executive Directors a majority of whom will be Independent.
Complied Two of the three Non-Executive Directors are independent
7.10.5(b) Functions of Remuneration CommitteeThe Remuneration Committee shall recommend the remuneration of the Chief Executive Officer and Executive Directors.
Complied Please refer page 73
Corporate Governance

Annual Report 2014/15 59
Section Applicable Rule Compliance Status Details
7.10.5(c) Disclosure in the Annual ReportThe Annual Report should set out;i. Names of the Directors comprising the Remuneration
Committee.
ii. Statement of Remuneration Policy
iii. Aggregated remuneration paid to Executive and Non-Executive Directors.
Complied
Complied
Complied
Please refer page 56
Please refer page 73
Please refer note 11 to the financial statements
7.10.6 Audit CommitteeThe Company shall have an Audit Committee
Please refer Audit Committeereport on page 71 to 72
7.10.6(a) Compositioni. Shall comprise of Non-Executive Directors a majority of
whom will be Independent.
ii. One Non-Executive Director shall be appointed as Chairman of the committee.
iii. Chief Executive Officer and Chief Financial Officer shall attend Committee meetings.
iv. The Chairman or one member of the Committee should be a member of a professional accounting body.
Complied
Complied
Complied
Complied
Please refer page 71
Please refer page 71
Please refer page 71
Please refer page 71
7.10.6(b) Functionsi. Overseeing the preparation, presentation and
adequacy of disclosures in the Financial Statements in accordance with Sri Lanka Accounting Standards
ii. Overseeing the compliance with financial reporting requirements, information requirements of the Companies Act and other relevant financial reporting related regulations and requirements
iii. Overseeing the process to ensure that the Entity’s internal controls and risk management, are adequate to meet the requirements of the Sri Lanka Accounting Standards / IFRS migration
iv. Assessment of the independence and performance of the entity’s external auditors
v. Make recommendations to the Board pertaining to appointment, re-appointment and removal of external auditors and to approve the remuneration and terms of engagement of the external auditors
Complied
Complied
Complied
Complied
Complied
Please refer Audit Committee report on pages 71 to 72

Dist i l ler ies Company of Sr i Lanka PLC60
Section Applicable Rule Compliance Status Details
7.10.6(c) Disclosure in Annual Reporti. The names of the Directors comprising the Audit
Committee.
ii. Basis of the determination of the Independence of the Auditors.
iii. Report by the Audit Committee setting out the manner of compliance by the Company.
Complied
Complied
Complied
Please refer Corporate Governance Report on page 56 and Audit Committee report on pages 71 to 72
Code of Best practice of Corporate Governance issued jointly by the Securities and Exchange Commission of Sri Lanka (SEC) and the Institute of Chartered Accountants of Sri Lanka (CA-Sri Lanka)
Ruling Index
Description of the Ruling Compliance Status
Details
A.1 The Board
A.1 Company to be headed by an effective board to direct and control the company
P Board consists of members who are qualified and experienced in various fields. Please refer Corporate Governance Report on page 55.
A.1.1 Regular Board meetings and supply of information. P Please refer Corporate Governance Report on page 56.
A.1.2 Board should be responsible for matters including implementation of business strategy, skills and succession of the management team, integrity of information, internal controls and risk management, compliance with laws and ethical standards, stakeholder interests, adopting appropriate accounting policies and fostering compliance with financial regulations and fulfilling other board functions.
P Please refer Corporate Governance Report, Report of the Board of Directors and Report of Audit Committee for the details.
A.1.3 Act in accordance with the laws of the country and obtain professional advice as and when required
P Please refer Report of the Board of Directors on page 74.
A.1.4 Access to advice and services of the Company Secretary P The company secretary position is headed by a professionally qualified company secretary.
A.1.5 Bring Independent judgment on various business issues and standards of business conduct
P All the Board members actively participate in the Board meetings by bringing up their own Independent judgment.
A.1.6 Dedication of adequate time and effort P The Directors dedicate sufficient time before a meeting to review Board Papers and call for additional information and clarification if necessary, and follow up issues consequent to the meeting.
Corporate Governance

Annual Report 2014/15 61
Ruling Index
Description of the Ruling Compliance Status
Details
A.1.7 Board induction & training P The Directors are provided with training as and when it is required
A. 2 Chairman and Chief Executive officer
A.2.1 Justification for combining the roles of the Chairman and CEO.
P The positions of Chairmen and CEO are separated
A.3 Chairman’s role
A.3.1 The Chairman should ensure Board proceedings are conducted in a proper manner
P Please refer Corporate Governance Report on page 56 for the following details
- effective participation of both Executive and Non-Executive Directors
- balance of power between Executive and Non-Executive Directors
A.4 Financial Acumen
A.4 The Board should ensure the availability within it of those with sufficient financial acumen and knowledge to offer guidance on matters of finance.
P Please refer the Audit committee report on page 71
A.5 Board Balance
A.5.1 In the event the Chairman and CEO is the same person, Non-Executive Directors should comprise a majority of the Board
N/A N/A
A.5.2 Where the constitution of the Board of Directors includes only two Non-Executive Directors, both such Non-Executive Directors should be ‘independent’
P Please refer Corporate Governance Report on page 56
A.5.3 Definition of Independent Directors P Please refer Corporate Governance Report on page 56
A.5.4 Declaration of Independent Directors P Please refer Corporate Governance Report on page 56
A.5.5 Board determinations on independence or non-independence of Non-Executive Directors.
P Please refer Corporate Governance Report on page 56
A.5.6 If an Alternate Director is appointed by a Non-Executive Director such Alternate Director should not be an executive of the company.
N/A N/A
A.5.7 In the event the Chairman and CEO is the same person, the Board should appoint one of the independent Non-Executive Directors to be the “Senior Independent Director” (SID)
N/A N/A

Dist i l ler ies Company of Sr i Lanka PLC62
Ruling Index
Description of the Ruling Compliance Status
Details
A.5.8 The Senior Independent Director should make himself available for confidential discussions with other Directors who may have concerns
N/A N/A
A.5.9 The Chairman should hold meetings with the Non-Executive Directors only, without the Executive Directors being present
P
A.5.10 Where Directors have concerns about the matters of the Company which cannot be unanimously resolved, they should ensure their concerns are recorded in the Board minutes
P
A.6 Supply of information
A.6.1 Board should be provided with timely information to enable it to discharge its duties
P
A.6.2 Timely submission of the minutes, agenda and papers required for the Board Meeting
P
A.7 Appointments to the Board
A.7 Formal and transparent procedure for Board appointments P Activities of the Nomination Committee are currently handled by the Board of Directors
A.7.1 Nomination Committee to make recommendations on new Board appointments
P Activities of the Nomination Committee are currently handled by the Board of Directors
A.7.2 Assessment of the capability of Board to meet strategic demands of the company
P Activities of the Nomination Committee are currently handled by the Board of Directors
A.7.3 Disclosure of new Board member profile and Interests P A new Director was appointed during the year. Please refer page 29
A.8 Re-election
A.8/ A.8.1/ A.8.2
Re-election at regular intervals and should be subject to election and re-election by shareholders
P Please refer Annual Report of the Directors on page 75
A.9 Appraisal of Board performance
A.9.1 The Board should annually appraise itself on its performance in the discharge of its key responsibilities
P
A.9.2 The Board should also undertake an annual self-evaluation of its own performance and that of its committees
P
Corporate Governance

Annual Report 2014/15 63
Ruling Index
Description of the Ruling Compliance Status
Details
A.9.3 The Board should state how such performance evaluations have been conducted
P
A.10 Disclosure of information in respect of Directors
A.10.1 Profiles of the Board of Directors and Board meeting attendance
P Please refer page 28 to 29 and Corporate Governance Report on page 56.
A. 11 Appraisal of the Chief Executive Officer
A.11.1/ A.11.2
Appraisal of the CEO against the set strategic targets P The CEO’s performance is reviewed annually.
B. Directors Remuneration
B.1 Remuneration Procedure
B.1.1 the Board of Directors should set up a Remuneration Committee
P
Please refer Remuneration Committee Report on 73
B.1.2 Remuneration Committees should consist exclusively of Non-Executive Directors
P
B.1.3 The Chairman and members of the Remuneration Committee should be listed in the Annual Report each year
P
B.1.4 Determination of the remuneration of Non-Executive Directors
P
B.1.5 The Remuneration Committee should consult the Chairman and/or CEO about its proposals relating to the remuneration of other Executive Directors
P
B.2 The Level and Makeup of Remuneration
B.2.1 to B. 2.4
Performance related elements in pay structure and alignment to industry practices
P
B.2.5 Executive share options should not be offered at a discount N/A N/A
B.2.6 Designing schemes of performance-related remuneration P
B.2.7/ B.2.8
Compensation commitments in the event of early termination of the Directors
P
B.2.9 Level of remuneration of Non-Executive Directors P
B.3 Disclosure of Remuneration
B.3/B.3.1 Disclosure of remuneration policy and aggregate remuneration
P Please refer Remuneration Committee Report on 73 and note 11 to the financial statements

Dist i l ler ies Company of Sr i Lanka PLC64
Ruling Index
Description of the Ruling Compliance Status
Details
C. Relations with Shareholders
C.1 Constructive use of the Annual General Meeting (AGM) and conduct of general meetings
P The Company holds the AGM within the appropriate regulatory time intervals and effectively uses it for communication with shareholders.
C.1.1 Counting of proxy votes P
C.1.2 Separate resolution to be proposed for each item P
C.1.3 Heads of Board sub-committees to be available to answer queries
P
C.1.4 Notice of Annual General Meeting to be sent to shareholders with other papers as per statute
P Please refer the page 173 of the Annual Report for the notice of the meeting.
C.1.5 Summary of procedures governing voting at General meetings to be informed
P
C.2 Communication with Shareholders
C.2.1 Channel to reach all shareholders to disseminate timely information
P
C.2.2 / C.2.7
Policy and methodology of communication with shareholders and implementation
P
C.3 Major and material transactions including major related party transactions
P
C.3.1 Disclosure of all material facts involving all material transactions including related party transactions
P Please refer note 35 to the Financial Statements.
D. Accountability and Audit
D.1 Financial Reporting
D.1.1 Disclosure of interim and other price-sensitive and statutorily mandated reports to Regulators.
P The Board presents a balanced and understandable assessment extends to interim and other price-sensitive public reports and reports to regulators, as well as to information required to be presented by statutory requirements complying with regulatory deadlines.
D.1.2 Declaration by the Directors that the company has not engaged in any activities, which contravene laws and regulations, declaration of all material interests in contracts, equitable treatment of shareholders and going concern with supporting assumptions or qualifications as necessary
P Please refer Annual Report of the Directors on page 74.
Corporate Governance

Annual Report 2014/15 65
Ruling Index
Description of the Ruling Compliance Status
Details
D.1.3 Statement of Directors Responsibility P Please refer the Statement of Directors Responsibility on Page 78.
D.1.4 Management Discussion and Analysis P Please refer Management Discussion and Analysis from page 34 to 42.
D.1.5 The Directors should report that the business is a going concern, with supporting assumptions or qualifications as necessary
P Please refer Annual Report of the Director on page 76.
D.1.6 Remedial action at EGM if net assets fall below 50% of value of shareholders’ funds
N/A N/A
D.1.7 Disclosure of Related Party Transactions P Please refer Note 35 to the Financial Statements.
D.2 Internal Control
D.2.1 Annual review of effectiveness of system of Internal Control and report to shareholders as required
P Please refer Audit Committee Report on page 71 and Annual Report of the Board of Directors on page 74.
D.2.2 Internal Audit Function P
D.2.3/ D.2.4
Maintaining a sound system of internal control P
D.3 Audit Committee
D.3.1 The Audit Committee should be comprised of a minimum of two Independent Non-Executive Directors or exclusively by Non-Executive Directors, a majority of whom should be independent, whichever is higher. The Chairman of the Committee should be a Non-Executive Director, appointed by the Board
P Please refer Audit Committee Report on pages 71 to 72.
D.3.2 Terms of reference, duties and responsibilities P
D.3.3 The Audit Committee to have written Terms of reference coving the salient aspects as stipulated in the section
P
D.3.4 Disclosure of Audit Committee membership P

Dist i l ler ies Company of Sr i Lanka PLC66
Ruling Index
Description of the Ruling Compliance Status
Details
D. 4 Code of Business Conduct and Ethics
D.4.1 Availability of a Code of Business Conduct & Ethics and an affirmative declaration that the Board of Directors abide by such Code
P Please refer Corporate Governance Report from page 55 to 66
D.4.2 The Chairman must certify that he/she is not aware of any violation of any of the provisions of this Code
P
D.5 Corporate Governance Disclosures
D.5.1 The Directors should include in the Company’s Annual Report a Corporate Governance Report
P Please refer Corporate Governance Report from pages 55 to 66
E. Institutional Investors
E.1 Shareholder Voting
E.1.1 Conducting regular and structured dialogue with shareholders based on a mutual understanding of objectives
P Please refer Corporate Governance Report from page 56
E.2 Evaluation of Governance Disclosures
E.2. When evaluating Companies’ governance arrangements, particularly those relating to Board structure and composition, institutional investors should be encouraged to give due weight to all relevant factors drawn to their attention
P Please refer Corporate Governance Report from page 56
F. Other Investors
F. 1 Investing / Divesting Decision
F. 1 Individual shareholders, investing directly in shares of companies should be encouraged to carry out adequate analysis or seek independent advice in investing or divesting decisions
P
F. 2 Shareholder Voting
F. 2 Individual shareholders should be encouraged to participate in General Meetings of companies and exercise their voting rights
P
G Sustainability Reporting
G.1/ G.1.7
Disclosure on adherence to sustainability principles P Please refer Sustainability Report from page 43 to 54
Corporate Governance

Annual Report 2014/15 67
Enterprise Risk ManagementUndoubtedly, there is risk in today’s volatile and uncertain business environment, which demands increased transparency within an organisation’s risk profile. There are vulnerabilities, probabilities, threats and weaknesses that must be addressed to ensure that risk in any enterprise is mitigated. This greater emphasis on risk and risk management also prompts greater penalties on entities that do not or fail to manage key risks, which naturally permeates to organisations being more cognisant of identifying and assessing risks. In this backdrop, it is also increasingly important that once these risks are identified and assessed, they are managed with pre-defined tolerances. Any entity faces myriad risks, from well known risks that are inherent and characteristic of the business to unknown risks that may emerge or are just emerging. Risk resilient organisations must objectively assess their existing risk management capabilities, evaluate their organisational culture with regard to risk, performance and reward and implement sustainable risk management practices.
In the current market context, risk is defined as the probability or threat of a liability, loss or other negative occurrence, caused by external or internal vulnerabilities which would affect the desired objectives of the organisation. This also means that stakeholder expectations must be worked into the organisation’s risk management strategy. Vulnerabilities could mean exposure that could trigger an adverse outcome and therefore, prevent the achievement of company objectives.
The process of risk management at DCSL involves analysing exposure to risks, by identifying vulnerabilities and their probability of occurrence, which determines the way we handle such exposure. This would therefore involve the implementation of numerous policies, procedures and practices that work in conjunction to identifying, analysing, evaluating, monitoring and prioritising risks, which will follow the application of coordinated and economical solutions that minimise the probability and impact of identified vulnerabilities. Once identified, elimination, reduction, transfer and retention are the broad risk management strategies employed across DCSL.
Changes in Risk ProfileGiven the range of industry, geographic locales and market segments that our business spans, the diversification which we have embarked upon provides a prudent pathway that would signal positive correlation between business and environmental risks, while on the converse, exposing the Group to a wider spread of risks, as well as opportunities.
This therefore prompts the DCSL Board to make risk assessment and identification of mitigating activities a priority and pivotal in achieving the Group’s strategic objectives. The Board is tasked with an overall responsibility for monitoring
risks and gaining assurance for managing these risks at an acceptable level.
Strategic Action PlanBoard oversight coupled with a strong organisational ethic is the cornerstone of DCSL risk framework.
The Board remains acutely aware that to generate business value it must manage and oversee all possible risks that the business or external factors could impose on the profitability of the Company, while in tandem, protecting and enhancing shareholder wealth. The DCSL Board is committed to deploying the highest standards of risk management to support a strong governance framework, ensuring that shareholder wealth is safeguarded from all the possible risk elements.
A dedicated team has been established to assist the Board in reviewing risk factors at regular intervals. Evaluation meetings are held to ensure that the focus from effective risk coverage remains strong and concentrated. The Board is kept updated on the progress and its opinion sought for mitigating any challenges that may emerge.
Risk Management FrameworkThe Group remains committed to increasing shareholder value within a carefully designed risk management framework. An effective risk management framework enables us to prioritise and allocate resources against those risks that underscore the ongoing sustainability of the organisation. Our systematic policies help us to identify and uncover risks and help us to be cognisant of the same. This preparedness builds the resilience of the organisation and allows us to establish procedures for risk mitigation.
The principal risks in achieving the Group objectives of enhancing shareholder value and safeguarding the Group’s assets have been identified as set out overleaf. The nature and the scope of risks are subject to change and not all of the factors listed, are within the control of your Company. It should be noted that the other factors besides those listed may affect the performance of the business, although we do reiterate, that we remain very vigilant to both internal and external factors that could prompt risk in any form and therefore, are able to, without delay, implement strategies to prevent, minimise or mitigate those ensuing risks.
DCSL Group’s risk management framework takes into account the range of risks to be managed, the systems and processes in place to deal with these risks and the chain of responsibility within the organisation to monitor the effectiveness of the mitigation measures.

Dist i l ler ies Company of Sr i Lanka PLC68
Enterprise Risk Management
Risk & Implication
Credit Risk & Implication Mitigation Strategies:
This risk ensues when a Group customer is unable to meet his financial obligations.
• Measure, monitor and manage credit risk for each borrower through clear credit approval procedures
• Regularly review customer credit ratings and constantly update records to ensure complete awareness of borrower credit status
Please refer financial risk management note on pages 155 to 160
Legal and Regulatory Risk & Implication Mitigation Strategies
Risks arising from non conformance to statutory and regulatory requirements remain a reality due to the possibilities of changes to regulations and policies being sudden or constant. It also increases costs and liabilities due to these periodic regulatory changes. The nature of our liquor, telecommunications, insurance and finance businesses continue to be subjected to a steady stream of changes in regulations and extensive compliance requirements. The authorities have severely restricted liquor advertising and limited other forms of communication with consumers via promotional and distribution activities, all of which affect profitability.
• Established a dedicated unit to keep abreast of all policy changes, to manage risk and ensure adherence to all regulations
• Recruitment of ex-regulators to senior positions within the Group with an objective of enhance regulatory awareness and increase compliance
Investment Risk & Implication Mitigation Strategies
The Group handles significant market investments which require smooth pre-study, monitoring and control. In this regard, there is stringent conformance by the Board in practicing due diligence.
• The Chairman / Managing Director is tasked with tracking returns on Group investments with the assistance of the Head of Finance and Group Financial Controller
• Carry out mark to market revaluation of equity portfolios to identify the viability of investments
• The Board develops policies and procedures to ensure that new investments and initiatives are subjected to mandatory compliance procedures.
• Regular reviews by Audit Committee and Internal Audit Division
Human Risk & Implication Mitigation Strategies
This is the risk arising from the inability to attract and retain skilled staff at middle to senior management levels. The migration of skilled workers, which is a phenomenon across most industry sectors, has created a brain-drain and the Group remains at risk of losing key personnel to better job prospects overseas.
• Maintaining above industry remuneration schemes
• Skills upgrading
• Professional growth avenues
• Performance-based reward systems
• Best practices being introduced and upgraded continually
• Measures taken to retain and minimise casual / temporary labour turnover.

Annual Report 2014/15 69
Risk & Implication
Operational Risk & Implication Mitigation Strategies
Operational risk is the risk of loss resulting from inadequate or failed internal processes, people and systems or from external events. The nature of our business renders us vulnerable to several common operational risks including fraud, human error, natural disasters, loss of data and unrequited disclosure of sensitive information.
• A structured internal control framework implemented works through a state of the art MIS system, internal audit mechanism and insurance policies
• A comprehensive system established to ensure that any loss is communicated to all related parties and across the company to prevent similar incidences
• Regular meetings are conducted to assess these risks
• Contingency plans are in place to minimise work-stop situations
• Regular reviews of contingencies and disaster recovery plans
• Financial risk arising from operation is covered in financial risk management on pages 155 to 160
Socio-Economic Risk & Implication Mitigation Strategies
Given the government dictate in stifling and repressing the consumption of alcohol and tobacco, there is a very real threat being imposed on the Company’s profitability and the perception of our business. In this milieu also exists a thriving of spurious liquor manufacturers, which naturally erodes our profitability base. A resurgent economy however should boost licit alcohol consumption.
• A committed Investigations Unit established to monitor and report illegal activities that challenge our business
Socio-Political Risk & Implication Mitigation Strategies
Socio-Political risk is the possibility of instability in a country or the world which would cascade to negatively impacting markets. Unrest of any kind could affect investor attitudes toward the markets in general, leading to disruption of business. Continuity of a cohesive policy towards local business is a key element here.
Our diversified portfolio of businesses encompasses investments that will not be minimally impacted. The only exception was the enactment of the Revival of Underperforming Enterprises and Underutilised Assets Act that re-acquired land of Pelwatte Sugar Industries PLC. Here again, the impact was managed and legal redress is being sought.
Technology Risk & Implication Mitigation Strategies
Stemming from the failure of the Group’s ICT systems where hardware, software and communications systems may have breakdowns, halts and herald lack of recovery, as a business that leverages strategically on ICT systems, we are very much aware of the potentiality of risk and the cascading negativities that could result to both business and profitability due to Technology Risk. The Group has identified system failures and theft of information as factors that can cause significant levels of operational, reputational and financial loss to the Group.
• Implementation of stringent barriers including password protection and restricted access, stringent user guidelines, contingency plans and physical security measures closely monitored by the Central IT Unit.
• Comprehensive backup and recovery systems in place
• A robust ERP system is deployed in the Company. Phased implementation of same across Group companies.

Dist i l ler ies Company of Sr i Lanka PLC70
Risk & Implication
Product Risk & Implication Mitigation Strategies
Product risk implies any negative impact or perceived impact of our products on stakeholders in general which could decrease our market share. There were no reported incidents of intoxication or health hazards arising from our range of liquor products.
• Employing established operating procedures to review and approve all raw material prior to use, to ensure maintenance of quality control
• Remain emphatic on safety, health and environmental hazards that may ensue due to possible negative publicity
• Equipping our R & D Team with ample knowledge to field any technical questions about our products
• Marketing and distribution procedures have complete control of the supply chain
Foreign Exchange Risk & Implication Mitigation Strategies
A depreciated Sri Lankan Rupee could impact the importation of rectified spirits and foreign brands in our distilleries portfolio.
• Remaining acutely attuned to the frequent changes seen in foreign currency rates with our bankers
• Monitoring local and international events and news related to economics which can impact to exchange rates
Please refer financial risk management note on pages 155 to 160.
Cheaper Product, Counterfeiting and Unethical Competition Risk & Implication
Mitigation Strategies
An increase in the import and in some cases smuggling and counterfeit of cheaper products that compete directly with our product portfolio could create an impact on our locally manufactured products, leading our products to be out priced in the market. This also endangers a reputational risk. The nature of the liquor business increases incidences of counterfeiting and smuggling of low quality or sub-quality liquor. The success of our brands also fuels a lucrative breeding ground for counterfeiters to indulge in illegal activity.
• Ensuring our products are competitively priced and continue to retain the highest standards of quality in order to drive a loyal consumer base who disregard cheaper options
• Our Investigations unit maintains close scrutiny on any counterfeit DCSL products in the market
• Communicate and demonstrate to our consumers on measures and processes in identifying DCSL brands, authorised dealers and retailers
• Continuing to improve manufacturing process which includes tamper proof bottles
• Make every effort to sustain and enhance brand equity, ensuring that consumers are not cheated in any manner due to third party action
• Co-operate with law enforcement bodies to curb illegal distillation
Enterprise Risk Management

Annual Report 2014/15 71
Audit Committee ReportCompositionThe Audit Committee appointed by and responsible to the Board of Directors comprises of three Independent Non- Executive Directors. Until 18th November 2014, the Chairman of the Committee was Mr. C .F. Fernando, a Senior Chartered Accountant and a former Managing Director of the Company. Following the demise of Mr. C. F. Fernando, the Board of Directors appointed Dr. A. N. Balasuriya, Independent Non-Executive Director as the Chairman of the Audit Committee of the Company as per the Listing Rules of Colombo Stock Exchange.
Mr. Ranjeevan Seevaratnan a fellow member of the Institute of Chartered Accountants of England & Wales was appointed as a consultant by the Board to assist the Chairman of the Audit Committee. Mr. Seevaratnam will be proposed to be appointed to the Board as an Independent Non-Executive Director and also be appointed as the Chairman of the Audit Committee at the Extra Ordinary General Meeting to be held on 21 September 2015. The other members of the Audit Committee comprise Mr. N. de S. Deva Aditya, Member of the European Parliament. Mr. D. Hasitha S. Jayawardena, Non-Independent Non-Executive Director was appointed to the Audit Committee on 05th August 2015.
A brief profile of each member is given on pages 28 to 29.
The Company Secretary functions as the Secretary to the Audit Committee.
MeetingsThe Audit Committee met three times during the year. Mr. N. de S. Deva Aditya could not attend any meetings during the year due to his engagements abroad. Nevertheless, Mr. Deva Aditya was represented at all meeting by his alternate and was kept informed of all the proceedings of the Audit Committee and his opinion was sought on important matters through his alternate on the Board. The attendance of the other members at these meetings is as follows:
Mr. C. F. Fernando 2/2
Dr. Naomal Balasuriya 3/3
The Group Financial Controller, Head of Finance and Chief Internal Auditor also attended these meetings by invitation when needed.
Terms of ReferenceThe Audit Committee Charter approved and adopted by the Board clearly sets out the terms of reference governing the Audit Committee ensuring highest compliance with the Corporate Governance Rules applicable to Listed Companies in accordance with the Rules of the CSE and the Code of Best Practice on Corporate Governance.
As allowed by the Listing Rules of the Colombo Stock Exchange, the Audit Committee of the Company, functions as the Audit Committee of each of the subsidiary companies which have not appointed a separate Audit Committee. All matters are dealt with through the Agenda of the Parent Company Audit Committee.
Activities and Responsibilities of Financial ReportingThe Committee reviewed and discussed the financial reporting system adopted by the Group in the preparation of its quarterly and annual financial statements with the Management and the External Auditors, the purpose being to ensure reliability of the processes and the consistency of the Accounting Policies adopted and its compliance with the Sri Lanka Accounting Standards ,International Financial Reporting Standards and the provisions of the Companies Act No. 07 of 2007.
Internal AuditThe internal audit function of the Company was carried out by the Internal Audit Division. The Committee reviewed the effectiveness of the internal audit plan to ensure that it was designed to provide reasonable assurance that the financial reporting system adopted by the Group can be relied upon in the preparation and presentation of the Financial Statements. The Committee also reviewed the findings of the Internal Auditors and their recommendations together with the management responses and regularly followed up the progress of the implementation of such recommendations in order to enhance the overall control environment.
External AuditThe Audit Committee met with the External Auditors to discuss the scope and the audit strategy including the coordination of the Group Audit. The Committee also reviewed the Report of the Auditors & Management Letters issued by them with and without the Management on separate occasions to ensure that no limitations were placed on their independence of work and conduct of the audit.

Dist i l ler ies Company of Sr i Lanka PLC72
The Committee carried out an annual evaluation of the External Auditors to establish their independence and objectivity and also obtained a written declaration from the Auditors in this regard. The Committee stipulated that the Lead Audit Partner is rotated every five years.
The Audit Committee recommended to the Board of Directors that Messrs. KPMG be reappointed as Auditors for the financial year ending 31 March 2016.
Compliance with Laws and RegulationsThe Committee reviewed the quarterly compliance reports submitted by the relevant officers to ensure that the Group complied with all statutory requirements.
ConclusionThe Audit Committee is satisfied that the Group’s accounting policies, operational controls and risk management processes provide reasonable assurance that the affairs of the Group are managed in accordance with Group policies and that Group assets are properly accounted for and adequately safeguarded.
Dr Naomal BalasuriyaChairman Audit Committee
25 August 2015
Audit Committee Report

Annual Report 2014/15 73
Remuneration Committee ReportThe Remuneration Committee of the Distilleries Company of Sri Lanka records with deep sorrow the passing away of Mr. C.F. Fernando, member of the Remuneration Committee. He was a tower of strength to this committee and it will miss him in its future deliberations. We wish to place on record our sincere appreciation for his significant contribution.
This committee comprises of two Independent, Non Executive Directors, namely Mr. N. de S. Deva Aditya, Member of the European Parliament and Dr. Naomal Balasuriya, Motivational Speaker, who chairs the Committee. Mr. D. Hasitha S. Jayawardena, Non-Independent Non-Executive Director was appointed to the Remuneration Committee on 05th August 2015.
Brief profiles of these Directors are given on pages 28 to 29.
The Remuneration Committee of the Distilleries Company of Sri Lanka is appointed and responsible to the Board of Directors of the Distilleries Company of Sri Lanka. Ms. Vijayanthi Senaratne, Company Secretary, functions as the Secretary to this Committee.
All members of this Committee are free from all business and other relationships that could hamper their duties as members of this body.
The Remuneration Committee is governed by the Remuneration Committee Charter, which has been approved
and adopted by the Board of Directors. It is responsible for determining the remuneration policy relating to the Chairman, Directors and the Key Management Personnel of the Company.
Chairman / Managing Director who is responsible for the overall management of the Company assists the Committee.
The Remuneration Committee is of the view that an attractive performance based remuneration package for the key Management Personnel of Distilleries Company of Sri Lanka is a critical need gap that calls for a highly attractive need gap filler in order to motivate them to steer the company to its next level of world class status.
Dr Naomal BalasuriyaChairmanRemuneration Committee
25 August 2015

Dist i l ler ies Company of Sr i Lanka PLC74
Annual Report of the Board of DirectorsThe Board of Directors of Distilleries Company of Sri Lanka PLC has pleasure in presenting the 25th Annual Report and the Audited Financial Statements of the Company and the Group for the financial year ended 31 March 2015.
Principal ActivitiesThe principal activities of Distilleries Company of Sri Lanka PLC are distillation, manufacture and distribution of liquor products. The Company has also invested in a portfolio of diverse business enterprises comprising the DCSL Group.
Business ReviewA review of the Group’s business, providing a comprehensive analysis of the financial and operational performance along with future trends and business development activities are described in the ‘Chairman’s Message’ and ‘Management Discussion and Analysis’ sections of the Annual Report.
Amount Due from Secretary to the Treasury o/a of Sri Lanka Insurance Corporation Ltd (SLIC)We still await the payment of profit earned during DCSL Group’s tenure at the helm of SLIC. We are hopeful that the profit earned to be paid as per the Supreme Court directive will be reimbursed to us early as possible. Detailed note is given in note 37 to the Financial Statements.
Pelwatte Sugar Industries PLC (PSIP)Following the expropriation of the PSIP by the State, the ownership of this property remains unresolved. The Company has not changed its position advocated since the occurrence of this unfortunate incident of being the legal owner of the property and as such, we have communicated our views to the Treasury. However, as a precautionary measure, the Company has also lodged an official claim with the Compensation Tribunal, appointed by the State. Since our group is deprived of participating in controlling the financial, operating policies and other relevant activities, the financial statements of PSIP have been deconsolidated from the group financial statements.
We hope some clarity regarding this untoward situation would be forthcoming within the new financial year. Further details are given in note 38 to the Financial Statements.
Melstacorp LimitedIn July 2014, Melstacorp Limited increased its investment in Continental Insurance Lanka Limited by 250 Mn. As a result stated capital of Continental Insurance has increased to Rs. 750 Mn.
Melstacorp Share Trust (Trustee) was created effective from 1 April 2011 for the holding of the company shares. Details are given in note 26.1 to the financial statements.
Results and AppropriationsThe gross turnover of the Group in the year under review amounted to Rs 66,765 Mn. The Group profit after tax was Rs. 6,474 Mn. The segmental analysis of the turnover and profit is provided in Note 5 to the Financial Statements.
The Board of Directors has recommended a dividend of Rs. 3.25 per share (2013/14 - Rs. 3.25 per share) for the financial year ended 31 March 2015, amounting to Rs. 975 Mn. The dividend payout for the year under review has been formulated in accordance with the Company’s policy to pay sustainable dividends linked to long term performance, keeping in view the Company’s need for capital for its growth plans and the intent to finance such plans through internally generated funds. An optimum debt / equity mix is warranted for DCSL given the volatility in money markets and fact that DCSL is taxed at high rate of 40%.
The Board of Directors confirm that the Company satisfies the requirements of the Solvency Test in accordance with Section 56 (2) of the Companies Act No. 07 of 2007 on the payment of the proposed dividend. A solvency certificate in this regard is received from the Auditors.
Financial StatementsThe Financial Statements of the Company and the Group for the year ended 31 March 2015 as approved by the Board of Directors on 25 August 2015 are given on pages 80 to 160.
Audit ReportThe Auditor’s Report on the Financial Statements of the Company and the Group is given on page 79.
Accounting PoliciesThe accounting policies adopted in the preparation and presentation of the Financial Statements are given on pages 86 to 103. There were no material changes in the accounting policies adopted by the Group during the year under review.
InvestmentsTotal investments of the Company in subsidiaries, associates and other equity investments amounted to Rs. 51,088 Mn (2013 /14 – Rs. 42,877 Mn). The details of the investments are given in Notes 19, 20 and 21 to the Financial Statements.
Property, Plant and EquipmentThe net book value of property, plant and equipment of the Company and the Group as at 31 March 2015 was 6,220 Mn (2013 /14 – Rs. 6,299 Mn) and Rs. 18,477 Mn (2013 /14 – Rs. 16,221 Mn.)

Annual Report 2014/15 75
Total capital expenditure during the year for acquisition of property, plant and equipment by the Company and the Group amounted to Rs. 4,481 Mn (2013/14 – Rs. 59 Mn) and Rs. 6,576 Mn (2013/14 – Rs. 964 Mn) respectively.
The details of property, plant and equipment are given in Note 15 to the Financial Statements.
Stated Capital and ReservesThe Stated Capital of the Company as at 31 March 2015 was Rs.300 Mn consisting of an equal number of Ordinary Shares. There was no change in the stated capital during the year. The total Group Reserves as at 31 March 2015 amounted to Rs. 60,706 Mn (2013 /14 – Rs. 53,336 Mn) comprising of Capital Reserves of Rs. 5,963 Mn (2013 /14 – Rs. 5,906 Mn) and Revenue Reserves & Retained Earnings of Rs. 54,743 Mn (2013 /14 - Rs. 47,430 Mn) the movement of which is disclosed in the Statement of Changes in Equity.
Internal Controls and Risk ManagementThe Directors acknowledge their responsibility for the Groups’ system of internal control. The systems are designed to provide reasonable assurance that the assets of the Group are safeguarded and to ensure that proper accounting records are maintained.
The Board, having reviewed the system of internal control is satisfied with the systems and measures in effect at the date of signing this report. At present DCSL is rolling out an ERP system across the Group.
Capital and Other CommitmentsContingent liabilities and capital commitments are disclosed in Note 38 and 39 to the Financial Statements of the Company.
Events after the Reporting PeriodThere were no material events or circumstances that have arisen since the reporting date that would require adjustment, other than the information disclosed in Note 41 to the Financial Statements.
EmployeesThe number of persons employed by the Company and Group as at 31 March 2015 was 1,197 (2013 /14 1,250) and 11,897 (2013 /14 -12,897) respectively.
Board of DirectorsThe Board of Directors of the Company as at 31 March 2015 and their brief profiles are given on pages 28 and 29.
During the year, the Board was deeply saddened at the passing away of our fellow director Mr. C. F. Fernando who was the Chairman of the Audit Committee too. His tenure on the Board was of much value to the Company.
Directors Standing for Re-electionIn terms of Article 92 of the Articles of Association of the Company, Capt. K. J. Kahanda and Dr. A. N. Balasuriya retire by rotation and being eligible are being recommended by the Board for re-election.
In terms of Article 98 of the Articles of Association of the Company D. Hasitha S. Jayawardena retire and being eligible is being recommended by the Board for re-election
Further, in terms of section 210 of the Companies Act, Mr. D. H. S. Jayawardena who is over the age of 70 years has to be reappointed by the membership annually. Accordingly, notice has been given of a resolution in terms of section 211 of the Companies Act No. 07 of 2007 to propose the reappointment of Mr. D. H. S. Jayawardena, notwithstanding the age limit of 70 years.
Interest RegisterThe Company maintains an Interest Register in compliance with the Companies Act No. 07 of 2007. This Annual Report also contains particulars of entries made in the Interest Register. Directors’ Interests in Contracts are disclosed in the Related Party Transactions under Note 35 to the Financial Statements. A Code of Business Conduct and Ethics along with other controls are in place to ensure that related party transactions involving directors, senior managers or their connected parties are conducted on an arm’s length basis. The Directors to the best of their knowledge and belief hereby confirm compliance with this code.
Directors’ ShareholdingsThe shareholdings of Directors of the Company as defined under the Colombo Stock Exchange Rules are as follows.
As at 31 As at 31March March2015 2014
D. H. S. Jayawardena Nil Nil
R. K. Obeyesekere (Ceased to be director w.e.f. 26/01/2015)
Nil Nil
C. R. Jansz Nil Nil
N. de S. Deva Aditya Nil Nil
Capt. K. J. Kahanda (Retd.) Nil Nil
C. F. Fernando (Deceased on 15/11/2014) - 2,062
Dr. A. N. Balasuriya Nil Nil
D. Hasitha S. Jayawardena (appointed w.e.f. 21/11/2014)
1,882,833 1,882,833

Dist i l ler ies Company of Sr i Lanka PLC76
Annual Report of the Board of Directors
Messrs. D. H. S. Jayawardena and R. K. Obeyesekere are shareholders of Milford Exports (Ceylon) Ltd. and Stassen Exports Limited, who hold significant stakes in the Company directly and indirectly. The shareholdings by these entities are available on page 164 of the Annual Report.
Directors’ RemunerationDirectors’ Remuneration in respect of the Company for the year is given in Note 11 to the Financial Statements.
Share InformationInformation relating to Earnings, Dividends, Net Assets and Market Value per Share is given on pages 4. There were 10,626 registered shareholders holding ordinary voting shares as at 31 March 2015. The distribution and the composition of shareholdings are given on page 163 of this report. Major Shareholdings details of the Twenty Major Shareholders of the Company including the number of shares held by them are given on page 164 of the Annual Report.
Corporate GovernanceThe Board has ensured that the Company has complied with the Listing Rules of the Colombo Stock Exchange and the Code of Best Practices on Corporate Governance issued by the Securities and Exchange Commission and the Institute of Chartered Accountants of Sri Lanka. The Board is committed towards the furtherance of Corporate Governance principles of the Company. The measures taken in this regard are set out in the Corporate Governance Report.
Board CommitteesThe Board has appointed two Sub-Committees i.e. the Audit Committee and the Remuneration Committee. The composition and responsibilities of the said Committees are detailed in the respective reports.
EnvironmentThe Company has not engaged in any activity that was detrimental to the environment and has been in due compliance with all applicable laws and regulations of the country to the best of its ability. The Group’s effort to conserve scarce and non-renewable resources are more fully described in the Sustainability Report.
Statutory PaymentsThe Directors, to the best of their knowledge and belief are satisfied that all statutory obligations due to the government and its employees have been duly paid or adequately provided for in the Financial Statements as confirmed by the Statement of Directors’ Responsibility.
Going ConcernThe Directors having reviewed the business plans, capital expenditure commitments and expected cash flows are satisfied that the Company and the Group have adequate resources to continue operations for the foreseeable future and therefore continue to adopt the going concern basis in preparing these Financial Statements.
AuditorsMessrs. KPMG, Chartered Accountants are deemed reappointed, in terms of section 158 of the Companies Act No. 07 of 2007, as Auditors of the Company. A resolution to authorise the Directors to determine their remuneration will be proposed at the Annual General Meeting. Total audit fees paid to Messrs. KPMG and other Auditors of Group companies are disclosed in Note 11 to the Financial Statements. The Auditors of the Company and its subsidiaries have confirmed that they do not have any relationship with the Company or its subsidiaries (other than that of Auditor) that would have an impact on their independence.
Annual General MeetingThe 25th Annual General Meeting of the Company will be held at the Sri Lanka Foundation Institute, on 21st September 2015 at 10.00 a.m. The Notice of Meeting appears on page 173 of the Annual Report.
For and on behalf of the Board of Directors,
D. H. S. Jayawardena C. R. JanszChairman / Managing Director Director
V. J. SenaratneCompany Secretary
25 August 2015Colombo

Annual Report 2014/15 77
Financial Statements 79 Independent Auditors’ Report 80 Statement of Profit or Loss and Other Comprehensive Income 81 Statement of Financial Position 82 Statement of Changes in Equity 85 Statement of Cash Flows 86 Notes to the Financial Statements
161 Statement of Value Added 162 Details of Real Estate 163 Shareholder Information 165 Ten Year Summary 166 DCSL Management Team 167 Group Directory 173 Notice of Meeting 175 Form of Proxy 177 Attendance Slip

Dist i l ler ies Company of Sr i Lanka PLC78
Statement of Directors Responsibility
The Directors are responsible under the Companies Act No. 07 of 2007, to ensure compliance of the requirements set out therein to prepare Financial Statements for each financial year giving a true and fair view of the state of the affairs of the Company and its Subsidiaries as at the Reporting date and the profit of the Company and its Subsidiaries for the financial year. The Directors are also responsible for ensuring that proper accounting records are kept to disclose, with reasonable accuracy, the financial position and enable preparation of the Financial Statements.
The Board accepts the responsibility for the integrity and objectivity of the Financial Statements presented. The Directors confirm that proper accounting records have been maintained and appropriate accounting policies have been selected and applied consistently in the preparation of such Financial Statements which have been prepared and presented in accordance with the Sri Lanka Accounting Standards and provide information required by the Companies Act and the Listing Rules of the Colombo Stock Exchange.
Further, the Directors confirm that the Financial Statements have been prepared on a going concern basis and are of the view that sufficient funds and other resources are available within the Group to continue its operations and to facilitate planned future expansions and capital commitments.
The Directors have taken adequate measures to safeguard the assets of the Group and in this regard have established appropriate systems of internal control with a view to preventing and detecting fraud and other irregularities.
The External Auditors were provided with all information and explanations necessary to enable them to form their opinion on the Financial Statements.
The Directors are confident that the Company would satisfy the solvency test as mandated under Section 56 (2) of the Companies Act No. 07 of 2007 regarding the payment of the proposed dividend and have sought a Certificate of Solvency from its Auditors.
Compliance ReportThe Directors confirm that to the best of their knowledge and belief that all statutory payments in relation to regulatory and statutory authorities that were due in respect of the Company and its Subsidiaries as at the reporting date have been paid or where relevant, provided for.
By Order of the Board,
V. J. SenaratneCompany Secretary
25 August 2015

Annual Report 2014/15 79
Independent Auditors’ Report
TO THE SHAREHOLDERS OF DISTILLERIES COMPANY OF SRI LANKA PLC
Report on the Financial StatementsWe have audited the accompanying financial statements of Distilleries Company of Sri Lanka PLC, (“the Company”), and the consolidated financial statements of the Company and its subsidiaries (“Group”), which comprise the statement of financial position as at 31 March 2015, and the statement of profit or loss and other comprehensive income, statement of changes in equity and, statement of cash flows for the year then ended, and a summary of significant accounting policies and other explanatory information set out on pages 80 to 160 of the annual report.
Board’s Responsibility for the Financial Statements The Board of Directors (“Board”) is responsible for the preparation of these financial statements that give a true and fair view in accordance with Sri Lanka Accounting Standards, and for such internal control as Board determines is necessary to enable the preparation of financial statements that are free from material misstatement, whether due to fraud or error.
Auditors’ Responsibility Our responsibility is to express an opinion on these financial statements based on our audit. We conducted our audit in accordance with Sri Lanka Auditing Standards. Those standards require that we comply with ethical requirements and plan and perform the audit to obtain reasonable assurance about whether the financial statements are free from material misstatement.
An audit involves performing procedures to obtain audit evidence about the amounts and disclosures in the financial statements. The procedures selected depend on the auditors’ judgment, including the assessment of the risks of material misstatement of the financial statements, whether due to fraud or error. In making those risk assessments, the auditor considers internal control relevant to the entity’s preparation of the financial statements that give a true and fair view in order to design audit procedures that are appropriate in the circumstances, but not for the purpose of expressing an opinion on the effectiveness of the entity’s internal control. An audit also includes evaluating the appropriateness
of accounting policies used and the reasonableness of accounting estimates made by Board, as well as evaluating the overall presentation of the financial statements.
We believe that the audit evidence we have obtained is sufficient and appropriate to provide a basis for our audit opinion.
OpinionIn our opinion, the consolidated financial statements give a true and fair view of the financial position of the Group as at 31 March 2015, and of its financial performance and cash flows for the year then ended in accordance with Sri Lanka Accounting Standards.
Report on Other Legal and Regulatory RequirementsAs required by section 163 (2) of the Companies Act No. 07 of 2007, we state the following:
a) The basis of opinion and scope and limitations of the audit are as stated above.
b) In our opinion:
- we have obtained all the information and explanations that were required for the audit and, as far as appears from our examination, proper accounting records have been kept by the Company,
- The financial statements of the Company give a true and fair view of its financial position as at 31 March 2015, and of its financial performance and cash flows for the year then ended in accordance with Sri Lanka Accounting Standards.
- The financial statements of the Company, and the Group comply with the requirements of sections 151 and 153 of the Companies Act No. 07 of 2007.
CHARTERED ACCOUNTANTSColombo25 August 2015

Dist i l ler ies Company of Sr i Lanka PLC80
Statement of Profit or Loss and Other Comprehensive Income
Group CompanyFor the year ended 31 March, 2015 2014 2015 2014
Notes Rs. 000 Rs. 000 Rs. 000 Rs. 000
Gross Revenue 6 66,764,509 63,186,302 51,800,065 47,755,538 Net Revenue 6 28,912,874 28,982,884 16,916,526 16,698,158 Cost of Sales, Net Benefits Paid and Interest Expenses 7 (16,233,934) (15,219,099) (8,093,405) (7,753,967)Gross Profit 12,678,940 13,763,785 8,823,121 8,944,191 Other Operating Income 8 1,376,876 898,392 6,251,274 1,374,595 Distribution Expenses (1,719,883) (1,814,190) (387,056) (331,688)Administrative Expenses (3,835,464) (3,591,995) (1,313,387) (1,109,827)Other Operating Expenses 9 (18,676) (729,142) - - Results from Operating Activities 8,481,793 8,526,850 13,373,952 8,877,271 Finance Income 10.1.1 566,668 747,833 191,846 118,630 Finance Cost 10.1.2 (711,309) (1,220,766) (495,479) (859,321)Net Finance Income 10 (144,641) (472,933) (303,633) (740,691)Share of Profit of Equity-Accounted Investees (Net of Tax) 20 1,390,668 1,440,182 - - Profit before Income Tax Expense 11 9,727,820 9,494,099 13,070,319 8,136,580 Taxation 12 (3,254,315) (3,263,009) (2,785,596) (2,778,643)Profit for the Year 6,473,505 6,231,090 10,284,723 5,357,937 Other Comprehensive IncomeItems that will never be Reclassified to Profit or LossRevaluation of Property, Plant and Equipment 26,092 - - - Share of Other Comprehensive Income of Equity-Accounted Investees (Net of Tax)
20.1 85,771 461,475 - -
Actuarial Gain/(Losses) on Retirement Benefit Obligations 31.1 (53,859) 29,547 (19,885) 5,585 Income tax on Other Comprehensive Income 22.1.1 11,382 (6,976) 7,954 (2,234)
69,386 484,046 (11,931) 3,351Items that are or may be Reclassified to Profit or LossNet Change in Fair Value of Available for Sale Financial Assets 1,708,471 (136,569) 721,172 217,263 Reversal of AFS Reserve on Disposal of AFS Investments - - (3,574,279) -
1,708,471 (136,569) (2,853,107) 217,263Total Other Comprehensive Income for the Year 1,777,857 347,477 (2,865,038) 220,614 Total Comprehensive Income for the Year 8,251,362 6,578,567 7,419,685 5,578,551
Profit attributable to:Equity Holders of the Parent 6,552,956 6,121,813 10,284,723 5,357,937 Non Controlling Interest (79,451) 109,277 - -
6,473,505 6,231,090 10,284,723 5,357,937 Total Comprehensive Income attributable to:Equity Holders of the Parent 8,339,918 6,457,079 7,419,685 5,578,551 Non Controlling Interest (88,556) 121,488 - -
8,251,362 6,578,567 7,419,685 5,578,551 Earnings per Share 13
Basic 21.84 20.41 34.28 17.86
Diluted 21.84 20.41 34.28 17.86
The notes from pages 80 to 160 form an integral part of these Financial Statements.Figures in brackets indicate deductions.

Annual Report 2014/15 81
Statement of Financial Position
Group CompanyAs at 31 March, 2015 2014 2015 2014
Notes Rs. 000 Rs. 000 Rs. 000 Rs. 000
ASSETSNon Current AssetsProperty, Plant and Equipment 15 18,477,298 16,221,042 6,219,769 6,298,670 Intangible Assets 16 2,736,603 2,990,493 22,971 23,640 Investment Property 17 586,095 - - - Biological Assets 18 3,551,869 3,176,036 - - Investments in Subsidiaries 19 - - 48,320,750 35,714,117 Investments in Equity Accounted Investees 20 24,192,237 22,994,509 28,703 28,703 Other Non Current Financial Investments 21 17,523,262 15,634,719 2,561,053 6,349,757 Deferred Tax Asset 22.1 502,714 396,816 54,845 44,068 Finance Lease and Hire Purchases Receivables 23 868,225 301,364 - - Advances and Other Loans 24 459,705 151,984 - -
68,898,008 61,866,963 57,208,091 48,458,955 Current AssetsInventories 25 4,984,050 4,435,796 2,796,489 2,246,156 Trade and Other Receivables 26 10,092,709 9,720,603 4,234,115 3,955,602 Finance Lease and Hire Purchases Receivables 23 311,999 114,199 - - Advances and Other Loans 24 1,224,551 673,015 - - Amounts due from Related Companies 35.1.1 672,539 567,714 426,925 5,324,230 Other Current Financial Investments 21 2,431,815 2,439,752 177,863 784,540 Cash at Bank and in Hand 27 4,072,931 3,923,512 184,718 420,103
23,790,594 21,874,591 7,820,110 12,730,631 Total Assets 92,688,602 83,741,554 65,028,201 61,189,586 Equity and LiabilitiesShare Capital and ReservesStated Capital 28 300,000 300,000 300,000 300,000 Reserves 29 22,751,448 20,832,013 11,341,703 14,871,455 Retained Earnings/(Losses) 37,952,431 32,504,269 38,641,622 28,667,185 Equity Attributable to Owners of the Company 61,003,879 53,636,282 50,283,325 43,838,640 Non Controlling Interest 3,820,118 3,956,832 - Total Equity 64,823,997 57,593,114 50,283,325 43,838,640 Non Current LiabilitiesInterest Bearing Loans and Borrowings 30 1,776,356 670,975 - - Deferred Tax Liabilities 21.1 1,301,892 733,350 532,164 60,958 Employee Benefits 31 949,961 831,769 137,110 110,170 Other Deferred Liabilities 32 258,935 252,571 - -
4,287,144 2,488,665 669,274 171,128 Current LiabilitiesTrade and Other Payables 33 10,211,241 8,772,678 6,032,439 5,146,561 Deposit Liabilities 34 511,789 663,537 - - Other Deferred Liabilities 32 56,112 56,730 - - Amount due to Related Companies 35.1.2 272,403 263,905 1,305,721 1,035,020 Income Tax Payable 463,460 1,178,888 260,986 972,399 Interest Bearing Loans and Borrowings 30 7,809,076 7,603,794 4,795,000 6,215,006 Bank Overdrafts 27 4,253,380 5,120,243 1,681,456 3,810,832
23,577,461 23,659,775 14,075,602 17,179,818 Total Liabilities 27,864,605 26,148,440 14,744,876 17,350,946 Total Equity and Liabilities 92,688,602 83,741,554 65,028,201 61,189,586 Net Assets per Share (Rs.) 203.35 178.79 167.61 146.13
The notes from pages 80 to 160 form an integral part of these Financial Statements. I certified that the Financial Statements are prepared and presented in compliance with the requirements of the Companies Act No.7 of 2007.
N.N. NagahawatteHead of FinanceThe Board of Directors is responsible for the preparation and presentation of these Financial Statements.Approved for and on behalf of the Board of Directors;
D. H. S. Jayawardena C. R. Jansz Chairman / Managing Director DirectorColombo, 25 August 2015

Dist i l ler ies Company of Sr i Lanka PLC82
Statement of Changes in EquityGr
oup
Attrib
utable
to E
quity
Hold
ers of
Pare
nt St
ated
Capit
alRe
valua
tion
Rese
rveCa
pital
Rese
rve R
eserv
eFu
ndGe
neral
Rese
rve
Exc
hang
e Flu
ctuati
onRe
serve
Timbe
rRe
serve
Ava
ilable
for
Sale
Rese
rve
Inves
tmen
t Fu
nd R
etaine
dEa
rning
s/(Lo
sses
)
Total
No
nCo
ntroll
ing
Intere
st
Total
Equit
y
Rs.0
00
Rs.0
00
Rs.0
00
Rs.0
00
Rs.0
00
Rs.0
00
Rs.0
00
Rs.0
00
Rs.0
00
Rs.0
00
Rs.0
00
Rs.0
00
Rs.0
00
Balan
ce as
at 01
April
2013
300,0
00
5,35
6,699
11
0,930
1,
131
8,21
0,000
32
8,935
56
5,806
5,
870,0
33
1,99
0 27
,232,3
24 4
7,977
,848
4,73
4,869
52,7
12,71
7 To
tal C
ompre
hens
ive In
come
for th
e peri
odPro
fit for
the Y
ear
-
-
-
-
-
-
-
-
-
6,121
,813
6,12
1,813
10
9,277
6,
231,0
90
Othe
r Com
prehe
nsive
Inco
meNe
t Cha
nge i
n Fair
Value
of Av
ailable
for
Sale
Finan
cial A
ssets
-
-
-
-
-
-
-
(136
,632)
-
(136
,632)
63
(136
,569)
Define
d Ben
efit Pl
an Ac
tuarial
Gain
s (Los
ses)
(Net o
f Tax)
-
-
-
-
-
-
-
10,42
3 10
,423
12,14
8 22
,571
Share
of O
ther C
ompre
hens
ive In
come
of
Equit
y-Acc
ounte
d Inv
estee
s (Ne
t of T
ax)
-
436,8
59
-
-
-
45,94
6 -
(5
,898)
-
(15,4
32)
461,4
75
-
461,4
75
Total
Othe
r Com
prehe
nsive
Inco
me fo
r the
Perio
d -
43
6,859
-
-
-
45
,946
-
(142
,530)
-
(5,00
9) 33
5,266
12
,211
347,4
77
Total
Com
prehe
nsive
Inco
me fo
r the P
eriod
-
436,8
59
-
-
-
45,94
6 -
(1
42,53
0) -
6,1
16,80
4 6,
457,0
79
121,4
88
6,57
8,567
Trans
actio
ns w
ith O
wners
Dire
ctly
Reco
rded i
n the
Equit
ySh
are of
Net
Asse
ts of
Equit
y-Acc
ounte
d Inv
estee
s (Ne
t of T
ax)
-
-
-
-
12,57
8 -
-
-
-
(5
,826)
6,75
2 -
6,
752
Divide
nds P
aid D
uring
the P
eriod
-
-
-
-
-
-
-
-
-
(900
,000)
(900
,000)
(15,6
88)
(915
,688)
Trans
ferred
from/
to Re
taine
d Earn
ings
-
-
-
667
-
-
32,11
5 -
85
4 (3
3,636
) -
-
-
Eff
ect o
n Cha
nge i
n Hold
ing in
Subs
idiarie
s -
-
-
-
-
-
-
-
-
94
,603
94,60
3 (9
4,714
) (1
11)
Effec
t on D
eeme
d Disp
osal
of Su
bsidia
ries
(Note
5.1)
-
-
-
-
-
-
-
-
-
-
-
(789
,123)
(789
,123)
Total
Con
tributi
ons b
y and
Dist
ributi
ons
to Ow
ners
-
-
-
667
12,57
8 -
32
,115
-
854
(844
,859)
(798
,645)
(899
,525)
(1,69
8,170
)
Balan
ce as
at 31
Marc
h 201
4 30
0,000
5,
793,5
58
110,9
30
1,79
8 8,
222,5
78
374,8
81
597,9
21
5,72
7,503
2,
844
32,50
4,269
53,6
36,28
2 3,
956,8
32 5
7,593
,114

Annual Report 2014/15 83
Grou
pAt
tributa
ble to
Equ
ity H
olders
of P
arent
State
d Ca
pital
Reva
luatio
nRe
serve
Capit
alRe
serve
Res
erve
Fund
Gene
ralRe
serve
E
xcha
nge
Fluctu
ation
Rese
rve
Timbe
rRe
serve
Ava
ilable
for
Sale
Rese
rve
Inves
tmen
t Fu
nd R
etaine
dEa
rning
s/(Lo
sses
)
Total
No
nCo
ntroll
ing
Intere
st
Total
Equit
y
Rs.0
00
Rs.0
00
Rs.0
00
Rs.0
00
Rs.0
00
Rs.0
00
Rs.0
00
Rs.0
00
Rs.0
00
Rs.0
00
Rs.0
00
Rs.0
00
Rs.0
00
Balan
ce as
at 01
Apr
il 201
4 30
0,000
5,
793,5
58
110,9
30
1,79
8 8,
222,5
78
374,8
81
597,9
21
5,72
7,503
2,
844
32,50
4,269
53,6
36,28
2 3,
956,8
32 5
7,593
,114
Total
Com
prehe
nsive
Inco
me fo
r the
Perio
dPr
ofit fo
r the Y
ear
-
-
-
-
-
-
-
-
-
6,552
,956
6,55
2,956
(7
9,451
) 6,
473,5
05
Othe
r Com
prehe
nsive
Inco
meNe
t Cha
nge i
n Fair
Value
of Av
ailable
for
Sale
Finan
cial A
ssets
-
-
-
-
-
-
-
1,708
,158
-
-
1,708
,158
313
1,70
8,471
Defin
ed B
enefi
t Plan
Actua
rial G
ains
(Loss
es) (N
et of
Tax)
-
-
-
-
-
-
-
-
-
(32,5
62)
(32,5
62)
(9,91
5) (4
2,477
)
Reva
luatio
n of P
ropert
y, Pla
nt an
d Eq
uipme
nt -
25
,595
-
-
-
-
-
-
-
25,59
5 49
7 26
,092
Share
of O
ther C
ompre
hens
ive In
come
of
Equit
y-Acc
ounte
d Inv
estee
s (Ne
t of T
ax)
-
118,5
54
-
-
-
(37,0
43)
-
28,08
5 -
(2
3,825
) 85
,771
- 85
,771
Othe
r Mov
emen
ts -
-
-
-
-
-
To
tal O
ther C
ompre
hens
ive In
come
for
the P
eriod
-
14
4,149
-
-
-
(3
7,043
) -
1,7
36,24
3 -
(5
6,381
) 1,
786,9
62
(9,10
5) 1,
777,8
57
Total
Com
prehe
nsive
Inco
me fo
r the
Perio
d -
14
4,149
-
-
-
(3
7,043
) -
1,7
36,24
3 -
6,4
96,56
9 8,
339,9
18
(88,5
56)
8,25
1,362
Trans
actio
ns w
ith O
wners
Dire
ctly
Reco
rded i
n the
Equit
yDiv
idend
s Paid
to N
on C
ontro
lling I
nteres
t -
-
-
-
-
-
-
-
-
-
-
(1
5,674
) (1
5,674
)Sh
are of
Net
Asse
ts of
Equit
y-Acc
ounte
d Inv
estee
s (Ne
t of T
ax)
-
(91,2
75)
-
-
63,85
6 -
62
,223
-
-
(34,0
90)
714
-
714
Divide
nds P
aid D
uring
the P
eriod
-
-
-
-
-
-
-
-
-
(975
,000)
(975
,000)
-
(975
,000)
Trans
ferred
from/
to Re
taine
d Earn
ings
-
-
-
4,19
4 -
-
39
,932
-
(2,84
4) (4
1,282
) -
-
-
Eff
ect o
n Cha
nge i
n Hold
ing in
Su
bsidi
aries
(Note
19.4)
-
-
-
-
-
-
-
-
-
1,96
5 1,
965
(32,4
84)
(30,5
19)
Total
Con
tributi
ons b
y and
Dist
ributi
ons
to Ow
ners
-
(91,2
75)
-
4,19
4 63
,856
-
102,1
55
-
(2,84
4) (1
,048,4
07)
(972
,221)
(48,1
58)
(1,02
0,479
)
Balan
ce as
at 31
Marc
h 201
5 30
0,000
5,
846,4
32
110,9
30
5,99
2 8,
286,4
34
337,8
38
700,0
76
7,46
3,746
-
37,9
52,43
1 61
,003,8
79
3,82
0,118
64,8
23,99
7
The
note
s fro
m p
ages
80
to 1
60 fo
rm a
n in
tegr
al pa
rt of
thes
e fin
ancia
l sta
tem
ents
.Fi
gure
s in
bra
cket
s in
dica
te d
educ
tions
.

Dist i l ler ies Company of Sr i Lanka PLC84
Statement of Changes in Equity
Com
pany
Sta
ted
Cap
ital
Rev
aluat
ion
Res
erve
C
apita
l R
eser
ve
Gen
eral
Res
erve
A
vaila
ble fo
r Sa
le Re
serve
R
etain
ed
Earn
ings
Tota
l
Rs.0
00
Rs.0
00
Rs.0
00
Rs.0
00
Rs.0
00
Rs.0
00
Rs.0
00
Balan
ce as
at 0
1 Ap
ril 20
13 3
00,0
00
2,0
52,2
42
107
,882
8
,210
,000
4
,364
,511
2
4,12
0,48
7 3
9,15
5,12
2 To
tal C
ompr
ehen
sive
Inco
me
for t
he P
eriod
Profi
t for
the Y
ear
-
-
-
-
-
5,3
57,9
37
5,3
57,9
37
Othe
r Com
preh
ensiv
e In
com
eNe
t Cha
nge i
n Fair
Value
of Av
ailable
for S
ale Fi
nanc
ial As
sets
-
-
-
-
217
,263
-
2
17,2
63
Actu
arial
Gain
/(Los
ses)
on R
etire
men
t Ben
efit O
bliga
tions
-
-
-
-
-
5,5
85
5,5
85
Tax o
n Ot
her C
ompr
ehen
sive I
ncom
e -
-
-
-
-
(2
,234
) (2
,234
) To
tal O
ther
Com
preh
ensiv
e Inc
ome f
or th
e Per
iod
-
-
-
-
217
,263
3
,351
2
20,6
14
Tota
l Com
preh
ensiv
e In
com
e fo
r the
Per
iod -
-
-
-
2
17,2
63
5,3
61,2
88
5,5
78,5
51
Tran
sact
ions w
ith O
wner
s Dire
ctly
Reco
rded
in th
e Eq
uity
Divid
ends
Paid
Dur
ing th
e Per
iod -
-
-
-
-
(9
00,0
00)
(900
,000
)De
ferre
d Ta
x -
4
,967
-
-
-
-
4
,967
Tra
nsfer
red
from
/to R
etain
ed E
arnin
gs -
(8
5,41
0) -
-
-
8
5,41
0 -
To
tal o
ther
Mov
emen
ts -
(8
0,44
3) -
-
-
8
5,41
0 4
,967
Ba
lance
as a
t 31
Mar
ch 2
014
300
,000
1
,971
,799
1
07,8
82
8,2
10,0
00
4,5
81,7
74
28,
667,
185
43,
838,
640
Balan
ce as
at 0
1 Ap
ril 20
14 3
00,0
00
1,9
71,7
99
107
,882
8
,210
,000
4
,581
,774
2
8,66
7,18
5 4
3,83
8,64
0 To
tal C
ompr
ehen
sive
Inco
me
for t
he P
eriod
Profi
t for
the Y
ear
-
-
-
-
-
10,
284,
723
10,
284,
723
Othe
r Com
preh
ensiv
e In
com
eNe
t Cha
nge i
n fai
r Valu
e of A
vaila
ble fo
r Sale
Fina
ncial
Ass
ets
-
-
-
-
(2,8
53,1
07)
-
(2,8
53,1
07)
Actu
arial
Gain
/(Los
ses)
on R
etire
men
t Ben
efit O
bliga
tions
-
-
-
-
-
(19,
885)
(19,
885)
Tax o
n ot
her C
ompr
ehen
sive I
ncom
e -
-
-
-
-
7
,954
7
,954
To
tal O
ther
Com
preh
ensiv
e In
com
e fo
r the
Per
iod
-
-
-
-
(2,8
53,1
07)
(11,
931)
(2,8
65,0
38)
Tota
l Com
preh
ensiv
e In
com
e fo
r the
Per
iod -
-
-
-
(2
,853
,107
) 1
0,27
2,79
2 7
,419
,685
Tr
ansa
ction
s with
Own
ers D
irect
ly Re
cord
ed in
the
Equit
yDi
viden
ds P
aid D
uring
the P
eriod
-
-
-
-
-
(975
,000
) (9
75,0
00)
Shar
e-Ba
sed
Paym
ent T
rans
actio
ns -
-
-
-
-
-
-
To
tal C
ontri
butio
ns b
y and
Dist
ribut
ions t
o Ow
ners
(975
,000
) (9
75,0
00)
Othe
r Mov
emen
ts in
Equ
ityDe
ferre
d Ta
xTra
nsfer
red
from
/to R
etain
ed E
arnin
gs -
(6
76,6
45)
-
-
-
676
,645
-
To
tal O
ther
Mov
emen
ts -
(6
76,6
45)
-
-
-
676
,645
-
Ba
lance
as a
t 31
Mar
ch 2
015
300
,000
1
,295
,154
1
07,8
82
8,2
10,0
00
1,7
28,6
67
38,
641,
622
50,
283,
325
The
note
s fro
m p
ages
80
to 1
60 fo
rm a
n in
tegr
al p
art o
f the
se fi
nanc
ial s
tate
men
ts.
Figu
res
in b
rack
ets
indi
cate
ded
uctio
ns.

Annual Report 2014/15 85
Statement of Cash Flows
Group CompanyFor the year ended 31 March, 2015 2014 2015 2014
Note Rs.000 Rs.000 Rs.000 Rs.000
CASH FLOW FROM OPERATING ACTIVITIESProfit for the Year 9,727,820 9,494,099 13,070,319 8,136,580 Adjustment for:(Gain) / Loss on sale of Property, Plant and Equipment (39,762) (30,331) (430,761) (50,767)Depreciation and Amortisation of PPE, Intangible Assets and Investment Property 1,535,441 1,502,987 160,882 148,392 Provision for Gratuity 161,231 151,125 20,641 21,445 Provision/(Reversal) of Inventories (6,828) 226,679 - - Provision /(Reversal) of Bad & Doubtful Debts and Impairment of Loans and Receivables. 174,749 (135,241) 7,916 25,057 Interest Expenses 777,005 1,186,613 495,478 862,274 Share of Profit of Equity-Accounted Investees (Net of Tax) (1,390,668) (1,440,182) - - Amortisation of Biological Assets 39,245 37,339 - - Amortisation of Deferred Grants and Subsidiaries (11,443) - - - (Gain)/Loss on Change in Fair Value of Financial Assets at Fair Value Through Profit or Loss (143,869) (53,338) (35,161) (66,877)Interest Income (422,630) (429,894) (156,684) (51,443)Recognition of Share Warrants at Fair Value - (225,081) - (310)(Profit)/Loss on Disposal of Other Financial Investments (337,023) (29,973) - (16,828)(Profit)/Loss on Sale of Subsidiaries, Associates and Quoted Shares - - (5,429,933) - Dividend Income (351,653) (405,809) (278,221) (1,159,818)Deferred Income Recognised (72,576) (85,660) - - Loss on Deemed Disposal of Subsidiary and Associate - 726,439 - - (Gain) / Loss on Fair Valuation of Biological Assets (92,377) (74,294) - - Operating Profit Before Working Capital Changes 9,546,662 10,415,478 7,424,476 7,847,705 Working Capital Changes(Increase)/Decrease in Receivables (2,343,083) (4,324,074) (514,246) (2,824,720)(Increase)/Decrease in Inventories (541,426) (324,392) (550,332) 257,642 Increase/(Decrease) in Payables 1,286,815 1,982,363 1,257,545 (1,481,625)Cash Generated from Operations 7,948,968 7,749,375 7,617,443 3,799,002
Finance Cost PaidInterest Paid (772,985) (1,182,530) (495,478) (862,274)Income Tax Paid (3,495,720) (2,723,126) (3,028,617) (2,244,381)Defined Benefit Plan Costs Paid (96,898) (106,980) (13,585) (21,056)Net Cash from/(used in) Operating Activities 3,583,365 3,736,739 4,079,763 671,291
CASH FLOW FROM INVESTING ACTIVITIESInvestment in Equity Accounted Investees (55,744) (507,636) - Acquisition of Property, Plant and Equipment,Intangible Assets and Investment Property (10,271,380) (4,812,025) (817,325) (2,700,384)Net Proceeds from Disposal / (Consideration Paid on Acquisition) of Other Financial Investments
585,369 (1,635,723) 577,319 (250,964)
Proceeds from the Sale of Property, Plant and Equipment 6,213,329 38,625 14,334 170,757 Interest Received 422,630 429,894 156,684 51,442 Dividend Received 686,822 656,045 278,221 1,159,818 Additions to Biological Assets (322,702) (334,721) - Net Cash Flow from Investing Activities (2,741,676) (6,165,542) 209,233 (1,569,331)
CASH FLOW FROM FINANCING ACTIVITIESPrincipal Repayment Under Lease Liabilities (10,160) (8,439) - - Proceeds from Long-Term Interest Bearing Loans and Borrowings 1,259,137 1,477,684 - - Repayments of Long-Term Interest Bearing Loans and Borrowings (162,904) (2,434,426) - (1,270,002)Dividend Paid (975,000) (897,859) (975,000) (897,859)Dividend Paid by Subsidiaries to Minority Share Holders (15,674) (15,688) - - Acquisition of Non Controlling Interests (30,686) - - Receipt of Deferred Income 89,765 78,951 - - Net Cash Generated from Financing Activities 154,478 (1,799,777) (975,000) (2,167,861)
Net Increase/(Decrease) in Cash and Cash Equivalents During the Year 996,167 (4,228,580) 3,313,996 (3,065,902)Net Cash and Cash Equivalents Derecognised via Derecognition of Subsidiaries - (13,182) - Cash and Cash Equivalents at the Beginning of the Year (8,155,308) (3,913,546) (9,605,735) (6,539,833)Cash and Cash Equivalents at the End of the Year (7,159,141) (8,155,308) (6,291,739) (9,605,735)
Analysis of Cash and Cash Equivalents at the End of the YearShort Term Deposits 27.1 3,180,904 3,044,934 42,099 82,062 Cash at Bank 27 804,823 595,628 66,553 61,719 Cash in Hand 27 17,862 206,471 6,724 199,883 Cash in Transit 27 69,342 76,479 69,342 76,439 Other Short Term Borrowings 30 (6,978,692) (6,958,577) (4,795,000) (6,215,006)Bank Overdrafts 27 (4,253,380) (5,120,243) (1,681,456) (3,810,832)
(7,159,141) (8,155,308) (6,291,738) (9,605,735) The notes from pages 80 to 160 form an integral part of these financial statements. Figures in brackets indicate deductions.

Dist i l ler ies Company of Sr i Lanka PLC86
1. Reporting Entity1.1 Domicile & Legal Form Distilleries Company of Sri Lanka PLC (Company)
is a quoted Public Limited Company incorporated and domiciled in Sri Lanka. The registered office and principal place of business of the Company is located at 110, Norris Canal Road, Colombo 10. The consolidated Financial Statements of Distilleries
Company of Sri Lanka PLC, as at and for the year ended 31 March 2015 comprise the Company and its subsidiaries (together referred to as the “Group”) and the Group’s interests in associates.
1.2 Principle Activities and Nature of Operation1.2.1 Company The principal activity of the Company is distillation,
manufacture and distribution of liquor products.
1.2.2 Subsidiaries
Name of Subsidiary Principal Activities1 Melstacorp Limited Investment Holding Company2 Balangoda Plantations PLC Cultivation and Processing of Tea & Rubber3 Bellvantage (Pvt) Ltd BPO, KPO & Software Development4 Bogo Power (Pvt) Ltd Generation and Sale of Hydro Electric Energy5 Browns Beach Hotel PLC Leisure6 Continental Insurance Lanka Limited General Insurance Services7 Melsta Logistics (Pvt) Ltd Automobile Servicing and Logistics8 Melsta Regal Finance Ltd Finance, Leasing, Hire Purchasing and Factoring9 Milford Holdings (Pvt) Ltd Investment Holding Company
10 Periceyl (Pvt) Ltd Distribution of Locally Manufactured Foreign Liquor11 Splendor Media (Pvt) Ltd Media Buying & Creative Services12 Timpex Ltd Investment Holding Company13 Melsta Properties (Pvt) Ltd Management of Real Estate14 Melsta Tower (Pvt) Ltd. Real Estate15 Melsta Technologies (Pvt) Ltd. IT Services16 Lanka Bell Ltd Telecommunication Services17 Texpro Industries Ltd Dyeing and Printing Woven Fabrics18 Negombo Beach Resorts (Pvt) Ltd Leisure19 Bell Solutions (Pvt) Ltd Information & Communication Technology20 Telecom Frontier (Pvt) Ltd Telecommunication Services
1.2.3 Associates
Name of Associate Principal Activities
1 Madulsima Plantations PLC Cultivation and Processing of Tea2 Aitken Spence PLC Diversified Holdings
1.3 Parent Enterprise and Ultimate Parent Enterprise The immediate and ultimate parent entity of Distilleries
Company of Sri Lanka PLC is Milford Exports Ceylon (Pvt) Limited.
2. Basis of Preparation2.1 Statement of Compliance The Financial Statements of the Company and the
Group have been prepared in accordance with new Sri Lanka Accounting Standards (referred “SLFRS”) as laid
down by the Institute of Chartered Accountants of Sri Lanka (ICASL) and the requirements of the Companies Act No. 07 of 2007.
2.2 Directors Responsibility for Financial Statements The Board of Directors is responsible for the
preparation and presentation of the Consolidated Financial Statements in accordance with Sri Lanka Accounting Standards (SLFRS).
Notes to the Financial Statements

Annual Report 2014/15 87
2.3 Approval of Financial statements The Consolidated Financial Statements for the year
ended 31 March 2015 were authorised for issue on 25 August 2015 by the Board of Directors.
2.4 Basis of Measurement The Consolidated Financial Statements have been
prepared on the historical cost basis and applied consistently with no adjustments being made for inflationary factors affecting the Financial Statements, except for the following items which are measured on an alternative basis on each reporting date.
Land and Building Fair valueDefined benefit obligation Actuarially valued and
recognised at present value of the defined benefit obligation
Available for sale financial assets
Fair Value
Fair value through profit or loss financial assets
Fair Value
Consumable Biological Assets
Fair Value
2.5 Functional and Presentation Currency The Consolidated Financial Statements are presented
in Sri Lankan Rupees, which is the Company’s functional currency. All financial information presented in Sri Lankan Rupees has been given to the nearest thousand, unless stated otherwise indicated.
2.6 Materiality and Aggregation Each material class of similar item is presented
separately in the Financial Statements. Items of dissimilar nature or function are presented separately unless they are immaterial.
2.7 Use of Estimates and Judgments The preparation of Financial Statements in conformity
with SLFRSs requires management to make judgments, estimates and assumptions that affect the application of accounting policies and the reported amounts of assets, liabilities, income and expenses. Actual results may differ from those estimates and judgemental decisions.
Estimates and underlying assumptions are reviewed on an ongoing basis. Revisions to accounting estimates are recognised prospectively.
Information about assumption and estimation uncertainty that have significant effect on the amounts recognised in the consolidated financial statements is included in notes;
Note 18 – Biological Assets
Note 26 – Provisions for bad and doubtful debts
Note 31 – Measurement of defined benefit plan; key actuarial assumptions
Note 38 – Provisions for contingencies; key assumptions about the likelihood and magnitude of an outflow of resources.
3. Significant Accounting Policies Except for the changes set out in Note 3.1 the Group
has consistently applied the accounting policies as set out below to all periods presented in these consolidated financial statements.
3.1 Changes in accounting policies The Group has adopted the following new standards
and amendments to standards, including any consequential amendments to other standards, with a date of initial application of 1 January 2014.
• SLFRS 10 - Consolidated Financial Statements.
• SLFRS 12 - Disclosure of Interests in Other Entities.
• SLFRS 13 - Fair Value Measurement.
The nature and the effects of the changes are explained below.
3.1.1 Subsidiaries As a result of SLFRS 10, the Group has changed
its accounting policy for determining whether it has control over and consequently whether it consolidates other entities. SLFRS 10 introduces a new control model that focuses on whether the Group has power over an investee, exposure or rights to variable returns from its involvement with the investee and the ability to use its power to affect those returns.
The change did not have a material impact on the Group’s financial statements.
3.1.2 Interests in other entities As a result of SLFRS 12, the Group has expanded
disclosures about its interests in subsidiaries (see Note 19.3.1).
Dist i l ler ies Company of Sr i Lanka PLC88
Notes to the Financial Statements
3.1.3 Fair value measurement In accordance with the transitional provisions of
SLFRS 13, the Group has applied the new definition of fair value, as set out in Note 3.11, prospectively. The change had no significant impact on the measurements of the Group’s assets and liabilities, but the group has included new disclosures in the financial statements, which are required under SLFRS 13. These new disclosure requirements are not included in the comparative information. However, to the extent that disclosures were required by other standards before the effective date of SLFRS 13, the Group has provided the relevant comparative disclosures under those standards.
3.2 Basis of consolidation The Financial Statements of the Company and Group
comprise the Financial Statements of the Company and its Subsidiaries for the year ended 31 March 2015 other than Periceyl (Pvt) Ltd, Continental Insurance Lanka Limited and Balangoda Plantations PLC whose financial year ends on 31 December. The difference between the reporting date of the above companies and that of the parent does not exceed three months but adjustments are made for any significant transactions or events up to 31 March.
3.2.1 Business combinations Business combinations are accounted for using
the acquisition method as at the acquisition date – i.e. when control is transferred to the Group. The consideration transferred in the acquisition is generally measured at fair value, as are the identifiable net assets acquired. Any goodwill that arises is tested annually for impairment. Any gain on a bargain purchase is recognised in profit or loss immediately. Transaction costs are expensed as incurred, except if they are related to the issue of debt or equity securities.
The consideration transferred does not include amounts related to the settlement of pre-existing relationships. Such amounts are generally recognised in profit or loss.
Any contingent consideration payable is measured at fair value at the acquisition date. If the contingent consideration is classified as equity, then it is not remeasured and settlement is accounted for within equity. Otherwise, subsequent changes in the fair value of the contingent consideration are recognised in profit or loss.
3.2.2 Non-controlling interests (“NCI”) NCI are measured at their proportionate share of the
acquiree’s identifiable net assets at the acquisition date. Changes in the Group’s interest in a subsidiary that do not result in a loss of control are accounted for as equity transactions.
3.2.3 Subsidiaries ‘Subsidiaries’ are investees controlled by the Group.
The Group ‘controls’ an investee if it is exposed to, or has rights to, variable returns from its involvement with the investee and has the ability to affect those returns through its power over the investee. The financial statements of subsidiaries are included in the consolidated financial statements from the date on which control commences until the date when control ceases.
3.2.4 Loss of control When the Group loses control over a subsidiary, it
derecognises the assets and liabilities of the subsidiary, and any related NCI and other components of equity. Any resulting gain or loss is recognised in profit or loss. Any interest retained in the former subsidiary is measured at fair value when control is lost.
3.2.5 Transactions eliminated on consolidation Intra-group balances and transactions, and any
unrealised income and expenses (except for foreign currency transaction gains or losses) arising from intra-group transactions, are eliminated in preparing the consolidated financial statements. Unrealised gains and losses resulting from transactions between the Group and its Associates are also eliminated in preparing the consolidated financial statements to the extent of the Group’s interests in the Associates.
Unrealised losses are eliminated in the same way as unrealised gains, but only to the extent that there is no evidence of impairment.
3.2.6 Interests in Equity Accounted Investees Associates are those entities in which the Group
has significant influence, but not control, over the financial and operating policies. Significant influence is presumed to exist when the Group holds between 20 and 50 percent of the voting power of another entity. Investments in associate’s entities are accounted for using the equity method (equity-accounted investees) and are recognised initially at cost. The cost of the investment includes transaction costs.

Annual Report 2014/15 89
The Consolidated Financial Statements include the Company’s share of the profit or loss and other comprehensive income, after adjustments to align the accounting policies with those of the Group, from the date that significant influence commences until the date that significant influence ceases.
When the Company’s share of losses exceeds its interest in an equity-accounted investee, the carrying amount of that interest, including any long-term investments, is reported at nil, and the recognition of further losses is discontinued except to the extent that the Group has an obligation or has made payments on behalf of the investee. If the associate subsequently reports profits, the Company’s resumes recognising its share of those profits only after its share of the profits equals the share of losses not recognised.
3.3 Property, Plant & Equipment3.3.1 Freehold Assets a. Recognition Properties, Plant & Equipments are tangible items that
are held for servicing, or for administrative purposes and are expected to be used during more than one period. Property, Plant & Equipment are recognised if it is probable that future economic benefits associated with the assets will flow to the Group and cost of the asset can be reliably measured.
b. Measurement Items of property, plant & equipment are measured at
cost or at fair value in the case of land and buildings less accumulated depreciation and accumulated impairment losses. The cost of property, plant & equipment includes expenditures that are directly attributable to the acquisition of the asset. The cost of self-constructed assets includes the cost of materials and direct labour, any other costs directly attributable to bringing the asset to a working condition for its intended use, and the costs of dismantling and removing the items and restoring the site on which they are located. When parts of an item of property, plant and equipment have different useful lives, they are accounted for as separate items (major components) of property, plant and equipment.
c. Subsequent Cost Subsequent costs are included in the asset’s
carrying amount or recognised as a separate asset, as appropriate, only when it is probable that future economic benefit associated with the item will flow to the Group and the cost of the item can be measured reliably. The cost of the day-to-day servicing of
property, plant and equipment are recognised in the profit or loss.
d. Impairment Carrying amount of property, plant & equipment are
reviewed for impairment whenever events or changes in circumstances indicate that the carrying amount may not be recoverable. An asset’s carrying amount is written down immediately to its recoverable amount if the asset’s carrying amount is greater than its estimated recoverable amount.
e. De-recognition An item of property, plant and equipment is
derecognised upon disposal or when no future economic benefits are expected from its use or disposal. Any gain or loss arising on derecognising of the asset (calculated as the difference between the net disposal proceeds and the carrying amount of the asset) is included in the Statement of Comprehensive Income in the year the asset is derecognised.
f. Revaluation The Group revalues its land and buildings at least
once in every five years which is measured at its fair value at the date of revaluation less any subsequent accumulated depreciation and accumulated impairment losses. On revaluation of land, any increase in the revaluation amount is credited to the revaluation reserve in shareholder’s equity unless it off sets a previous decrease in value of the same asset that was recognised in the profit or loss. A decrease in value is recognised in the profit or loss where it exceeds the increase previously recognised in the revaluation reserve. Upon disposal, any related revaluation reserve is transferred from the revaluation reserve to retained earnings and is not taken into account in arriving at the gain or loss on disposal.
g. Depreciation Depreciation is recognised in the profit or loss on a
straight-line basis over the estimated useful lives of each part of an item of property, plant & equipment. Freehold land is not depreciated. Assets held under finance lease are depreciated over the shorter of the lease term or the useful lives of equivalent owned assets. Depreciation is based on the cost of an asset less its residual value. Significant components of individual assets are assessed and if a component has a useful life that is different from the remainder of that asset, that component is depreciated separately. The estimated useful lives used for this purpose, which are consistent with that of the preceding years, are:

Dist i l ler ies Company of Sr i Lanka PLC90
Notes to the Financial Statements
Freehold Buildings 20 yearsPlant, Machinery & Equipment 10 yearsFurniture, Fittings, Office Equipment &Fire Fighting Equipment
10 years
Vats & Casks 10 yearsOil Storage Tanks 10 yearsComputers 03 yearsMotor Vehicles 04 yearsEmpty Drums 02 yearsKitchen Equipment 10 yearsSoft Furnishing, Crockery, Cutlery and Glassware
05 years
Depreciation of an asset begins when it is available for use and ceases at the earlier of the date that the asset is classified as held for sale and the date that the asset is derecognised.
Depreciation methods, useful lives and residual values are reviewed at each reporting date.
h. Capital Work-in-progress Capital work-in-progress is stated at cost. These are
expenses of a capital nature directly incurred in the construction of buildings, major plant and machinery, awaiting capitalisation.
3.3.2 Leased Assets Assets obtained under the finance lease, which
effectively transfer to the Group substantially, all of the risks and benefits incidental to ownership of the leased assets, are treated as if they have been purchased outright and are capitalised at their cash price. Assets acquired by way of a finance lease are measured at an amount equal to the lower of their fair value and the present value of minimum lease payments at the inception, less accumulated depreciation and accumulated impairment losses.
Assets held under finance lease are amortised over the shorter of the lease period or the useful lives of equivalent-owned assets, unless ownership is not transferred at the end of the lease period. The principal/ capital elements payable to the lessor are shown as liability/ obligation. The lease rentals are treated as consisting of capital and interest elements. The capital element in the rental that is applied to reduce the outstanding obligation and interest element is charged against profit, in proportion to the reducing capital element outstanding.
The cost of improvements to or on leased property is capitalised, disclosed as improvements to leasehold property and depreciated over the unexpired period of the lease, or the estimated useful lives of the improvements, whichever is shorter.
3.4 Investment Property Investment property is property held either to earn
rental income or for capital appreciation or for both, but not for sale in the ordinary course of the business, use in the production or supply of goods or services or administrative purpose. Investment properties are initially measured at its cost including related transaction costs. The group opts the cost model and it is therefore carried at its cost less any accumulated depreciation and any accumulated impairment losses.
Investment properties are derecognised when disposed or permanently withdrawn from use because no future economic benefits are expected. Any gains or losses retirement or disposal is recognised in the profit or loss in the year of retirement or disposal. Transfers are made to investment property, when there is a change in use. Where group company occupies in a significant portion of an investment property of a subsidiary, such investment properties are treated as property, plant & equipment the consolidated financial statements and accounted for as per LKAS 16 Property, Plant & Equipment.
3.5 Operating Leases When the lessor effectively retains substantially all
the risks and rewards of an asset under the lease agreement, such leases are classified as operating leases. Payments under operating leases are recognised as expense in the profit or loss over the period of lease on a straight line basis.
3.6 Intangible Asset An intangible asset is recognised if it is probable
that future economic benefits will flow to the entity and the cost of the asset can be measured reliably in accordance with LKAS 38 “Intangible Assets”. Intangible assets with finite useful lives are measured at cost less accumulated amortisation and accumulated impairment losses.
3.6.1 Goodwill Goodwill represents the excess of the cost of
acquisition over the fair value of Group’s share of the net identifiable assets of the acquired Subsidiary at the date of acquisition. Goodwill acquired in a business combination is tested annually for impairment or

Annual Report 2014/15 91
more frequently if events or changes in circumstance indicate that it might be impaired and carried at cost less accumulated impairment losses. Impairment losses on goodwill are not reversed.
Goodwill is allocated to cash generating units for the purpose of impairment testing. The allocation is made to those cash generating units or groups of cash generating units that are expected to benefit from the business combination in which goodwill arose.
3.6.2 Amortisation Amortisation is recognised in profit or loss on a
straight line basis over the estimated useful lives of intangible assets from the date that they are available for use. The estimated useful lives for the current and comparative periods are as follows:
Computer Software 3 years
3.7 Inventories Inventories are measured at the lower of cost or net
realisable value. Net realisable value is the estimated selling price in the ordinary course of business less the estimated cost of completion and selling expenses. The general basis on which cost is determined is: all inventory items, except manufactured inventories and work-in progress are measured at weighted average directly attributable cost.
Manufactured inventories and work-in-progress are measured at weighted average factory cost which includes all direct expenditure and appropriate shares of production overhead based on normal operating capacity.
3.8 Financial Instruments3.8.1 Non-derivative Financial Assets The Group recognises a financial asset or financial
liabilities in its Statement of Financial Position when the Group becomes a party to the contractual provisions of the instrument.
Financial assets are initially measured at fair value. Transaction costs that are directly attributable to the acquisition or issue of a financial asset (other than financial assets at fair value through profit and loss) are added or deducted from the fair value of the financial asset, as appropriate, on initial recognition. Transaction costs that are directly attributable to the acquisition of financial assets at fair value through profit or loss are recognised immediately in profit or loss.
The Group has following non derivative financial assets: Fair value through profit or loss, Loans and receivables, Held to Maturity and Available for sale.
a. Fair Value Through Profit or Loss A financial asset is classified as fair value through
profit or loss if it is classified as held for trading or is designated as such upon initial recognition. Financial assets are designated as fair value through profit or loss if the Group manages such investments and makes purchase and sales decisions based on their fair value in accordance with the Group’s documented risk management or investment strategy. Upon initial recognition attributable transaction costs are recognised in profit or loss as incurred. Financial assets at fair value through profit or loss are measured at fair value, and changes therein are recognised in profit or loss.
Fair value through profit or loss comprise trading portfolio of the Group which includes investment in quoted shares and share warrants.
b. Loans and Receivables Loans and receivables are financial assets with fixed or
determinable payments that are not quoted in an active market. Such assets are recognised initially at fair value plus any directly attributable transaction costs. Subsequent to initial recognition loans and receivables are measured at amortised cost using the effective interest method less any impairment losses. Loans and receivables comprise trade receivables, amounts due for related parties, trust certificates, short term deposits and cash and cash equivalents.
c. Held to Maturity If the Group has the positive intent and ability to hold
debt securities to maturity, then such financial assets are classified as held-to-maturity. Held to Maturity financial assets are recognised initially at fair value plus any direct attributable transaction costs. Subsequent to initial recognition, held-to-maturity financial assets are measured at amortised cost using effective interest method, less any impairment losses.
Held to Maturity financial assets comprise debt securities.
d. Available-for-Sale Financial Assets Available-for-sale financial assets are non-derivative
financial assets that are designated as available-for-sale or are not classified in any of the above categories of financial assets. Available-for-sale financial assets

Dist i l ler ies Company of Sr i Lanka PLC92
Notes to the Financial Statements
are recognised initially at fair value plus any directly attributable transaction costs.
Subsequent to initial recognition, they are measured at fair value and changes therein, other than impairment losses, are recognised in other comprehensive income and presented in the fair value reserve in equity. When an investment is derecognised, the gain or loss accumulated in available for sale reserve is reclassified to profit or loss.
Available- for-sale financial assets comprise of investment in unquoted shares and unit trust an quoted shares purchased for long term investment purpose.
e. Cash and Cash Equivalents Cash and cash equivalents comprise cash balances
and call deposits. Bank overdrafts that are repayable on demand and form an integral part of the Group’s cash management are included as a component of cash and cash equivalents for the purpose of the Statement of Cash Flows.
Investments with short maturities, i.e. three months or less from the date of acquisition are also treated as cash equivalents.
f. De-recognition The Group derecognises the financial asset when
the rights to receive cash flows from the asset have expired or when it transfer the financial asset in a transaction in which substantially all the risks and rewards of ownership of the financial asset are transferred or in which the Group neither transfers nor substantially all risks and rewards of ownership and it does not retain control of the financial asset.
3.8.2 Non- derivative Financial Liabilities Non-derivative financial liabilities are recognised initially
at fair value plus any directly attributable transaction costs. Subsequent to initial recognition, these financial liabilities are measured at amortised cost using the effective interest method.
Financial liabilities comprise of interest bearing loans, trade and other payables and bank overdrafts. Bank overdrafts that are repayable on demand and form an integral part of the Group’s cash management are included as a component of cash and cash equivalents for the statement of cash flows.
a. De-recognition The Group derecognises a financial liability when its
contractual obligations are discharged, cancelled or expired.
3.9 Stated Capital Ordinary Capital Ordinary Shares are classified as equity. Incremental
costs directly attributable to the issue of ordinary shares and share options are recognised as a deduction from equity, net of any tax effects.
3.10 Impairment 3.10.1 Non Financial Assets The carrying amounts of the Group’s assets are
reviewed at each reporting date to determine whether there is any indication of impairment. If any such indication exists then the asset’s recoverable amount is estimated. For goodwill that has indefinite life, recoverable amount is estimated at each reporting date or more frequently, if events or changes in circumstances indicate that it might be impaired.
An impairment loss is recognised if the carrying amount of an asset or its cash-generating unit exceeds its recoverable amount. A cash-generating unit is the smallest identifiable asset group that generates cash flows that are largely independent from other assets and groups.
The recoverable amount of an asset or cash-generating unit is the greater of its value in use and its fair value less costs to sell. In assessing value in use, the estimated future cash flows are discounted to their present value using a pre-tax discount rate that reflects current market assessments of the time value of money and the risks specific to the asset. An impairment loss in respect of goodwill is not reversed.
3.10.2 Financial Assets A financial asset not carried at fair value through profit
or loss is assessed at each reporting date to determine whether there is objective evidence that it is impaired. A financial asset is impaired if objective evidence indicates that a loss event has occurred after the initial recognition of the asset, and that the loss event had a negative effect on the estimated future cash flows of that can be estimated reliably. Objective evidence that financial assets are impaired can include default or delinquency by a debtor, restructuring of an amount due to the Group on terms that the Group would not consider otherwise, indications that a debtor or issuer will enter bankruptcy, or the disappearance of an active market for a security.

Annual Report 2014/15 93
Financial Assets measured at Amortised Cost The Group considers evidence of impairment for
financial assets measured at amortised cost (loans and receivables and held-to-maturity financial assets) at both a specific asset and collective level. All individually significant assets are assessed for specific impairment. Those found not to be specifically impaired are then collectively assessed for any impairment that has been incurred but not yet identified. Assets that are not individually significant are collectively assessed for impairment by grouping together assets with similar risk characteristics. In assessing collective impairment, the Group uses historical trends of the probability of default, the timing of recoveries and the amount of loss incurred, adjusted for management’s judgment as to whether current economic and credit conditions are such that the actual losses are likely to be greater or lesser than suggested by historical trends. An impairment loss in respect of a financial asset measured at amortised cost is calculated as the difference between its carrying amount and the present value of the estimated future cash flows discounted at the asset’s original effective interest rate. Losses are recognised in profit or loss and reflected in an allowance account against loans and receivables or held-to-maturity investment securities. Interest on the impaired asset continues to be recognised. When an event occurring after the impairment was recognised causes the amount of impairment loss to decrease, the decrease in impairment loss is reversed through profit or loss.
Available-for-Sale Financial Assets Impairment losses on available-for-sale financial
assets are recognised by reclassifying the losses accumulated in the fair value reserve to profit or loss. The amount reclassified is the difference between the acquisition cost (net of any principal repayment and amortisation) and the current fair value, less any impairment loss previously recognised in profit or loss. If the fair value of an impaired available-for-sale debt security subsequently increases and the increase can be related objectively to an event occurring after the impairment loss was recognised, then the impairment loss is reversed through profit or loss; otherwise, it is reversed through OCI.
3.11 Fair value measurement Policy applicable from 1 January 2014 ‘Fair value’ is the price that would be received to sell
an asset or paid to transfer a liability in an orderly transaction between market participants at the measurement date in the principal or, in its absence,
the most advantageous market to which the Group has access at that date. The fair value of a liability reflects its non-performance risk.
When available, the Group measures the fair value of an instrument using the quoted price in an active market for that instrument. A market is regarded as active if transactions for the asset or liability take place with sufficient frequency and volume to provide pricing information on an ongoing basis.
If there is no quoted price in an active market, then the Group uses valuation techniques that maximise the use of relevant observable inputs and minimise the use of unobservable inputs. The chosen valuation technique incorporates all of the factors that market participants would take into account in pricing a transaction.
The best evidence of the fair value of a financial instrument at initial recognition is normally the transaction price – i.e. the fair value of the consideration given or received. If the Group determines that the fair value at initial recognition differs from the transaction price and the fair value is evidenced neither by a quoted price in an active market for an identical asset or liability nor based on a valuation technique that uses only data from observable markets, then the financial instrument is initially measured at fair value, adjusted to defer the difference between the fair value at initial recognition and the transaction price. Subsequently, that difference is recognised in profit or loss on an appropriate basis over the life of the instrument but no later than when the valuation is wholly supported by observable market data or the transaction is closed out.
If an asset or a liability measured at fair value has a bid price and an ask price, then the Group measures assets and long positions at a bid price and liabilities and short positions at an ask price.
Portfolios of financial assets and financial liabilities that are exposed to market risk and credit risk that are managed by the Group on the basis of the net exposure to either market or credit risk are measured on the basis of a price that would be received to sell a net long position (or paid to transfer a net short position) for a particular risk exposure. Those portfolio-level adjustments are allocated to the individual assets and liabilities on the basis of the relative risk adjustment of each of the individual instruments in the portfolio.

Dist i l ler ies Company of Sr i Lanka PLC94
Notes to the Financial Statements
The fair value of a demand deposit is not less than the amount payable on demand, discounted from the first date on which the amount could be required to be paid.
The Group recognises transfers between levels of the fair value hierarchy as of the end of the reporting period during which the change has occurred.
Policy applicable before 1 January 2014 ‘Fair value’ is the amount for which an asset
could be exchanged, or a liability settled, between knowledgeable, willing parties in an arm’s length transaction on the measurement date.
When available, the Group measures the fair value of an instrument using quoted prices in an active market for that instrument. A market is regarded as active if quoted prices are readily and regularly available and represent actual and regularly occurring market transactions on an arm’s length basis.
If a market for a financial instrument is not active, then the Group establishes fair value using a valuation technique. The chosen valuation technique makes maximum use of market inputs, relies as little as possible on estimates specific to the Group, incorporates all factors that market participants would consider in setting a price and is consistent with accepted economic methodologies for pricing financial instruments.
The best evidence of the fair value of a financial instrument at initial recognition is the transaction price – i.e. the fair value of the consideration given or received. However, in some cases the initial estimate of fair value of a financial instrument on initial recognition may be different from its transaction price. If this estimated fair value is evidenced by comparison with other observable current market transactions in the same instrument (without modification or repackaging) or based on a valuation technique whose variables include only data from observable markets, then the difference is recognised in profit or loss on initial recognition of the instrument. In other cases, the fair value at initial recognition is considered to be the transaction price and the difference is not recognised in profit or loss immediately but is recognised over the life of the instrument on an appropriate basis or when the instrument is redeemed, transferred or sold, or the fair value becomes observable.
If an asset or a liability measured at fair value has a bid price and an ask price, then the Group measures
assets and long positions at a bid price and liabilities and short positions at an ask price. Where the Group has positions with offsetting risks, mid-market prices are used to measure the offsetting risk positions and a bid or ask price adjustment is applied only to the net open position as appropriate.
The fair value of a demand deposit is not less than the amount payable on demand, discounted from the first date on which the amount could be required to be paid.
3.12 Employee Benefits Defined Contribution Plans Defined contribution plan is a post-employment
benefit plan under which contributions are made into a separate fund and the entity will have no legal or constructive obligation to pay further amounts. Obligations for contributions to defined contribution plan are recognised as an employee benefit expense in profit or loss in the periods during services is rendered by employees. Prepaid contributions are recognised as an asset to the extent that a cash refund or a reduction in future payments is available.
Employees’ Provident Fund (EPF): The Company and employees contribute 15% and
10% respectively on the basic salary of each employee to the above mentioned fund.
Employees’ Trust Fund (ETF) The Company contributes 3% of the basic salary of
each employee to the Employees’ Trust Fund.
Defined Benefit Plans A defined benefit plan is a post-employment
benefit plan other than a defined contribution plan. The Group’s net obligation in respect of defined benefit plans is calculated separately for each plan by estimating the amount of future benefit that employees have earned in return for their service in the current and prior periods; that benefit is discounted to determine its present value. The valuation is performed annually by a qualified actuary using the projected unit credit method. When the valuation results in a benefit to the Group, the recognised asset is limited to the total of any unrecognised past service costs and the present value of economic benefits available in the form of any future refunds from the plan or reductions in future contributions to the plan. An economic benefit is available to the Group if it is realisable during the life of the plan, or on settlement of the plan liabilities. When the benefits of a plan are improved,

Annual Report 2014/15 95
the portion of the increased benefit relating to past service by employees is recognised in profit or loss on a straight line basis over the average period until the benefits become vested. To the extent that the benefits vest immediately, the expense is recognised immediately in profit or loss. The Group recognises all actuarial gains and losses arising from defined benefit plans directly in the other comprehensive income and all expenses related to defined benefit plan in personnel expense in profit or loss.
Short Term Benefits Short-term employee benefit obligations are measured on
an undiscounted basis and are expensed as the related service is provided.
3.13 Provisions, Contingent Assets and Contingent Liabilities
Provisions are recognised, if as a result of a past event, the Group has a present legal or constructive obligation that can be estimated reliably, and it is probable that an outflow of economic benefits will be required to settle the obligation. All the contingent liabilities are disclosed, as Notes to the Financial Statements unless the outflow of resources is made contingent assets if exits are disclosed when inflow of economic benefit is probable.
3.13.1 Commitments All material commitments as at the reporting date have
been identified and disclosed in the Notes to the Financial Statements.
3.14 Revenue Revenue from the sale of goods is measured at the fair
value of the consideration received or receivable, net of returns and allowances, trade discounts and volume rebates. Revenue is recognised when the significant risks and rewards of ownership have been transferred to the buyer, recovery of the consideration is probable, the associated costs and possible return of goods can be estimated reliably, and there is no continuing management involvement with the goods.
Dividend Income from investment is recognised when the shareholder’s right to receive payment has been established.
Rental Income is recognised in profit and loss as it accrues.
Gains and losses on the disposal of investments held by the Group have been accounted for in the Statement of comprehensive income.
Gains and losses on the disposal of property, plant & equipment are determined by comparing the net sales proceeds with carrying amount. These are included in profit and loss.
3.15 Borrowing Costs Borrowing costs are recognised as an expense
in the period in which they are incurred, except to the extent where borrowing costs that are directly attributable to the acquisition, construction or production of a qualifying asset that takes a substantial period of time to get ready for its intended use or sale is capitalised as part of that asset.
Borrowing costs that are not capitalised are recognised as expenses in the period which they are incurred and charged to the Profit or Loss.
The amounts of the borrowing costs which are eligible for capitalisation are determined in accordance with the in LKAS 23 – ‘Borrowing Costs’.
3.16 Finance Income and Expenses Finance income comprises interest income on funds
invested (including available for sale financial assets), gains on the disposal of available for sale financial assets. Interest income is recognised as it accrues in the profit or loss, using the effective interest method.
Finance cost comprise interest expenses on borrowings, unwinding of the discount on provisions and contingent consideration, losses on disposal of available for sale financial assets, impairment losses recognised on financial assets (other than trade receivables).
Borrowing costs that are not directly attributable to the acquisition, construction or production of a qualifying asset are recognised in profit or loss using the effective interest rate method.
Foreign currency gains and losses are reported on a net basis as either finance income or finance cost depending on whether foreign currency movements are in a net gain or net loss position.
3.17 Taxation Income tax expense comprises current and deferred tax.
Income tax expense is recognised in profit or loss except to the extent that it relates to items recognised directly in equity, in which case it is recognised in equity.

Dist i l ler ies Company of Sr i Lanka PLC96
Notes to the Financial Statements
a. Income Tax Provision for taxation is based on the profit for the year
adjusted for taxation purposes in accordance with the provisions of the Inland Revenue Act, No.10 of 2006 and amendments made thereto.
Current tax is the expected tax payable on the taxable income for the year, using tax rates enacted at the reporting date and any adjustments to tax payable in respect of previous years.
b. Deferred Tax Deferred tax is recognised using the reporting method,
providing for temporary differences between the carrying amounts of assets and liabilities for financial reporting purposes and the amounts used for taxation purposes. Deferred tax is not recognised for the following temporary differences: the initial recognition of goodwill, the initial recognition of assets or liabilities in a transaction that is not a business combination and that affects neither accounting nor taxable profit, and differences relating to investments in subsidiaries to the extent that they probably will not reverse in the foreseeable future. Deferred tax is measured at the tax rates that are expected to be applied to the temporary differences when they reverse, based on the laws that have been enacted or substantively enacted by the reporting date.
A deferred tax asset is recognised only to the extent that it is probable that future taxable profits will be available against which the asset can be utilised. Deferred tax assets are reviewed at each reporting date and are reduced to the extent that it is no longer probable that the related tax benefit will be realised. Tax withheld on dividend income from subsidiaries and associates is recognised as an expense in the Consolidated Income Statement at the same time as the liability to pay the related dividend is recognised.
3.18 Subsequent Events All material post reporting events have been
considered and where appropriate adjustments or disclosures have been made in the respective notes to the Financial Statements.
3.19 Earnings Per Share The Group presents basic and diluted Earnings Per
Share (EPS) for its ordinary shares. Basic EPS is calculated by dividing the profit or loss attributable to ordinary shareholders of the Group by the weighted average number of ordinary shares outstanding during the period. Diluted EPS is determined by adjusting
the profit or loss attributable to ordinary shareholders and the weighted average number of ordinary shares outstanding for the effects of all dilutive potential ordinary shares.
3.20 Segment Reporting A segment is a distinguishable component of the
Group that is engaged either in providing related products or services (Business Segment) or in providing products or services within a particular economic environment (Geographical Segment), which is subject to risks and rewards that are different from those of other segments.
The activities of the segments are described in Note 05 to the Financial Statements.
3.21 Statement of Cash Flows The Statement of Cash Flows has been prepared
using the ‘Indirect Method’ of preparing Cash Flows in accordance with the Sri Lanka Accounting Standard - LKA S 7 ‘Statement of Cash Flows.’ Cash and cash equivalents comprise short term, highly liquid investments that are readily convertible to known amounts of cash and are subject to an insignificant risk of changes in value.
3.22 Comparative Figures Where necessary comparative figures have been
reclassified to conform to the current year’s presentation.
3.23 Grants and Subsidies Grants and subsidies are credited to the Statements
of Comprehensive Income over the periods necessary to match them with the related costs which they are intended to compensate, on a systematic basis. Grants related to assets, including non-monetary grants at fair value, are deferred in the Reporting and credited to the profit or loss over the useful life of the related asset.
Grants related to income are recognised in the Income Statement in the period in which it is receivable.
3.24 Policies Specific to Plantation Sector3.24.1 Biological Asset3.24.1.1 Immature and Mature Plantations Biological assets are classified in to mature biological
assets and immature biological assets. Mature biological assets are those that have attained harvestable specifications or are able to sustain regular

Annual Report 2014/15 97
harvests. Immature biological assets are those that have not yet attained harvestable specification. Tea, rubber, other plantations and nurseries are classified as biological assets.
Biological assets are further classified as bearer biological assets and consumable biological assets. Bearer biological asset includes tea plants, those that are not intended to be sold or harvested, however used to grow for harvesting agriculture produce. Consumable biological assets includes managed timber trees those that are to be harvested as agricultural produce from biological assets or sold as biological assets.
The entity recognise the biological assets when, and only when, the entity controls the assets as a result of past event, it is probable that future economic benefits associated with the assets will flow to the entity and the fair value or cost of the assets can be measured reliably.
The bearer biological assets are measured at cost less accumulated depreciation and accumulated impairment losses, if any, in terms of LKAS 16 – Property Plant & Equipment as per the ruling issued by CASL.
The cost of land preparation, rehabilitation, new planting, replanting, crop diversification, inter planting and fertilizing, etc., incurred between the time of planting and harvesting (when the planted area attains maturity), are classified as immature plantations. These immature plantations are shown at direct costs plus attributable overheads, including interest attributable to long-term loans used for financing immature plantations. The expenditure incurred on bearer biological assets (Tea, Rubber, Timber fields) which comes into bearing during the year, is transferred to mature plantations. Expenditure incurred on consumable biological assets is recorded at cost at initial recognition and thereafter at fair value at the end of each reporting period.
Permanent impairments to biological asset are charged to the Income Statement in full and reduced to the net carrying amounts of such asset in the year of occurrence after ascertaining the loss.
The managed timber trees are measured on initial recognition and at the end of each reporting
period at its fair value less cost to sell in terms of LKAS 41. The cost is treated as approximation to fair value of young plants as the impact on biological transformation of such plants to price during this period is immaterial. The fair value of timber trees are measured using DCF method taking in to consideration the current market prices of timber, applied to expected timber content of a tree at the maturity by an independent professional valuer. Key assumptions and sensitivity analysis are given in Note 18.1.2.
The main variables in DCF model concerns
Variable Comment
Currency Valuation Sri Lankan Rupees
Timber Content Estimate based on physical verification of girth, height and considering the growth of the each spices in different geographical regions.
Factor all the prevailing statutory regulations enforced for harvesting of timber coupled with forestry plan of the company.
Economic Useful Life
Estimated based on the normal life span of each spices by factoring the forestry plan of the Company
Selling Price
Estimated based on prevailing Sri Lankan market price. Factor all the conditions to be fulfilled in bringing the trees in to saleable condition
Planting Cost Estimated costs for the further development of immature areas are deducted.
Discount Rate Future cash flows are discounted at following discount rates: Timber trees 13%

Dist i l ler ies Company of Sr i Lanka PLC98
Notes to the Financial Statements
Nursery cost includes the cost of direct materials, direct labour and an appropriate proportion of directly attributable overheads, less provision for overgrown plants.
The gain or loss arising on initial recognition of biological assets at fair value less cost to sell and from a change in fair value less cost to sell of biological assets are included in profit or loss for the period in which it arises.
3.24.2 Infilling Cost on Bearer Biological Assets The land development costs incurred in the form of
infilling have been capitalised to the relevant mature field, if it increases the expected future benefits from that field, beyond its pre-infilling performance assessment. Infilling costs so capitalised are depreciated over the newly assessed remaining useful economic life of the relevant mature plantation, or the unexpired lease period, whichever is lower.
Infilling costs that are not capitalised have been charged to the Income Statement in the year in which they are incurred.
3.24.3 Land Development Cost Permanent land development costs are those costs
incurred in making major infrastructure development and building new access roads on leasehold lands.
These costs have been capitalised and amortised over the remaining lease period.
Permanent impairments to land development costs are charged to the Income Statement in full or reduced to the net carrying amounts of such assets in the year of occurrence after ascertaining the loss.
3.24.4 Depreciation and Amortisation (a) Depreciation Depreciation is recognised in Profit or Loss on
a straight-line basis over the estimated useful economic lives of each part of an item of Property, Plant & Equipment. Assets held under finance leases are depreciated over the shorter of the lease term and the useful lives of equivalent owned assets unless it is reasonably certain that the Group will have ownership by the end of the lease term. Lease period of land acquired from JEDB/ SLSPC will be expired in year 2045. The estimated useful lives for the current and comparative periods are as follows:
No. of Years Rate (%)
Buildings & Roads 40 2.50Plant & Machinery 20/25 5.00/4.00Motor Vehicles 15/20 6.67/5.00Equipment 8/4 12.50/25Furniture & Fittings 10 10.00Mature Plantations(Replanting and New Planting)Tea 33 1/3 3.00Rubber 20 5.00
Depreciation of an asset begins when it is available for use and ceases at the earlier of the date on which the asset is classified as held for sale or is derecognised. Depreciation methods, useful lives and residual values are reassessed at the reporting date and adjusted prospectively, if appropriate. Mature plantations are depreciated over their useful lives or unexpired lease period, whichever is less. No depreciation is provided for immature plantations.
(b) Amortisation The leasehold rights of assets taken over from SLSPC
are amortised in equal amounts over the shorter of the remaining lease periods and the useful lives as follows:
No. of Years Rate (%)Bare Land 53 1.89Improvements to Land 30 3.33Mature Plantations(Tea & Rubber)
30 3.33
Buildings 25 4.00Machinery 15 6.67
3.24.5 Deferred Income
3.24.5.1 Grants and Subsidies Government grants are recognised where there is
reasonable assurance that the grant will be received and all attached conditions will be complied with. When the grant relates to an expense item, it is recognised as income over the period necessary to match the grant on a systematic basis to the costs that it is intended to compensate. Where the grant relates to an asset, it is recognised as deferred income and released to income in equal amounts over the expected useful life of the related asset.
Where the Group receives non-monetary grants, the asset and the grant are recorded gross at nominal

Annual Report 2014/15 99
amounts and released to the income statement over the expected useful life and pattern of consumption of the benefit of the underlying asset by equal annual instalments. Where loans or similar assistance are provided by governments or related institutions with an interest rate below the current applicable market rate, the effect of this favourable interest is regarded as additional government grant. Assets are amortised over their useful lives as follows;
- Buildings 40 years
3.25 Policies Specific to Insurance Sector3.25.1 Insurance Contracts As permitted by SLFRS 4 Insurance Contracts, the
Group continues to apply the existing accounting policies for Insurance Contracts that were applied prior to the adoption of SLFRS.
Product Classification SLFRS 4 requires contracts written by insurers
to be classified as either “insurance contracts” or “investment contracts” depending on the level of insurance risk transferred.
Insurance contracts are those contracts when the Group (the insurer) has accepted significant insurance risk from another party (the policyholders) by agreeing to compensate the policyholders if a specified uncertain future event (the insured event) adversely affects the policyholders. As a general guideline, the Group determines whether it has significant insurance risk, by comparing benefits paid with benefits payable if the insured event did not occur. Insurance contracts can also transfer financial risk.
Investment contracts are those contracts that transfer significant financial risk and no significant insurance risk.
Financial risk is the risk of a possible future change in one or more of a specified interest rate, financial instrument price, commodity price, foreign exchange rate, index of price or rates, credit rating or credit index or other variable, provided in the case of a non-financial variable that the variable is not specific to a party to the contract.
Once a contract has been classified as an insurance contract, it remains an insurance contract for the remainder of its lifetime, even if the insurance risk reduces significantly during this period, unless all rights and obligations are extinguished or expire. Investment
contracts can, however, be reclassified as insurance contracts after inception if insurance risk becomes significant.
All the products sold by the Group are insurance contracts and therefore classified as Insurance contracts under the SLFRS 4 – Insurance Contracts. Thus, the Group does not have any investment contracts within its product portfolio as at the reporting date.
3.25.2 Deferred acquisition Costs (DAC) Those direct and indirect costs incurred during the
financial period arising from the writing or renewing of insurance contracts are deferred and amortised over the period in which the related revenues are earned. All other acquisition costs are recognised as an expense when incurred.
The DAC is applicable only to Non - Life Insurance Contracts. In line with the available regulatory guidelines from the Insurance Board of Sri Lanka (IBSL), the DAC is calculated based on the 365 days basis.
An impairment review is performed at each reporting date or more frequently when an indication of impairment arises. When the recoverable amount is less than the carrying value, an impairment loss is recognised in the statement of comprehensive income. No such indication of impairment was experienced during the year. DAC is derecognised when the related contracts are either settled or disposed-off.
3.25.3 Reinsurance The Group cedes insurance risk in the normal course
of business to recognised reinsurers through formal reinsurance arrangements. Reinsurance assets include the balances due from reinsurance companies for paid and unpaid losses and loss adjustment expenses. Amounts recoverable from reinsurers are estimated in a manner consistent with the outstanding claims provision or settled claims associated with the reinsurer’s policies and are in accordance with the related reinsurance contract.
Reinsurance is recorded gross in the statement of financial position unless a right to offset exists. Reinsurance assets are reviewed for impairment at each reporting date, or more frequently, when an indication of impairment arises during the reporting year. Impairment occurs when there is objective evidence as a result of an event that occurred after

Dist i l ler ies Company of Sr i Lanka PLC100
Notes to the Financial Statements
initial recognition of the reinsurance asset that the Group may not receive all outstanding amounts due under the terms of the contract and the event has a reliably measurable impact on the amounts that the Group will receive from the reinsurer. The impairment loss, if any is recorded in the Profit or Loss.
Ceded reinsurance arrangements do not relieve the Group from its obligations to policyholders. Reinsurance assets or liabilities are derecognised when the contractual rights are extinguished or expire or when the contract is transferred to another party.
3.25.4 Premium Receivable Insurance receivables are recognised when due and
measured on initial recognition at the fair value of the consideration receivable. Collectability of premiums is reviewed on an ongoing basis.
According to the Premium Payment Warranty (PPW) directive issued by the Insurance Board of Sri Lanka (IBSL), all Non-Life insurance policies are issued subject to PPW and are cancelled upon the expiry of 60 days if not settled except some selected customers where Group has allowed extra period for settlements.
3.25.5 Insurance Provision – Non - Life Insurance Non - Life Insurance contract liabilities include the
outstanding claims provision including IBNR /IBNER and provision for unearned premiums.
The outstanding claims provision is based on the estimated ultimate cost of all claims incurred but not settled at the reporting date, whether reported or not, together with related claims handling costs and reduction for the expected value of salvage and other recoveries. Delays can be experienced in the notification and settlement of certain types of claims, therefore, the ultimate cost of these cannot be known with certainty at the reporting date.
The valuation of Unearned Premium Reserve is measured in accordance with guidelines of the Regulation of Insurance Industry Act, No. 43 of 2000 (i.e. based on the 365 days basis). The Incurred But Not Reported (IBNR) and Incurred But Not Enough Reported (IBNER) claims reserve are actuarially computed. The liability is not discounted for the time value of money. No provision for equalisation or catastrophe reserves is recognised. The liabilities are derecognised when the obligation to pay a claim expires, is discharged or is cancelled.
Liability Adequacy Test (LAT) As required by the SLFRS 4- Insurance Contracts, the
Group performed a Liability Adequacy Test (LAT) in respect of Non - Life Insurance contract liabilities with the assistance of the external actuary.
3.25.6 Revenue Recognition3.25.6.1 Insurance Premiums a) Non - Life Insurance Business Gross written premiums - Non - Life Insurance comprise
the total premiums received /receivable for the whole period of cover provided by contracts entered into during the accounting period. Gross Written Premium is generally recognised is written upon inception of the policy. Upon inception of the contract, premiums are recorded as written and are earned primarily on a prorate basis over the term of the related policy coverage.
Rebates that form part of the premium rate, such as no claim rebates, are deducted from the gross premium. Unearned premiums are those proportions of premiums written in a year that relate to periods of risk after the reporting date. Unearned premiums are calculated on 365 days basis in accordance with the Regulation of Insurance Industry Act, No. 43 of 2000. However, for those contracts for which the period of risk differs significantly from the contract period, premiums are earned over the period of risk in proportion to the amount of insurance protection provided. The proportion attributable to subsequent periods is deferred as a provision for unearned premiums which is included under liabilities.
b) Reinsurance Premiums Gross reinsurance premiums on insurance contracts
are recognised as an expense on the earlier of the date when premiums are payable or when the policy becomes effective. Reinsurance premiums are decided based on rates agreed with reinsurers. Unearned reinsurance premiums are those proportions of premiums written in a year that relate to periods of risk after the reporting date. Unearned reinsurance premiums are deferred over the term of the underlying direct insurance policies for risks-attaching contracts (using 365 days basis in accordance with the Regulation of Insurance Industry Act, No. 43 of 2000).
3.25.7 Policy Income Insurance contract policyholders are charged for
policy administration services and other contract fees. These fees are recognised as revenue upon receipt or becoming due and is classified under other income.

Annual Report 2014/15 101
3.25.8 Benefits, Claims and Expenses a) Gross Benefits and Claims Non - Life Insurance Business Non - Life insurance claims include all claims occurring
during the year, whether reported or not together with claims handling costs that are directly related to the processing and settlement of claims, a reduction for the value of salvage and other recoveries, and any adjustments to claims outstanding from previous years. Claims outstanding are assessed by review of individual claim files and estimating changes in the ultimate cost of settling claims.
The provision in respect of Claims Incurred But Not Reported (IBNR) and Claims Incurred But Not Enough Reported (IBNER) is actuarially valued to ensure a more realistic estimation of the future liability based on the past experience and trends. Actuarial valuations are performed on a semi-annual basis. Whilst the Directors consider that the provisions for claims are fairly stated on the basis of information currently available, the ultimate liability will vary as a result of subsequent information and events. This may result in adjustments to the amounts provided. Such amounts are reflected in the financial statements for that period.
The methods used to estimate claims and the estimates made are reviewed regularly.
b) Reinsurance Claims Reinsurance claims are recognised when the related
gross insurance claim is recognised according to the terms of the relevant contract.
3.25.9 Net Deferred Acquisition Expenses Acquisition expenses, representing commissions,
which vary with and are directly related to the production of business, are deferred and amortised over the period in which the related written premiums are earned.
Reinsurance commission is also treated in the same manner within deferred acquisition costs.
3.25.10 Premium income (GWP) and other sundry sales related taxes
Revenue, expenses and assets are recognised net of the amount of sales taxes and premium taxes except where the premium or sales tax incurred on the purchase of assets services is not recoverable from the taxation authority, in which case, the sale tax is recognised as a part of the cost of acquisition of the asset or as a part of the expense item, as applicable.
3.26 Policies Specific to Telecommunication Sector3.26.1 Depreciation The estimated useful lives used are as follows;
Buildings 8 yearsShelters and Other Equipment 5 yearsVehicles 5 yearsFurniture and Fittings 5 yearsComputer Software 3 yearsLeasehold Improvements 5 yearsLeased Equipment 3 – 10 yearsOffice/Other Equipment 1 – 5 yearsDigital Electronic Switches 10 yearsNetwork Equipment 10 yearsTowers 10 yearsCustomer Premise Equipment 1 – 10 yearsFLAG Project Assets 5 – 15 yearsWiMAX 5 – 10 years
3.26.2 Intangible Assets3.26.2.1 License Fees and Access Rights Separately acquired licences and access rights are
shown at historical cost. Expenditures on license fees and access rights that is deemed to benefit or relate to more than one financial year is classified as intangible assets and is being amortised over the agreement period on a straight line basis.
3.26.2.2 Amortisation Amortisation is recognised in profit or loss on a
straight line basis over the estimated useful lives of intangible assets from the date that they are available for use. The estimated useful lives for the current and comparative periods are as follows:
Computer Software 3 – 5 years
FLAG access Rights 15 years
Licenses 10 years
3.26.3 Revenue Revenue from services rendered in the course of
ordinary activities is measured at fair value of the consideration received or receivable net of trade discounts and volume rebates.
Revenue is recognised when persuasive evidence exist, usually in the form of an executed sales agreement, that the significant risks and rewards of ownership have been transferred to the customer, recovery of the consideration is probable and the amount of revenue can be measured reliably.

Dist i l ler ies Company of Sr i Lanka PLC102
Notes to the Financial Statements
If it is probable that discounts will be granted and the amount can be measured reliably, then the discount is recognised as a reduction of revenue as the sales are recognised.
The revenue is recognised as follows:
3.26.3.1 Domestic and International Call Revenue, Rental Income
Revenue for call time usage by customers is recognised as revenue as services are performed on accrual basis.
Fixed rental is recognised as income on a monthly basis in relation to the period of the rental.
3.26.3.2 Revenue from other Network Operators and International Settlements
The revenue received from other network operators, local and international, for the use of the Group’s telecommunication network are recognised, net of taxes, based on usage taking the traffic minutes/per second rates stipulated in the relevant agreements and regulations and based on the terms of the lease agreements for fixed rentals. Revenue arising from the interconnection of voice and data traffic between other telecommunications operators is recognised at the time of transit across the Group’s network and presented on gross basis.
The relevant revenue accrued is recognised under income in Profit or Loss and interconnection expenses recognised under operating costs in the statement of Profit or Loss.
3.26.3.3 Revenue from Broadband Revenue from broadband service is recognised on
usage and the fixed rental on a monthly basis when it is earned net of taxes, rebates and discounts.
3.26.3.4 Revenue from other Telephony Services The revenue from Data services and other telephony
services are recognised on an accrual basis based on fixed rental contracts entered between the Group and subscribers.
3.26.3.5 Installation Revenue The installation revenue relating to Code Divisional
Multiple Access (CDMA) and non CDMA connections are deferred over the expected life of the customer on the network.
3.26.3.6 Service Agreements Revenue Capacity contracts which convey the right to use
a specified capacity in an identified fibre cable are accounted as service arrangements. Customers are
charged on a monthly basis based on usage, and the contracts are for a short term.
3.26.3.7 Prepaid Card Revenue Revenue from the sale of prepaid card on CDMA,
Internet is recognised upon activation of the said card as the period of expiry of the card and the non refundable nature of the amounts are considered immaterial to the revenue recognition process.
3.27 Policies Specific to Finance Sector3.27.1 Revenue Recognition Revenue is recognised to the extent that it is probable
that the economic benefits will flow to the Group and the revenue can be reliably measured. The following specific recognition criteria must also be met before revenue is recognised.
a) Interest Income and Expense For all financial instruments measured at amortised
cost, interest bearing financial assets classified as available-for-sale and financial instruments designated as fair value through profit or loss, interest income and expense are recognised in profit or loss using the Effective Interest Rate (EIR) method. The EIR is the rate that exactly discounts the estimated future cash payments and receipts through the expected life of the financial asset or liability (or, where appropriate, a shorter period) to the carrying amount of the financial asset or liability. When calculating the EIR, the Group estimates future cash flows considering all contractual terms of the financial instrument, but not future credit losses.
The calculation of the EIR takes into account all contractual terms of the financial instrument (for example, prepayment options) and includes all material transaction costs and fees and points paid or received that are an integral part of the EIR. Transaction costs include incremental costs that are directly attributable to the acquisition or issue of a financial asset or liability.
The carrying amount of the financial asset or financial liability is adjusted if the Group revises its estimates of payments or receipts. The adjusted carrying amount is calculated based on the original EIR and the change in carrying amount is recorded in ‘Interest Income’ for financial assets and in ’Interest and similar expense’ for financial liabilities.
However, for a reclassified financial asset for which the Group subsequently increases its estimates of future cash receipts as a result of increased recoverability of those cash receipts, the effect of that increase is recognised as an adjustment to the EIR from the date of the change in estimate.

Annual Report 2014/15 103
Once the recorded value of a financial asset or a group of similar financial assets has been reduced due to an impairment loss, interest income continues to be recognised using the rate of interest used to discount the future cash flows for the purpose of measuring the impairment loss.
b) Lease Income In terms of the provisions of the Sri Lanka Accounting
Standard – LKAS 17 on ‘Leases’, the recognition of finance income on leasing is accounted, based on a pattern reflecting a constant periodic rate of return on capital outstanding.
The excess of aggregate lease rentals receivable over the cost of the leased assets constitutes the total unearned finance income at the commencement of a lease. The unearned finance income included in the lease rentals receivable is recognised in profit or loss over the term of the lease commencing from the month in which the lease is executed using Effective Interest Rate.
Minimum lease payments made under finance leases are apportioned between the finance expense and the reduction of the outstanding liability.
c) Hiring Rental Income Payments made under operating leases are recognised
in profit or loss on a straight-line basis over the term of the lease. Lease incentives received are recognised as an integral part of the total lease expense, over the term of the lease.
3.27.2 Impairment Losses on Loans and Advances The Group reviews its individually significant loans and
advances at each reporting date to assess whether an impairment loss should be provided for in the Statement of Comprehensive Income. In particular, management’s judgment is required in the estimation of the amount and timing of future cash flows when determining the impairment loss. These estimates are based on assumptions about a number of factors and actual results may differ, resulting in future changes to the allowance made.
Loans and advances that have been assessed individually and found not to be impaired and all individually insignificant loans and advances are then assessed collectively, by categorising them into groups of asset with similar risk characteristics, to determine whether a provision should be made due to incurred loss events for which there is objective evidence, but the effects of which are not yet evident. The collective assessment takes account of data from the loan portfolio (such as loan to collateral ratio, level of restructured performing loans, etc.), and judgment
on the effect of concentrations of risks and economic data.
3.28 Policies Specific to Hotel Sector3.28.1 Revenue Revenue is measured at the fair value of the
consideration received or receivable, net of trade discounts; value added taxes and intra-group revenue. No revenue is recognised if there are significant uncertainties regarding recovery of the consideration due.
Apartment revenue is recognised for the rooms occupied on a daily basis, whilst food beverages sales are accounted for at the time of sales.
4. New Accounting Standards Issued but not Effective
The Institute of Chartered Accountants of Sri Lanka has issued the following new Sri Lanka Accounting Standard which will become applicable for financial periods beginning on or after 1 January 2018. Accordingly, the Group has not applied the following new standards in preparing these consolidated financial statements.
4.1 SLFRS 9-Financial Instruments SLFRS 9 – “Financial Instruments” replaces
the existing guidance in LKAS 39 – Financial Instruments: Recognition and Measurement. SLFRS 9 includes revised guidance on the classification and measurement of financial instruments including a new expected credit loss model for calculating impairment on financial assets.
SLFRS 9 is effective for annual period beginning on or after 1 January 2018 with early adoption permitted.
The Group is assessing the potential impact on its Consolidated Financial Statements resulting from the of SLFRS 9. Given the nature of the Group’s operations, this standard is expected to have a pervasive impact on the Group’s financial statements.
4.2 SLFRS 15 – Revenue Recognition from Customer Contracts
SLFRS 15 – “Revenue from Contracts with Customers” establishes a comprehensive framework for determining whether, how much and when revenue is recognised. It replaces existing revenue recognition guidance LKAS 18 Revenue, LKAS 11 Construction Contracts.
SLFRS 15 is effective for annual reporting period beginning on or after 1 January 2017, with early adoption permitted.

Dist i l ler ies Company of Sr i Lanka PLC104
Notes to the Financial Statements
5 Operating Segment Information A segment is a distinguishable component of the Group that is engaged either in providing related products or services
(business segment), which is subject to risks and rewards that are different from those of other segments.
Segmental information is presented in respect of the Group’s business segments. The business segments are determined based on the Group’s management and internal reporting structure. Inter-segment transfers are based on fair market prices. Segment results, assets and liabilities include items directly attributable to a segment as well as those that can be allocated on a reasonable basis.
5.1 Segment Revenues
For the year ended 31 March, 2015 2014Rs.000 Rs.000
Beverages 56,992,501 53,136,535 Plantations 3,002,156 3,171,983 Telecommunication 3,372,078 3,633,987 Diversified 3,397,774 3,243,797 Total Gross Revenue 66,764,509 63,186,302 Direct Turnover Related Taxes (37,851,635) (34,203,418)Total Net Revenue 28,912,874 28,982,884
5.2 Segment Profits
For the year ended 31 March, 2015 2014Rs.000 Rs.000
Beverages 8,397,998 8,027,247 Plantations (106,444) 129,715 Telecommunication (691,844) (638,824)Diversified 737,442 535,779
8,337,152 8,053,917 Share of Profit of Equity-Accounted Investees (Net of Tax) 1,390,668 1,440,182 Profit Before Income Tax Expense 9,727,820 9,494,099 Taxation (3,254,315) (3,263,009)Profit for the Year 6,473,505 6,231,090

Annual Report 2014/15 105
5 O
pera
ting
Segm
ent I
nfor
mat
ion
(Con
td.)
5.
3 O
ther
Seg
men
tal I
nfor
mat
ion
Repo
rting S
egme
ntsBe
verag
esTe
lecom
munic
ation
Planta
tion
Divers
ified
Elimi
natio
ns/O
ther
Cons
olidate
d Adju
stmen
tsGr
oup T
otal
For th
e yea
r end
ed 31
Marc
h,20
1520
1420
1520
1420
1520
1420
1520
1420
1520
1420
1520
14Rs
.000
Rs.00
0Rs
.000
Rs.00
0Rs
.000
Rs.00
0Rs
.000
Rs.00
0Rs
.000
Rs.00
0Rs
.000
Rs.00
0
Addit
ions t
o PPE
5,208
,372
2,70
2,375
1,
106,8
99
1,84
8,340
55
,366
139,0
33
3,75
9,208
67
7,090
(4
68,20
9) (1
17,50
0) 9,
661,6
36
5,24
9,338
Ad
dition
s to I
ntang
ible As
sets
2,01
4 6,
363
- 28
9,034
-
- 21
,575
13,87
2 -
- 23
,589
309,2
69
Depre
ciatio
n of P
PE16
6,165
154,0
05
719,9
74
763,4
78
60,91
4 70
,377
310,8
51
278,7
34
- -
1,25
7,904
1,
266,5
94
Amort
isatio
n and
Impa
irmen
t of In
tangib
le As
sets
1,07
2 -
264,5
82 22
7,131
-
- 11
,823
9,26
2 -
- 27
7,477
23
6,393
Amort
isatio
n of B
earer
Biolo
gical
Asse
ts at
Finan
ce Le
ase (
(JEDB
/SLP
C) -
- -
- 9,0
41 9,
040
- -
- -
9,04
1 9,
040
Intere
st Ex
pens
e 49
5,479
85
9,321
16
7,982
22
3,089
88
,431
70,15
9 34
,697
48,06
9 (9
,584)
(15,2
90)
777,0
05
1,18
5,348
Repo
rting S
egme
ntsBe
verag
esTe
lecom
munic
ation
Planta
tion
Divers
ified
Elimi
natio
ns/O
ther
Cons
olidate
d Adju
stmen
tsGr
oup T
otal
As at
31 M
arch,
2015
2014
2015
2014
2015
2014
2015
2014
2015
2014
2015
2014
Rs.00
0Rs
.000
Rs.00
0Rs
.000
Rs.00
0Rs
.000
Rs.00
0Rs
.000
Rs.00
0Rs
.000
Rs.00
0Rs
.000
Total
Asse
ts 67
,753,4
37
63,63
5,487
7,
908,2
67
8,30
7,821
5,
416,2
57
5,01
5,269
71
,891,2
59
56,98
8,042
(60
,280,6
18)
(50,20
5,065
) 92
,688,6
02
83,74
1,554
To
tal Li
abilit
ies 15
,229,4
35
18,09
5,042
4,
086,4
34
3,80
5,047
2,
794,6
24
2,25
8,720
7,
590,0
56
8,36
7,156
(1,
835,9
44)
(6,37
7,526
) 27
,864,6
05
26,14
8,440
Re
tireme
nt Be
nefit
Oblig
ation
s 14
2,682
11
4,723
74
,241
55,86
1 68
4,326
62
6,819
48
,712
34,29
3 -
- 94
9,961
83
1,769
De
ferred
Tax A
ssets
57,07
4 45
,889
383
365
271,9
79
182,2
15
173,2
7816
8,346
--
502,7
14
396,8
16
Defer
red Ta
x Liab
ilities
532,2
93
61,01
7 12
5 95
41
2,340
34
9,063
18
5,813
15
1,854
171,3
21
171,3
21
1,30
1,892
73
3,350
Inc
ome T
ax Pa
yable
403,6
92
1,11
2,935
56
5 3,
540
16,28
8 18
,385
42,91
5 44
,028
--
463,4
60
1,17
8,888
5.4
Segm
enta
l Cas
h Fl
ows
For t
he ye
ar en
ded
31 M
arch
,20
1520
1420
1520
1420
1520
1420
1520
14Rs
.000
Rs.0
00Rs
.000
Rs.0
00Rs
.000
Rs.0
00Rs
.000
Rs.0
00
Opera
ting C
ash F
low 4,
217,0
66
872,3
59
663,2
90
473,7
41
(24,9
10)
111,3
26
(509
,304)
979,7
91
Inves
ting C
ash F
low 44
2,798
(1
,716,4
82)
(587
,324)
(871
,988)
(330
,925)
(358
,718)
(4,89
7,000
) (3
,406,9
39)
Finan
cing C
ash F
low (1
,075,0
00)
(2,26
7,861
) 93
,062
362,9
60
451,1
53
(36,2
98)
3,08
0,418
1,
913,0
74
3,58
4,864
(3
,111,9
84)
169,0
28
(35,2
87)
95,31
8 (2
83,69
0) (2
,325,8
86)
(514
,074)

Dist i l ler ies Company of Sr i Lanka PLC106
Notes to the Financial Statements
6 Revenue
GroupFor the year ended 31 March, 2015 2014
Gross Revenue Direct Turnover Related Taxes
Net Revenue Gross Revenue Direct Turnover Related Taxes
Net Revenue
Rs.000 Rs.000 Rs.000 Rs.000 Rs.000 Rs.000
Sale of Goods 61,674,643 (37,846,540) 23,828,103 58,000,543 (34,203,418) 23,797,125 Rendering of Services 5,089,866 (5,095) 5,084,771 5,185,759 - 5,185,759 Total 66,764,509 (37,851,635) 28,912,874 63,186,302 (34,203,418) 28,982,884
CompanyFor the year ended 31 March, 2015 2014
Gross Revenue Direct Turnover Related Taxes
Net Revenue Gross Revenue Direct Turnover Related Taxes
Net Revenue
Rs.000 Rs.000 Rs.000 Rs.000 Rs.000 Rs.000
Sale of Goods 51,800,065 (34,883,539) 16,916,526 47,755,538 (31,057,380) 16,698,158 Total 51,800,065 (34,883,539) 16,916,526 47,755,538 (31,057,380) 16,698,158
6.1 Business Segment Analysis
GroupFor the year ended 31 March, 2015 2014
Sale Of Goods Rendering Of Services
Total Revenue Sale Of Goods Rendering Of Services
Total Revenue
Rs.000 Rs.000 Rs.000 Rs.000 Rs.000 Rs.000
Beverages 19,145,961 - 19,145,961 18,933,117 - 18,933,117 Plantation 3,002,156 - 3,002,156 3,171,983 - 3,171,983 Telecommunication - 3,372,078 3,372,078 - 3,633,987 3,633,987 Diversified 1,679,986 1,712,693 3,392,679 1,692,025 1,551,772 3,243,797
23,828,103 5,084,771 28,912,874 23,797,125 5,185,759 28,982,884
7 Cost of Sales, Net Benefits Paid and Interest Expenses This includes all the directly attributable costs of sale of goods and rendering of services. Further the interest expense
on customer deposits in financial services and net insurance benefits and claims paid, net change in insurance claims outstanding and underwriting and net acquisition costs in insurance businesses are included.

Annual Report 2014/15 107
8 Other Operating IncomeGroup Company
For the year ended 31 March, 2015 2014 2015 2014Note Rs.000 Rs.000 Rs.000 Rs.000
Gain on Change in Fair Value of Biological Assets 92,377 74,294 - - Government Grants 11,443 13,226 - - Gain on Sale of Property, Plant and Equipment 8.2 39,762 30,331 430,761 50,767 Fees and Commission Income 42,674 62,761 - - Rent Income 39,366 24,557 36,190 24,557 Refunds on Telecommunication Development Charge (TBC) 8.1 144,279 - - - Sale of Timber 19,941 40,664 - - Other Sundry Income 191,523 202,759 76,169 122,625 Dividend Income from Subsidiary Companies - - 920,000 Dividend Income from Equity Accounted Investees - - 602 279 Dividend Income on Available-for-Sale Financial Assets 407,267 332,815 255,727 200,619 Dividend Income from Fair Value Through Profit or Loss Investments
55,614 72,994 21,892 38,920
Gain on Disposal of Fair Value Through Profit or Loss Investments
330,926 29,973 206,512 16,828
Gain on Disposal of Available-for-Sale Financial Assets 8.2 - - 5,223,421 - Loan Loss Recoveries 500 14,018 - - Reversal of Impairment of Doubtful Debts 1,204 - - -
1,376,876 898,392 6,251,274 1,374,595
8.1 Lanka Bell Limited - Refunds on Telecommunication Development Charge (TDC) In accordance with the Finance Act No. 11 of 2004, all telecommunication gateway operators are required to pay a levy
defined as the Telecommunication Development Charge (TDC) to the Government of Sri Lanka, based on international call minutes terminated in the country. This levy was made effective from 03rd March, 2003 where initially the levy was defined in such a way that operators were allowed to claim the 2/3rd of the TDC against the costs of network development charges. First revision to this regulation was introduced with effect from 15th July, 2010 with a TDC rate change from USD cents 3.80 to USD cents 1.50. Through the same revision the disbursement process was removed from the regulation. The revised rates prevailed until such time the rate was again revised to USD cents 3.0 per minute with effect from January, 2012 in accordance with the Budget Proposal for 2012. The total amount of the levy payable by the Company for the period from 1 April 2014 to 31 March 2015 was estimated at Rs.96,944,159/- (2014-Rs. 96,544,392), and has been recognised as expenses in the current financial year. The corresponding liability, net of payments, has been recognised in the statement of financial position.
The total TDC refunds claimed during the year amounting to Rs. 144,279,145/- and these were for periods between 2009 to 2010.This will be the final refund the company will receive from Telecommunication Regulatory Commission (TRC).
8.2 Gain/(Loss) on Disposal of Shares / Lands and Buildings During the year ended 31 March 2015, the Company structured its Investments and lands and buildings into its fully own
subsidiary, Melstacorp Limited. As a result a capital gain of Rs. 5.6 Bn was recognised in the Company and eliminated in the Group Financial Statements as an inter group transaction.
9 Other Operating ExpensesGroup Company
For the year ended 31 March, 2015 2014 2015 2014Note Rs.000 Rs.000 Rs.000 Rs.000
Impairment on Loans and Other Advances 18,676 2,703 - -Loss on De-Recognition of Subsidiaries - 640,155 - -Loss on De-Recognition of Equity Accounted Investee 19.1 - 86,284 - -
18,676 729,142 - -

Dist i l ler ies Company of Sr i Lanka PLC108
Notes to the Financial Statements
10 Finance Income and Finance Costs10.1 Recognised in Profit and Loss10.1.1 Finance Income
Group CompanyFor the year ended 31 March, 2015 2014 2015 2014
Note Rs.000 Rs.000 Rs.000 Rs.000
Interest Income on Unimpaired Held-to-Maturity Investments
6,946 - - -
Interest Income on Available-for-Sale Financial Assets 53,477 27,302 31,998 2,893 Interest Income on Loans and Receivables 362,207 402,592 124,687 48,550 Foreign Exchange Gain 169 7,119 - - Gain on Change in Fair Value of Financial Assets at Fair Value Through Profit or Loss
143,869 85,739 35,161 66,877
Recognition of Share Warrants at Fair Value - 225,081 - 310 566,668 747,833 191,846 118,630
10.1.2 Finance Cost Interest Expense on Financial Liabilities Measured at Amortised Cost
- Interest Expense on Long Term Borrowings (122,238) (103,290) - (94,356) - Interest Expense on Bank Overdrafts and Other Short Term Borrowings
(628,437) (1,055,035) (495,479) (764,965)
- Interest Expense on Finance Leases (34) (2,645) - - Government Lease Interest (JEDB/SLSPC) (26,296) (24,378) - - Foreign Exchange Loss (12,950) (44,888) - - Loss on Change in Fair Value of Financial Assets at Fair Value Through Profit or Loss
- (32,401) - -
Preference Share Dividends (1,265) (1,265) - - (791,220) (1,263,902) (495,479) (859,321)
Less: Borrowing Cost Capitalised 10.1.2.1 79,911 43,136 - - (711,309) (1,220,766) (495,479) (859,321)
Net Finance Costs Recognised in Profit or Loss (144,641) (472,933) (303,633) (740,691)
10.1.2.1 During the year Balangoda Plantations PLC, a subsidiary of the company, capitalised borrowing cost amounting to Rs. 58,231,199 (2014 - Rs. 43,136,174/-) incurred on borrowings obtained to meet expenses relating to immature plantations being part of the cost of the immature plantations. The amount of borrowing cost eligible for capitalisation is determined in accordance with LKAS 23 (Borrowing Costs). Further this borrowing cost includes amount of Rs. 21,679,737 from Lanka Bell Limited.
10.2 The above finance income and finance costs include the following interest income and expense in respect of assets (liabilities) not at fair value through profit or loss:
Total interest income on financial assets 422,630 429,894 156,685 51,443Total interest expense on financial liabilities (778,270) (1,186,613) (495,479) (859,321)
10.3 Recognised in Other Comprehensive Income
Net Change in Fair Value of Available-For-Sale Financial Assets 1,708,471 (136,568) 721,172 217,263Reversal of AFS Reserve on Disposal of AFS Investments - - (3,574,279) -
1,708,471 (136,568) (2,853,107) 217,263

Annual Report 2014/15 109
11 Profit before Income Tax ExpenseProfit before Income Tax Expense is stated after charging all expenses including the following;
Group Company For the year ended 31 March, 2015 2014 2015 2014
Notes Rs.000 Rs.000 Rs.000 Rs.000
Directors’ Emoluments 92,888 89,234 24,121 23,410 Auditor’s Remuneration Audit - KPMG 11,405 9,379 5,445 4,950 - Other Auditors 4,745 4,853 - Non-Audit - KPMG 2,803 4,641 2,376 3,327 - Other Auditors 1,026 693 1,026 693 Management Fees 31,841 44,887 - Personnel Costs 11.1 4,039,003 3,861,748 1,216,485 1,162,203 Depreciation and AmortisationDepreciation of Property Plant and Equipment Depreciation of Property Plant and Equipment 15 1,257,904 1,266,594 160,215 148,392 Depreciation of Investment Property 17 60 - Amortisation of Intangible Assets 16 277,477 236,393 669 - Amortisation of Bearer Biological Assets 18.1.1/18.1.2 39,245 37,339 - Provision /(Reversal) for Bad & Doubtful Debts 156,072 (137,944) 7,916 25,057 Provision /(Reversal) for Inventories (6,828) 226,679 - Donations 5,777 13,415 4,432 12,524
11.1 Personnel CostsSalaries, Wages and Other Benefits 3,524,677 3,356,525 1,104,705 1,050,753 Employee Benefits - - - Defined Contribution Plans - - - EPF and ETF 363,861 354,098 91,140 90,005 Defined Benefit Plans 31.1.1 161,227 151,125 20,640 21,445 Total 4,039,003 3,861,748 1,216,485 1,162,203
11.1.1 Number of Employees
As At 31 March, 2015 2014 2015 2014
11,897 12,897 1,197 1,250
12 Taxation
Group Company For the year ended 31 March, 2015 2014 2015 2014
Notes Rs.000 Rs.000 Rs.000 Rs.000
Current Tax Charge 12.1 2,780,292 3,238,860 2,317,212 2,757,104 Deferred Tax Charged/(Credited) 22.1.1 474,023 24,150 468,384 21,539
3,254,315 3,263,009 2,785,596 2,778,643

Dist i l ler ies Company of Sr i Lanka PLC110
Notes to the Financial Statements
12.1 Current tax expense
Group Company For the year ended 31 March, 2015 2014 2015 2014
Notes Rs.000 Rs.000 Rs.000 Rs.000
Current Tax Charge 12.1.1 2,743,315 3,194,494 2,317,212 2,757,104 (Over)/Under Provision of Current Tax of Previous Years (567) (322) - - 10% Withholding Tax on Intercompany Dividends 37,544 44,688 - -
2,780,292 3,238,860 2,317,212 2,757,104
12.1.1 Numerical Reconciliation of Accounting Profits to Income Tax Expense
Group Company For the year ended 31 March, 2015 2014 2015 2014
Notes Rs.000 Rs.000 Rs.000 Rs.000
Profit Before Income Tax Expense 9,727,820 9,494,099 13,070,319 8,136,580 Share of Results of Equity Accounted Investees (1,390,668) (1,440,182) - - Dividend Income from Group Companies 337,894 1,292,453 - - Other Consolidation Adjustments - 726,439 - -
8,675,046 10,072,809 13,070,319 8,136,580 Exempt (Profits)/Loss (261,828) 411,685 - -Profit Before Income Tax Expense after Adjustments 8,413,218 10,484,494 13,070,319 8,136,580 (-) Income Not Subject to Tax (6,528,614) (2,352,292) (6,092,137) (1,279,853)(+) Disallowable Expenses 7,500,300 846,495 192,805 208,814 (-) Allowable Expenses (2,327,265) (1,065,422) (1,272,664) (108,769)(+) Tax Losses Incurred 12.1.4 553,118 304,188 - - (-) Tax Losses Utilised 12.1.4 (92,560) (72,533) - - Taxable Income 7,518,197 8,144,930 5,898,323 6,956,772
Income Tax at, 40% 2,528,189 2,979,452 2,218,937 2,697,359 28% 215,126 215,041 98,275 59,744 Total Current Tax Charge 2,743,315 3,194,494 2,317,212 2,757,104 Average Statutory Income Tax Rate (%) 36.49% 39.22% 39.29% 39.63%
Group CompanyFor the year ended 31 March, 2015 2014 2015 2014
Notes % % % %
12.1.2 Effective Tax Rate 12.1.2.1 32.61% 30.47% 17.73% 33.89%

Annual Report 2014/15 111
GroupFor the year ended 31 March, 2015 2014
Rs.000 % Rs.000 %
12.1.2.1 Reconciliation of Effective Tax RateAccounting Profit / (Loss) Chargeable to Income Tax 8,413,218 10,484,494 Income Tax Expense at the Average Statutory Income Tax Rate 3,069,899 36.49% 4,112,086 39.22%Income Not Subject to Tax (2,382,226) -28.32% (922,584) -8.80%Disallowable Expenses 2,736,785 32.53% 332,001 3.17%Allowable Expenses (849,196) -10.09% (417,865) -3.99%Tax Losses Incurred 201,827 2.40% 119,304 1.14%Tax Losses Utilised (33,774) -0.40% (28,448) -0.27%Current Tax Expense 2,743,315 32.61% 3,194,494 30.47%
12.1.2.1 Reconciliation of Effective Tax Rate
Company2015 2014
Rs.000 % Rs.000 %
Accounting Profit / (Loss) Chargeable to Income Tax 13,070,319 8,136,580 Income Tax Expense at The Average Statutory Income Tax Rate
5,134,798 39.29% 3,224,684 39.63%
Income Not Subject to Tax (2,393,354) -18.31% (507,231) -6.23%Disallowable Expenses 75,745 0.58% 82,758 1.02%Allowable Expenses (499,978) -3.83% (43,107) -0.53%Tax Losses Incurred - 0.00% - 0.00%Tax Losses Utilised - 0.00% - 0.00%(Over)/Under Provision of Current Tax of Previous Years - 0.00%Deem Dividend Tax Paid - 0.00% - 0.00%Current Tax Expense 2,317,212 17.73% 2,757,104 33.89%
12.1.3 Applicable rates and exemptions, concessions or holidays granted on income tax The tax liabilities of the companies are computed at the standard rate of 28% on non liquor business and 40% on liquor business except for the following companies which enjoy exemptions and concessions.
Company Sector Basis Exemption or Concessions PeriodLanka Bell Limited
Telecommuni cation
In terms of an agreement entered in to with the Board of Investment (BOI) of Sri Lanka under section 17 of Law No. 04 of 1978.
The profits and income of the company is exempt for a period of 20 years. Thereafter the company will be taxed at a normal rate of 28%.
Commencing from year of assessment 97/98
Bogo Power (Pvt) Limited
Generation and sale of Hydro Electric Energy
Pursuant to the agreement dated 22 April 2010 entered with the Board of Investment under Section 17 of the BOI Law.
The Company is exempt from income tax arising from the income of generation of hydropower. After the expiration of exemption period the profits and income of the enterprise shall be charged to for each year of assessment at the rate of ten per centum (10%) (Concessionary period) for a period of two years immediately succeeding the last date of the tax exemption period during the which the profits and income of the Enterprise is exempted from income tax. After the expiration of concessionary period, the profits and income of the Enterprise shall, for any year of assessment be charged at the rate of twenty per centum (20%).
For a period of 05 years commencing from 01st April 2012

Dist i l ler ies Company of Sr i Lanka PLC112
Notes to the Financial Statements
Group CompanyFor the year ended 31 March, 2015 2014 2015 2014
Rs.000 Rs.000 Rs.000 Rs.000
12.1.4 Tax LossesLosses Brought Forward 1,634,083 1,600,428 - -Acquisition/(Disposal) of Subsidiaries - (198,000) - -Losses Incurred 553,118 304,188 - -Losses Utilised (92,560) (72,533) - -Loss Carried Forward 2,094,641 1,634,083 - -
13 Earnings per Share13.1 Basic Earnings per Share The calculation of basic earnings per share is based on the profit attributable to Ordinary shareholders and the weighted
average number of shares outstanding during the year.
Group CompanyFor the year ended 31 March, 2015 2014 2015 2014
Profit Attributable to Equity Holders of the Company (Rs.’000)*
6,552,956 6,121,813 10,284,723* 5,357,937
Weighted Average Numbers of Ordinary Shares (000) 300,000 300,000 300,000 300,000Basic Earnings per Share (Rs.) 21.84 20.41 34.28 17.86
* The Company’s profit includes a capital gain of Rs. 5.6 Bn from intra-group assets transfers.
13.2 Diluted Earnings per Share There were no potential dilutive ordinary shares outstanding at any time during the year. Therefore, diluted Earnings per
Share is same as Basic Earnings per Share shown above.
14 Dividend per Share Equity dividend on ordinary shares declared and paid during the year.
CompanyFor the year ended 31 March, 2015 2014
Per share Total Per share TotalRs. Rs.000 Rs. Rs.000
Final Dividend Proposed / Paid 3.25 975,000 3.25 975,000 975,000 975,000
The Directors recommended a final dividend of Rs. 3.25 per share for the year ended 31 March 2015, for approval by the shareholders at the Annual General Meeting to be held on 21 September 2015. As stipulated by Sri Lanka Accounting Standards - Events After the Reporting date (LKAS 10), this proposed dividend is not recognised as a liability as at 31 March 2015.
As required by Section 56 of the Companies Act No7 of 2007, the Board of Directors have satisfied the solvency test in accordance with Section 57. A statement of solvency completed and duly signed by the directors has been audited by Messrs. KPMG.
However, for the purpose of computing dividend per share, the final dividend to be approved has been taken into consideration.

Annual Report 2014/15 113
15
Prop
erty
, Pla
nt a
nd E
quip
men
tGr
oup
Cost
or Va
luatio
nAc
cumu
lated
Dep
reciat
ion an
d Imp
airme
ntCa
rrying
Value
At th
eBe
ginnin
gof
the Ye
ar
Addit
ions
Durin
g the Year
Reva
luatio
ns
Durin
g the Year
Dispo
sals/
Tra
nsfer
sAt
the
end o
fthe
Year
At th
eBe
ginnin
gof
the Ye
ar
Charg
efor
the
Year
Reva
luatio
ns
Durin
g the Year
Dispo
sals
At th
eEn
d of
the Ye
ar
As at
31 M
arch
2015
As at
31 M
arch
2014
Free
hold
Note
Rs.00
0Rs
.000
Rs.00
0Rs
.000
Rs.00
0Rs
.000
Rs.00
0Rs
.000
Rs.00
0Rs
.000
Rs.00
0Rs
.000
Land
15.2
4,65
5,042
1,
433,1
19
(15,8
50)
(1,20
7,328
) 4,
864,9
83
- -
- -
- 4,
864,9
83
4,65
5,042
La
nd Im
prove
ments
105,9
92
9,72
4 -
-
115,7
16
27,37
0 5,
284
- -
32,65
4 83
,062
78,62
2 Bu
ilding
s15
.2 1,
811,6
60
1,33
1,603
21
,010
(24,9
60)
3,13
9,313
43
4,611
80
,781
(20,9
31)
(10,0
90)
484,3
71
2,65
4,942
1,
377,0
49
Civil C
onstr
uctio
ns 65
9,504
1,
528
-
- 66
1,032
61
,409
32,97
5 -
- 94
,384
566,6
48
598,0
95
Plant,
Mach
inery
& Othe
r Equ
ipmen
t 1,
858,7
68
3,15
1,076
-
11
,680
5,02
1,524
1,
277,6
19
127,7
24
- (9
85)
1,40
4,358
3,
617,1
66
581,1
49
Motor
Vehic
les 1,
395,9
27
70,02
4 -
(5
6,501
) 1,
405,1
13
1,28
2,796
22
2,898
-
(60,0
85)
1,44
5,609
(4
0,496
) 11
3,131
Fu
rnitur
e, Fitt
ings &
Office
Equip
ment
1,32
2,308
79
,467
-
(4,32
2) 1,
397,4
53
1,14
5,595
60
,220
- (3
,423)
1,20
2,392
19
5,061
17
6,713
Co
mpute
r Equ
ipmen
t & So
ftware
218,4
51
24,78
8 -
72
3 24
3,962
16
8,824
21
,347
- -
190,1
71
53,79
1 49
,627
Electr
o Mec
hanic
al Eq
uipme
nt 29
9,785
-
-
-
299,7
85
29,95
4 14
,989
- -
44,94
3 25
4,842
26
9,831
Dig
ital E
lectro
nic Sw
itche
s 1,
125,8
91
21,02
0 -
(3
0,713
) 1,
116,1
98
671,4
56
113,1
51
- (1
8,172
) 76
6,435
34
9,763
45
4,435
Ne
twork
Equip
ment
2,07
5,765
21
,630
-
(12,1
47)
2,08
5,248
1,
432,6
33
167,0
45
- (8
,361)
1,59
1,317
49
3,931
64
3,132
To
wers
905,1
61
13,74
1 -
-
918,9
02
527,2
83
79,52
4 -
- 60
6,807
31
2,095
37
7,878
Cu
stome
r Prem
ise Eq
uipme
nt 3,
072,0
26
78,89
6 -
(2
,588)
3,14
8,334
2,
482,7
30
198,4
87
- (2
57)
2,68
0,960
46
7,374
58
9,296
Wa
ter Sa
nitati
on 60
,732
-
-
- 60
,732
38,45
7 2,
983
- -
41,44
0 19
,292
22,27
5 Sh
elters
and O
ther E
quipm
ent
524,9
70
1,82
4 -
(8
20)
525,9
74
498,6
20
17,58
4 -
(445
) 51
5,759
10
,215
26,35
0 Fla
g Proj
ect
39,94
1 62
-
-
40,00
3 35
,924
609
- -
36,53
3 3,
470
4,01
7 LT
E Proj
ect
196,5
79
334,1
00
-
- 53
0,679
7,
825
61,80
5 -
- 69
,630
461,0
49
188,7
54
Wi-M
ax 24
8,696
1,
751
-
- 25
0,447
19
7,892
18
,472
- -
216,3
64
34,08
3 50
,804
Fire F
ightin
g Equ
ipmen
t 4,
247
636
-
- 4,
883
3,39
3 17
6 -
- 3,
569
1,31
4 85
4 Oi
l Stor
age T
anks
315
-
-
- 31
5 31
5 -
- -
315
- -
Vats
& Cas
ks 69
,575
-
-
- 69
,575
53,31
5 3,
032
- -
56,34
7 13
,228
16,26
0 Dr
ums
80
-
-
- 80
80
-
- -
80
- -
20,65
1,415
6,
574,9
89
5,16
0 (1
,326,9
76)
25,90
0,251
10
,378,1
01
1,22
9,086
(2
0,931
) (1
01,81
8) 11
,484,4
38
14,41
5,813
10
,273,3
14
Leas
ehold
Motor
Vehic
les -
67
4 -
-
674
- 56
-
- 56
61
8 -
Plant
& Mac
hinery
30,54
4 -
-
-
30,54
4 55
9 1,
222
- -
1,78
1 28
,763
29,98
5 Fu
rnitur
e, Fit
tings
& Eq
uipme
nt 14
,027
-
-
- 14
,027
14,02
9 -
- -
14,02
9 (2
) (2
)Im
mova
ble (J
EDB/
SLSP
C) As
sets
On
Finan
ce Le
ase
15.1
438,1
41
-
-
- 43
8,141
22
7,894
9,
350
- -
237,2
44
200,8
97
210,2
47
Leas
ehold
Impro
veme
nts 33
4,135
54
4 -
-
334,6
79
309,3
09
18,19
0 -
- 32
7,499
7,
180
24,82
6 To
tal Fr
eeho
ld an
d Lea
seho
ld Pr
opert
y, Pla
nt & E
quipm
ent
816,8
47
1,21
8 -
-
81
8,065
5
51,7
91
28,
818
-
-
580
,609
2
37,4
56
265,0
56
Capit
al Wo
rk in
Prog
ress
5,68
2,672
3,
085,4
29
-
(4,94
4,072
) 3,
824,0
29
- -
- -
- 3,
824,0
29
5,68
2,672
To
tal P
ropert
y, Pla
nt &
Equip
ment
27,15
0,934
9,
661,6
36
5,16
0 (6
,271,0
48)
30,54
2,345
10
,929,8
92
1,25
7,904
(2
0,931
) (1
01,81
8) 12
,065,0
47
18,47
7,298
16
,221,0
42

Dist i l ler ies Company of Sr i Lanka PLC114
Notes to the Financial Statements
15
Prop
erty
, Pla
nt a
nd E
quip
men
t (C
ontd
.)Co
mpa
nyCo
st or
Valu
ation
Accu
mula
ted
Depr
eciat
ion an
d Im
pairm
ent
Carry
ing V
alue
At th
eBe
ginnin
gof
the Y
ear
Addit
ions
Durin
g th
eYe
ar
Disp
osals
/ Tra
nsfer
sAt
the
End
ofth
e Ye
ar
At th
eBe
ginnin
gof
the Y
ear
Char
gefo
r the
Year
Disp
osals
At th
eEn
d of
the
Year
As a
t31
Mar
ch20
15
As at
31 M
arch
2014
Free
hold
Note
Rs.0
00Rs
.000
Rs.0
00Rs
.000
Rs.0
00Rs
.000
Rs.0
00Rs
.000
Rs.0
00Rs
.000
Land
15.2
2,0
81,2
00
- (7
35,0
00)
1,3
46,2
00
--
- -
1
,346
,200
2
,081
,200
Build
ings
15.2
56,
338
1,2
95,2
90
(10,
090)
1,3
41,5
38
56,
338
2,4
84
(10,
090)
48,
732
1,2
92,8
06
-
Plan
t, M
achin
ery &
Oth
er E
quipm
ent
662
,347
3
,120
,780
3
,783
,127
4
22,1
10
62,
176
484
,286
3
,298
,841
2
40,2
37
Mot
or V
ehicl
es 4
74,5
29
53,
900
(32,
966)
495
,463
3
57,2
20
81,
701
(31,
955)
406
,966
8
8,49
7 1
17,3
09
Furn
iture
, Fitti
ngs &
Offic
e Equ
ipmen
t 5
8,97
9 1
,487
(1
30)
60,
336
44,
068
2,7
40
(130
) 4
6,67
8 1
3,65
8 1
4,91
1
Com
pute
r Equ
ipmen
t & S
oftw
are
53,
916
9,3
36
- 6
3,25
2 4
2,00
4 7
,906
-
49,
910
13,
342
11,
912
Fire F
ightin
g Eq
uipm
ent
4,2
47
636
-
4,8
83
3,3
93
176
-
3,5
69
1,3
14
854
Oil S
tora
ge Ta
nks
315
-
- 3
15
315
-
-
315
-
-
Vats
& Ca
sks
69,
575
--
69,
575
53,
315
3,0
32
- 5
6,34
7 1
3,22
8 1
6,26
0
Drum
s 8
0 -
- 8
0 8
0 -
- 8
0 -
-
3,4
61,5
26
4,4
81,4
29
(778
,186
) 7
,164
,769
9
78,8
43
160
,215
(4
2,17
5) 1
,096
,883
6
,067
,886
2
,482
,683
Capit
al W
ork i
n Pr
ogre
ss 3
,815
,987
7
26,8
78
(4,3
90,9
82)
151
,883
-
--
- 1
51,8
83
3,8
15,9
87
Tota
l Pro
perty
, Plan
t & E
quip
men
t 7
,277
,513
5
,208
,307
(5
,169
,168
) 7
,316
,652
9
78,8
43
160
,215
(4
2,17
5) 1
,096
,883
6
,219
,769
6
,298
,670
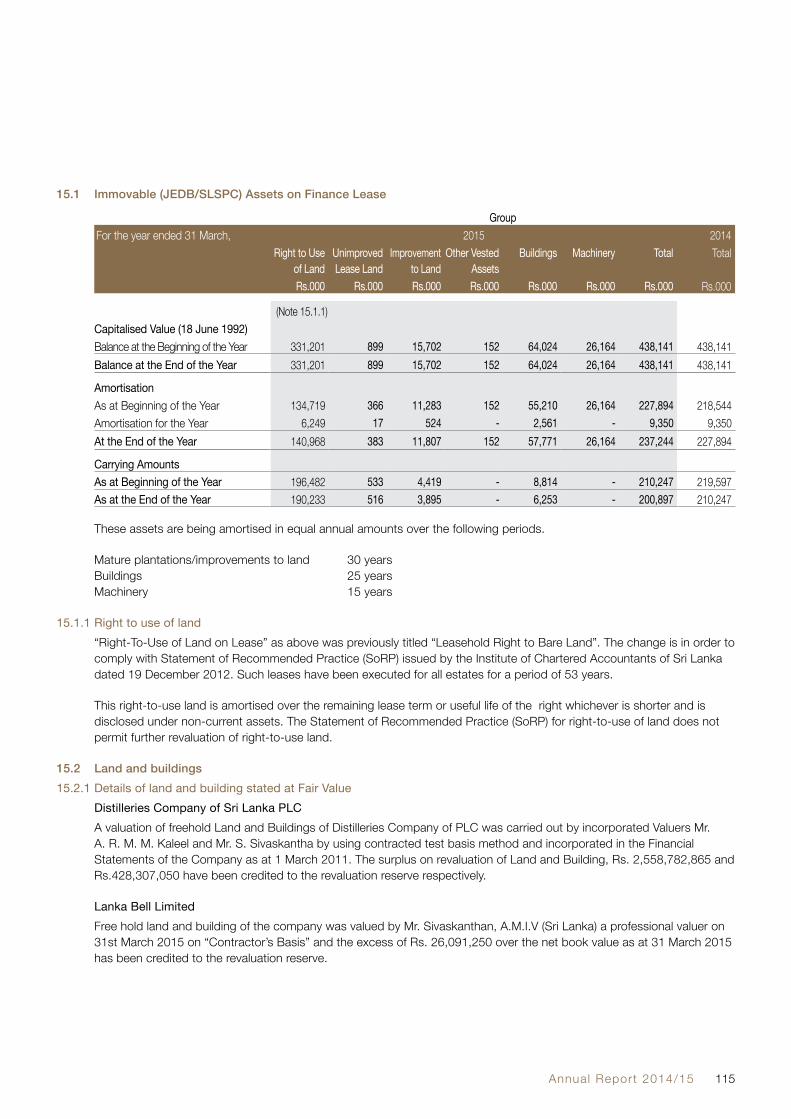
Annual Report 2014/15 115
15.1 Immovable (JEDB/SLSPC) Assets on Finance Lease
GroupFor the year ended 31 March, 2015 2014
Right to Use of Land
Unimproved Lease Land
Improvement to Land
Other Vested Assets
Buildings Machinery Total Total
Rs.000 Rs.000 Rs.000 Rs.000 Rs.000 Rs.000 Rs.000 Rs.000
(Note 15.1.1)Capitalised Value (18 June 1992)Balance at the Beginning of the Year 331,201 899 15,702 152 64,024 26,164 438,141 438,141Balance at the End of the Year 331,201 899 15,702 152 64,024 26,164 438,141 438,141
AmortisationAs at Beginning of the Year 134,719 366 11,283 152 55,210 26,164 227,894 218,544Amortisation for the Year 6,249 17 524 - 2,561 - 9,350 9,350At the End of the Year 140,968 383 11,807 152 57,771 26,164 237,244 227,894
Carrying AmountsAs at Beginning of the Year 196,482 533 4,419 - 8,814 - 210,247 219,597As at the End of the Year 190,233 516 3,895 - 6,253 - 200,897 210,247
These assets are being amortised in equal annual amounts over the following periods.
Mature plantations/improvements to land 30 years Buildings 25 years Machinery 15 years
15.1.1 Right to use of land “Right-To-Use of Land on Lease” as above was previously titled “Leasehold Right to Bare Land”. The change is in order to
comply with Statement of Recommended Practice (SoRP) issued by the Institute of Chartered Accountants of Sri Lanka dated 19 December 2012. Such leases have been executed for all estates for a period of 53 years.
This right-to-use land is amortised over the remaining lease term or useful life of the right whichever is shorter and is disclosed under non-current assets. The Statement of Recommended Practice (SoRP) for right-to-use of land does not permit further revaluation of right-to-use land.
15.2 Land and buildings15.2.1 Details of land and building stated at Fair Value Distilleries Company of Sri Lanka PLC A valuation of freehold Land and Buildings of Distilleries Company of PLC was carried out by incorporated Valuers Mr.
A. R. M. M. Kaleel and Mr. S. Sivaskantha by using contracted test basis method and incorporated in the Financial Statements of the Company as at 1 March 2011. The surplus on revaluation of Land and Building, Rs. 2,558,782,865 and Rs.428,307,050 have been credited to the revaluation reserve respectively.
Lanka Bell Limited Free hold land and building of the company was valued by Mr. Sivaskanthan, A.M.I.V (Sri Lanka) a professional valuer on
31st March 2015 on “Contractor’s Basis” and the excess of Rs. 26,091,250 over the net book value as at 31 March 2015 has been credited to the revaluation reserve.

Dist i l ler ies Company of Sr i Lanka PLC116
Notes to the Financial Statements
Texpro Industries (Pvt) Ltd The Company’s land and building were revalued on 01 April 2009. The land was subsequently revalued on 3rd April 2013
by a professionally qualified independent valuer K. Arthur Perera. The valuation was based on contractors method of valuation.
Browns Beach Hotel PLC The Book value of freehold land owned by the Company, which is situated at No. 175, Lewis Place, Negombo has been
revalued by Mr. J. Rajasooriya, (A.I.V. (Sri Lanka), M.P.V.A. (Sri Lanka) on 26 March 2003. The surplus on revaluation, Rs. 74.3 million, has been credited to the revaluation reserve.
Freehold land at No. 175, Lewis Place, Negombo was valued by Mr. J. Rajasooriya, A.I.V. (Sri Lanka), M.P.V.A. (Sri Lanka) a professional valuer, on 28 March 2007 on “Market pricing basis” and the excess of Rs.290,000,000 over the net book value has been placed to the credit of revaluation reserve.
Free hold land at No.175, Lewis Place, Negombo of Browns Beach Hotel PLC was revalued by Mr. K. C. B. Condegama, (A.I.V. Sri Lanka) a professional valuer on 31 March 2012 on “Market Pricing Basis” and the excess of Rs. 476,500,000 over the net book value as at 31 March 2012 has been placed to the credit of revaluation reserve.
15.2.2 The carrying amount of revalued land and buildings if they were carried at cost less depreciation would be as follows;
GroupFor the year ended 31 March, 2015 2014
Land Building Land Building Rs. Rs.000 Rs. Rs.000
Cost 591,554 446,412 591,554 446,412 Accumulated Depreciation and Impairment - (272,967) - (255,741)Carrying Values 591,554 173,445 591,554 190,671
CompanyFor the year ended 31 March, 2015 2014
Land Building Land Building Rs. Rs.000 Rs. Rs.000
Cost 51,047 46,248 109,402 56,339 Accumulated Depreciation and Impairment - (46,248) - (56,339)Carrying Values 51,047 - 109,402 -
15.3 Gross Carrying Value of Fully Depreciated Assets The cost of the fully depreciated assets of the Group and the Company amounts to Rs.6,039.1 Mn (5,284 Mn - 2014) and
595.6 Mn (513 Mn - 2014) respectively as at reporting dated.
15.4 Property Plant and Equipment that have been Pledged The property plant and equipments that are pledged for long term borrowings are disclosed in Note 41 to these financial
statements.
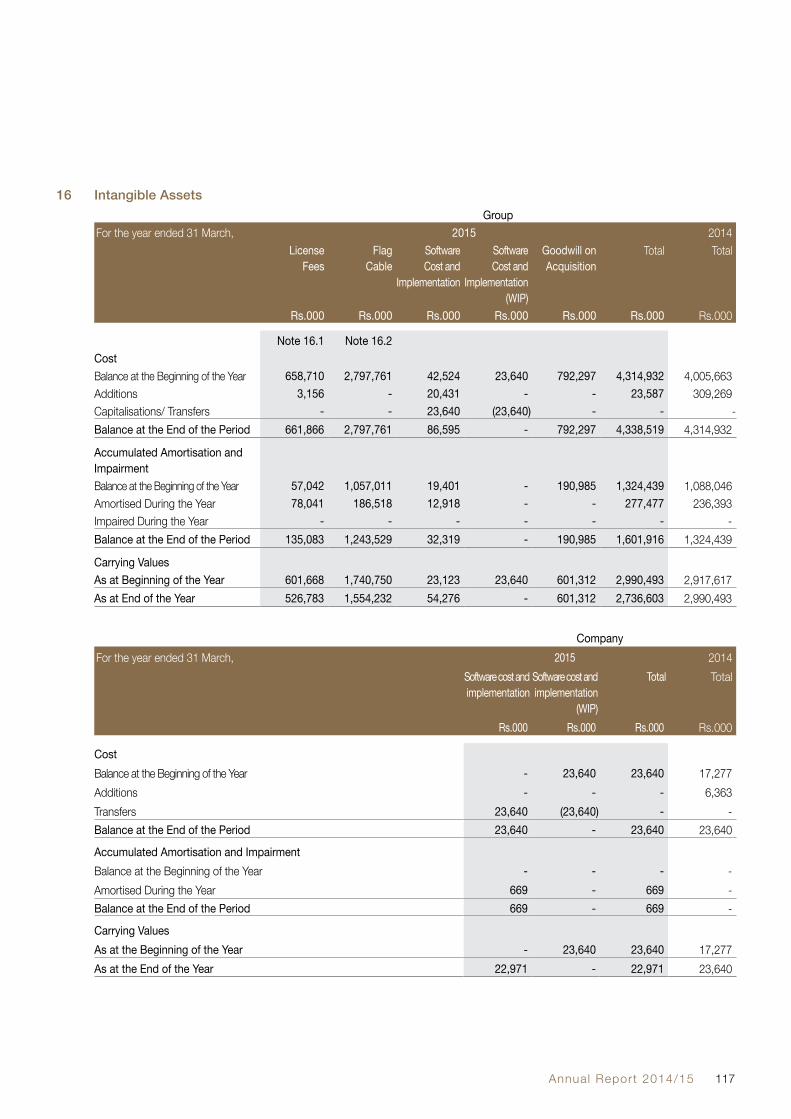
Annual Report 2014/15 117
16 Intangible Assets Group
For the year ended 31 March, 2015 2014License
FeesFlag
CableSoftwareCost and
Implementation
SoftwareCost and
Implementation (WIP)
Goodwill on Acquisition
Total Total
Rs.000 Rs.000 Rs.000 Rs.000 Rs.000 Rs.000 Rs.000
Note 16.1 Note 16.2CostBalance at the Beginning of the Year 658,710 2,797,761 42,524 23,640 792,297 4,314,932 4,005,663 Additions 3,156 - 20,431 - - 23,587 309,269 Capitalisations/ Transfers - - 23,640 (23,640) - - - Balance at the End of the Period 661,866 2,797,761 86,595 - 792,297 4,338,519 4,314,932
Accumulated Amortisation and ImpairmentBalance at the Beginning of the Year 57,042 1,057,011 19,401 - 190,985 1,324,439 1,088,046 Amortised During the Year 78,041 186,518 12,918 - - 277,477 236,393 Impaired During the Year - - - - - - - Balance at the End of the Period 135,083 1,243,529 32,319 - 190,985 1,601,916 1,324,439
Carrying ValuesAs at Beginning of the Year 601,668 1,740,750 23,123 23,640 601,312 2,990,493 2,917,617 As at End of the Year 526,783 1,554,232 54,276 - 601,312 2,736,603 2,990,493
CompanyFor the year ended 31 March, 2015 2014
Software cost and implementation
Software cost and implementation
(WIP)
Total Total
Rs.000 Rs.000 Rs.000 Rs.000
CostBalance at the Beginning of the Year - 23,640 23,640 17,277 Additions - - - 6,363 Transfers 23,640 (23,640) - - Balance at the End of the Period 23,640 - 23,640 23,640
Accumulated Amortisation and ImpairmentBalance at the Beginning of the Year - - - - Amortised During the Year 669 - 669 - Balance at the End of the Period 669 - 669 -
Carrying ValuesAs at the Beginning of the Year - 23,640 23,640 17,277 As at the End of the Year 22,971 - 22,971 23,640

Dist i l ler ies Company of Sr i Lanka PLC118
Notes to the Financial Statements
16.1 License fees License fee includes the operator license fee of Rs. 300 million which was paid in 1996, and amortised over 226 months
on straight line basis commencing from that year. The External Gateway License fee of Rs. 4.85 million which was renewed in 2013 amounting to Rs. 102Mn is amortised over a period of 10 years, commencing from 28th February 2013. The Wi-Max 2365-2380 MHz License Fee of Rs.510.2 Mn was paid in 2011/12 and 2012/13 and operations commenced on 01st July 2013.
16.2 FLAG cable FLAG expenditure represents the expenditure incurred on undersea fibre optic cable link and the landing station, which
enables Lanka Bell to offer direct global connectivity and a complete end-to-end data connectivity solution. The total expenditure will be amortised over the license period of 15 years on a straight line basis from August 2008.
17 Investment Property Group
For the year ended 31 March, Land Building Total 2015 Total 2014Rs.000 Rs.000 Rs.000 Rs.000
Cost / ValuationBalance at the Beginning of the Year - - - - Additions 579,005 7,150 586,155 - Balance at the End of the Period 579,005 7,150 586,155 -
Accumulated DepreciationBalance at the Beginning of the Year - - - - Charge During the Year - 60 60 - Balance at the End of the Period - 60 60 -
Carrying ValuesAs at Beginning of the Year - - - - As at End of the Year 579,005 7,090 586,095 -
17.1 Fair Value of Investment Property Since the above properties have been acquired during the year, the management believes there is no material difference
between the cost and the fair value of above properties.
18. Biological AssetsGroup
As at 31 March, 2015 2014Note Rs.000 Rs.000
Bearer Biological Assets 18.1 1,889,494 1,616,271 Consumer Biological Assets 18.2 1,662,375 1,559,765
3,551,869 3,176,036
18.1 Bearer Biological Assets
On Finance Lease (JEDB/SLSPC) 18.1.1 78,863 87,904
Investments after Formation of the Plantation Company 18.1.2 1,810,631 1,528,367
1,889,494 1,616,271

Annual Report 2014/15 119
18.1.1 On finance lease (JEDB/SLSPC) In terms of the ruling of the UITF of the Institute of Chartered Accountants of Sri Lanka prevailed at the time of
privatisation of plantation estates, all immovable assets in these estates under finance leases have been taken into the books of the Company retroactive to 18th June 1992. For this purpose, the Board decided at its meeting on 8th March, 1995, that these assets be stated at their book values as they appear in the books of the JEDB/SLSPC, on the day immediately preceding the date of formation of the Company. These assets are taken into the Statement of Financial Position as at 18 June, 1992 and amortisation of immovable leased assets to 31 December 2014 are as follows.
Mature PlantationsFor the year ended 31 March, 2015 2014
Tea Rubber Total TotalRs.000 Rs.000 Rs.000 Rs.000
CostBalance as at the Beginning of the Year 206,227 64,997 271,224 271,224 Balance as at the End of the Year 206,227 64,997 271,224 271,224
Accumulated AmortisationBalance as at the Beginning of the Year 139,677 43,643 183,320 174,280 Amortisation for the Year 6,874 2,167 9,041 9,040 Balance as at the End of the Year 146,551 45,810 192,361 183,320 Carrying Amounts 59,676 19,187 78,863 87,904
Investment in Immature Plantations at the time of handing over to the Company as at 18 June, 1992 by way of estate leases were shown under Immature Plantations.
However, since then all such investments in immature plantations attributable to JEDB/ SLSPC period have been transferred to mature plantations. These mature tea and rubber were classified as bearer biological assets in terms of LKAS 41 - Agriculture. The carrying value of the bearer biological assets leased from JEDB/SLSPC is recognised at cost less amortisation. Further investments in such plantations to bring them to maturity are shown in Note 18.1.2.
18.1.2 Investments after formation of the plantation company
For the year ended 31 March, 2015 2014Immature
PlantationsMature
PlantationsTotal Total
Rs.000 Rs.000 Rs.000 Rs.000
CostBalance as at the Beginning of the Year 1,140,840 673,110 1,813,950 1,489,462 Additions During the Year 312,468 - 312,468 324,488 Transfers (from)/to (40,078) 40,078 - - Balance as at the End of the Year 1,413,230 713,188 2,126,418 1,813,950
Accumulated AmortisationBalance as at the Beginning of the Year - 285,583 285,583 257,284 Charge for the Year - 30,204 30,204 28,299 Balance as at the End of the Year - 315,787 315,787 285,583 Carrying Amounts at the End of the Year 1,413,230 397,401 1,810,631 1,528,367

Dist i l ler ies Company of Sr i Lanka PLC120
Notes to the Financial Statements
These are investments in immature/ mature plantations since the formation of the Company. The assets (including plantation assets) taken over by way of estate leases are set out in Notes 18.1.1 Further investment in immature plantations taken over by way of these leases are shown in the above note. When such plantations become mature, the additional investments since take over to bring them to maturity, will be moved from immature to mature under this note.
The requirement for recognition of bearer biological assets at its fair value less cost to sell under LKAS 41 was superseded by the ruling issued on March, 2nd 2012 by the Institute of Chartered Accountants of Sri Lanka. Accordingly, the Company has elected to measure the bearer biological assets at cost using LKAS 16 - Property, Plant & Equipment.
Specific borrowings have been obtained to finance the planting expenditure. The above additions include Rs.58,231,199 (2014-Rs.43,136,174/=) of borrowing costs capitalised during the year.
18.2 Consumer Biological Assets
GroupFor the year ended 31 March, 2015 2014
Rs.000 Rs.000
Balance as at the Beginning of the Year 1,559,765 1,475,236 Gain/(Loss) Arising from Changes in Fair Value Less Cost to Sell 92,376 74,293 Increase Due to Development 10,234 10,236 Balance as at the End of the Year 1,662,375 1,559,765
Managed timber plantations include commercial timber plantations cultivated in estates. The timber plantations are recorded at fair value other than young trees which are recorded at cost as the significant biological transformation has not taken place.
Managed timber plantation was measured at fair value initially as at 31 December 2012 and subsequently. The corresponding gain/loss was recognised in the profit or loss. However fair value surplus was recognised in the equity as a separate component which will be available for distribution only on realisation of consumable biological assets.
18.2.1 Measurement of Fair Values a) Fair Value Hierarchy The fair value measurements of for the standing timber have been categorised as Level 3 fair values based on the inputs
to the valuation techniques used.
The fair value of managed timber plantations was ascertained since the LKAS 41 is only applicable for managed agricultural activity in terms of the ruling issued by The Institute of Chartered Accountants of Sri Lanka. The valuation was carried by Messers Mr. W.M.Chandrasena, incorporated valuers, using Discounted Cash Flow (DCF) methods. In ascertaining the fair value of timber a physical verification was carried out covering all the estates.
Key assumption used in the Valuation 1. The harvesting is approved by the PMMD and Forestry Department Based on the Forestry Department Plan.
2. The current market prices used are net of selling expenditure.
3. Discount rate is 13%, a Sensitivity analysis at (+) or (-) 1% is also disclosed
4. Though the replanting is a condition precedent for harvesting , yet the costs are not taken into consideration, as these are not considered to be material.

Annual Report 2014/15 121
The valuations, as presented in the external valuation models based on net present values, take into account the long term exploitation of the timber plantations. Because of the inherent uncertainty associated with the valuation at fair value of the biological assets due to the volatility of the variables, their carrying value may differ from their realisable value. The Board of Directors retains their view that commodity markets are inherently volatile and that long term price projections are highly unpredictable. Hence, the sensitivity analysis regarding discount rate variations as included in this note allows every investor to reasonably challenge the financial impact of the assumptions used in the LKAS 41 against his own assumptions.
b) Level 3 Fair Values The break down of the total gains (losses) in respect of Level 3 fair values is shown below.
GroupFor the year ended 31 March, 2015 2014
Rs.000 Rs.000
Gain Included in Other Income Change in Fair Value (Realised) 19,941 40,664 Change in Fair Value (Unrealised) 92,377 74,294
112,318 114,958
18.2.2 Sensitivity analysis Sensitivity variation discount rate Values as appearing in the Statement of Financial Position are very sensitive to changes of the discount rate applied.
Simulations made for timber trees show that a rise or decrease by 1% of the discount rate has the following effect on the net present value of biological assets:
12% 13% 14%Managed Timber 1,738,526 1,662,376 1,598,537 Total 1,738,526 1,662,376 1,598,537
19 Investments in SubsidiariesAs at 31 March, 2015 2014
Number ofshares
Effectiveholding
CostRs.000
Number ofshares
Effectiveholding
CostRs.000
Melstacorp Limited 265,450,000 100% 48,320,750 200,000,000 100% 35,558,000Timpex Limited* - - 15,611,661 51.03% 156,117AION SG Residencies (Pvt) Ltd 100% 25,000 2,500,000 100% 25,000Less: Provision for Impairment of Investment
(25,000) (25,000)
48,320,750 35,714,117
* The Company has structured its investment in Timpex Limited to its fully owned subsidiary, Melstacorp Limited during the year as per group restructuring plan.

Dist i l ler ies Company of Sr i Lanka PLC122
Notes to the Financial Statements
19.1 Group Holdings in Subsidiaries
Subsidiary Principal Activity Reporting date
Reason for using adifferent period
Indirectlyholdingthrough
2015No. of shares
held
2015Effective
ownershipinterest
1 Balangoda Plantations PLC BPL Cultivation and Processing of Tea & Rubber
31-Dec To comply with the rules and regulations in the Plantation sector
MC 10,217,300 43.23%
2 Bell Solutions (Pvt) Ltd BSL Information & CommunicationTechnology
31-Mar - LB 98,090 98.09%
3 Bellvantage (Pvt) Ltd BV BPO,KPO & Software Development
31-Mar - MC 5,000,100 100%
4 Bogo Power (Pvt) Ltd BP Generation and Sale of Hydro Electric Energy
31-Mar - MC 993,000,000 99.30%
5 Browns Beach Hotel PLC BBH Leisure 31-Mar - MC 54,273,234 41.88%6 Continental Insurance Lanka
LimitedCIL General Insurance
Services 31-Dec To comply with the rules
and regulations in the Insurance sector
MC 50,000,000 100%
7 Lanka Bell Ltd LB Telecommunication Services
31-Mar - MH 50,719,061 99.73%
8 Melstacorp Limited MC Investment Holding Company
31-Mar - Direct 265,450,000 100%
9 Melsta Logistics (Pvt) Ltd ML Automobile Servicing and Logistics
31-Mar - MC 66,572,573 100%
10 Melsta Regal Finance Ltd MRF Finance, Leasing, Hire Purchasing and Factoring
31-Mar - MC 134,029,451 100%
11 Milford Holdings (Pvt) Ltd MH Investment Holding Company
31-Mar - MC 333,067,925 98.36%
12 Negombo Beach Resorts (Pvt) Ltd
NBR Leisure 31-Mar - BBH 91,400,001 41.88%
13 Periceyl (Pvt) Ltd PVL Distribution of locally manufacturedForeign Liquor
31-Dec To operate in line with foreign strategic alliances
MC 40,000 100%
14 Splendor Media (Pvt) Ltd SM Media Buying & Creative Services
31-Mar - MC 100,002.00 100%
15 Telecom Frontier (Pvt) Ltd TF Telecommunication Services
31-Mar - LB 98,090 98.09%
16 Texpro Industries Ltd TEXP Dyeing and Printing Woven Fabrics
31-Mar - TIM 46,836,524 41.75%
17 Timpex Ltd TIM Investment Holding Company
31-Mar - MC 15,611,661 51.03%
18 Melsta Properties (Pvt) Ltd MP Management of Real Estate
31-Mar - MC 170,194,901 100%
19 Melsta Tower (Pvt) Limited MT Real Estate 31-Mar MC 42,500,000 100%20 Melsta Technology (Pvt) Limited TECH IT Services 31-Mar MC 1,000,000 z 100%
19.2 Significant Judgements and Assumptions made in Determining whether the Group has Control Although the Group owns less that half of the voting rights of Browns Beach Hotel PLC (BBH) and Balangoda Plantations
PLC (BPL), the Group assessed that it is able to govern the financial and operating policies of BBH and BPL by virtue of de facto control on the basis that the remaining share holders are widely depressed and there is no indication to believe that all of them will exercises their votes collectively.

Annual Report 2014/15 123
19.3 Disclosure of the Interest that Non-Controlling Interests have in the Group’s Activities and Cash Flows19.3.1 Nature of Interests in Subsidiaries with Material NCI
Name of the subsidiary : Balangoda Plantations PLC (BPL) Browns Beach Hotels PLC (BBH)
Principal Place of Business : In the areas of Ratnapura, Balangoda and Badulla
No. 175, Lewis Place, Negombo
Proportion of Ownership Interest held by Non Controlling Interest : 56.77% 58.12%Profit / (Loss) allocated to Non Controlling Interest (Rs. ‘000) : (54,066) (9,108)Accumulated Non Controlling Interest at the End of the Reporting Period (Rs. ‘000)
: 1,488,378 2,063,625
19.3.2 Summarised Financial Information of Subsidiaries that have Material NCI BPL BBH
As at/ for the year ended 31 March, 2015 2014 2015 2014Rs.000 Rs.000 Rs.000 Rs.000
Dividends Paid to Non Controlling Interests 13,419 13,419 - -Current Assets 795,348 835,147 87,119 1,048,716Non Current Assets 4,348,929 3,997,908 4,253,596 2,536,628Current Liabilities 876,898 947,133 124,391 12,127Non Current Liabilities 1,645,747 1,129,373 665,848 471Revenue 3,002,156 3,171,983 - -Profit from Continuing Operations (95,231) 132,654 (15,671) 93,249Other Comprehensive Income (16,601) 21,147 (169) 442Total Comprehensive Income (111,832) 153,801 (15,840) 93,691
19.4 Acquisition of NCI In March 2015, the Group acquired 50% of interest in Splendor Media Private Limited for Rs.30,520,261, increasing its
ownership from 50 to 100%. The Group recognised: • a decrease in NCI of Rs.32,484,965; • an increase in retained earnings of RS.1,964,704; and The carrying amount of Splendor Media Private Limited’s net assets in the Group’s financial statements on the date of the
acquisition was Rs.64,867,930. The following summarises the changes in the Company’s ownership interest in Splendor Media Private Limited.
GroupFor the year ended 31 March, 2015
Rs.000
Company’s Ownership Interest at 31 March 2015 32,383 Effect of Increase in Company’s Ownership Interest 32,485 Company’s Ownership Interest at 31 March 2015 64,868
20 Investment in Equity Accounted InvesteesGroup
As at 31 March, 2015 2014No. of
SharesEffective Holding
Equity Value Cost No. of Shares Effective Holding
Equity Value Cost
Rs.000 Rs.000 Rs.000 Rs.000
20.1 20.1Aitken Spence Holdings PLC 167,584,298 41.28% 23,735,329 18,809,061 167,030,743 41.14% 22,538,992 14,239,687 Madulsima Plantations PLC 9,048,307 31.20% 456,908 90,000 9,048,307 31.20% 455,517 90,000
24,192,237 18,899,061 22,994,509 14,329,687

Dist i l ler ies Company of Sr i Lanka PLC124
Notes to the Financial Statements
CompanyAs at 31 March, 2015 2014
No. of Shares Effective Holding Cost No. of Shares Effective Holding Cost
Rs.000 Rs.000Aitken Spence PLC 186,500 0.001% 28,703 186,500 0.001% 28,703
28,703 28,703
20.1 Equity Value of Investment in Equity Accounted Investees to the Group For the year ended 31 March 2015
Equity AccountedInvestee
Balance as at1 April 2014
Acquisitions/(Disposal)
Share of Profit/(Loss) Net
of Tax
Dividend Received
Share of Other Comprehensive
Income
Share ofNet Assets
Balance As At 31 March 2015
Rs.000 Rs.000 Rs.000 Rs.000 Rs.000 Rs.000 Rs.000
Aitken Spence PLC 22,538,992 55,744 1,477,319 (335,169) (2,271) 714 23,735,329 Madulsima Plantations PLC 455,517 - (86,651) - 88,042 - 456,908
22,994,509 55,744 1,390,668 (335,169) 85,771 714 24,192,237
For the year ended 31 March 2014
Equity AccountedInvestee
Balance as at1 April 2013
Acquisitions/(Disposal)
Share of Profit/(Loss) Net
of Tax
Dividend Received
Share of Other Comprehensive
Income
Share ofNet Assets
Balance As At 31 March 2014
Rs.000 Rs.000 Rs.000 Rs.000 Rs.000 Rs.000 Rs.000Aitken Spence PLC 20,303,398 507,636 1,508,771 (250,236) 462,671 6,752 22,538,992Madulsima Plantations PLC 525,303 - (68,590) - (1,197) 455,517 Pelwatte Dairies (Pvt) Ltd 86,284 (86,284) - - - -
20,914,985 421,352 1,440,182 (250,236) 461,474 6,752 22,994,509
20.2 Fair Value of Quoted Equity Accounted Investees and Other Information
Group CompanyAs at 31 March, Principal Activity Reporting Date 2015 2014 2015 2014
Rs.000 Rs.000 Rs.000 Rs.000
Aitken Spence PLC Diversified holdings 31 March 16,674,637 16,352,310 18,557 18,258Madulsima Plantations PLC Cultivation and
processing of Tea31 December 103,151 91,388 - -
16,777,788 16,443,698 18,557 18,258
20.3 Disclosure of Nature, Extent and Financial Effects of the Entity’s Interests in Associates20.3.1 Associates that are Individually Material to the Group
Name of the Associate : Aitken Spence PLC Madulsima Plantations PLC
Principal Place of Business : No.315, Vauxhall Street, Colombo 02. In the areas of Madulsima and Bogawanthalawa.
Principal Activities : Investment Holding Company Cultivation and plantation of teaProportion of Ownership Interests : 41.28% 31.20%Whether Strategic to the Group : Yes Yes
Investment in Associate is Measured using : Equity method Equity method

Annual Report 2014/15 125
20.3.2 Summarised financial information of Equity Accounted Investees (entire amount reported in associate’s financial statements)
Aitken Spence PLC Madulsima Plantations PLCAs at / for the year ended 31 March, 2015 2014 2015 2014
Rs.000 Rs.000 Rs.000 Rs.000
Total Current Assets 25,703,317 25,865,144 411,709 452,701 Total Non Current Assets 39,729,771 35,280,093 4,454,513 3,891,249 Total Current Liabilities 12,426,235 13,816,605 2,202,176 1,862,099 Total Non Current Liabilities 10,727,403 8,550,368 1,088,871 911,134 Revenue 35,318,891 36,108,370 2,207,886 2,056,721 Profit / (Loss) from Continuing Operations 4,883,600 4,508,635 (277,727) (219,628)Other Comprehensive Income / (Expenses) 2,907 1,286,282 282,185 (3,831)Total Comprehensive Income / (Expenses) 4,886,507 5,794,917 4,458 (223,459)Cash and Cash Equivalents 2,911,135 2,728,514 1,747 2,364Depreciation and Amortisation. 1,391,376 1,499,420 74,533 73,142 Interest Income. 622,825 800,721 212 205 Interest Expense. 804,836 1,145,540 192,877 111,840 Income Tax Expense 826,323 900,476 7,685 3,620
21 Other Financial Investments
Group CompanyAs at 31 March, 2015 2014 2015 2014
Note Rs.000 Rs.000 Rs.000 Rs.000
Non Current InvestmentsAvailable For Sale Financial Investments - (AFS) 21.1 17,340,724 15,452,954 2,561,053 6,349,895 Loans and Receivables (L&R) Financial Investments
21.4 182,538 181,765 - -
Other Non Current Financial Investments 17,523,262 15,634,719 2,561,053 6,349,895
Current InvestmentsAvailable for Sale Financial Investments - (AFS) 21.1 177,517 - - - Fair Value Through Profit or Loss (FVTPL) Financial Investments
21.2 2,011,416 2,184,859 177,863 784,540
Held to Maturity (HTM) Financial Investments 21.3 40,911 - - - Loans and Receivables (L&R) Financial Investments
21.4 201,971 254,893 - -
Other Current Financial Investments 2,431,815 2,439,752 177,863 784,540
21.1 Available for Sale Financial Investments - (AFS)
Non Current InvestmentsQuoted Equity Securities 21.1.1 16,931,800 15,213,946 2,223,612 6,126,080 Unquoted Equity Securities 21.1.2 114,102 338 113,771 7 Investments in Unit Trusts 21.1.3 59,152 3,000 3,000 3,000 Debt Securities 21.1.4 235,670 235,670 220,670 220,670
17,340,724 15,452,954 2,561,053 6,349,757 Current investmentsGovernment securities 21.1.5 177,517 - - -
177,517 - - -

Dist i l ler ies Company of Sr i Lanka PLC126
Notes to the Financial Statements
21.1
.1 Q
uote
d Eq
uity
Sec
uriti
es -
Non
Cur
rent
Inve
stm
ents
- AF
S Grou
pCo
mpan
yAs
at 31
Marc
h,20
1520
1420
1520
14No
. of S
hares
/ W
arran
tsCo
stRs
.000
Fair V
alue
Rs.00
0No
. of S
hares
Cost
Rs.00
0Fa
ir Valu
eRs
.000
No. o
f Sha
resCo
stRs
.000
Fair V
alue
Rs.00
0No
. of S
hares
Cost
Rs.00
0Fa
ir Valu
eRs
.000
Dive
rsifie
d Inv
estm
ents
John
Kee
lls Ho
lding
s PLC
36,49
8,341
7,
193,1
81
7,27
7,769
36
,538,9
387,2
02,02
68,2
94,34
0 -
- -
40,59
78,8
459,2
16 7,
193,1
81
7,27
7,769
7,2
02,02
68,2
94,34
0 -
- 8,8
459,2
16Ba
nk fin
ance
& In
suran
ceCo
mmerc
ial Ba
nk of
Cey
lon PL
C 18
,989,2
72
2,92
1,577
3,
140,8
26
18,84
5,020
567,9
582,3
17,93
8 -
- -
17,49
8,457
432,3
322,1
52,31
1Co
mmerc
ial Ba
nk of
Cey
lon P
LC-N
V -
- -
50,98
03,6
394,9
45 -
- -
50,98
03,6
394,9
45DF
CC B
ank P
LC 17
,042,8
56
3,56
6,627
3,
456,2
91
17,04
2,856
599,9
512,4
52,46
7 -
- -
17,04
2,856
599,9
512,4
52,46
7Ha
tton N
ation
al Ba
nk P
LC 10
,016,2
72
494,9
46
2,22
3,612
10
,016,2
7249
4,946
1,502
,441
10,01
6,272
49
4,946
2,
223,6
12
10,01
6,272
494,9
461,5
02,44
1Ha
tton N
ation
al Ba
nk P
LC -
NV -
- -
39,16
94,5
934,7
00 -
- -
39,16
94,5
934,7
00Na
tiona
l Dev
elopm
ent B
ank P
LC 3,
252
- 81
3 1,6
2615
026
1 -
- -
--
- 6,
983,1
50
8,82
1,542
1,6
71,23
76,2
82,75
2 49
4,946
2,
223,6
12
1,535
,461
6,116
,864
Beve
rage,
Food
& To
bacc
oLa
nka M
ilk Fo
ods (
CWE)
PLC
5,94
6,351
60
6,109
83
2,489
5,9
46,35
160
6,108
636,8
54 -
- -
--
- 60
6,109
83
2,489
60
6,108
636,8
54 -
- -
-M
anuf
actu
ring
Pelw
atte S
ugar
Indus
tries P
LC 33
,140,5
01
926,4
73
- 33
,140,5
0192
6,473
- -
- -
--
926,4
73
- 92
6,473
- -
- -
--
Total
Quo
ted Eq
uity S
ecuri
ties -
AFS
14,78
2,440
16
,931,8
00
10,40
5,845
15,21
3,946
494,9
46
2,22
3,612
1,5
44,30
66,1
26,08
021
.1.2
Unq
uote
d Eq
uity
Sec
uriti
es -
AFS
Intern
ation
al Dis
tillerie
s Lan
ka Lt
d 10
0 3
3 10
03
3 10
0 3
3 10
03
3No
rthern
Gree
n Agro
(Pvt)
Ltd
- -
- -
--
--
South
ern G
reen A
gro (P
vt) Lt
d -
- -
--
--
-Am
ethys
t Leis
ure Lt
d 43
,266,1
67
113,7
64
113,7
64
- -
- 43
,266,1
67
113,7
64
113,7
64
- -
- Cr
edit I
nves
tmen
t Bure
au of
Sri
Lank
a -
- 33
1 3,3
1033
133
1-
-
W.M.
Mend
is & C
o., Lt
d 20
0 4
4 20
04
420
04
420
04
4To
tal U
nquo
ted Eq
uity S
ecuri
ties -
AFS
113,7
71
114,1
02
338
338
113,7
71
113,7
71
7
7 21
.1.3
Inve
stm
ents
in U
nit T
rust
s
Unit T
rust M
gt Co
., Ltd
300,0
00 3,
000
3,00
0 30
0,000
3,000
3,000
300,0
00 3,
000
3,00
0 30
0,000
3,000
3,000
Gu
ardian
Acuit
y Ass
et Mg
t. Lim
ited
301,6
1454
,000
56,15
2-
--
--
--
--
Total
Inve
stmen
ts in
Unit T
rusts
- AFS
57,00
0 59
,152
3,000
3,000
3,
000
3,00
0 3,0
003,0
00

Annual Report 2014/15 127
21.1.4 Debt Securities - AFS
Group CompanyAs at 31 March, Fair Value Fair Value
2015 2014 2015 2014Rs.000 Rs.000 Rs.000 Rs.000
Corporate Debentures 235,670 235,670 220,670 220,670 235,670 235,670 220,670 220,670
21.1.5 Government Securities - AFS
Group CompanyAs at 31 March, Fair Value Fair Value
2015 2014 2015 2014Note Rs.000 Rs.000 Rs.000 Rs.000
Treasury Bills matures after 3 Months 177,517 - - -177,517 - - -
21.2 Fair Value through Profit or Loss (FVTPL) Financial Investments
Group CompanyAs at 31 March, Fair Value Fair Value
2015 2014 2015 2014Note Rs.000 Rs.000 Rs.000 Rs.000
Quoted Equity Securities 21.2.1 1,111,052 1,801,780 177,863 784,540 Investments in Unit Trusts 21.2.2 765,487 258,772 - - Quoted Debentures 21.2.3 134,877 124,307 - -
2,011,416 2,184,859 177,863 784,540
21.2.1 Quoted Equity Securities - FVTPL
Group CompanyAs at 31 March, 2015 2014 2015 2014
No. of Shares Fair Value No. of Shares Fair Value No. of Shares Fair Value No. of Shares Fair ValueRs.000 Rs.000 Rs.000 Rs.000
Bank Finance & InsuranceUnion Bank PLC - - 6,000 112 - - 6,000 112 Central Finance PLC - - 131,750 23,723 - - 106,950 19,358 Peoples Leasing Company PLC - - 26,478,500 378,367 - - 24,517,300 350,597 National Development Bank PLC - - 68,500 12,053 - - 58,500 10,448 Nation Trust Bank PLC - - 258,000 16,603 - - 206,000 13,369 Ceylinco Insurance PLC - NV - - 14,861 6,193 - - 10,990 4,649 Sampath Bank PLC - - 201,413 36,182 - - 152,794 27,824 Seylan Bank PLC 16,203 932 - - - - - - Commercial Bank of Ceylon PLC - - 75,000 9,030 - - - - Commercial Bank of Ceylon PLC - NV - - 42,027 4,641 - - - - Hatton National Bank PLC - NV - - 9,463 1,126 - - - -
932 488,030 - 426,357

Dist i l ler ies Company of Sr i Lanka PLC128
Notes to the Financial Statements
Group CompanyAs at 31 March, 2015 2014 2015 2014
No. of Shares Fair Value No. of Shares Fair Value No. of Shares Fair Value No. of Shares Fair ValueRs.000 Rs.000 Rs.000 Rs.000
Beverage, Food & TobaccoCeylon Tobacco PLC - - 11,600 12,635 - - 8,600 9,082 Cargills (Ceylon) PLC - - 49,900 6,950 - - 36,700 5,010 Bairaha Farms PLC - - 49,574 7,108 - - 39,274 5,781 Keells Foods Product PLC - - 110,669 6,272 - - 84,221 4,632 Ceylon Cold Stores PLC - - 68,970 9,799 - - 49,583 6,976 Renuka Agri Foods PLC 6,118,560 28,877 6,768,560 22,243 4,918,560 23,117 4,668,560 14,473 Nestle Lanka PLC 3,997 8,912 - - 2,625 6,024 - - Lanka Milk Foods (CWE) PLC 763,733 106,923 763,700 81,796 763,733 106,923 763,733 81,796
144,712 146,803 136,064 127,750
Hotel and TravelsThe Kingsbury Hotel PLC 823,600 13,588 1,323,600 17,224 618,600 9,898 618,600 7,918 Aitken Spence Hotel Holdings PLC 23,100 1,813 84,400 5,906 - - 61,300 4,291 Asian Hotels & Properties PLC - - - - - - - - Serandib Hotels PLC - - 220,000 6,244 - - 160,000 4,480 John Keells Hotels PLC 528,850 7,941 528,850 6,611 388,850 5,561 388,850 4,861
23,342 35,985 15,459 21,550
Construction & EngineeringAccess Engineering PLC - - 418,497 9,367 - - 295,797 6,655 Colombo Dockyard PLC - - 21,083 3,818 - - 12,053 2,106
- - 439,580 13,185 - - 307,850 8,761 ManufacturingACL Cables PLC 63,000 4,813 249,000 15,630 - - 136,000 8,296 Royal Ceramics Lanka PLC - - 85,200 6,852 - - 67,100 5,321 Tokyo Cement PLC - - 858,800 24,359 - - 568,400 17,564 Chevron Lubricants Lanka PLC - - 37,500 9,944 - - 28,000 7,400 Lanka Tiles PLC - - 123,208 9,434 - - 89,815 6,799 Lanka IOC - - 100,000 3,850 - - 100,000 3,850 Bukit Darah PLC 72,200 48,952 72,200 42,663 - - - - Textured Jersey Lanka PLC 13,511,928 324,569 13,511,928 212,954 - - - -
378,334 325,686 - 49,230
TelecommunicationDialog Axiata PLC - - 2,280,893 20,528 - - 861,951 7,758
- 20,528 - 7,758
Power & EnergyVallibel Power Erathna PLC - - 1,605,425 9,080 - - 1,155,024 6,468
- 9,080 - 6,468

Annual Report 2014/15 129
Group CompanyAs at 31 March, 2015 2014 2015 2014
No. of Shares Fair Value No. of Shares Fair Value No. of Shares Fair Value No. of Shares Fair ValueRs.000 Rs.000 Rs.000 Rs.000
Diversified InvestmentsJohn Keells Holdings PLC - - 19,190 4,362 - - - - John Keells Holdings PLC - Warrant 2015 1,666,208 34,657 1,676,292 115,030 - - 6,921 475 John Keells Holdings PLC - Warrant 2016 1,666,208 53,485 1,669,292 120,048 - - - - CT Holding PLC 1,475,500 188,864 1,475,500 199,193 - - - - Softlogic Holdings PLC 380,000 5,016 380,000 4,028 380,000 5,016 380,000 4,028 Softlogic Capital PLC 40,000,000 240,000 40,000,000 156,000 - - - - Free Lanka Capital Holdings PLC 2,850,850 4,561 2,850,850 5,987 2,850,850 4,561 2,850,850 5,987 Expo Lanka Holdings PLC - - 872,000 7,298 - - - - Carson Cumberbatch PLC 29,400 10,772 29,400 10,731 - - 632,000 5,498 Vallibel One PLC 121,084 2,671 124,200 2,080 - - - - Renuka Holdings PLC - - 67,358 2,061 - - - -
540,026 626,818 9,577 15,988
HospitalsAsiri Hospitals Holdings PLC - - 5,222,890 112,538 - - 4,672,890 103,738 Ceylon Hospitals PLC - Non Voting 135,909 10,403 140,120 10,709 95,869 7,200 100,080 7,706
10,403 123,247 7,200 111,444
Chemicals and PharmaceuticalsHaycarb PLC 73,876 13,303 67,755 12,418 52,255 9,563 50,255 9,096
73,876 13,303 67,755 12,418 52,255 9,563 50,255 9,096 Total Quoted Equity Securities -FVTPL 1,111,052 1,801,780 177,863 784,540
21.2.2 Investments in Unit trusts - FVTPLGroup
As at 31 March, 2015 2014 No. of Units Fair Value No. of Units Fair Value
Rs.000 Rs.000
Namal High Yield Fund 5,186,213 71,309 5,186,213 66,416 JB Vantage Money Market Fund 14,617,175 215,543 4,964,585 66,312 Eagle Income Fund 5,639,583 58,894 3,741,112 40,254 Eagle Money Fund 4,236,359 44,581 2,107,020 25,745 Ceybank Savings Plus Money Market Fund 5,200,912 69,037 5,639,583 60,045 NDB GILT EDGED 2,509,294 25,573 - - Guardian Acuity Fixed Income Fund 1,689,189 20,557 - -Comtrust Money Market Fund 12,408,657 143,215 - - Investust Money Fund 10,919,517 116,778 - - Total Unit Trust Investment -FVTPL 765,487 258,772

Dist i l ler ies Company of Sr i Lanka PLC130
Notes to the Financial Statements
21.2.3 Quoted Debentures - FVTPL
GroupAs at 31 March, 2015 2014
Carrying Value Fair Value Carrying Value Fair Value Rs.000 Rs.000 Rs.000 Rs.000
People's Leasing Company PLC 50,000 59,625 50,000 52,427 Hatton National Bank PLC 19,003 19,003 19,003 19,844 Senkadagala Finance PLC 20,000 23,718 20,000 20,618 Lion Brewery (Ceylon ) PLC 15,000 16,082 15,000 15,736 Hayleys PLC 15,000 16,449 15,000 15,682 Total Investments in Quoted Debentures 119,003 134,877 119,003 124,307
21.3 Held to Maturity (HTM) Financial Investments
GroupAs at 31 March, 2015 2014
Rs.000 Rs.000
Commercial Papers 40,911 - 40,911 -
21.4 Loans and Receivables (L&R) Financial Investments
Non Current InvestmentsCorporate Debentures 182,538 181,765
182,538 181,765 Current InvestmentsTreasury Bills Matures After 3 Months - 42,516 Commercial Papers 83,341 - Term Deposits Matures After 3 Months 118,630 212,377
201,971 254,893
21.5 Investments that have been Pledged The investments that are pledged for liabilities are disclosed in Note 41 to these financial statements if any.

Annual Report 2014/15 131
22 Deferred Tax Asset and Liabilities22.1 Recognised Deferred Tax Assets and Liabilities Deferred tax assets and liabilities are attributable to the following:
GroupAs at 31 March, 2015 2014
Assets Liabilities Net Assets Liabilities NetRs.000 Rs.000 Rs.000 Rs.000 Rs.000 Rs.000
Property, Plant and Equipment (15,419) 923,078 907,659 (11,382) 416,080 404,698Biological Assets - 347,301 347,301 - 308,814 308,814Employee Benefits (178,715) - (178,715) (154,545) - (154,545)Accelerated Tax Depreciation on Leasing Assets
- 31,513 31,513 - 8,456 8,456
Unutilised Tax Loss Carry-Forwards (308,580) - (308,580) (230,889) - (230,889) (502,714) 1,301,892 799,178 (396,816) 733,350 336,534
CompanyAs at 31 March, 2015 2014
Assets Liabilities Net Assets Liabilities NetRs.000 Rs.000 Rs.000 Rs.000 Rs.000 Rs.000
Property, Plant and Equipment - 532,164 532,164 - 60,958 60,958Employee Benefits (54,845) - (54,845) (44,068) - (44,068)
(54,845) 532,164 477,319 (44,068) 60,958 16,890
22.1.1 Movement in Recognised Deferred Tax Assets and Liabilities
Group 2015Charged/(Credited)
Balance as at 1 April 2014
inProfit or
Loss
in Other Comprehensive
Income
Directly in Equity
Balance as at 31 March 2015
Rs.000 Rs.000 Rs.000 Rs.000 Rs.000
Property, Plant and Equipment 404,698 502,961 - - 907,659 Biological Assets 308,814 38,487 - - 347,301 Employee Benefits (154,542) (12,791) (11,382) - (178,715)Accelerated Tax Depreciation on Leasing Assets 8,456 23,056 - - 31,512 Unutilised Tax Loss Carry-Forwards (230,889) (77,690) - - (308,579)
336,537 474,023 (11,382) - 799,178
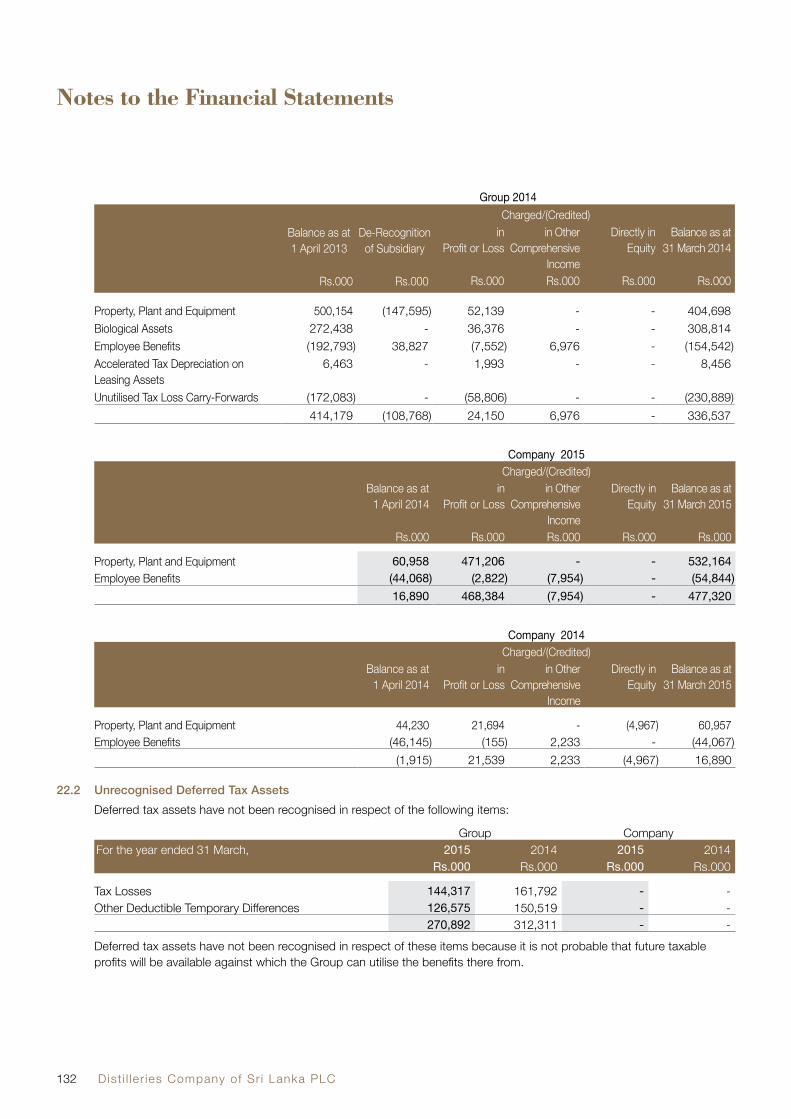
Dist i l ler ies Company of Sr i Lanka PLC132
Notes to the Financial Statements
Group 2014Charged/(Credited)
Balance as at 1 April 2013
De-Recognition of Subsidiary
inProfit or Loss
in Other Comprehensive
Income
Directly in Equity
Balance as at 31 March 2014
Rs.000 Rs.000 Rs.000 Rs.000 Rs.000 Rs.000
Property, Plant and Equipment 500,154 (147,595) 52,139 - - 404,698 Biological Assets 272,438 - 36,376 - - 308,814 Employee Benefits (192,793) 38,827 (7,552) 6,976 - (154,542)Accelerated Tax Depreciation on Leasing Assets
6,463 - 1,993 - - 8,456
Unutilised Tax Loss Carry-Forwards (172,083) - (58,806) - - (230,889) 414,179 (108,768) 24,150 6,976 - 336,537
Company 2015Charged/(Credited)
Balance as at 1 April 2014
inProfit or Loss
in Other Comprehensive
Income
Directly in Equity
Balance as at 31 March 2015
Rs.000 Rs.000 Rs.000 Rs.000 Rs.000
Property, Plant and Equipment 60,958 471,206 - - 532,164 Employee Benefits (44,068) (2,822) (7,954) - (54,844)
16,890 468,384 (7,954) - 477,320
Company 2014Charged/(Credited)
Balance as at 1 April 2014
inProfit or Loss
in Other Comprehensive
Income
Directly in Equity
Balance as at 31 March 2015
Property, Plant and Equipment 44,230 21,694 - (4,967) 60,957 Employee Benefits (46,145) (155) 2,233 - (44,067)
(1,915) 21,539 2,233 (4,967) 16,890
22.2 Unrecognised Deferred Tax Assets Deferred tax assets have not been recognised in respect of the following items:
Group CompanyFor the year ended 31 March, 2015 2014 2015 2014
Rs.000 Rs.000 Rs.000 Rs.000
Tax Losses 144,317 161,792 - - Other Deductible Temporary Differences 126,575 150,519 - -
270,892 312,311 - - Deferred tax assets have not been recognised in respect of these items because it is not probable that future taxable
profits will be available against which the Group can utilise the benefits there from.

Annual Report 2014/15 133
23 Finance Lease and Hire Purchases Receivables Group
2015 2014As at 31 March, Finance Lease
ReceivablesHire Purchase
ReceivablesTotal Finance Lease
ReceivablesHire Purchase
ReceivablesTotal
Note Rs.000 Rs.000 Rs.000 Rs.000 Rs.000 Rs.000
Non Current AssetsReceivable from One to Five Years 23.1 704,659 163,566 868,225 199,562 101,802 301,364 Receivable from more than Five Years - - - - - -
704,659 163,566 868,225 199,562 101,802 301,364 Current AssetsReceivable within One Year 23.2 235,719 76,280 311,999 77,633 36,566 114,199
235,719 76,280 311,999 77,633 36,566 114,199
23.1 Receivable from One to Five Years
Gross Rental Receivable 881,254 204,215 1,085,469 258,125 133,997 392,122 Unearned Interest Income (172,668) (39,814) (212,482) (58,563) (32,195) (90,758)Allowance for Impairment 23.3 (3,927) (835) (4,762) - - -
704,659 163,566 868,225 199,562 101,802 301,364
23.2 Receivable within One Year
Gross Rental Receivable 365,945 111,979 477,924 127759 61441 189,200 Unearned Interest Income (128,917) (35,306) (164,223) (50,126) (24,875) (75,001)Allowance for Impairment 23.3 (1,309) (393) (1,702) - - -
235,719 76,280 311,999 77,633 36,566 114,199
23.3 Allowance for Impairment
Allowance for Individual ImpairmentBalance as at 1 April - - - - - - Charge/(Reversal) for the Year 2,845 - 2,845 - - - Balance as at 31 March 2,845 - 2,845 - - -
Allowance for Collective ImpairmentBalance as at 1 April - - - - Charge/(Reversal) for the Year 2,391 1,228 3,619 - - - Balance as at 31 March 2,391 1,228 3,619 - - - Total Allowance for Impairment 5,236 1,228 6,464 - - -

Dist i l ler ies Company of Sr i Lanka PLC134
Notes to the Financial Statements
24 Advances and Other Loans
GroupAs at 31 March, 2015 2014
Loans and advances
Factoring receivables
Total Loans and advances
Factoring receivables
Total
Notes Rs.000 Rs.000 Rs.000 Rs.000 Rs.000 Rs.000
Note 24.1 Note 24.1Non Current AssetsReceivable from One to Five Years 459,705 - 459,705 151,984 - 151,984
459,705 - 459,705 151,984 - 151,984 Current AssetsReceivable within One Year 958,980 265,571 1,224,551 433,622 239,393 673,015
958,980 265,571 1,224,551 433,622 239,393 673,015 Total 1,418,685 265,571 1,684,256 585,606 239,393 824,999
24.1 Loans and Advances
GroupAs at 31 March, 2015 2014
Loans and advances
Total Loans and advances
Total
Notes Rs.000 Rs.000 Rs.000 Rs.000
Loans Secured by Fixed Deposits - - 687 687 Loans Secured by Other Assets 640,873 640,873 259,363 259,363 Trade Finance Receivables 786,160 786,160 328,259 328,259Allowance for Impairment 24.2 (8,348) (8,348) (2,703) (2,703)
1,418,685 1,418,685 585,606 585,606
24.2 Allowance for Impairment
Allowance for Individual ImpairmentBalance as at 1 April 2,703 2,703 - - Charge for the Year (671) (671) 2,703 2,703 Balance as at 31 March 2,033 2,033 2,703 2,703
Allowance for Collective ImpairmentBalance as at 1 April - - - - Charge/(Reversal) for the Year 6315 6,315 - - Balance as at 31 March 6,315 6,315 - -
Total Allowance for Impairment 8,348 8,348 2,703 2,703

Annual Report 2014/15 135
25 Inventories
Group CompanyAs at 31 March, 2015 2014 2015 2014
Rs.000 Rs.000 Rs.000 Rs.000
Raw Materials 1,779,695 1,361,500 1,459,991 1,107,897Packing Materials 637,827 518,818 556,689 453,429Work in Progress 322,799 269,330 222,679 136,877Finished Goods 722,604 650,638 250,360 283,012Harvested Crop 273,323 376,037 - -Nurseries 18,163 21,519 - -Input Materials, Consumables and Spares 2,129,459 2,124,555 312,213 270,384Goods in Transit 4,988 25,035 - -
5,888,858 5,347,432 2,801,932 2,251,599Provision for Slow Moving and Obsolete Inventories (904,808) (911,636) (5,443) (5,443)
4,984,050 4,435,796 2,796,489 2,246,156
25.1 Inventories that have been Pledged The inventories that are pledged for liabilities are disclosed in Note 41 to these financial statements if any.
26 Trade and Other Receivables
Group CompanyAs at 31 March, 2015 2014 2015 2014
Note Rs.000 Rs.000 Rs.000 Rs.000
Financial AssetsTrade Receivables 4,414,892 4,975,673 2,167,795 2,534,074 Other Financial Receivables 2,128,136 1,213,119 390,674 452,161 Receivable from Share Trust 26.1 1,418,716 1,446,830 - - Insurance Contract Receivables 554,077 371,872 - - Loans given to Employees 5,379 4,123 - - Refundable Deposits 236,026 24,012 - 3,421
8,757,226 8,035,629 2,558,469 2,989,656 Provision for Impairment Loss on Financial Assets (1,114,985) (958,913) (161,625) (154,766)
7,642,241 7,076,716 2,396,844 2,834,890 Non Financial AssetsPrepayments and Advances 1,933,284 1,440,808 1,772,319 1,054,318 Accrued Income 64,952 66,394 64,952 66,394 Prepaid Staff Costs 35,884 31,829 - - Other Non Financial Receivables 112,975 884,501 - - Tax Receivables 303,373 220,355 - -
2,450,468 2,643,888 1,837,271 1,120,712 Provision for bad and doubtful debts - - - -
2,450,468 2,643,888 1,837,271 1,120,712 10,092,709 9,720,603 4,234,115 3,955,602
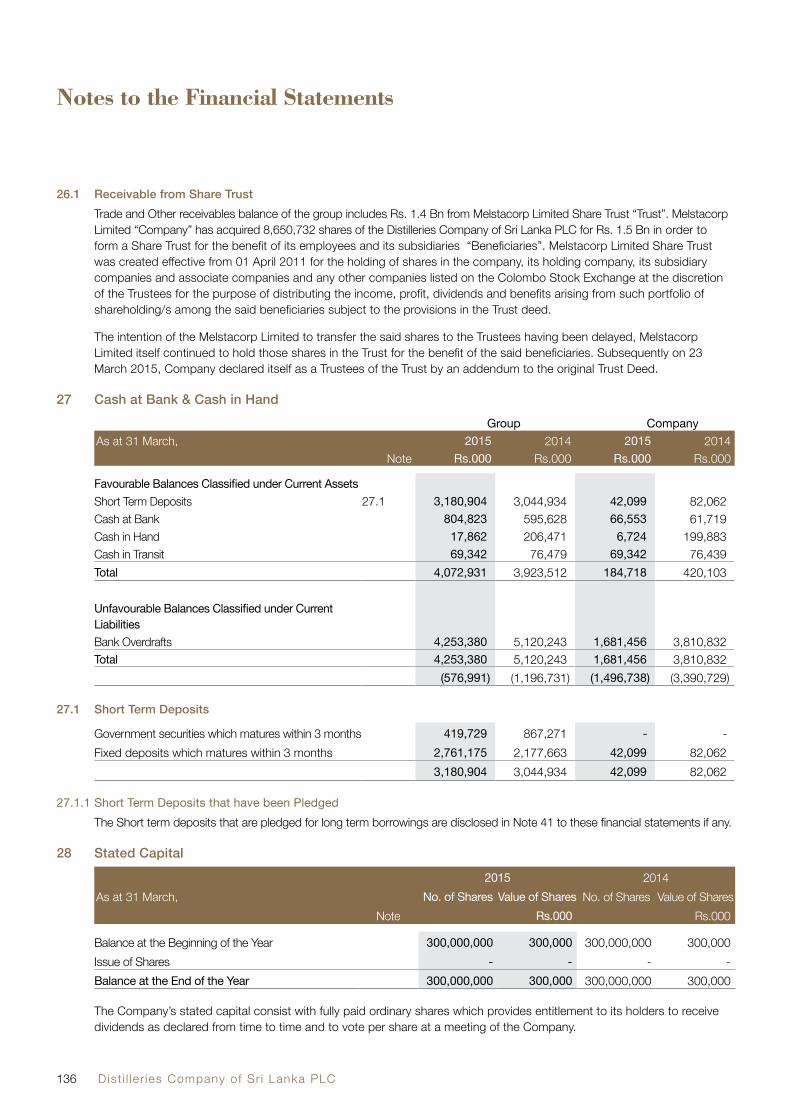
Dist i l ler ies Company of Sr i Lanka PLC136
Notes to the Financial Statements
26.1 Receivable from Share Trust Trade and Other receivables balance of the group includes Rs. 1.4 Bn from Melstacorp Limited Share Trust “Trust”. Melstacorp
Limited “Company” has acquired 8,650,732 shares of the Distilleries Company of Sri Lanka PLC for Rs. 1.5 Bn in order to form a Share Trust for the benefit of its employees and its subsidiaries “Beneficiaries”. Melstacorp Limited Share Trust was created effective from 01 April 2011 for the holding of shares in the company, its holding company, its subsidiary companies and associate companies and any other companies listed on the Colombo Stock Exchange at the discretion of the Trustees for the purpose of distributing the income, profit, dividends and benefits arising from such portfolio of shareholding/s among the said beneficiaries subject to the provisions in the Trust deed.
The intention of the Melstacorp Limited to transfer the said shares to the Trustees having been delayed, Melstacorp Limited itself continued to hold those shares in the Trust for the benefit of the said beneficiaries. Subsequently on 23 March 2015, Company declared itself as a Trustees of the Trust by an addendum to the original Trust Deed.
27 Cash at Bank & Cash in HandGroup Company
As at 31 March, 2015 2014 2015 2014Note Rs.000 Rs.000 Rs.000 Rs.000
Favourable Balances Classified under Current AssetsShort Term Deposits 27.1 3,180,904 3,044,934 42,099 82,062 Cash at Bank 804,823 595,628 66,553 61,719 Cash in Hand 17,862 206,471 6,724 199,883 Cash in Transit 69,342 76,479 69,342 76,439 Total 4,072,931 3,923,512 184,718 420,103
Unfavourable Balances Classified under Current LiabilitiesBank Overdrafts 4,253,380 5,120,243 1,681,456 3,810,832 Total 4,253,380 5,120,243 1,681,456 3,810,832
(576,991) (1,196,731) (1,496,738) (3,390,729)
27.1 Short Term Deposits
Government securities which matures within 3 months 419,729 867,271 - - Fixed deposits which matures within 3 months 2,761,175 2,177,663 42,099 82,062
3,180,904 3,044,934 42,099 82,062
27.1.1 Short Term Deposits that have been Pledged The Short term deposits that are pledged for long term borrowings are disclosed in Note 41 to these financial statements if any.
28 Stated Capital
2015 2014As at 31 March, No. of Shares Value of Shares No. of Shares Value of Shares
Note Rs.000 Rs.000
Balance at the Beginning of the Year 300,000,000 300,000 300,000,000 300,000 Issue of Shares - - - - Balance at the End of the Year 300,000,000 300,000 300,000,000 300,000
The Company’s stated capital consist with fully paid ordinary shares which provides entitlement to its holders to receive dividends as declared from time to time and to vote per share at a meeting of the Company.

Annual Report 2014/15 137
29 ReservesGroup Company
As at 31 March, 2015 2014 2015 2014Note Rs.000 Rs.000 Rs.000 Rs.000
Capital ReservesRevaluation Reserve 29.1 5,846,432 5,793,558 1,295,154 1,971,799 Capital Reserve 29.2 110,930 110,930 107,882 107,882 Reserve Fund 29.3 5,992 1,798 - - Total Capital Reserves 5,963,354 5,906,286 1,403,036 2,079,681 Revenue ReservesGeneral Reserve 29.4 8,286,434 8,222,578 8,210,000 8,210,000 Exchange Fluctuation Reserve 29.5 337,838 374,881 - - Timber Reserve 29.6 700,076 597,921 - - Afs Reserve 29.7 7,463,746 5,727,503 1,728,667 4,581,774 Investment Fund 29.8 - 2,844 - - Total Revenue Reserves 16,788,094 14,925,727 9,938,667 12,791,774 Total Reserves 22,751,448 20,832,013 11,341,703 14,871,455
29.1 Revaluation Reserve The revaluation reserve comprises of the gain arisen from the revaluation of Property, Plant and Equipment. This reserve is
realised upon the de-recognition of the revalued Property, Plant and Equipment.
29.2 Capital Reserve Capital reserve comprises profits retained in order to utilise for the capital commitments.
29.3 Reserve Fund Reserve fund was created to comply with the Direction No.1 of 2003 (Capital funds) issued by the Central Bank. Melsta
Regal Finance Limited is required to transfer 5% of annual profits to this reserve fund as long as the capital funds are not less 25% of total deposit liabilities.
29.4 General Reserve General reserve reflects the amount the Group has reserved over the years from its earnings.
29.5 Exchange Fluctuation Reserve Exchange fluctuation reserve comprises of all foreign exchange differences arising from the translation of foreign
subsidiaries and the portion of exchange gain or loss arising from the translation of the hedge instrument in relation to cash flow hedges of Aitken Spence PLC Group.
29.6 Timber Reserve This represents the unrealised gains arising from the fair value of consumable biological assets ( Timber plantations) until
the assets are derecognised or impaired.
29.7 AFS Reserve This represents the cumulative net change in the fair value of available-for-sale financial assets until the investments are
derecognised or impaired.
29.8 Investment Fund During the year, the balance available in Investment Fund Reserve as at 31 March 2015 was transferred to retained
earnings as per the instructions given by the Central Bank of Sri Lanka.

Dist i l ler ies Company of Sr i Lanka PLC138
Notes to the Financial Statements
30 Interest Bearing Loans and BorrowingsGroup Company
As at 31 March, 2015 2014 2015 2014Note Rs.000 Rs.000 Rs.000 Rs.000
Non Current LiabilitiesTerm Loans Payable after One Year 30.1 1,661,933 549,408 - - Liability to Make Lease Payments Payable after One Year 30.2 97,133 98,852 - - Finance Lease Liabilities Payable after One Year 30.3 17,290 22,715 - -
1,776,356 670,975 - -
Current LiabilitiesTerm Loans Payable within One Year 30.1 757,016 625,856 - - Liability to Make Lease Payments Payable within One Year 30.2 1,719 1,653 - - Finance Lease Liabilities Payable within One Year 30.3 6,000 5,062 - - Other Short Term Borrowings 6,978,692 6,958,577 4,795,000 6,215,006 Debt Instruments-Commercial Papers 53,003 - - - Redeemable Preference Shares 30.4 12,646 12,646 - -
7,809,076 7,603,794 4,795,000 6,215,006
30.1 Term loansGroup Company
As at 31 March, 2015 2014 2015 2014Note Rs.000 Rs.000 Rs.000 Rs.000
Balance as at Beginning of the Year 1,175,264 2,284,095 - 1,270,002 Received During the Year 1,259,136 1,477,684 - - Acquisition / (De-recognition) of Subsidiaries - (152,089) - - Repaid During the Year (15,451) (2,434,426) - (1,270,002)Amortised Finance Cost - - - -
2,418,949 1,175,264 - -
Repayable within One Year 757,016 625,856 - - Repayable after One Year 1,661,933 549,408 - -
2,418,949 1,175,264 - -
30.2 Liability to make Lease Payments Group Company
As at 31 March, 2015 2014 2015 2014Note Rs.000 Rs.000 Rs.000 Rs.000
Gross Liability as at the Beginning of the Year 178,385 184,058 - - Acquisition of Subsidiaries (Gross Liability) - - - - Repayments During the Year (5,673) (5,673) - -
172,712 178,385 - - Finance Costs Allocated to Future Years (73,860) (77,880) - - Net Liability as at the End of the Year 98,852 100,505 - -

Annual Report 2014/15 139
Group CompanyAs at 31 March, 2015 2014 2015 2014
Note Rs.000 Rs.000 Rs.000 Rs.000
Repayable within One YearGross Liability 5,673 5,673 - - Finance Costs allocated to Future Years (3,954) (4,020) - - Net Liability 1,719 1,653 - -
Repayable within Two to Five YearsGross Liability 22,692 22,692 - - Finance Costs allocated to Future Years (15,098) (15,385) - - Net Liability 7,594 7,307 - -
Repayable after Five YearsGross Liability 144,347 155,693 - - Finance Costs allocated to Future Years (54,808) (64,148) - - Net Liability 89,539 91,545 - - Finance Lease Liabilities Payable after One Year 97,133 98,852 - -
The lease of the estates have been amended, with effect from 11th June 1996 to an amount substantially higher than the previous lease rental of Rs. 500/= per estate per annum. The first rental payable under the revised basis is Rs.5,673 million from 11th June 1997.This amount is to be inflated annually by the Gross Domestic Product (GDP) deflator, and is in the from of Contingent rental. The contingent rental charged to the Income statement amounted to Rs.22,276,019/= Which is based on GDP deflator of 6.7% (2013).
The Statement of Recommended Practice (SoRP) for Right-to-use of Land on Lease was approved by the Council of the Institute of Chartered Accountants of Sri Lanka on 19th December 2012. Subsequently, the amendments to the SoRP along with the modification to the title as Statement of Alternative Treatment (SoAT) were approved by the Council on 21st August 2013. The Company has not reassessed the Right-to-use of Land because this is not mandatory requirement. However, if the liability is reassessed according to the alternative treatment (SoAT) on the assumption that the lease rent is increased constantly by GDP deflator of 4% and discounted at a rate of 7.3%, liability would be as follows.
As at 31 March, AmountRs.000
Gross Liability 1,774,455Finance Charges (830,826)Net Liability 943,629
The above reassessed liability is not reflected in theses financial statements.
30.3 Finance Lease
Financial Institution Terms of repayment Repayablewithin one year
Repayablewithin 2-5 year
Repayableafter 5 year
Total as at 31/03/2015
Central Finance Company PLC
60 equal monthly instalments @ Rs. 707,793/- commencing from 23.05.2013
5,786 16,929 - 22,715
Hatton National Bank
36 equal monthly instalments @ Rs.11,063/- commencing from 11/07/2014
214 361 - 575
6,000 17,290 - 23,290

Dist i l ler ies Company of Sr i Lanka PLC140
Notes to the Financial Statements
30.4 Redeemable Preference Shares As per LKAS/ SLFRS requirements, preference shares of 1,264,616 amounting to Rs. 12.646 Mn which is redeemable as
per the terms of an agreement has been classified as borrowings based on the features of the said shares. Therefore the purpose of the financial reporting, the Company has classified the redeemable preference shares under borrowings.
31 Employee BenefitsGroup Company
As at 31 March, 2015 2014 2015 2014Note Rs.000 Rs.000 Rs.000 Rs.000
Present Value of Unfunded Obligations 31.1 949,961 831,769 137,110 110,170 Present Value of Funded Obligations - - - - Total Present Value of Obligations 949,961 831,769 137,110 110,170 Fair Value of Planed Assets - - - - Provision for Retirement Benefit Obligations 949,961 831,769 137,110 110,170
31.1 Movement in Present Value of Defined Benefit ObligationsGroup Company
As at 31 March, 2015 2014 2015 2014Note Rs.000 Rs.000 Rs.000 Rs.000
Balance as at Beginning of the Year 831,769 1,147,985 110,170 115,365 Acquisition/ (De-recognition) of Subsidiaries - (330,811) - - Benefits Paid by the Plan (96,894) (106,983) (13,585) (21,056)Expense Recognised in the in the Income Statement
31.1.1 161,227 151,125 20,640 21,445
Actuarial (Gain) / Loss Recognised in Other Comprehensive Income
53,859 (29,547) 19,885 (5,584)
Balance as at the End of the Year 949,961 831,769 137,110 110,170
31.1.1 Expense Recognised in the Profit or LossGroup Company
As at 31 March, 2015 2014 2015 2014Rs.000 Rs.000 Rs.000 Rs.000
Current Service Costs 74,266 67,034 9,623 8,755 Interest Costs 86,961 84,091 11,017 12,690
161,227 151,125 20,640 21,445
31.1.2 Actuarial Assumptions Principal actuarial assumptions at the reporting date
Group CompanyAs at 31 March, 2015 2014 2015 2014
Rs.000 Rs.000 Rs.000 Rs.000
Discount Rate (%) 9% - 10% 10-11.5% 9% 10%Future Salary Increases (%) 5-15% 5-10% 5% 5%Retirement Age (Years) 55-65 years 55-65 years 55-65 years 55-65 years

Annual Report 2014/15 141
Sensitivity of assumptions used If one percentage increase in the assumptions, would have the following effects,
Group CompanyAs at 31 March, 2015 2015 2015 2015
Note Discount rate
Salary increment rate
Discount rate
Salary increment rate
Effect on Define Benefit Obligation Liability,Increase by 1% (68,178) 52,974 (4,093) 4,790Decrease by 1% 78,912 (48,186) 4,349 (4,577)
Effect on Comprehensive Income,Increase by 1% 68,178 (52,974) 4,093 (4,790)Decrease by 1% (78,912) 48,186 (4,349) 4,577
32 Other Deferred LiabilitiesGroup
As at 31 March, 2015 2014Note Rs.000 Rs.000
Non Current LiabilitiesDeferred Grants and Subsidies 32.1 202,696 214,139 Deferred Revenue 32.2 56,239 38,432
258,935 252,571 Current LiabilitiesDeferred Revenue 32.2 56,112 56,730
56,112 56,730
32.1 Deferred Grants and SubsidiesGroup
2015 2014Rs.000 Rs.000
Balance at the Beginning of the Year 214,139 227,365 Amortisation for the Year (11,443) (13,226)Balance at the End of the Year 202,696 214,139
The Balangoda Plantation PLC has received funding from the Plantation Housing and Social Welfare Trust and Plantation Development Project (PDP) for the development of workers facilities such as re-roofing of line rooms, latrines, water supply, sanitation and roads etc. The amounts spent are included under the relevant classification of property, plant & equipment and the grant component is reflected under Deferred Grants and Subsidies. Grants are amortised over the life of the assets for which they are being deployed.
32.2 Deferred RevenueGroup
2015 2014Rs.000 Rs.000
Balance at the Beginning of the Year 95,162 88,645 Revenue Received During the Year 89,765 78,951 Deferred Revenue Recognised During the Year (72,576) (72,434)Balance at the End of the Year 112,351 95,162
Deferred Revenue to be Recognised within One Year 56,112 56,730 Deferred Revenue to be Recognised after One Year 56,239 38,432
112,351 95,162 The above amount represent funding received by Balangoda Plantations PLC from various governmental and non-
governmental Institutions for social and infrastructure development of estates.

Dist i l ler ies Company of Sr i Lanka PLC142
Notes to the Financial Statements
33 Trade and Other Payables
Group CompanyAs at 31 March, 2015 2014 2015 2014
Note Rs.000 Rs.000 Rs.000 Rs.000
Financial LiabilitiesTrade Payables 1,209,700 941,271 127,411 121,226 Insurance Contract Liabilities 1,087,389 801,254 - - Other Financial Liabilities 3,327,835 3,234,670 2,937,834 2,771,217 Refundable Advances and Deposits 145,480 2,292 - -
5,770,404 4,979,487 3,065,245 2,892,443 Non Financial LiabilitiesAccrued Expenses 1,652,022 1,296,790 425,106 102,466 Direct and Indirect Taxes Payables 33.1 2,630,283 2,257,698 2,400,483 2,015,708 Non Refundable Advances and Deposits 3,047 90,989 - - Unclaimed Dividends 155,485 147,713 141,605 135,944
4,440,837 3,793,190 2,967,194 2,254,118 10,211,241 8,772,678 6,032,439 5,146,561
33.1 Direct and Indirect Taxes Payables
Group CompanyAs at 31 March, 2015 2014 2015 2014
Rs.000 Rs.000 Rs.000 Rs.000
Excise Duty Payable 2,589,439 1,595,715 2,392,276 1,454,449 Value Added Tax (VAT) Payable 17,825 553,519 7,090 469,810 Nation Building Tax (NBT) Payable 23,019 108,464 1,117 91,449
2,630,283 2,257,698 2,400,483 2,015,708
34 Deposit Liabilities
GroupAs at 31 March, 2015 2014
Note Rs.000 Rs.000
Term Deposits 458,609 605,876 Savings Deposits 26,485 5,121 Liabilities to FBIL Customers 34.1 26,695 52,540
511,789 663,537
34.1 Liabilities to FBIL Customers The liability is recognised based on the Scheme of Arrangements approved at the meeting of the creditors of First
Barakah Investments Limited (FBIL), (Subsequently renamed as Group Subsidiary Melsta Regal Finance Limited) held on 12/02/2011 and upheld by the Colombo Commercial High Court (Case No. H.C.(Civil) 01/2011 (CO)).During the period under consideration, the Melsta Regal Finance Limited has repaid sum of Rs.25,845,383 to its creditors according to the repayment scheme.
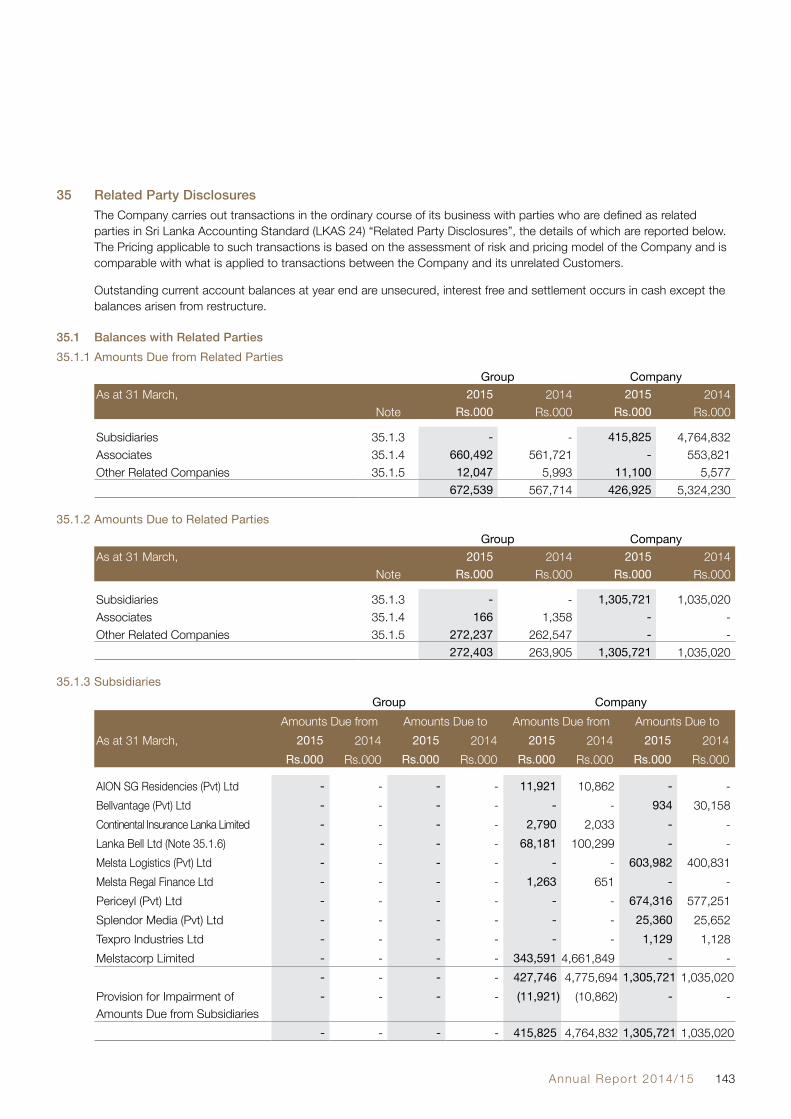
Annual Report 2014/15 143
35 Related Party Disclosures The Company carries out transactions in the ordinary course of its business with parties who are defined as related
parties in Sri Lanka Accounting Standard (LKAS 24) “Related Party Disclosures”, the details of which are reported below. The Pricing applicable to such transactions is based on the assessment of risk and pricing model of the Company and is comparable with what is applied to transactions between the Company and its unrelated Customers.
Outstanding current account balances at year end are unsecured, interest free and settlement occurs in cash except the balances arisen from restructure.
35.1 Balances with Related Parties35.1.1 Amounts Due from Related Parties
Group CompanyAs at 31 March, 2015 2014 2015 2014
Note Rs.000 Rs.000 Rs.000 Rs.000
Subsidiaries 35.1.3 - - 415,825 4,764,832 Associates 35.1.4 660,492 561,721 - 553,821 Other Related Companies 35.1.5 12,047 5,993 11,100 5,577
672,539 567,714 426,925 5,324,230
35.1.2 Amounts Due to Related PartiesGroup Company
As at 31 March, 2015 2014 2015 2014Note Rs.000 Rs.000 Rs.000 Rs.000
Subsidiaries 35.1.3 - - 1,305,721 1,035,020 Associates 35.1.4 166 1,358 - - Other Related Companies 35.1.5 272,237 262,547 - -
272,403 263,905 1,305,721 1,035,020
35.1.3 Subsidiaries Group Company
Amounts Due from Amounts Due to Amounts Due from Amounts Due toAs at 31 March, 2015 2014 2015 2014 2015 2014 2015 2014
Rs.000 Rs.000 Rs.000 Rs.000 Rs.000 Rs.000 Rs.000 Rs.000
AION SG Residencies (Pvt) Ltd - - - - 11,921 10,862 - - Bellvantage (Pvt) Ltd - - - - - - 934 30,158 Continental Insurance Lanka Limited - - - - 2,790 2,033 - - Lanka Bell Ltd (Note 35.1.6) - - - - 68,181 100,299 - - Melsta Logistics (Pvt) Ltd - - - - - - 603,982 400,831 Melsta Regal Finance Ltd - - - - 1,263 651 - -Periceyl (Pvt) Ltd - - - - - - 674,316 577,251 Splendor Media (Pvt) Ltd - - - - - - 25,360 25,652 Texpro Industries Ltd - - - - - - 1,129 1,128 Melstacorp Limited - - - - 343,591 4,661,849 - -
- - - - 427,746 4,775,694 1,305,721 1,035,020 Provision for Impairment of Amounts Due from Subsidiaries
- - - - (11,921) (10,862) - -
- - - - 415,825 4,764,832 1,305,721 1,035,020

Dist i l ler ies Company of Sr i Lanka PLC144
Notes to the Financial Statements
35.1.4 Associates
Group Company Amounts Due from Amounts Due to Amounts Due from Amounts Due to
As at 31 March, 2015 2014 2015 2014 2015 2014 2015 2014Rs.000 Rs.000 Rs.000 Rs.000 Rs.000 Rs.000 Rs.000 Rs.000
Aitken Spence PLC 2,331 2,520 166 1,358 - - - - Madulsima Plantations PLC (Note 35.1.7)
658,161 559,201 - - - 553,821 - -
660,492 561,721 166 1,358 - 553,821 - -
35.1.5 Other Related Companies
Group Company Amounts Due from Amounts Due to Amounts Due from Amounts Due to
As at 31 March, 2015 2014 2015 2014 2015 2014 2015 2014Rs.000 Rs.000 Rs.000 Rs.000 Rs.000 Rs.000 Rs.000 Rs.000
Ace Power Generation Matara (Pvt) Ltd 5 2 - - - - - - Aitken Spence Hotel Holdings PLC 571 87 - - - - - - Aitken Spence Hotel Management (Pvt) Ltd
72 11 1,827 173 - - - -
Ambewela Livestock Co.Ltd - 32 - - - - - - Ambewela Products (Pvt) Ltd 15 - - - - - - - Comark Engineers (Pvt) Ltd - - - 53 - - - - Lanka Aluminium Industries PLC - - 4,355 1,507 - - - - Lanka Milk Foods (CWE) PLC 9,149 4,490 - 20 9,105 4,429 - - Lanka Stassens Distributors (Pvt) Ltd 119 1 - - - - - - Stassen Lanka Private Limited (Note 35.1.8)
- - 161,584 - - - - -
Stassen Export Private Limited 2,114 1,367 104,471 260,794 1,995 1,148 - - Stassen Natural Foods (Pvt) Ltd 2 3 - - - - - -
12,047 5,993 272,237 262,547 11,100 5,577 - -
35.1.6 This represents the remaining balance of loan granted for Rs.200Mn to Lanka Bell Limited at the rate of AWPLR plus 1% adjusted on quarterly basis.
35.1.7 This amount represents the balance remaining on a short term loan granted to Madulsima Plantations PLC along with the interest.
35.1.8 This represents the an interest free loan amounting to USD 1.212Mn from Stassens Lanka Private Limited by the Texpro Industries Limited. The Company has to settle this loan on demand. Hence, it has been classified under current liabilities and no fair value adjustments have been made.

Annual Report 2014/15 145
35.2 Transactions with Related Parties35.2.1 Transactions with subsidiaries, associates and other related companies
Name of the Company
Names of Directors Nature of Interest
Nature of Transaction Transaction Value Balance due (to) /from
Rs.000 Rs.000
1 Milford Exports (Ceylon) (Pvt) Limited
Mr. D. H. S. Jayawardena Mr. R. K. Obeyesekere* (a) Mr. D. Hasitha S.
Jayawardena* (c)
Parent Co. Dividend Paid 404,529 -
2 Periceyl (Pvt) Limited Mr. D. H. S. Jayawardena Mr. R. K. Obeyesekere* (a) Mr. C. R. Jansz Mr. D. Hasitha S.
Jayawardena* (c)
Subsidiary Co. Debtor Collections & Transfers
5,325,000 (674,316)
Supply of Goods & Services
421,724
Trading Account Profit 42,673 Goods Received 122,810
3 Balangoda Plantations PLC
Mr. D. H. S. Jayawardena Mr. C. R. Jansz
Subsidiary Co. Rent Paid Purchase of Tea
232 129
-
Mr. R. K. Obeyesekere* (a) 4 Splendor Media (Pvt)
Ltd. Subsidiary Co. Loan Interest 2,098 (25,360)
Supply of Goods & Services
1,332
Services Received 1,085 5 Texpro Industries
Limited Mr. D. H. S. Jayawardena Subsidiary Co. Supply of Materials 1,953 (1,128)
6 Continental Insurance Lanka Ltd
Mr. C. F. Fernando* (b) Subsidiary Co. Insurance Premium 43,932 2,790
Insurance Claim Received
6,632
Supply of Goods & Services
1,832
7 Melsta Logistics (Pvt) Ltd
Subsidiary Co. Vehicle Hiring charges Repair Charges & Other Services
315,096
35,169
(603,982)
Rent 5,128 Settlements 88,000 Supply of Goods & Services
24,767

Dist i l ler ies Company of Sr i Lanka PLC146
Notes to the Financial Statements
Name of the Company
Names of Directors Nature of Interest
Nature of Transaction Transaction Value Balance due (to) /from
Rs.000 Rs.000
8 Melstacorp Limited Mr. D. H. S. Jayawardena Mr. R. K. Obeyesekere* (a) Mr. C. R. Jansz Mr. N. de S. Deva Aditya Capt. K. J. Kahanda Mr. C. F. Fernando* (b) Dr. A. N. Balasuriya Mr. D. Hasitha S.
Jayawardena* (c)
Subsidiary Co. Dividend Paid 28,115 343,591 Rent & Other Services 189,024 Supply of Goods & Services
2,886
Financial Assistance for Land & Building trf. MP
1,152,438
Transfer Value of Loan 636,136 Transferred Value of Shares
6,428,955
Funds Transferred 1,339,658 Funds Received 912,500 Investment Made 12,762,750
9 Lanka Bell Ltd Mr. D. H. S. Jayawardena Subsidiary Co. Loan Interest Received 7,235 68,181Mr. C. R. Jansz Telephone Bills Paid &
Services Rendered 11,150
Supply of Goods & Services
583
10 Bellvantage (Pvt) Ltd Subsidiary Co. Maintenance Charges 14,329 (934) Supply of Goods & Services
55
11 Bell Solutions (Pvt) Ltd.
Mr. D. H. S. Jayawardena Subsidiary Co. Maintenance Charges 3,672 -
12 Melsta Regal Finance (Pvt) Ltd
Subsidiary Co. Supply of Goods & Services
611 1,263
13 Aitken Spence PLC Mr. D. H. S. Jayawardena Associate co. Supply of Services 307 - Mr. N. de S. Deva Aditya
14 Madulsima Plantations PLC
Mr. D. H. S. Jayawardena Mr. R. K. Obeyesekere* (a)
Associate co. Loan Interest Transfer Value of Loan
82,315 636,136
-
15 Stassen Exports (Pvt) Limited
Mr. D. H. S. Jayawardena Affiliate Co. Dividend Paid 6,871 1,995
Mr. R. K. Obeyesekere* (a) Rent Income 29,520 Mr. D. Hasitha S.
Jayawardena* (c) Maintenance & Transport Charges
52,659
Supply of Goods & Services
3,600
16 Lanka Dairies (Pvt) Ltd.
Mr. D. H. S. Jayawardena Mr. R. K. Obeyesekere* (a)
Affiliate Co. Purchase of Milk Foods 301 -
Mr. C. R. Jansz 17 Lanka Milk Foods
(CWE) PLC Mr. D. H. S. Jayawardena Mr. R. K. Obeyesekere* (a)
Affiliate Co. Dividend Paid Purchase of Milk Foods
123,375 10,925
9,105
Mr. C. R. Jansz Supply of Goods & Services
25,210
18 DFCC Bank PLC Mr. C. R. Jansz Affiliate Co. Dividend Received 91,741 -

Annual Report 2014/15 147
Name of the Company
Names of Directors Nature of Interest
Nature of Transaction Transaction Value Balance due (to) /from
Rs.000 Rs.000
19 Aitken Spence Hotel Holding PLC
Mr. D. H. S. Jayawardena Affiliate Co. Sales 904 -
20 Melsta Properties (Pvt) Ltd
Capt. K. J. Kahanda Mr. C. F. Fernando* (b)
Subsidiary Co. Rent Expense Lands and Buildings Transfer
26,021 1,152,438
-
*(a) Mr. R. K. Obeyesekere (Ceased to be a Director w.e.f. 26-01-2015) *(b) Mr. C. F. Fernando (Deceased on 15-11-2014) *(c) Mr. D. Hasitha S. Jayawardena (Appointed on 21-11-2014)
35.2.2 Transactions with Key Management Personnel According to Sri Lanka Accounting Standard (LKAS 24) “Related Party Disclosures”, Key Management Personnel, are
those having authority and responsibility for planning, directing and controlling the activities of the entity. Accordingly, the Board of Directors (including executive and non-executive Directors) and their immediate family member have been classified as Key Management Personnel of the Company.
The immediate family member is defined as spouse or dependent. Dependent is defined as anyone who depends on the respective Director for more than 50% of his/her financial needs.
35.2.2.1 Compensations to Key Management Personnel There were no compensation paid to Key Management Personnel during the year other than those disclosed below.
Group CompanyFor the year ended 31 March, 2015 2014 2015 2014
Note Rs.000 Rs.000 Rs.000 Rs.000
Short Term Employee Benefits 92,888 89,234 24,121 23,410 Post Employment Benefits 900 2,227 - - Other Long Term Benefits 1,750 - - - Share based Payments - - - -
35.2.2.2 Loans to Directors There were no loans granted to directors during the year.
35.2.3 Related party transactions exceeding 10% of the equity or 5% of the total assets of the entity as per audited financial statements, whichever is lower (CSE Ruling)
Date of Name of the Relationship Nature of the Amount Rational for Entering to theTransaction Related Party Transaction Rs. 000 Transaction
28-Nov-14 Melstacorp Ltd Subsidiary Disposal of Investment 3,523,201 As part of the group re-structuring plan.28-Nov-14 Melstacorp Ltd Subsidiary Disposal of Investment 2,749,637 As part of the group re-structuring plan.31-Dec-14 Melstacorp Ltd Subsidiary Disposal of Investment 156,117 As part of the group re-structuring plan.
6,428,955 25-Feb-15 Melstacorp Ltd Subsidiary Investment in Shares 12,533,404 As part of the group re-structuring plan.31-Mar-15 Melstacorp Ltd Subsidiary Investment in Shares 229,346 As part of the group re-structuring plan.
12,762,750

Dist i l ler ies Company of Sr i Lanka PLC148
Notes to the Financial Statements
36
Fina
ncia
l Ins
trum
ents
36.1
Ac
coun
ting
Cla
ssifi
catio
n of
Fin
anci
al In
stru
men
ts36
.1.1
Acc
ount
ing
Cla
ssifi
catio
n of
Fin
anci
al A
sset
s
Grou
pLo
ans a
nd re
ceiva
bles
(L&R)
Asse
ts at
fair v
alue
throu
gh p
rofit
and
loss
(FVTP
L)
Held
to m
aturity
inv
estm
ents
(HTM
)Av
ailab
le for
sale
finan
cial
asse
ts (A
FS)
Total
As a
t 31
Mar
ch,
2015
2014
2015
2,01
4 20
15 2,
014
2015
2,01
4 20
15 2,
014
Note
Rs.0
00
Rs.0
00
Rs.0
00
Rs.0
00
Rs.0
00
Rs.0
00
Rs.0
00
Rs.0
00
Rs.0
00
Rs.0
00
Asse
ts a
s per
Sta
tem
ent o
f Fina
ncial
Pos
ition
Non
Curre
nt A
sset
sOt
her N
on C
urre
nt F
inanc
ial In
vestm
ents
21 18
2,538
18
1,765
-
-
-
-
17,3
40,72
4 15
,452,9
54
17,52
3,262
15
,634,7
19
Finan
ce L
ease
, Hire
Pur
chas
es a
nd O
pera
ting
Leas
e Re
ceiva
bles
23 86
8,225
30
1,364
-
-
-
-
-
-
86
8,225
30
1,364
Adva
nces
and
Oth
er L
oans
24 45
9,705
15
1,984
-
-
-
-
-
-
45
9,705
15
1,984
Cu
rrent
Ass
ets
Trade
and
Oth
er R
eceiv
ables
26 7,
642,2
41
7,07
6,716
-
-
-
-
-
-
7,
642,2
41
7,07
6,716
Fin
ance
Lea
se, H
ire P
urch
ases
and
Ope
ratin
g Le
ase
Rece
ivable
s23
311,9
99
114,1
99
-
-
-
-
-
-
311,9
99
114,1
99
Adva
nces
and
Oth
er L
oans
24 1,
224,5
51
673,0
15
-
-
-
-
-
-
1,22
4,551
67
3,015
Am
ount
s Due
from
Rela
ted
Com
panie
s35
.1.1
672,5
39
567,7
14
-
-
-
-
-
-
672,5
39
567,7
14
Othe
r Cur
rent
Fina
ncial
Inve
stmen
ts21
201,9
71
254,8
93
2,01
1,416
2,
184,8
59
40,91
1 -
17
7,517
-
2,
431,8
15
2,43
9,752
Ca
sh a
nd C
ash
Equiv
alent
s27
4,07
2,931
3,
923,5
12
-
-
-
-
-
-
4,07
2,931
3,
923,5
12
Tota
l 15
,636,7
00
13,24
5,162
2,
011,4
16
2,18
4,859
40
,911
- 1
7,518
,241
15,45
2,954
35
,207,2
68
30,88
2,975
Com
pany
Loan
s and
Rec
eivab
les
(L&R)
Asse
ts at
Fair V
alue
Thro
ugh P
rofit
and
Loss
(FV
TPL)
Held
to M
aturity
Inv
estm
ents
(HTM
)Av
ailab
le for
Sale
Fina
ncial
As
sets
(AFS
)To
tal
As a
t 31
Mar
ch,
2015
2014
2015
2,01
4 20
15 2,
014
2015
2,01
4 20
15 2,
014
Note
Rs.0
00
Rs.0
00
Rs.0
00
Rs.0
00
Rs.0
00
Rs.0
00
Rs.0
00
Rs.0
00
Rs.0
00
Rs.0
00
Asse
ts a
s per
Sta
tem
ent o
f Fina
ncial
Pos
ition
Non
Curre
nt A
sset
sOt
her N
on C
urre
nt F
inanc
ial In
vestm
ents
21 -
-
-
-
-
-
2,
561,0
53
6,34
9,895
2,
561,0
53
6,34
9,895
Cu
rrent
Ass
ets
Trade
and
Oth
er R
eceiv
ables
26 2,
396,8
44
2,83
4,890
-
-
-
-
-
-
2,
396,8
44
2,83
4,890
Am
ount
s Due
from
Rela
ted
Com
panie
s35
.1.1
426,9
25
5,32
4,230
-
-
-
-
-
-
42
6,925
5,
324,2
30
Othe
r Cur
rent
Fina
ncial
Inve
stmen
ts21
-
-
177,8
63
784,4
02
-
-
-
-
177,8
63
784,4
02
Cash
and
Cas
h Eq
uivale
nts
27 18
4,718
42
0,103
-
-
-
18
4,718
42
0,103
To
tal
3,00
8,487
8,
579,2
23
177,8
63
784,4
02
-
-
2,56
1,053
6,
349,8
95
5,74
7,403
15
,713,5
20

Annual Report 2014/15 149
35.1.2 Accounting classification of financial liabilities
GroupFinancial Liabilities at Fair
Value Through Profit or LossFinancial Liabilities Measured
at Amortised CostTotal
As at 31 March, 2015 2,014 2015 2014 2015 2014Note Rs.000 Rs.000 Rs.000 Rs.000 Rs.000 Rs.000
Liabilities as per Statement of Financial PositionNon Current LiabilitiesInterest Bearing Loans and Borrowings
30 - - 1,776,356 670,975 1,776,356 670,975
Current LiabilitiesTrade and Other Payables 33 - - 5,770,404 4,979,488 5,770,404 4,979,488 Deposit Liabilities 34 - - 511,789 663,537 511,789 663,537 Amount Due to Related Companies
35.1.2 - - 272,403 263,905 272,403 263,905
Interest Bearing Loans and Borrowings
30 - - 7,809,076 7,603,794 7,809,076 7,603,794
Bank Overdrafts 27 - - 4,253,380 5,120,243 4,253,380 5,120,243 Total - - 20,393,408 19,301,942 20,393,408 19,301,942
CompanyFinancial Liabilities at Fair
Value Through Profit or LossFinancial Liabilities Measured
at Amortised CostTotal
As at 31 March, 2015 2,014 2015 2014 2015 2014Note Rs.000 Rs.000 Rs.000 Rs.000 Rs.000 Rs.000
Liabilities as per Statement of Financial PositionCurrent LiabilitiesTrade and Other Payables 33 - - 3,065,245 2,892,443 3,065,245 2,892,443 Amount Due to Related Companies
35.1.2 - - 1,305,721 1,035,020 1,305,721 1,035,020
Interest Bearing Loans and Borrowings
30 - - 4,795,000 6,215,006 4,795,000 6,215,006
Bank Overdrafts 27 - - 1,681,456 3,810,832 1,681,456 3,810,832 Total - - 10,847,422 13,953,301 10,847,422 13,953,301
36.2 Fair Value Hierarchy of Financial Instruments The table below analyses financial instruments carried at fair value, by valuation method. The different levels have been
defined as follows:
Level 1: Quoted prices (unadjusted) in active markets for identical assets or liabilities.
The fair value of financial instruments traded in active markets is based on quoted market prices at the balance sheet date. A market is regarded as active if quoted prices are readily and regularly available from an exchange, dealer, broker, industry group, pricing service, or regulatory agency, and those prices represent actual and regularly occurring market

Dist i l ler ies Company of Sr i Lanka PLC150
Notes to the Financial Statements
transactions on an arm’s length basis. The quoted market price used for financial assets held by the group/company is the closing market price in Colombo Stock Exchange. These instruments are included in Level 1. Instruments included in Level 1 comprise equity investments classified as fair value through profit and loss securities or available for sale.
Level 2: Inputs other than quoted prices included within Level 1 that are observable for the asset or liability, either directly (i.e. as prices) or indirectly (i.e. derived from prices).
The fair value of financial instruments that are not traded in an active market (for example, over-the-counter derivatives) is determined by using valuation techniques. These valuation techniques maximise the use of observable market data where it is available and rely as little as possible on entity specific estimates. If all significant inputs required to fair value an instrument are observable, the instrument is included in Level 2.
Level 3: Inputs for the asset or liability that are not based on observable market data (Unobservable inputs).
If one or more of the significant inputs is not based on observable market data, the instrument is included in Level 3.
GroupLevel 1 Level 2 Level 3 Total
As at 31 March, 2015 2014 2015 2014 2015 2014 2015 2014Note Rs.000 Rs.000 Rs.000 Rs.000 Rs.000 Rs.000 Rs.000 Rs.000
Non Current AssetsOther Non Current Financial InvestmentsAvailable for Sale Financial Investments - (AFS)Quoted Equity Securities 21.1.1 16,931,800 15,213,946 - - - - 16,931,800 15,213,946 Unquoted Equity Securities 21.1.2 - - - - 114,102 338 114,102 338 Investments in Unit Trusts 21.1.3 - - - - 59,152 3,000 59,152 3,000 Debt Securities 21.1.4 235,670 235,670 - - - - 235,670 235,670
Current AssetsOther Current Financial InvestmentsAvailable for Sale Financial Investments - (AFS)Quoted Equity Securities - - - - - - - - Government Securities 21.1.6 177,517 - - - - - 177,517 - Fair Value Through Profit or Loss (FVTPL) Financial InvestmentsQuoted Equity Securities 21.2.1 1,111,052 1,801,780 - - - - 1,111,052 1,801,780 Quoted Debentures 21.2.3 134,877 124,307 - - - - 134,877 124,307 Investments in Unit Trusts 21.2.2 - - - - 765,487 258,772 765,487 258,772 Total 18,590,918 17,375,703 - - 938,741 262,110 19,529,657 17,637,813

Annual Report 2014/15 151
CompanyLevel 1 Level 2 Level 3 Total
As at 31 March, 2015 2014 2015 2014 2015 2014 2015 2014Note Rs.000 Rs.000 Rs.000 Rs.000 Rs.000 Rs.000 Rs.000 Rs.000
Non Current AssetsOther Non Current Financial InvestmentsAvailable for Sale Financial Investments - (AFS)Quoted Equity Securities 21.1.1 2,223,612 6,126,080 - - - - 2,223,612 6,126,080 Unquoted Equity Securities 21.1.2 - - - - 113,771 7 113,771 7 Investments in Unit Trusts 21.1.3 - - - - 3,000 3,000 3,000 3,000 Debt Securities 21.1.4 220,670 220,670 - - - - 220,670 220,670
Current AssetsOther Current Financial InvestmentsFair Value Through Profit or Loss (FVTPL) Financial Investments
21.2
Quoted Equity Securities 21.2.1 177,863 784,540 - - - - 177,863 784,540 Total 2,622,145 7,131,290 - - 116,771 3,007 2,738,916 7,134,297
Fair value information of financial asserts and financial liabilities not measured at fair value has not been included in the carrying amount is a reasonably approximation of fair value.
For Variable interest bearing loans, it was considered that carrying value equal fair value.
37 Amount due from the Secretary to the Treasury on Account of SLIC a) In respect of Shares As per the Judgment delivered by the Supreme Court of the Democratic Socialist Republic of Sri Lanka on 4 June 2009 it
was declared and directed that the shares of SLIC purported to have been sold to Distilleries Consortium on 11 April 2003 along with any shares purchased from employees as per SSPA shall be deemed to have been held for and on behalf of the Secretary to the Treasury.
As directed by the said judgment, the Secretary to the Treasury returned Rs.5,716 Mn in 2010/11 that was paid by Group Subsidiary Milford Holdings (Pvt) Limited (MHL) to purchase shares from SLIC.
b) In respect of Profits Earned Furthermore, MHL was entitled to retain the profits of SLIC derived by MHL from 11 April 2003 to 04 June 2009 in lieu of the
interest for the aforesaid investment. The Secretary to the Treasury was directed to cause profits of SLIC to be computed and audited from the date of the last audited Reporting of SLIC to 04 June 2009 to enable MHL to obtain such profits.
However, Secretary to the Treasury has not yet determined the value of profits to be retained by the MHL; hence no adjustments were made to the financial statements in this regards.

Dist i l ler ies Company of Sr i Lanka PLC152
Notes to the Financial Statements
38 Impact of Revival of Underperforming Enterprises and Underutilised Assets Bill – Pelwatte Sugar Industries PLC Group (PSIP)
Consequent to the enactment and passage of the above Act of Parliament on 9 November 2011, the state officials are occupying the land leased to PSIP. As the leasing of the land to PSIP was done in 1985, and the above mentioned Act empowers the vesting of land leased during a period of 20 years before the enactment of the Act. The Company believes that the land that was used by PSIP have not been vested in the state. At this moment the management is unable to comment further on the implications on the ruling as the Company is awaiting instructions by the Secretary to the Treasury.
Financial results up to 30 September 2011 were consolidated to Group results for the year ended 31 March 2012. Subsequent financial results have not been incorporated to the Group results due to non accessibility of the information. Subsequently a Compensation Tribunal was formed as required by the Act. Without assuming any liability or without any prejudice to, or impact on its rights, PSIP has submitted a claim to the Compensation Tribunal.
Commercial High Court of Western Province (Colombo Civil) issued a winding-up order of Pelwatte Sugar Industries PLC on 13 March 2013. The Court has appointed P.E.A. Jayewickreme and G.J. David, as the Liquidators.
39 Pending Litigations and Contingent Liabilities Based on the available information, the Management is of the view that following litigation claims that could not have
material impact on the financial position on the group. Accordingly, no provision has been made in the Financial Statements.
39.1 Distilleries Company of Sri Lanka PLC A plaint filled by Censtear (Pvt) Limited against the Company claiming a sum of Rs 18 Mn was decided in favour of the
plaintiff by the Commercial High Court of Colombo. The Company has filed an appeal against this order and a claim has been made in reconvention.
39.2 Lanka Bell Limited Sri Lanka Customs carried out an investigation claiming that Lanka Bell Limited is required to pay duty on the FLAG fibre
optic submarine cable network which spans the globe connecting over 86 locations around the world. The Company is confident that no such duties are payable since Lanka Bell does not own this global network and also has already obtained BOI approval for the FLAG project.
The company filed a writ application in Court of Appeal citing irregularities in the procedure adopted by the Sri Lanka Customs in issuing such a notice. The argument is fixed for 03rd of September 2015.Accordingly no provision has been made in the financial statements.
39.3 Other Contingent Liabilities
GroupAs at 31 March, 2015 2014
Rs.000 Rs.000
Bank Guarantees 26,998 33,294 Import/Export Bill Collection 20,359 34,165 Letter of Credit 38,915 73,376 Shipping Guarantee 95,724 113,217
There are no material contingent liabilities as at 31 March 2015 other than disclose above.

Annual Report 2014/15 153
40 Capital and Other Commitments There were no material capital expenditure approved by the Board of Directors as at 31 March 2015 other than followings;
40.1 Browns Beach Hotel PLC The project for constructing a new resort hotel in the existing hotel compound is undertaken by Negombo Beach Resorts
(Pvt) Ltd. Which is a 100% owned subsidiary of Browns Beach Hotels PLC. The total project cost is estimated to be in the region of Rs. 4.0 Billion.
40.2 Melsta Regal Finance Limited The Company has opened a sum of Rs. 92,977,700/- ( 2014 - Rs.18,111,175/-) worth of Letter of Credit on behalf of the
customers.
40.3 Bogo Power Private Limited Operating Lease Commitments - Company as a Lease
The Company has entered into a lease on the land on which the power house has constructed with a lease term of thirty years. The Company has the option, to lease the land for additional terms as negotiated with the lessor.
The approximate future minimum lease rentals payable as per the above operating leases as at 31st March are as follows.
CompanyAs at 31 March, 2015 2014
Rs.Mn Rs.Mn
Within One Year 22.9 22.7After One Year but not more than Five Years 94.4 93.2More than Five Years 624.7 648.8
742 764.7
41 Assets Pledged Following assets have been pledged as securities for liabilities.
Company Nature of Liability Security Value of the Assets Pledged
(Rs.000)Description Asset Type 2015
Melstacorp Limited
Permanent over draft facilities and other short term borrowings of DCSL
Long term investments held in Quoted shares of John Keels Holdings PLC (25 mn shares) and Aitken Spence PLC (95.25 Mn shares) are pledged on the other short term borrowings obtained by Distilleries Company of Sri Lanka PLC.
Other Long Term Investments and Investments in Equity Accounted Investees.
14,462,375
Balangoda Plantations PLC
Long Term Loan Primary mortgage over the lease hold rights of Balangoda Estates.
Property, Plant and Equipment
690,000
Mortgage on Colour Separator Property, Plant and Equipment
36,408
Finance Lease Absolute ownership of the leased bikes Property, Plant and Equipment
574

Dist i l ler ies Company of Sr i Lanka PLC154
Notes to the Financial Statements
Company Nature of Liability Security Value of the Assets Pledged
(Rs.000)Description Asset Type 2015
Texpro Industries (Pvt) Ltd
Long Term Loan The Company has provided existing primary floating mortgage bond for USD 3.262 Mn over land, building and immovable machinery at Ranala as collateral against the bank facility and borrowings.
Property, plant and equipment
434,890
Other Short Term Borrowings
Hypothecation of Stock Inventory 232,056
The Company has provided letter from SL Army, Navy, Air Force and other Government departments regarding award of order, indemnity of the Company, documents of title to goods shipped.
Indemnity of the Company, documents of title to goods shipped
Build up cash margin of 2% from each export proceeds,pro note
Revenue-Export 711,678
Secondary mortgage over land, building and immovable machinery at Embulagama,Ranala for USD 1.5Mn
Property, plant and equipment
199,980
Lanka Bell Limited
Term Loans and Other Borrowings
Tower portfolio has been pledged as a security against the financing facilities.
Property, plant and equipment
425,000
Movable and immovable property has been pledged as a security against the financing facilities.
Property, plant and equipment
1,073,226
42 Subsequent Events There were no other material events occurring after the reporting period that requires adjustments to or disclosure in the
Financial Statements other than the items disclosed below and proposed dividend disclosed in Note 14 to these financial statements.
42.1 Super Gain Tax The interim budget proposal presented by the Minister of Finance on 29 January 2015 and the pursuant bill presented to
the Parliament on 7 April 2015, impose a one off tax of 25% on taxable profits for the year of assessment 2013/14 on any company or each company in a group of companies, if the company’s / Group’s profit before income tax exceeds Rs. 2 Bn. The impact to the company will be assessed and if required provisions will be made when the bill is enacted.
42.2 Melstacorp Limited Melstacorp Limited has invested Rs.735.5 Mn in 7.5Mn shares of Aitken Spence PLC after the reporting period. The
Group’s stake in Aitken Spence PLC has gone up to 43.12% with the said investment.

Annual Report 2014/15 155
43 Financial Risk Management The Group has adopted practices to mitigate risks arising from adverse market conditions (prices, rates and volatile
markets) by hedging (or not) using financial instruments.
Financial risk derives from economic uncertainty. The inability to forecast with certainty would either erode profitability (e.g. adverse exchange rate) or could jeopardise the ability of the company to raise finance from markets (e.g. volatile interest rates).
Group’s core business of beverage is essentially a cash business hence has a short cash cycle. This results in low financial risk adding to greater degree of control of finance. Other sectors such as Telecommunication, Plantation, Insurance, Finance and other diversified holdings exercise policies stemming from DCSL’s practices of effective financial risk management as common members of the board ensures uniformity. Continental Insurance and Melsta Regal Finance are exceptional and adhere to an even higher degree of management to comply with IBSL and CBSL regulatory compliance/guidelines respectively.
Financial Instruments Group’s financial instruments consist of ASSETS - its portfolio of equity investments, deposits in banks,accounts
receivable. LIABILITIES - Loan obligations, accounts payable and accrued liabilities such excise duty, taxes, payroll and pension account.
43.1 Financial Risk Management Objectives and Policies Whilst ‘risk management’ is ingrained in the business from the Board down to operational level, financial risk management
at Group is entrusted to a niche of in-house financial professionals ably supported by external economists, financial consultants, legal counsel, tax experts, banks and auditors.
In the normal course of business, the Group is exposed to financial risks that have the potential to negatively impact its financial performance. The Group does not use derivative financial instruments to manage these risks, as management believes that the risks arising from the financial instruments are already at an acceptable level. This is further accredited by the AAA/Stable rating assigned by Fitch this year.
The Group has exposure to the following risks from financial instruments
43.1.1 Credit Risk This is the risk that counterparty will not meet its obligations under a financial instrument or customer contract, leading to
financial loss. Group’s credit risk arises primarily from credit exposure to customers, including outstanding receivable from select retail chains.
The Group assesses the credit quality of its counter-parties, taking into account their financial position, past experience and seasonal factors.
The group trades only with recognised, credit worthy third parties. It is a group policy that all clients who wish to trade on credit terms are subject to credit verification procedures. In addition, receivable balances are monitored on an ongoing basis with the result that the Group’s exposure to bad debts is not significant.
Credit Risk Liquidity Risk Market Risk
Interest Rate RiskEquity Risk Foreign Exchange Risk

Dist i l ler ies Company of Sr i Lanka PLC156
Notes to the Financial Statements
Maximum Credit Exposure The carrying amount of financial assets represents the maximum credit exposure. The maximum exposure to credit risk at
the end of the reporting period was as follows,
Group CompanyAs at 31 March, 2015 2014 2015 2014
Note Rs.000 % from totalexposure
Rs.000 % from totalexposure
Rs.000 % from totalexposure
Rs.000 % from totalexposure
Trade and Other Receivables
43.1.1.1 7,642,241 48% 7,076,716 54% 2,396,844 76% 2,834,890 33%
Receivables from/ in Finance Business
43.1.1.2 2,864,480 18% 1,240,562 9% - 0% - 0%
Amounts Due from Related Companies
43.1.1.3 672,539 4% 567,714 4% 426,925 14% 5,324,230 62%
Corporate Debt Securities
43.1.1.4 553,085 3% 541,742 4% 220,670 7% 220,670 3%
Government Securities 43.1.1.5 419,729 3% 909,787 7% - 0% - 0%Deposits with Bank 43.1.1.6 2,879,805 18% 2,177,663 17% 42,099 1% 82,062 1%Cash at Bank 43.1.1.7 804,823 5% 595,628 5% 66,553 2% 61,719 1%
15,836,702 100% 13,109,812 100% 3,153,091 100% 8,523,571 100%
43.1.1.1 Trade and Other Receivables As the large majority of Beverage accounts receivable balances are collectable from licensed retailers, management
believes that the sector’s credit risk relating to accounts receivable is at an acceptably low level.
The Group has observed higher credit risk in telecommunication sector due to large number of small customers. However, risk is managed and mitigated by adopting timely disconnection policy and converting customer to prepaid mode.
The requirement for an impairment is analysed at each reporting date on an individual basis for major customers. Additionally, a large number of minor receivables are grouped into homogenous groups and assessed for impairment collectively.
The group’s maximum exposure to credit risk from Insurance contract receivables are mainly consist with Premium Receivables.
Some of the actions specific to Premiums Receivables in Non-Life Insurance are shown below.
-Premium Payment Warranty (PPW) is strictly implemented and all Non - Life Insurance policies with payments outstanding for more than 60 days are cancelled.
- Follow-up meetings on debt collection are conducted with the participation of finance, distribution and underwriting officials on a monthly basis.
- Claim settlements are processed only after reviewing the position of outstanding receivables.
43.1.1.2 Receivables from / in Finance Business The above stated financial assets are backed with the underlying securities.
43.1.1.3 Amounts Due from Related Companies The amounts due from related parties mainly consist of receivables from associates and other related ventures and those
are closely monitored by the group.
The amounts receivable from related parties are mainly consist of its fully owned subsidiary, Melstacorp Limited and its due to the group restructuring process.

Annual Report 2014/15 157
43.1.1.4 Corporate Debt Securities The Corporate debt securities are entirely consist of Corporate Debentures which are listed in Colombo Stock Exchange
which are guaranteed by local and foreign credit rating agencies as BBB+ or Better.
An Analysis of credit ratings of the issuers of debenture are as follows, Credit Rating
Group Company2015 2014 2015 2014
Amount % from Total Exposure
Amount % from Total Exposure
Amount % from Total Exposure
Amount % from Total Exposure
Rs.'000 Rs.'000 Rs.'000 Rs.'000
AA– 92,156 17% 103,689 19% - - - 0%A+ 19,003 3% - - - - - -A– 220,670 40% 417,435 77% 220,670 100.00% 220,670 100%BBB+ 221,256 40% 20,618 4% - - - 0%
553,085 100% 541,742 100% 220,670 100.00% 220,670 100%
43.1.1.5 Government Securities Government securities are referred to as risk free instruments in its nature.
43.1.1.6 Deposits with Bank and Cash at Bank The Deposits with banks are entirely consist of fixed deposits and call deposits placed in both Banks and other financial
institutions.
Further the cash at bank is mainly consist of favourable balances in Savings and current accounts of private and government commercial banks.
The Group has selected its bankers by considering the credit ratings of the rating agencies, the reputation in the economy, efficiency in transaction processing by minimising the transaction costs.
The financial institutions in which the deposits and cash at bank is existed are guaranteed by local and foreign credit rating agencies as AA- or Better.
43.1.2 Liquidity Risk Liquidity risk is the risk that the Group will encounter difficulty in meeting financial obligations on time.
Group’s sources of liquidity are its short term deposits in banks and its cash generated by operating activities. Group’s total contractual maturities are represented by its accounts payable and accrued liabilities, and are mostly due to be paid within one year. The Group believes that its deposits in cash management pools, ready bank lines (ODs, loans), debt with rollover options, combined with its historically strong and consistent operational cash flows, are more than sufficient to fund its operations, investing activities and commitments for the foreseeable future.
Group does not have any investments in asset-backed commercial papers and, therefore, has no exposure to this type of liquidity risk.

Dist i l ler ies Company of Sr i Lanka PLC158
Maturity Analysis The table below summarises the maturity profile of the Group’s financial liabilities as at 31 March 2015.
Within 1 year Between 1-3 years
Between3 to 5 years
More than5 years
Total
Rs'000 Rs'000 Rs'000 Rs'000 Rs'000
Interest Bearing Loans and Borrowings 7,809,076 462,380 433,604 880,373 9,585,433 Trade and Other Payables 10,211,241 - - - 10,211,241 Deposit Liabilities 482,714 19,775 9,300 - 511,789 Amount Due to Related Companies 272,403 - - - 272,403 Bank Overdrafts 4,253,380 - - - 4,253,380
23,028,814 482,155 442,904 880,373 24,834,246
The table below summarises the maturity profile of the Group’s financial liabilities as at 31 March 2015.
Within 1 year Between 1-3 years
Between3 to 5 years
More than5 years
Total
Rs'000 Rs'000 Rs'000 Rs'000 Rs'000
Interest Bearing Loans and Borrowings 4,795,000 - - - 4,795,000 Trade and Other Payables 6,032,439 - - - 6,032,439 Deposit Liabilities - - - - - Amount Due to Related Companies 1,305,721 - - - 1,305,721 Bank Overdrafts 1,681,456 - - - 1,681,456
13,814,616 - - - 13,814,616
43.1.3 Market Risk Market risk is the risk that the fair value of future cash flows of a financial instrument will fluctuate because of changes
in market prices. Market prices comprise four types of risk; equity price risk, interest rate risk, currency risk (or foreign exchange risk), and other price risks such as commodity price risk. Financial instruments at Group level affected by market risk include loans and borrowings, deposits, letters of credit and available for sale investments. The objective of market risk management is to manage and to control market risk exposures within acceptable parameters while optimising the return.
Equity Price Risk Certain companies of the Group have their major equity investment portfolios held on a long term basis; hence immune
to daily fluctuations. Those are classified as AFS. Further, a small trading portfolio is managed by two reputed Unit Trust companies licensed by the SEC and individual companies manage their own short term portfolios as well. These investments are held by complying with group investment policies. Safe Custodian agreements with banks are in place that adds a control dimension.
The Group manages the equity price risk through diversification of its investments to each sector. Further the Management daily monitors the reports of the equity portfolios
Notes to the Financial Statements

Annual Report 2014/15 159
The extend of diversification of short term equity investments (FVTPL) are analysed bellow.
Group CompanyAs at 31 March, 2015 2014 2015 2014
Rs'000 % Rs'000 % Rs'000 % Rs'000 %
Bank, Finance and Insurance 932 0% 488,030 27% - 0% 426,357 54%Beverage, Food and Tobacco 144,712 13% 139,033 8% 136,064 76% 127,750 16%Chemicals and Pharmaceuticals 13,303 1% 12,418 1% 9,563 5% 9,096 1%Construction and Engineering - 0% 13,185 1% - 0% 8,761 1%Diversified Holdings 540,026 49% 626,818 35% 9,577 5% 16,126 2%Hospitals 10,403 1% 123,247 7% 7,200 4% 111,444 14%Hotel and Travels 23,342 2% 35,984 2% 15,459 9% 21,550 3%Manufacturing 378,334 34% 333,456 19% - 0% 49,230 6%Power and Energy - 0% 9,080 1% - 0% 6,468 1%Telecommunication - 0% 20,528 1% - 0% 7,758 1%
1,111,052 100% 1,801,779 100% 177,863 100% 784,540 100%
Interest Rate Risk Interest rate risk is the risk that the fair value or future cash flows of a financial instrument will fluctuate because of
changes in market interest rates. The Group has short and long-term debt facilities. Interest rate risk exists as Group earns market rates of interest on its deposits in cash management pools. An active risk management program does not exist, as management believes that changes in interest rates would not have a material impact on Group’s financial position over the long term.
Foreign Currency Risk The Group has exposure to foreign currency risk as it conducts business in a select few foreign currencies; however, its
exposure is primarily limited to the US dollar. Group does not utilise derivative instruments to manage this risk. Subject to competitive conditions, changes in foreign currency rates may be passed on to consumers through pricing over the long term.
The beverage sector demand for USD has traditionally outpaced its supply, due to USD sourcing of production inputs (imported spirits and machinery) exceeding that of the sector’s USD sales. Therefore, decreases in the value of the Sri Lankan Rupee (LKR) relative to the USD will have an unfavourable impact on the sector earnings.
43.1.4 Financing Risk The company has a very strong Financial Position and is among the most preferred among local providers of finance. This
was further cemented by the high credit rating assigned by Fitch negating any doubts of Group’s ability to secure funding at cheaper rates. Often the company has access to bank lines sans security. However, the management as a policy maintains a healthy gearing ratio and a Debt Service Coverage Ratio always in par with the industry without overstretching the Financial Position. Since of late foreign funding lines too have been cautiously approached to benefit from low interest rates globally.

Dist i l ler ies Company of Sr i Lanka PLC160
43.2 Capital Management The Group’s objectives when managing capital are to safeguard the Group’s ability to continue as a going concern in
order to provide returns for shareholders and benefits for other stakeholders and to maintain an optimal capital structure to reduce the cost of capital.
In order to maintain or adjust the capital structure, the Group’s may adjust the amount of dividends paid to shareholders, return capital to shareholders, issue new shares or sell assets to reduce debt.
Consistent with others in the industry, the Group monitors capital on the basis of the gearing ratio. The ratio is calculated as net debt/total capital. Net debt is calculated as total borrowings (including current and non-current interest bearing borrowing as shown in the consolidated Statement of Financial Position plus bank overdrafts) less cash and cash equivalents. Total capital is calculated as “equity” as shown in the consolidated Statement of Financial Position plus net debt. Gearing ratios at 31 March 2015 and 2014 are as follows.
Group CompanyAs at 31 March, 2015 2014 2015 2014
Rs.000 Rs.000 Rs.000 Rs.000
Total Interest Bearing Loans and Borrowing 9,585,432 8,274,769 4,795,000 6,215,006 Bank Overdrafts 4,253,380 5,120,243 1,681,456 3,810,832 Less: Cash & Cash Equivalents (4,072,931) (3,923,512) (184,718) (420,103)Net Debt 9,765,881 9,471,500 6,291,738 9,605,735 Total Equity 64,823,997 57,593,114 50,283,325 43,838,640 Total Capital 74,589,878 67,064,614 56,575,063 53,444,375 Gearing Ratio 13% 14% 11% 18%
Notes to the Financial Statements
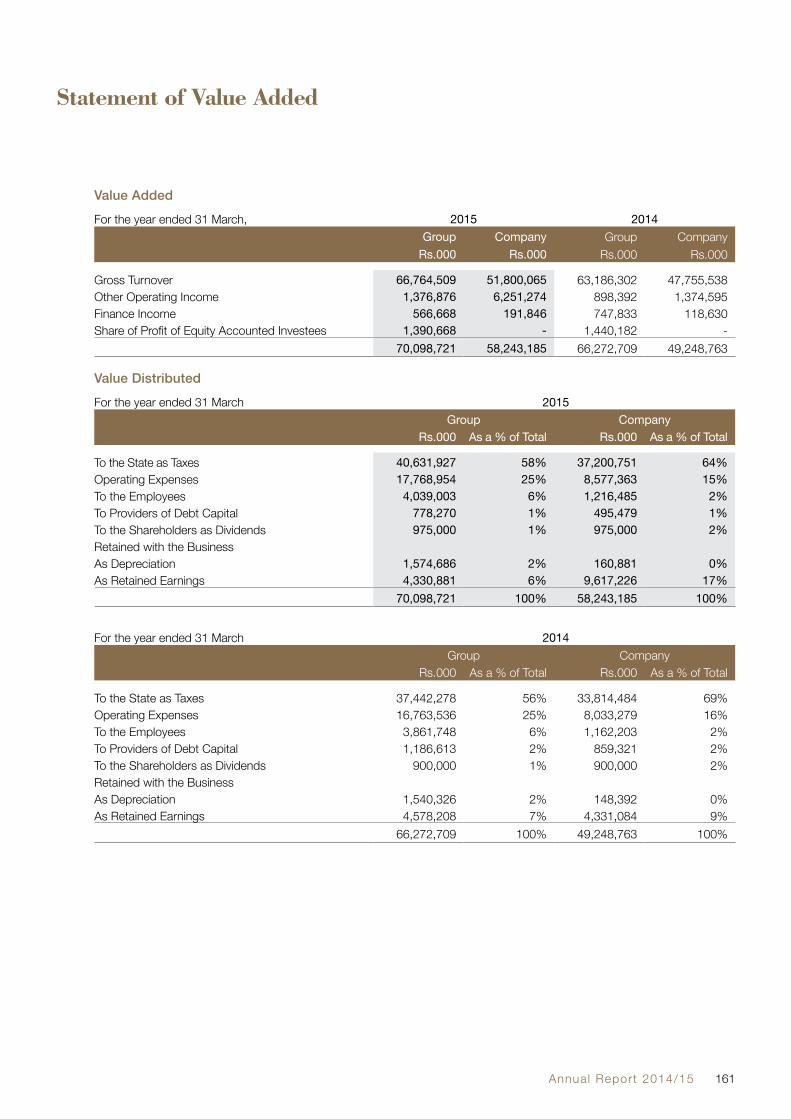
Annual Report 2014/15 161
Statement of Value Added
Value AddedFor the year ended 31 March, 2015 2014
Group Company Group CompanyRs.000 Rs.000 Rs.000 Rs.000
Gross Turnover 66,764,509 51,800,065 63,186,302 47,755,538 Other Operating Income 1,376,876 6,251,274 898,392 1,374,595 Finance Income 566,668 191,846 747,833 118,630 Share of Profit of Equity Accounted Investees 1,390,668 - 1,440,182 -
70,098,721 58,243,185 66,272,709 49,248,763
Value DistributedFor the year ended 31 March 2015
Group Company Rs.000 As a % of Total Rs.000 As a % of Total
To the State as Taxes 40,631,927 58% 37,200,751 64%Operating Expenses 17,768,954 25% 8,577,363 15%To the Employees 4,039,003 6% 1,216,485 2%To Providers of Debt Capital 778,270 1% 495,479 1%To the Shareholders as Dividends 975,000 1% 975,000 2%Retained with the BusinessAs Depreciation 1,574,686 2% 160,881 0%As Retained Earnings 4,330,881 6% 9,617,226 17%
70,098,721 100% 58,243,185 100%
For the year ended 31 March 2014 Group Company
Rs.000 As a % of Total Rs.000 As a % of Total
To the State as Taxes 37,442,278 56% 33,814,484 69%Operating Expenses 16,763,536 25% 8,033,279 16%To the Employees 3,861,748 6% 1,162,203 2%To Providers of Debt Capital 1,186,613 2% 859,321 2%To the Shareholders as Dividends 900,000 1% 900,000 2%Retained with the BusinessAs Depreciation 1,540,326 2% 148,392 0%As Retained Earnings 4,578,208 7% 4,331,084 9%
66,272,709 100% 49,248,763 100%

Dist i l ler ies Company of Sr i Lanka PLC162
Details of Real Estate
Location Lands Buildings VALUE Extent No of
UnitsExtent Cost/Revaluation
A R P In (Sq. Ft.) Rs. 000 Distilleries Company of Sri Lanka PLCSeeduwa No. 3 Warehouse, New Bottling Plant Complex &
Housing Complex15 2 17.09 27 274,546.50 2,181,976
Seeduwa New W/H, Old W/H & Distillery 5 2 15.10 22 93,276.00 319,562 Kandy Mawilmada Land 2 0 0.00 0 - 22,200 Kalutara Bare Land 1 0 23.00 0 - 14,000
Melsta Properties (Pvt.)LimitedGampola Wholesale Outlet 0 3 35.50 5 8,415.00 33,279 Dickoya Wholesale Outlet 0 3 9.60 4 16,735.50 6,759 Dankotuwa Old Distillery 2 1 38.00 3 8,083.50 22,045 Marawila Toddy Collection Centre 2 0 0.00 0 - 16,639 Kalutara No. 1 Warehouse 4 0 33.38 5 56,580.00 145,599 Kalutara Teak Stores / Warehouse 1 0 32.82 3 14,870.00 20,799 Mirishena Warehouse 0 3 28.32 4 10,280.00 20,799 Badulla Warehouse 0 2 8.64 3 9,390.00 13,519 Vauniya Wholesale Outlet 0 3 33.69 2 14,315.50 44,719 Jaffna Bare Land 1 0 21.65 0 - 11,439 Batticaloa Wholesale Outlet 3 0 11.04 2 5,545.75 51,999 Trincomalee Wholesale Outlet 0 1 38.68 2 4,762.00 36,399 Kalutara No. 2 Warehouse / Premises No. 14 & 16 1 1 4.27 7 20,410.00 60,950 Kaithadi Bare Land 2 0 11.71 0 - 13,000 Colombo 10 Head Office 1 1 15.20 6 30,000.00 647,765 Negombo Wholesale Outlet 0 1 27.50 3 8,576.00 75,280
Melstacorp LimitedAmbalantota Wholesale Outlet - 1 24.16 5 7,657.00 28,710 Anuradhapura Proposed Wholesale Outlet - 3 21.46 3 8,401.00 89,514 Badulla Warehouse - 3 37.20 1 1,522.00 6,030 Beruwala Warehouse 2 1 19.08 12 15,279.50 125,548 Colombo 14 Warehouse 2 1 14.10 8 86,500.00 410,799 Galle Wholesale Outlet - 1 37.00 4 9,879.00 36,711 Katugastota Warehouse - 2 27.50 6 11,798.50 38,167 Katugastota Wholesale Outlet 5 - 3.84 11 28,385.00 123,135 Kurunegala Wholesale Outlet - 2 29.00 2 9,519.00 48,879 Ranala - Nawagamuwa Industrial Building 10 - - 7 83,094.50 231,815 Ratmalana Wholesale Outlet 1 - 28.20 4 30,871.00 178,567 Seeduwa Bare Land 1 2 19.10 0 - 43,208Seeduwa Factory Complex - 1 2.55 1 18,920.00 62,087 Seeduwa Residential Property - - 10.00 1 1,975.00 13,124 Seeduwa Residential Property - - 24.05 1 980.00 26,249 Seeduwa Residential Property - - 12.27 1 1,910.00 26,249 Seeduwa Residential Property - - 31.46 0 - 61,359 Seeduwa Residential Property - - 37.50 0 - 61,879 Seeduwa Residential Property - 2.00 22.00 0 - 44,446 Seeduwa Residential Property - - 18.75 2 2,771.00 61,802 Seeduwa Residential Property - - 22.85 1 1,470.00 61,802 Colombo 10. Residential Property - - 25.94 2 5,642.00 74,892
Melsta Tower (Private) LimitedColombo 10. Bare Land 2 38.75 0 - 405,662 Colombo 10. Bare Land - 0 15.27 0 - 48,318 Colombo 10. Residential Property 1 1.9 2 3,550.00 132,175
Lanka Bell Limited Minuwangoda Warehouse & Switch 1 3 35.35 2 20,920.00 98,650
Texpro Industries Limited Embulgama Factory - 2 - 4,000 Ranala Factory 6 - 6.05 5 92,537.00 173,889 Browns Beach Hotels PLCNegombo Hotel Complex-Under Constructions 6 3 33.50 1 225,347.00 856,500

Annual Report 2014/15 163
Shareholder Information
1. Stock Exchange Listing The Issued Ordinary Shares of the Company are listed with the Colombo Stock Exchange. Ticker Symbol - DIST.N0000 Market Sector - Beverage, Food & Tobacco
2. Distribution of Shareholding
As at 31 March 2015 31 March 2014Holding No. of Share
HoldersTotal Holdings % of Holding No. of Share
HoldersTotal Holding % of Holding
1 to 1,000 8,678 2,844,827 0.95% 8,788 2,937,971 0.98%1,001 to 10,000 1,610 5,223,162 1.74% 1,682 5,481,178 1.83%10,001 to 100,000 244 7,325,766 2.44% 250 7,593,906 2.53%100,001 to 1000,000 65 18,367,339 6.12% 53 14,441,900 4.81%1,000,001 & Over 29 266,238,906 88.75% 25 269,545,045 89.85%
10,626 300,000,000 100.00% 10,798 300,000,000 100.00%
3. Analysis of Shareholding
No. of Share Holders
Holding % of Holding
Individuals 10,351 55,810,172 18.60%Institutions 275 244,189,828 81.40%
10,626 300,000,000 100.00%
Resident 10,479 230,538,039 76.85%Non-Resident 147 69,461,961 23.15%
10,626 300,000,000 100.00%
4. Market Prices
31 March 2015 31 March 2014
Last Traded 240.50 203.00 Highest 246.00 218.00 Lowest 210.50 160.00
Share Price Performance
0
50
100
150
200
250
300
2011 2012 2013 2014 2015

Dist i l ler ies Company of Sr i Lanka PLC164
Shareholder Information
5 Twenty Largest Shareholders
As at 31 March, 2015 2014 Rank Name Share Holding % Share Holding %
1 Milford Exports (Ceylon) (Pvt) Limited 124,470,500 41.49% 124,470,500 41.49%2 Lanka Milk Food (CWE) PLC 37,961,500 12.65% 37,961,500 12.65%3 Mr. Muzaffar Ali Yaseen 25,418,512 8.47% 33,238,000 11.08%4 Mrs. Lorraine Estelle Marlene Yaseen 10,721,177 3.57% 14,350,600 4.78%5 Melstacorp Limited 8,650,732 2.88% 8,650,732 2.88%6 Commercial Bank of Ceylon PLC/L.E.M.Yaseen 4,750,000 1.58% 4,750,000 1.58%7 HSBC International Nominees Ltd-
Morgan Stanley and Co INTL P4,400,000 1.47% - -
8 HSBC INTL NOM LTD – SSBT – Wasatch Frontier Emerging Small COU
4,230,100 1.41% 4,230,100 1.41%
9 Commercial Bank of Ceylon PLC/M.A. Yaseen 4,000,000 1.33% - - 10 Caceis Bank Luxembourg S/A Barca Global Master Fund LP 3,713,286 1.24% 3,713,286 1.24%11 Lahugala Plantation (Pvt) Ltd 3,695,560 1.23% 4,189,590 1.40%12 BNYM SA/NV – Consilium Frontier Equity Fund L.P 2,949,848 0.98% - - 13 Mrs. Shantha Marie Chrysostom 2,847,500 0.95% 2,847,500 0.95%14 Northern Trust CO S/A National Westminister Bank PLC as
Trust C/O Standard Chartered Bank2,800,000 0.93% 2,800,000 0.93%
15 HSBC INTL NOM LTD – MSCO-ROUTE ONE FUND 1, L.P. 2,527,485 0.84% 5,280,944 1.76%16 HSBC International Nominees Ltd- MSCO-Route One
Offshore Master Fund L.P2,468,614 0.82% 4,767,395 1.59%
17 BNYM SA/NV – Blackrock Frontiers Investment Trust PLC 2,287,157 0.76% 1,411,238 0.47%18 Stassen Exports Limited 2,114,200 0.70% 2,114,200 0.70%19 Mr. Don Hasitha Stassen Jayawardena 1,882,833 0.63% 1,882,833 0.63%20 HSBC International Nominees Ltd- MSNY- Bay Pond Partners 1,840,283 0.61% 1,840,283 0.61%
Total 253,729,287 84.58% 258,498,701 86.15%
Percentage of Shares held by the public 42.34% 42.97%Total No. of share holders who hold the public holding 10,619

Annual Report 2014/15 165
Ten Year Summary
In Rs Million - Company 2015 2014 2013 2012 2011 2010 2009 2008 2007 2006
RESULTSGross Turnover 51,800.1 47,755.5 51,548.9 49,135.6 38,987.1 29,964.1 29,569.8 27,416.0 22,653.1 18,399.7Excise Duty 34,883.6 31,057.4 34,087.5 33,859.7 25,464.4 18,979.0 18,339.2 16,458.0 14,020.3 11,263.9Net Turnover 16,916.5 16,698.1 17,461.4 15,275.9 13,522.7 10,985.0 11,230.5 10,958.0 8,632.8 7,135.8Profit/(Loss) Before Tax 13,070.3 8,136.6 9,275.9 6,905.4 9,972.0 4,004.5 3,977.9 3,014.9 2,826.6 2,480.7Profit/(Loss) After Tax 10,284.7 5,357.9 6,872.7 4,297.2 7,768.7 2,815.0 2,682.4 1,981.6 1,868.9 1,807.6FUNDS EMPLOYEDStated Capital 300.0 300.0 300.0 300.0 300.0 300.0 300.0 300.0 300.0 300.0Capital Reserves 1,403.0 2,079.7 2,160.1 2,506.9 2,923.6 107.9 107.9 107.9 107.9 107.9Revenue Reserves & Retained Earnings 48,580.3 41,459.0 36,695.0 29,790.3 21,718.0 14,849.3 12,709.3 10,551.8 8,708.1 7,019.2Shareholders Funds 50,283.3 43,838.7 39,155.1 32,597.2 24,941.7 15,257.2 13,117.2 10,959.7 9,116.0 7,427.1Total Borrowings 6,476.4 10,025.8 8,576.0 9,741.5 254.6 76.2 920.1 2,648.1 1,634.0 2,221.2Non Current Liabilities Net of Borrowings 669.3 171.1 159.6 116.1 270.1 111.4 171.5 109.6 88.0 99.2Current Liabilities Net of Borrowings 7,599.2 7,154.0 8,095.6 20,107.8 6,860.7 5,159.9 4,785.2 4,662.9 4,279.9 3,390.6
65,028.2 61,189.6 55,986.3 62,562.6 32,327.1 20,604.7 18,994.0 18,380.1 15,118.0 13,138.1ASSETS EMPLOYEDNon-Current Assets 57,208.1 48,459.1 45,578.4 54,982.5 20,212.7 14,024.6 12,840.9 12,302.9 10,383.5 10,398.5Current Assets 7,820.1 12,730.5 10,407.9 7,580.1 12,114.4 6,580.1 6,153.1 6,007.5 4,734.4 2,739.6
65,028.2 61,189.6 55,986.3 62,562.6 32,327.1 20,604.7 18,994.0 18,310.4 15,117.9 13,138.1CASHFLOWNet Cashflow from Operating Activities 4,079.8 671.2 3,148.9 1,954.9 4,275.1 2,692.7 1,881.7 2,509.3 1,118.2 1,974.1Net Cashflow from Investing Activities 209.2 (1,569.3) (689.3) (16,037.3) 1,247.0 (661.2) (35.6) (3,041.8) (48.4) (2,662.4)Net Cashflow from Financing Activities (975.0) (2,167.9) (1,535.6) 1,147.0 (875.8) (675.0) (525.0) (465.0) (169.7) (149.7)Net Increase/(Decrease) in Cash & Cash Equivalents
3,314.0 (3,065.9) 924.0 (12,935.4) 4,646.3 1,356.5 1,321.1 (997.5) 900.1 (838.0)
KEY INDICATORSEarnings per Share (Rs.) 15.48* 17.86 10.68* 11.85* 15.08 9.38 8.90 6.60 6.20 6.00Net Assets per Share (Rs.) 167.61 146.13 130.52 108.66 83.14 50.86 43.70 36.50 30.40 24.80Market Value per Share (Rs) Year End 240.50 203.00 166.50 145.00 180.00 118.00 65.00 98.00 105.00 35.00Return on Shareholders’ Funds 9%* 12% 8%* 11%* 31% 18% 21% 18% 21% 24%Dividends per Share (Rs.) 3.25 3.25 3.00 3.00 3.00 2.50 2.25 1.75 1.55 0.60Dividend Payout 21%* 18% 28%* 25%* 20% 27% 25% 27% 25% 10%Dividend Yield 1% 2% 2% 2% 2% 2% 3% 2% 1% 2%
With effect from year ended 31 March 2012 the figures are derived from financial statements prepared in accordance with Sri Lanka Accounting Standards (SLFRS/LKAS). Figures for the remaining periods are derived from financial statements prepared in accordance with previous version of Sri Lanka Accounting Standards (SLAS).
* For the purpose of calculation of EPS for the years ended 31 March 2015, 31 March 2013 and 31 March 2012, the Company profit has been adjusted for intragroup capital gain on assets transfer.

Dist i l ler ies Company of Sr i Lanka PLC166
DCSL Management Team
Head Office
Chief Executive Officer Maximus R. PeriesB.Sc. (Eng), MBA (Merit), LLB (Hons) London, C. Eng. MIEE (London)
Finance DivisionHead of Finance Nimal Nagahawatte B.Sc.Asst. Finance Manager Suranjan LakmanaratchiAsst. Finance Manager Justin Algama B.Sc., Dip. Acc.Manager - IT Ms. P. Gamagedara Dip. (NIBM), AACS
Supplies DivisionHead of Procurement S. Rajanathan
Internal Audit DivisionChief Internal Auditor L. P. Liyanaarachchi FCA, FCMA, Dip.Acc.
Investigation DivisionDirector - Investigations Alfred Wijewardene DIG (Retd.)Dy. Director - Investigations A. X. Clarence Motha ASP (Retd.)Dy. Director - Investigations G. U. J. Vithanage SSP (Retd.)
Company Secretarial & Legal DivisionCompany Secretary & Chief Legal Officer
Ms. V. J. Senaratne Attorney-At-Law & N.P., Solicitor (Eng. & Wales)
Human Resources DivisionHead of Human Resources Ms. Gayathri Chakravarthy
LLB, Attorney-at-LawManager - Human Resources Ms. U. R. Edirisinghe
MBA (Sri J), B.Sc. (HRM) Sp
Asst. Manager - Human Resources T. S. Morawaka B.Sc. (Mgt) Sp
Transport DivisionHead of Transport & Logistics Roshanth Kumar Perera
Stock Control DivisionHead of Inventory Management Lalith Ratnayake MBA (WUSL), B.Sc. (B.Ad) Sp
Consultant - Enactments and Regulations
J. R. de Crusz(Retd. Dy. Commissioner of Excise)
Extra Special Heritage ArenaHead of Extra Special Heritage Arena
Col. Ranjith Rupasinghe (Retd.) RSP, IG(Appointed w.e.f. 03rd August 2015)
Project Engineer D. S. P. Jayawardena M.Sc. (Building Services Engineering), AMCIBSE U.K., Eng. Tec. U.K., MASHRAE U.S.A., Mar.Eng. (DIP)
Senior Production Manager Capt. K. G. N. S. Senanayake SLN (Retd.), MDS, B.Sc., psc
Manager – Engineering Services W. M. U. R. Gunadasa B.Sc. (Eng) (Hons)Manager – Administration N. U. K. De Silva (Former CI of Police)Manager – IT R. Aravinth B.Sc. (Hons)Manager – Distribution H. D. A. C. Herath BA (Sp) (Hons)Assistant Engineer – Civil R. W. D. M. N. Senadheera NCT (Civil)Assistant Security Manager H. M. T. R. B. Herath IP (Retd.)
Regional Offices
Northern Region - SeeduwaHead of Northern Region Maj. R. M. Cabraal (Retd.)Deputy Regional Manager Col. A. M. B. Peiris (Retd.) RWP, MHRP, MBA
(PIM / Sri’J)Deputy Regional Manager Cdr. C. M. Gunanayagam USP (Retd.)
Group Security Manager Deshabandu R. M. L. N. Bandara MBA (USA), SSP (Retd.)
Head of Analytical Division T. D. Ekmon B.Sc. (Hons), M.I.Chem C, Chartered Chemist
Chief Engineer M. N. PereraConsultant - Analytical Procedures
K. Sivarajah B.Sc. (Cey), M.Sc. (UK), F.I Chem. C, Chartered Chemist, (Retd. Govt. Analyst)
Senior Production Manager Capt. K. A. P. Perera SLN (Retd.) RSP, B.Sc. (Defense Studies)
Production Manager S. G. Bandula Silva B.Sc.
Transport Manager Sqn. Ldr. T. S. S. S. Perera (Retd.) B.Sc. (Defense Studies)
Senior Chemist S. M. Sumanasekera B.Sc., M.Sc. (Food Science and Technology) I Chem
Senior Executive - IT Capt. K. V. G. H. Harischandra (Retd.)
Distillery SeeduwaWarehouses New Warehouse, No 3 Warehouse, Old
WarehouseWholesale Outlets Peliyagoda (W), Peliyagoda (S), Rajakadaluwa,
Negombo, Kurunegala
Southern Region - KalutaraHead of Southern Region Maj. Gen. Jagath Rambukpotha (Retd.)
RSP, USP (Appointed w.e.f. 03rd August 2015)
Senior Production Manager A. D. AmaradevaChemist W. A. I. Wickramasinghe A.I. Chem C, Grad
Chem, Dip in POM
Asst. Engineer H. P. D. P. Mangala GunasekaraManager (Beruwala Distillery) C. E. NanayakkaraDistillery BeruwalaWarehouses Kalutara No 01 & Kalutara No 02,
Teak Store, MirishenaWholesale Outlets Kalutara, Ratmalana, Ambalantota, Galle, Kuruwita
Central Region - KandyHead of Central Region Brig. Aruna Wijewickrama (Retd.) USP, PQHRM (IPM)
Senior Deputy Regional Manager Capt. Chula Ranasinghe USP - SLN (Retd.)Senior Production Manager V. Jeiyachandiran B.Sc. (Hons)
Production Manager N. Thiranagama B.Sc.
Consultant - Quality Control W. W. M. S. U. Wijayarathna B.Sc. (Hons), M.Phil, Chartered Chemist
Civil Engineer A. M. A. J. B. AbeykoonSenior Executive-Operations/IT M. R. I. K. Bandara B.Sc. (Hons)
Asst. Accountant Mrs. W. M. P. PereraWarehouse NawayalatennaWholesale Outlets Katugastota, Gampola, Vavuniya, Batticaloa, Minneriya,
Dickoya, Trincomalee, Jaffna, Anuradhapura
Uva Region - BadullaHead of Uva Region Capt. Ranjith Wettewa SLN (Retd.) RSP, P.S.N.
Warehouse BadullaWholesale Outlet Badulla
Group Management DivisionGroup Financial Controller Cleetus Mallawaarachchi FCA, FCMA, MBA
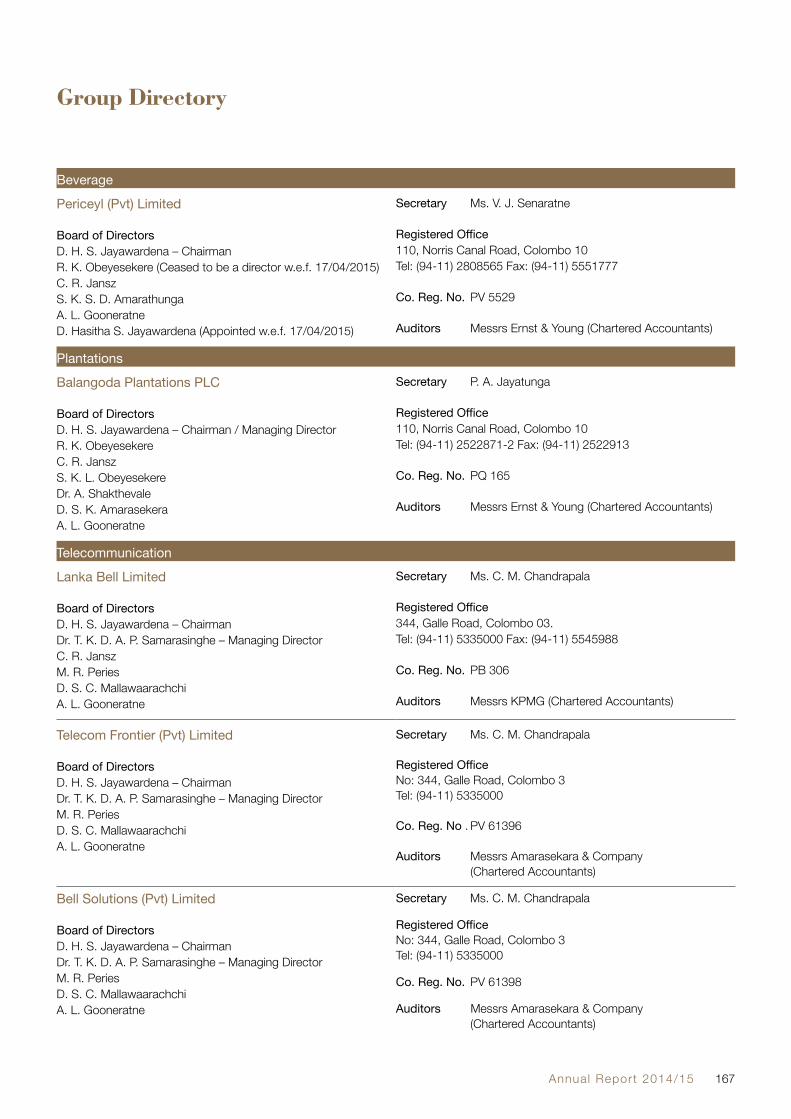
Annual Report 2014/15 167
Group Directory
Beverage
Periceyl (Pvt) Limited
Board of DirectorsD. H. S. Jayawardena – ChairmanR. K. Obeyesekere (Ceased to be a director w.e.f. 17/04/2015)C. R. JanszS. K. S. D. AmarathungaA. L. GooneratneD. Hasitha S. Jayawardena (Appointed w.e.f. 17/04/2015)
Secretary Ms. V. J. Senaratne
Registered Office110, Norris Canal Road, Colombo 10Tel: (94-11) 2808565 Fax: (94-11) 5551777
Co. Reg. No. PV 5529
Auditors Messrs Ernst & Young (Chartered Accountants)
Plantations
Balangoda Plantations PLC
Board of DirectorsD. H. S. Jayawardena – Chairman / Managing DirectorR. K. ObeyesekereC. R. JanszS. K. L. ObeyesekereDr. A. ShakthevaleD. S. K. AmarasekeraA. L. Gooneratne
Secretary P. A. Jayatunga
Registered Office110, Norris Canal Road, Colombo 10Tel: (94-11) 2522871-2 Fax: (94-11) 2522913
Co. Reg. No. PQ 165
Auditors Messrs Ernst & Young (Chartered Accountants)
Telecommunication
Lanka Bell Limited
Board of DirectorsD. H. S. Jayawardena – ChairmanDr. T. K. D. A. P. Samarasinghe – Managing DirectorC. R. Jansz M. R. PeriesD. S. C. Mallawaarachchi A. L. Gooneratne
Secretary Ms. C. M. Chandrapala
Registered Office344, Galle Road, Colombo 03.Tel: (94-11) 5335000 Fax: (94-11) 5545988
Co. Reg. No. PB 306
Auditors Messrs KPMG (Chartered Accountants)
Telecom Frontier (Pvt) Limited
Board of DirectorsD. H. S. Jayawardena – ChairmanDr. T. K. D. A. P. Samarasinghe – Managing DirectorM. R. PeriesD. S. C. MallawaarachchiA. L. Gooneratne
Secretary Ms. C. M. Chandrapala
Registered OfficeNo: 344, Galle Road, Colombo 3Tel: (94-11) 5335000
Co. Reg. No . PV 61396
Auditors Messrs Amarasekara & Company (Chartered Accountants)
Bell Solutions (Pvt) Limited
Board of DirectorsD. H. S. Jayawardena – ChairmanDr. T. K. D. A. P. Samarasinghe – Managing DirectorM. R. PeriesD. S. C. MallawaarachchiA. L. Gooneratne
Secretary Ms. C. M. Chandrapala
Registered OfficeNo: 344, Galle Road, Colombo 3Tel: (94-11) 5335000
Co. Reg. No. PV 61398
Auditors Messrs Amarasekara & Company (Chartered Accountants)

Dist i l ler ies Company of Sr i Lanka PLC168
Diversified Holdings
Melstacorp Limited
Board of DirectorsD. H. S. Jayawardena – ChairmanA. L. Gooneratne – Managing DirectorR. K. Obeyesekere (Ceased to be a director w.e.f. 20/02/2015)C. R. JanszN. de. S. Deva AdityaCapt. K. J. Kahanda (Retd.)C. F. Fernando (Deceased on 15/11/2014)Dr. A. N. BalasuriyaD. Hasitha S. Jayawardena (Appointed w.e.f. 02/01/2015)Ms. V. J. Senaratne (Alternate to N. de. S. Deva Aditya)
Secretaries P. W. Corporate Secretarial (Pvt) Limited
Registered Office110, Norris Canal Road, Colombo 10Tel: (94-11) 5696794Web : www.melsta.com
Co. Reg. No. PV 11755 PB
Auditors Messrs KPMG (Chartered Accountants)
Milford Holdings (Pvt) Limited
Board of DirectorsD. H. S. Jayawardena – ChairmanR. K. ObeyesekereC. R. JanszCapt. K. J. Kahanda (Retd.)
Secretaries P. W. Corporate Secretarial (Pvt) Limited
Registered Office110, Norris Canal Road, Colombo 10Tel: (94-11) 2695295-7 Fax: (94-11) 2696360
Co. Reg. No. PV 5944
Auditors Messrs KPMG (Chartered Accountants)
Browns Beach Hotels PLC
Board of DirectorsD. H. S. Jayawardena – ChairmanM. V. TheagarajahJ. M. S. BritoS. M. HapugodaT. D. U. D. PeirisA. L. Gooneratne
Secretaries Aitken Spence Corporate Finance (Private) Limited
Registered Office315, Vauxhall Street, Colombo 02Tel: (94-11) 2308308 Fax: (94-11) 2308099
Co. Reg. No. PQ 202
Auditors Messrs KPMG (Chartered Accountants)
Texpro Industries Limited
Timpex (Pvt) LimitedBoard of DirectorsD. H. S. Jayawardena – ChairmanJ. D. Peries – Managing DirectorH. I. MunasinghaA. L. GooneratneD. S. C. Mallawaarachchi
Secretaries SSP Corporate Services (Pvt) Limited
Registered Office1st Floor, Lakshman’s Building, 321,Galle Road, Colombo 3Tel: (94-11) 2565951
Co. Reg. No. PB 748
Auditors Messrs KPMG (Chartered Accountants)
Group Directory

Annual Report 2014/15 169
Diversified Holdings (contd.)Melsta Logistics (Pvt) Limited
Board of DirectorsA. L. Gooneratne – ChairmanA. M. J. AbeysingheT. Q. FernandoM. R. Peries D. S. C. Mallawarachchi
Secretaries P. W. Corporate Secretarial (Pvt) Limited
Registered Office160, Negombo Road, SeeduwaTel: (94-11) 5223300 Fax: (94-11) 5223322Web: www.crc.lk
Co. Reg. No. PV 14051
Auditors Messrs Amarasekara & Company (Chartered Accountants)
Continental Insurance Lanka Ltd.
Board of DirectorsG. D. C. de Silva - Managing DirectorA. S. AbeyewardeneC. F. Fernando (Deceased on 15/11/2014)A. L. GooneratneA. M. De S. Jayaratne (Appointed w.e.f. 01/09/2014)
Secretaries P. W. Corporate Secretarial (Pvt) Limited
Registered Office79, Dr. C. W. W. Kannangara Mawatha, Colombo 07Tel : (94-11) 5200300Co. Reg. No. PB 3784
Auditors Messrs KPMG (Chartered Accountants)
Splendor Media (Pvt) Limited
Board of DirectorsMs. D. S. T. Jayawardena – ChairpersonMs. G. ChakravarthyN. N. NagahawatteO. A. R. P. ObeysingheP. Hennayake (Resigned w.e.f. 11/11/2014)A. P. L. Fernando (Resigned w.e.f.13/11/2014)
Secretaries P. W. Corporate Secretarial (Pvt) Limited
Registered Office110, Norris Canal Road, Colombo 10Tel: (94- 11) 5 639 501 Fax: (94-11) 5 373 344
Co. Reg. No. PV1230
Auditors Messrs Amarasekara & Company (Chartered Accountants)
Bogo Power (Pvt) Limited
Board of DirectorsD. H. S. Jayawardena – ChairmanDr. N. M. Abdul GaffarS. K. L. ObeyesekereA. L. Gooneratne
Secretary P. A. Jayatunga
Registered Office833, Sirimavo Bandaranaike Mawatha, Colombo 14Tel: (94-11) 2522871-2 Fax: (94-11) 2522913
Co. Reg. No. PV 64901
Auditors Messrs Ernest & Young (Chartered accountants)
Bellvantage (Pvt) Limited
Board of DirectorsA. L. Gooneratne – ChairmanP. KarunanaykeD. S. C. MallawaarachchiMs. S. A. Atukorale (Resigned w.e.f. 30/05/2014)
Secretaries P. W. Corporate Secretarial (Pvt) Limited
Registered Office33, Park Street, Colombo 02Tel: (+94-11)-5753753 Fax: (+94-11)-5753754E-mail : [email protected] : www.bellvantage.com
Co. Reg. No. PV 65022
Auditors Messrs Amarasekara & Company (Chartered Accountants)

Dist i l ler ies Company of Sr i Lanka PLC170
Diversified Holdings (contd.)
Melsta Regal Finance Limited
Board of DirectorsA. L. Gooneratne – ChairmanD. M. N. P. Karunapala- CEOL. P. LiyanarachchiN. A. RodrigoK. D. BernardM. S. J. D. CooreyD. S. C. MallawaarachchiJ. M. T. GalgamuwaMs. S. A. AtukoraleB. A. S. P. S. Balasuriya (Appointed w.e.f. 26/08/2014)
Secretaries P. W. Corporate Secretarial (Pvt) Limited
Registered Office110, Norris Canal Road, Colombo 10Tel: (94-11) 268 2742-3, 5288571 Fax: (94-11) 268 2741Web : www.melstaregalfinance.lk
Co. Reg. No. PB 878
Auditors Messrs KPMG (Chartered Accountants)
Melsta Properties (Private) Limited
Board of DirectorsC. F. Fernando (Deceased on 15/11/2014)Capt. K. J. Kahanda (Retd.)S. RajanathanR. R. P. L. S. Ratnayake
Secretaries: Financial Services and Commercial Agencies (Pvt) Ltd.
Registered Office110, Norris Canal Road, Colombo 10Tel: (94-11) 5288625 Fax : (94-11) 2695794
Co. Reg. No. PV 78422
Auditors Messrs KPMG (Chartered Accountants)
Melsta Towers (Pvt) Ltd
Board of DirectorsA. L. GooneratneM. R. Peries Ms. S. A. AtukoraleD. S. C. Mallawaarachchi
Secretaries: Financial Services and Commercial Agencies (Pvt) Ltd.
Registered Office110, Norris Canal Road, Colombo 10Tel: (94-11) 5288625 Fax : (94-11) 2695794
Co. Reg. No. PV 90157
Auditors Messrs KPMG (Chartered Accountants)
Melsta Technologies (Pvt) Ltd
Board of DirectorsB. A. S. P. S. Balasuriya B. K. J. P. Rodrigo (Managing Director)P. KarunanaykeD. A. C. PeirisD. M. Welikandage
Secretaries P. W. Corporate Secretarial (Pvt) Limited
Registered Office110, Norris Canal Road, Colombo 10Tel: (94-11) 5288625 Fax : (94-11) 2695794
Co. Reg. No. PV 104028
Auditors Messrs KPMG (Chartered Accountants)
Group Directory

Annual Report 2014/15 171
Diversified Holdings (contd.)
Pelwatte Sugar Industries PLC
Board of DirectorsD. H. S. JayawardenaCapt. K. J. Kahanda (Retd.)M. R. PeriesR. WettewaD. A. de S. WickramanayakeD. H. J. GunawardenaC. S. WeeraratneD. A. E. de S. WickramanayakeK. K. U. Wijeyesekera
Secretaries Managers & Secretaries (Pvt) Limited
Registered Office27, Melbourne Avenue, Colombo 04Tel: (94-11) 2589390 Fax: (94-11) 2500674
Co. Reg. No. PV 14051
Auditors Messrs Ernst & Young (Chartered Accountants)
Pelwatte Sugar Distilleries (Pvt) Limited
Board of DirectorsCapt. K. J. Kahanda (Retd.) - Managing DirectorM. R. PeriesD. A. de S. Wickramanayake
Secretaries Managers & Secretaries (Pvt) Limited
Registered Office27, Melbourne Avenue, Colombo 04Tel: (94-11) 2589390 Fax: (94-11) 2500674
Co. Reg. No. PV 10221
Auditors Messrs Ernst & Young (Chartered Accountants)
Pelwatte Agriculture & Engineering Services (Pvt) Limited
Board of DirectorsD. A. de S. WickramanayakeC. S. Weeraratne
Secretaries Managers & Secretaries (Pvt) Limited
Registered Office27, Melbourne Avenue, Colombo 04 Tel: (94-11) 2589390 Fax: (94-11) 2500674
Co. Reg. No. PV 66850
Auditors Messrs Ernst & Young (Chartered Accountants)
Associates
Aitken Spence PLC
Board of DirectorsD. H. S. Jayawardena – ChairmanJ. M. S. Brito – Managing & Finance DirectorDr. R. M. FernandoDr. M. P. DissanayakeMs. D. S. T. Jayawardena G. C. WickremasingheC. H. GomezN. de S. Deva AdityaV. M. FernandoR. N. Asirwatham
Secretary R. E. V. Casie Chetty
Registered Office315, Vauxhall Street, Colombo 02Tel: (94-11) 2308308 Fax : (94-11) 2445406Web: www.aitkenspence.com
Co. Reg. No. PQ 120
Auditors Messrs KPMG (Chartered Accountants)
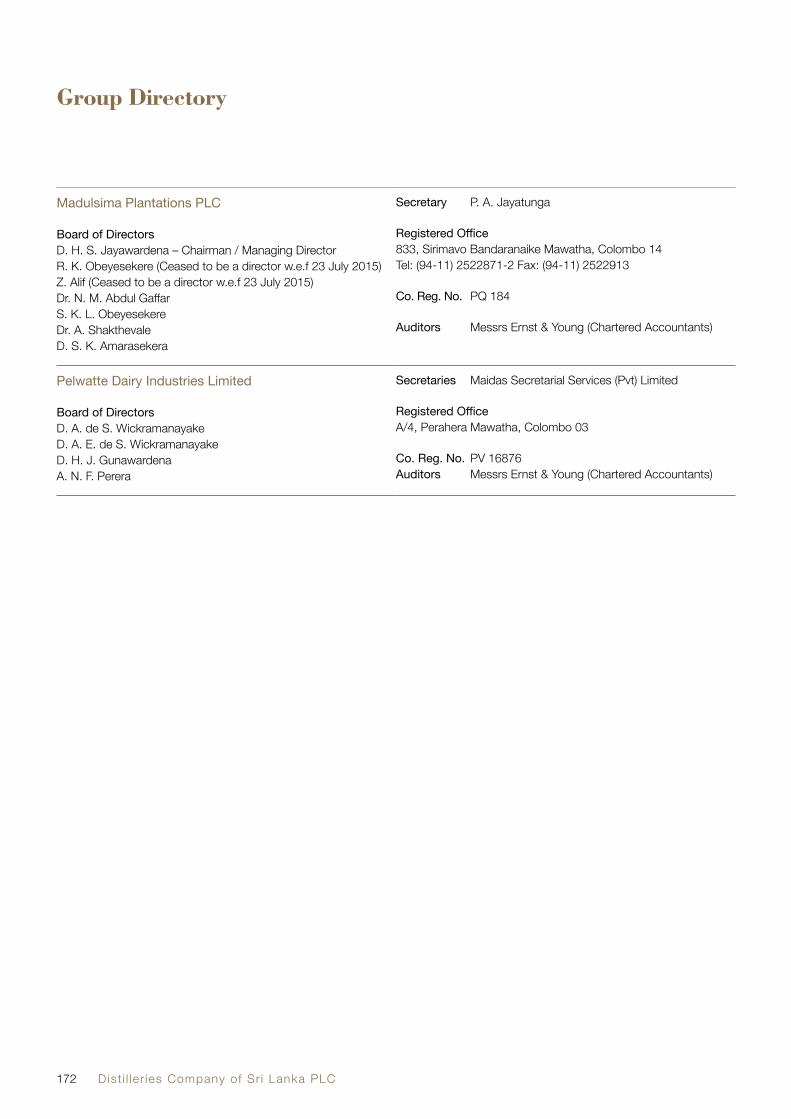
Dist i l ler ies Company of Sr i Lanka PLC172
Group Directory
Madulsima Plantations PLC
Board of DirectorsD. H. S. Jayawardena – Chairman / Managing DirectorR. K. Obeyesekere (Ceased to be a director w.e.f 23 July 2015)Z. Alif (Ceased to be a director w.e.f 23 July 2015)Dr. N. M. Abdul GaffarS. K. L. Obeyesekere Dr. A. ShakthevaleD. S. K. Amarasekera
Secretary P. A. Jayatunga
Registered Office833, Sirimavo Bandaranaike Mawatha, Colombo 14Tel: (94-11) 2522871-2 Fax: (94-11) 2522913
Co. Reg. No. PQ 184
Auditors Messrs Ernst & Young (Chartered Accountants)
Pelwatte Dairy Industries Limited
Board of DirectorsD. A. de S. WickramanayakeD. A. E. de S. WickramanayakeD. H. J. GunawardenaA. N. F. Perera
Secretaries Maidas Secretarial Services (Pvt) Limited
Registered OfficeA/4, Perahera Mawatha, Colombo 03
Co. Reg. No. PV 16876Auditors Messrs Ernst & Young (Chartered Accountants)

Annual Report 2014/15 173
Notice of Meeting
NOTICE IS HEREBY GIVEN that the TWENTY FIFTH ANNUAL GENERAL MEETING OF DISTILLERIES COMPANY OF SRI LANKA PLC will be held at the Sri Lanka Foundation Institute on 21st September 2015 at 10.00 a.m. for the following purposes.
1. To receive and consider the Annual Report of the Directors and the Financial Statements of the Company for the year ended 31st March 2015.
2. To approve a final dividend as recommended by the Board of Directors.
3. To re elect Capt. K. J. Kahanda who retires by rotation at the Annual General Meeting in terms of Article 92 of the Articles of Association , as a Director of the Company.
4. To re elect Dr. A. N. Balasuriya who retires by rotation at the Annual General Meeting in terms of Article 92 of the Articles of Association, as a Director of the Company.
5. To re elect Mr. D. Hasitha S. Jayawardena who retires at the Annual General Meeting in terms of Article 98 of the Articles of Association, as a Director of the Company.
6. To re elect as a Director, Mr. D. H. S. Jayawardena,who is over the age of 70 years and who retires in terms of Section 210 of the Companies Act No. 07 of 2007,by passing the following resolution.
“RESOLVED that Mr. D. H. S. Jayawardena,who attained the age of 70 on 17th August 2012 be and is hereby re-elected as a Director of the Company ,and it is hereby declared that the age limit of 70 years referred to in Section 210 of the Companies Act No.07 of 2007 shall not apply to the said Director.”
7. To authorise the Directors to determine contributions to charities.
8. To authorise the Directors to determine the remuneration of the Auditors, Messrs. KPMG who are deemed to have been reappointed as Auditors in terms of Section 158 of the Companies Act No. 07 of 2007.
By Order of the Board,
Ms.V.J.SenaratneCompany Secretary
25 August 2015Colombo.
Notes:
1. A member is entitled to attend and vote at the meeting or to appoint a proxy to attend and vote on behalf of him/her by completing the Form of Proxy enclosed herewith.
2. A Proxy need not be a member of the Company.
3. The completed Form of Proxy should be deposited at the Registered Office of the Company at 110,Norris Canal Road, Colombo 10, before 10:00 a.m. on 19th September 2015.
The Dividend warrants will be posted within seven market days, if the dividend proposed is approved at the Annual General Meeting. In accordance with the rules of the Colombo Stock Exchange, the shares of the Company will be quoted ex-dividend with effect from 2015.
THE SHAREHOLDERS AND THE PROXY HOLDERS ATTENDING THE MEETING ARE KINDLY REQUESTED TO BE IN THEIR SEATS BY 9.45A.M.THEY ARE ALSO REQUESTED TO BRING THIS ANNUAL REPORT, ALONG WITH AN ACCEPTABLE FORM OF IDENTITY.

Dist i l ler ies Company of Sr i Lanka PLC174
Notes

Annual Report 2014/15 175
Form of Proxy
Folio No.
I/We ...................................................................................................................................................................................................
of ........................................................................................................................................................................... being a member / members of the Distilleries Company of Sri Lanka PLC hereby appoint Don Harold Stassen Jayawardena* or failing him Cedric Royle Jansz* or failing him Niranjan de Silva Deva Aditya* or failing him Kolitha Jagath Kahanda* or failing him Adrian Naomal Balasuriya* or failing him Don Hasitha Stassen Jayawardena*
or ......................................................................................................................................................................................................
of .......................................................................................................................................................................................................as my/our* Proxy to represent me/us* and vote for me/us* on my/our* behalf at the Extra Ordinary General Meeting of the Company to be held on the 21st September 2015 and at any adjournment thereof and at every poll which may be taken in consequent thereof.
* Please delete the inappropriate words.** Please write your Folio Number which is given on the top left of the address sticker …………………………………… Signature of Shareholder Dated this ……………………day of …………….2015.
Notes:1. Proxy need not be a member of the Company.
2. In terms of the Article 71 of the Article of Association of the Company.
The instrument appointing a Proxy shall be in writing under the hand of the appointer or his attorney duly authorised in writing, or where the appointer is a corporation, either under seal, or under the hand of an officer or attorney duly authorised. A Proxy need not be a member of the Company.
3. In terms of Article 71 of the Articles of Association of the Company.
The instrument appointing a Proxy and the Power of Attorney or other authority, if any, under which it is signed or notarially certified copy of that power of attorney shall be deposited at the registered office of the Company or at such other place within Sri Lanka as is specified for the purpose in the notice convening the meeting not later than 48 hours before the time of the holding of the meeting or adjourned meeting at which the person named in the instrument proposes to vote or in the case of the poll, not later than 24 hours before the time appointed for the taking of the poll and in default the instrument of Proxy shall not be treated as valid.
4. In terms of Article 66 of the Articles of Association of the Company.
In case of the Joint holders the votes of the senior who tenders a vote, whether in person or by Proxy, shall be accepted to the exclusion of the votes of the other joint-holders; and for this purpose seniority shall be determined by the order in which the names stand in the register of members.
The first joint-holder thereby has power to sign the Proxy without the consent of the other joint holder.
5. Instructions as to completion are noted overleaf.

Dist i l ler ies Company of Sr i Lanka PLC176
Instructions as to completion Kindly perfect the Form of Proxy, after filling in legibly your full name and address, by signing on the space provided and filling in
the date of signature.
Kindly return the completed Form of Proxy to the Company after deleting one or other of the alternate words indicated by an asterisk.
To be valid the completed Form of Proxy should be deposited at the Registered Office of the Company at No.110, Norris Canal Road, Colombo-10, not later than 48 hours before the time appointed for the holding of the meeting.
Every alteration or addition to the Form of Proxy must be duly authenticated by the full signature of the shareholder signing the Form of Proxy. Such signature should as far as possible be placed in proximity to the alteration or addition intended to be authenticated.

Annual Report 2014/15 177
Attendance Slip
Distilleries Company of Sri Lanka PLCPQ 112110, Norris Canal Road, Colombo 10, Sri Lanka.
I / We hereby record my / our presence at the Twenty Fifth Annual General Meeting of the Distilleries Company of Sri Lanka PLC at the Sri Lanka Foundation Institute on 21st September 2015 at 10.00 a.m.
1. Full Name of Shareholder : ...................................................................................................................................... (In Capital Letters please)
2. Shareholder’s NIC No./Passport No. : ......................................................................................................................................
3. Number of Shares held and Folio No. : ......................................................................................................................................
4. Name of Proxy Holder : ......................................................................................................................................
5. Proxy Holder’s NIC No./Passport No. : ......................................................................................................................................
6. Signature of Attendee : ......................................................................................................................................
Notes1. Shareholders / Proxy Holders are requested to bring this Attendance Slip with them when attending the meeting and hand it over
at the entrance to the meeting hall after signing it.
2. Shareholders are also kindly requested to indicate any changes in their addresses / names by completing the following and forward same to the registered office 110, Norris Canal Road, Colombo 10, if not attending the meeting.
Name of the Shareholder : ............................................................................................................................................................
Certificate No. : ............................................................................................................................................................
Previous Address : ............................................................................................................................................................
Present Address : ............................................................................................................................................................
Any changes to the Name : ............................................................................................................................................................


Annual Report 2014/15 179
fuu jdr®;dj iïmQr®Kfhkau ms<sfh, lr we;af;a bx.%Sis NdIdfjks' Tng iNdm;s;=udf.a m◊jqvh"
wOHlaIljrekaf.a jdr®Isl jdr®;dj iy ú.Kl jdr®;dj isxy, fyda fou< NdIdfjka ilik ,o
m˙jr®;khla wjYH kï" ta nj f,alï" äiaá,¯ia fldïmeks Tµa Y%S ,xld mSt,aiS wxl 110" fkd˙ia
lek,a mdr" fld<U 10 hk ,smskhg 2015" iema;eïnr® ui 14 fjks †kg m%:u okajkak'
,t;twpf;if KOikahf Mq;fpyj;jpy; cs;sJ. jiythpd; nra;jp> gzpg;ghsh; rigapd;
tUlhe;j mwpf;if> fzf;fha;thshpd; mwpf;if> Mfpatw;wpd; rpq;fsk; my;yJ jkpo;
nkhopngah;g;G Ntz;Lkhapd;> jaTnra;J fbjk; %yk; gpd;tUk; tpyhrj;jpw;F>
2015> nrg;nlk;gH khjk; 14 jpfjpf;F Kd; mwptpf;fTk;. nrayhsh;> b];byhP]; fk;gdp xg;
=yq;fh gp.vy;.rp> ,yf;fk; 110> nehhp]; nfdy; tPjp> nfhOk;G 10.
This report is entirely in English. If you require a translated copy of The Chairman’s Message, Annual Report of the Board of Directors and The Auditor’s Report in Sinhala or Tamil, please make
a request by letter addressed to the Secretary, Distilleries Company of Sri Lanka PLC, No. 110, Norris Canal Road, Colombo 10 on or before 14th day of September 2015.
