distribu statement a
TRANSCRIPT

THIS REPORT HAS BEEN DELIMITED
AND CLEARED FOR PUBLIC RELEASE
UNDER DOD DIRECTIVE 5200.20 AND
NO RESTRICTIONS ARE IMPOSED UPON
ITS USE AND DISCLOSURE.
DISTRIBU™ STATEMENT A
APPROVED FOR PUBLIC RELEASE;
DISTRIBUTION UNLIMITED,

mCLASSIFIED if1 \u
FNSE DOCUMENTATION CENTER FOR
ENTIFIC AND TECHNICAL INFORMATION
CAMERON STATION ALEXANDRIA. VIRGINIA
mm ^m/ß
UNCLASSIFIED

NOTICE: When government or other drawings, speci- fications or other data are used for any purpose other than in connection with a definitely related government procurement operation, the U. S. Government thereby incurs no responsibility, nor any obligation whatsoever; and the fact that the Govern- ment may have formulated, furnished, or in any way supplied the said drawings, specifications, or other data is not to be regarded by implication or other- wise as in any manner licensing the holder or any other person or corporation, or conveying any rights or permission to manufacture, use or sell any patented invention that may in apyjjay be related thereto.

i
^r
CO
UJ ( CD Z o —i r
I
I I I i I i
ROTOR BLADE RADAR ANTENNA PHASE II
INTERIM TECHNICAL REPORT
NO. 299-099-275
462744
ilk BELL HELICORTER COMRANY
FORT WORTH . TEXAS
DIVISION OF BELL AEROSPACE CORPORATION • A teXtTOIll COMPANY

@ BELL
HELiCORTER COMPANY
DIVISION OF BELL AEROSPACE CORPORATION - 19X1 fOn | COMP
I
i
i
JANAIR
JOINT ARMY-NAVY AIRCRAFT INSTRUMENTATION RESEARCH
ROTOR BLADE RADAR ANTENNA REPORT PHASE II
Interim Technical Report
299-099-275
February 19 65
I
I
|
APPROVED:
H Ü TTn-t-onU
By
j^JOU-ULU £-' \\ouLn^ Japrfes E. Palmer p/oject Engineer
±H^_
David W. Yoi! David W. Young and Associates, Inc,
H. W. Uptorf- Chief Electronics Research Engineer
H. W. Mitchell Chief Electronics Engineer
N OFFICE OF NAVAL RESEARCH Contract Nonr 4148(00)
V ^ ikt//

I
i
'
I
I
I
I I
I
i
i
This report presents work which was performed under the Joint Array-Navy Aircraft Instrumentation Research (JANAIR) Project, a research and development program directed by the United States Navy, Office of Naval Research. Special guidance is provided to the program for the Army Material Command, the Office of Naval Research and the Bureau of Naval Weapons through an organization known as the JANAIR Committee. The Committee is currently composed of the following representatives
U. S. Navy, Office of Naval Research CAPT J. D. Kuser
U. S. Navy, Bureau of Naval Weapons CDR W. A. Engdahl
U. S. Army, Material Command Mr. Len Evenson
The goals of JANAIR are:
a. The Joint Array-Navy Aircraft Instrumentation Research (JANAIR) Project, is a research project, the objective of which is to improve the state of the art of piloted aircraft instru- mentation.
b. The JANAIR Project is to be responsive to specific problems assigned, and shall provide guidance for aircraft instrumentation research and development programs.
c. The JANAIR Project will conduct feasibility studies and develop concepts in support of service requirements.
d. These efforts shall result in reports and the knowl- edge to form the basis for development of improved instru- mentation systems, components, and subsystems.
11
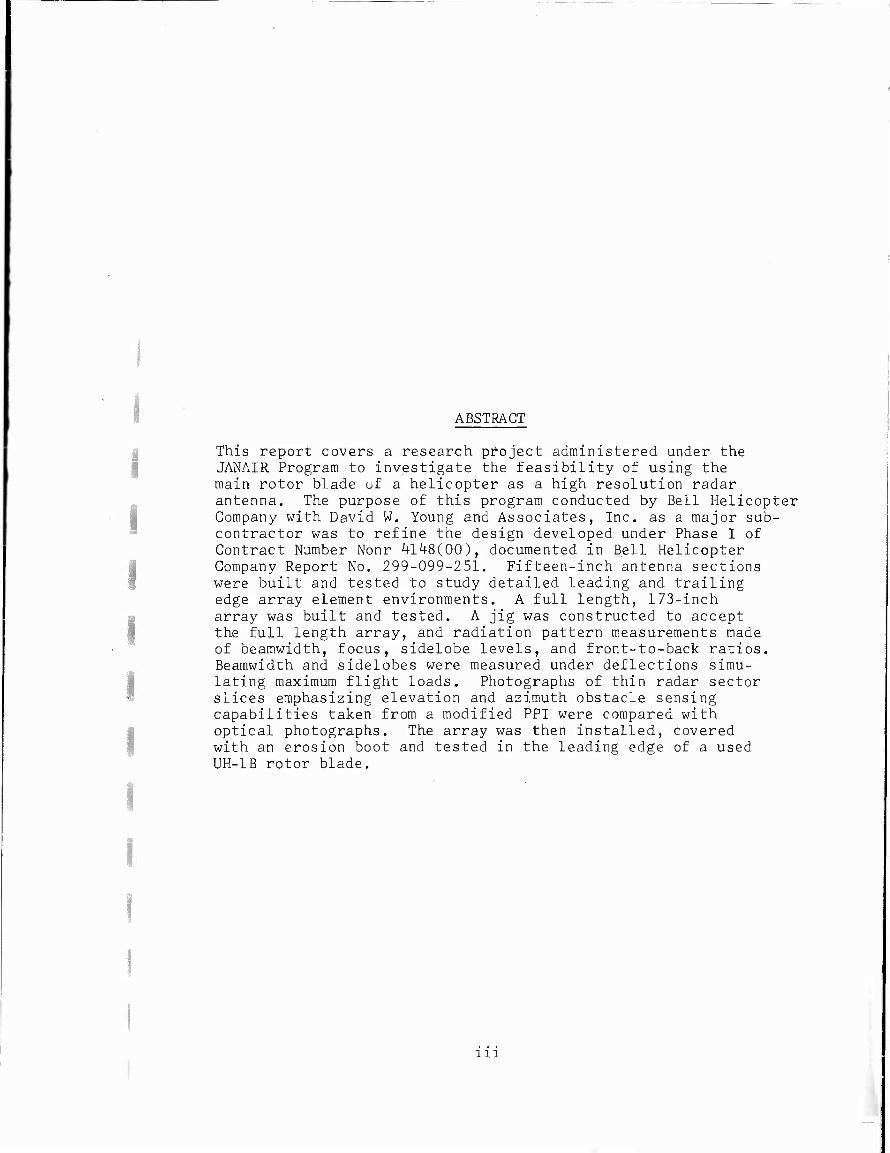
ABSTRAGT
SThis report covers a research project administered under the JANAIR Program to investigate the feasibility of using the main rotor blade of a helicopter as a high resolution radar (antenna. The purpose of this program conducted by Bell Helicopter
Company with David W. Young and Associates, Inc. as a major sub- contractor was to refine the design developed under Phase I of Contract Number Nonr 4148(00), documented in Bell Helicopter Company Report No. 299-099-251. Fifteen-inch antenna sections were built and tested to study detailed leading and trailing edge array element environments. A full length, 173-inch
I array was built and tested. A jig was constructed to accept the full length array, and radiation pattern measurements made of beamwidth, focus, sidelobe levels, and front-to-back ratios. Beamwidth and sidelobes were measured under deflections simu- lating maximum flight loads. Photographs of thin radar sector slices emphasizing elevation and azimuth obstacle sensing capabilities taken from a modified PPI were compared with optical photographs. The array was then installed, covered with an erosion boot and tested in the leading edge of a used UH-1B rotor blade.
111

TABLE OF CONTENTS
i
Page
I. INTRODUCTION 1
II. SUMMARY 3
III. ARRAY TECHNIQUE 5
IV. FRONT TO BACK RATIO 15
V. 173.3 INCH ARRAY DESIGN 22
VI. EFFECTS OF FOCUSING 29
VII. RADAR AND OPTICAL PHOTOGRAPHIC COMPARISONS 32
III. PERMANENT ARRAY INSTALLATION 40
APPENDIX I 51
PPI Display 52
STC Circuit 54
References 61
JANAIR DISTRIBUTION LIST 62
IV

i
i
1 13
14
15
16
17
18
LIST OF ILLUSTRATIONS
Figure Page
1 Band Width Pattern of 50-Inch Array Section, Unmounted 8
2 Band Width Pattern of 50-Inch Array Section, Mounted in Rotor Blade Nose Block 9
3 Broad Band Gain Characteristics of 50-Inch Array Section 10
4 Beam Angle in Degrees End-fire From Broadside 11
5 50-Inch Array Section Pattern, Uniform Power Distribution 12
6 50-Inch Array Section Pattern, Uniform Power Distribution Expanded Azimuth Scale 13
7 Azimuth Pattern, Final Configuration 50-Inch Array Section Ik
8 15-Inch Rotor Blade Section Showing Early Antenna Configuration 17
9 Cross Section 15-Inch Rotor Blade Showing Early Leading and Trailing Edge Installations 18
10 Elevation Pattern, 15-Inch Final Configuration, Leading Edge Array 19
11 Elevation Pattern 15-Inch Leading Edge Array Without Erosion Boot 20
12 Elevation Pattern Typical 15-Inch Trailing Edge Blade Section 21
Coupling Curve for Taylor Distribution 23
Equipment Layout Used for Pattern Tests 24
Optical Photograph of Radar Test Sites 25
One Mile Azimuth Pattern 173-Inch Array 26
Azimuth Pattern - Expanded 27
Rayleigh Range Azimuth Pattern 173-Inch Array 28

LIST OF ILLUSTRATIONS (Cont'd)
Figure Page
19 Azimuth Pattern 173-Inch Array Focused at 300 Feet 30
20 Theoretical and Measured Beamwidths of 173-Inch Antenna 31
21 Equipment Layout for Radar PPI Data Tests 33
22 Optical Photograph, Oat Mountain, Stony Point Area 34
23 Radar Photographs of Oat Mountain and Stony Point Area Using Gross Beam Detection 35
24 Optical Photograph of Obstacle Test Area 36
25 Radar Cross Beam Obstacle Detection Data From Figure 24 37
26 Optical Photograph, Cornfield, Obstacles, etc. 38
27 Radar Cross Beam Detection Dpta From Figure 25 39
28 Cross Section of Rotor Blade Showing Antenna Slot 43
29 Work Aid Used to Slot Rotor Blade 44
30 Radar Antenna Array Being Positioned Into Blade Slot 45
31 Radar Antenna installed in Rotor Blade 46
32 Specimen of Composite Erosion Boot 47
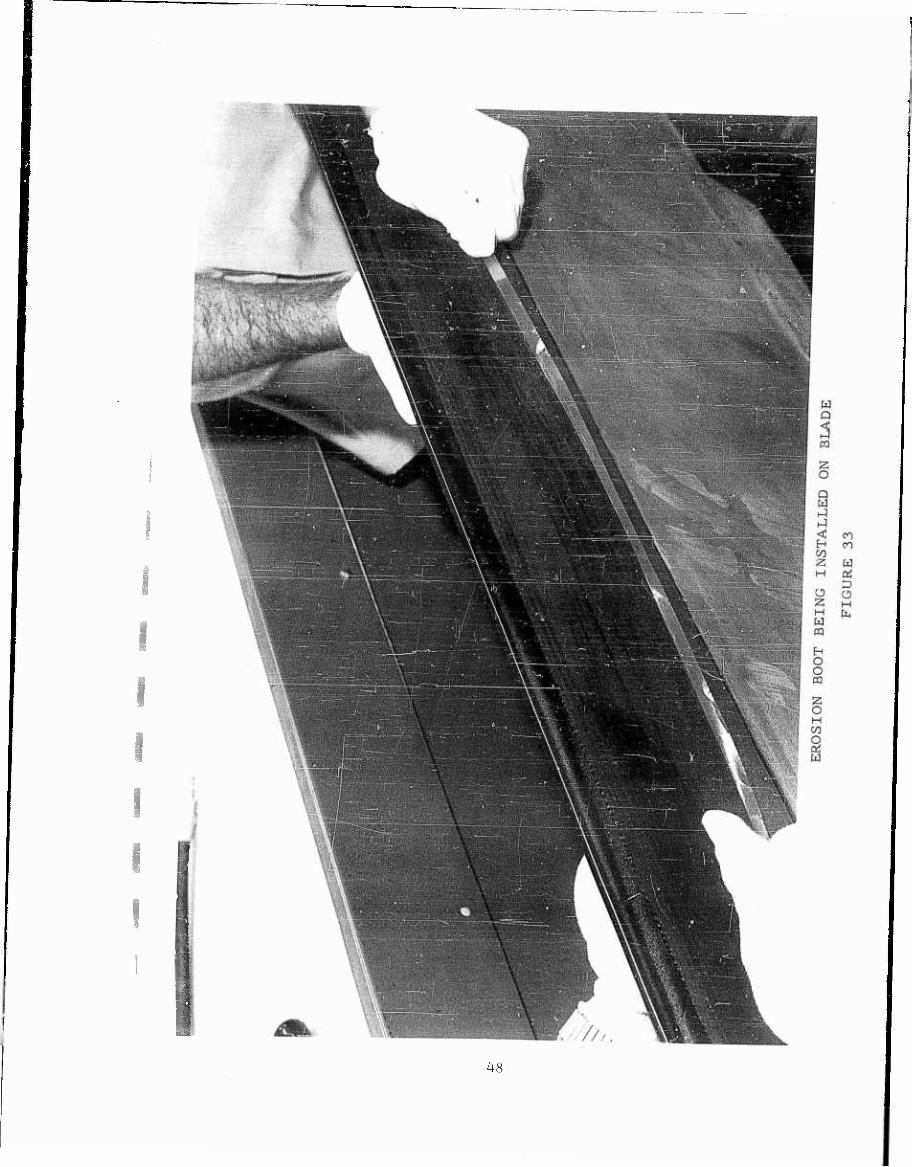
33 Erosion Boot Being Installed on Blade 48
34 Rotor Blade With Array and Erosion Boot Installed 49
35 Rotor Blade Radar Antenna Layout Drawing 50
36 Time Control Box Schematic 55
37 Monostable Multivibrator Specifications 56
VI

LIST OF ILLUSTRATIONS (Cont'd)
Figure
38
39
40
m
Video Amplifier Schematic
Video Amplifier Voltage Regulator Schematic
STC Circuit Schematic
STC Circuit Voltage Regulator Schematic
Page
57
58
59
60
Vll

I
I
i
I
I I I i
INTRODUCTION
This is a JANAIR (Joint Army-Navy Aircraft Instrumentation Research) radar sensor project. The purpose of the project is evaluation of the helicopter rotor blade antenna feasibility through use of a modified Bell Helicopter Company UH-1B heli- copter rotor blade (20 feet long) and the David W. Young and Associates, Inc. Ku band cutoff element array antenna (15 feet long).
During the previous contractual phase of the Helicopter Rotor Blade Antenna Research Program (Reference 1), longitudinal resonant slots, with phase reversal were cut in the broad face of the Kq waveguide, used as a transmission line for the Ku band array. A new method of element radiation (other than slots) was attempted to further reduce the height of the vertical cross section for particular application to the leading edge of the blade and to increase the bandwidth of the array. Holes in the cutoff mode were used as the radiating elements for the first time as part of a David W. Young and Associates, Inc. and com- pany funded general low level flight research program, a pro- gram activated between JANAIR contracts. This brief study of the cutoff element array demonstrated large bandwidths and sufficient coupling to the transmission line, together with very convenient mechanical and construction properties to sug- gest the cutoff element techniques might be applicable to the JANAIR Rotor Blade Antenna Research Program. This hole tech- nique led to the eventual success of the 173.3 inch leading edge Rotor Blade Antenna. The': element technique is equally applicable to the trailing edge. The array is attached very close to the extreme trailing edge of the rotor blade.
The enclosed radar pictures arid patterns reflect the feasi- bility of the leading edge Rotor Blade Antenna. A method of obtaining vertical obstacle information as well as azimuth is also demonstrated.
What was done is emphasized rather than why, and an attempt has been made to make many of the illustrations self explana- tory. Some of the patterns contain structural details about the antenna used to generate the pattern and sketches of typi- cal sections. The techniques used to provide the radar pic- ture data are also illustrated.
The final form of the basic array (^S-inch length) is sketched in Figure 7, along with a 30 db measured sidelobe pattern which demonstrates performance. This same type array, in the final form was inserted in a 15-inch rotor blade with the proper combination of erosion materials to achieve practical erosion resistance, satisfactory front-to-back ratio, and sufficiently small transmission losses. This final array form in the lead- ing edge of a rotor blade is sketched in Figure 10, complete

with erosion boot and elevation pattern (front-to-back ratio included). Figure L6 and Figure 17 demonstrate the feasibility of the full length 173.3 inch array with far field radiation patterns. Figure 19 is a pattern of the same full length antenna, but focused at 300 feet to a width of 1.57 feet (0.3° bearawidth). Figure 20 relates the beamwidth in feet as a function of range for measured and theoretical arrays focused in the near field and in the far field. Figures 21 through 27 explain the techniques used to provide radar pictures and this same group of figures demonstrates through actual radar picture data the high azimuth resolution capability of the Helicopter Rotor Blade Antenna and also demonstrates a method for obtaining high elevation resolution.
The array was permanently installed in a used UH-1B rotor blade using techniques required to fly the blade. The combination Estane and Neoprene boot was attached to the array-blade as- sembly, and the final assembly tested. The details of the permanent installation are outlined in Section VIII. Photo- graphs of the installation are included.
Appendix I gives a detailed description of the modification of the commercial oscilloscope for radar PPI measurements and preparation of STC and other timing circuits. STC was not used with the pictures shown in the main body of the report, but perhaps it will be used in the flight test phase. The Crossed Beam Radar technique with its very small elevation beamwidth did not greatly need the STC. However, had STC been used on the PPI, the elevation resolution would have been even further enhanced.

II. SUMMARY
The cutoff element array technique is applicable to both the leading and trailing edges of the rotor blade, indeed it appears the exact same antenna configuration may be used in both the leading and trailing edges. Short antennas were tested in both the leading and trailing edges of the blade with excellent results, but only the leading edge antenna was made full length (173.3 inch aperture). The full length antenna can be tested out of the blade or in the blade for there is little or no difference in the azimuth pattern in either case. The sidelobes and beamwidth change with application of the erosion boot to the leading edge of the blade containing the antenna is negligible. There is a loss of gain of about 1.5 db with .055 inch thick Estane and less loss with thinner pieces. The radiating ele-
Iments, being at cutoff and certainly not resonant, are affected very little by changes in the element environment caused by the application of erosion material (leading edge), fiberglass
I cap (trailing edge), and proximity of metal (array in or array out of blade).
The leaky wave mode of radiation was used throughout and al- though the 30 degree end-fire from broadside beam reduces the effective aperture from 173.3 inches to 150 inches, the ex- perienced phase stability was quite satisfactory. The phase is essentially independent of hole spacing in the final 173 inch antenna. However, large changes in hole spacing in the narrow wall of the waveguide will cause a phase error. This
I error can be compensated by adjusting the "a" dimension of the waveguide. However, holes in the broadside of the guide, and not too near the edge of the guide, do not cause appre- ciable phase error. Very large cutoff holes in the narrow I side of the guide make the guide appreciably larger, providing a lower than normal cutoff frequency for the guide. The cutoff element technique seems to be particularly applicable to long
I arrays because of the small required coupling between the radiating element and the waveguide transmission line (about 17 to 40 db)0
The thin wall of the waveguide keeps the loss due to the cutoff characteristic of the hole element radiator to about 1 db or less. A nominal wall thickness of .010 inch provides satis- factory results. Control of the wall thickness and of the .030 inch by 173 inch opening above the holes is fairly critical, and poor adjustment and improper handling can raise sidelobe levels from 30 db to 25 db. The proper design sidelobe level suggested 40 db sidelobes, but construction tolerances pro- vided about 30 db sidelobes. It is suspected that flight tests under full load conditions will exhibit sidelobes of anywhere from 25 db to 30 db sidelobes. A 5 db change in sidelobe level at the low level of 30 db can in general antenna practice occur quite easily. The elevation beamwidth of the Rotor Blade Antenna

i
i
i 1
is about 38 degrees which makes measurement of Low sidelobe levels difficult,, It is possible the coming flight tests may provide better results than the static field tests because of the obstruction free test site provided by a helicopter at alti- tude. However, little difference is expected between static field and flying antenna performance data.
The Taylor power distribution employed with the 173.3 inch antenna (150 inch effective) was to provide a theoretical beamwidth of 0.346 degrees, assuming the antenna straight (not bent) and the beamwidth measured at one mile or more. The measured beamwidth at one mile with the antenna bent slightly more than expected under a full load of 121 knots was 0.367 degrees. The measured beamwidth was assumed to be 6 per cent broader because of drag plane deflection. The measured antenna gain was approximately 25 db. The same antenna focused at 300 feet exhibited a measured beamwidth of .3 degrees, a slightly smaller beamwidth than expected. The focused antenna beamwidth at 300 foot range was 1.57 feet wide (.3 degrees), less than the distance between the shoulders of an average man. The antenna has been operated over a wide frequency range with little change in pattern structure, but most of the enclosed patterns were operated at the frequency of 16.2 Kmc since the magnetron available at this facility for radar tests operates at that frequency. Two sets of patterns from ^6.^ arrays rang- ing in frequency from 15 to 50 Kmc demonstrate the broadband capability of the array
1 The thin sector slices (20 degrees x 1 degree x several miles) of the radar were displayed similarly to a common PPI (with a conventional PPI radar the elevation beamwidth is much broader) and adequately demonstrated the high azimuth resolution of the rotor blade and the capability of high elevation resolution through the Grossed Beam Technique (References 2 and 3).
While the commerical oscilloscope was oftentimes the limiting factor rather than the antenna, the oscilloscope provided an adequate experimental radar display presentation.

I
I
1
I
I
I !
III. ARRAY TECHNIQUE
Early in the program it was found that the leading edge of the rotor blade could be, from a rotor blade structural design aspect, an excellent location for the long array antenna. The main advantage of the leading edge was: if the antenna eleva- tion (or vertical) cross section was small enough, and if the openings in the antenna were not too large, a standard produc- tion flyable rotor blade could be modified to accept the an- tenna and still be airworthy. A flyable trailing edge Rotor Blade Antenna would necessarily require fabrication of a special blade to accept the array. Possible disadvantages of the leading edge were the erosion problem, front-to-back ratio (the microwave energy tends to readily diffract over the leading edge airfoil surface toward the trailing edge) and the require- ment for an even smaller elevation cross section array radiator.
The narrow side of the Kg waveguide has neither the proper field current conditions for many slot configurations nor enough vertical height for inclined shunt slots, since the operating frequency is the K band. However, it was found that small holes cut in the small side of the waveguide provided sufficient coupling from the guide to free space if the wall thickness were sufficiently thin, and as expected the coupling was very insensitive to frequency change if the hole diameters were well below cutoff for the dominate mode and operating frequency. (Please refer to Section II, Summary). However, it was found that change in hole size apparently affected the cutoff characteristic of the waveguide (changed the wave- length in the guide) and therefore changed both the emerging phase front and thus the beam angle. The broad dimension of the waveguide ("a") could have been slightly decreased to pre- vent this phase error but it was decided to move the holes to the broad side of the guide. Here too it was found that the holes introduced phase error, but as the holes were moved closer to the longitudinal centerline of the waveguide, the coupling reduced slightly, but the phaseerror rapidly reduced to a negligible value. The holes can be used in the narrow side, there is no doubt, but most of the remaining work reported here is with the holes in the broad side. When a portion of the broad wall is cut away to provide a thin wall for the holes, this same cut away volume can be used as a secondary radiating aperture area, finally leading to a very small cross section radiator. It was found that the coupling to the opening above the holes was quite sensitive to variations in the dimensions of the opening. A thin .010 inch brass plate now covers the holes and good conductivity is assured (soldered) at the joint of the plate and the waveguide. The plate provided the re- quired structural integrity and the electrical conductivity at the junction of the waveguide with the plate. With the plate added, the antenna performed equally well both in and out of the rotor blade. With electrical stability the array

:
I
assembly could be epoxied into the rotor blade without critical mechanical features or critical conductivity. Installation of the array is not critical and requires only good aerodynamic practice. The Kg waveguide with its .OkO inch wall thickness and 0.25 inch x 0.5 inch outside dimension is the fundamental structure of all arrays demonstrated and reported in this re- port .
Figure I demonstrates the broadband capability of the cutoff element array using the leaky wave mode. The sine of the angle of the main beam with respect to broadside is proportional to the ratio of the free space wavelength to the wavelength in the guide. Change in frequency causes a corresponding change in beam angle, but unlike resonant slots with critical slot spacing, the pattern shape generated by the cutoff element, leaky wave array, is largely independent of frequency.
The antenna is more broadband without the use of the opening in the brass nose section of the rotor blade, probably due to the frequency sensitivity of the short at the junction of the brass leading edge with the waveguide back of the hole ele- ments. However, Figure 2 adequately demonstrates the broad- band capability of the array in the brass leading edge. Figure 3 is a plot of the normalized relative gain of a horn whose gain varies with the square of the free space wavelength and the gain of the array, which is assumed to vary only as a func- tion of wavelength. Theoretical and measured gains are shown.
When the data for Figure 4 were taken it was not intended to indicate effective dimensional change in the waveguide broad dimension (a) with hole position, and the data taken may not be accurate enough, but it is certain that holes in the narrow
(side do increase the "a" dimension effectively by lowering the cutoff frequency or decreasing the wavelength in the guide. The extreme hole diameters used in the 173.3 inch array were found to exhibit little phase error. Why the curve which demon-
Istrates radiation from holes in the broadside (near the center line) is not coincident with the theoretical curve, is not quite certain. However, the lower ends of the curve are within
I the specified tolerance of the waveguide as given by the origi- nal manufacturer.
While the bandwidth of the array in the brass leading edge is «less than in free space (no brass plate), the bandwidth of the
array in either condition is greater than the HP-628A signal generator bandwidth which was used for these pattern measure-
Iments. The only limit to bandwidth of the basic array is probably the transmission line and perhaps a ridged line would give greater bandwidth. An octave bandwidth does seem a possi- bility (2/1 frequency change).

i
i
I
1
i
i
I
i
I I
I
Figures L and 2 used symmetrical power coupling about the center of the array, while using a high per cent of power in the load to achieve a near symmetrical power taper. Figures 5 and 6 used the same array with constant coupling (holes to the trans- mission line) and a high per cent of power in the load to achieve a nearly uniform power distribution. These patterns were all used to confirm phase linearity prior to building the long array.
Figure 7 is representative of the final basic array configura- tion of short length ikG.k inches). Note particularly the sketch of the array which is different than the preceding figures. The final basic array form shown in Figure 7 contains the brass plate as an integral part of the basic array and the .030 inch slit is the secondary radiator.

R.OTACTI0M OF
'o&CTlOM OF SO'1 k£ZAY
7T ■';' .-•!■.:; '-/ , ' ''■'-.'_ :
IfilllBiSS i .sr
■ ■
H i 1 +W- mm H:-fH+ ■-
5 SsBs BI
tt£ ill \-J _ g
-KMC.—-=> if ./ff-r-jf; ;/,(6 - _J^ ^n ■•.■.' ~r,~
' '. ^ -.. 'iv::'-- ^..^r ■'■"■■ ;■■■'■ ■ ""■;-: ■V':' ' ; ' / x'/ - .. ■ ■ ■ ■■( ■ ■ . i
o ,,",'.
FRE-QUeNCV 60 15,0 Tol9.OK.MC
^AM^E'. ^7.5 FEET (INDOOR.) A,PEß-TUß.E po 4^.(b IMCHES FKE(?UEMCV SCA,W t 2 US'0
DATA SCAue; Hoaizo^r^L ,* 3eä0/c^ VERTICAL; lV/CM
LARGE BANDW1DTM DEM0M5TRATI0KJ
FIGURE L

....
i
1
I
BRASS Ri3T0R.BLKDe W06SP1E.CE
ROTA<T10Ki OF ARRAY
RADIATED POWER,
.CnS"ESTANlL BOOT
ARRAY APERTUR-E
SECTION OF 50"AR£KY
FREQUENCY: 15".O TOig.OKMC eANGE : 37. ST FEET (flMDOOR)
AFEßTURE*. 46.fclMCHES
DATA ^C/\LE: HORIZONTAL;3.8/CM VEITTIC^L; i \j /CM
CKMC)
15
n 18
1 9
P&lMClPAU LOBE
Z3,0
4O.0 44.0
50"/\RRAY PATTERN LARGE BKNDW10TH DEMOMST^ATIOM
FIGURE 2
9

i
I
i
1
I
>. 01 CO CQ U S U U ^ d 01 < • C E > - <U -H c 0Jr< oi o q
•H c x; r-l 01 -H cfl 4J g-i 0 J-l r-l B
c 0 £ V 0 CO M X) ax • -
•H C C n z z w nj o J" X e oJ-
•H C -H Cl bO d r-l (^ •H -4-1 •H B csi o
c nj U -^•H
cö ^ ^ - q B O -H 3 S^
bO q CM u") >Vä E <u U 4-1 cd -1-14-1
QJ 0 0 QJ U X V ;> K M '•.U . cd B
•H C !M XS cd x) B cd 4-i o cy d) cd "H cd •• -H > u 4-J o -x) r-iK+j q d q r-i : 0) Ü >H w QJ 4-0) ^ 4-i q cd E q (^ H
,0 d q 01 0) -H o o -v C44 Cd 2 r-l . £ OJ q OJ ^
4-1 0 oi m cd oi bß E u •H 05 TH q M-4 £ q. d •
■H v U c CH 0 -H E - x) u a; q tu 0 CX U -H CO
OJ q i> -H 4-1 4-i cd X^o ^ d q cd q d 4-i a cd o
Ot 4-1 -H W) < u 0 M S •
L
&
«0
1« IVJ - O
IP NIJ) (NIV5'AV3'aV 0J.rilV9 (q,
01 >
01 -H - X! 4-i q •P O ^J
OJ OJ 0 4-14-1
■P 4-1 4-1 cu cd
co a ■P q q -H (u OJ X E OJ 4-1 oi bO
r-J q q ji (U Cd 0 4-1
X bO bO o 4-i q q o 0)
•H 0) OJ H 4-i X 4-i a;- cd H 4-4 >
•H (U cd TJ U cd • oj k >ir4 Cd
Ü 4-1 cu q 4-i o
X! OJ -H 4J 4J d r-l
W 4-1 4-1 0) CO U o s-j cd OJ
4^ x a bfl co q 4-1 >^ QJ
•H o u ^ r-i q 0,4-1 cu X d c d 4J o OJ cr-H 0 Xl OJ ^
q !M
OJ 01 4-1 r-l X a r-l H OJ q cd
X) 'H B P CO
0 ^ •H CO
OJ >>
s ^ r-i q OJ
i/ cd r-i cd P> <: cd X
'H O CO
2 p 4-1 -H 21 q oi -". ^
QJ bß bC co t-i q
y co cd -H
j 2
Q QJ r-l u cd
o co x a ÜJ Pa ■H 4-1 CO
3 m ■H 01 15 -P
o- fc q q
UJ o ■H bO OJ
r-i q E D/ •z. •H 01
u. o q U r-l H 0 cd oi H •H a
^ (0 CO QJ
co X H •H 4-1 4-1 w E q iz; CO QJ QJ
o q E u cd OJ q
w ^ r-l -H Q 4-1 QJ CO
cn
M
D O H
10

-
I
I
q O
OP
^VM^I MI A^Nanöa^d
LL
O
uJ
UJ ul
UJ
LU -J
<
< ÜJ CO
u D Ü H
11

1
I
1 : i . ; '
i - i i
; i ' M .. i |M;I llTl1:'
i ' '
h ; M . I ; Mi M'' :; J ' ! JL M
1 • r 1 ' ' ■ 1
M i I
L.:.. —" trir
. 2-
-L__ j— j— ' ^ Mi .! 11 i ^j
M *' 1' i i. ,
Ml i i'f IB
\::t : ■
1 . . i '. i
■ ■ i !! * i i j 1 ! Ml I'I
I'.'Z I.i.
J i . i 111
1 ■
'' i i
9
rJ3 ■ t
M!: M to
[u i ■' i
M' ! M 1 i | : 1
i J | ^« ̂ II [ : } ] 1 1 M : o p : 1' i i '
' ' ' 1 H ^ 1 It'. | ; ■ 1 ;
1 ! i 1 i Lb
1 Ci k ■ : . i .
BJu, 4» ■'J !' '1 1 i; j v T
•» ■ .
Ili! : i i ■ M' .) tr 1; h I i s
Ml ■
::;
p U) ;! ;i : ; ; j i ! ■ ' ; >,
'' ■*
: !** L—
pj- ' -'-1 I -i j
-Ui i
U=- j ' i i 1 z
ü. ■* 0 ' '
1 ' ' ' Ml); T ■ : ;
'*'! Lr^—' i . f-==
M i ^
i ■ f" | ; l 1- : . 1 .
. 1 i 1
lit. ' ' i ■; i
1 1 : ,
: i.i j 'i;!
i ill— i
r' in ' . iTr i.i' I 1 3 1
■"^ -
■f—E
. i; i ilÜ
1 , i ;: :
;.l i ' 1 , j '':'.\ . . i i ;
i; :* h1^ : ' : 1 -tiK f— =^ n
l;:j; * ^ ,| . ; t . 1 . .
| 1 ' ,
| ■ : J —= ! , , ...
—^ -'J: "H : 1 ]
1 ' 1 ' 1 ' 1
; i ■
: J) i.i i ; i: <
1, — ■ ==> —
q u | I f*! 1 - :
*l ''
|:p! 1 ' 1, 1 : .i ?r"
:■: !
——♦—
i ■ :
i :
-ji T -t
. i M r1^
'■ } i . i. . .
s
J._iJ_ ■.. i
1' - 0 : v-
. .1
■
^3 ID j
q «s:
■ t
: ■ '-
1 "' T
V t
' : ■ '
■ ;
i ; i. i 1
■ : r
: , I ;
1 : ; i
_—_ I ■ ]
; r ;. 1 |-, i
' ! '== ^
«— i ■
- 1 : . 1. . ;
1 ■
■ ; 1
—J i IJJ
MN ' 1^1 n
=—
1 1
■
— '-]
t ^i'
. .. , 1 -J r.:1 saaad
i J i
v 1 1 : 1 ' '■■■', : ?r 4 I ■ : '■'"'\
J ~4 ' !
V ^
its!
if". ■ \ '
1 1
3 J
^ /
!-
|
A \ II ;.:
Li i : ' 11 i
1 I J l-fi' i: ■: 1 V^ kH /
' ' "t 1
' ! • •
1 ' ' ' \ ̂ \ \ P ! ' 1
'.ii ,\ "^ 1 q ä 1
\\o\ A 1 r J
1 " ' ' ' W ̂
I b 1
: i ; 1 ' .1
■ '
■ i !-l ,■ j
^ u r
1
' i i i i L 1
L2

I
Ü H
L3

I
I
I
w
p Ü H
14

i
IV. FRONT TO BACK RATIO
Fifteen inch rotor blade sections were, cut to aid in detailed measurements of the: element radiator environments and some of these same, sections were used for elevation pattern measure- ments, but it was soon realized that new sections cut on a 30 degree bias had to be prepared to make meaningful front to back ratio measurements with convenient short sections. Figures 8 and 9 are typical of the square cut sections. The array shown has holes in the broad side and is not typical but the slot in the leading edge of the rotor blade section and the trailing
wave mode with, a wavelength in the guide twice the length, of the free space, wavelength. Both. the. forward main lobe and a dif- fraction lobe, to the rear are 30 degrees from the broad side beams,
Figure 10 is the elevation pattern of both the forward and reverse lobe with, the complete final assembly, including the. proper combination of Estane and Neoprene to provide both. erosion and suppression of the back lobe. While the back lobe suppression (front to back ratio) has not been optimized, 20 db is believed satisfactory. Twenty-five db should not be very difficult to achieve, but 30 db will be quite a bit more dif- ficult . The back lobe is a surface wave and has rather small elevation beamwidth, having an effective aperture of about seven inches. Perhaps this feature could be put to good use but for the present program the surface wave effect serves no useful purpose.
Figure 11 is the elevation pattern of a leading edge antenna, without Neoprene. Thus, the back beam is not absorbed. This back lobe causes no difficulty if the rotor blade is used to transmit and a vertical antenna is used for receiving (Crossed Beam Technique). Since, the vertical antenna will have a. broad azimuth pattern but probably no more than 180 degrees, the re- ceiving antenna may be switched off when the back lobe from the. helicopter blade passes into the visible frontal view. How- ever, when the. rotor blade is used for both transmit and receive, the back lobe, is no different than any other side. lobe, and may cause a serious display error by printing each obstacle, twice, one correctly and one displayed 120 degrees (a considerable error). However, the 20 db sidelobe level provided by the micro- wave absorbent Neoprene is quite sufficient for most performance requirements.
The trailing edge antenna (Figure 12) performs quite well and has much, less tendency to produce a lobe toward the leading edge (naturally good front to back ratio). A small, very thin conductive, sheet is required to balance the back radiation
15

toward the leading edge to minimize the back lobe. Again, the back lobe suppression has not been optimized, but the 20 db is believed to be satisfactory. Good front to back ratio seems somewhat easier to provide, with the trailing edge antenna. There is very little transmission difficulty with the fiberglas airfoil fairing.
lb

I
I
00 Z c^ M H H <;
Z M 2
O H H < > 1-1
<; pi o
a o H H U
p
W GO 00 <?
O H Q cd W
o o 2 cd H H
I > u") Z
w
ID Ü H
17

I
w
o H EH
$ W
w cd
o
o S H w H Cd U p U M CO <
cd o EH O cd W
u o Z cd H H
l >
W cd P ü H
IS

M
O H
19

I !
I 1
I i
I I |
1 I'i 1 i ■ i
I'I
Mi' i
'' i Ji'l i Ii ■ ' ■ ' i . M -
■ ( i
h rri 1.1 1 ' ' i 1.1.}..
11 n 5 a HI °l * '
r N J 01 i -1 ■ i a ■
d
r— a ■ ■.
!:: : : l
:::l l : . . . hjr
is 5 ■ ^ h li j ' i !| r : '
I-- j
1 f
I'm-''
a t
ß (J S Ul J BM-i- o -3—-
it !'♦ | "Sv \y
* f 7"
0
-■-— '
• H^ s^^
Pi T ; a -J <
1 3 v u)
If j /
| ' ' ' i hrj
1
I i I. i *
u ^ 71 o3? ; Ö 1 W -fl ill 4 -CA Mh
6 _1J M..^ —i J r —L P 11 • i
u I i'i ] p^i-i--" r '" B ■1—"—" f E
1 i ^J- T*-"^ b "T ■ ■ P LI.
ii.i; [^ p^ i 1 ' i: ■ !■' i
^ ^0 ^
6
1 N
■ 4 . ,
■ l '■ ^ in 0
1 r :_i •
-* 3 h^
0
2 i!-:: f i ' 1
1' '' :\ Hi "I t
I- i;' V<c ! j P : 1 ' :
ij : •
j i !.'.- -i- ■ ■ ■
: . ; j; -J '..': : ■ t ' r i. ■ -
2! ■■t '
3 i ' . "SlH«-. : i ■
' : t ' ^^^ : i., ■ • ■
11' J i.i i i. il ....
..;. i j J i ; . . 1 1 1
■
i : | l L ]h J ■
jj :
.; ) , ; i. I . . i i . 1
i
... - ... nr ID ■ ■1-i . i. ,
. i. i . . ! 1 . .+ J 1
■• ' ! , . ! - .
jf1 - ti' i
ju< ■ ■ ipl
1 ' . '. . . ■ t . r'i! ■ il
Tf~ , ' ^ ' i 0 '3 ■ .. 1 . -14 . ]
i " ■ .:.. i - 1 HU .; .- I t ■' M ■ .,. . ....... j i.r J i ' 1 1 ' 1 ■ ■ -r jj.
l." fi'i i r; ■ • • ■ :
1 ■ ■■' j H : ; ;| A ■ ;
... 1 i .i i . ! !■. i -i' i ■i H ..14-1 i : 1 L i : i -i . . . ! ' ' • 1 1 i' l" •■■ii 1'' i ■ f-i-H ''' 1 1 1:" i i' r * ; r ..... n "^—MJ ■ 1 ' M'
i.l.;, , . i , 1' U I 1 j ■■]
|:.!1;.: ■ ■ "i '■J r.| !.! ; i I :.:i: r a" ' \
94 ■ U.J i , 1 i [ j
1 * "M ' T ' i.'! i r i-d ii i..i. rf:\ ^! t ' j
■ 11; i 1 • ' ' ■ if I'I; Ii J L i •: i 1-i ■' n p j. 4 ■ j 1 | ;•
; : ■ il ■ M I ]\ ^-4 J 1' •■ if ■■
; t- ! ■-!;. 'i:|] ' 1 i 11 r 1 ;:t- R i-4 , ■ ■ 1 i t c ■ '
1 ' i .i . i ! t . i ! i ,-j L| . , , i ^-p
Is • ■ i j 1 i ■ * •' i { : ' ' J ': i .1 i; : 1- ! i.....
:' ' IJT t&rf . r 1 '"' ' 1 1 1 ' 1' ! ' -] i ; ■ 1 ■ i^i • ■ 'I r . l-i 1 1
uiJ I , i.. i u ^ : U i' ■\ , '] t I'I j" 1 ■ ■
' i i
1.' i j;;.: ■ ■ -' iT H~li t : 'tf r ■ t" j J
M t ■ • ■ 1 •'?? c '. ■ ■ ' 1 i 1 M-l 'ill i .
■
'^T a L
II'P ■ b ► ■ 1 ■i i
.; J1 jJ: . . . .1-1
' ' T —T * ■ ; t
' W ' ' ^
'111
: •' ■
.,1.1 1 . 1 ■ L rrjl ' 1 1 1 F . 1 . . 1 i ' i..
U: i.J.l'. i . . ! 1
! Li
• ■ '
' 1
.1
.i: :| .(-i.i
I , •: | j : ■]_
20

_
I
21

1
V. 173.3 INCH ARRAY DESIGN
Figure 13 is a plot of the hole coupling as a function of the position on the array. The method of calculating coupling, to- gether with the variation in hole sizes used, and the effects of a lossy transmission line are shown. The statement in paren- thesis "(a similar technique for half wave or more spacing)" was meant to imply the cutoff hole technique could be used for an array which used element spacing to determine the main beam angle, usually a half wavelength or more. While the curve shown was normalized, the peak value of coupling (the closest coupling) was about 17 db. The transmission line loss reduced the gain of the antenna 1.5 db, a reasonably small figure.
Figure Ik itemizes the equipment used to provide the patterns for the full length Rotor Blade Antenna. The figure further details the instrumentation schematic and the physical layout of equipment. The actual antenna pattern measurement site is shown in Figure 15. Both the Rayleigh range and the far field range is shown.
(Figures 16, 17, and 18 are final patterns of the finished array. Figure 16 is most complete and the data detailed on Figure 16 apply equally well to Figure 17 and largely to Figure 18. Figure 16 and Figure 17 differ slightly in sidelobe structure and level
(and it is not known why, but this small change in sidelobe level can occur because of the broad elevation beamwidth of the array and slight scattering from the ground cover. Most of the dif- Iference in Figures 16 and 17 is scale factor, however. The data
itemized are self-explanatory.
I I I
i
22

CL
<(
r
0 n
CO 0 -j
u) o
0 ^ 2 0 P D M
D (^ 0 J
\
e UJ
I
/ J a 3 0 u
ro
a; B H
(SPMI^ ^Nndnos? aaanv^^oN
23

i
3 BO LU Z .
7, s9-4
i o 4t
0 ^J- i xS Ul 2
i
H i
vl ^M>
Ui '"" h e
4- H
W Bi P O H
2k

MMSm
I
I I
9 • O
o - M I fa i I
25

I
i
9fi

PATTeE>4 (FIG, 16)
SI&E.LOBE.S REMMN BELONG THIS LEVEL.
0' r
AZIMUTH PATTERN^LEADING EDGE RDTO^ ^LADEA^AY
FIGURE 17
27

i
FIGURE 18
28

VI. EFFECTS OF FOCUSING
There are only two figures with this section, Figure 19 and Figure 20, At first glance the figures are deceptively simple and seem of little significance, but the relationship between an antenna focused in the near field and the far field and the relationship between the resolution of an array in the near field, when focused at infinity, or slightly defocused, is seldom understood. The following measurements may make these resolution relations at 3 db clearer for this particular 173.3 inch antenna .
Figure 19 is the pattern of the 173.3 inch array focused at 300 feet and exhibits low sidelobes and a beamwidth of 1.57 feet, corresponding to 0.3 degrees.
J Figure 20 illustrates the following: the beamwidth of the array measured in feet is the same at the aperture for all conditions
I of phase including focus at near and far field and defocused. The beamwidth at the aperture is simply the power distribution of the array, in this case the Taylor distribution for kO db sidelobes, tT = 10, If the antenna had a uniform power distri- bution instead of the symmetrical power taper, the beamwidth. at the aperture would be about 15 feet instead of 5 feet. The beamwidth of the focused antenna is not a point (or line) as in geometric optics, but is limited to the basic beamwidth of the array. The beamwidth of the array at distances other than the focal distance is shown at the left side of Figure 20. While comparing the measured beamwidth in feet for the array under full load conditions (slightly defocused) at various ranges (it is not a straight line function) it is interesting to remember that beamwidth in the far field is proportional to the ratio of array aperture to wavelength, while the Rayleigh range is proportional to the ratio of the array aperture squared to the wavelength, which might suggest a higher operating frequency for the same resolution with a subsequent reduction in the Ray- leigh range. However, the antenna can only be effectively focused for improved resolution in the Rayleigh range. No con- clusion has been drawn but these relations are being considered. Many practical uses of the rotor blade will in the future, take place in the present Rayleigh. range of the 173.3 inch Ku band antenna (the Rayleigh range is approximately 1400 feet).
i
29

i
I I
30

-L33J Nl HJ.CM/M wv=ia
3L

I I
VII. RADAR AND OPTICAL PHOTOGRAPHIC COMPARISONS
Figure 21 illustrates the equipment layout and electromagnetic technique for obtaining the radar results shown in Figures 23, 25, and 27. Thin PPI sector slices were used having the di- mensions of 20 degrees azimuth, one degree elevation and some particular value of range for each slice.
Figure 22 shows the actual antenna configurations employed for the thin slice PPI radar data. Figure 22 also indicates the edgeview orientation of the four PPI radar slices shown in Figure 23 which correspond to the following elevation angles; 0 degrees, 1 degree, 2 degrees, and 5 degrees. The radar sectors are shown in Figure 23. The slide at 5 degrees eleva- tion has a ten mile full scale range and the other slices (0 degrees, 1 degree, 2 degrees) have a full scale range of two miles each. The transmitter power was in all cases about 4,000 watts peak power with a pulse width of about 0.125 us. Aerial photographs for both two miles and ten miles full scale are shown in Figure 23. No STC (receiver sensitivity time control) was employed, but even so, the crispness which "Stony Point" appears and disappears with one degree displacement of the sector slice is excellent. The small amount of "Stony Point'' shown in the one degree slice is actually the lower portion of the "Stony Point" which can be seen on larger negatives not included.
The power poles shown at four miles and ten miles, the train, the wooden poles at 0.5 to one mile, small metal poles, corn field, etc. in Figure 25 and 27, point to the feasibility of not only high azimuth resolution but obstacle detection through use of high elevation resolution. Only obstacles were ac- centuated. Figure 24 provides an optical view of the radar targets or obstacles shown in Figure 25. Figure 26 is an optical view of the obstacles shown in Figure 27. In Figure 26 the very close hill and closer trees are also shown on the radar. Figure 27.
These simple photographs suggest great airborne radar system capability.
32

J
1
I
CM
W Pi D Ü H
^ ö IP N
33

i
I 1
I
3k

i
■p CO > 0)
r-l w in
H O P
2 H X H m
o H ^-^ §
O H CN N
<; o o ,-1 LT)
CO
o o o
H GO H H5
So W O ttS CN U w 2 H CO
Pi •z o O H H U H W <| GO > U H i-l PA
U
u
p
cuo a. m
U H
< 00 H <: fe P H 2
O P H
I .fH CO 00 p
w a u m o K p w H H W
O E-I P p . ' P pi n qo oi w PM O K
H H &0
W W P
2 00 cq
£P^ 00 H H >-! o <; w z >
o
0
EH P
W 00 p p PM
O LD
X
o m
Pi Q < H P P
EH
U CQ 2
Cd W > CQ
35
<
la o H H O w
Q
W
o
m o a! o w
O
CM
CO og
U
P o H
0 Oi o ^-i a, o

I
36

CROSS BEAM 3D SENSOR, OBSTACLE DETECTION DATA
FREQUENCY: 16.2 KMC
ELEVATION INCREMENTS OF THIN (1° ELEVATION BEAM) PPI SECTORS (20°) WITH 0.35° AZIMUTH BEAMWIDTH
THE RADAR SYSTEM TO PRODUCE THE 3D DATA BELOW DID NOT USE STC OR A TR TUBE. IF STC HAD BEEN INCORPORATED (IT WAS NOT AVAILABLE) THE CROSSED BEAM 0.35° X 50 ft 3D RESOLUTION WOULD HAVE BEEN FURTHER ACCENTUATED.
ELEVATIONS NOTED ARE FROM HORIZONTAL (0°)
..-]
i
POWER TRANSMISSION TOWERS, RANGE ^ 4 Mi (COMPARABLE TO BRIDGE SUPERSTRUCTURE)
10 X 20° X 10 Mi PPI SLICE 0° (Horizontal)
POWER TRANSMISSION TOWERS, RANGE ^10 Mi
1° X 20° X 20 Mi PPI SLICE 0.4° PITCH UP
I
TREES
BUILDING
1.5 Ft DIA WOOD POLES-Sr^'
1° X 20° X 1 Mi PPI SLICE 0° (Horizontal)

Q J UJ
2
i
I I i
i
■mm ümä v..-M
IP p ,'M'.±,V.!.\;,. V,--
m
mm§
38

i
i
I
I
0) pq
C o
•H -P
> r-l w
u
2 CM
U
P O w Pi
•P
Q W fp W PQ X
Q Q M CO '
00 h Q ^ U cd 2
MUM w w w o w m
HH P O Pi P
o
oo
00
Pi
> . w
w P ffl «
H Pi -4
Ü 00
00 5
w w P 00 EH P'
P P P o
p o H H p p o 00 w Pi
p •CO
o o
p <1 H P o N H P o p
S o p p
p p <1 p p H O P
00 p p Ü p <;
p o H H
^ P P P
P P H
o ^ >-i in P <; . w ü P o P P P P PP o <1 >-< <; H P
P XH P P 00 W CO •H <; OPH^ 2 o P ^ P H p <; q o -i 5 H ^BPP o p O 00 M 00 X Q P P H W > P fc O OOP
Q P EH O H U P P O Q CN P EH P p U W P 00 H H p S H X! P
<; U O O 00 U P P P
H O PO
<; oo En P « r-l P H C\l
p p p Ü H P
39

VIII. PERMANENT ARRAY INSTALLATION
After having proven in the early effort of this program that either a leading or trailing edge antenna would work equally well, and because the trailing edge antenna would require redesign of the trailing edge spar to produce a blade stressed for flight, it was decided to concentrate research on the leading edge configuration whereby regular production UH-1B blades could be easily modified to accept the rotor blade antenna without affecting the blade structurally.
Placement of the antenna array in the leading edge of the rotor blade was considered under the company-funded study conducted in early 1963, The idea was rejected at that time because of the erosion that occurs in the leading edge of the blade during rotation. A study of this erosion problem was conducted at Bell. Polyurethane and Neoprene exhibited the highest resistance to sand erosion of the non-metallic materials. Seventeen of the best eighteen materials were either Neoprene or Polyurethane compounds. Test results indicate that the best material tested was a Polyurethane compound by B. F. Goodrich Company designated as 3047A Estane. Samples of this and other Estane compounds were obtained and tested at microwave fre- quencies. B. F, Goodrich developed the composite Estane and Neoprene erosion boot which was used on the full length test blade.
The UH-1B main rotor blade has an aluminum box beam which is the leading edge structural member. To this is bonded the brass nose block which among other things, establishes the curvature of the leading edge, A thin layer of stainless steel is then bonded over the curved brass leading edge and extended down and over about 90 per cent of the box beam, serving as an erosion shield.
The radar antenna was installed in the leading edge of a used UH-1B rotor blade by cutting a slot .256 inches wide and .512 inches deep, the full length of the blade, extending through the stainless steel erosion shield and into the brass nose block. (See Figure 28) The slot had to follow the centerline of the leading edge and also parallel the axis of the blade chord. This requirement was made difficult by the .5 degree per foot twist built into the blade, A work aid using an air motor to drive an end mill '"router" fashion was constructed. The work aid was designed to follow the centerline of the leading edge, with side guides to follow the blade twist. See Figure 29.
Tinning
To improve the bond between the copper waveguide antenna array and the brass nose block, the array was tinned using a cold wipe process. Step by step this procedure follows.

1. Remove grease and oils with a cloth dampened with a safety solvent, (Vythene was used.)
2. Remove light oxides with Scotch-Brite.
3. Wipe with Vythene.
i+. Wipe with Metex acid tin solution to deposit a light tin coating.
5. Wipe with distilled water.
6. Dry.
Bonding
1. The machined slot in the blade was cleaned using Scotch- Brite and wiped with Vythene and a rag.
2. A layer of 3M EG2216 was brushed on the sides and bottom of the slot. A layer approximately .030 thick was deposited on bottom of slot.
3. Three lengths of No. 450-1/2 glass strands were embedded in the bottom of slot to give resiliency and shimming.
4. The array was placed in the slot. Templates made of 3/16 inch plexiglass cut out to conform to the leading edge curvature were used to position depth of array in slot. Working six inch intervals, the array was pushed down into position using the templates. Pieces of two inch wide mylar tape were placed over the leading edge to hold the antenna array in position during cure. Curing consisted of a 110 degree flash solvent for one hour, followed by 48 hours at room temperature. Pre- ceding the bonding operation, a strip of .030 teflon was inserted in the array slit for protection against EC2216 squeeze out (Figures 30 and 31).
Erosion Boot
The composite erosion boot used to cover the leading edge of the blade consisted of three parallel strips of material making a total width of 7 inches. A strip of Estane 2.5 inches wide with the outer half inch of each edge tapered consituted the center or "window" section. On each side of the Estane, strips of Neoprene 2.75 inches wide with a half inch taper along one side and a long tapering feather edge on the other were used. The half inch tapered edges were overlapped and bonded, giving a uniform cross section thickness of .055 inches across the center four inches, the outer edges being feathered. (Figure 32)
This composite boot was used to satisfy the need for a low loss erosion material to cover the radiating window, together
41

with a high loss erosion material on either side of the window to suppress the back lobe as pointed out in Section IV. Goodrich Company is attempting to compound a one piece boot of Estane in y/hich the center section will remain low loss, but outboard of the center, the Estane will be loaded with carbon to increase the losses. There was insufficient time remaining in the present program to complete compounding and testing (electrical ar)d erosion) of an all Estane boot.
Installation of Boot on Rotor Blade
1. The leading edge of the rotor blade was cleaned, using Scotch-Brite and a Ketone wipe.
2. Goodrich A934B adhesion promoter applied to leading edge.
3. The Estane center section of the boot was masked.
4. The adjacent areas consisting of the Neoprene strips were spray coated with clear urethane adhesive.
5. The masking tape was removed from the center or Estane section of the boot and a double coat of EC 2126 applied to this area as well as the corresponding area of the blade.
6. The teflon protecting strip was removed from the antenna slit.
7. Estane section of boot was applied to center part of leading edge which had been previously coated with EC 2126.
8. Worked one side of blade at a time, starting from center of boot and working both inboard and outboard using Epon 934 epoxy adhesive, rolling to apply uniform pressure and provide squeeze out of air.
9. The boot was taped and held' in position as work pro- gressed.
10. Same procedure was applied to other side of blade. (See Figures 33, 34 and 35.)
U2

00 CN
M Oi P Ü H
«

l
I I
WORK AID USED TO CUT SLOT IN BLADE
FIGURE 29
44

i
t
1
i
i
i
RADAR ANTENNA BEING INSTALLED IN LEADING EDGE SLOT
FIGURE 30
45

1
I I I |
RADAR ANTENNA INSTALLED IN ROTOR BLADE
FIGURE 31
46

1 p
I
I
CN CO
w 5 P o H
kl
i
I I
I
48

i
I
I
COMPLETED BLADE WITH RADAR ANTENNA AND EROSION BOOT INSTALLED
FIGURE 3U
49

WAVE GU\De AHD ANTENNA A S S'C REf
i
I
259HES3£<I-7 COVER PLATE ASS/-
TAP DRILL .CO Offl" TAP r* 2» UNP-JB .6 DEEP PEffVULS-;*/^
comtLjlt D/A ».loo ce^p
AN9liOP£"»l(iL WASHER ^5; r;vr PLACE'S.
4-)
fi
(?)
1

-AöRASlOfO öool
e9SSP3-l BLADf.
iEF
-WAV£-GUID£ AND ANTENNA AS5V {FURNISUED SC" DAVE VOUNG ASSOCIATE'S' BOND IN SLOT WITH ECSc2l<i ADHE-SJVE PER BOND LAB INSTRUCTIONÄ
^^£, HES32«-( WEIGHT SUPPORT ;!//£>/••",, & flACeS, MATCH WITH vve";s/vr SL/PPORT
CS/NK IOO- TO .SOT DIA MS l5S>i94-4l6Ria ^CREW i REOP
ABRASION EiOoTßPiEcel PART-UO JAI4 3£, PURCHASE FROM GOODRICH. RUBBER CO. BOND BOOT Assy TO
BLADE WITH EC lUt, PER BONiJ LAS INST AFT EDGES OF BOOT TO BE EVEN TO ETACH OTHER WITHIN .03
HELICOPTER ROTOR BLADE RADAR ANTENNA IAYOUT DRAWING
FIGURE 35
50

I i
i
i
I
I
APPENDIX I
PPI DISPLAY
51

i
}
I
APPENDIX I
PPI DISPLAY
Timing, sweep and video circuits were provided to operate a standard commercial laboratory oscilloscope as a PPI indicator. A 541 Tektronix scope was used as the display device by using its internally generated sawtooth wave for the sweep and by using the CRT cathode circuit for intensity modulation. Since a linear pot was used rather than the usual sine cos functions, the scan sector was limited to about 20 degrees to keep distor- tion below 10 per cent. The timing control box is shown in Figure 36.
Sweep
The sweep for this display was obtained from the internally generated sawtooth waveform of the scope. The trigger circuit of the scope was set so that each time the transmitter was triggered the scope produced one sweep and then remained idle until the next transmitter trigger. The sawtooth waveform thus obtained was connected to a voltage divider which reduced its amplitude from about 150 volts to a usable level. This signal was impressed across a potentiometer physically connected to the gimbal mount of the Rotor Blade Antenna. The output of this potentiometer was directly proportional to the degree of rotation through which the antenna was rotated. This output was connected to the vertical amplifier of the scope and thus provided the second sweep necessary for a PPI sector scan. Small errors were expected to exist due to the potentiometer and the vertical amplifier. The potentiometer itself produced a slightly non-linear sweep due to the reactance of its winding. The vertical amplifier of the scope produced a propagation delay of 0.2 microseconds which is a range error of 100 feet. At the shortest range used (1 mile) this error is quite small and on the longest range (20 miles) became negligible. Another small error was introduced through use of the linear pot rather than the usual sine cos functions. The maximum error was about 8 per cent of full scale range.
Z-Axis Modulation (Intensity) and Video Amplifier
The video information was displayed by Z-axis modulation of the CRT. A video amplifier was designed and mounted inside the scope so that output leads would be as short as possible. The amplifier was basically the amplifier described in application note APP-27 of the Fairchild Semiconductor Division entitled "A 120 Volt 40 Nanosecond Transistor Video Amplifier". Many hours were spent adjusting the gain of the amplifier, the intensity control of the scope, and the settings of the scope camera for the best display of information. To acquire the- correct resolution the spot size of the CRT should not have
52

exceeded approximately .0L7 of an inch. However, this is one- half the normal spot size which meant that the tube could never be turned on full if resolution were to be correct. This also meant that the video amplifier must provide signals that would operate the CRT at near cutoff and yet the CRT must provide enough light to record on film. The gain of the ampli- fier was first recorded. Then the amplifier was connected to the scope and tests were made to see what voltage pulse was needed to give the required 0.017 inch spot size.
Spot Size
Pictures were taken to give the same relative spot size on the negative (0.011 inch) as was viewed on the CRT. The values of the scope camera adjustments were found and recorded. The minimum signal that would appear on the film was then found and this then gave the dynamic range of Z-axis information. This was approximately 15 db of input signal.
I The intensity knob of the 541A oscilloscope had to be replaced with a digital vernier knob for better control. Full range of the intensity control was 00.0 to 85.0 on the vernier knob.
{Visually, a spot (signal pulse width was less than 0.017 inches) was just detectable at an intensity setting of 71.7 and would almost bloom at 73.0. For a line (full width of scope face) the setting became 45.7 to just be detectable and 47.2 to almost bloom. Using a .1 microsecond pulse width the intensity setting and pulse amplitude combination was investigated using polaroid type 47 film as a detector. For values of pulse amplitude expected from the radar receiver it was found that for one second exposure at an "f" setting of 5.6 on the camera and an intensity setting of 47.5 on the scope the following data was recorded.
■
rideo Ampl. Output Spot Size in Inches In Volts Vert. Horiz.
Rec. Ir put Rec. Output in D.B. M. In Volts
-20 0.06 -11 0.13 - 4 0.185 + 10 0.3
? 0.5
»
1.0 .005 .010 2.2 .016 ,022 3.2 .025 .025 5.5 ,029 .030 9.5 .32 .024
(Phosphor Saturated)
Blooms beyond this size
All of the above information was based upon constant speed of rotation of the antenna but the antenna was turned manually, which proved to be much slower during the field test than in the laboratory. This caused the film in some cases to be over exposed and produced spot sizes well in excess of the 0.011 inches optimum, but the PPI radar data was still reasonably effective due to the high resolution of tl"e antennas.
53

S.T.G. Circuit
1
The S.T.C. circuit controls (see schematic) the conductance of microwave switching diodes causing the radar return to be attenuated in the waveguide before it reaches the receiver. While the circuit was not used on the radar, the design details of development are reported. This circuit consists of a switch circuit, a current ramp circuit, a back bias circuit and the microwave diodes and their mount. The diodes do not attenuate the signal when forward biased (conducting) but as the bias is changed to a back bias condition the diodes switch and a large attenuation of the signal is achieved. This action is explained in an article entitled "Microwave Diodes for Switching and Modulating" published in the December 1963 issue of Special Report on Electronics. The switch circuit is used to start the current ramp of the current ramp circuit which provides the forward bias current for the diodes. At the time this current ramp starts the diodes are back biased and therefore the ramp has no effect until the back bias falls to zero. To remove the back bias the input signal shuts off the back bias circuit and its voltage starts to fall. The actual curves of the back bias fall time and of the current ramp are con- trolled so as to give a composite curve. This composite curve impresses a current-voltage wave shape on the diodes which cause them to vary their attenuation so that short range re- turns are attenuated more than long range returns. The ideal relationship is found when the signal return from a specific target is the same amplitude (at the receiver input) for all range values under consideration. Timing was critical for this circuit since the attenuation must change at a given rate from a given time related to the transmitter firing time. The S.T.C. circuit needs a pre-trigger which was not available during the field tests to be effective and without this pre- trigger the circuit caused too much attenuation of the received signals at short range settings. For range settings of 5 miles and over, the S.T.C. would only suppress the near targets and therefore would not substantially improve the PPI simulated dis- play. It was decided during the field tests that the use of the S.T.C. circuit would not justify the time necessary to insert the circuit into the system.
5^

o
J o u y ■z O u uJ
h-
n w cd
g H
0- 2 Ö
55

I
MONOSTÄSLE MULTIVIBRATOR f I circuit per module)
The "Single Shot" is designed to provide a source of pulses for the system clock and special reset functions, or time delays. It will provide positive and negative outputs the duration of which will depend on the application. Included in the module is a three term (2 level & 1 pulse) AND Gate to the trigger input. The pulse width can be trimmed or lengthened by inserting additional external capacitance be- tween terminals 8 and 2. The standard delay is 1 microsecond ± 20% and other delays are available on request.
ELECTRICAL SPECIFICATIONS
INPUT
Pulse Amplitude ........ ..... ö ,5 to 6 volts positive Rise Time 0.20 microsecond maximum Maximum Clock Rate ,.,, Dependent on output pulse
width—250 kcps max for pulses of less than three microsecond duration.
Level Disable Gate - 5.6 to -6.5 Enable Gate - 0.2 to +0.3 volts Gate setup time .2 microseconds max.
OUTPUT
Voltage Conducting (Logical "1") 0 to -0.2 volts Non Conducting (Logical "0") -6 to -6.5 volts
Duration For Pulse Generation 1 microseconds ±20%
Transient Times (Fully Loaded) Delay 0.18 microsecond Rise 0.30 microsecond Storage 0.10 microsecond Fall 1.00 microsecond
LOADING See Loading Chart
POWER REQUIREMENTS
-12 volts ±5% -18 ma -6 volts ±5% ... ..+ 6 ma + 6 volts ±5% ,+0.6 ma
•JOGRID
O ö 6 -6V 8 +6V 6
(See reverse side for Mechanical Specifications)
p-o b c
«^P
*P
sBasassBiiiBi EEMO I SSHaSSIiaQfillBICI
CLearbrooh ? 2900
1949 6REENSPRIN6 DRIVE • Tl M O N I U M . M AR^L AN D
FIGURE 37
56

1
u 0 i-
IÜ o 0 I
0
0
0 a. h 0 0
Ü 0
2 0 5
0
2
—NVvVA-
0 >
in
?a—W ■HH"
vS
Q^^"
y 5
5 u.
JVWVAA-
8 o
"=1-
J W Wtl
"S In cr z
CO
v/VWNr-
00*
%. S
-yVs/VW
4—w^AA^Ar■
0
-vvvUv-
(^ UJ
0 Ü. ÜJ j ü a. > 5
^
i 4 <
^i- •^ —
00 cp
S
H
00
h D a. z
Ö
I 57

VIDEO AMPLIFIER VOLTAGE REGULATORS
^
V-, 30 60 li|,0
V- ^5 76.5 181.5
Rl
R2
GRi
5. IK
62K
5.6K
12K
91K
120K
|M30Z5 iH30Z'5 ^M1^0Z5
iM30Z'5
Q-, Zfa893 2W1893 HD81HB
5oi4Pn 50 v
20MPD 100 V
50MPD 150 v
50MFD 5o v
20MFD 100 V
50MFD 150 V
FIGURE 39 58

i
I
. 1- u 5 h 0
I/O - U
^
^J- >3 \ ^ N \ ^
o -d-
w
P Ü H
59

t
■
+ G7.S V 0
•3K
lOkAFO \2V
50MFD
i' 12-V
IOK
i
\ i i KEAT^IMK.
-0 40-50V
±: 50MFD SO :^K :iOVC
STC CIRCUIT VOLTAGE
REöULATO^
FIGURE 41
I 60

I
REFERENCES
L. Lindenrneyer, Leonard and Young, David W., Rotor Blade Radar Antenna, Phase I. Bell Helicopter Company Technical Report No. 299-099-251, Prepared for the Office of Naval Research under Contract Nonr 4148(00), January, 1965.
2. Young, David W., JANAIR Crossed Beam Radar Project. David W. Young and Associates, Inc. Interim Report, ASTIA No. AD 435 558, June 1964.
3. Young, David W., High Speed. Raster Scanning, High Resolu- tion, Radar Sensor for Vertical Display. Prepared for JANAIR, under Contract Nonr 4032(00) by David W. Young and Associates, Inc., July 30, 1964.
1
ol

JANAIR DISTRIBUTION LIST
i
CDRW.A. Engdahl (RAAV-9) Chief, Bureau of Naval Weapons Room 1W98, W Building Washington, D.C. (3)
Mr. Henry Birmingham U. S. Naval Research Laboratory Washington, D.C.
Mr. L. S. Guarino Airborne Instrument Laboratory Commanding Officer U.S. Naval Air Development Center Johnsville, Pennsylvania
Commanding Officer Office of Naval Research Br. Office 495 Summer Street Boston, Massachusetts
Commanding Officer Office of Naval Research Br, 219 S. Dearborn Street Chicago, Illinois 60604
Office
Commanding Officer Office of Naval Research Br. Office 1030 East Green Street Pasadena 1, California
LCDR J. Charles Life Sciences Department Point Mugu, California
Headquarters Ministry of Aviation Saint Giles Court London, EC-2, England
ODDR&E Office of Electronics Attn: CDR W.W. Vallandinghara, USN Pentagon (Room 3D1037) Washington, D.C.
Commanding Officer Office of Naval Research Br. Box 39, Navy #100, Fleet P. New York, New York
Office Office
Commanding Officer Office of Naval Research Br.
Office 207 West 24th Street New York 11, New York
Commanding Officer Office of Naval Research Br.
Office 1000 Geary Street San Francisco 9, California
Federal Aviation Agency Information Retrieval (MS-112) Washington, D.C.
Commander Hdqtrs., Air Force Systems Command Andrews AFB, Maryland
Commandant School of Aviation Medicine, USAF Attn: Research Secretariat Randolph AFB, Texas
Chief, Engr. Electronics Section National Bureau of Standards Washington, D.C.
U.S. Naval Training Devices Center Attn : Joe N. Pe'coraro
Head, Equip. Res. Div. Pt. Washington, L.I., N.Y.
Hqs., Quartermaster R&E Command Quartermaster, R&D Center
• Natick, Massachusetts
Defense Documentation Center Cameron Station Alexandria, Virginia (20)
•British Defense Research P. 0. Box 680 Benjamin Franklin Station Washington, D.C. (2)
I 62

JANAIR DISTRIBUTION LIST CONT'D
;!
I
Defense Research Member Canadian Joint Staff 2450 Massachusetts Ave., N.W. Washington, D.C. (2)
National Aeronautics & Space Administration
1520 H Street, N.W. Code RBB Attn : Mr. Lowell Anderson Washington, D.C.
CAPT John D. Kuser, USN Office of Naval Research. Air Programs, Code U61 Room 4231, Main Navy Washington, D.C.
AFFDL (FDC) LCOL. L.C. Wright Wright-Patterson Air
Force Base, Ohio (2)
Headquarters USAF (AFRSTB) MAJ W, Hippie Washington, D.C, (2)
National Aeronautics & Space Administration
1520 H Street Attn: Bertram A. Mulcahy, Chief
Division of Research
Director Naval Research Laboratory Attn: Tech. Info. Office. Washington, D.C.
Headquarters RTD (RTNF) MAJ. C.R. Wheat on Boiling Air Force Bas6 Washington, D.C.
Staff Officer Medical (IAM) 3AF Staff, British Embassy 3100 Massachusetts Avenue Washington, D.C.
Raymond F, Bohling Code REC NASA Headquarters Washington, D.C. 20545
Civil Aeromedical Research Institute Federal Aviation Agency Aeronautical Center P. 0. Box 1082 Oklahoma City, Oklahoma 73101
U.S. Army Human Engineering Laboratories Aberdeen Proving Ground Attn: Mr. R. Cassatt Maryland 21005
Mr, Carmine Castellono Code 3101 Naval Training Devices Center Pt. Washington, L.I., N.Y.
Commanding Officer USAEL Attn: AMSEL-RD-SRI Mr. B. S. Gurman Ft. Monmouth, New Jersey
Commanding Officer USAEL Attn: AMSEL-RD-SRI Mr. T.E. Maloney Ft. Monmouth, New Jersey
Commanding Officer USAEL Attn: AMSEL-RD-SRI Mr. S.J. Zywotow Ft. Monmouth, New Jersey
Commanding Officer USAEL Attn: AMSEL-RD-SS Ft. Monmouth, New Jersey
Commanding Officer USAEL Attn: AMSEL-RD-S Mr. L. E. Evenson
63

■
JANAIR DISTRIBUTION LIST CONT'D
Commanding Officer USA EL Attn: AMSEL-AV Headquarters USAECOM Fort Monraouth, New Jersey
Commanding Officer USAMC Headquarters Attn: AMCRD-DE-S Mr. W. Cary Robinson Washington, D.C.
Commanding Officer USAMC Headquarters Attn: AMCRD-AFS Washington, D.C,
Chief of Research Department of the Attn: GRD/R Lt.Col. A.B. Shattuck Washington, D.C.
Mr, John Grey Aviation Test Board Ft. Rucker, Alabama
& Development Army
Commanding Officer USAMC Headquarters Attn: AMCRD-R Washington, D.C.
Commanding Officer USAMC Headquarters Attn: AMCRD-D Washington, D.C.
Commanding Officer USAMC Headquarters Attn: AMCRD-DM Washington, D.C.
Commanding Officer USAMC Headquarters Attn: AMCRD-S Dr. Grenshaw Washington, D.C,
Commanding Officer U.S. Army Combat Develop. Command Lt.Gol, J.P. Smith Ft. Belvoir, Virginia 22060
Royal Aircraft Establishment Farnborough, Hants England
1
I 64

Unclassified Security Classification
DOCUMENT CONTROL DATA - R&D (Security clataitication of title, body ot abatract and indoxinf annotation muat be antand when the overall report io claaailied)
I ORIGINATING ACTIVITY (Corporate author)
Bell Helicopter Company P. 0, Box 482, Fort Pbrth, Texas 76101
2«. REPORT SECURITY CLASSIFICATION
Unclassified 26. SROUP
;■;
3. REPORT TITLE
Rotor Blade Radar Antenna - Phase II
4- DESCRIPTIVE NOTES (Type ot report and inclusive datea)
Interim Final Report 5- AUTHORfS) (Last nurne, first name, Initial)
Palmer, James E. Young, David W.
t REPORT DATE
Fphruary 19 65
7a- TOTAL NO. OF PACES
6k 7b. NO. OF REFS
ta CONTRACT OR 5RANT NO.
Nonr 4148(00) 6. PROJECT NO.
9«. ORIOINATOR'S REPORT NUMBERCS;
BHC No. 299-099-275
9b. OTHER REPORT NOCS.) fAny o(her numb»« that may be aesigned thla report)
10. AVAILABILITY/LIMITATION NOTICES
Qualified requestors may obtain copies of this report from DDG.
11. SUPPLEMENTARY NOTES 12. SPONSORING MILITARY ACTIVITY
Office of Naval Research Washington, D. C.
13. ABSTRACT
This report covers a research project administered under the JANAIR Program to investigate the feasibility of using the main rotor blade of a helicopter as a high resolution radar antenna. The purpose of this program conducted by Bell Helicopter Company with David W. Young and Associates, Inc. as a major subcontractor was to refine the de- sign developed under Phase I of Contract Number Nonr 4148(00), docu- mented in Bell Helicopter Company Report No. 299-099-251._ Fifteen- inch antenna sections were built and tested to study detailed leading and trailing edge array element environments. A full length, 173- inch array was built and tested. A jig was constructed to accept the full length array, and radiation pattern measurements made of beamwidth, focus, sidelobe levels, and front-to-back ratios. Beam- width and sidelobes were measured under deflections simulating maxi- mum flight loads. Photographs of thin radar sector slices emphasizing elevation and azimuth obstacle sensing capabilities taken from a modified PPI were compared with optical photographs. The array was_ then installed, covered with an erosion boot and tested in the leading edge of a used UH-1B rotor blade.
DD FORM 1473 Unclassified Security Classification

Unclassified
P Sen 'irity Classification
KEY WORDS
Helicopter Main Rotor Blade Radar Antenna
LINK A LINK B LINK C
INSTRUCTIONS
1. ORIGINATING ACTIVITY: Enter the name and address of the contractor, subcontractor, grantee, Department of De- fense activity or other organization (corporate author) Issuing the report.
2a. REPORT SECUFaTY CLASSIFICATION: Enter the ovei^ all security classification of the report. Indicate whether "Restricted Data" is included. Marking is to be in accord- ance with appropriate security regu'-bons.
26. GROUP; Automatic downgra'J1 . la jpecified in DoD Di- rective 5200.10 and Armed Forces It 'ustrial Manual, Enter the group number. Also, when appiimble, show that optional markings have been used for Group 3 and Group 4 as author- ized.
3. REPORT TITLE: Enter the complete report title in all capital letters. Titles in all cases should be unclassified. If a meaningful title cannot be selected without classifica- tion, show title classification in all capitals in parenthesis immediately following the title.
4. DESCRIPTIVE NOTES: If appropriate, enter the type of report, e.g., interim, progress, summary, annual, or final. f.ive the inclusive dates when a specific reporting period is covered.
5. AUTHOR(S): Enter the name(9) of authors) as shown on nr in the report. Enter last name, first name, middle initial. If military, show rank and branch of service. The name of the principal author is an absolute minimum requirement
6. REPORT DATL: Enter the date of the report as day, month, year; or month, year. If more than one date appears on the report, use date of publication.
7a. TOTAL NUMBER OF PAGES: The total page count should follow normal pagination procedures, i.e., enter the number of pages containing informatioa
76. NUMBER OF REFERENCES: Enter the total number of references cited in the report.
8a. CONTRACT OR GRANT NUMBER: If appropriate, enter the applicable number of the contract or grant under which the report was written.
86, 8c, & 8d. PROJECT NUMBER; Enter the appropriate military department identification, such as project number, subproject number, system numbers, task number, etc.
9a. ORIGINATOR'S REPORT NUMBER(S): Enter the offi- cial report number by which the document will be identified and controlled by the originating activity. This number must be unique to this report. 96. OTHER REPORT NUMBER(S): If the report has been assigned any other report numbers (either by the originator or by the sponsor), also enter this numbers).
10. AVAILABILITY/LIMITATION NOTICES: Enter any lim- itations on further dissemination of the report, other than those
imposed by security classification, using standard statements auch os:
(1) "Qualified requesters may obtain copies of this report from DDC"
(2) "Foreign announcement and dissemination of this report by DDC is not authorized."
(3) "U. S. Government agencies may obtain copies of this report directly from DDC. Other qualified DDC users shall request through
(4) "U. S. military agencies may obtain copies of this report directly from DDC Other qualified users shall request through
(5) "All distribution of this report is controlled. Qual- ified DDC users shall request through
If the report has beep furnished to the Office of Technical Services, Department of Commerce, for sale to the public, indi- cate this fact and enter the price, if known.
1L SUPPLEMENTARY NOTES: Use for additional explana- tory notes.
12. SPONSORING MILITARY ACTIVITY: Enter the name of the departmental project office or laboratory sponsoring (pay- ing for) the research and development. Include address.
13. ABSTRACT: Enter an abstract giving a brief and factual Bummary of the document indicative of the report, even though it may also appear elsewhere in the body of the technical re- port. If additional space is required, a continuation sheet shall be attached.
It is highly desirable that the abstract of classified reports be unclassified. Each paragraph of the abstract shall end with an indication of the military security classification of the in- formation in the paragraph, represented as (TS), (S), (C), ot (U).
There is no limitation on the length of the abstract. How- ever, the suggested length is from 150 to 225 words.
14. KEY WORDS: Key words are technically meaningful terms or short phrases that characterize a report and may be used as Index entries for cataloging the report. Key words must be selected so that no security classification is required. Identi- fiers, such as equipment model designation, trade name, military project code name, geographic location, may be used as key words but will be followed by an indication of technical con- text. The assignment of links, rales, and weights is optional.
FORM 1 JAN «4 473"fBÄeK) Unclassified
Security Classification