distributed health outcome monitoring and comparative effectiveness evaluation using i2b2
DESCRIPTION
2013 Summit on Clinical Research InformaticsTRANSCRIPT

Distributed Health Outcome Monitoring and Comparative Effectiveness
Evaluation using i2b2
William G. Adams, MD
Professor of Pediatrics Director, BU-CTSI Clinical Research Informatics
Boston University School of Medicine/Boston Medical Center [email protected]
March 21, 2013

University of Alabama, Birmingham (UAB)
Eta S. Berner, EdD Mathew Wyatt, MSHI
Niveditha Thota
University of Massachusetts (UMASS)
Ralph J. Zottola, PhD Paul J. Ranauro
Thomas M. English, PhD
Boston University/Boston Medical Center (BMC)
William G. Adams, MD David Center, MD
Shiby Thomas, PhD Howard Cabral, PhD Nancy Kressin, PhD
Elizabeth S. McClure Cathryn Byrne-Dugan, MD
Sara Mathews University of Cincinnati
(UC) Daniel P. Schauer, MD
Dave Hoskin
University of Washington (UW)
Nicholas R. Anderson, PhD
DHOME Collaborators

i2b2 and Health Services Research
• i2b2 excels at cohort identification
• Lacks functionality to easily describe processes and outcomes over time for populations
• Addition of temporal query functionality was needed for outcomes and clinical effectiveness research

i2b2 HOME Cell
Our i2b2 Health Outcome Monitoring and Evaluation (HOME) Cell* to model and assess relationships between:
• any exposure fact(s)
• any outcome fact(s)
• many temporal relationships
• during discrete reference intervals
• stratified by i2b2 query populations
*currently software is modified v 1.6 CRC Cell, soon will be Analysis Cell Plug-in

Distributed HOME Project
• 5 Collaborating i2b2-enabled CTSAs
• Comparative effectiveness evaluation of hypertension, hypercholesterolemia, childhood asthma, diabetes
• Boston University
• Univ. of Massachusetts
• Univ. of Cincinnati
• Univ. of Alabama at Birmingham
• Univ. of Washington
www.dhome-project.net

HOME Cell Components
• Baseline query from i2b2 Query Cell
• Constraints:
• Occurrence: temporal relationships between facts
• Value: extends occurrence constraint to specify numeric values/ranges
• Age: models subject’s age at time of fact
• Strata: i2b2 queries define sub-populations
• Reference interval: period (month, year, date interval) to optionally further constrain data

Occurrence Value
Constraints
Age

Denominator Population

Numerator Population

Strata

Display/Execute: Percent

Sample Result Set
Strata Denominator Count
Strata Numerator Count
Proportion

• Describe variation in cardiovascular outcomes (hypertension, dyslipidemia, diabetes) over time in 5 CTSA i2b2 instances distributed across U.S. • Assess within medication class outcome
differences (comparative effectiveness) for commonly used medications (anti-hyper tensives, statins, oral hypo-glycemics)
Research Objectives

Approach
• Bi-monthly web-based teleconferences • Shared ontology development (BP,
BMI, medications) • Technical collaborations between sites
and from Recombinant/Deloitte • Shared query development • Distributed query execution with
centralized aggregate data sharing
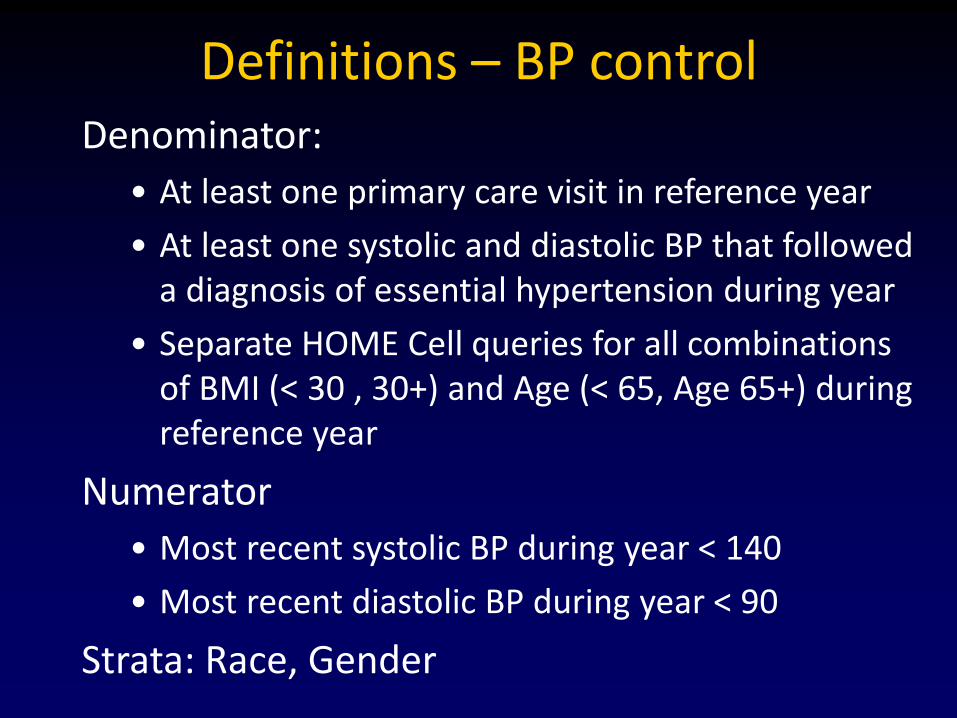
Definitions – BP control Denominator:
• At least one primary care visit in reference year
• At least one systolic and diastolic BP that followed a diagnosis of essential hypertension during year
• Separate HOME Cell queries for all combinations of BMI (< 30 , 30+) and Age (< 65, Age 65+) during reference year
Numerator
• Most recent systolic BP during year < 140
• Most recent diastolic BP during year < 90
Strata: Race, Gender

Building Multi-variate Aggregate Reference Data: BP Example (“young, not obese”)
Year Race Gender Age BMI 30+ Total Controlled SN/SD
2012 Black Male 18 - < 65 No
2012 Black Female 18 - < 65 No
2012 White Male 18 - < 65 No
2012 White Female 18 - < 65 No
2012 Hispanic Male 18 - < 65 No
2012 Hispanic Female 18 - < 65 No
2012 Asian Male 18 - < 65 No
2012 Asian Female 18 - < 65 No
* Additional queries for Age 65+ years and BMI < 30, Age 18-<65 and BMI < 30,
and Age 65+ and BMI 30+ AND repeated for all available years.

Definitions – HGBA1C control
Same approach as BP but used diabetes as diagnosis, HgbA1C < 9%, and oral hypoglycemic medication

Results

Percent of Patients with Essential Hypertension and Controlled BP*
* n = number of patients for most recent year
Site n
BMC 24,930
UAB 15,393
UC 19,435
UMASS 16,144
UW 8,913
Total 84,815

Percent of Patients with Essential Hypertension and Controlled BP on Most Recent Test
Site n
BMC 24,930
UC 19,435
UMASS 16,144
Total 60,509

BP Control for Patients with Essential Hypertension by Gender and Site
UMASS - Female
UMASS - Male
UC – Male/Female
BMC - Female
BMC - Male

BP Control for Patients with Essential Hypertension by Obesity and Site
UMass – Not Obese
UC – Obese
UMASS – Not Obese
UC – Not Obese
BMC – Not Obese
BMC - Obese

BP Control for Patients with Essential Hypertension by Race and Site
UC – White
UC – Black
UMASS - White
UMASS - Black
BMC - White
BMC - Black

Logistic Regression Models for BP Control 2006-2012*
* Limited to comparisons with significant findings

BP Control for Patients with Essential Hypertension by Medication Class at BMC
BMC - ACE: Black
BMC – ACE: White
BMC - Diuretic: Black
BMC – Diuretic: White

HGBA1C Control for Patients with Diabetes by Gender
UMASS
UAB
UC
BMC Site n
BMC 7,189
UAB 5,546
UC 5,982
UMASS 3,049
Total 21,766

HGBA1C Control for Patients with Diabetes by Race
UMASS
UAB
UC
BMC

Logistic Regression Models for HGBA1C Control 2006-2012*
* Limited to comparisons with significant findings

HGBA1C Control for Patients with Diabetes and Treated with Oral Hypoglycemic

HGBA1C Control for Patients with Diabetes and Treated with Oral Hypoglycemic by Race

Challenges
•Ontology synchronization (medications especially) •Data types • Limited resources •Query performance

Conclusions
•Powerful tool for exploratory analyses • “Rapid”, distributed queries are feasible
and informative • The outcomes evaluated are not
improving nor are racial gaps narrowing •Multi-variate approach particularly
promising/important (strata enhancement work ongoing)

A New Approach
•Data is open - privacy is protected • Focus is on measurement - not SQL •Ordinary smart people can ask complex
questions themselves – quickly •CER, HSR, and QI supported by a
common framework • Software is shareable and affordable • Logic is transparent and portable


HgbA1C Control for Patients with Diabetes By Site

HGBA1C Control for Patients with Diabetes by Age

HGBA1C Control for Patients with Diabetes by Obesity Status