metadata-driven clinical data loading into i2b2 for
TRANSCRIPT

Metadata-driven Clinical Data Loading into i2b2for Clinical and Translational Science Institutes.Andrew Post, Emory UniversityAkshatha K. Pai, Emory UniversityRichard Willard, Emory UniversityBradley J. May, Emory UniversityAndrew C. West, Emory UniversitySanjay Agravat, Emory UniversityStephen J. Granite, Johns Hopkins UniversityRaimond L. Winslow, Johns Hopkins UniversityDavid Stephens, Emory University
Journal Title: AMIA Joint Summits on Translational Science proceedingsVolume: Volume 2016Publisher: American Medical Informatics Association | 2016, Pages 184-193Type of Work: Article | Final Publisher PDFPermanent URL: https://pid.emory.edu/ark:/25593/rs8kh
Copyright information:©2016 AMIA. This is an Open Access article: verbatim copying andredistribution of this article are permitted in all media for any purpose.
Accessed December 12, 2021 8:05 AM EST

Metadata-driven Clinical Data Loading into i2b2 for Clinical and
Translational Science Institutes
Andrew R. Post, MD, PhD1, Akshatha K. Pai, MS
1, Richard Willard
1, Bradley J. May
1,
Andrew C. West, MBA1, Sanjay Agravat, MS
1, Stephen J. Granite, MS, MBA
2, Raimond
L. Winslow, PhD2, David S. Stephens, MD
1
1Atlanta Clinical and Translational Science Institute, Emory University, Atlanta, GA 2Institute for Computational Medicine, Johns Hopkins University, Baltimore, MD
Abstract
Clinical and Translational Science Award (CTSA) recipients have a need to create research data marts from their
clinical data warehouses, through research data networks and the use of i2b2 and SHRINE technologies. These data
marts may have different data requirements and representations, thus necessitating separate extract, transform and
load (ETL) processes for populating each mart. Maintaining duplicative procedural logic for each ETL process is
onerous. We have created an entirely metadata-driven ETL process that can be customized for different data marts
through separate configurations, each stored in an extension of i2b2’s ontology database schema. We extended our
previously reported and open source Eureka! Clinical Analytics software with this capability. The same software
has created i2b2 data marts for several projects, the largest being the nascent Accrual for Clinical Trials (ACT)
network, for which it has loaded over 147 million facts about 1.2 million patients.
Introduction
A recent Institute of Medicine report on the CTSA program recommended that the consortium’s members engage
more in consortium-level activities regionally and nationally1. The consortium’s members have begun initiatives in
enhancing access to electronic health record (EHR) data for accrual into clinical trials and conducting comparative
studies of treatment effectiveness in diverse populations2,3
. Both of these use cases may require looking beyond
one’s own institution to find study participants4. Leading technologies for implementing networks of EHR data for
research are i2b25 and SHRINE
6. They provide access to local data and mechanisms to query for aggregate
information such as counts, and the networking protocols and interfaces for sharing aggregate information across
institutions, respectively. Different i2b2 projects within an i2b2 deployment can contain different datasets.
Populating an i2b2 project from local EHRs and data warehouses remains a function that sites adopting i2b2 must
implement separately due to the variety of data environments found at academic centers.
Loading data from local systems into an i2b2 project is achieved through ETL software7. Commercial and locally
developed ETL solutions typically involve specifying the procedural steps needed to move data from one schema
and representation to another. Even with commercial tools, for a typical academic health system several FTEs of
local support are needed to build and maintain the procedural logic. Because research data networks use different
data models and ontologies for representing data, it is typically necessary to maintain separate i2b2 databases and
ETL processes for each network of interest. Reusing procedural logic between those ETL processes would
substantially reduce the burden of joining a new network, but existing tools typically do not facilitate reuse8. While
i2b2 does not have an ETL implementation built-in, it does implement an ontology cell that provides storage and
interfaces for working with standard terminologies and custom data representations. I2b2 also has a simple star
schema with a central fact table (observation_fact) and dimension tables for patients, visits, providers and concepts.
We hypothesized that i2b2’s data schema design and ontology cell together provide most of the metadata needed to
configure an ETL process that can be reused across i2b2 projects at an institution.
We previously developed Eureka! Clinical Analytics, an open source ETL system that is designed to create data
marts from clinical data warehouses and other large clinical datasets9. Eureka!’s core data loading code is the
Analytic Information Warehouse system, a tool we previously applied to processing large clinical datasets in
analyses of hospital readmissions10
. Eureka! supports extracting data from clinical data warehouses with a variety of
data schemas and representations; optionally computing clinical phenotypes10,11
representing patterns in EHR data
that signify disease, treatments and responses; and loading the data and computed phenotypes into i2b2. In support
of this process, we originally implemented in Eureka! using the Protégé ontology editor12
an ontology containing a
clinical data model and hierarchies representing standard terminologies. This ontology was the primary source of
184

configuration information for controlling the data loading and phenotyping processes. Because the ontology was
unique to Eureka!, keeping it up-to-date with current versions of standard terminologies became prohibitively
resource intensive. Meanwhile, the database schema implemented by i2b2’s ontology cell has become a common
format for sharing standard medical terminologies. We aimed to replace the Protégé ontology with support for
reading the data model and terminology information from an i2b2 ontology cell’s database schema. This paper
describes our technical implementation and discusses the extent to which we have achieved our goal of relying
primarily on the ontology cell metadata to control our ETL process into i2b2.
Methods
Use cases
We are evaluating the flexibility of the metadata-driven ETL process implemented by Eureka! in three scenarios that
are either under development or completed. While the sections below focus on a single representative project within
each of the three use cases, the Results section more broadly shows statistics on all of the major projects in which
Eureka! has been used to-date.
Connecting to a national research data network
The Accrual for Clinical Trials (ACT) Network is a SHRINE-based network of over 20 CTSA hubs. It aims in part
to enable investigators to query for patient counts from participating hubs using their web browser in a self-service
fashion. The first implementation phase, which setup i2b2 and SHRINE components at each site and loaded them
with data, was completed in Summer, 2015. Subsequent phases aim to use the network to facilitate accrual into high
priority clinical trials. Our institution aimed to use Eureka! as the ETL engine for making local EHR data available
to the network for query.
Local EHR data is available through the Emory Clinical Data Warehouse, an enterprise relational data warehouse
architected with a dimensional modeling approach. It is implemented using the Oracle 11g database system (Oracle
Corp., Redwood Shores, CA). It currently contains over 8 million patients and 35 million encounters from 5
hospitals and our institution’s clinics. It contains almost the entire contents of Emory’s EHR (Cerner Corp., Kansas
City, MO) integrated with data from billing and other systems. It is refreshed nightly. To avoid heavy loads on the
production data warehouse, we developed a cloning process using Oracle’s dump file export and import tools that
clones tables of interest from production into a staging area for this project.
Major technical work for the project involved mapping local codes for laboratory tests and medication orders to the
LOINC laboratory test13
and RxNorm medication14
codes required by the project, as well as mapping local visit and
demographics value sets for gender, race and the like to the value sets in the network’s data model. We developed
and configured a data adapter for Eureka! to generate SQL for querying demographics, visits, labs, medication
orders, diagnosis codes and procedure codes from the staging area. We used Eureka! to load 3 ½ years of data from
January 2012 through May 2015 into an i2b2 project.
Providing clinical data access for quality improvement investigations
Many academic centers are adopting national data registries containing EHR data that enable them to benchmark
their performance against their peers using common metrics such as length of stay, rate of hospital readmissions
within 30 days and rate of mortality. We created a local copy of 5 years of data from one of these registries, the
UHC Clinical Database15
, to support developing local metrics to perform deep dives into the patient populations that
drive performance on standard metrics.
The UHC Clinical Database contains de-identified administrative data and limited clinical data from over 200
hospitals associated with US academic medical centers. Variables include demographics and visit details mapped by
UHC to an UHC-specific coding system, and ICD-9 diagnosis and procedure billing codes. De-identified data files
going back many years are available to UHC members for download. We created a database schema that mirrors the
structure of and relationships between the data files, and we loaded 5 years of content from the files into the schema.
We developed and configured a data adapter for Eureka! to generate SQL for querying the schema. We loaded the
data into an i2b2 project.
Providing access to clinical data sets for biomedical informatics training and education
Biomedical informatics training programs typically do not provide access to informatics systems loaded with real
clinical data. Technical barriers include availability of large de-identified clinical datasets with data represented
185

using standards, and a low-cost solution for loading such data into a widely used clinical data warehousing system
that does not require extensive data warehousing expertise to use.
The MIMIC-II Database16
is a large de-identified dataset containing clinical and administrative data on over thirty-
two thousand patients who were in an intensive care unit. It is publicly available with a signed data use agreement.
The laboratory test codes in the dataset recently were mapped to the LOINC standard17
, and ICD-9 diagnosis and
procedure codes are in the dataset. Demographics and visit details are represented using custom codes.
We developed and configured a data adapter for Eureka! that generates SQL for querying MIMIC-II data from the
PostgreSQL database that is available from the PhysioNet project as a virtual machine (http://physionet.org). The
data adapter supports querying demographics, visits, labs, diagnoses and procedures. These data were loaded into
i2b2, and the resulting i2b2 project was made available to a class of over 20 students for assignments in working
with clinical data, formulating hypotheses and performing data analysis. This deployment is part of the
CardioVascular Research Grid, an initiative in developing cloud computing resources for data management and
analysis for cardiovascular research18
.
Eureka! Clinical Analytics
Eureka! has a three-tiered architecture, shown in Figure 1, with web application (user interface), services and
backend layers that communicate via representational state transfer (REST) APIs. The server side is implemented in
Java (https://www.oracle.com/java/), and the client side is implemented using modern web client programming
languages and technologies. The backend implements ETL job processing and tracking. The web application
(webapp) and services layers implement a user interface, file upload (for ETL jobs involving extracting data from
files), and phenotype storage. A customized JA-SIG CAS (http://jasig.github.io/cas/4.1.x/index.html) server
authenticates users in all three layers and facilitates audit trailing. It supports “local” accounts with usernames and
hashed passwords stored in Eureka!’s database, or Lightweight Directory Access Protocol (LDAP) or OAuth
(http://oauth.net) provider accounts.
Figure 1. Eureka! Clinical Analytics component diagram.
Data Flow
An engineer creates an ETL process using the webapp’s job submission screen, shown in part in Figure 2. The user
specifies a data source adapter, an action to perform on the data, a set of concepts representing the data to load, and
an optional date range. Data source adapters configure Eureka! to extract data from a specified database or data file.
Actions load data into a target i2b2 project or other database or data file. Separate screens support specifying a data
source adapter with database connection information, and mappings from the unique structure and semantics of the
data source into Eureka!’s internal representation of EHR data. These configuration capabilities assume the
existence of a central data warehouse or research database from which to extract data. Eureka! does not currently
implement the substantially more diverse data transformations that would be needed to extract data directly from a
transactional system like an EHR.
186

Part of Eureka!’s internal data model is shown in Figure 3. While the model predates standards for modeling EHR
data such as OMOP19
, the PCORnet common data model20
and the ACT data model21
, it mirrors their structure and
semantics closely. While historically Eureka!’s internal model has used our institution’s local laboratory and
medication order codes, we have moved in the past year to representing labs with LOINC and medication orders
with RxNorm. Data transformations such as clinical phenotyping occur on data represented in the internal model.
Figure 2. The Eureka! job submission screen, showing the submission of a job loading the MIMIC-II dataset (see
Methods) into an i2b2 project. Data to load is specified by dragging concepts from the hierarchy on the left into the
blue Concepts box on the right. Users also may specify a date range.
The terminologies used in the internal model are stored in an extended version of the i2b2 ontology cell’s schema,
shown in Figure 4. We add one column to each ontology table, EK_UNIQUE_ID, to store a system-wide unique
identifier for every concept. We also may store additional metadata about modifiers depending on how they are
represented. Modifiers are attributes of a concept such as dose and route for a medication. They map to properties in
the Eureka! internal model. A modifier’s value set can be represented as a list of values in the concept’s
C_METADATA_XML fragment or as separate records in the concept’s ontology table. While the former provides
sufficient metadata to map a modifier to a Eureka! property, the latter does not. Thus, we add to the ontology cell
schema an additional EK_MODIFIER_INTERP table to annotate such modifier values with their value set
membership. Finally, we add a EK_TEMP_UNIQUE_IDS temporary table for intermediate metadata processing
187

during bulk retrieval. The extensions allow automated import of ontology cell tables as delimited files or SQL
statements, which are increasingly common ways of sharing laboratory, medication, diagnosis and procedure codes.
We have implemented simple scripts to populate the additional columns and table after importing ontology tables
published by the ACT network21
.
Figure 3. Eureka! internal data model, showing various entities and their properties (blue boxes), and references
between entities (black lines).
Figure 4. Extended i2b2 metadata schema for use with Eureka!, showing four ontology tables that each have one
additional column as compared with i2b2’s standard ontology tables, the standard TABLE_ACCESS table
supporting concept lookup, and the Eureka!-specific EK_MODIFIER_INTERP table (see text for details).
188

Accessed from the job submission page, screens allow configuring an action with the type of data target (i2b2
project), database connection information, and metadata for mapping from the Eureka! internal data model into the
target database’s data representation. Example metadata for the “load into i2b2” action is shown in Figure 5.
Processing one Encounter at a time, each record in this table specifies the location of facts or dimension column
values in the internal data model (Figure 3). Mappings may be to a property of an Encounter or a path through a
reference from the Encounter to the property of another entity in the model. For example, ICD-9 codes are found by
traversing the EK_ICD9D reference from Encounter to Diagnosis. The patient’s date of birth is found by traversing
the patientDetails reference from Encounter to PatientDetails. The patient’s race is found in the race property of the
Encounter. A separate table, not shown, assigns records in this table to dimension table columns, otherwise records
are assumed to specify facts. These tables, together with the extended ontology cell schema, provide sufficient
metadata to load facts and dimension values into i2b2’s star schema.
Thus, Eureka! extends the i2b2 ontology cell’s schema with a total of three tables and one additional column per
ontology table. This is in addition to database connection information for the source and target databases, semantic
mappings from source coding systems to the standard coding systems supported by the internal data model, and
structural mappings from the source system’s physical schema to the structure of the internal data model.
Figure 5. Mappings from the Eureka! internal data model to facts and the dimension tables in i2b2’s star schema.
System requirements
We typically install Eureka! on CentOS version 6 or 7 Linux systems (http://www.centos.org). For testing purposes
we also have run it successfully on Ubuntu (http://www.ubuntu.com) and other distributions. Eureka! has been
tested on Oracle Java 7 virtual machines. It runs in a Tomcat 7 servlet container (http://tomcat.apache.org) with the
maximum heap size set to between 4 and 32 GB of RAM depending on the size of the datasets being loaded.
Eureka!’s ETL implementation is pipelined, thus its performance benefits from multiple processors and cores.
We install i2b2 on CentOS version 6 or 7 Linux systems. While we currently are using i2b2 version 1.7.05, the
projects described have used various releases of i2b2 1.5 and 1.7 over time.
We use Oracle 11g Express or Enterprise Edition database systems deployed on Linux except where indicated.
Results
Eureka! is available as open source under the Apache 2 license or the GNU General Public License (GPL) version 3.
The GPL-licensed version differs from the Apache-licensed version in supporting an additional action for writing
data and phenotypes to the Neo4j graph database (http://www.neo4j.com). In addition to loading data into i2b2, both
versions of the software also support loading data into a delimited file. Figure 6 illustrates Eureka! configured for
three separate ETL processes for creating i2b2 projects containing a portion of our local clinical data warehouse, a
local copy of 5 years of the UHC Clinical Database, and local copy of the MIMIC-II Database for the projects
described in Use Cases above.
189
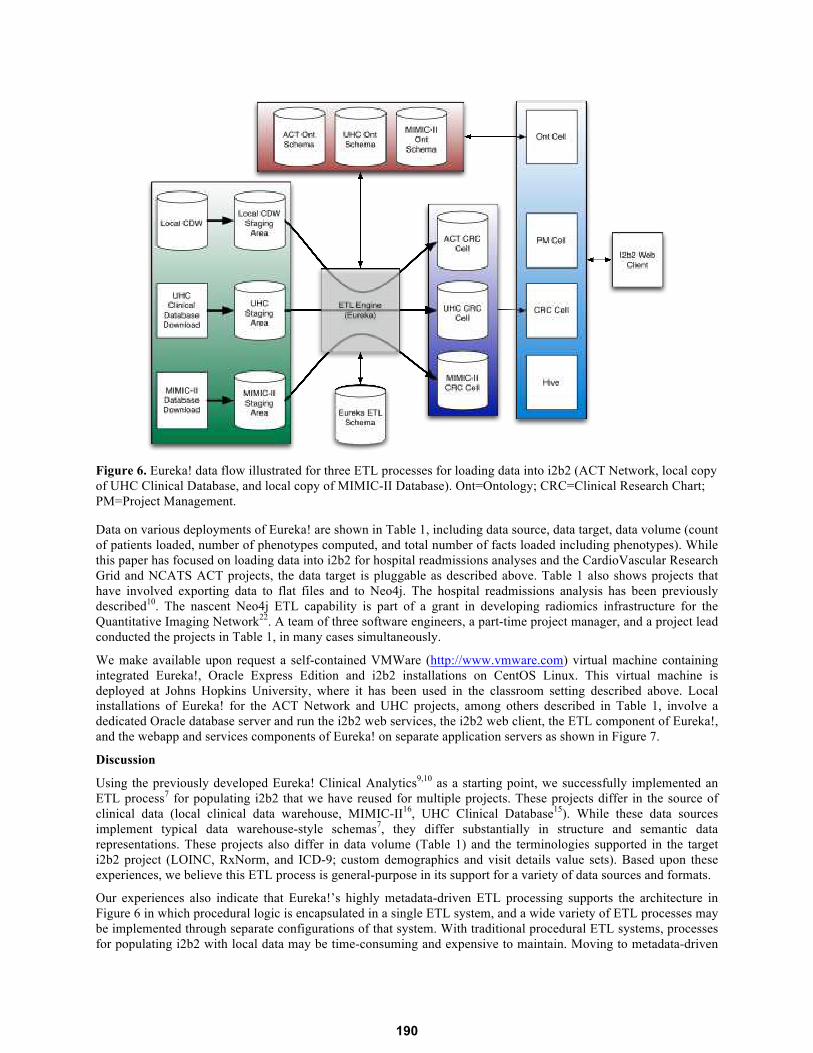
Figure 6. Eureka! data flow illustrated for three ETL processes for loading data into i2b2 (ACT Network, local copy
of UHC Clinical Database, and local copy of MIMIC-II Database). Ont=Ontology; CRC=Clinical Research Chart;
PM=Project Management.
Data on various deployments of Eureka! are shown in Table 1, including data source, data target, data volume (count
of patients loaded, number of phenotypes computed, and total number of facts loaded including phenotypes). While
this paper has focused on loading data into i2b2 for hospital readmissions analyses and the CardioVascular Research
Grid and NCATS ACT projects, the data target is pluggable as described above. Table 1 also shows projects that
have involved exporting data to flat files and to Neo4j. The hospital readmissions analysis has been previously
described10
. The nascent Neo4j ETL capability is part of a grant in developing radiomics infrastructure for the
Quantitative Imaging Network22
. A team of three software engineers, a part-time project manager, and a project lead
conducted the projects in Table 1, in many cases simultaneously.
We make available upon request a self-contained VMWare (http://www.vmware.com) virtual machine containing
integrated Eureka!, Oracle Express Edition and i2b2 installations on CentOS Linux. This virtual machine is
deployed at Johns Hopkins University, where it has been used in the classroom setting described above. Local
installations of Eureka! for the ACT Network and UHC projects, among others described in Table 1, involve a
dedicated Oracle database server and run the i2b2 web services, the i2b2 web client, the ETL component of Eureka!,
and the webapp and services components of Eureka! on separate application servers as shown in Figure 7.
Discussion
Using the previously developed Eureka! Clinical Analytics9,10
as a starting point, we successfully implemented an
ETL process7 for populating i2b2 that we have reused for multiple projects. These projects differ in the source of
clinical data (local clinical data warehouse, MIMIC-II16
, UHC Clinical Database15
). While these data sources
implement typical data warehouse-style schemas7, they differ substantially in structure and semantic data
representations. These projects also differ in data volume (Table 1) and the terminologies supported in the target
i2b2 project (LOINC, RxNorm, and ICD-9; custom demographics and visit details value sets). Based upon these
experiences, we believe this ETL process is general-purpose in its support for a variety of data sources and formats.
Our experiences also indicate that Eureka!’s highly metadata-driven ETL processing supports the architecture in
Figure 6 in which procedural logic is encapsulated in a single ETL system, and a wide variety of ETL processes may
be implemented through separate configurations of that system. With traditional procedural ETL systems, processes
for populating i2b2 with local data may be time-consuming and expensive to maintain. Moving to metadata-driven
190

systems such as Eureka! are likely to enable institutions’ efforts in joining research data networks, participation in
which is becoming a national mandate as well as important infrastructure in support of multicenter clinical research.
This architecture complements traditional data warehouse architectures that have a single database that represents
the source of truth for reporting on an institution’s operations. The principal benefit of a data warehouse system is
integration of data from disparate transactional systems for reporting. As healthcare institutions pool data across
institutions for research and quality improvement, maintaining a single data representation that is compatible with
every cross-institution initiative is unlikely to succeed. Even with standards, different data networks may justifiably
have different data models and representations that are optimized for their use cases. It is theoretically possible to
represent synonyms in an i2b2 ontology that assign an observation multiple terms from different terminologies, thus
allowing data to be stored once and queried using multiple data representations. However, in practice, differences in
the granularity of terminologies make using synonyms for this purpose difficult. It appears increasingly common for
institutions to build data marts off of a central warehouse for each network in which they participate.
Table 1. Ongoing and completed project data (2011 – present).
Project name # of
users
Data source Data target
(and software
version, where
applicable)
Count of
phenotypes
computed
Count of
patients
loaded
Count of facts
loaded
(including
phenotypes)
Project status
Hospital
readmissions
analysis
11 Emory Clinical
Data Warehouse
(inpatient
discharges from
10/2006-3/2011)
Tab-delimited
file
7,886,868 149,514 41,031,5151 Completed
Hospital
readmissions
analysis
11 UHC Clinical
Database
(inpatient
discharges from
10/2006-3/2011)
Tab-delimited
file
593,428,440 11,794,310 1,685,673,6831 Completed
Lymphoma data
registry
4 Emory Clinical
Data Warehouse
i2b2 1.7.05 0 4,870 13,086,0712 Completed
Lung cancer data
registry
4 Emory Clinical
Data Warehouse
i2b2 1.7.05 0 1,554 310,3302 Completed
CardioVascular
Research Grid
34 MIMIC-II (all
encounters)
i2b2 1.7.05 13,196 32,074 6,446,4132 Production
Quantitative
Imaging Network
6 NLST data files
(all patients)
Neo4j 2.2.2 0 53,452 374,1643 Development
NCATS ACT 42 Emory Clinical
Data Warehouse
(all discharges
1/2012-5/2015)
i2b2 1.7.05 0 1,153,320 147,345,6592 Beta testing
1number of non-null values in the output file,
2number of rows in the i2b2 project’s observation_fact table,
3number of nodes in the graph
database
Using the i2b2 ontology cell as the primary source of metadata for Eureka! has the principal benefit of leveraging
the work of national projects in developing and maintaining hierarchies of standard codes. Typical coding systems
are updated quarterly to annually, and standard coding systems still frequently lack hierarchies that group the codes
in semantically meaningful ways. Thus, maintaining coding hierarchies is very resource intensive. A pitfall in using
the i2b2 ontology cell is representing modifier values as separate records in an ontology table, which may result in
incomplete metadata for the purpose of building an ETL process (see Methods). As we have demonstrated, a
relatively small amount of additional metadata is sufficient to overcome this problem.
Eureka! is available as open source. Beyond several internal deployments, we support a deployment at Johns
Hopkins University for the CardioVascular Research Grid (see educational use case in Methods). We also recently
began a deployment at Medical University of South Carolina as part of a southeastern regional CTSA consortium.
191

These efforts are enabling the development of installation tools for Eureka! that we expect will support
dissemination to interested institutions. Additional work required to support dissemination will include more
complete graphical screens for specifying the schema of a source system for Eureka!’s query generation, and
development of solutions to sharing configurations for accessing frequently used public datasets, versions of
standard terminologies in Eureka!’s extended i2b2 ontology schema format, common target data systems like i2b2,
and the specification of clinical phenotypes.
Figure 7. Deployment diagram showing Eureka! receiving a feed from an enterprise clinical data warehouse. The
diagram shows the database and application server deployments, and it shows the network zones in which those
systems are deployed (DMZ, Academic, Healthcare).
Limitations of Eureka!’s implementation at present include lack of a capability to compose metadata describing data
integration steps. Eureka supports integration of data from multiple source systems into a single target database, but
it requires executing sequential data loads a data source at a time. Eureka lacks support for expression of negated
concepts and inclusion and exclusion criteria, though in many cases phenotypes can be constructed that represent
mutually exclusive states implicitly. Another limitation is lack of support for emerging standards for representing
phenotypes such as the Health Quality Measure Format (HQMF)23
. These are all areas of future work. Filling in
these feature gaps will enable us to conduct more detailed evaluations of the metadata-driven ETL architecture.
Conclusion
Eureka! Clinical Analytics has supported deployment of clinical data from multiple sources to multiple data marts
with different data model and ontology requirements with few technical resources. This technology provides a low-
cost and sustainable technical infrastructure for joining research data networks and otherwise building research data
marts that enhance access to EHR data for the research community.
Acknowledgments
This work has been supported in part by PHS Grant UL1 RR025008 from the CTSA program, NIH, NCATS; PHS
grant UL1 TR000005 from the CTSA program, NIH, NCATS; NHLBI grant R24 HL085343; NCI grant U01
CA187013; Emory Healthcare; and Emory Winship Cancer Institute.
References
1. Committee to Review the Clinical and Translational Science Awards Program. The CTSA Program at NIH:
Opportunities for Advancing Clinical and Translational Research. In: Leshner AI, Terry SF, Schultz AM,
Liverman CT, editors. Washington (DC): National Academies Press (US), National Academy of Sciences;
2013.
192

2. National Center for Advancing Translational Sciences. CTSA Consortium Tackling Clinical Trial Recruitment
Roadblocks. 2015 [updated Aug 21, 2015; cited 2015 Sep 22]; Available from:
http://www.ncats.nih.gov/pubs/features/ctsa-act.
3. Collins FS, Hudson KL, Briggs JP, Lauer MS. PCORnet: turning a dream into reality. J Am Med Inform Assoc.
2014;21(4):576-7.
4. Appel LJ. A primer on the design, conduct, and interpretation of clinical trials. Clin J Am Soc Nephrol.
2006;1(6):1360-7.
5. Murphy SN, Weber G, Mendis M, Gainer V, Chueh HC, Churchill S, et al. Serving the enterprise and beyond
with informatics for integrating biology and the bedside (i2b2). J Am Med Inform Assoc. 2010;17(2):124-30.
6. McMurry AJ, Murphy SN, MacFadden D, Weber G, Simons WW, Orechia J, et al. SHRINE: enabling
nationally scalable multi-site disease studies. PloS one. 2013;8(3):e55811.
7. Kimball R, Ross M. The Data Warehouse Toolkit: The Complete Guide to Dimensional Modeling. 2nd ed. New
York: Wiley Computer Publishing; 2002.
8. He T, Gudyka M. Build a Metadata-Driven ETL Platform by Extending Microsoft SQL Server Integration
Services. 2008 [cited 2016 Jan 5]; Available from: http://download.microsoft.com/download/D/2/0/D20E1C5F-
72EA-4505-9F26-FEF9550EFD44/Build%20a%20Metadata-
Driven%20ETL%20Platform%20by%20Extending%20Microsoft%20SQL%20Server%20Integration%20Servi
ces.docx.
9. Post A, Kurc T, Rathod H, Agravat S, Mansour M, Torian W, et al. Semantic ETL into i2b2 with Eureka!
AMIA Summits Transl Sci Proc. 2013:203-7.
10. Post AR, Kurc T, Cholleti S, Gao J, Lin X, Bornstein W, et al. The Analytic Information Warehouse (AIW): A
platform for analytics using electronic health record data. J Biomed Inform. 2013;46(3):410-24.
11. Conway M, Berg RL, Carrell D, Denny JC, Kho AN, Kullo IJ, et al. Analyzing the heterogeneity and
complexity of Electronic Health Record oriented phenotyping algorithms. AMIA Annu Symp Proc. 2011:274-
83.
12. Stanford Medical Informatics. The Protege Ontology Editor and Knowledge Acquisition System. 2012 [cited
2012 December 11]; Available from: http://protege.stanford.edu/.
13. McDonald CJ, Huff SM, Suico JG, Hill G, Leavelle D, Aller R, et al. LOINC, a universal standard for
identifying laboratory observations: a 5-year update. Clin Chem. 2003;49(4):624-33.
14. Parrish F, Do N, Bouhaddou O, Warnekar P. Implementation of RxNorm as a terminology mediation standard
for exchanging pharmacy medication between federal agencies. AMIA Annu Symp Proc. 2006:1057.
15. Sutton JM, Hayes AJ, Wilson GC, Quillin RC, 3rd, Wima K, Hohmann S, et al. Validation of the University
HealthSystem Consortium administrative dataset: concordance and discordance with patient-level institutional
data. J Surg Res. 2014;190(2):484-90.
16. Joon L, Scott DJ, Villarroel M, Clifford GD, Saeed M, Mark RG, editors. Open-access MIMIC-II database for
intensive care research. Engineering in Medicine and Biology Society, EMBC, 2011 Annual International
Conference of the IEEE; 2011 Aug. 30 2011-Sept. 3 2011.
17. Abhyankar S, Demner-Fushman D, McDonald CJ. Standardizing clinical laboratory data for secondary use. J
Biomed Inform. 2012;45(4):642-50.
18. Winslow RL, Saltz J, Foster I, Carr JJ, Ge Y, Miller MI, et al. The CardioVascular Research (CVRG) Grid.
Proceedings of the AMIA Summit on Translational Bioinformatics. 2011:77-81.
19. Observational Health Data Sciences and Informatics (OHDSI). OMOP Common Data Model. 2016 [cited 2016
Jan 5]; Available from: http://www.ohdsi.org/data-standardization/the-common-data-model/.
20. PCORnet. Common Data Model (CDM) Specification, Version 3.0. 2015 [cited 2016 Jan 5]; Available from:
http://www.pcornet.org/wp-content/uploads/2014/07/2015-07-29-PCORnet-Common-Data-Model-v3dot0-
RELEASE.pdf.
21. ACT Data Harmonization Working Group. ACT Ontology and Data Dictionary v1.3. 2015 [cited 2016 Jan 5];
Available from:
https://ncatswiki.dbmi.pitt.edu/acts/attachment/wiki/DataHarmonization/ACT%20Ontology%20and%20Data%
20Dictionary%20v1.3.docx.
22. Kurland BF, Gerstner ER, Mountz JM, Schwartz LH, Ryan CW, Graham MM, et al. Promise and pitfalls of
quantitative imaging in oncology clinical trials. Magn Reson Imaging. 2012;30(9):1301-12.
23. Health Level 7. Representation of the Health Quality Measures Format (eMeasure), Release 2. Ann Arbor, MI:
2012 V3_HQMF_R2_DSTU_2012SEP.
193