distributors’ perception on coca cola distribution system …
TRANSCRIPT
DISTRIBUTORS’ PERCEPTION OF COCA COLA
DISTRIBUTION SYSTEM IN NAIROBI, KENYA
BY: MUTHONI KARANJA
REG NO: D61/P/8692/05
SUPERVISOR: DR. R. MUSYOKA
A MANAGEMENT RESEARCH PROPOSAL SUBMITTED IN
PARTIAL FULFILLMENT OF THE REQUIREMENTS OF THE
DEGREE OF MASTER OF BUSINESS ADMINISTRATION,
SCHOOL OF BUSINESS, UNIVERSITY OF NAIROBI
OCTOBER 2009

ii
DECLARATION
I, the undersigned, declare that this project is my original work and that it has not been
presented in any other university or institution for academic credit.
Full name: HANNAH MUTHONI KARANJA
REG NO: D61/P/8692/05
Signature…………. Date…………………..
SUPERVISOR
This project has been submitted for examination with my approval as university
supervisor.
Signature…………… Date………………….

iii
DEDICATION
I wish to dedicate this thesis to my late grandmother –Hannah Muthoni Macharia for her
continued emotional support.
iv
ACKNOWLEDGMENTS
Acknowledgments go to my parents who have not only supported me financially but have
been there for me all the way. Thanks Luis Gitonga (Hubby) for the love, great support
and encouragement that you have always showered me with it went a long way.
I also wish to thank my supervisor Dr. R Musyoka for his support when doing the thesis.
May God bless you All
LIST OF TABLES
Table 4.1: Gender ……………………………………………………………………….28
Table 4.2: Years in Operation …………………………………………………………..29
Table 4.3: Frequency of distribution strategies review …………………………………32
Table 4.4: Company Related Features ………………………………………………….33
Table 4.5: Rating of Nairobi Bottlers Company Limited Services ……………………..34
Table 4.6: Frequency of distribution strategies review …………………………………35
Table 4.7: Frequency of distribution strategies review …………………………………36
LIST OF FIGURES
Figure 2.1: Conceptual Framework ...………….……………………………………….25
Figure 4.1: Ownership of the Company …………………………….…………………..30
Figure 4.2: NBL‟s Services to Distributor Firms ………………………………………31
Figure 4.3: Advance Information about Delays ………………………………………...36
Figure 4.4: Adequacy of Storage Space ………………………………………………...37
Figure 4.5: NBL‟s Inventory Management and Distribution Performance …………….38
ABSTRACT
This study was set out to investigate the distributor‟s perception on Coca Cola
distribution system in Nairobi. The objectives of the study were determine the perception
of Coca Cola Company distributors on the channel management used, the perception on
the physical distribution management and to establish what the coca cola distributors
perceive as the hindrances in the distribution system. The study aimed at determining the
distributor‟s perception on Coca Cola distribution system in Nairobi. The author was not
aware of any study done on distributor‟s perception and distribution system of Coca Cola
which was the gap the study sought to fill.
This study adopted a survey design that was most appropriate to investigate the
distributor‟s perception on the Coca Cola distribution system in Nairobi. The population
of interest consisted of distributors of the Nairobi Bottlers which is a subsidiary Coca
Cola bottling company. A stratified sample was selected through proportionate sampling
from Nairobi urban and Nairobi rural. Data collection was done through self-
administered questionnaires with closed and open-ended questions. The data collected
was analyzed using descriptive statistics. This involved the use of frequency tables,
percentages, rank ordering, and means scores. Percentages and rank ordering helped the
researcher to address the objectives of the study.
The study found out that the respondents had very high knowledge on distribution of
products which is consistent with industry norms. The finding suggests that service
accorded to distributors by NBL to the distributors was rated as good by a majority of the
respondents. There existed a motivational strategy which was both financial and non-
financial. NBL regularly reviews the performance of products with the distributors; and
offeres high quality services it consulted them after the promotions to advice on the
results. It can be concluded that the distributors have a positive perception of NBL‟s
distribution system in Nairobi and that it holds a positive image. NBL should form
linkages to ensure better productivity and performance. NBL needs to invest more in
transport trucks and vans so as to ensure constant supply of products at all times.
1
CHAPTER 1: INTRODUCTION
1.1 Background
Today‟s era of globalization has seen the emergence of the „global‟ corporation. Such a
corporation has operations scattered over multiple locations across the globe. One of the
most important aspects of the „global‟ corporation is the international distribution system
employed for the distribution of product to customers in different parts of the world. The
distribution process includes the physical handling and distribution of goods, passage of
title and the buying and selling negotiations between producers and middlemen and
between middlemen and consumers (Cateora and Graham 1996).
In the theory of marketing mix, place (distribution) determines where the product will be
sold and how it will get there (Kotler, 2000). Griffith and Ryan (1996) hold that
distribution channels evolved through the utilization of national resources contained
within an area of trade. The need to move the resources to other areas where they were in
demand brought about the need for distribution channels. A channel of distribution
comprises a set of institutions which perform all of the activities utilised to move a
product and its title from production to consumption.
Every business that manufactures or moves tangible products from place to place faces a
similar set of demands from customers, suppliers, investors and industry analysts: to
deliver products faster, reduce inventory, lower operating costs, and deal with
increasingly complex orders. Of course, these requirements often conflict with each
other, creating trade off and opportunity costs throughout the supply chain.
Mergers, divestitures, e-commerce, and growth further complicate the process of moving
products from manufacturers to customers. Ultimately, management must confront the
issue of how to effectively optimize its distribution network.
Paliwoda and Thomas (1998), points out that there are a number of differences between
national and international distribution as the procedure and documentation for
international sales transactions is more complex. In essence, it is characterized by higher
2
costs, involving more parties, having higher financial penalties for errors and requiring
more data and knowledge of international trade rules and regulations. The average export
order size is much larger than the domestic one and it requires more credit checks, quality
inspection and verification and it involves more intermediaries. However, the number of
channel players involved in international trade is becoming shorter by the day.
Distribution costs on the other hand are not uniform across markets.
Successful companies are using location and network efficiency as a competitive weapon
to drive down overall operating costs and create value in the supply chain. Performance
of the distribution network as a whole and of its component facilities is scrutinized
closely to find hidden opportunities. These companies recognize that the facility strategy
must be robust enough to handle current demand, while remaining flexible enough to
react to changing market conditions and avoid business risk.
Streamlining the distribution network is often clouded by other challenges, such as
globalization, e-market place trends, collaborative commerce, and the technology
evolution. In the rush to apply solutions across the supply chain, it is easy to overlook the
backbone of distribution performance, that is, the location, costs and conditions affecting
each facility. Undeniably, technology solutions promote increased visibility, inventory
control and performance measurement that allow stakeholders to make better decisions
and improve operations.
1.1.1 The Concept of Perception
Perception is a process of giving meaning to sensory stimuli. People act and react on the
basis of the way they sense and interpret the world around them. Perception as a
determinant of behaviour in organizations has been and is likely to be a subject of fierce
debate amongst human resource management community (Armstrong, 2004). It is
therefore not surprising that perception is a central concept in procurement and
management of human resources. Bennett (1997) argues that perception is essential
because of the amount of information, signals and cues, which the senses constantly
assailed. He suggests that the process by which individual perception is developed is both
learned and instinctive. Cole (1997) notes that the understanding of perception in work
3
situations is critical to successful managerial and organizational performance for those
who have people to manage. Majumder (1996) observes that perception is the basis on
which everyone forms their understanding of the world. People make interpretations of
others that they meet, and places and situations that are encountered by combining each
of these elements indicated to produce their own individual picture, which they can
understand and be comfortable with.
Perception is affected by repetition and familiarity. Beardwell et al (1997) notes that
something or someone who is always present acquires the illusion of permanence and
that routines and habits are formed by organizing activities and interactions into regular
patterns based on a combination of expectation and near certainty (Beardwell et al,
1997). According to Martin and Jackson, (1997) perception is affected by the
characteristics of perceiver and perceived. The greater the knowledge of perception on
the part of people and organizations, the greater the mutual understanding likely to be
generated; and where problems do arise, the greater the potential of addressing these
effectively.
Cole (1997) observes that personal characteristics affect the type of characteristics likely
to be seen in others, their levels of importance, and whether these are or should be
negative or positive. Those being perceived greatly influence the views of the perceiver
through their visibility (appearance, manner, dress, speech) and through their status and
role (either in a given situation or in a wider context) (Martin and Jackson, 1997).
1.1.2 The concept of distribution system
Distribution is where intermediaries, such as wholesalers and retailers, split large
production runs into small amounts (breaking bulk) and create an assortment of products
to offer customers. Distributors facilitate or help the flow of the transaction by physically
moving product, information, or funds through the distribution channel. Distribution
systems thus provide a standard of living for customers by moving products from
producers to users in the most cost efficient manner as possible. This calls for marketing
systems to constantly look for ways to lower the overall cost of distribution channels
while striving to improve relationships between channel members. The main functions of
4
a distribution system are ordering, warehousing and physical movement of the product
from producers to end users.
The distribution process includes the physical handling and distribution of goods, passage
of title and the buying and selling negotiations between producers and middlemen and
between middlemen and consumers (Cateora and Graham 1996). In the theory of
marketing mix, place (distribution) determines where the product will be sold and how it
will get there (Kotler, 2001). Griffith and Ryan (1996) hold that distribution channels
evolved through the utilization of national resources contained within an area of trade.
The need to move the resources to other areas where they were in demand brought about
the need for distribution channels. A channel of distribution comprises a set of
institutions which perform all of the activities utilised to move a product and its title from
production to consumption.
Frequently there may be a chain of intermediaries; each passing the product down the
chain to the next organization, before it finally reaches the consumer or end user. This
process is known as the 'distribution chain' or the 'channel.' Each of the elements in these
chains will have their own specific needs, which the producer must take into account,
along with those of the all important end user. A number of alternate 'channels' of
distribution may be available: Selling direct, such as via mail order, Internet and
telephone sales, Agent, who typically sells direct on behalf of the producer ,Distributor
(also called wholesaler), who sells to retailers and Retailer (also called dealer), who sells
to end customers (Cateora and Graham, 1996).
Distribution channels may not be restricted to physical products alone. They may be just
as important for moving a service from producer to consumer in certain sectors, since
both direct and indirect channels may be used. Hotels, for example, may sell their
services (typically rooms) directly or through travel agents, tour operators, airlines,
tourist boards and centralized reservation systems (Churchill and Peter, 1999). There
have also been some innovations in the distribution of services. For example, there has
been an increase in franchising and in rental services the latter offering anything from
5
televisions through tools. There has also been some evidence of service integration, with
services linking together, particularly in the travel and tourism sectors. For example, links
now exist between airlines, hotels and car rental services. In addition, there has been a
significant increase in retail outlets for the service sector. Outlets such as estate agencies
and building society offices are crowding out traditional grocers from major shopping
areas (Majumder, 1996).
Distribution channels can thus have a number of levels. Kotler (2001) defined the
simplest level that of direct contact with no intermediaries involved, as the 'zero level'
channel. The next level, the 'one level' channel, features just one intermediary; in
consumer goods a retailer, for industrial goods a distributor. In small markets (such as
small countries) it is practical to reach the whole market using just one and zero level
channels. Majumder (1996) in large markets a second level, a wholesaler for example, is
now mainly used to extend distribution to the large number of small, neighborhood
retailers. In Japan the chain of distribution is often complex and further levels are used,
even for the simplest of consumer goods.
Of the various `levels' of distribution, which they refer to as the `channel length', (Kotler,
2001) also added another structural element, the relationship between its members:
Conventional or free flow. This is the usual, widely recognized, channel with a range of
`middlemen' passing the goods on to the end user. A temporary `channel' may be set up
for one transaction; for example, the sale of property or a specific civil engineering
project. This does not share many characteristics with other channel transactions, each
one being unique and vertical marketing system (VMS) in this form; the elements of
distribution are integrated.
Many of the marketing principles and techniques which are applied to the external
customers of an organization can be just as effectively applied to each subsidiary's, or
each department's, 'internal' customers (Churchill and Peter, 1999) In some parts of
certain organizations this may in fact be formalized, as goods are transferred between
separate parts of the organization at a `transfer price'. To all intents and purposes, with
the possible exception of the pricing mechanism itself, this process can and should be
6
viewed as a normal buyer seller relationship. The fact that this is a captive market,
resulting in a `monopoly price', should not discourage the participants from employing
marketing techniques (Cateora and Graham, 1996).
1.1.3 Overview of Soft Drinks Industry in Kenya
The soft drink industry is one of the very competitive industries in the market. In Kenya
it has both local and multinational companies thus making it one of the very competitive
industries. The soft drink industry is classified into; the carbonated soft drinks, the ready
to drink juices and the mineral water.
In Kenya the soft drink industry consists of Coca cola Kenya which has six strategically
located bottling companies in the country, Softa bottling company, Milly foods,
Trufoods, premier foods and East African Breweries Ltd (EABL). Earlier Pepsi company
had operations in Kenya but pulled out after a bruising battle with Coca cola during the
difficult trading environment of the early 1980s (Abdallah, 2000). Schweppes Company
entered the market in the late 1990s but also pulled out in early 2000. The major brands
of Coca cola are Coke, Fanta, Sprite, Krest, Stoney and Dasani with Coke being their
flagship brand. While those for Kuguru foods are Softa cola, Softa lemon, Softa orange
and Mecca cola. Milly brands include Picana which is a juice that come in different
flavours such as mango, passion and cocktail. The EABL has also entered into the soft
drinks with its Malta Guinness and Alvaro brands.
Implementation of structural adjustment programmes (SAPS) in Kenya led to intense
competition which saw new entrants‟ especially cheap imports and substitutes threaten
the strategic position of the incumbents in the market. Trade liberation of early 1990s
opened gates for massive imports thus saturating the disintegrating market in Kenya.
(Economic Survey, 2000) this saw the influx of Mirinda brands, canned Pepsi cola, Red
bull and even wines. The emergence of various milk processing firms in Kenya offered
consumer with wide growing choice of dairy products that also pose competition to soft
drinks.
7
With such an overwhelming variety, one wonder what makes a rational consumer choose
one particular brand of soft drink over the others available in the shelves. This has led to
intense competition for the same disposable income from the consumer. The
consumption of soft drinks is directly proportional to age (Abdalla, 2000). Therefore the
main target market for all these companies is the youth. Coca cola has a demand creation
competency that deals with promotion and recruitment of new customers, thus increasing
the consumer base. Coca cola practice aggressive, innovative and creative advertising
policies on billboards, Christmas Coca cola caravans, road side shows and point of
purchase raffles while the East African breweries concentrate on corporate advertising,
sales promotion and advertising on billboards, Softa on the other hand has played low
and imitated Coca cola through positioning of vendors (Push carts) strategically and
advertising through the radio.
Due to changing lifestyles and consciousness towards health, consumers have tended to
prefer low calorie drinks, bottled water and also tea. This has led to increasing number of
packaged water brands ranging from Keringet, Dasani –produced and distributed by coca
cola Company, Grange Park, Mt. Kenya, Highland and Kilimanjaro among others. It has
also led to Coca Cola Company producing diet drinks such as; Coke light, Fanta light and
Sprite light. Kenya Tea Packers (KETEPA) has also begun packaging iced tea. In the last
five years competition in the soft drinks industry has really intensified existing players
such as Softa (Kuguru foods) introduced Mecca cola which mostly targets the Muslim
community; East African Breweries has also introduced Alvaro which is a non-alcoholic
drink fruit flavored into the market while Coca Cola bottling company started distributing
the Schweppes products as well as most recently Novida (which was mainly to counter
competition from Alvaro).
1.1.4 Overview of Coca Cola Company
Coca-Cola originated as a soda fountain beverage in 1886 selling for five cents a glass.
Early growth was impressive, but it was only when a strong bottling system developed
that Coca-Cola became the world-famous brand it is today. It was however until 1948
that the Coca Company founded Nairobi Bottlers in Kenya.
8
Nairobi Bottlers later formed a partnership in the late 1960s with the Industrial and
Commercial Development Corporation (ICDC), which is the government‟s initiative for
promotion of investment. There were eight bottlers in Kenya, the other seven being: Mt
Kenya Bottlers, East Kenya Bottlers, Equator Bottlers, Kisii Bottlers, Flamingo Bottlers,
Rift Valley Bottlers and Coastal Bottlers. All these have common ownership in ICDC,
while the other investing owners differ. Coca-Cola South Africa bottling company
(Sabco), together with a local investment partner, acquired Nairobi Bottlers Limited from
The Coca-Cola Company in November 1995 and followed suit a little over two years
later with the purchase of Flamingo Bottlers in Nakuru from the Shah family in
December 1997. In 2000, East Kenya Bottling of Machakos was added to the territory,
thus reducing the number of bottlers to the current six.
Nairobi bottlers currently operate in Nairobi province, Machakos –up to Mutito wa ndei,
and Nakuru. There are 2 regions in Nairobi province namely rural and urban. The rural
region comprises of the whole of Waiyaki way from Kangemi up to fly over (limuru),
Eastleigh and its environs, then Thika road upto Murang‟a. Whereas urban comprises of
Nairobi town and its environs (such as Upperhill, Hurlingham, Westlands, Parklands,
South B and C, industrial area, Buru buru).
Nairobi Bottlers Limited has had to do more than design a good channel system which
they have set in motion. The system has required periodic modifications to meet the new
conditions in the market place. Modification becomes necessary since consumers buying
patterns have changed, market have expanded, product have matured through the product
lifestyle, new competition have arisen and innovative distribution strategies emerged. The
most difficult decision has involved revising the overall channel strategy. The company
has even considered replacing independent dealers with company owned dealers or local
franchised dealers with centralized operations and direct sales.
1.2 Statement of the Problem
Perception is influenced by intelligence, personality expectations, motivations and
interest. Perception and attitudes are developed over time and can change as how
information and experiences are acquired (Bennett, 1977; Mullins 1999). In the theory of
9
marketing mix, place (distribution) determines where the product will be sold and how it
will get there (Kotler, 2001). Griffith and Ryan (1996) hold that distribution channels
evolved through the utilization of national resources contained within an area of trade.
The need to move the resources to other areas where they were in demand brought about
the need for distribution channels. A channel of distribution comprises a set of
institutions which perform all of the activities utilised to move a product and its title from
production to consumption.
Today‟s era of globalization has seen the emergence of the „global‟ corporation. Such a
corporation has operations scattered over multiple locations across the globe. One of the
most important aspects of the „global‟ corporation is the international distribution system
employed for the distribution of product to customers in different parts of the world. The
paper examines issues involved in international distribution systems. Every business that
manufactures or moves tangible products from place to place faces a similar set of
demands from customers, suppliers, investors and industry analysts: to deliver products
faster, reduce inventory, lower operating costs, and deal with increasingly complex
orders. Of course, these requirements often conflict with each other, creating tradeoffs
and opportunity costs throughout the supply chain. Mergers, divestitures, ecommerce,
and growth further complicate the process of moving products from manufacturers to
customers. Ultimately, management must confront the issue of how to effectively
optimize its distribution network.
Performance of the distribution network as a whole and of its component facilities is
being scrutinized closely to find hidden opportunities. Companies are recognizing that the
facility strategy must be robust enough to handle current demand, while remaining
flexible enough to react to changing market conditions and avoid business risk.
Soft drinks companies are heavy spenders in quality distribution channels, yet not many
studies are available and showing the extent of input of the company in the distribution
channels. Coca Cola has been seen to invest a big amount of resources in distribution of
its brands. There exists no empirical evidence that the distribution system has led to
influence on distributor‟s perception of Coca Cola distribution system.
10
Local scholars have come up with the following findings: Mburu (2001) research on
perceived quality on brand choice on soft drinks found that quality enhances a positive
image of quality perception. Abdallah (2000) did a research on strategic marketing
practices of soft drinks and found out that promotional strategy and good network
distribution strategies are the corner stone of strategic marketing. Waweru (2003) carried
out a research on the extent to which soft drinks advertising slogans influence brand
preference and his conclusion were that slogans actually influence brand preference to
some extent.
The study is aimed at determining the distributor‟s perception on Coca Cola distribution
system in Nairobi. I am not aware of any study done on distributor‟s perception and
distribution system of Coca Cola. This is the gap which this study seeks to fill.
1.3 Objectives of the Study
The purpose of this study was to investigate the distributor‟s perception on Coca Cola
distribution system in Nairobi. The study mainly addressed the following objectives:
a. To determine the perception of Coca Cola Company distributors on the channel
management used in Nairobi
b. To determine the perception of Coca Cola Company distributors on the physical
distribution management.
c. To establish what the coca cola distributors perceive as the hindrances in the
distribution system.
1.4 Importance of the Study
This study is based on the premise that the passage of time and the very numerous and
significant changes in the business environment have led to totally different distribution
systems by companies. As a result there is need for a study that will update the existing
knowledge about distribution channels because the political, legal, economic and trading
environments have undergone numerous changes, ushering in new challenges for
company.
11
The study will be of importance to the policy makers. It will help them evaluate whether
the distribution channels adopted have had an impact on the targeted regions in as far as
the distribution of products is concerned. It will indicate whether the distribution network
is able to bring about the benefits that are associated with distribution channels. As a
result it will caution or encourage the promoters on the choice of distribution strategy in
future; so that the amount of resources spent on promotions can in some way be linked to
the intended positive reaction or change.
This study will determine the distribution network created by the Coca Cola Company. It
will give an idea on improving the distribution channels in order to improve the
efficiency of the distribution network, in creating awareness and customer loyalty.
Coca Cola management and stakeholders will benefit from the study as it will shed light
on the distribution system of the company. This will guide them as they improve the
distribution channel management and operations.
Researchers and scholars can use this information to add to their understanding of
distribution channels activities, channel operations and management as well as factors
that influence the perception of distributors on distribution systems.
The study will provide foundation and material for further related research. It will also
contribute to the growing body of knowledge in the field of marketing. The study could
also provide a good basis for future research on distribution channel activities of the
industrialists.
12
CHAPTER TWO: LITERATURE REVIEW
2.1 Introduction
This chapter presents the literature review providing a theoretical grounding for the
study, identifying the research issues that will be addressed. The chapter discusses other
works that give insight on distribution, perception concepts, as well as the distribution
system. It also provides the conceptual framework and a detailed outline of the
underlying concepts and variables.
2.2 Channel management
The channel decision is very important. In theory at least, there is a form of tradeoff: the
cost of using intermediaries to achieve wider distribution is supposedly lower. Indeed,
most consumer goods manufacturers could never justify the cost of selling direct to their
consumers, except by mail order. In practice, if the producer is large enough, the use of
intermediaries (particularly at the agent and wholesaler level) can sometimes cost more
than going direct (Kotler, 2001).Many of the theoretical arguments about channels
therefore revolves around cost. On the other hand, most of the practical decisions are
concerned with control of the consumer. The small company has no alternative but to use
intermediaries, often several layers of them, but large companies 'do' have the choice
(Churchill and Peter, 1999).
However, many suppliers seem to assume that once their product has been sold into the
channel, into the beginning of the distribution chain, their job is finished. Yet that
distribution chain is merely assuming a part of the supplier's responsibility; and, if he has
any aspirations to be market oriented, his job should really be extended to managing,
albeit very indirectly, all the processes involved in that chain, until the product or service
arrives with the end-user. This may involve a number of decisions on the part of the
supplier: Channel membership, Channel motivation and Monitoring and managing
channels (Majumder, 1996).
Intensive distribution is where the majority of resellers stock the `product' (with
convenience products, for example, and particularly the brand leaders in consumer goods
13
markets) price competition may be evident. Selective distribution is the normal pattern
(in both consumer and industrial markets) where `suitable' resellers stock the product.
Exclusive distribution is where specially selected resellers (typically only one per
geographical area) are allowed to sell the `product'. (Churchill and Peter, 1999)
According to Cateora and Graham (1996) it is difficult enough to motivate direct
employees to provide the necessary sales and service support. Motivating the owners and
employees of the independent organizations in a distribution chain requires even greater
effort. There are many devices for achieving such motivation. Perhaps the most usual is
`bribery': the supplier offers a better margin, to tempt the owners in the channel to push
the product rather than its competitors; or a competition is offered to the distributors'
sales personnel, so that they are tempted to push the product. At the other end of the
spectrum is the almost symbiotic relationship that the all too rare supplier in the computer
field develops with its agents; where the agent's personnel, support as well as sales, are
trained to almost the same standard as the supplier's own staff.
In much the same way that the organization's own sales and distribution activities need to
be monitored and managed, so will those of the distribution chain. In practice, of course,
many organizations use a mix of different channels; in particular, they may complement a
direct sales force, calling on the larger accounts, with agents, covering the smaller
customers and prospects. This relatively recent development integrates the channel with
the original supplier producer, wholesalers and retailers working in one unified system.
This may arise because one member of the chain owns the other elements (often called
`corporate systems integration'); a supplier owning its own retail outlets, this being
'forward' integration. It is perhaps more likely that a retailer will own its own suppliers,
this being 'backward' integration. (For example, MFI, the furniture retailer, owns Hygena
which makes its kitchen and bedroom units.) The integration can also be by franchise
(such as that offered by McDonald's hamburgers and Benetton clothes) or simple
cooperation (in the way that Marks & Spencer cooperates with its suppliers) (Bert, 1997).
Alternative approaches are `contractual systems', often led by a wholesale or retail
cooperative, and `administered marketing systems' where one (dominant) member of the
14
distribution chain uses its position to coordinate the other members' activities. This has
traditionally been the form led by manufacturers. The intention of vertical marketing is to
give all those involved (and particularly the supplier at one end, and the retailer at the
other) 'control' over the distribution chain. This removes one set of variables from the
marketing equations (Bert, 1997).
Other research indicates that vertical integration is a strategy which is best pursued at the
mature stage of the market (or product). At earlier stages it can actually reduce profits. It
is arguable that it also diverts attention from the real business of the organization.
Suppliers rarely excel in retail operations and, in theory, retailers should focus on their
sales outlets rather than on manufacturing facilities (Marks & Spencer, for example, very
deliberately provides considerable amounts of technical assistance to its suppliers, but
does not own them) (Bert, 1997). A rather less frequent example of new approaches to
channels is where two or more non-competing organizations agree on a joint venture and/
or joint marketing operation because it is beyond the capacity of each individual
organization alone. In general, this is less likely to revolve around marketing synergy
(Louis, Adel, Ansary, and James, 1989).
2.3 Distribution Strategies
A distribution strategy defines how you are going to move products from point of
creation to points of consumption, in a cost effective manner. It must also define how you
are going to manage your brand. A producer must do more than design a good channel
system and set it into motion. The system will require periodic modification to meet new
conditions in the market place. Modification becomes necessary when consumer buying
patterns change, market expands, product matures through the product lifestyle, new
competition arises and innovative distribution strategies emerge.
For product-focused companies, establishing the most appropriate distribution strategies
is a major key to success, defined as maximizing sales and profits. Unfortunately, many
of these companies often fail to establish or maintain the most effective distribution
strategies. Distribution issues come into play heavily in deciding brand level strategy. In
order to secure a more exclusive brand label, for example, it is usually necessary to
15
sacrifice volume. Some firms can be very profitable going for quantity where economies
of scale come into play and smaller margins on a large number of units add up, but may
make larger profits because of volume. Some firms choose to engage in a niching
strategy which targets small segment of customers. In order to maintain one‟s brand
image, it may be essential that retailers and other channel members provide certain
services, such as warranty repairs, providing information to customers and carrying a
large assortment of products. Since not all retailers are willing to provide these services,
insisting on them will likely reduce the intensity of distribution given to the product
(Kotler 2001).
2.3.1 Multi-channel Marketing Systems
Kotler (2001) looks at multi-channel marketing as a strategy where a firm uses two or
more marketing channels to reach one or more customer segments. Companies have
applied this strategy in trying to reach its customers for instance; it sells its products
directly to its corporate buyers as well as through value-added resellers. Buy doing this,
companies increases its market coverage, lower channel costs and also increase more
customized selling. This is the use of two channels to reach one or two customer
segments. A single firm sets up two or more marketing channels to reach on or more
customer segments. The multi-marketer gains volume with each new channel but also
risks alienating its existing channels. Existing channels can cry „unfair competition‟ and
threaten to drop the multi-marketer if it does not limit the competition or recompense
them in some way.
2.3.2 Intensive Distribution Strategy
Companies also use intensive distribution strategy to distribute its products. The company
places the products as many outlets as possible to increase their market coverage and
sales. Company‟s products are carried by supermarkets, retail shops, wholesalers and
through distributor and even goes out of its way to attract even the tiniest retailers (Belch
and Belch, 2004).
16
2.3.3 Internet Distribution Strategy
Technology has been changing; product companies have incorporated the electronic
marketing channel distribution (Belch and Belch 2004). The company uses the internet to
make products available so that the target market with access to enabling technologies
can shop and complete transaction for the purchase via interactive electronic, means. This
way the company has been able to lower sales and distribution costs interact with
customers, through email communication and also to expand global scope and reach.
Internet distribution can serve several purposes such as actual sales of products. On-line
distribution provides customer service where the site may contain information for those
who no longer have their manuals handy and, for electronic products, provide updated
drivers and software patches. It can also Market research in which data can be collected
relatively inexpensively on the Net.
2.3.4 Franchising Business Strategy
According to Kotler (2001) franchising business strategy is a business arrangement where
the franchiser of a business concept grants other (the franchisees) the license –right to
own and operate a business based on the franchiser‟s business concept using its
trademark. The product companies use product franchising method where it grants
franchisees the right to produce and sell its products. Through this strategy the
companies, have been able to penetrate the market, limit its overheads and gain access to
ready market, as well as creating employment opportunity to the host country. A channel
member called franchiser might link several successive stages in the production-
distribution process. Franchising has been the fastest growing and most interesting
retailing development in the recent years. Although the idea is an old one, some forms of
franchising are quite new. Three forms can be distinguished as; manufacture-sponsored
retailer franchiser, exemplified by the auto mobile industry; manufacture-sponsored
wholesaler system, which is found in the soft drink industry and service-firm sponsored
retailer franchise. It is where a service firm organizes a whole system for bringing its
service efficiently for example auto rental business, fast food service business and motel
business.
17
2.3.5 Direct Marketing Strategy
According to Belch and Belch (2004) direct marketing strategy is the interactive system
of marketing that uses one or more advertising media to affect a measurable response
and/or transaction at any location. The product companies have applied this strategy in
distribution of its products where it uses direct mail in form of letters, flyers, brochures
and catalogues. Newspapers, magazines, telephone, television and radio are also used
extensively. The companies have taken a market segmentation or micro marketing
approach in an attempt to target its market more precisely so as to find niches that avoid
the intense competition of mass markets. Through the use of direct marketing, product
companies have been able to reach their target market hence it‟s an alternative marketing
channel structure for achieving distribution objectives of the company. This is one of the
newer elements added on to the promotional mix tools. The advances made in the
telecommunications sectors have now opened avenues where promotions can be carried
out. This new media incorporates the use of mailings, telephone, fax, email and other
non-personal contact tools to communicate directly with or solicit a direct response from
specific customers and prospects.
2.3.6 Indirect Distribution Strategy
Indirect distribution strategy is where goods move from producer to consumer through
middlemen (McCarthy 1991). The firm uses longer or shorter chains of distribution. The
product companies employ this strategy by using various middlemen, for example,
distributors, wholesalers and several retailers. Product companies have a long chain of
distribution comprising of the wholesalers and retailers who finally sell to the consumers.
In general, a company cannot save money by eliminating the middlemen because
intermediaries specialize in performing certain tasks that they can perform more cheaply
than the manufacturer. Most products are most efficiently sold to consumers through
retail stores that take modest mark-up. It would not make sense for manufacturers to ship
their products in small quantities directly to consumers. Intermediaries perform tasks
such as moving the goods efficiently, breaking bulk, consolidating goods –carrying a
wide assortment especially at retail stores and adding value via services offered such as
demonstrations of how to use products as well as guaranteed repairs.
18
2.3.7 Multiple Channel Strategy
McCarthy (1991) views multiple channel as a strategy in which two or more different
channels are employed for distribution of goods and services. In this strategy, markets
must be segmented so that each segment is given a product or service its needs. This
strategy includes complementary channels strategy where each channel handles a
different non-competing, product or serving non competing market segment and
competitive channel strategy where the same product is sold via two different and
competing channels to capture a large share of the market. A firm can set up two or more
marketing channels to reach one or more customer segments. The multi-marketer gains
volume with each new channel but also risks alienating its existing channels. Existing
channels can cry „unfair competition‟ and threaten to drop the multi-marketer if it does
not limit the competition or recompense them is some way.
2.3.8 Channel Modification Strategy
This refers to introduction of a change in existing distribution arrangement based on
evaluation and critical review. This is done when existing channels may not be meeting
expectations of the firm or there may be a market segment that the existing channel may
not be effectively serving. Many product companies have also employed this strategy.
For instance, in the past there were some market segments e.g. in rural areas that the
existing channels were not effectively serving therefore, the company modified its
channels to cater for these segments by adding more or increasing kiosks, roadside sellers
and retailers in the distribution task (Kotler, 2001).
A producer must do more than design a good channel system and set it into motion. The
system will require periodic modification to meet new conditions in the market place.
Modification becomes necessary when consumer buying patterns change, market
expands, product matures through the product lifestyle, new competition arises and
innovative distribution strategies emerge. Three levels of channel modification should be
distinguished. The change could involve adding or dropping individual channel members,
adding or dropping particular market channels, or developing a totally new way to sell
goods in all markets.
19
2.3.9 Channel Control Strategy
According to Etzel (2003) channel control is a strategy where the manufacturer or
producer has a direct control over its products and distribution. Control may be achieved
using vertical marketing where professionally managed and centrally programmed
networks which are pre-engineered to achieve operating economies
Under this we have corporate vertical marketing system where successive stages of
production and distribution are owned by a single company. Product Company have
corporate vertical marketing system where it owns the stages of production and
distribution thus the company is able to cut on distribution costs and problems associated
with distribution such as damages to the bottles or products. The companies have been
able to achieve this through backward and forward linkages (Etzel, 2003).
2.4 Physical Distribution
Churchill and Peter (1999) viewed the second important element in physical distribution
concerned storing products for future delivery. Marketers of tangible products, and even
digital products, may have storage concerns. Storage facilities, such as warehouses, play
an important role in the distribution process for a number of reasons which includes:
The need to hold wide assortment of products. Many resellers allow their customers to
purchase small quantities of many different products and yet, to obtain the best prices
from suppliers, resellers must purchase in large quantities. The need, thus, exists for
storage facilities that not only hold a large volume of product, but also can hold a wide
variety of resellers‟ inventory. Additionally, these facilities must be organized in a way
that permits resellers to easily fill orders for their customers.
Holding products in storage offer a safeguard in cases of unanticipated increases in
demand for products. Needed for Large Shipping Quantities As we noted in our
discussion of transportation, manufacturers generally prefer to ship in large product
quantities in order to more effectively spread transportation costs. This often means
manufacturers must create storage areas in which the manufactured goods can build up in
the quantities needed for such shipments to occur.
20
Offer Faster Response: Additional storage facilities, strategically located in different
geographical areas, allow a marketing organization to respond quickly to customers‟
needs. The ability to respond with quick delivery can be a major value-added feature
since it reduces the buyer‟s need to maintain large inventory at their own locations.
Security and Backup: For digital products, additional storage facilities are not only
needed to offer customers faster access to products (e.g., online content and software) but
are also needed to protect against technical glitches and security threats(Louis, Adel,
Ansary, and James, 1989).
2.4.1 Types of Warehouses
The warehouse is the most common type of storage though other forms do exist (e.g.,
storage tanks, computer server farms). Some warehouses are massive structures that
simultaneously support the unloading of numerous inbound trucks and railroad cars
containing suppliers‟ products while at the same time loading multiple trucks for
shipment to customers.
Private Warehouse: This type of warehouse is owned and operated by a company that is
also involved in other aspects of the distribution channel. For instance, a major retail
chain may have several regional warehouses supplying their stores or a wholesaler will
operate a warehouse at which it receives and distributes products. The public warehouse
on the other hand is essentially space that can be leased to solve short-term distribution
needs. Retailers that operate their own private warehouses may occasionally seek
additional storage space if their facilities have reached capacity or if they are making a
special, large purchase of products. For example, retailers may order extra merchandise
to prepare for in store sales or order a large volume of a product that is offered at a low
promotional price by a supplier.
Automated Warehouse: with advances in computer and robotics technology many
warehouses now have automated capabilities. The level of automation ranges from a
small conveyor belt transporting products in a small area all the way up to a fully
automated facility where only a few people are needed to handle storage activity for
thousands of pounds/kilograms of product. In fact, many warehouses use machines to
21
handle nearly all physical distribution activities such as moving product filled pallets
around buildings that may be several stories tall and the length of two or more football
fields (Louis, Adel, Ansary, and James, 1989).
Climate Controlled Warehouse handle storage of many types of products including those
that need special handling conditions such as freezers for storing frozen products,
humidity controlled environments for delicate products, such as produce or flowers, and
dirt free facilities for handling highly sensitive computer products. Distribution Centre:
There are some warehouses where product storage is considered a very temporary
activity. These warehouses serve as points in the distribution system at which products
are received from many suppliers and quickly shipped out to many customers. In some
cases, such as with distribution centres handling perishable food (e.g., produce), most of
the product enters in the early morning and is distributed by the end of the day (Churchill
and Peter, 1999).
2.4.2 Transportation
The key objective of product distribution is to get products into customers‟ hands in a
timely manner (Kotler 2001). While delivery of digital products can be handled in a
fairly smooth way by allowing customers to access their purchase over the Internet, for
example, download software, gain access to subscription material, tangible products
require a more careful analysis of delivery options in order to provide an optimal level of
customer service. In terms of delivering products to customers, there are six distinct
modes of transportation: air, digital, pipeline, rail, truck, and water. However, not all
modes are an option for all marketers. Each mode offers advantages and disadvantages
on key transportation features that include:
Product Options: This feature is concerned with the number of different products that can
realistically be shipped using a certain mode. Some modes, such as pipeline, are very
limited in the type of products that can be shipped while others, such as truck, can handle
a wide range of products. Speed of Delivery: This refers to how quickly it takes products
to move from the shipper‟s location to the buyer‟s location.
22
Accessibility: This transportation feature refers to whether the use of a mode can allow
final delivery to occur at the buyer‟s desired location or whether the mode requires
delivery to be offloaded onto other modes before arriving at the buyer‟s destination. For
example, most deliveries made via air must be loaded onto other transportation modes,
often trucks, before they can be delivered to the final customer (Bert 1997). Cost: The
cost of shipment is evaluated in terms of the cost per item to cover some distance such as
mile, kilometre. Often for large shipments of tangible products cost is measured in terms
of tons-per-mile or metric-tons-per-kilometre.
Capacity: Refers to the amount of product that can be shipped at one time within one
transportation unit. The higher the capacity the more likely transportation cost can be
spread over more individual products leading to lower transportation cost per item
shipped. Inter-modal Capable: Inter-modal shipping occurs when two or more modes can
be combined in order to gain advantages offered by each mode. For instance, in an inter-
modal method called piggybacking truck trailers are loaded onto rail road cars without
the need to unload the trailer. When the rail road car has reached a certain destination the
truck trailers are offloaded onto trucks for delivery to the customer‟s location.
2.4.3 Lead Time and Just In Time Delivery
Just in time (JIT) is a synchronized system where customer demands can be met and
profits maintained or increased through reduction in stock piles and inventory level which
do not gain value as they wait. In fact they cost the organization money in terms of extra
financing (Hackman, and Wageman, 1995). Just in time practices are associated with
improved quality. Suppliers are evaluated on their ability to provide high quality
products. The Total effects of JIT can be enormous. The purchasing inventory and
inspection costs can be reduced, product design can be improved, delivery streamlined,
production downtime reduced and the quality of products enhanced (Hackman, and
Wageman, 1995).
Just in time was first practised in Japan. With advancement of technology and new ways
of doing business, the traditional distribution system is no longer effective. The adoption
of JIT supply chain system has resulted in reduced stock out, cost cut downs and
23
ultimately increased margins. Products reach their destined places in good condition and
in time as well Masinde, (1986). The main objective is to present better customer
services, increased efficiency levels and cut down on operational costs. The JIT concept
aims at reducing stocks by organizing a supply system which provides materials and
components as they are required. As such stock holding costs are significantly reduced or
eliminated and thus profits are increased (Hackman, and Wageman, 1995). The system
requires integration of both purchasing and production operations. It requires delivery of
exact amount of materials or components as they are required. Delivery schedules must
very reliable and suppliers must be ready and capable of making deliveries (Hackman,
and Wageman, 1995). Lead times for ordering must be short and honoured. The
marketing implication of JIT is that, to be competitive suppliers must be able to meet the
requirements of this fast growing system (Hackman, and Wageman, 1995).
2.5 Perception
The human factor in organizations has been the subject of debate for some time now its
origin can be traced to do early works of Prof. Elton Mayo at the Western Electric
Hawthorne Plant in Chicago in 1927-32 (Burnes, 2000). The study for the first time,
addressed the issue of the worker in the workplace, rather than the work itself (Cole,
1996). This view was taken up by other social scientist such as Abraham Maslow. He
was able to demonstrate that a hierarchy of needs can influence behaviour in
organizations. This ranges from the physiological, such as food and shelter through
esteem needs, self-actualization, the highest level of self-fulfilment. At any time it is the
unmet needs that act as motivators, further V, H. Room, in the mid 1960s expounded this
issue with the expectancy theory of motivation. He advanced the view that an
individual‟s behaviour is formed on the perception of what they consider to be the reality
(Cole, 1996). This Theory stresses the importance if perceptions in the motivation
process. It argues the case or the view that individuals act on the basis of how they
perceive situations. Individual effort and productivity is determined by the perception of
the situation (Cole, 1997).
24
Managers therefore need to be interested not only with the physical presence of the
employee in the workplace but more importantly their emotional presence. This latter
attribute is developed through motivational and intrinsic satisfaction.
2.5.1 Factors Influencing Perception
Perception as a determinant of behaviour in organizations has been and is likely to be a
subject of fierce debate amongst human resource management community (Armstrong,
2004). It is therefore not surprising that perception is a central concept in procurement
and management of human resources. Bennett (1997) argues that perception is essential
because of the amount of information, signals and cues, which the senses constantly
assailed. He suggests that the process by which individual perception is developed is both
learned and instinctive. Cole (1997) notes that the understanding of perception in work
situations is critical to successful managerial and organizational performance for those
who have people to manage. Rogers (1947) observes that perception is the basis on which
everyone forms their understanding of the world. People make interpretations of others
that they meet, and places and situations that are encountered by combining each of these
elements indicated to produce their own individual picture, which they can understand
and be comfortable with.
According to Bennett (1997) perception is influenced by situational factors. Perception is
affected by the context in which employees are placed. Cole (1997) points out that the
contextual factor varies according to the nature of the organization involved and the
relationship with it(whether one is a member of staff or customer, for example).
Perception is affected by repetition and familiarity. Beardwell et al (1997) notes that
something or someone who is always present acquires the illusion of permanence and
that routines and habits are formed by organizing activities and interactions into regular
patterns based on a combination of expectation and near certainty (Beardwell et al,
1997).
According to Martin and Jackson, (1997) perception is affected by the characteristics of
perceiver and perceived. The greater the knowledge of perception on the part of people
25
and organizations; the greater is the mutual understanding likely to be generated; and
where problems do arise, the greater the potential of addressing these effectively. Cole
(1997) observes that personal characteristics affect the type of characteristics likely to be
seen in others, their levels of importance, and whether these are or should be negative or
positive. Those being perceived greatly influence the views of the perceiver through their
visibility (appearance, manner, dress, speech) and through their status and role (either in a
given situation or in a wider context) (Martin and Jackson, 1997).
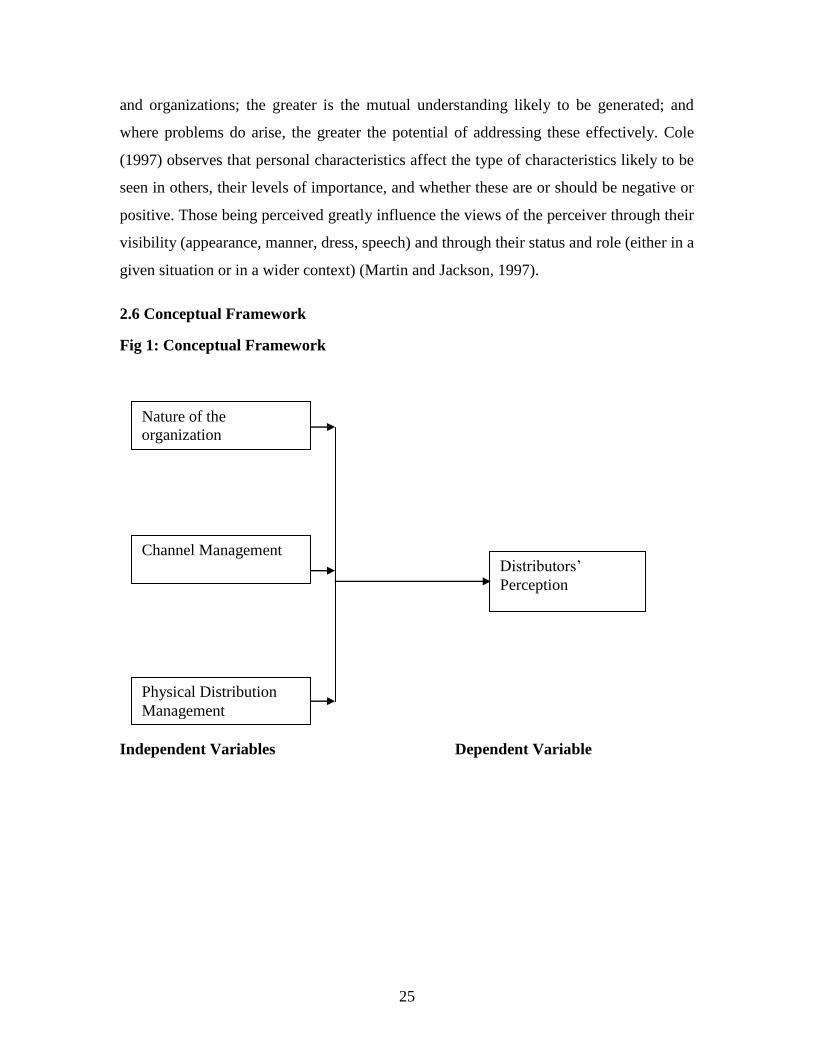
2.6 Conceptual Framework
Fig 1: Conceptual Framework
Independent Variables Dependent Variable
Nature of the
organization
Channel Management
Distributors‟
Perception
Physical Distribution
Management
26
CHAPTER 3: RESEARCH METHODOLOGY.
3.1 Introduction
This chapter gives details regarding the procedures used to conduct this study. Pertinent
issues discussed in this section include the research design, population, sample design
and data collection methods and data analysis.
3.2 Research Design
Nachmias and Nachmias (1981) have grouped primary data collection methods into three
broad categories: observation, surveys and unobtrusive measures. The nature of data to be
collected was largely determine the choice taken. The survey design was selected as it
was the best in investigation of the distributor‟s perception on the Coca Cola distribution
system in Nairobi. This gave the required observation of the kind of strategies prevalent
and factors affecting management and how these were being addressed thus giving a
comprehensive picture.
3.3 Population
The population of interest in this study consisted of distributors of the Nairobi
Bottlers which is a Coca Cola bottling company.
3.4 Sampling
Mugenda and Mugenda (1999); propose a rule of the thumb for determining a sample
size and says that a size of 30 to 500 is appropriate for most academic researches. It was
stratified into two: Nairobi urban and Nairobi rural. 30 distributors were selected through
proportionate sampling of which 20 Nairobi urban and 10 from Nairobi rural. Within
each stratum, systematic random sampling was used.
3.5 Data Collection
Data was collected using a semi structured questionnaire with a likert scale as the main
part of the questionnaire. The questions were both open ended and closed questions. The
questionnaire was divided into two parts. Part one collected the demographic data. Part
two consisted of questions with likert scale which tapped the information on distributor‟s
27
perception on the Coca Cola distribution system in Nairobi. The respondents interviewed
were owners of the enterprises. The questionnaire was be self administered.
3.6 Data Analysis
This was a descriptive study, and descriptive statistics were used to analyse the data.
Frequencies, mean scores, percentages as well as standard deviation will be used. The
analysed data was presented in frequency distribution tables with percentages.
28
CHAPTER FOUR: DATA ANALYSIS AND INTERPRETATION
4.1 Introduction
This chapter presents a detailed discussion of the research findings in an attempt to
achieve the research objectives. Data analysis is carried out based on the objectives of the
study.
4.2 Analysis of General Information
The data in this study was summarized and presented in the form of tables, frequencies
and percentages. A total of 30 questionnaires were distributed to various distributors in
Nairobi. However, only 20 distributors responded by completing the questionnaires,
representing 66.67% of the response rate.
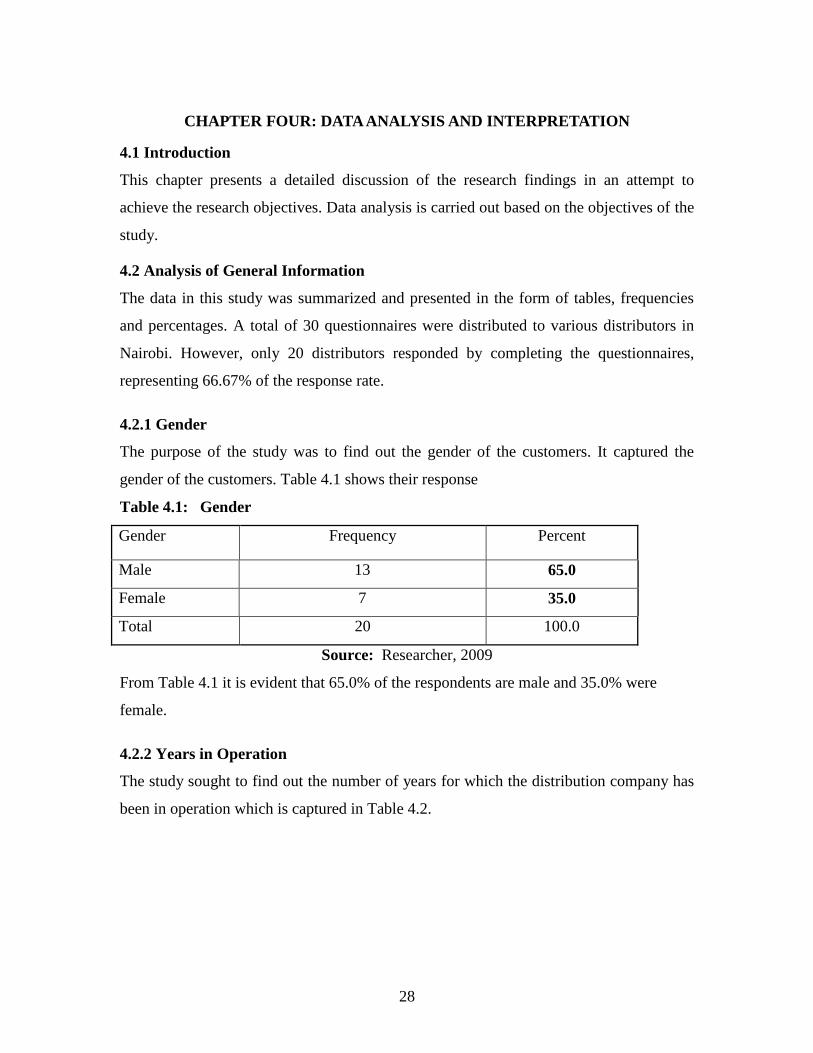
4.2.1 Gender
The purpose of the study was to find out the gender of the customers. It captured the
gender of the customers. Table 4.1 shows their response
Table 4.1: Gender
Gender Frequency Percent
Male 13 65.0
Female 7 35.0
Total 20 100.0
Source: Researcher, 2009
From Table 4.1 it is evident that 65.0% of the respondents are male and 35.0% were
female.
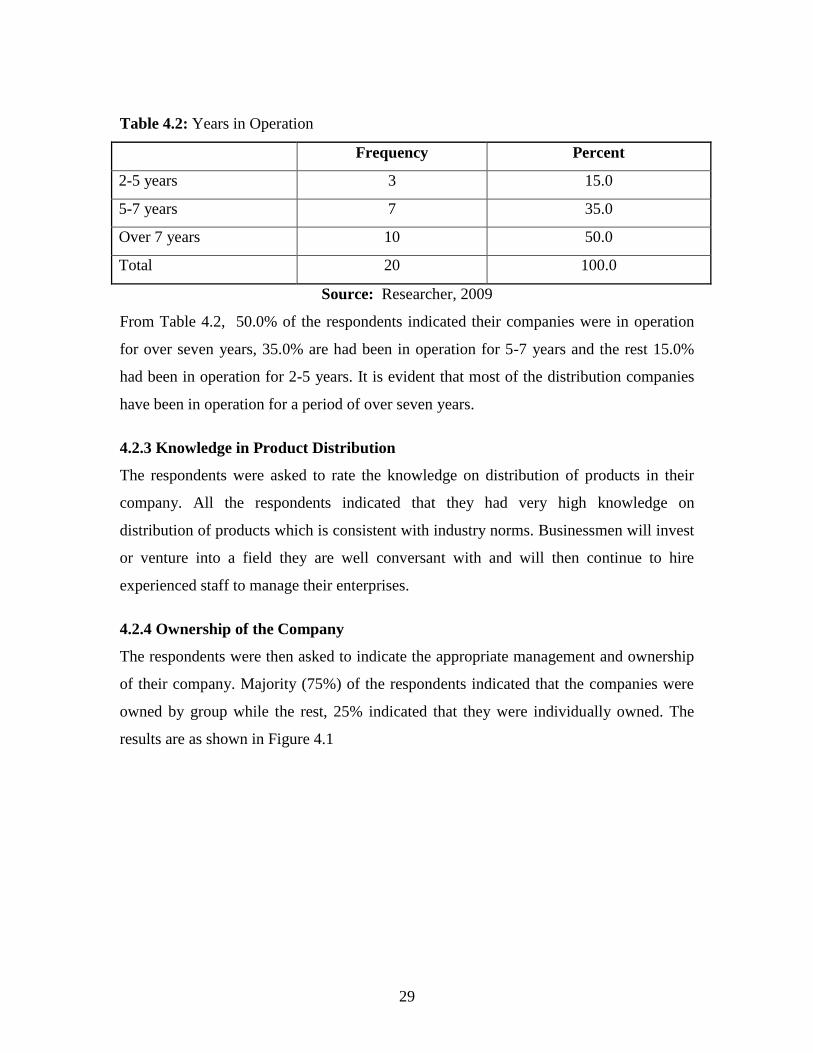
4.2.2 Years in Operation
The study sought to find out the number of years for which the distribution company has
been in operation which is captured in Table 4.2.
29
Table 4.2: Years in Operation
Frequency Percent
2-5 years 3 15.0
5-7 years 7 35.0
Over 7 years 10 50.0
Total 20 100.0
Source: Researcher, 2009
From Table 4.2, 50.0% of the respondents indicated their companies were in operation
for over seven years, 35.0% are had been in operation for 5-7 years and the rest 15.0%
had been in operation for 2-5 years. It is evident that most of the distribution companies
have been in operation for a period of over seven years.
4.2.3 Knowledge in Product Distribution
The respondents were asked to rate the knowledge on distribution of products in their
company. All the respondents indicated that they had very high knowledge on
distribution of products which is consistent with industry norms. Businessmen will invest
or venture into a field they are well conversant with and will then continue to hire
experienced staff to manage their enterprises.
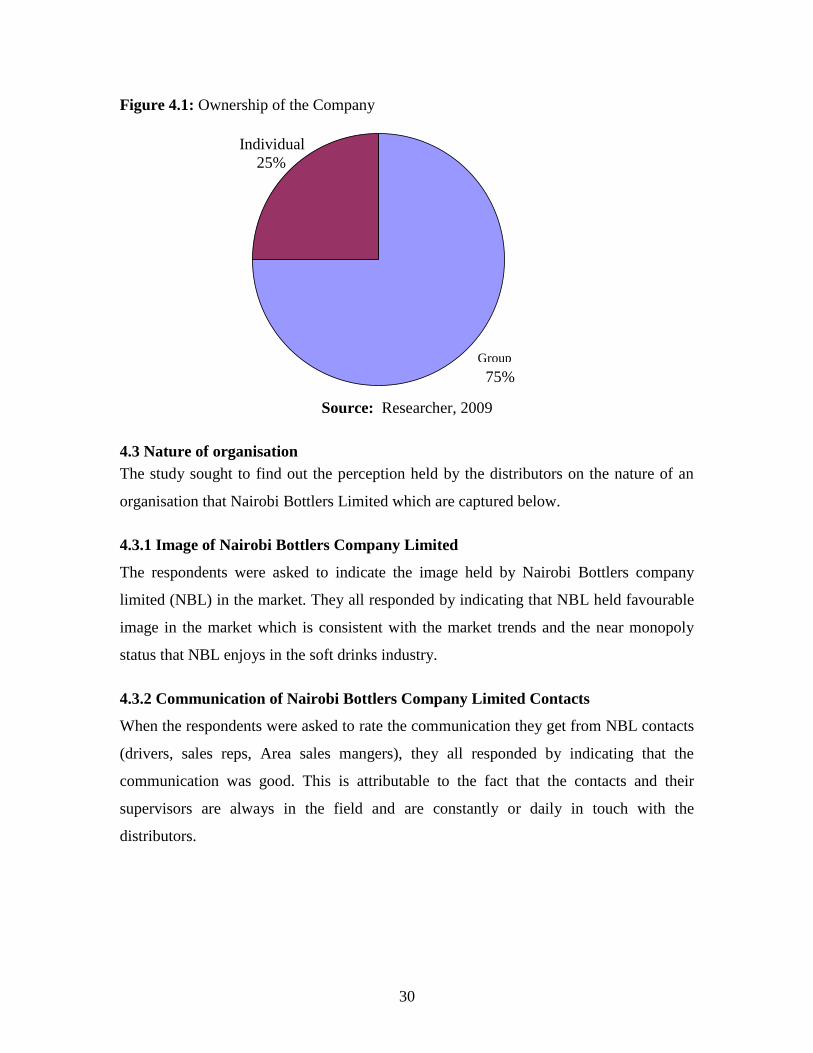
4.2.4 Ownership of the Company
The respondents were then asked to indicate the appropriate management and ownership
of their company. Majority (75%) of the respondents indicated that the companies were
owned by group while the rest, 25% indicated that they were individually owned. The
results are as shown in Figure 4.1
30
Figure 4.1: Ownership of the Company
Source: Researcher, 2009
4.3 Nature of organisation
The study sought to find out the perception held by the distributors on the nature of an
organisation that Nairobi Bottlers Limited which are captured below.
4.3.1 Image of Nairobi Bottlers Company Limited
The respondents were asked to indicate the image held by Nairobi Bottlers company
limited (NBL) in the market. They all responded by indicating that NBL held favourable
image in the market which is consistent with the market trends and the near monopoly
status that NBL enjoys in the soft drinks industry.
4.3.2 Communication of Nairobi Bottlers Company Limited Contacts
When the respondents were asked to rate the communication they get from NBL contacts
(drivers, sales reps, Area sales mangers), they all responded by indicating that the
communication was good. This is attributable to the fact that the contacts and their
supervisors are always in the field and are constantly or daily in touch with the
distributors.
Group
75%
Individual
25%
31
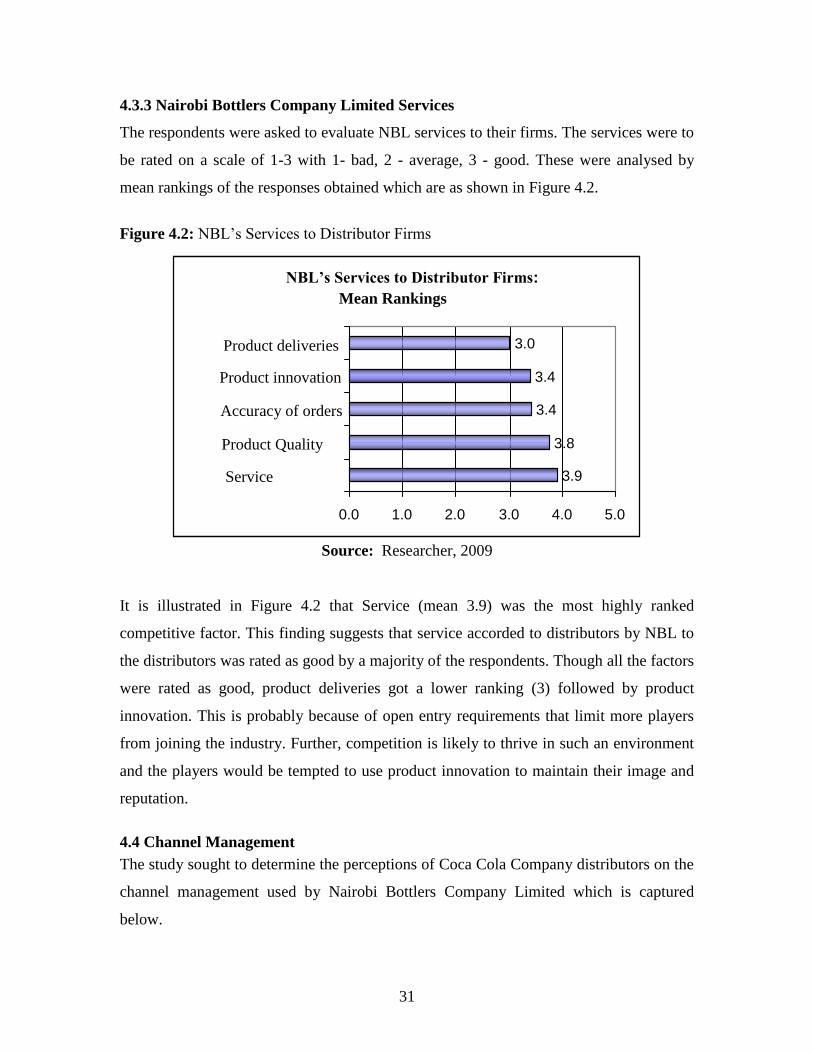
4.3.3 Nairobi Bottlers Company Limited Services
The respondents were asked to evaluate NBL services to their firms. The services were to
be rated on a scale of 1-3 with 1- bad, 2 - average, 3 - good. These were analysed by
mean rankings of the responses obtained which are as shown in Figure 4.2.
Figure 4.2: NBL‟s Services to Distributor Firms
Source: Researcher, 2009
It is illustrated in Figure 4.2 that Service (mean 3.9) was the most highly ranked
competitive factor. This finding suggests that service accorded to distributors by NBL to
the distributors was rated as good by a majority of the respondents. Though all the factors
were rated as good, product deliveries got a lower ranking (3) followed by product
innovation. This is probably because of open entry requirements that limit more players
from joining the industry. Further, competition is likely to thrive in such an environment
and the players would be tempted to use product innovation to maintain their image and
reputation.
4.4 Channel Management
The study sought to determine the perceptions of Coca Cola Company distributors on the
channel management used by Nairobi Bottlers Company Limited which is captured
below.
NBL’s Services to Distributor Firms:
Mean Rankings
3.9
3.8
3.4
3.4
3.0
0.0 1.0 2.0 3.0 4.0 5.0
Service
Product Quality
Accuracy of orders
Product innovation
Product deliveries
32
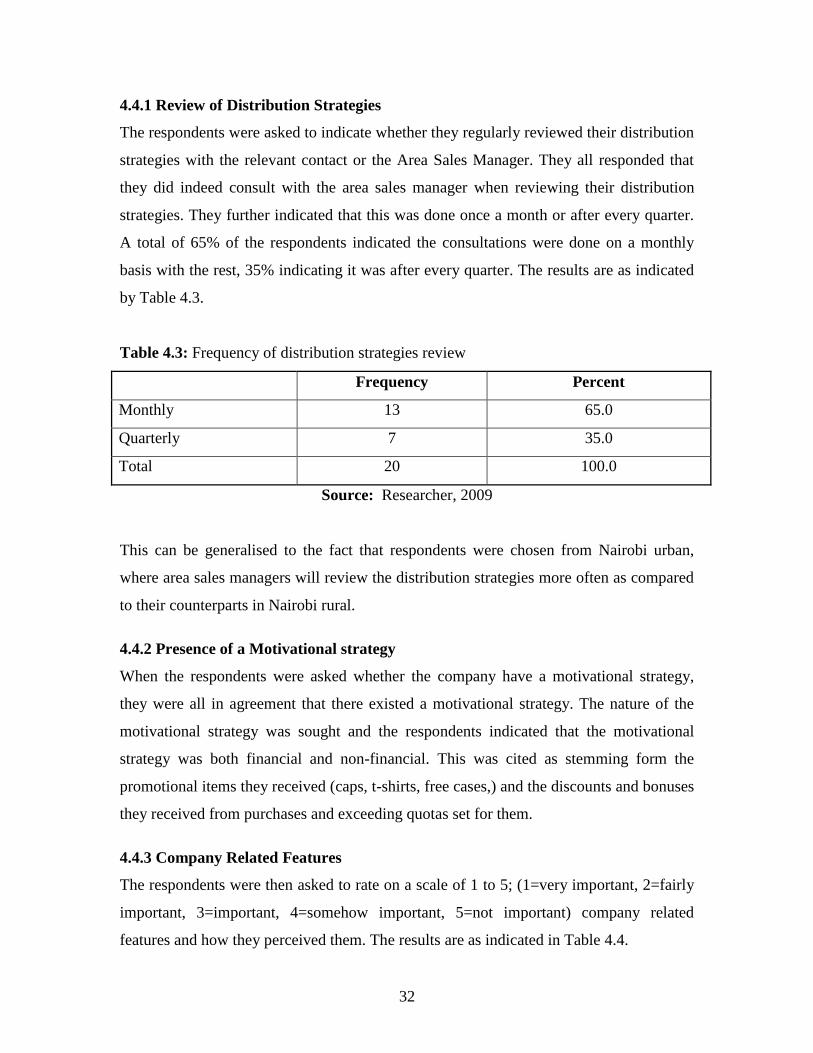
4.4.1 Review of Distribution Strategies
The respondents were asked to indicate whether they regularly reviewed their distribution
strategies with the relevant contact or the Area Sales Manager. They all responded that
they did indeed consult with the area sales manager when reviewing their distribution
strategies. They further indicated that this was done once a month or after every quarter.
A total of 65% of the respondents indicated the consultations were done on a monthly
basis with the rest, 35% indicating it was after every quarter. The results are as indicated
by Table 4.3.
Table 4.3: Frequency of distribution strategies review
Frequency Percent
Monthly 13 65.0
Quarterly 7 35.0
Total 20 100.0
Source: Researcher, 2009
This can be generalised to the fact that respondents were chosen from Nairobi urban,
where area sales managers will review the distribution strategies more often as compared
to their counterparts in Nairobi rural.
4.4.2 Presence of a Motivational strategy
When the respondents were asked whether the company have a motivational strategy,
they were all in agreement that there existed a motivational strategy. The nature of the
motivational strategy was sought and the respondents indicated that the motivational
strategy was both financial and non-financial. This was cited as stemming form the
promotional items they received (caps, t-shirts, free cases,) and the discounts and bonuses
they received from purchases and exceeding quotas set for them.
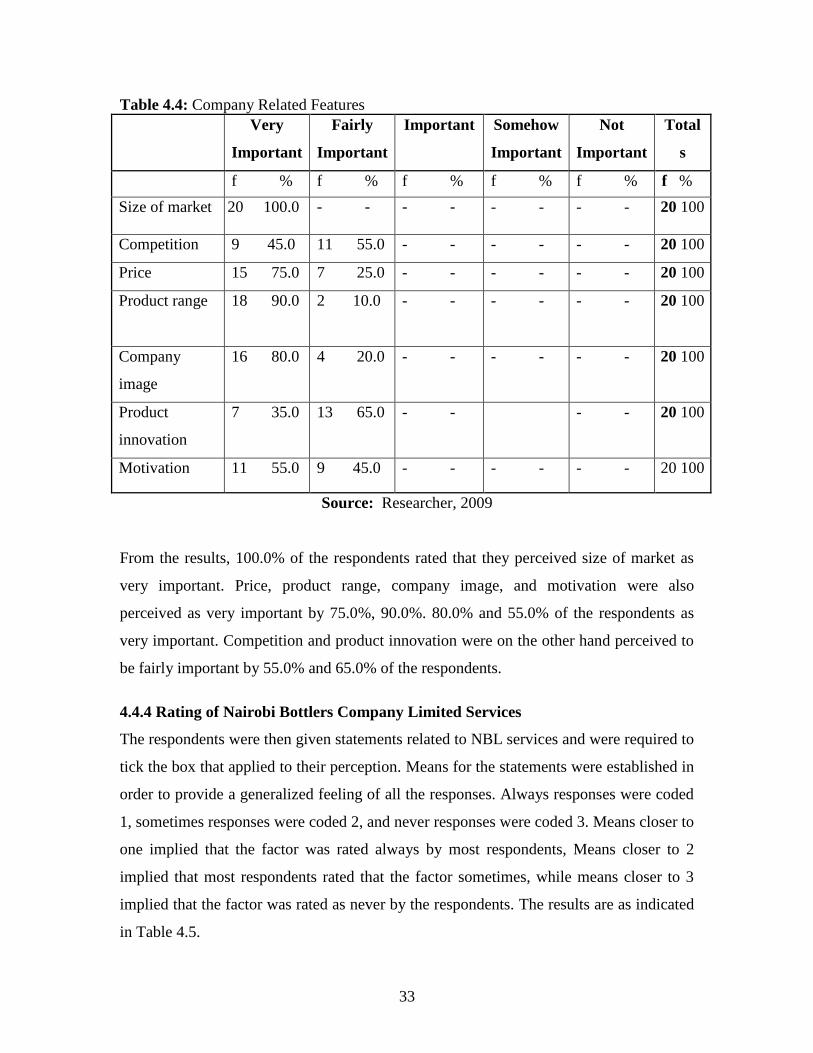
4.4.3 Company Related Features
The respondents were then asked to rate on a scale of 1 to 5; (1=very important, 2=fairly
important, 3=important, 4=somehow important, 5=not important) company related
features and how they perceived them. The results are as indicated in Table 4.4.
33
Table 4.4: Company Related Features
Very
Important
Fairly
Important
Important Somehow
Important
Not
Important
Total
s
f % f % f % f % f % f %
Size of market 20 100.0 - - - -
- - - - 20 100
Competition 9 45.0 11 55.0 - - - - - - 20 100
Price 15 75.0 7 25.0 - - - - - - 20 100
Product range 18 90.0 2 10.0
- - - - - - 20 100
Company
image
16 80.0 4 20.0 - - - - - - 20 100
Product
innovation
7 35.0 13 65.0 - - - - 20 100
Motivation 11 55.0 9 45.0 - - - - - - 20 100
Source: Researcher, 2009
From the results, 100.0% of the respondents rated that they perceived size of market as
very important. Price, product range, company image, and motivation were also
perceived as very important by 75.0%, 90.0%. 80.0% and 55.0% of the respondents as
very important. Competition and product innovation were on the other hand perceived to
be fairly important by 55.0% and 65.0% of the respondents.
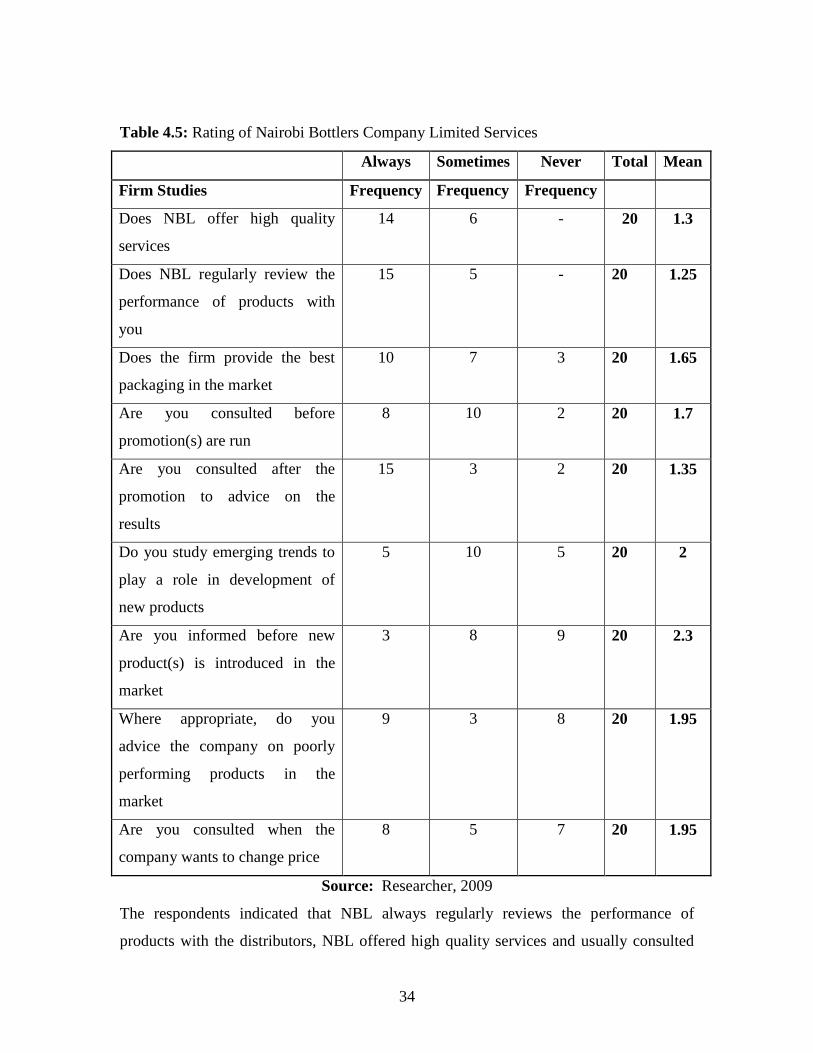
4.4.4 Rating of Nairobi Bottlers Company Limited Services
The respondents were then given statements related to NBL services and were required to
tick the box that applied to their perception. Means for the statements were established in
order to provide a generalized feeling of all the responses. Always responses were coded
1, sometimes responses were coded 2, and never responses were coded 3. Means closer to
one implied that the factor was rated always by most respondents, Means closer to 2
implied that most respondents rated that the factor sometimes, while means closer to 3
implied that the factor was rated as never by the respondents. The results are as indicated
in Table 4.5.
34
Table 4.5: Rating of Nairobi Bottlers Company Limited Services
Always Sometimes Never Total Mean
Firm Studies Frequency Frequency Frequency
Does NBL offer high quality
services
14 6 - 20 1.3
Does NBL regularly review the
performance of products with
you
15 5 - 20 1.25
Does the firm provide the best
packaging in the market
10 7 3 20 1.65
Are you consulted before
promotion(s) are run
8 10 2 20 1.7
Are you consulted after the
promotion to advice on the
results
15 3 2 20 1.35
Do you study emerging trends to
play a role in development of
new products
5 10 5 20 2
Are you informed before new
product(s) is introduced in the
market
3 8 9 20 2.3
Where appropriate, do you
advice the company on poorly
performing products in the
market
9 3 8 20 1.95
Are you consulted when the
company wants to change price
8 5 7 20 1.95
Source: Researcher, 2009
The respondents indicated that NBL always regularly reviews the performance of
products with the distributors, NBL offered high quality services and usually consulted
35
them after the promotions to advice on the results, all of which had means closer to one.
The respondents indicated that the firm sometimes provided the best packaging in the
market, consulted the distributors before promotion(s) are run, where appropriate, they
advised the company on poorly performing products in the market and they were
consulted when the company wanted to change price as indicated by the means closer to
2. Studying emerging trends to play a role in development of new products and being
informed before new product(s) is introduced in the market was also undertaken
sometimes.
4.5 Physical Distribution Management
The study then sought to determine the perceptions held by Coca Cola Company
distributors on the physical distribution management used by Nairobi Bottlers Company
Limited which is captured below.
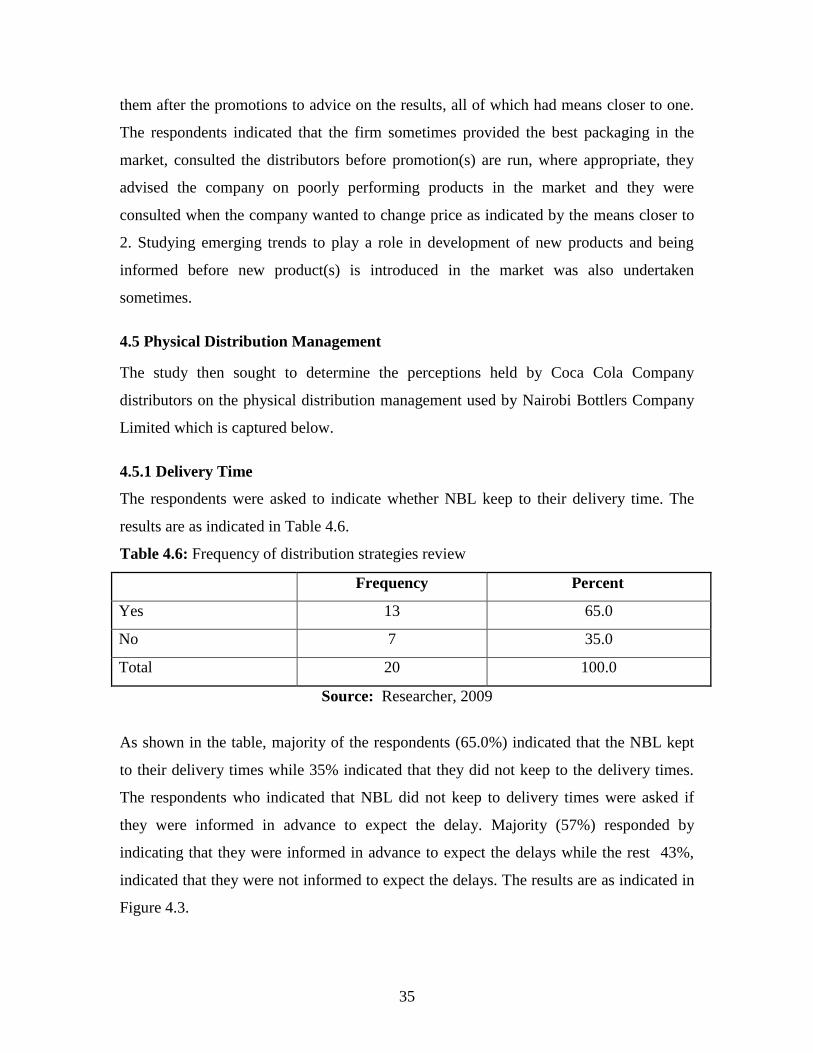
4.5.1 Delivery Time
The respondents were asked to indicate whether NBL keep to their delivery time. The
results are as indicated in Table 4.6.
Table 4.6: Frequency of distribution strategies review
Frequency Percent
Yes 13 65.0
No 7 35.0
Total 20 100.0
Source: Researcher, 2009
As shown in the table, majority of the respondents (65.0%) indicated that the NBL kept
to their delivery times while 35% indicated that they did not keep to the delivery times.
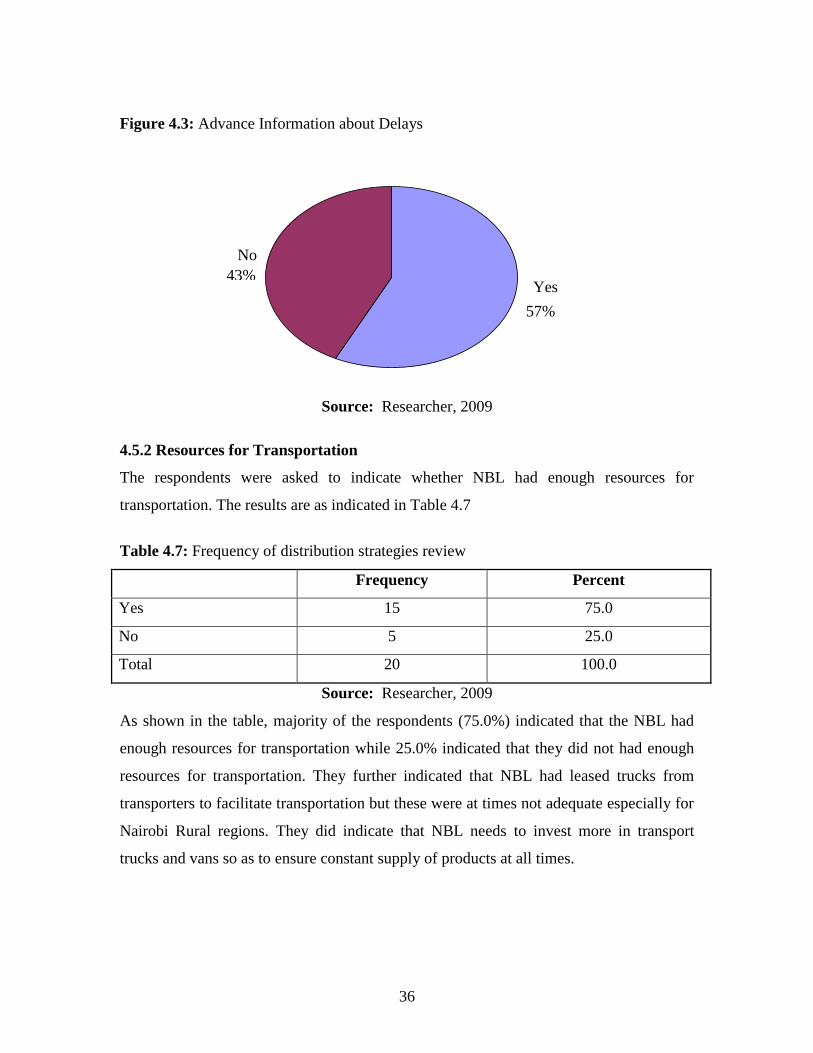
The respondents who indicated that NBL did not keep to delivery times were asked if
they were informed in advance to expect the delay. Majority (57%) responded by
indicating that they were informed in advance to expect the delays while the rest 43%,
indicated that they were not informed to expect the delays. The results are as indicated in
Figure 4.3.
36
Figure 4.3: Advance Information about Delays
Source: Researcher, 2009
4.5.2 Resources for Transportation
The respondents were asked to indicate whether NBL had enough resources for
transportation. The results are as indicated in Table 4.7
Table 4.7: Frequency of distribution strategies review
Frequency Percent
Yes 15 75.0
No 5 25.0
Total 20 100.0
Source: Researcher, 2009
As shown in the table, majority of the respondents (75.0%) indicated that the NBL had
enough resources for transportation while 25.0% indicated that they did not had enough
resources for transportation. They further indicated that NBL had leased trucks from
transporters to facilitate transportation but these were at times not adequate especially for
Nairobi Rural regions. They did indicate that NBL needs to invest more in transport
trucks and vans so as to ensure constant supply of products at all times.
Yes
57%
No
43%
37
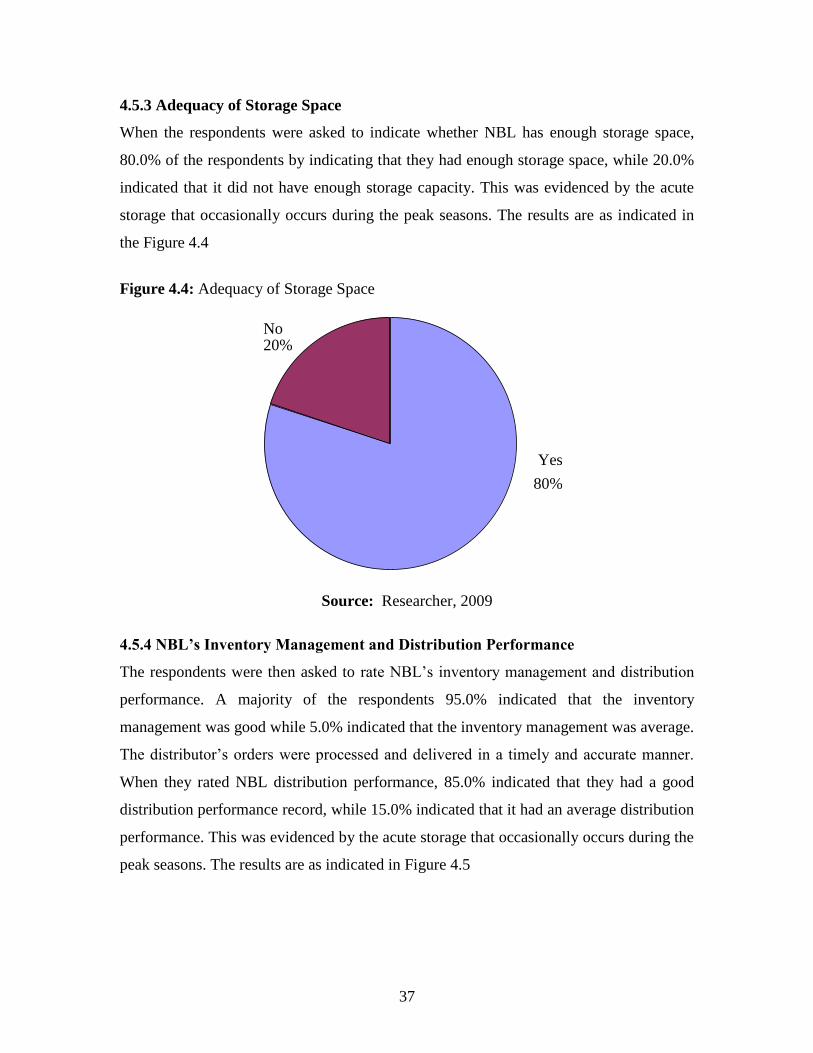
4.5.3 Adequacy of Storage Space
When the respondents were asked to indicate whether NBL has enough storage space,
80.0% of the respondents by indicating that they had enough storage space, while 20.0%
indicated that it did not have enough storage capacity. This was evidenced by the acute
storage that occasionally occurs during the peak seasons. The results are as indicated in
the Figure 4.4
Figure 4.4: Adequacy of Storage Space
Source: Researcher, 2009
4.5.4 NBL’s Inventory Management and Distribution Performance
The respondents were then asked to rate NBL‟s inventory management and distribution
performance. A majority of the respondents 95.0% indicated that the inventory
management was good while 5.0% indicated that the inventory management was average.
The distributor‟s orders were processed and delivered in a timely and accurate manner.
When they rated NBL distribution performance, 85.0% indicated that they had a good
distribution performance record, while 15.0% indicated that it had an average distribution
performance. This was evidenced by the acute storage that occasionally occurs during the
peak seasons. The results are as indicated in Figure 4.5
Yes
80%
No 20%
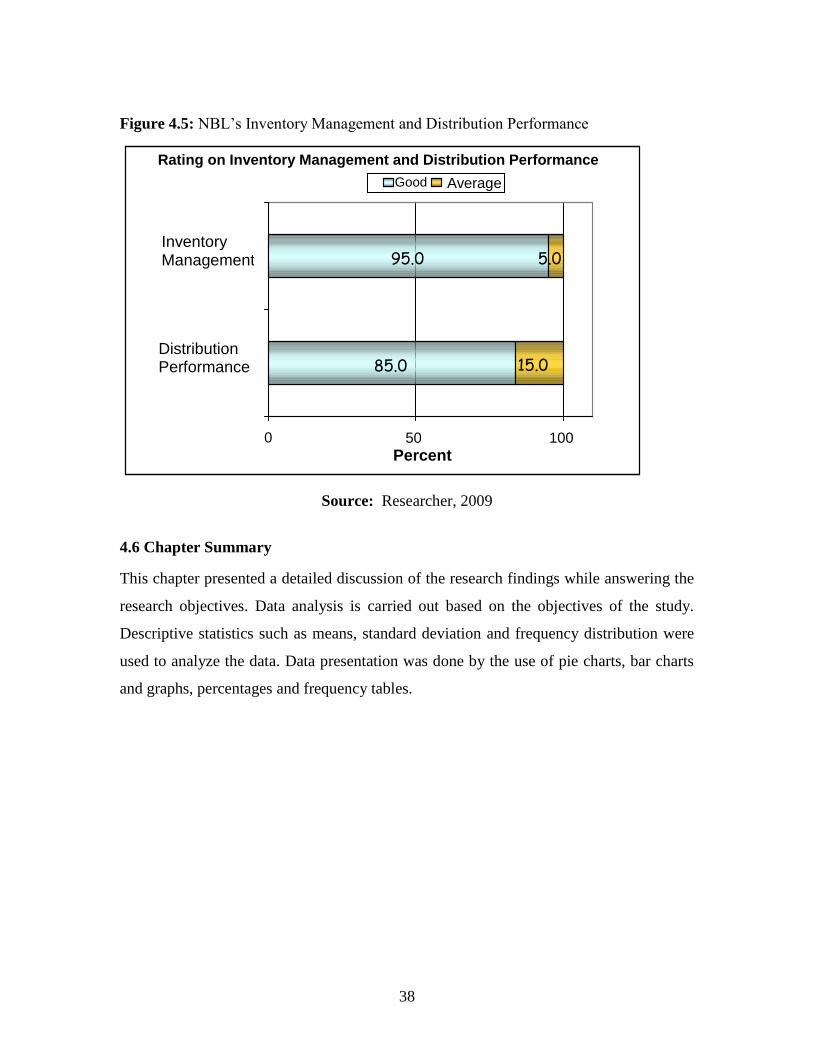
38
Figure 4.5: NBL‟s Inventory Management and Distribution Performance
Source: Researcher, 2009
4.6 Chapter Summary
This chapter presented a detailed discussion of the research findings while answering the
research objectives. Data analysis is carried out based on the objectives of the study.
Descriptive statistics such as means, standard deviation and frequency distribution were
used to analyze the data. Data presentation was done by the use of pie charts, bar charts
and graphs, percentages and frequency tables.
85.0
95.0
15.0
5.0
0 50 100
Distribution Performance
Inventory Management
Percent
Good Average
Rating on Inventory Management and Distribution Performance
39
CHAPTER FIVE: SUMMARY, CONCLUSION AND RECOMMENDATIONS
5.1 Introduction
This chapter discusses the results gathered from the analysis of the data, as well as the
conclusions reached. The chapter incorporates the various suggestions and comments
given by the youth in the questionnaires. Findings have been summarized alongside the
objectives of the study, conclusions have been drawn from the study and the
recommendations for action are also given.
5.2 Summary of Findings
Majority of the distributors interviewed were male and most of the distribution
companies have been in operation for a period of over seven years. All the respondents
indicated that they had very high knowledge on distribution of products which is
consistent with industry norms. Businessmen will invest or venture into a field they are
well conversant with and will then continue to hire experienced staff to manage their
enterprises. The ownership and management of the companies was mostly group
ownership.
The study sought to find out the perception held by the distributors on the nature of an
organisation that Nairobi Bottlers Limited where they indicated that NBL held a
favourable image in the market which is consistent with the market trends and the near
monopoly status that it enjoys in the soft drinks industry. The finding suggests that
service accorded to distributors by NBL to the distributors was rated as good by a
majority of the respondents.
The study also sought the perceptions of Coca Cola Company distributors on the channel
management used by Nairobi Bottlers Company Limited. The respondents indicated that
they did indeed consult with the area sales manager when reviewing their distribution
strategies. They further indicated that this was done once a month or after every quarter.
There existed a motivational strategy which was both financial and non-financial. The
respondents indicated that NBL always regularly reviews the performance of products
40
with the distributors; NBL offered high quality services and usually consulted them after
the promotions to advice on the results.
The study then sought to determine the perceptions held by Coca Cola Company
distributors on the physical distribution management. From the results, it is evident that
NBL kept to their delivery times and that distributors were informed in advance to expect
the delays. NBL had enough resources for transportation and had leased trucks from
transporters to facilitate transportation but these were at times not adequate especially for
Nairobi Rural regions. They did indicate that NBL needs to invest more in transport
trucks and vans so as to ensure constant supply of products at all times. They had enough
storage space. Inventory management was good as distributor‟s orders were processed
and delivered in a timely and accurate manner. They also have good distribution
performance in place.
5.3 Conclusions
From the findings it can be concluded that the distributors have a positive perception of
NBL‟s distribution system in Nairobi. NBL holds a favourable image in the market which
is consistent with the market trends and the near monopoly status that NBL enjoys in the
soft drinks industry. It can also be concluded that the motivational strategy which is both
financial and non-financial that has been set in place serves to improve the distributors
perception. This was cited as stemming from the promotional items they received (caps,
t-shirts, free cases,) and the discounts and bonuses they received from purchases and
exceeding quotas set for them. It can also be concluded that NBL does not have enough
resources for transportation which can be cited from the fact that they have leased trucks
from transporters to facilitate transportation. It can be further concluded that NBL has
enough storage space with a good inventory management system and a good distribution
performance.
5.4 Recommendations
The study found out that NBL is in competition with other companies and as such it
should form linkages to ensure better productivity and performance. NBL needs to invest
41
more in transport trucks and vans so as to ensure constant supply of products at all times.
NBL needs to put in place procedures for allocating the necessary financial resources to
distributors thus enabling them to play their mandated roles. It should also invest more in
the motivational strategy by providing better terms and more promotional items (caps, t-
shirts, free cases,), discounts and bonuses they offer to distributors for purchases and
exceeding quotas set for them.
5.5 Recommendations for Further Studies
Distributor welfare programs are very important factors that affect organizations not only
in Kenya but the world over, it is therefore suggested that further research be carried out
focusing on whether there is a strong relationship between the provision of distributor
welfare programs and financial performance and stability of firms. NBL distribution
performance, as both good and average and it is therefore recommended that they expand
the storage spaces to cover the acute storage that occasionally occur during the peak
seasons.
Other areas of future research interest include relationships between provision of
distributor welfare programs and human behaviour of employees in Kenya. All these may
need the use of multi regression to analyze. The future study should be wide enough but
limited to particular sectors to control for the differences in various sectors or focus on a
specific organization.
42
REFERENCE
Abdallah, (2000), “An empirical investigation of the strategic marketing practices of the
soft drink industry in Kenya”, Unpublished MBA Research Project, University Of
Nairobi, Nairobi, Kenya
Armstrong, M. (2004), A handbook of human resources management; 10th edition;
London: Kogan Publishing Company
Beardwell, I., And Holden (1997), Human resource management: a contemporary
perspective; London: Pitman Publishing Company.
Belch G. E. and Belch M. A., (2004), “An integrated marketing communications
perspective” Advertising and promotion, 6th
Edition, New York: Pearson Professional
Ltd.
Bennett R, (1997), Organizational Behaviour; 3rd edition, New York: Pearson
Professional Ltd
Bert, R. (1997). Channels Management, 3rd edition, New York: Pearson Professional
Ltd.
Bolen, W. H. (2000). Advertising, Second Edition, London: McGraw Hill Press.
Cateora P. and Graham J.L. (1996), International Marketing, 10th
Edition, Boston: Irwin
Inc.
Churchill G. and Peter L. (1999), Marketing: Creating Value for Customers, Illinois:
Irwin McGraw Hill.
Cole G.A, (1996) Management; Theory and Practice, 5th
edition, New York: Continuum
Cole G.A, (1997), Personnel Management; 4th edition, London: Continuum
43
Cravens, Hills and Woodruff, (1996), Marketing Management, Irwin: McGraw Hill
Etzel M. Walker B. Stanton W. (2003).Marketing. Boston: Irwin: McGraw Hill
Griffith D.A., Ryan J.K., (1996), “Natural Channels in Global Marketing” Journal of
Marketing Practice, 1, (4), 5253 Vol no 1
Hackman, J.R and Wageman, R (1995), “Total quality management, empirical,
conceptual and practical issues” Administrative Science quarterly vol 40 no 2 pp 309-42
Institute of Personnel Management
Kibera and Waruinge, (1998), Fundamentals of marketing: An African Perspective
Nairobi: Kenya Literature Bureau.
Kotler P. (2001). Marketing Management: Analysis, Planning and Control. New Jersey:
Prentice Hall, Engle Wood Cliffs.
Kotler, P. (1997). Marketing Management: Analysis, Planning, Implementation, and
Control, Englewood Cliffs: Prentice Hall.
Kotler, P., Armstrong, G., Saunders, J. and Wong, V. (1996) Principles of Marketing:
The European Edition, Hemel Hemstead: Prentice Hall Europe.
Louis W., Adel I., El-Ansary, James R. (1989), Management in Marketing Channels,
New Jersey: Amazon
Majumder R. (1996). “Marketing Strategies”, New Delhi: Allied Publishers.
Martin and Jackson, (1997), Personnel Practice: People and Organization; London.
Masinde, (1986), Perceived Quality of Service: The case of Kenya Airways; Unpublished
MBA Research Project, University Of Nairobi, Nairobi, Kenya
44
Mburu (2001), “The impact of perceived quality on brand choice: The case of soft
drinks”, Unpublished MBA Research Project, University Of Nairobi, Nairobi, Kenya
McCarthy E. Perreault W., (1991), “Essentials of Marketing”, Boston: Irwin McGraw
Hill.
Mugenda, O. and Mugenda A. (1999); Research Methods: Quantitative & Qualitative
Approaches, Acts Press
Mullins L.J. (1999), Management and Organizational Behaviour, 5th
edition, Financial
Times Prentice Hall, Essex.
Nachmias and Nachmias, (1996), Research Methods in the Social Sciences, 5th
Edition,
St. Martin‟s Press, Inc
Paliwoda S., and Thomas M., (1998), International Marketing, Heinemann, Oxford, 3rd
edition
Paliwoda S., Thomas M. (1998). International Marketing, 3rd
edition, Heinemann:
Oxford.
Pearce J.A., Robinson R.B. (2003). Strategic Management; Strategy Formulation,
Implementation and Control, 8th
edition, Illinois: Irwin, Homewood
PIEA training manual – 2006
Sokoni – The Voice of Africa, June (2003), Youth Vibez – Ignore the Youth at your Own
Peril. Page 68.
Thompson A, Strickland A.J. (1993). Strategic Management; Concepts and Cases, New
York: Irwin
Waweru (2003), “A survey of the extent to which soft drinks advertising slogans
influence brand preference” Unpublished MBA Research Project, University Of Nairobi,
Nairobi, Kenya

45
World Bank, (2000), Economic Survey 2000, World Bank
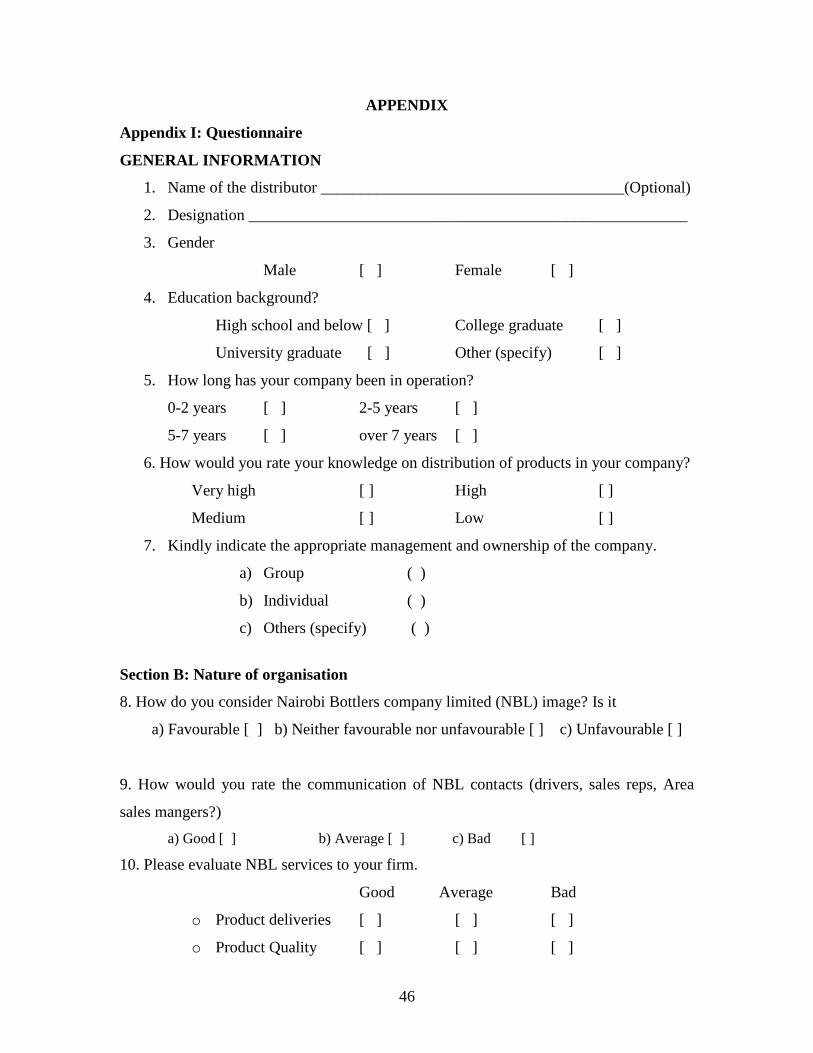
46
APPENDIX
Appendix I: Questionnaire
GENERAL INFORMATION
1. Name of the distributor ______________________________________(Optional)
2. Designation _______________________________________________________
3. Gender
Male [ ] Female [ ]
4. Education background?
High school and below [ ] College graduate [ ]
University graduate [ ] Other (specify) [ ]
5. How long has your company been in operation?
0-2 years [ ] 2-5 years [ ]
5-7 years [ ] over 7 years [ ]
6. How would you rate your knowledge on distribution of products in your company?
Very high [ ] High [ ]
Medium [ ] Low [ ]
7. Kindly indicate the appropriate management and ownership of the company.
a) Group ( )
b) Individual ( )
c) Others (specify) ( )
Section B: Nature of organisation
8. How do you consider Nairobi Bottlers company limited (NBL) image? Is it
a) Favourable [ ] b) Neither favourable nor unfavourable [ ] c) Unfavourable [ ]
9. How would you rate the communication of NBL contacts (drivers, sales reps, Area
sales mangers?)
a) Good [ ] b) Average [ ] c) Bad [ ]
10. Please evaluate NBL services to your firm.
Good Average Bad
o Product deliveries [ ] [ ] [ ]
o Product Quality [ ] [ ] [ ]
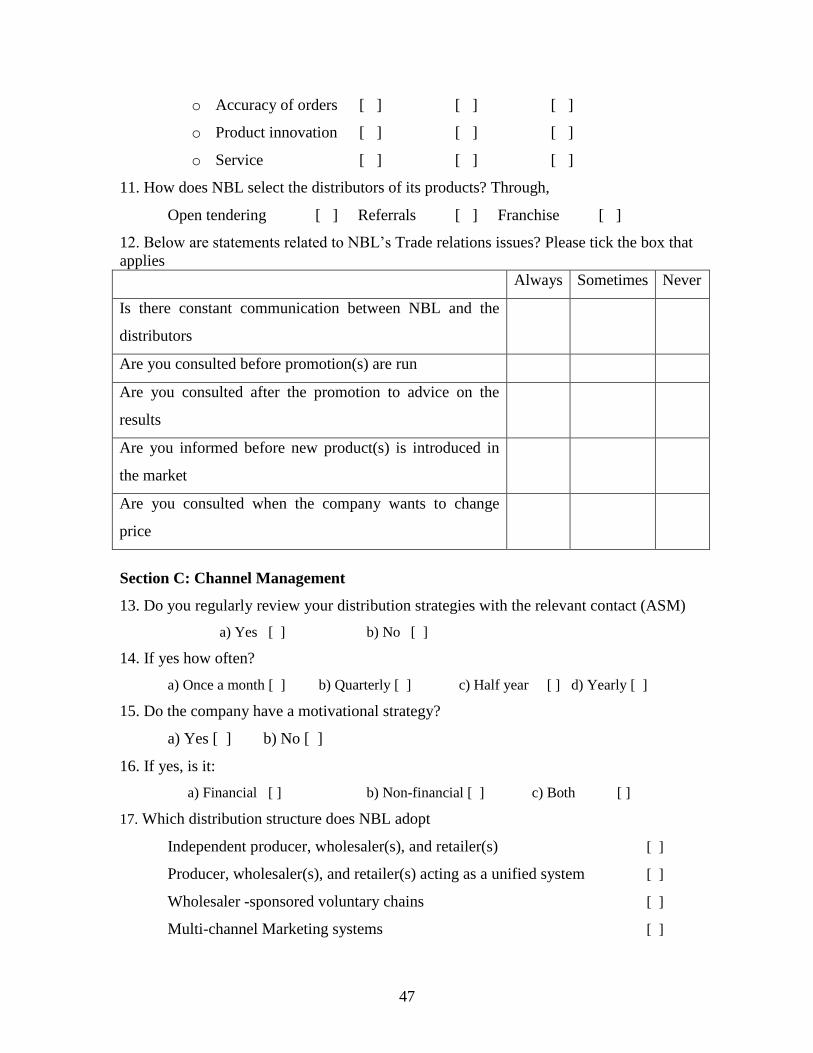
47
o Accuracy of orders [ ] [ ] [ ]
o Product innovation [ ] [ ] [ ]
o Service [ ] [ ] [ ]
11. How does NBL select the distributors of its products? Through,
Open tendering [ ] Referrals [ ] Franchise [ ]
12. Below are statements related to NBL‟s Trade relations issues? Please tick the box that
applies
Always Sometimes Never
Is there constant communication between NBL and the
distributors
Are you consulted before promotion(s) are run
Are you consulted after the promotion to advice on the
results
Are you informed before new product(s) is introduced in
the market
Are you consulted when the company wants to change
price
Section C: Channel Management
13. Do you regularly review your distribution strategies with the relevant contact (ASM)
a) Yes [ ] b) No [ ]
14. If yes how often?
a) Once a month [ ] b) Quarterly [ ] c) Half year [ ] d) Yearly [ ]
15. Do the company have a motivational strategy?
a) Yes [ ] b) No [ ]
16. If yes, is it:
a) Financial [ ] b) Non-financial [ ] c) Both [ ]
17. Which distribution structure does NBL adopt
Independent producer, wholesaler(s), and retailer(s) [ ]
Producer, wholesaler(s), and retailer(s) acting as a unified system [ ]
Wholesaler -sponsored voluntary chains [ ]
Multi-channel Marketing systems [ ]
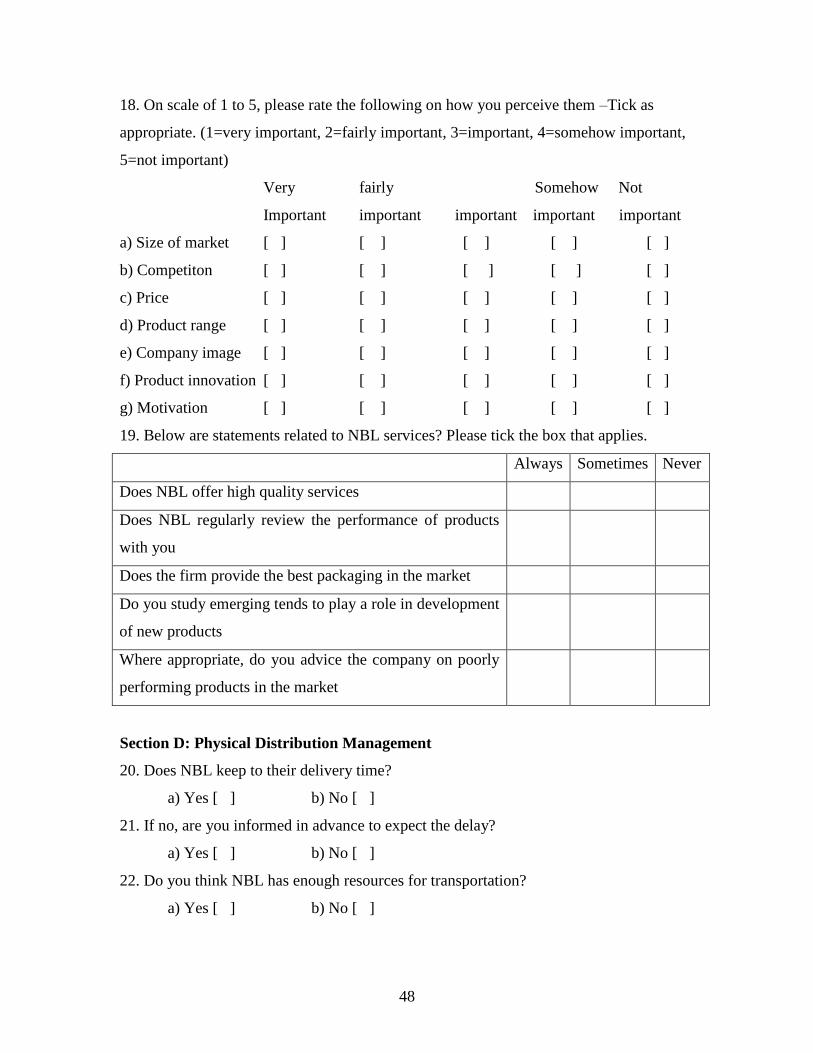
48
18. On scale of 1 to 5, please rate the following on how you perceive them –Tick as
appropriate. (1=very important, 2=fairly important, 3=important, 4=somehow important,
5=not important)
Very fairly Somehow Not
Important important important important important
a) Size of market [ ] [ ] [ ] [ ] [ ]
b) Competiton [ ] [ ] [ ] [ ] [ ]
c) Price [ ] [ ] [ ] [ ] [ ]
d) Product range [ ] [ ] [ ] [ ] [ ]
e) Company image [ ] [ ] [ ] [ ] [ ]
f) Product innovation [ ] [ ] [ ] [ ] [ ]
g) Motivation [ ] [ ] [ ] [ ] [ ]
19. Below are statements related to NBL services? Please tick the box that applies.
Always Sometimes Never
Does NBL offer high quality services
Does NBL regularly review the performance of products
with you
Does the firm provide the best packaging in the market
Do you study emerging tends to play a role in development
of new products
Where appropriate, do you advice the company on poorly
performing products in the market
Section D: Physical Distribution Management
20. Does NBL keep to their delivery time?
a) Yes [ ] b) No [ ]
21. If no, are you informed in advance to expect the delay?
a) Yes [ ] b) No [ ]
22. Do you think NBL has enough resources for transportation?
a) Yes [ ] b) No [ ]
49
23. If no, which additional investment should the company consider?
………………………………………………………………………………………………
………………………………………………………………………………………………
………………………………………………………………………………………………
24. How would you rate NBL distribution performance?
a) Good [ ] b) Average [ ] c) Bad [ ]
25. Any other
comments……………………………………………………………………..
………………………………………………………………………………………………
………………………………………………………………………………………………
………………………………………………………………………………………………
Thank you for your cooperation!