district of columbia tmdl implementation planning april 20, 2015 metropolitan washington cog
TRANSCRIPT

District of ColumbiaTMDL Implementation Planning
April 20, 2015
Metropolitan Washington COG

MS4 PERMIT REQUIREMENTS- TMDLS
• Consolidated TMDL IP for all MS4 WLAs• Schedule for attainment and, where applicable,
interim milestones and numeric benchmarks• Demonstration of how WLAs will be attained• Narrative for the schedules and controls
• Public for review and comment and submitted to EPA by May 2015
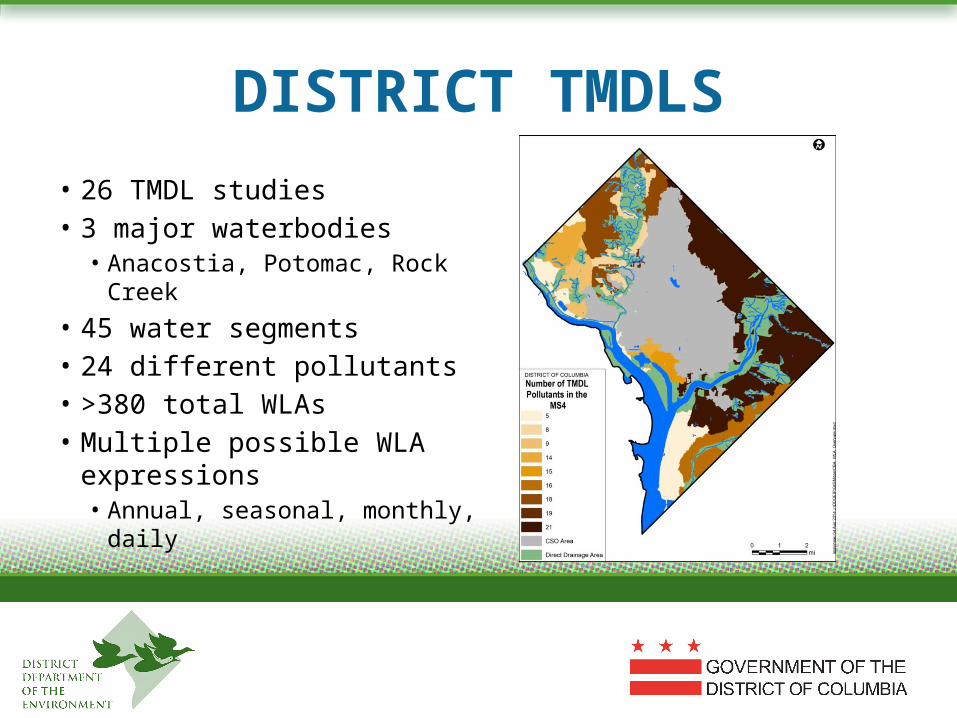
DISTRICT TMDLS
• 26 TMDL studies• 3 major waterbodies
• Anacostia, Potomac, Rock Creek
• 45 water segments• 24 different pollutants• >380 total WLAs• Multiple possible WLA
expressions• Annual, seasonal, monthly, daily

REVIEW OF TMDLS
• TMDLs supported by varying levels of data• Questionable impairment data
• TMDLs/MS4 WLAs for toxics being re-evaluated
• Inconsistent data and modeling approaches
• Other issues• TMDLs superseded/replaced• Overlapping TMDLs

Baseline Analysis
Modeling of Implementation Scenarios
(Iterative)
Consolidated TMDL Implementation Plan
Development of Consolidated TMDL Implementation Plan
TMDL IP Methodology
PROJECT CONCEPT AND APPROACH

CONSOLIDATED TMDL IP Summary and history of TMDLs in DC Evaluation of applicable TMDLs/MS4 WLAs Summary of implementation to date
Structural and non-structural BMPs Modeling of current and future (growth/development) scenarios Plan to close gaps in implementation Schedule for compliance with each TMDL with benchmarks Discussion of stakeholder and public involvement Integration with other plans/programs Potential sources for funding
CHALLENGES• History of TMDL development in DC
• “Consolidated” TMDL implementation planning
• Monitoring and compliance tracking
• Need for practical decision-making and adaptive management
• Long term projections
• Enforceable requirements
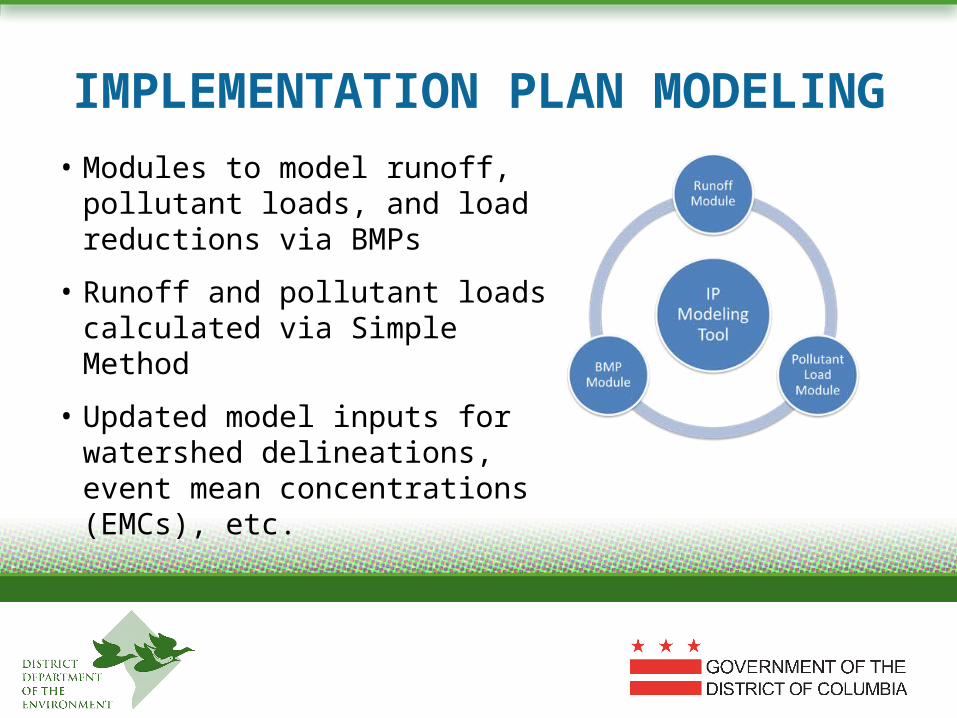
IMPLEMENTATION PLAN MODELING
• Modules to model runoff, pollutant loads, and load reductions via BMPs
• Runoff and pollutant loads calculated via Simple Method
• Updated model inputs for watershed delineations, event mean concentrations (EMCs), etc.

Baseline Conditions (no BMPs)
Current Conditions (with BMPs)
WLA
MODELING, CON’T.
Gap = Modeled Current Load – Original TMDL WLA
GAP = AMOUNT TO BE REDUCED THROUGH ADDITIONAL BMP IMPLEMENTATION

GAP ANALYSIS RESULTS

SCENARIO MODELING AND IMPLEMENTATION PLANNING
• Implementation projections• Ongoing BMP
implementation• Development/re-
development build-out• Existing watershed planning
• Schedule development

Development by 5 year Increment
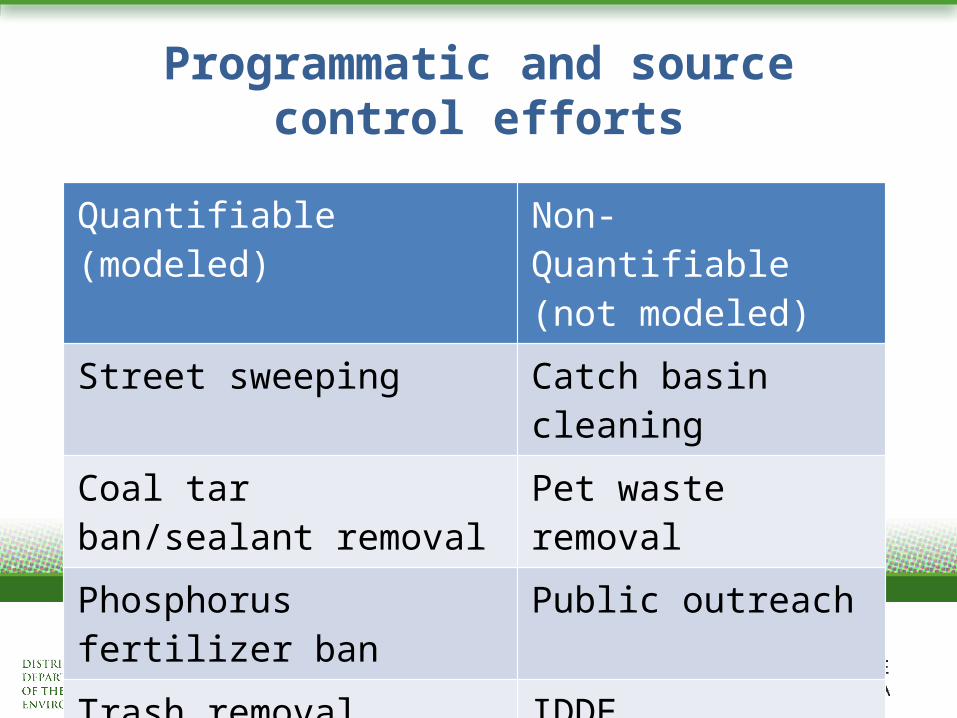
Programmatic and source control efforts
Quantifiable (modeled)
Non-Quantifiable (not modeled)
Street sweeping Catch basin cleaning
Coal tar ban/sealant removal Pet waste removal
Phosphorus fertilizer ban Public outreach
Trash removal IDDE
Others
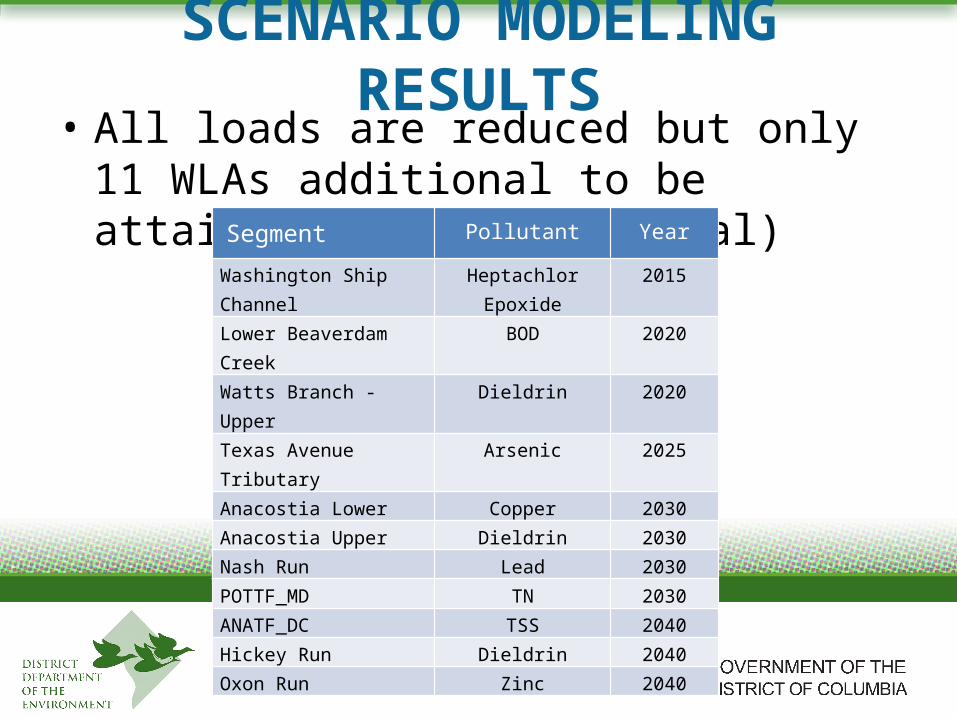
SCENARIO MODELING RESULTS
• All loads are reduced but only 11 WLAs additional to be attained by 2040 (54 total)
Segment Pollutant Year
Washington Ship Channel Heptachlor Epoxide 2015Lower Beaverdam Creek BOD 2020Watts Branch - Upper Dieldrin 2020Texas Avenue Tributary Arsenic 2025Anacostia Lower Copper 2030Anacostia Upper Dieldrin 2030Nash Run Lead 2030POTTF_MD TN 2030ANATF_DC TSS 2040Hickey Run Dieldrin 2040Oxon Run Zinc 2040

TOTAL PROJECTED AREA OF DEVELOPMENT/REDEVELOPMENT IN MS4 OVER
TIME

Milestone and Benchmark Definitions
• Milestone - interim step toward attainment of a WLA• Included when final attainment of applicable WLAs
requires more than five years • Enforceable
• Benchmark - quantifiable goal or target used to assess progress towards milestones• Numeric annual pollutant load reductions • Aid in adaptive management • Not enforceable

Purpose of Milestones and Benchmarks
Track progress towards meeting WLAs• Milestones are set at 5 year increments until ultimate
attainment of WLAs• Benchmarks are set annually
MilestoneBenchmark
2015 2020 2025 2030 20352016 2017 2018 2019
Milestones
• Measures physical progress in controlling pollutants
• Targets to be assessed over multi-year span
• Set at major basin level• Based on model projections

Developing Milestones
• 2016 to 2040• Use projections of area controlled by BMPs
• After 2040• Use projections of predicted load reductions

2020 Milestones
Major Basin Milestone (acres of area controlled)
Anacostia 833
Potomac 489
Rock Creek 152
Example Milestones
Benchmarks
• Developed for every individual MS4 WLA• Based on average annual amount of pollutant
reduction needed• Allows evaluation of progress for individual
MS4 WLA

Fort Stanton Tributary
Pollutant Benchmark (lbs/yr)TN N/A*TP N/A*TSS N/A*
E. coli 27.5 Billion MPN/yrBOD N/A*Trash N/A*
Arsenic 1.80E-03Copper 7.10E-02
Lead 2.20E-02Mercury N/A*
Zinc N/A**Chlordane 1.10E-05
DDD 3.50E-06DDE 1.50E-05DDT 3.80E-05
Dieldrin 4.10E-07Heptachlor Epoxide 1.10E-06
PAH1 9.00E-04PAH2 4.60E-03PAH3 3.00E-03
* No WLA **WLA met in 2014
Example Benchmarks

PROJECTED RESULTS
• Currently 29 WLAs achieved
• By 2040 – 30% of MS4 retrofit to 1.2” retention standard
• Significant load reductions achieved for all WLAs
• Only 44 WLA achieved

IMPLICATIONS• Implementation timelines for some WLAs will be extremely
long
• Level of control for some WLAs exceeds what is achievable by current treatment BMPs, or practical by runoff retention
• Plan will focus on making year-over-year progress in a consistent fashion, tracking improvements, and adaptively managing
• Underscores the importance of revisiting and refining the District’s TMDLs
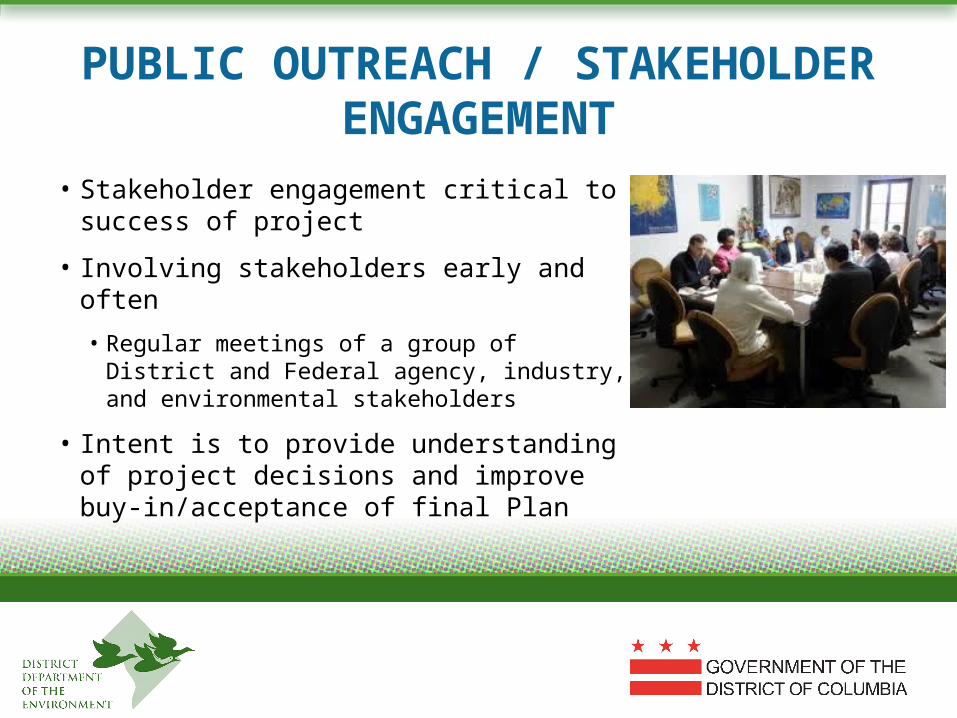
PUBLIC OUTREACH / STAKEHOLDER ENGAGEMENT
• Stakeholder engagement critical to success of project
• Involving stakeholders early and often
• Regular meetings of a group of District and Federal agency, industry, and environmental stakeholders
• Intent is to provide understanding of project decisions and improve buy-in/acceptance of final Plan
QUESTIONS?
Jonathan Champion
DDOE Stormwater Management Division
(202) 535 1722
www.dcstormwaterplan.org