diuin paper serie - iza institute of labor economicsftp.iza.org/dp10570.pdf · diuin paper serie...
TRANSCRIPT

Discussion PaPer series
IZA DP No. 10570
Alessia MatanoPaolo Naticchioni
The Extent of Rent Sharing along the Wage Distribution
februAry 2017

Any opinions expressed in this paper are those of the author(s) and not those of IZA. Research published in this series may include views on policy, but IZA takes no institutional policy positions. The IZA research network is committed to the IZA Guiding Principles of Research Integrity.The IZA Institute of Labor Economics is an independent economic research institute that conducts research in labor economics and offers evidence-based policy advice on labor market issues. Supported by the Deutsche Post Foundation, IZA runs the world’s largest network of economists, whose research aims to provide answers to the global labor market challenges of our time. Our key objective is to build bridges between academic research, policymakers and society.IZA Discussion Papers often represent preliminary work and are circulated to encourage discussion. Citation of such a paper should account for its provisional character. A revised version may be available directly from the author.
Schaumburg-Lippe-Straße 5–953113 Bonn, Germany
Phone: +49-228-3894-0Email: [email protected] www.iza.org
IZA – Institute of Labor Economics
Discussion PaPer series
IZA DP No. 10570
The Extent of Rent Sharing along the Wage Distribution
februAry 2017
Alessia MatanoUniversitat de Barcelona, AQR-IREA and University of Rome “La Sapienza”
Paolo NaticchioniRoma Tre University and IZA

AbstrAct
IZA DP No. 10570 februAry 2017
The Extent of Rent Sharing along the Wage Distribution*
The relation between rent sharing and wages has generally been evaluated on average
wages. This paper uses a unique employer-employee panel database to investigate the
extent of rent sharing along the wage distribution in Italy. We apply quantile regression
techniques and control for national level bargaining, unobserved worker and firm
heterogeneity and endogeneity. Our findings show that the extent of rent-sharing
decreases along the wage distribution, suggesting that unskilled workers benefit most from
firms’ rents. By applying quantile regressions by occupational categories, we show that the
decreasing pattern is mainly driven by blue collar workers, while estimates for white collars
are higher and basically constant along the wage distribution. We also provide evidence
that unions might represent one of the driver of our findings.
JEL Classification: C33, J31, J41, L25
Keywords: rent sharing, wage distribution, quantile regressions, IV quantile regressions, quantile fixed effects regressions
Corresponding author:Paolo NaticchioniRoma Tre UniversityVia Chiabrera 19900145 RomeItaly
E-mail: [email protected]
* We are grateful to the research partnership between ISFOL (Rome) and Dipartimento di Analisi Economiche e Sociali - University ”La Sapienza” of Rome, for access to the INPS, AIDA and RIL databases. We also thank Roger Koenker for his comments and for making his procedure available, Christian Dahl, Antonio Galvao and Christian Hansen for access to the routines and for suggestions concerning implementation of the quantile procedures, and participants in seminars at University of Barcelona, AIEL 2012 (Naples), LEED Workshop 2013 (Lisbon), EALE 2013 (Turin), SIE 2013 (Bologna), SAEe 2014 (Palma de Mallorca), RES 2015 (Manchester), ESPE 2015 (Izmir), ALDE 2015 (Alicante) conferences. We finally thank three anonymous referees for comments and useful suggestions. Alessia Matano gratefully acknowledges financial support from the Spanish Ministry of Economy and Competitiveness through the project ECO2016-75805-R.

2
1. Introduction
European countries are usually taken as examples for non-competitive labor markets
because of the important role played by labor market institutions. The economic
literature has largely investigated how wage setting works in non-competitive labor
markets, and how rent sharing can emerge in such markets. Non-competitive theories,
such as efficiency wage and bargaining models, can predict a positive relationship
between wages and profits. In particular, bargaining models underline that wages
result from a bargain between employer and employees which generates a long-run
positive relation between wages and profits. In this setting, wages are determined by
workers’ outside options, by quasi-rent (firm profits evaluated at the opportunity cost
of labor) and by the relative bargaining power of the parties involved (Hildreth and
Oswald, 1997).
At the empirical level many papers have tested the existence and extent of rent
sharing (Abowd and Lemieux, 1993, Van Reenen, 1996, Margolis and Salvanes, 2001,
Martins, 2009, Card et al., 2014, etc.). However, these analyses have generally been
carried out taking into account average wages. In this way there can be no insight into
the distributional consequences of rent sharing, i.e. it is not possible to take into
account the difference in the degree of rent sharing for workers located at different
points of the distribution.
The aim of this paper is to evaluate the degree of rent sharing along the whole wage
distribution in order to achieve a better understanding of the mechanisms behind the
relation between profits and wages. Previous empirical investigations have analyzed
rent sharing across categories of workers, defined by education and by occupation. The
main drawback using this approach is that workers belonging to the same
education/occupation level are usually associated to very high within group wage
heterogeneity. For instance, according to the 1996 data of the European Community
Household Panel, almost 50% of Italian graduates were not employed in the top
quartile of the wage distribution, and around 20% had a wage lower than the median,
suggesting a substantial heterogeneity within educational levels. A similar argument
can be applied when considering blue collar and white collar workers, where
especially in the white collar category secretaries coexist with managers, with huge
differences in terms of productivities and wages. We make use of quantile regressions
methodologies to deal with this heterogeneity, since percentiles of the wage

3
distribution can be more closely associated to the productivity of workers in the labor
market.
Furthermore, there could be various different reasons why rent sharing is not
uniform along the workers’ wage distribution. On the one hand, it might be argued
that if bargaining at the firm level was mainly organized by unions, low and median
skilled workers might enjoy a higher degree of rent sharing than high skilled workers.
This channel refers to the robust evidence concerning the distributional goals of unions
that mainly represent the interest of low skilled workers (Di Nardo et al., 1996; Card,
1996; Frandsen, 2012). On the other hand, if bargaining occurred mainly at the
individual level, rent sharing might favor high skilled workers, who can benefit from
higher individual bargaining power and performance pay schemes (Lemieux et al.,
2009). Hence, given the ambiguous theoretical predictions, the analysis of rent sharing
along the wage distribution is mostly an empirical issue, and to the best of our
knowledge this is the first paper that addresses this issue along the whole wage
distribution.
In our analysis we make use of a unique employer-employee panel database from
1996 to 2003 for Italy, constructed by merging the INPS (the Italian Social Security
Institute) employer-employee panel database with the AIDA database (provided by
Bureau Van Dick) which contains detailed information on the balance sheets of the
Italian capital-owned firms.
On the econometric side, our empirical analysis takes into account all the issues
which have been proved to be relevant when addressing the relationship between rents
and wages.
We begin by estimating the impact of quasi-rents on wages using cross-sectional
quantile regressions (Koenker and Basset, 1978), controlling for observed worker and
firm heterogeneity. In the estimation we use as proxy for the opportunity cost of labor
the minimum wage corresponding to the national contract applied to each worker and,
within the national contract, to the exact occupation level (‘livello di inquadramento’)
the worker belongs to. We argue that this is an accurate measure to control for the
opportunity cost of labor mainly because in such a way it is possible to control in the
estimates for the first national collective bargaining level, since minimum wages in
Italy are formally bargained at the national level between unions and employer
associations. The cross-section estimates show that the impact of rent sharing is

4
positive for all percentiles analyzed and decreases along the wage distribution: rent
sharing elasticities range from 5.4% at the 10th wage percentile to 4.3% at the 90th wage
percentile.
A second step in the analysis is to control for the unobserved worker and firm
heterogeneity, which can affect the relationship between profits and wages (Card et al.,
2014, Arai and Heyman, 2001, Margolis and Salvanes, 2001, Martins, 2009). By
applying quantile job-match fixed effects estimates (Canay, 2011), that explicitly take
into account the individual and firm unobserved heterogeneity, the impact of rent
sharing is significantly reduced along the whole wage distribution and rent sharing
elasticities are still slightly decreasing along the wage distribution.
The last step of the empirical analysis investigates the endogeneity issue, which has
been proved to be a serious concern in the analysis of rent sharing since endogeneity
could cause serious coefficients underestimation (Card et al., 2014, van Reenen, 1996),
an underestimation which could even be exacerbated by the introduction of fixed
effects in the specification (Nickell, 1981). Therefore, we apply IV quantile fixed effect
estimation techniques (Galvao, 2011, Galvao and Montes-Rojas, 2010). For the
instrument, we exploit the intuition developed in Card et al. (2014) by using a
weighted average of the real sales per employee in other provinces of Italy in the same
3-digit industry. The idea is that real sales per employee in the same industry – which
represents national industry demand shocks - affect the profitability of the firms.
Further, these sales relate to firms in other provinces of Italy and are therefore assumed
to be uncorrelated with local labor market conditions. Consistently with the related
literature, by applying an IV methodology estimates increase along the whole wage
distribution and by a large extent, thus pointing out that previous fixed effects
estimates suffered by a serious degree of underestimation. In particular, the elasticity
of wages with respect to rents stands at 7.3% at the 10th percentile, 6.1% at the median
and 5.0% at the 90th percentile, confirming that the degree of rent sharing is decreasing
along the wage distribution.
We also explore the heterogeneity of rent sharing within occupational categories by
applying our preferred specification separately for blue collars and white collars. In
such a way we integrate our approach based on quantile regressions with the standard
sample split approach by occupational categories. To the best of our knowledge, this
represents an original contribution of the paper, aimed at capturing the large
heterogeneity within occupational categories. Interestingly, results show that, on

5
average, the decreasing pattern uncovered in the main estimates is mainly driven by
the results for blue collar workers. Estimates for white collars are higher and basically
constant along the wage distribution, consistently with the intuition that high skilled
workers might have higher individual bargaining power (Arai and Heyman 2001;
Martins, 2009; Guertzen, 2009).
As a possible explanation for our findings, we investigate the role of union, which in
Italy represents an important actor in the bargaining process between workers and
employers. Indirectly, this also allows us to address the role of individual bargaining,
defined as the rent sharing left once having controlled for the role of unions, observed
and unobserved individual and firm heterogeneity, national bargaining and
endogeneity issues. We test this possible explanation exploiting the regional/sectoral
variability in the percentage of unionized firms, considered as a proxy for union power
in the bargaining process at the local/firm level. Focusing on the manufacturing sector,
we introduce in our preferred specification an interaction term between the quasi-rent
variable and a dummy indicating high union presence. Also in this case we analyze the
results separately for blue collars and white collars, and interesting differences emerge.
As for blue collar workers, unions seem to represent a driving force at all percentiles of
the distribution, but the union effect is stronger for the unskilled blue collars,
suggesting that unions mainly care about unskilled welfare (Di Nardo et al., 1996;
Card, 1996). For white collars, still the interaction with unions seems to be a crucial
driver for workers at the 10th and 50th percentiles, while individual bargaining emerges
to be a not negligible driver for the rent sharing accruing to the high skilled workers.
Nonetheless, we want to stress that the latter findings have to be taken with some
cautious, because of the imperfect proxy of union power we use and of the assumption
of union exogeneity.
The structure of the paper is as follows. In Section 2 we review the theoretical and
empirical literature on the relationship between profits and wages. In Section 3 we
describe the data we use throughout the empirical analyses. Section 4 discusses the
empirical specification and presents the main results. Section 5 concludes.
2. Related Literature
Non-competitive theories underline that firms may pay a wage over the level set in the
competitive labor market for various different reasons. First, it is possible that firms

6
pay higher wages on the basis of efficiency wage arguments (see Shapiro and Stiglitz,
1984, Krueger and Summers, 1988). Second, according to bargaining theories, profits
and wages can move together due to the bargaining over wages between employers
and employees. More specifically, in a bargaining framework, wages at the firm level
are determined by workers’ outside options, by the quasi-rent (firm profits evaluated
at the opportunity cost of labor) and by the relative bargaining power of the parties
involved (Hildreth and Oswald, 1997).1
As for the empirical evidence, many studies explore the existence and the extent of
rent sharing in different countries, using various methodologies and various kinds of
data. Hildreth and Oswald (1997) make use of firm level data for the UK providing
evidence in favor of a significant positive relationship between profits and wages,
controlling for observed work heterogeneity and firm characteristics and applying
GMM techniques (or using lagged values of profits) to control for the endogeneity of
profits. Similar findings are derived by Blanchflower, Oswald and Sanfey (1996) for the
US, using industry level data matched with individual data.
Other papers use instrumental variables techniques to control for the endogeneity of
profits. Abowd and Lemieux (1993), in the case of Canada, use instruments related to
international performance, namely the industry import and export prices, finding a
very large degree of underestimation in the extent of rent sharing when not controlling
for the endogeneity between profits and wages. Van Reenen (1996) analyzes the case of
the UK using different measures for profits and past innovations as instruments. His
findings suggest a substantial amount of rent sharing in the UK, and serious
underestimation when not controlling for endogeneity.
More recently, various papers have made use of matched employer-employee panel
data in order to control for unobserved worker and firm heterogeneity. Margolis and
Salvanes (2001) investigate the case of France and Norway. They apply IV techniques
using as instruments sales and operating subsidies, finding relevant rent sharing only
in the case of Norway. For France, when taking into account the unobserved individual
heterogeneity in the IV estimation, rent sharing estimates are not significant. Similarly,
using employer-employee data Arai (2003) analyzes the case of Sweden. He uses time- 1 Note that also within a modified version of the competitive model it is possible to have a positive correlation between wages and profits. In particular, in the presence of short-run frictions, such as those experienced by firms facing an upward sloping labor supply curve, positive demand shocks could lead to a rise in total firm profits and wages (Hildreth and Oswald, 1997). However, in the long-run, wages adjust to the competitive level. Hence, a test for rent sharing cannot rest on the evidence of a short-run correlation between profits and wage.

7
average of lagged values of profits as instruments and controls for observable firm
characteristics. He finds robust evidence of rent sharing, in line with bargaining
theories, and this effect does not differ across the different worker categories. In
another related paper, Arai and Heyman (2001) make use of a larger employer-
employee matched, providing evidence of higher rent sharing for white collar workers
with respect to blue collars, and for the service sector with respect to manufacturing.
They also apply instrumental variable techniques, using different instruments such as
lagged values of profits, demand elasticity and measures indicating the degree of
competition in the product market.
Also Martins (2009) makes use of matched employer-employee panel data to derive
evidence of rent sharing for Portugal in the period 1993-1995. His findings strongly
support the need to take into account the role of both the unobserved individual and
firm heterogeneity, as well as endogeneity (the interaction between the exchange rate
and the share of total exports in sales is used as instrument). Further, he shows that
rent-sharing is substantially higher for better educated workers.
Another interesting paper is Guertzgen (2009), which focuses on how rent sharing is
affected by the different levels of bargaining in Germany, using firm-worker level data
and GMM techniques. She shows that rent sharing is higher where there is no
collective agreement coverage and in the presence of firm-specific contracts. Moreover,
she also shows that blue collar workers in uncovered establishments seem to benefit
more from the local bargaining power of works councils, i.e. local unions, and that high
educated workers display higher rents.
Rusinek and Rycx (2013) also analyze the impact of different levels of bargaining
(industry and firm level) on the extent of rent sharing, using an employer-employee
database for Belgium. Their results show that, after controlling for the endogeneity of
profits and heterogeneity among workers and firms, in industries where agreements
are more likely to be renegotiated at firm-level (‘decentralized industries’), wages and
profits are positively correlated regardless of the type of collective wage agreement. On
the contrary, where firm-level wage renegotiation is less likely (‘centralized
industries’), wages are only significantly related to profits for workers covered by a
firm-level collective agreement.2
2 See also Martins (2007) for a survey of the main empirical results and methodologies applied in the rent sharing literature.

8
As for Italy, empirical evidence on rent sharing is somewhat wanting. One of the
few exceptions is the paper by Card et al. (2014), which analyzes the degree of rent
sharing and tests the hold-up hypothesis in the Italian region of Veneto in 1995-2001.
By using INPS-AIDA matched employer-employee data, they perform an accurate
analysis taking into account all the relevant issues needed to identify the extent of rent
sharing (the workers’ and firms unobserved heterogeneity and the endogeneity of
profits). Their findings show that there is evidence of a substantial degree of rent
sharing in Veneto, and that profits are shared with workers after capital costs are fully
deducted from profits.3
3. The Italian Institutional Setting and Data Description
The institutional issues related to this paper concern the Italian wage setting. Since the
beginning of the nineties there has been a two-level wage bargaining system, which is
similar to schemes used in other European countries such as Germany. The first level
concerns national collective bargaining, which has to preserve the purchasing power of
wages at the sector level by incorporating the expected inflation rate in wage increases.
This is done by setting minimum wages for all workers covered by the related National
collective agreements, which are renewed every 2-4 years. Minimum wages are
different in each industry, and within industries different minimum wages are
assigned to different workers in different occupation levels (‘livelli di inquadramento’):
this means that minimum wages are settled, at different levels, for blue collar workers,
white collar workers and managers.
The second level of bargaining is decentralized, and encourages rent sharing
through performance-related pay schemes at the region/firm level.4 This second level
is not compulsory for firms and unions, while it is compulsory respecting the lower
bound set by the minimum wage of the first national bargaining level.
3 Apart from Card et al (2014), very few published papers are available on rent sharing in Italy. We mention Matano and Naticchioni (2013) who investigate the extent of rent sharing in Italy from a gender perspective. 4 Apart from the wage setting issue, the second level bargaining may also concern other work dimensions, such as hours worked, working conditions, etc. Furthermore, note also that in Italy workers can bargain at the individual level their wages, with the only constraint given by the minimum wage set by at the national level.

9
As for the data, we use a panel version of the administrative database provided by
INPS (Italian Social Security Institute) and elaborated by ISFOL.5 It is a matched
employee-employer dataset, constructed by merging the INPS employee information
database for the period 1985-2003 with the INPS employer information database.6 The
database contains individual information such as age, gender, occupation, workplace,
date of beginning and end (if any) of the current contract, the kind of national contract
and the related minimum wage, the social security contributions, the worker status
(part-time or full-time), the real gross yearly wage and the number of weeks worked.
We then have some information concerning the firm such as the plant location
(province), the number of employees and the sector (NACE Rev.1.1). We focus on male
and female workers, aged between 15 and 64 (when they first enter the database),
working in the industrial and service sectors, both part-time (converted into full-time
equivalent) and full-time, employed in standard labor market contracts: blue collar and
white collar workers (excluding managers and apprenticeship workers). We derive the
panel version considering only one observation per year for each worker. For workers
who display more than one observation per year we selected the longest available
contract in terms of weeks worked.7
We merge the INPS panel dataset with the AIDA database, from 1996 to 2003. AIDA
is a database on Italian (capital-owned) firms provided by Bureau Van Dijk that
contains information on the balance sheet such as value added, profits, sales,
production and costs of production.8
The two databases are merged by using as key variable the tax code or the VAT
number (codice fiscale or partita IVA) of the company, in such a way restricting the
5 ISFOL stands for “Institute for the Development of Vocational Training”. The sample scheme has been set up to follow individuals born on the 10th of March, June, September and December and therefore the proportion of this sample on the Italian employees’ population is approximately of 1/90. 6 For the information on employers we also make use of the ASIA (“Italian Statistical Archive of Operating Firms”) database, provided by ISTAT. This database has been used since 1999, because the INPS employer database was no longer available as from 1998. The two databases provide the same set of information (firm size and sector). 7 As a robustness check, in a previous version of the paper, we have focused on prime age workers to minimize issues related to labour force participation, and baseline results of the analysis were basically unaffected. 8 The data have been deflated using the valued added deflator for value added, profits, sales, production and costs of production. The value added deflator is derived from our elaboration of ISTAT data on regional economic accounts and is defined at the sectoral and regional level. The base year is 2002.

10
analysis to the capital-owned firms.9 After the merge, we recover our final estimation
sample largely following the approach outlined in Card et al. (2014), a reference paper
in the field, which uses the same INPS-AIDA data, although restricted to the Veneto
region. In particular, we eliminate those observations where the difference in the firm
size reported in AIDA and the one reported in INPS exceeds 100 (in this way the
correlation between the firm size reported in AIDA and the firm size reported in INPS
is 0.99). We also drop firms with less than 15 employees, since these firms are
exempted from many labour regulations and we exclude the "construction" and
"mining" sectors. Further, we eliminate extreme observations below (above) the 1st
(99th) percentile of the wage, profits per employee and total personnel costs variables,
used to build the quasi-rent variable. Finally, we drop workers for whom data on the
minimum wage are not available. In fact, our database does not include minimum
wages for the – nearly - 300 national contracts. We have this information for the 39
major contracts, which nonetheless cover more than 75% of the whole sample. Table
A1 in the Appendix shows the details of the steps implemented from the original INPS
data to the final sample estimation. The table shows that after the merge with AIDA
(comparison between columns (1) and (2)), the firm size increases as well as both the
average and minimum wage. This is due, as already stressed, to the fact that in AIDA
only capital-owned firms with turnover higher than 500,000 euro are included. These
firms are in general larger, and due to the positive empirical relation between firm size
and wages, also the average wages turn out to be larger. Therefore, we stress that this
analysis is representative for the capital-owned firms with a turnover higher than
500,000 euro and not of the universe of Italian firms. This is not unusual for empirical
analyses that make use of balance sheet data that are available in most of the countries
only for capital-owned firms. As for the following steps of the sample selection, table
A1 shows that when passing from the matched INPS-AIDA sample (column (2)) to the
panel estimation sample (column (3)), i.e., by eliminating the outliers data, there is a
slight reduction in the average firm size, average quasi-rents and average wage
variables. The next steps (columns (4) and (5)) do not entail significant changes in the
characteristics of the sample (all details are included in the legend of Table A1).
9 Note that AIDA contains capital-owned firms with total value of production equal to or higher than 500,000 euro, while INPS data cover workers employed in all kinds of companies whatever the legal status and amount of total value of production. Therefore, it is possible to match only the INPS records of firms that are included in the AIDA database. For this reason, the merge concerns around 50% of the original INPS data.

11
In this way, we end up with an employer-employee panel database constituted by
38,810 workers for 157,600 observations for the period 1996-2003.
4. Econometric Analysis
4.1 Econometric Strategy
In this section we present our empirical strategy for investigating the impact of rents
on wages. Since our focus is on the relationship between rents and wages along the
wage distribution, we start by performing standard quantile regressions (Koenker and
Bassett, 1978). We use the INPS-AIDA employer-employee database from 1996-2003.
The baseline specification is quite standard in the rent sharing literature (see for
instance Van Reenen, 1996), and it is as follows:
where θ refers to the percentile, i to individuals, j(i,t) to the firm where the worker i is
employed at time t, c(i,t) to the national contract (along with its level) the worker is
subject to, s to industry. The dependent variable, the (log) real gross weekly wage in
euro,10 includes all components of gross wages (base wage, overtime payments and
bonuses). As main independent variable we use the quasi-rent per worker defined as
rents per worker evaluated at the opportunity cost of labor, QuasiRentsj(i,t), which is
equal, in line with Martins (2009), to the total revenues per workers minus non-labour
costs and the alternative wage, where the total revenues per workers minus non-labour
costs have been proxied by using accounting profits per workers plus total personnel
costs per worker.11
The term I_Chari,t is the set of observed individual characteristics, such as age, age
squared, tenure (in three categories, 1-2, 3-10, more than 10 years) and occupation
dummy (blue collar and white collar). MWc(i,t) is the national contract minimum wage.
Firmsizei,t (in log) is the proxy for firm heterogeneity, while φs, λa, δt are industry (17
sectors), regional (20 regions) and year dummies respectively. All the relevant
10 Wages have been deflated using as deflator the National Consumer Price Index (FOI index, Indice dei Prezzi al Consumo per le Famiglie di Operai e Impiegati, ISTAT). The base year is 2002. 11 Note that in accounting profits per worker, capital costs are already deducted. See Martins (2009) for more details and for a derivation of a standard Nash bargaining problem, in which employers and workers choose employment and wage levels.
'( , ) ( , ) , ( , )
1, ( , ) , , , , ,
ln( ) * ln * _ * ln
* ln Re
i t c i t i t j i t
j i t s a t i t
w MW B I Char Firmsize
Quasi nts
12
variables are in logarithms and therefore we estimate elasticities. Table 1 shows the
descriptive statistics of the variables of the analysis.
[Table 1 around here]
In the first specification, as benchmark estimates, we perform cross-sectional
quantile estimates where, as already pointed out, we use as alternative wage the
minimum wage which captures the extent of the first (national) level of bargaining. It is
worth noting that the minimum wage turns out to be a very accurate measure to
control for first level bargaining at the national level. At the same time it is an
appropriate measure of the opportunity cost of labor. We prefer to use this measure, in
contrast to the average industrial wages generally used in the literature, because it is
related to the specific contract (and within the contract to the specific level) the worker
belongs to.12 Nonetheless, in the following we will also carry out a robustness check
using as measure for the opportunity cost of labour a standard average industrial
wage.
Since an important concern in our analysis is to tackle the issue of the unobserved
heterogeneity that can bias the cross sectional estimates, we then carry out quantile
fixed effects estimates (Canay, 2011). In fact, in the literature unobserved worker
heterogeneity has been proved to be very important in affecting the relationship
between rents and wages since high-skilled workers may sort into highly profitable
firms (Martins, 2009, Arai and Heyman, 2001, Margolis and Salvanes, 2001).
Furthermore, recent papers have also taken into account firm unobserved
heterogeneity that might play a crucial role in affecting firm profitability and rent
sharing policies. Card et al. (2014) consider their preferred specification the one that
includes job-match effect (i.e., fixed effects for each worker-firm pair) that control for
unobserved heterogeneity of both workers and firms. We follow this empirical strategy
approach using job-match fixed effects in all estimates presented in this paper.
12 The number of different minimum wages, obtained by combining the number of different contracts and the occupational levels within the contracts, is on average 257 per year. The number of national contracts is on average 35 per year, while considering the entire sample time span we have the availability of 39 different contracts.

13
Finally, in order to control also for the issue of the endogeneity between profits and
wages (due to simultaneous determination and to possible measurements error) we
apply an IV strategy. The literature has stressed that in case of endogeneity the
(attenuation) bias in the cross-sectional estimates can be severe, and may also be
aggravated by a fixed effects strategy (Card et al., 2014). Therefore, we use a very
recently developed estimation strategy of IV quantile fixed effects estimates (Galvao,
2011, and Galvao and Montes-Rojas, 2010), which is an extension of the IV quantile
procedure of Chernozukov and Hansen (2008) that allows for the inclusion of fixed
effects as introduced in Koenker (2004).13 As instrument we exploit the idea developed
in Card et al. (2014) by using a weighted average of the firm sales per employee in
other provinces of Italy but in the same three-digit industry of the firm considered. The
weights are the inverse of the distance between the main province cities (‘capoluoghi’).
The idea is that industry sales, which represent industry demand shocks, affect the
profitability of the firms while, at the same time, they are not correlated with local
labor market conditions since they concern firms in other provinces of Italy. Card et al.
(2014) provide evidence supporting this identifying assumption.14 Since their analysis
concerns the Italian labour market (using also the same administrative data even if
only for the Veneto region), the same evidence can be used to support our analysis.
Nonetheless, we carry out a robustness check concerning the exogeneity of our
instrument. In particular, we address the issue that demand shocks in provinces within
the same region of the province where the firm is located might be spatially correlated.
For this reason, we will carry out our preferred estimates using an alternative
definition for the instrument where we exclude from the instrument computation the
provinces belonging to the same region where the firm is located.
13 For a detailed description of the procedures applied see the Appendix in Matano and Naticchioni (2012) and Canay (2011), Galvao (2011) and Galvao and Montes-Rojas (2010). 14 In particular, the main possible criticism to this IV approach is that industry-level shocks may be correlated with the unobserved determinants of wages, leading to a bias in the estimates. Card et al (2014) argue that such bias is most likely to arise in industrial districts (specialized local labour markets), where many of the alternative jobs for a given worker are in the same narrowly defined industry. When re-estimating the baseline specification dropping observations for firms in the most prevalent industry in industrial districts their results remain basically the same, suggesting the validity of the identifying assumption.

14
4.2 Results
Table 2 shows the cross-sectional quantile estimates of the impact of profits per
employee on workers’ wages, by using the minimum wage as a measure for the
opportunity cost of labor.
The main relevant variable, quasi-rent, displays a non-uniform impact along the
wage distribution. In particular, elasticity estimates decrease along the wage
distribution, standing at 5.4% at the 10th percentile, 5.0% at the median and 4.3% at the
90th percentile. The impact at the median is then very similar to that at the mean 5%
(table A2 in the Appendix), which is not surprising since the distribution of (log) wages
should come fairly close to a symmetric distribution. The Lester range associated to the
OLS estimates is 13.7%, slightly lower with respect to Card et al. (2010).15 Moreover,
since these elasticities have been computed by controlling for the importance of the
first (national) level of bargaining, they suggest that there is a non-negligible rent
sharing that essentially takes place at the local, firm and individual level (consistently
with Van Reenen, 1996).16
[Table 2 around here]
The cross sectional standard quantile regressions are likely to be biased since they
do not take into account the unobserved heterogeneity of workers and firms. Therefore
we run quantile fixed effects estimates (Canay, 2011), enabling the introduction of job-
match fixed effects in the estimation, in such a way as to capture time invariant worker
and firm unobserved heterogeneity. Table 3 shows the results. The estimates change
15 The “Lester” range is defined as the elasticity of wages with respect to quasi-rent multiplied by four times the ratio between the standard deviation of quasi-rent and mean quasi-rent (Lester, 1952). It provides a measure of how much the wage of a worker increases moving from a firm at the bottom of the profit distribution (two standard deviations below the mean) to a firm at the top of the profit distribution (two standard deviations above the mean). In this paper we are unable to provide measures for the “Lester” range, since we are working with quantiles and not with average wages. For this reason we compute the Lester range associated to the OLS estimates shown in Table A2 in the Appendix. 16 As for the control variable in the estimation, the results are as follow: the impact of minimum wage is positive and increasing along all the wage distribution and its elasticity is higher than 1, meaning that an increase in the minimum wage implies a more than proportional increase in the corresponding worker’s wage; the age coefficients show a concave pattern, which is decreasing along the wage distribution; the gender wage gap is higher at the highest percentiles; the return to tenure is positive and decreasing along the wage distribution and the occupation dummy is positive and increasing, highlighting higher wages for white collar workers; the firm size has only a slightly positive and decreasing impact along the wage distribution.

15
significantly: the coefficients are much reduced in magnitude and slightly decreasing
along the wage distribution, ranging from 1.6% at the 10th percentile to 1.3% at the 90th
percentile.17 For sake of comparison, in column 2 of Table A2 in the Appendix we also
report the standard fixed effect estimation computed at the mean, that provides a
coefficient actually equal to the one computed at the median.
[Table 3 around here]
These results are consistent with previous empirical evidence showing that taking
into account the unobserved worker and firm heterogeneity entails a sharp reduction
in the estimated degree of rent sharing (see Card et al., 2014, Martins, 2009).
Finally, we present the IV estimates to tackle the endogeneity between rents and
wages; in fact, endogeneity can cause serious underestimation of the degree of rent
sharing, which can also be worsened by a fixed effects strategy (Card et al., 2014). The
estimation was carried out simultaneously on three percentiles (10th, 50th, 90th).
Moreover, since it is not possible to test the weakness of the instrument in this
procedure, we carried out a standard IV fixed effects estimation on average wages (see
table A2 in the Appendix), checking the first stage F-statistics. The F-value for the
instrument in the first stage is significant and higher than the threshold value of 10,
confirming that the instrument chosen is not weak.
When endogeneity is taken into account, the results change significantly (Table 4).
In fact, the elasticities of rents with respect to wages are now greater, and the highest
increases are to be seen in the lower tail of the wage distribution. In particular, rents
show a decreasing impact along the wage distribution with elasticities ranging from
7.3% at the 10th percentile to 6.1% at the median and 5.0% at the 90th percentile, which
are significantly different across wage percentiles.18 These estimates are quite
17 Interestingly, the coefficient of minimum wage, which was increasing in the cross section estimates, is now constant along the wage distribution, and it will be generally the case also in the following estimates. This evidence suggests that the increasing trend observed in cross section estimates was actually driven by worker and firm unobserved heterogeneity. 18 We perform equality tests of coefficients across different wage percentiles. In particular, we get a t-test value of 3.39 for the equality of coefficients between the 10th and 50th percentile; a t-test value of 3.15 for the equality of coefficients between the 50th and the 90th percentile, and a t-test value of 5.71 for the one between the 10th and 90th percentile. It is hence possible to reject the equality of coefficients across different percentiles at 99% of significance level.

16
consistent with those of Card et al. (2014), who find an elasticity of (average) wages
with respect to rents of 4.5% for the Veneto region in Italy.
[Table 4 around here]
This evidence suggests that once having controlled for the national centralized level
of bargaining, unobserved heterogeneity and endogeneity, rent sharing in Italy is such
as to favor the low paid workers.
We carry out a set of robustness checks of our preferred quantile IV fixed effect
estimates. First, we carry out the IV estimation using an alternative definition of the
instrument, where we exclude from its computation the sales in provinces belonging to
the same region of the province where the firm is located, in order to avoid possible
spatial correlation between provinces within the same region (Table A3). Second, as
shown in Table A4 in the Appendix, we run the same estimates excluding part-time
workers, in order to check whether our results are affected by the inclusion of part-
time workers (converted into full-time equivalent workers) in the main estimation
sample. Third, we run the same estimates using a different measure for the alternative
wage (Table A5 in the Appendix). In particular, we employ a measure of average
industrial wage carried out by averaging wages within industry-wide national
contracts, separately for blue collars and white collars.19 Last, we perform the same
estimates using a set of firm size dummies (defined on the basis of the deciles of the
firm size distribution) in place of the logarithm of the firm size, to control for stronger
nonlinearities in the relationship between the firm size and wages (Table A6 in the
Appendix). Results of these robustness checks are strongly consistent with the baseline
estimates.20
19 In particular, we have the availability of an average of 35 contracts per year distinguished also by blue collars and white collars, for a total of around 65 contracts per year, since some contracts do not apply for both workers' categories. 20 An additional issue is related to the fact that in our data there is no information about the amount of hours worked, but only about the number of full-time equivalent days/weeks worked during the year. One possible concern is that our results might be affected by differences along the wage distribution in the amount of extra-hours worked. We can only partially deal with this issue. For instance, in the robustness check in which we excluded part-time workers we impose a restriction in the amount of hours worked. In a similar way, the split between blue collar and white collar workers allows controlling for systematic difference between these occupation categories. However, this issue cannot be addressed in a satisfactory way using our administrative data. Hence, we have to stress that at least partially our results might be affected by differences in hours worked along the wage distribution.

17
4.3 Occupation heterogeneity: Blue Collars versus White collars
The literature so far has investigated the heterogeneity of rent sharing across groups of
workers using differences in skills. Since education is not usually available in
administrative data, this issue has been mainly addressed using differences in
occupation levels, i.e. comparing blue collar and white collar workers. Our
administrative data allows implementing the same approach, distinguishing between
blue and white collar workers.
Apart from replicating what already done in the literature, i.e. carrying out our
preferred specification separately for the two groups of workers using standard
regressions at the conditional mean (Table A2), we apply the quantile regressions
approach to the two groups of workers, in order to investigate the heterogeneity in
rent sharing within the two occupational categories for workers located at different
percentiles of the wage distribution. We do believe this represent an additional
contribution to the literature, since it extends the standard sample split by occupation
to a quantile regression approach. This approach is of interest because of the
important differences at work within occupational categories in terms of earnings.21
We apply our preferred specification, controlling for unobserved worker and firm
heterogeneity and for endogeneity, to the samples of blue collar and white collar
workers. Results are reported in Table 5. Interestingly, patterns are rather different for
the two groups of workers. For blue collars, the extent of rent sharing is still decreasing
along the wage distribution, with an elasticity that runs from 3.4% at the 10th percentile
to a not statistically significant elasticity at the 90th percentile. For white collar workers,
the coefficients are higher (around 26%), and basically constant across the distribution.
This is consistent with the findings in other papers, such as Arai and Heyman (2001),
who find higher rent sharing for white collar workers, and Martins (2009) and
Guertzgen (2009) who provide evidence of higher rent sharing for better educated
workers, with the underlying intuition that high skilled workers might have higher
power in the individual bargaining.22 In the next section we will further explore this
issue.
21 This heterogeneity within occupation categories also implies overlapping in terms of wages and skills across workers' categories. In fact, for instance a white collar worker at the 50th percentile of the white collars wage distribution has a lower wage with respect to a blue collar worker located at the 90th percentile of the blue collars wage distribution. 22 Note that in Card et al. (2014) rent sharing is higher for blue collars. This difference is likely due to the fact that they consider only the Veneto region, a region that is highly specialized in the manufacturing sector. Unfortunately, we cannot carry out a check only for the Veneto region, since
18
[Table 5 around here]
4.4 Possible explanation: The role of unions
We have shown that the impact of rent sharing is decreasing along the wage
distribution and that this decreasing pattern is driven by the blue collars dynamics,
while white collars enjoy a higher and stable pattern of rent sharing along the wage
distribution. Two possible explanations for these findings might be at work. The first
one concerns the role of unions that might foster workers’ wages, especially for the
unskilled workers (Card, 1996), while the second one focuses on the role of individual
bargaining. Both explanations could have a different incidence for blue collars and
while collars and also, within the two occupational groups, for different percentiles of
their wage distribution. Unfortunately, we cannot rigorously test these two
explanations, because of data limitations. In fact, our administrative data do not
include a reliable proxy for the role of individual bargaining in the wage setting
process within the firm, i.e. there is not availability of any information about wage
policies at the firm level and on the role of individual bargaining. Similarly, we do not
know whether a given firm is unionized, i.e., if there is a legal entity that is allowed to
bargain with the employer.
Nonetheless, a partial test we can carry out concerns the possibility to use another
source of data to investigate the role of unions.23 In particular, we focus on
manufacturing, since the literature has shown that the unions in this sector can be
assumed to be more organized and with greater power (see for instance Booth, 1995,
Disney, 1990).24 Further, we exploit the information on unionized firms coming from
the dataset "Rilevazione su Imprese e Lavoro -RIL" (Surveys on Firms and workers)
we cannot observe the universe of workers for this region as in Card et al (2014), but only a limited sample size, which is not enough to carry out reliable estimates (in particular considering only one region in our data the instrument turns out to be weak). 23 As for the institutional framework of unions, the Italian law gives the workers the right to join a union, engage in union activity and organize a plant-level union representation structure. The main workplace representation body is the so-called ‘unitary workplace union structures’ (Rappresentanze Sindacali Unitarie, RSU), and an alternative plant-level union body (Rappresentanza Sindacale Aziendale, RSA) can be elected by the members of a particular union. RSUs have tended to replace RSAs over time. Note also that in Italy unions and employees' representations are allowed to negotiate at the plant level over additional issues not tackled by the industry-wide bargaining, such as -apart from wages- performance pay and working conditions. 24 The literature has also focused on the decline in manufacturing as a possible determinant of the fall in union density in the last decades (for the UK , see Disney, 1990).

19
elaborated by ISFOL for the year 2005.25 This dataset allows identifying unionized
firms, i.e. those firms characterized by any form of workers’ representation at the
workplace that is legally entitled to participate in the firm-level bargaining process.
Using this information we compute the share of unionized firms at the region-industry
level in the manufacturing sector (20 regions and 9 sectors within manufacturing),
taking into account firms with at least 15 employees (consistently with INPS-AIDA
data) and region-industry cells with at least 10 firms in order to get reliable values for
the union share variable.26 We then split the sample on the basis of the share of
unionized firms, which can be considered as a proxy of regional-sectoral union power.
More specifically, we derive a dummy equal to one if in a given region-industry cell
the share of unionized firms is greater than the overall median value. We finally adapt
our preferred specification interacting the quasi-rent variable with the union dummy.
An important premise of this analysis is the fact that we consider union as an
exogenous variable. This might not be the case. However, it is well-known that it is
hard to find an exogenous variation in unions, especially in European countries.27
Nonetheless, Breda (2015), focusing on France, argues that, conditional on observable
characteristics, it is not necessarily the case that workplace unionization systematically
targets more profitable/efficient/better firms. This is mainly due to the fact that it is
typically very easy to organize a firm’s workers in a union, since what is needed is only
to find a worker who is willing to act as union representative, or to contact the local
union officials who are always willing to help on how to set up a union in a firm. In
such an institutional environment, Breda (2015) assumes that that estimates are
unlikely to be biased by a selection of the best firms by unions, and hence that the
assignment to treatment can be assumed as ‘quasi-random’. The Italian institutional
framework is very similar to the French one, thus supporting the choice of considering
union as exogenous when applying a similar approach, i.e. using a wide and accurate
set of controls in the empirical analysis.
25 We use RIL in 2005 since it is the first available wave of the survey. Nonetheless, this should not be worrying since unionization is a persistent phenomenon. 26 For this reason, the sample size of our estimates decreases, since not for all region/sector cells it is possible to associate a reliable union variable. As a check, all previous results apply also for this restricted sample. 27 Recent studies by Di Nardo and Lee (2004), Lee and Mas (2012) and Frandsen (2012) use regression discontinuity design (RDD) techniques to identify the ‘causal effect’ of unions by comparing closely run union certification elections for the US case. For most of European countries, however, there are no such natural experiments to exploit, as unions do not generally need to win a majority election to be recognized as bargaining partners.

20
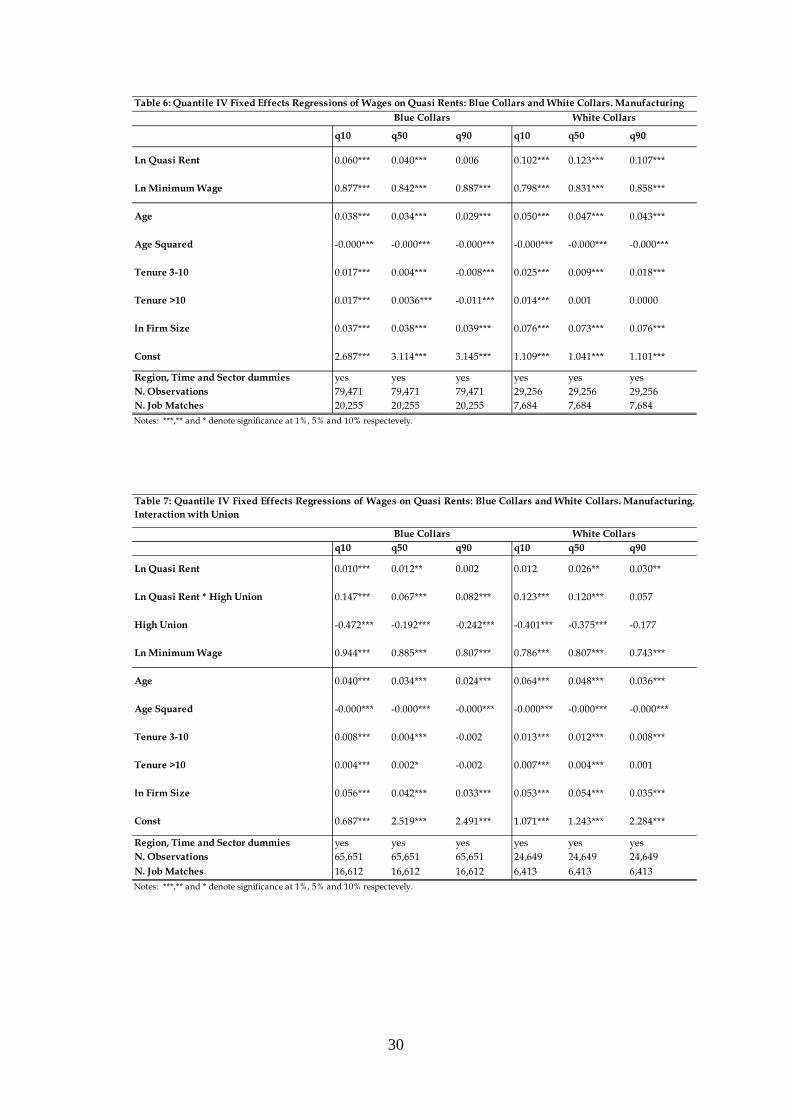
Table 6 reproduces our baseline estimates, i.e., without the interaction with the
union dummy, for blue collars and white collars for the manufacturing sector, which
represents the sector of interest for the analysis of unions, to check whether when
focusing on this sector previous findings change. Results show a similar pattern with
respect to those derived for the whole economy (Table 5). The blue collar coefficients
are, as expected, slightly higher, while the white collar coefficients are significantly
lower, suggesting that rent sharing for white collar workers is higher in the service
sector (consistently with Arai and Heyman, 2001). In particular, elasticities in the
manufacturing sector decrease from 6.0% at the 10th percentile to a non-significant
0.006% at the 90th percentile for blue collars, while they are around 10/12% for white
collars over the whole wage distribution.28
[Table 6 around here]
Table 7 shows the rent-sharing estimations, for blue collars and white collars, with
the introduction of the interaction term between the quasi-rent variable and the union
dummy. As for blue collars, results show that the interaction between quasi-rents and
unions is positive and statistically significant along the whole wage distribution, with a
decreasing pattern that runs from 14.7% at the 10th percentile to 7/8% at the 50th/90th
percentiles. Moreover, the baseline effects of rent sharing are negligible, suggesting
that where union power is low the rent sharing for blue collars almost disappears. As
for white collars, the interaction with the union dummy is positive and significant up
to the 50th percentile (around 12%), while at the 90th percentile the elasticity is lower
and not statistically different from zero. On the other hand, the baseline effects are
positive and increasing along the wage distribution (up to 3% at the 90th percentile)
suggesting that the pattern previously detected for white collar workers might be
explained by two main drivers: unions play a major role at the low and middle part of
the wage distribution, while individual bargaining seems to matter more for the
28 We have also carried out the same estimates for the service sector. Results for blue collars are lower in magnitude, but still decreasing along the wage distribution, while for white collar they are higher in magnitude compared to the estimates for the whole economy. These estimates are available upon request.

21
medium and high skilled workers.29 Of course, this way of reasoning assumes that
once we control for observed and unobserved individual and firm heterogeneity,
national bargaining, endogeneity and the power of local unions, the residual rent
sharing can be interpreted as the impact of individual bargaining.
This evidence confirms the intuition that labor market institutions, and in particular
the unions, contribute, at least in part, to the heterogeneous extent of rent sharing
along the wage distribution, suggesting that unions favor rent sharing for low and
medium skilled workers. The underline intuition of this result that, to the best of our
knowledge, represents an original empirical finding within the rent sharing literature,
is consistent with a robust empirical evidence on the distributional goal of unions,
which mainly take care of the welfare on unskilled workers (Di Nardo et al., 1996;
Card, 1996; Frandsen, 2012).
Nonetheless, we want to point out that the findings of this section have to be taken
with cautious because of the assumption of union exogeneity and the lack of a firm
measure of unionization that forced us to make use of a regional-sectoral measure.
Beyond these drawbacks, we believe the section provides interesting evidence on the
possible explanations behind the baseline results.
[Table 7 around here]
5. Conclusions
The contribution of this paper is to analyze the degree of rent sharing along the wage
distribution. Previous empirical analyses focused only on average wages. In some
cases attention have been paid to average wages of workers’ groups defined using
education and/or occupation categories, which however does not allow taking into
account the substantial heterogeneity within workers' groups. In this paper we address
this issue by using quantile regressions, since percentiles of the wage distribution can
be more closely associated to the productivity of workers in the labor market.
We make use of a unique employer-employee database for Italy, which merges
administrative records for workers (INPS) and balance sheet data for firms (AIDA).
29 Note that the base effect for union is always negative. However, in this case, this coefficient has not a standard interpretation since it refers to the case in which the quasi-rent variable is equal to zero, which is never the case.

22
Our findings show that the rent sharing impact is not uniform along the wage
distribution. In particular, taking into account the first national level of bargaining,
unobserved worker and firm heterogeneity and endogeneity, we find a decreasing
pattern of rent sharing along the wage distribution, with elasticities of wages with
respect to quasi-rents ranging from 7.3% at the 10th percentile to 5.0% at the 90th
percentile of the wage distribution.
In the paper we also integrate the quantile regressions approach with the standard
approach using sample split by occupation categories. More specifically, we apply
quantile regressions for the two groups of blue and white collar workers in order to
capture the heterogeneity within occupation categories that cannot be taken into
account using the traditional sample split analysis at the conditional mean.
Interestingly, we find out that the decreasing pattern of rent sharing previously
detected is driven by the dynamics for blue collar workers, while white collars enjoy a
stable and higher degree of rent sharing along the wage distribution.
One of the possible explanations for these findings refers to the role of the unions,
which in Italy play a crucial role in the bargaining process between employers and
employees. We provide evidence in favor of this possible explanation exploiting the
regional and sectoral variability in the share of unionized firms, which can be
considered as a proxy for union power. We show that where union power is high the
extent of rent sharing for blue collar is still decreasing and mainly driven by unions,
while little is left to individual bargaining. As for white collars, unions play a major
role at the low and middle part of the wage distribution, while individual bargaining
seems to be at work for the high skilled workers.
Nonetheless, these findings on the role of unions have to be taken with cautious
because of the assumption of the exogeneity of unions (Breda, 2015) and the use of an
imperfect proxy of union power. Hence, future research is needed to shed light on the
underlying mechanisms driving our results, by using different and more qualitative
survey data on unions and firms strategies which might allow overcoming the
limitations due to the use of administrative data.

23
References
Abowd, J. and Lemieux, T. (1993). ‘The effects of Product Market Competition on Collective Bargaining Agreements: The case of Foreign Competition in Canada’, Quarterly Journal of Economics, 108: 983-1014.
Arai, M. (2003). ‘Wages, Profits and Capital Intensity: Evidence from Matched Worker-Firm Data’, Journal of Labor Economics, 21: 593-618.
Arai, M. and Heyman, F. (2001). ‘Wages, profits and individual unemployment risk: evidence from matched firm-worker data’, FIEF Working Paper series, 172.
Bartolucci, C., Devicienti, F. and Monzon, I. (2015). ‘Identifying Sorting in Practice’, IZA Discussion Paper, 9411.
Blanchflower, D., Oswald A. and Sanfey, P. (1996). ‘Wages, Profits and Rent Sharing’, Quarterly Journal of Economics, 111: 227-252.
Booth, A. (1995). The Economics of Trade Unions, Cambridge University Press.
Breda, T. (2015). ‘Firms’ rents, workers’ bargaining power and the union wage premium in France’, Economic Journal, 125(589): 1616-1652.
Canay, I. (2011). ‘A Simple Approach to Quantile Regression for Panel Data’, The Econometrics Journal, 14(3): 368-386.
Card, D. (1996). ‘The Effect of Unions on the Structure of Wages: A Longitudinal Analysis’, Econometrica, 64: 957–979.
Card, D., Devicienti, F. and Maida, A. (2010). ‘Rent Sharing, Hold Up and Wages: Evidence from Matched Panel Data’, NBER Working Paper, 16192.
Card, D., Devicienti F. and Maida A. (2014). ‘Rent Sharing, Hold Up and Wages: Evidence from Matched Panel Data’, The Review of Economic Studies, 81(1): 84-111.
Chernozukov, V. and Hansen C., (2008). ‘Instrumental Variable Quantile Regression: A Robust Inference Approach’, Journal of Econometrics, 142: 379-398.
Di Nardo, J., Fortin, N.M. and Lemieux, T. (1996). ‘Labor Market Institutions and the Distribution of Wages, 1973-1992: A Semiparametric Approach’, Econometrica, 64: 1001–1044.
Di Nardo, J. and Lee, D.S. (2004). ‘Economic Impacts of New Unionization on Private Sector Employers: 1984-2001’, Quarterly Journal of Economics, 119(4): 1383-1441.

24
Disney, R. (1990). ‘Explanations of the Decline in Trade Union Density In Britain: an Appraisal’, British Journal of Industrial Relations, 28(2): 165–177.
Frandsen, B. R. (2012). ‘Why Unions Still Matter: The Effects of Unionization on the Distribution of Employee Earnings’, (Manuscript). Cambridge, MA: Massachusetts Institute of Technology.
Galvao, A. (2011). ‘Quantile Regression for Dynamic Panel Data with Fixed Effects’, Journal of Econometrics, 164: 142-157.
Galvao, A. and Montes-Rojas, G. (2010). ‘Penalized Quantile Regression for Dynamic Panel Data’, Journal of Statistical Planning and Inference, 140: 3476-3497.
Guertzgen, N. (2009). ‘Rent-Sharing and Collective Bargaining Coverage – Evidence from Linked Employer-Employee Data’, Scandinavian Journal of Economics, 111(2): 323-349.
Hildreth, A. and Oswald, A. (1997). ‘Rent Sharing and Wages: Evidence from Company and Establishment Panels’, Journal of Labor Economics, 15: 318-337.
Koenker, R. and Bassett, G. (1978). ‘Regression Quantiles’, Econometrica, 46(1): 33-50.
Koenker, R. (2004). ‘Quantile Regression for Longitudinal Data’, Journal of Multivariate Analysis, 91: 74-89.
Krueger, A.B. and Summers, L.H. (1988). ‘Efficiency Wages and the Inter-Industry Wage Structure’, Econometrica, 56(2): 259-293.
Lee, D. and Mas, A. (2012). ‘Long-Runs Impacts of Unions on Firms: New Evidence from Financial Markets, 1961-1999’, The Quarterly Journal of Economics, 127(1): 333-378.
Lemieux, T., MacLeod, B. and Parent, D. (2009). ‘Performance Pay and Wage Inequality’, Quarterly Journal of Economics, 124(1): 1-49.
Lester, R.A. (1952). ‘A Range Theory of Wage Differentials’, Industrial and Labor Relations Review, 5: 483-500.
Margolis, D. and Salvanes, K. (2001). ‘Do Firms Really Share Rents with Their Workers?’, IZA Discussion Paper, 330.
Martins, P.S. (2007). ‘Rent Sharing and Wages’, Reflets et Perspectives de la Vie Economique, 46(2): 23-31.
Martins, P.S. (2009). ‘Rent Sharing Before and After the Wage Bill’, Applied Economics, 41(17): 2133-2151.

25
Matano, A. and Naticchioni, P. (2012). ‘Wage Distribution and the Spatial Sorting of Workers’, Journal of Economic Geography, 12(2): 379-408.
Matano, A. and Naticchioni, P. (2013). ‘Rent Sharing as a Driver of the Glass Ceiling Effect’, Economic Letters, 118(1): 55-59.
Nickell, S.J. (1981). ‘Biases in Dynamic Models with Fixed Effects’, Econometrica, 49: 1417-1426.
Rusinek, M. and Rycx, F. (2013). ‘Rent-Sharing under Different Bargaining Regimes: Evidence from Linked Employer-Employee Data’, British Journal of Industrial Relations, 51(1): 28-58.
Shapiro, C. and Stiglitz, J. (1984). ‘Equilibrium Unemployment as a Worker Discipline Device’, American Economic Review, 74: 433-444.
Van Reenen, J. (1996). ‘The Creation and Capture of Rents: Wages and Innovation in a Panel of U.K. Companies’, Quarterly Journal of Economics, 111: 195-226.

26
Tables
Table 1: Descriptive Statistics of the Variables of the Analysis
Variable Mean Std. Dev. Min MaxLog Real Weekly Wage 5.99 0.30 4.96 7.04
Log Real Weekly Minimum Wage 5.69 0.11 4.96 6.77Female 0.32 0.46 0.00 1.00Age 36.79 9.74 15 70Age Squared 1,448.28 755.97 225 4,900Blue Collars 0.65 0.48 0 1White Collars and Manager 0.35 0.48 0 1Log Firm Size 4.62 1.25 2.708 9.01Log Quasi-Rent per Employee 3.01 0.76 -7.56 5.07Log Real Sales per Employee other provinces (instrument) 5.24 0.52 2.17 7.64Tenure 1-2 0.31 0.46 0 1Tenure 3-10 0.51 0.50 0 1Tenure >10 0.19 0.39 0 1North East 0.31 0.46 0 1North West 0.43 0.49 0 1Centre 0.16 0.36 0 1South 0.09 0.28 0 1Island 0.03 0.16 0 1By Percentiles 10th 50th 90thLog Real Weekly Wage 5.66 5.94 6.39Log Real Weekly Minimum Wage 5.56 5.66 5.84
Number of Observations 157,600Number of Workers 38,810Number of Job Matches 41,965Source: Panel ISFOL on INPS-AIDA data.

27
q10 q25 q50 q75 q90
Region, Time and Sector dummies
yes yes yes yes yes
N. Observations 157,600 157,600 157,600 157,600 157,600
N. Job Matches 41,965 41,965 41,965 41,965 41,965
Table 2: Cross Sectional Quantile Regressions of Wages on Quasi Rents
Ln Quasi Rent 0.054*** 0.051*** 0.050*** 0.046*** 0.043***
Ln Minimum Wage 1.465*** 1.555*** 1.663*** 1.761*** 1.791***
Age 0.010*** 0.009*** 0.009*** 0.008*** 0.008***
Gender Dummy -0.070*** -0.071*** -0.090*** -0.119*** -0.155***
Tenure 3-10 0.038*** 0.029*** 0.020*** 0.012*** 0.008***
Age Squared -0.000*** -0.000*** -0.000*** -0.000*** -0.000***
White Collar Dummy 0.040*** 0.040*** 0.053*** 0.073*** 0.104***
Tenure >10 0.071*** 0.053*** 0.036*** 0.025*** 0.018***
Notes: ***,** and * denote significance at 1%, 5% and 10% respectevely.
Const -3.129*** -3.557*** -4.123*** -4.607*** -4.384***
ln Firm Size 0.019*** 0.019*** 0.017*** 0.014*** 0.009**

28
q10 q25 q50 q75 q90
Region, Time and Sector dummies
yes yes yes yes yes
N. Observations 157,600 157,600 157,600 157,600 157,600
N. Job Matches 41,965 41,965 41,965 41,965 41,965
Table 3: Quantile Fixed Effects Regressions of Wages on Quasi Rents
Ln Quasi Rent 0.016*** 0.013*** 0.013*** 0.013*** 0.013***
Ln Minimum Wage 0.849*** 0.835*** 0.837*** 0.840*** 0.837***
Age Squared -0.000*** -0.000*** -0.000*** -0.000*** -0.000***
Age 0.033*** 0.030*** 0.028*** 0.026*** 0.023***
Tenure >10 0.014*** 0.006*** 0.000 -0.004*** -0.009***
Tenure 3-10 0.020*** 0.013*** 0.007*** 0.003*** 0.001
ln Firm Size 0.031*** 0.030*** 0.030*** 0.029*** 0.029***
White Collar Dummy 0.035*** 0.038*** 0.037*** 0.037*** 0.044***
Notes: ***,** and * denote significance at 1%, 5% and 10% respectevely.
Const 0.071** 0.275*** 0.345*** 0.399*** 0.517***

29
q10 q50 q90
Region, Time and Sector dummies yes yes yesN. Observations 157,600 157,600 157,600
N. Job Matches 41,965 41,965 41,965
Table 4: Quantile IV Fixed Effects Regressions of Wages on Quasi Rents.
Ln Quasi Rent 0.073*** 0.061*** 0.050***
Ln Minimum Wage 0.849*** 0.840*** 0.862***
Age 0.039*** 0.036*** 0.030***
Age Squared -0.000*** -0.000*** -0.000***
Tenure 3-10 0.025*** 0.007*** -0.001
Tenure >10 0.019*** 0.003*** -0.010***
White Collar Dummy 0.029*** 0.030*** 0.038***
Const 3.100*** 3.329*** 3.393***
Notes: ***,** and * denote significance at 1%, 5% and 10% respectevely.
ln Firm Size 0.051*** 0.051*** 0.051***
q10 q50 q90 q10 q50 q90
Region, Time and Sector dummies yes yes yes yes yes yesN. Observations 102,076 102,076 102,076 54,812 54,812 54,812N. Job Matches 27,121 27,121 27,121 15,058 15,058 15,058
Table 5: Quantile IV Fixed Effects Regressions of Wages on Quasi Rents: Blue Collars and White CollarsBlue Collars White Collars
Ln Quasi Rent 0.034*** 0.012*** 0.001 0.266*** 0.264*** 0.275***
Ln Minimum Wage 0.737*** 0.716*** 0.741*** 0.944*** 0.984*** 1.023***
Age 0.043*** 0.038*** 0.033*** 0.032*** 0.030*** 0.026***
-0.000***
Tenure 3-10 0.020*** 0.005*** -0.005** 0.027*** 0.011*** 0.015***
Age Squared -0.000*** -0.000*** -0.000*** -0.000*** -0.000***
Tenure >10 0.015*** 0.003** -0.010*** 0.014*** 0.004* -0.001
ln Firm Size 0.029*** 0.029*** 0.029*** 0.134*** 0.130*** 0.131***
3.146*** 3.055***
Notes: ***,** and * denote significance at 1%, 5% and 10% respectevely.
Const 3.351*** 3.705*** 3.778*** 3.156***
30
q10 q50 q90 q10 q50 q90
Region, Time and Sector dummies yes yes yes yes yes yesN. Observations 79,471 79,471 79,471 29,256 29,256 29,256N. Job Matches 20,255 20,255 20,255 7,684 7,684 7,684
Table 6: Quantile IV Fixed Effects Regressions of Wages on Quasi Rents: Blue Collars and White Collars. ManufacturingBlue Collars White Collars
0.107***
Ln Minimum Wage 0.877*** 0.842*** 0.887*** 0.798*** 0.831*** 0.858***
Ln Quasi Rent 0.060*** 0.040*** 0.006 0.102*** 0.123***
Age 0.038*** 0.034*** 0.029*** 0.050*** 0.047*** 0.043***
Age Squared -0.000*** -0.000*** -0.000*** -0.000*** -0.000*** -0.000***
0.018***
0.001 0.0000
0.009***
0.073*** 0.076***
Tenure >10 0.017*** 0.0036*** -0.011*** 0.014***
Tenure 3-10 0.017*** 0.004*** -0.008*** 0.025***
ln Firm Size 0.037*** 0.038*** 0.039*** 0.076***
Const 2.687*** 3.114*** 3.145*** 1.109*** 1.041*** 1.101***
Notes: ***,** and * denote significance at 1%, 5% and 10% respectevely.
q10 q50 q90 q10 q50 q90
Region, Time and Sector dummies yes yes yes yes yes yesN. Observations 65,651 65,651 65,651 24,649 24,649 24,649N. Job Matches 16,612 16,612 16,612 6,413 6,413 6,413
Ln Quasi Rent 0.010*** 0.012** 0.002 0.012 0.026**
Table 7: Quantile IV Fixed Effects Regressions of Wages on Quasi Rents: Blue Collars and White Collars. Manufacturing.Interaction with Union
Blue Collars White Collars
0.030**
High Union -0.472*** -0.192*** -0.242*** -0.401*** -0.375*** -0.177
Ln Quasi Rent * High Union 0.147*** 0.067*** 0.082*** 0.123*** 0.120*** 0.057
Ln Minimum Wage 0.944*** 0.885*** 0.807*** 0.786*** 0.807*** 0.743***
0.036***
Age Squared -0.000*** -0.000*** -0.000*** -0.000*** -0.000*** -0.000***
Age 0.040*** 0.034*** 0.024*** 0.064*** 0.048***
Tenure 3-10 0.008*** 0.004*** -0.002 0.013*** 0.012*** 0.008***
Tenure >10 0.004*** 0.002* -0.002 0.007*** 0.004*** 0.001
Notes: ***,** and * denote significance at 1%, 5% and 10% respectevely.
0.035***
Const 0.687*** 2.519*** 2.491*** 1.071*** 1.243*** 2.284***
ln Firm Size 0.056*** 0.042*** 0.033*** 0.053*** 0.054***

31
Appendix
Table A1: Characteristics of the match between AIDA-INPS (1996-2003)Universe of Job-
Year Observations (1)
Matched Job-Year
Observations (2)
Panel Estimation
Sample (3)
Subset with Minimum
Wage (4)
Subset with at least a spell of
two years (5)
Number of Workers 196,485 121,709 75,804 58,793 38,810Real Weekly Wage 397.18 423.17 405.88 410.90 416.62Real Weekly Minimum Wage 288.04 295.88 295.06 295.06 296.57
missings (270,805) missings (123,466) missings (61,771)Age 36.51 36.877 36.59 36.339 36.79Females 0.37 0.34 0.33 0.32 0.32White Collars 0.37 0.38 0.34 0.35 0.35Number of Firms 178,584 64,677 39,772 31,631 22,145Firm Size (INPS) 68 124 99 99 100Firm Size (AIDA) 155 101 101 101Quasi Rent per Employee (1000s euro) 38.97 25.12 25.78 25.62Quasi Rent per Employee (1000s euro) Median 19.53 21.20 21.79 21.72Real Sales per Employee (1000s euro) 297.48 210.75 223.55 226.44Number of Records 963,763 483,867 249,376 187,605 157,600Number of Job Matches 92,612 70,199 41,965Mean Duration of Job Spell (years) 4.7 4.4 4.2 4.1 4.7The Universe of Job-Year Observations refers to the original INPS panel database, with workers aged between 15 and 64, employed in standard labourcontracts (blue collars and white collars) and working in the industry and service sectors. The Matched Job-Year observations refer to the fraction of theINPS panel database which has been merged with the AIDA database (with no any outlier and missing cleaning). The Panel Estimation Sample has beencostructed by dropping from the INPS-AIDA matched database the outliers in the firm size (observations for which the difference in absolute value betweenthe firm size reported in AIDA and the firm size reported in INPS was higher than 100) and missing observations for the variables of interest. Further, the"construction" and "mining" sectors were excluded as well as firms with less than 15 employees. Finally, extreme observations below (above) the 1st (99th)percentile of wages, profits per employee and total personnel costs variables were dropped from the sample. The Subset with Minimum Wage referes to thefraction of the Panel Estimation Sample for which there is the availability of the minimum wage. The subset with at least a spell of two years, considers thefraction of the sample with at least two observations per job spell.

32
Cross Section Fixed Effects IV-Fixed Effects IV-Fixed Effects IV-Fixed EffectsAll Blue Collars White Collars
Region, Time and Sector dummies yes yes yes yes yes
N. Observations 157,600 157,600 157,600 102,076 54,812N. Job Matches 41,965 41,965 41,965 27,121 15,058F Instrument IV First Stage 90.70 104.21 12.89
Table A2: OLS Regressions of Average Wages on Quasi Rents.
Ln Quasi Rent 0.050*** 0.013*** 0.072*** 0.012 0.259***
Female Dummy -0.106***
Ln Minimum Wage 1.623*** 0.841*** 0.884*** 0.702*** 0.994***
Age Squared -0.000*** -0.000*** -0.000*** -0.000***
Age 0.010*** 0.028*** 0.026*** 0.022*** 0.036***
-0.000***
0.018***
0.010**Tenure >10 0.042*** 0.002 0.002 0.0000
Tenure 3-10 0.024*** 0.010*** 0.009*** 0.006***
ln Firm Size 0.015** 0.030*** 0.052*** 0.023***
White Collar Dummy 0.071*** 0.038*** 0.037*** - -
0.126***
Notes: ***,** and * denote significance at 1%, 5% and 10% respectevely.
Const -3.720*** 0.254**

33
q10 q50 q90
Region, Time and Sector dummies yes yes yes
N. Observations 157,600 157,600 157,600
N. Job Matches 41,965 41,965 41,965
Ln Minimum Wage 0.844*** 0.836*** 0.859***
Table A3: Quantile IV Fixed Effects Regressions of Wages on Quasi Rents. Instrument computed excluding Provinces within the Same Region.
Ln Quasi Rent 0.066*** 0.057*** 0.046***
Age 0.039*** 0.036*** 0.030***
Age Squared -0.000*** -0.000*** -0.000***
Tenure 3-10 0.025*** 0.007*** -0.001
Tenure >10 0.019*** 0.002** -0.010***
White Collar Dummy 0.029*** 0.030*** 0.038***
ln Firm Size 0.049*** 0.049*** 0.049***
Const 2.976*** 3.203*** 3.269***
Notes: ***,** and * denote significance at 1%, 5% and 10% respectevely.

34
q10 q50 q90
Region, Time and Sector dummies yes yes yesN. Observations 147,936 147,936 147,936N. Job Matches 39,240 39,240 39,240
Table A4: Quantile IV Fixed Effects Regressions of Wages on Quasi Rents. No Part-Time
Ln Quasi Rent 0.065*** 0.054*** 0.047***
Ln Minimum Wage 0.840*** 0.844*** 0.884***
Age 0.039*** 0.036*** 0.030***
Age Squared -0.000*** -0.000*** -0.000***
Tenure 3-10 0.026*** 0.007*** -0.002*
Tenure >10 0.020*** 0.003*** -0.010***
White Collar Dummy 0.031*** 0.031*** 0.037***
ln Firm Size 0.049*** 0.048*** 0.048***
Notes: ***,** and * denote significance at 1%, 5% and 10% respectevely.
Const 5.828*** 5.990*** 5.948***
q10 q50 q90
Region, Time and Sector dummies yes yes yesN. Observations 157,149 157,149 157,149N. Job Matches 41,835 41,835 41,835
Table A5: Quantile IV Fixed Effects Regressions of Wages on Quasi Rents. Alternative Wage: Average Industrial Wage.
Ln Quasi Rent 0.084*** 0.074*** 0.068***
Ln Average Industrial Wage 0.339*** 0.309*** 0.338***
Age 0.056*** 0.052*** 0.047***
Age Squared -0.000*** -0.000*** -0.000***
Tenure 3-10 0.030*** 0.009*** 0.004***
Tenure >10 0.019*** 0.002* -0.008***
White Collar Dummy -0.039*** -0.030*** -0.025***
ln Firm Size 0.062*** 0.061*** 0.062***
Notes: ***,** and * denote significance at 1%, 5% and 10% respectevely.
Const 9.373*** 9.773*** 9.773***

35
q10 q50 q90
Region, Time and Sector dummies yes yes yesFirm Size Dummies yes yes yesN. Observations 157,600 157,600 157,600N. Job Matches 41,935 41,935 41,935
Table A6: Quantile IV Fixed Effects Regressions of Wages on Quasi Rents. Firm Size Dummies (Deciles)
Ln Quasi Rent 0.058*** 0.043*** 0.039***
Ln Minimum Wage 0.835*** 0.831*** 0.855***
Age 0.041*** 0.038*** 0.032***
Age Squared -0.000*** -0.000*** -0.000***
Tenure 3-10 0.026*** 0.006*** -0.001
Tenure >10 0.020*** 0.003*** -0.008***
White Collar Dummy 0.031*** 0.031*** 0.039***
Notes: ***,** and * denote significance at 1%, 5% and 10% respectevely.
Const 5.789*** 6.017*** 6.056***