diversity of morinda citrifolia l. in andaman and nicobar
TRANSCRIPT
African Journal of Biotechnology Vol. 11(86), pp. 15214-15225, 25 October, 2012 Available online at http://www.academicjournals.org/AJB DOI: 10.5897/AJB12.696 ISSN 1684-5315 ©2012 Academic Journals
Full Length Research Paper
Diversity of Morinda citrifolia L. in Andaman and Nicobar Islands (India) assessed through
morphological and DNA markers
Singh, D. R.*, Shrawan Singh, Darick Minj, Anbananthan, V., Salim, K. M., Chaya Kumari and Antia Varghese
Division of Horticulture and Forestry, Central Agricultural Research Institute, Port Blair, Andaman and Nicobar Islands,
India.
Accepted 16 April, 2012
Morinda citrifolia L. is an important plant species for traditional medicine systems which also has immense scope in pharmaceutical industry. The aim of this study was to assess the genetic diversity of the 33 accessions using morphological traits and molecular markers. The accessions showed great variation among morphological parameters. The germplasm showed great variation for fruit weight which ranged from 60 to 125 g. JGH-5, GAH-2, HD-6, CHLD-17 and HBAY-11A from Andaman Islands were found to be big fruited while TRA-1 and TRA-2 from Nicobar Islands were found as small fruited accessions, suggesting difference in collections from Andaman Islands and Nicobar Islands. The extent of diversity in accessions was also supported by polymerase chain reaction (PCR) analysis using random amplified polymorphic DNA (RAPD) and inter-simple sequence repeats (ISSR) markers which grouped M. citrifolia collections into two major clusters with 74% similarity. The study revealed variation in M. citrifolia populations from two different geographical isolated islands and identified promising accessions for agronomical parameters for breeding and industrial use. Key words: Morinda citrifolia L., DNA markers, morphological markers, genetic diversity, Andaman and Nicobar Islands.
INTRODUCTION Noni (Morinda citrifolia L.; family Rubiaceae), a highly potential plant species originates from Andaman and Nicobar Islands (Singh et al., 2011). It has been used as source of medicine in many of the traditional health management systems of Ayurveda, Nicobar, China, Polynesia and Australia to treat various ailments for over 2000 years. It is emerging as one of rare plant source with manifold health benefits. M. citrifolia originates from Andaman and Nicobar Islands, and Indonesia. Scientific investigations revealed a number of biological activities of fruit extracts such as anti-angiogenesis, antioxidant, cyclooxygenases-1 and -2 inhibition and tyrosine kinase inhibition. The fruit juice is used as a traditional medicine for curing arthritis, diabetes, high blood pressure, muscle
*Corresponding author. E-mail: [email protected].
aches, menstrual difficulties, headaches, heart disease, immunodeficiency, cancer, gastric ulcers, sprain, mental depression, senility, poor digestion, atherosclerosis, blood vessel problems and drug addiction (Bushnell et al., 1950; Wang et al., 2002). It exhibits antibacterial, antiviral, antifungal, antitumor, antihelminthic, analgesic, hypotensive, anti-inflammatory and immune enhancing effects (Liu et al., 2001; McClatchey, 2002). The noni juice works to rejuvenate the entire cellular system of the human body. It contains certain bioactive principles which have multidimensional health benefits. Due to increased awareness and scientific breakthrough, noni products have benefited millions of consumers in more than 50 countries. Noni fruits are being consumed as ‘food for stressful situations’ particularly in primitive tribes of Andaman and Nicobar Islands, and Polynesians. Additionally, the roots were used to produce a yellow or red dye for tapa cloths and mats, while the fruit are eaten
for health and food reasons (Singh et al., 2011). The leaf and fruits extracts also showed anti-mosquito, snail repellent, and insecticidal properties. The roots, stems, bark, leaves, flowers, and fruits of the noni all are involved in various combinations in almost 40 known and recorded herbal remedies. Contingent Andaman and Nicobar islands is the largest archipelago of about 572 islands in Bay of Bengal situated between 14 to 16°N and 92 to 94°E. The climate of the Islands is humid tropics with annual rainfall around 3180 mm; mean temperature ranges between 22 and 30°C and relative humidity varies between 70 to 90%. Maritime climate, geographical speciation and intensive stresses in islands compel plant species for adaptive changes (Abraham et al., 2008). The islands are well versed with rich diversity of floral and faunal species and acclaimed as one of the hot spot of biodiversity. Floral composition of Andaman Islands is closer to North East India while plant species of Nicobar Islands shows more resemblance to the Indonesian region. Thus, understanding of M. citrifolia diversity seems to be necessary to highlight its regional distribution and flow pattern of population in the region. Morphological and adaptive variations are commonly observed in M. citrifolia across the Islands. Singh et al. (2011) also observed species diversity using limited number of RAPD markers but there is need to generate systematic information on the extent of diversity in M. citrifolia using different marker systems.
Morphological characters are mainly used as deter-minants of the agronomic value and taxonomic classification of plants. M. citrifolia is a small semi-spreading evergreen tree or shrub with a medium flora that grows about 3 to 10 m height at maturity stage (Nelson, 2001). Three botanical varieties of M. citrifolia have been identified as var. citrifolia, var. bracteata and var. potteri. These botanical varieties are distinguished based on various morphological parameters (Waki et al., 2008a) which distinguished them only to a limited extent. More than 150 species have been reported in genus Morinda which are distributed throughout tropical region including South East Asia (primarily Andaman and Nicobar Islands and Indonesia), Papua New Guinea, northern Australia and Polynesian Islands (Rethinam and Sivaraman, 2007). McClatchey (2002) postulated that intra-species variations in M. citrifolia may be due to varietal level variation or it is constituted from two or more species which usually does not interbreed. However, Waki et al. (2008b) pointed out five variants of M. citrifolia which are given as M. citrifolia var. citrifolia, var. potteri, var. sativa, typical and var. bracteata. In Andaman and Nicobar Islands, M. citrifolia is an abundant specie in Morinda group. M. citrifolia is the most commercially exploited species for medicinal purposes. Andaman and Nicobar Islands have rich diversity of M. citrifolia where it grows naturally on shoreline, disturbed lands, undulated terrains, sea water affected soil, rocky soil and acidic soil (Singh et al., 2011). Topographic variations and exposure
Singh et al. 15215 to different levels of stresses created variation in M. citrifolia. Evaluation of morphological traits is direct, cost effective and easy to observe but they are limited in number, depends on environment and plant age factors (Lombard et al., 2001).
Recent advances in molecular markers such as restriction fragment length polymorphism (RFLP), random amplified polymorphic DNA (RAPD), simple sequence repeats (SSR), inter-simple sequence repeats (ISSR), and amplified fragment length polymorphism (AFLP) have been widely used to analyze genetic diversity, genetic relationship and germplasm management (Karp et al., 1996; Lu et al., 1996; McGregor et al., 2000). Molecular markers are superior to morphological traits and particularly, RAPD and ISSR markers are cheap, simple, cost effective, abundant in genome, independent of stage, environment and requirement for DNA sequence information of a specie (Williams et al., 1990; Zietkiewicz et al., 1994; Ramanatha and Hodgkin, 2002). The selection of an appropriate molecular marker system depends on many considerations, with no single approach optimal for studying intraspecific variation (Spooner et al., 2005). Polymerase chain reaction (PCR) based markers are most commonly used to measure the genetic diversity at DNA level in the crop species. Among the various molecular marker systems, RAPD (Williams et al., 1990) and ISSR (Zietkiewicz et al., 1994) have been commonly used to investigate the extent of genetic diversity in crop plants (Esselman et al., 1999; Rossetto et al., 1999).
RAPD and ISSR markers can also provide simple and reproducible fingerprint of germplasm by using single arbitrary chosen primers. Singh et al. (2011) demonstrated the extent of genetic variation in M. citrifolia, Morinda tinctoria and Morinda pubescens using DNA markers. Therefore, this study was undertaken to investigate the extent of morphological and molecular diversity in M. citrifolia germplasm for breeding and establishing appropriate strategies of noni germplasm. MATERIALS AND METHODS
Collection and conservation of germplasm
The 33 accessions of M. citrifolia were collected from South Andaman, North and Middle Andaman and Nicobar districts of Andaman and Nicobar Islands (Table 1) and conserved in Germplasm Block at Central Agricultural Research Institute, Port Blair, India. Morphological parameters
31 morphological descriptors including plant habit, plant height, plant shape, crown diameter, leaf length, leaf width, leaf petiole length, flowers colour, number of flowers per plant, fruit weight, fruit width, fruit height, fruit colour, seed length, seed width, seed colour,
number of seeds per fruit, and total seed weight parameters were observed from three years grown up plants of 33 accessions of M.

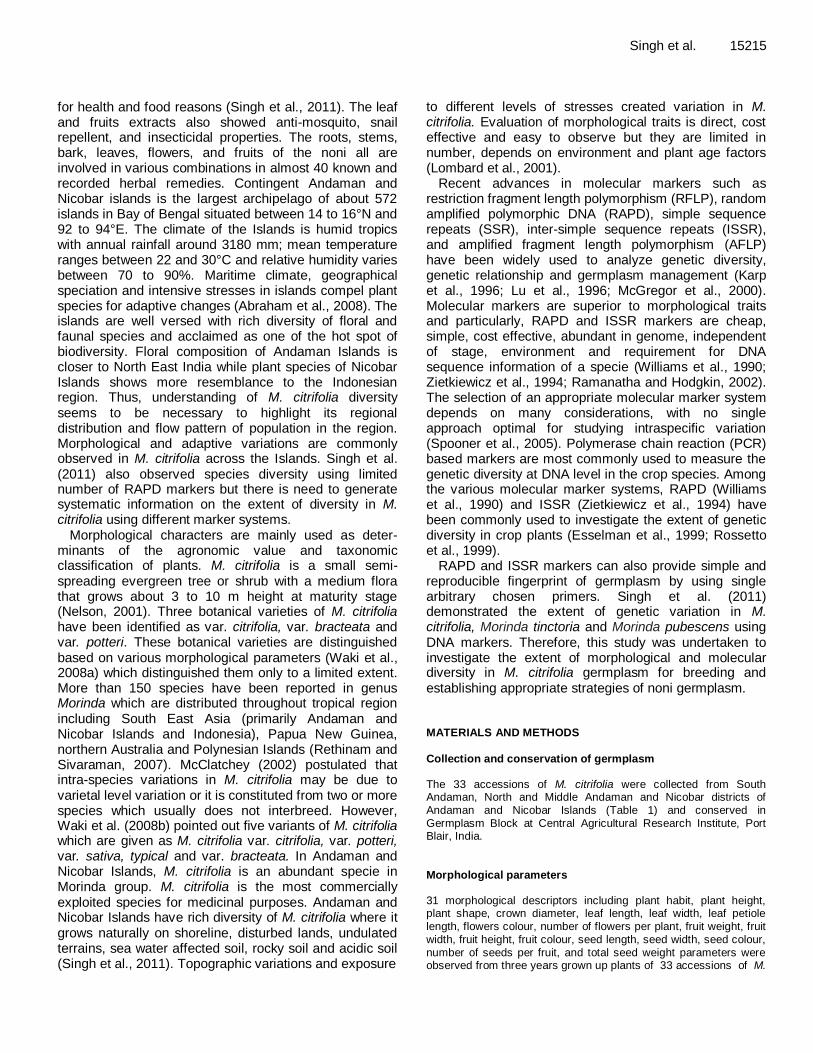
15216 Afr. J. Biotechnol. Table 1. Collection sites and morphological diversity (qualitative traits) of M. citrifolia L. germplasm.
Accessio
n
Collection site
Geographical location
Plant shape
Young
shoot pigmentation
Petiole colour
Young
shoot colour
Lamina colour
Leaf glossiness
Leaf apex shape
Lateral
veins/
leaf
Style Fruit colour
Mature
fruit texture
Fruit shape
Fruit
bunching
Fruit
branching
Fruit
base shape
Seed
colour
1 2 3 4 5 6 7 8 9 10 11 12 13 14 15 16 17 18
ABF-1 Bambooflat-1 11° 39’ 28.7” N, 92° 43’ 30.8”E
EC NP G G LG G Acuminate 6 to 8 Short YG Smooth OE - - C B
ABF-2 Bambooflat-2 11° 42’30.43” N,
92° 43’ 32.89” E Oval NP LG G LG SG Acuminate 7 to 8 Long YG Smooth OE - - C B
ABH-1 Bahai House 11° 40’ 13.17” N, 92° 43’ 56.05” E
Conical NP LG G DG G Acute 6 to 8 Long WG Rough OE - - C DB
AHD-1 Haddo
11° 40’ 57.31”
N, 92° 43’ 21.29” E
Bushy RP LG LG G G Acute 6 to 8 Long G Smooth OW + - C LB
BRJ-19 Brijgunj 11° 37’28.22” N,
92° 43 ’42.07” E Bushy NP LG G WG G Acuminate 6 to 8 Short WG Smooth OW - - C B
CAL-10 Calicut 11°36’57.62” N, 92° 42’’23.62” E
Oval NP LG G LG G Acuminate 7 to 8 Long YG Rough R - + C B
CHLD-17 Chouldari 11° 38’ 4.5” N,
92° 40’ 4.9” E Oval NP LG G G G Acute 6 to 8 Long YG Rough OE - - C B
CHTAP-13
Chidiyatapu 11° 30’ 20.7” N, 92° 42’ 03.7” E
Bushy NP WG G G SG Acute 6 to 8 Long WG Smooth R - + C LB
FF-8 Memeo 11°35’ 51.4” N,
92° 37’ 56.7”E Bushy NP WG LG LG G Acute 8 to 9 Long WG Smooth R - - T B
FRG-14 Ferrargunj 11° 43’ 22.6” N,
92° 39’ 15.8”E Oval NP WG G DG SG Acute 9 to 8 Long WG Rough OE - - SD B
GAH-1 Garacharma 11° 37’03.9” N,
92° 42’ 30.1” E
Pyrami
dal NP LG G G G Acute 6 to 8 Long WG Rough OE - - C B
GAH-2 Garacharma 11° 37’03.9” N,
92° 42’ 30.1” E Bushy NP LG G G G Acute 6 to 8 Short WG Smooth OE - - C B
HBAY-11 Hutbay-11 10° 36’17.76” N,
92°32’ 03.43” E Conical NP WG G G G Acute 7 to 8 Long YG Smooth OE - - C LB
Singh et al. 15217 Table 1. Contd
HBAY-11A Hutbay-11a 10° 36’39.29” N, 92°31’ 51.99” E
Conical NP WG LG WG G Acute 7 to 8 Long WG Smooth OW - - C B
HD-6 Haddo-6 11° 40’ 57.31”N,
92° 43’ 21.29”E Conical NP LG LG G G Acute 8 to 9 Long WG Rough OW + - SD B
HD-6A Haddo-6a 11° 40’ 57.31”N, 92° 43’ 21.29”E
Conical RP LG LG DG G Acute 6 to 8 Long YG Smooth OE + - T B
JGH-1 Junglighat 11° 39’45.40” N,
92° 43’ 49.25” E EC NP LG LG DG SG Acuminate 6 to 8 Long YG Rough OW - + T B
JGH-5 Junglighat 11° 39’40.30” N,
92° 44’ 07.65” E Bushy NP G G DG G Acute 8 to 9 Long YG Smooth OE - - C B
LH-1 Light House 11° 42’27.91” N,
92° 45’ 18.30” E Bushy NP WG LG G G Acute 6 to8 Long YG Smooth OW - - T B
LH-12 Light House 11°42’31.47” N, 92° 45’ 08.21” E
Bushy NP WG LG G G Acute 9 to 8 Long WG Smooth OE + - C LB
MANJ-1 Manjery-1 11° 39’20.25” N,
92° 42’ 00.10” E Oval NP LG LG LG SG Acute 6 to 7 Long YG Smooth R - - T B
MANJ-9 Manjeri-9 11° 39’30.91” N, 92° 42’ 02.31” E
Oval NP WG LG G G Acute 6 to 8 Short WG Smooth R - - C B
MBAY-16 Minniebay-
16
11° 36’ 0.9” N,
92° 45’ 01.9”E Oval NP LG G G G Acute 6 to 8 Short WG Rough R - - C LB
MEM-1 Memio-1 11° 35’ 51.4” N,
92° 37’ 56.7” E
Pyramid
al NP LG G LG SG Acuminate 6 to 8 Long YG Smooth OW - - C B
MEM-2 Memio-2 11° 35’ 51.4” N, 92° 37’ 56.7” E
EC NP LG LG G SG Acuminate 7 to 8 Long YG Smooth OE - - T B
MEM-3 Memio-3 11° 35’ 51.4” N,
92° 37’ 56.7” E Bushy NP G G LG G Acuminate 6 to 8 Short WG Rough OW + - SD DB
MHP-19 Mohanpura 11° 40’ 06.07” N, 92° 44’ 16.03”E
Bushy NP LG G DG SG Acute 6 to 7 Long WG Smooth OW - - C LB
NESAH-15 Nayasahar 11° 38’59.61” N,
92° 44’ 30.46” E Bushy RP LG G G G Acute 6 to 9 Long WG Rough R - - C LB
15218 Afr. J. Biotechnol.
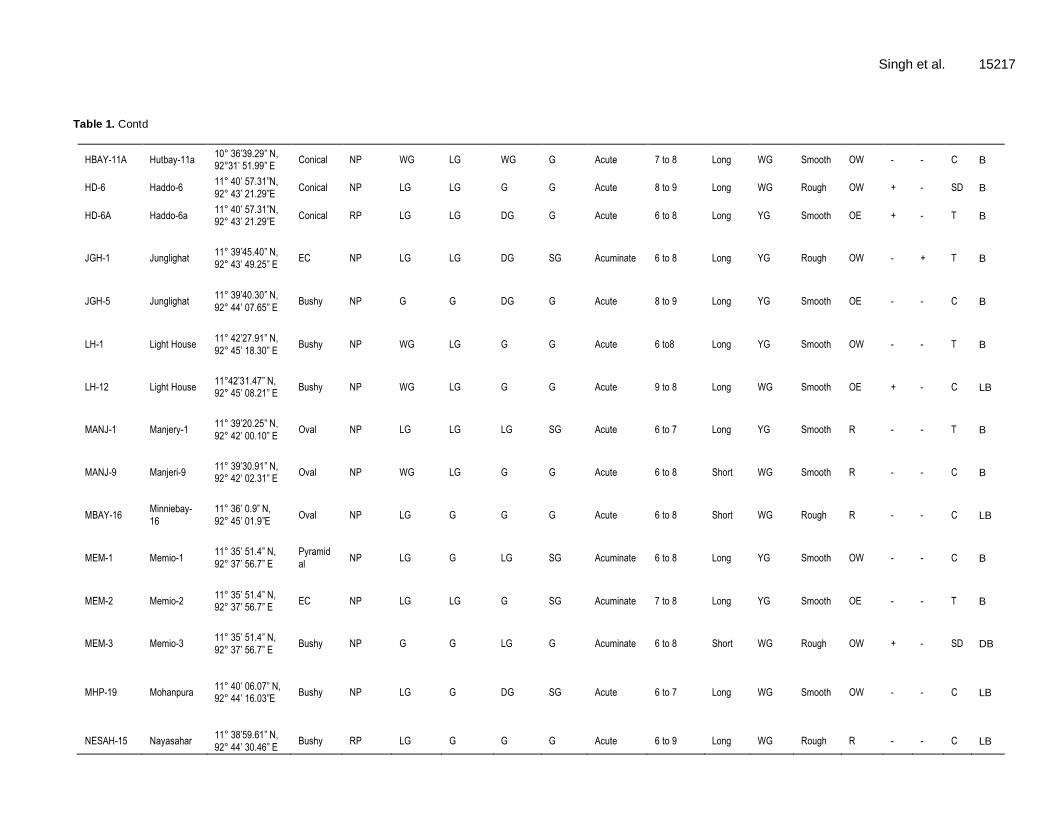
Table 1. Contd
PBAY-7 Phoenix Bay 11° 40’ 06.07 ”N, 92° 44’ 16.03” E
Bushy NP LG LG DG SG Acute 6 to 7 Long YG Smooth OE + - C B
SPG-2 Sippighat-2 11° 36’ 42.8” N, 92°
40’ 47.1” E Bushy NP LG LG G G Acute 6 to 8 Long YG Rough OE - - C B
TRA-1 Hutbay 11° 37’03.9” N, 92° 42’ 30.1” E
Bushy NP WG G DG G Acuminate 6 to 8 Long YG Smooth OW + - C B
TRA-2 Nicobar 11° 37’03.9” N, 92° 42’ 30.1” E
Bushy NP G LG DG SG Acute 6 to 8 Long WG Smooth OW + - C B
WAND-4 Wandoor-4 11° 35’ 37.9” N, 92° 36’ 37.9” E
Bushy NP G LG G SG Acuminate 6 to 8 Short YG Smooth R - - C B
EC, Elongated conical; NP, no pigmentation; RP, red pigmentation; LG, light green; G, green; WG, whitish green; DG, dark green; YG, yellowish green; G, glossy; SG, semi glossy; OE, obovate
elongate; OW, obovate wide; R, round; (+), present; (-), absent; C, cordate, SD, strongly depressed; T, tapering; B, brown; LB, light brown, DB, dark brown.
citrifolia using details given by Walki et al. (2008a). Molecular markers
Genomic DNA isolation The genomic DNA isolation was done by using cetyltrimethly ammonium bromide (CTAB) protocol (Doyle and Doyle, 1990) with minor modifications. For each genotype, 3 g of young leaves was collected from germ-plasm, cut into small pieces, ground and homogenized with 15 ml of preheated extraction buffer (100 mM Tris HCl, 20 mM EDTA [pH 8], 1.4 M NaCl, 2% CTAB, 2 µl/ml β-mercaptoethanol) and incubated for 1 h at 60°C. After incubation, an equal amount of chloroform: isoamyl alcohol
(24:1) was mixed by gentle inversion for 10 min and centrifuged at 8000 rpm for 10 min at 4°C. The supernatant was added with 1.5 ml of 5 M sodium chloride and equal volume of chilled Isopropanol and incubated at -20°C for 20 min. The mixture was centrifuged at 8000 rpm for 10 min at 4°C and precipitated DNA was washed twice with 70% ethanol. The DNA pellet was resuspended in 200 µl of
Tris-EDTA (TE) buffer. To remove contaminant RNA, the sample was treated with 2 µl RNase and then incubated in
water bath for 1 h at 37°C and equal volume of phenol: chloroform: isoamyl alcohol (25:24:1) was added and mixture was centrifuged at 8000 rpm for 5 min at 4°C. The
supernatant was washed twice with chloroform: isoamyl alcohol (24:1) and mixed with 1/10th of 3 M sodium acetate. DNA was precipitated by chilled absolute alcohol and pelleted by centrifugation at 5000 rpm for 8 min. The precipitated DNA was spooled, rinsed with 70% ethanol and dissolved in 0.5 ml of TE buffer for further analysis. After electrophoresis on 0.8% (w/v) agarose gel, DNA quantification was done by visualizing under UV light. RAPD analysis RAPD analysis (Williams et al., 1990) was performed using
RAPD primers (GeneI, Banglore). Polymerase chain reactions were carried out in a final volume of 20 µl containing 20 ng template DNA, 25 mM of 1.0 µl of each deoxy-nucleotide triphosphate, 20 ng of primers, 1.5 mM MgCl2, 1x Taq buffer (10 mM Tris- HCl of pH 9.0, 50 mM KCl, 0.01% gelatin) and 0.5 U Taq DNA polymerase. Amplification was achieved in a G-STORM thermal cycler
programmed as pre-heat (104°C) for 5 min, denaturation at 94°C for 5 min, 40 amplification cycles (denaturation 94°C,
1 min; annealing at 36°C, 1 min and extension at 72°C, 1 min), final extension at 72°C for 10 min and amplified product was stored at 4°C for 1 h. 3 µl of amplified product
was separated alongside a known molecular weight marker (100 bp ladder) by electrophoresis (BioRad Gel Electrophoresis Unit, 15 × 10 cm) on 1.5% agarose gel run in 1X TBE buffer at 70 V for 1 h, stained with ethidium bromide and visualized under UV light in Gel Doc system (UVP MultiDoc-IT Digital Imaging System). ISSR analysis ISSR analysis was carried out using 18 to 20 nucleotides consisting of six to eight fold repeats of short sequence of two nucleotides and zero to three additional nucleotides,
often degenerated and usually anchored to the 3' primer. The sequences of ISSR primers used in this study were obtained from Sigma, St. Louis, MO. Touchdown polymerase chain reaction with minor modifications in annealing temperature was used for the PCR reaction for analysis of ISSR markers (Don et al., 1991). The Touchdown PCR programming for ISSR markers was
followed with steps of pre-heat (104°C) for 5 min, hot start (94°C, 5 min), 8 amplification cycles (94°C, 1 min.; 45 to
39°C, 1 min; 72°C, 1 min) followed by 35 cycles (94°C, 1 min; 38°C, 1 min; 72°C, 1 min), by final extension (72°C, 10 min) and cooling (10°C, 1 h). The electrophoresis of amplified products was performed as in the RAPD protocol. Analysis of RAPD and ISSR profiles
The DNA banding patterns from RAPD and ISSR markers in 33 genotypes were observed and scored as present (1) or for absent (0) in each genotype. Cluster analysis of genotypes was carried out on similarity matrix using the Unweighted Pairgroup Method Arithmetic Average (UPGMA) using NTSYS-PC, version 2.02
(Rohlf, 1998). Polymorphism Information Content (PIC) was calculated based on the number of bands/primer, using the formula given by Roldan-Ruiz et al. (2000): PICi = 2 fi (1-fi), where PICi is the polymorphic information content of the marker i, fi is the frequency of the marker bands present and (1-fi) is the frequency of absent marker bands.
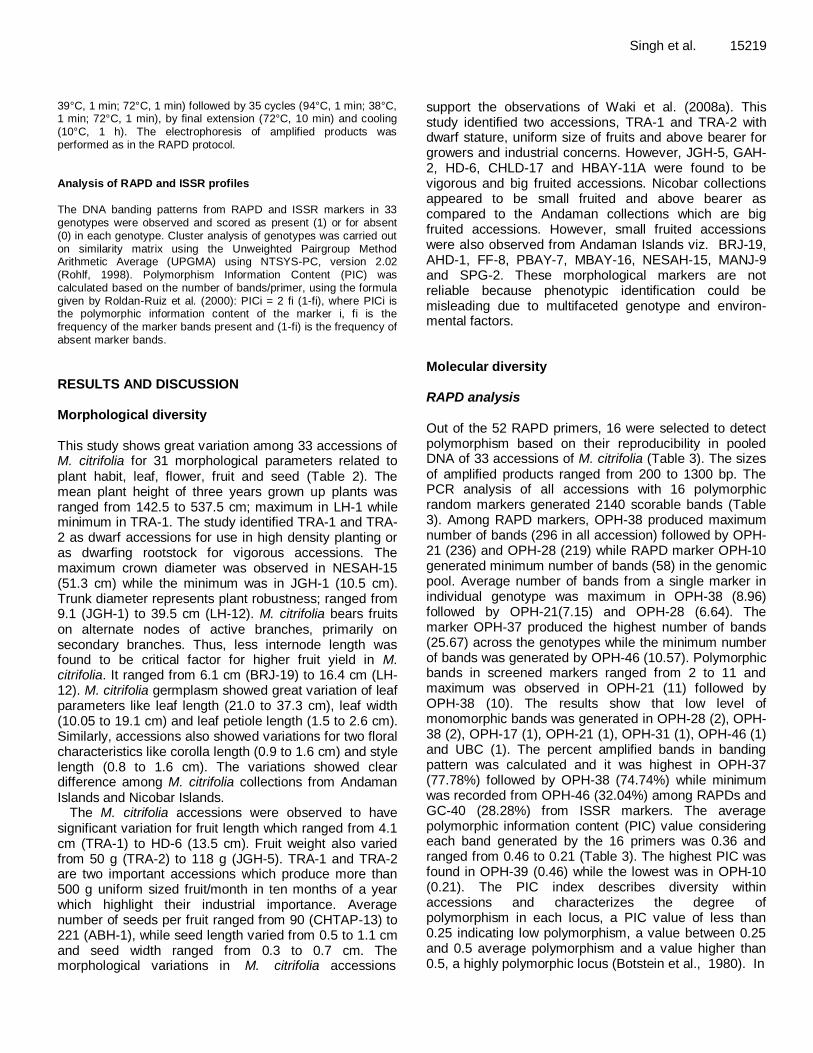
RESULTS AND DISCUSSION Morphological diversity This study shows great variation among 33 accessions of M. citrifolia for 31 morphological parameters related to plant habit, leaf, flower, fruit and seed (Table 2). The mean plant height of three years grown up plants was ranged from 142.5 to 537.5 cm; maximum in LH-1 while minimum in TRA-1. The study identified TRA-1 and TRA-2 as dwarf accessions for use in high density planting or as dwarfing rootstock for vigorous accessions. The maximum crown diameter was observed in NESAH-15 (51.3 cm) while the minimum was in JGH-1 (10.5 cm). Trunk diameter represents plant robustness; ranged from 9.1 (JGH-1) to 39.5 cm (LH-12). M. citrifolia bears fruits on alternate nodes of active branches, primarily on secondary branches. Thus, less internode length was found to be critical factor for higher fruit yield in M. citrifolia. It ranged from 6.1 cm (BRJ-19) to 16.4 cm (LH-12). M. citrifolia germplasm showed great variation of leaf parameters like leaf length (21.0 to 37.3 cm), leaf width (10.05 to 19.1 cm) and leaf petiole length (1.5 to 2.6 cm). Similarly, accessions also showed variations for two floral characteristics like corolla length (0.9 to 1.6 cm) and style length (0.8 to 1.6 cm). The variations showed clear difference among M. citrifolia collections from Andaman Islands and Nicobar Islands.
The M. citrifolia accessions were observed to have significant variation for fruit length which ranged from 4.1 cm (TRA-1) to HD-6 (13.5 cm). Fruit weight also varied from 50 g (TRA-2) to 118 g (JGH-5). TRA-1 and TRA-2 are two important accessions which produce more than 500 g uniform sized fruit/month in ten months of a year which highlight their industrial importance. Average number of seeds per fruit ranged from 90 (CHTAP-13) to 221 (ABH-1), while seed length varied from 0.5 to 1.1 cm and seed width ranged from 0.3 to 0.7 cm. The morphological variations in M. citrifolia accessions
Singh et al. 15219 support the observations of Waki et al. (2008a). This study identified two accessions, TRA-1 and TRA-2 with dwarf stature, uniform size of fruits and above bearer for growers and industrial concerns. However, JGH-5, GAH-2, HD-6, CHLD-17 and HBAY-11A were found to be vigorous and big fruited accessions. Nicobar collections appeared to be small fruited and above bearer as compared to the Andaman collections which are big fruited accessions. However, small fruited accessions were also observed from Andaman Islands viz. BRJ-19, AHD-1, FF-8, PBAY-7, MBAY-16, NESAH-15, MANJ-9 and SPG-2. These morphological markers are not reliable because phenotypic identification could be misleading due to multifaceted genotype and environ-mental factors. Molecular diversity RAPD analysis Out of the 52 RAPD primers, 16 were selected to detect polymorphism based on their reproducibility in pooled DNA of 33 accessions of M. citrifolia (Table 3). The sizes of amplified products ranged from 200 to 1300 bp. The PCR analysis of all accessions with 16 polymorphic random markers generated 2140 scorable bands (Table 3). Among RAPD markers, OPH-38 produced maximum number of bands (296 in all accession) followed by OPH-21 (236) and OPH-28 (219) while RAPD marker OPH-10 generated minimum number of bands (58) in the genomic pool. Average number of bands from a single marker in individual genotype was maximum in OPH-38 (8.96) followed by OPH-21(7.15) and OPH-28 (6.64). The marker OPH-37 produced the highest number of bands (25.67) across the genotypes while the minimum number of bands was generated by OPH-46 (10.57). Polymorphic bands in screened markers ranged from 2 to 11 and maximum was observed in OPH-21 (11) followed by OPH-38 (10). The results show that low level of monomorphic bands was generated in OPH-28 (2), OPH-38 (2), OPH-17 (1), OPH-21 (1), OPH-31 (1), OPH-46 (1) and UBC (1). The percent amplified bands in banding pattern was calculated and it was highest in OPH-37 (77.78%) followed by OPH-38 (74.74%) while minimum was recorded from OPH-46 (32.04%) among RAPDs and GC-40 (28.28%) from ISSR markers. The average polymorphic information content (PIC) value considering each band generated by the 16 primers was 0.36 and ranged from 0.46 to 0.21 (Table 3). The highest PIC was found in OPH-39 (0.46) while the lowest was in OPH-10 (0.21). The PIC index describes diversity within accessions and characterizes the degree of polymorphism in each locus, a PIC value of less than 0.25 indicating low polymorphism, a value between 0.25 and 0.5 average polymorphism and a value higher than 0.5, a highly polymorphic locus (Botstein et al., 1980). In
15220 Afr. J. Biotechnol.
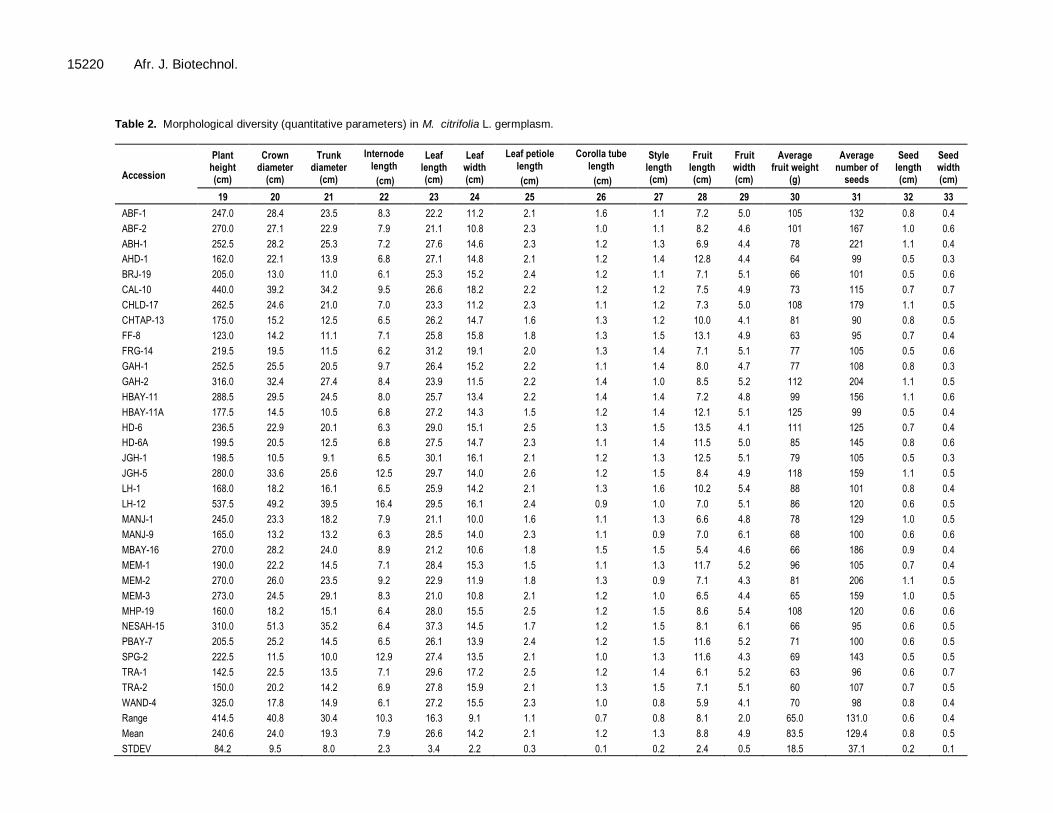
Table 2. Morphological diversity (quantitative parameters) in M. citrifolia L. germplasm.
Accession
Plant height (cm)
Crown diameter
(cm)
Trunk diameter
(cm)
Internode
length
(cm)
Leaf length (cm)
Leaf width (cm)
Leaf petiole
length
(cm)
Corolla tube
length
(cm)
Style length (cm)
Fruit length (cm)
Fruit width (cm)
Average fruit weight
(g)
Average number of
seeds
Seed length (cm)
Seed width (cm)
19 20 21 22 23 24 25 26 27 28 29 30 31 32 33
ABF-1 247.0 28.4 23.5 8.3 22.2 11.2 2.1 1.6 1.1 7.2 5.0 105 132 0.8 0.4
ABF-2 270.0 27.1 22.9 7.9 21.1 10.8 2.3 1.0 1.1 8.2 4.6 101 167 1.0 0.6
ABH-1 252.5 28.2 25.3 7.2 27.6 14.6 2.3 1.2 1.3 6.9 4.4 78 221 1.1 0.4
AHD-1 162.0 22.1 13.9 6.8 27.1 14.8 2.1 1.2 1.4 12.8 4.4 64 99 0.5 0.3
BRJ-19 205.0 13.0 11.0 6.1 25.3 15.2 2.4 1.2 1.1 7.1 5.1 66 101 0.5 0.6
CAL-10 440.0 39.2 34.2 9.5 26.6 18.2 2.2 1.2 1.2 7.5 4.9 73 115 0.7 0.7
CHLD-17 262.5 24.6 21.0 7.0 23.3 11.2 2.3 1.1 1.2 7.3 5.0 108 179 1.1 0.5
CHTAP-13 175.0 15.2 12.5 6.5 26.2 14.7 1.6 1.3 1.2 10.0 4.1 81 90 0.8 0.5
FF-8 123.0 14.2 11.1 7.1 25.8 15.8 1.8 1.3 1.5 13.1 4.9 63 95 0.7 0.4
FRG-14 219.5 19.5 11.5 6.2 31.2 19.1 2.0 1.3 1.4 7.1 5.1 77 105 0.5 0.6
GAH-1 252.5 25.5 20.5 9.7 26.4 15.2 2.2 1.1 1.4 8.0 4.7 77 108 0.8 0.3
GAH-2 316.0 32.4 27.4 8.4 23.9 11.5 2.2 1.4 1.0 8.5 5.2 112 204 1.1 0.5
HBAY-11 288.5 29.5 24.5 8.0 25.7 13.4 2.2 1.4 1.4 7.2 4.8 99 156 1.1 0.6
HBAY-11A 177.5 14.5 10.5 6.8 27.2 14.3 1.5 1.2 1.4 12.1 5.1 125 99 0.5 0.4
HD-6 236.5 22.9 20.1 6.3 29.0 15.1 2.5 1.3 1.5 13.5 4.1 111 125 0.7 0.4
HD-6A 199.5 20.5 12.5 6.8 27.5 14.7 2.3 1.1 1.4 11.5 5.0 85 145 0.8 0.6
JGH-1 198.5 10.5 9.1 6.5 30.1 16.1 2.1 1.2 1.3 12.5 5.1 79 105 0.5 0.3
JGH-5 280.0 33.6 25.6 12.5 29.7 14.0 2.6 1.2 1.5 8.4 4.9 118 159 1.1 0.5
LH-1 168.0 18.2 16.1 6.5 25.9 14.2 2.1 1.3 1.6 10.2 5.4 88 101 0.8 0.4
LH-12 537.5 49.2 39.5 16.4 29.5 16.1 2.4 0.9 1.0 7.0 5.1 86 120 0.6 0.5
MANJ-1 245.0 23.3 18.2 7.9 21.1 10.0 1.6 1.1 1.3 6.6 4.8 78 129 1.0 0.5
MANJ-9 165.0 13.2 13.2 6.3 28.5 14.0 2.3 1.1 0.9 7.0 6.1 68 100 0.6 0.6
MBAY-16 270.0 28.2 24.0 8.9 21.2 10.6 1.8 1.5 1.5 5.4 4.6 66 186 0.9 0.4
MEM-1 190.0 22.2 14.5 7.1 28.4 15.3 1.5 1.1 1.3 11.7 5.2 96 105 0.7 0.4
MEM-2 270.0 26.0 23.5 9.2 22.9 11.9 1.8 1.3 0.9 7.1 4.3 81 206 1.1 0.5
MEM-3 273.0 24.5 29.1 8.3 21.0 10.8 2.1 1.2 1.0 6.5 4.4 65 159 1.0 0.5
MHP-19 160.0 18.2 15.1 6.4 28.0 15.5 2.5 1.2 1.5 8.6 5.4 108 120 0.6 0.6
NESAH-15 310.0 51.3 35.2 6.4 37.3 14.5 1.7 1.2 1.5 8.1 6.1 66 95 0.6 0.5
PBAY-7 205.5 25.2 14.5 6.5 26.1 13.9 2.4 1.2 1.5 11.6 5.2 71 100 0.6 0.5
SPG-2 222.5 11.5 10.0 12.9 27.4 13.5 2.1 1.0 1.3 11.6 4.3 69 143 0.5 0.5
TRA-1 142.5 22.5 13.5 7.1 29.6 17.2 2.5 1.2 1.4 6.1 5.2 63 96 0.6 0.7
TRA-2 150.0 20.2 14.2 6.9 27.8 15.9 2.1 1.3 1.5 7.1 5.1 60 107 0.7 0.5
WAND-4 325.0 17.8 14.9 6.1 27.2 15.5 2.3 1.0 0.8 5.9 4.1 70 98 0.8 0.4
Range 414.5 40.8 30.4 10.3 16.3 9.1 1.1 0.7 0.8 8.1 2.0 65.0 131.0 0.6 0.4
Mean 240.6 24.0 19.3 7.9 26.6 14.2 2.1 1.2 1.3 8.8 4.9 83.5 129.4 0.8 0.5
STDEV 84.2 9.5 8.0 2.3 3.4 2.2 0.3 0.1 0.2 2.4 0.5 18.5 37.1 0.2 0.1
Singh et al. 15221
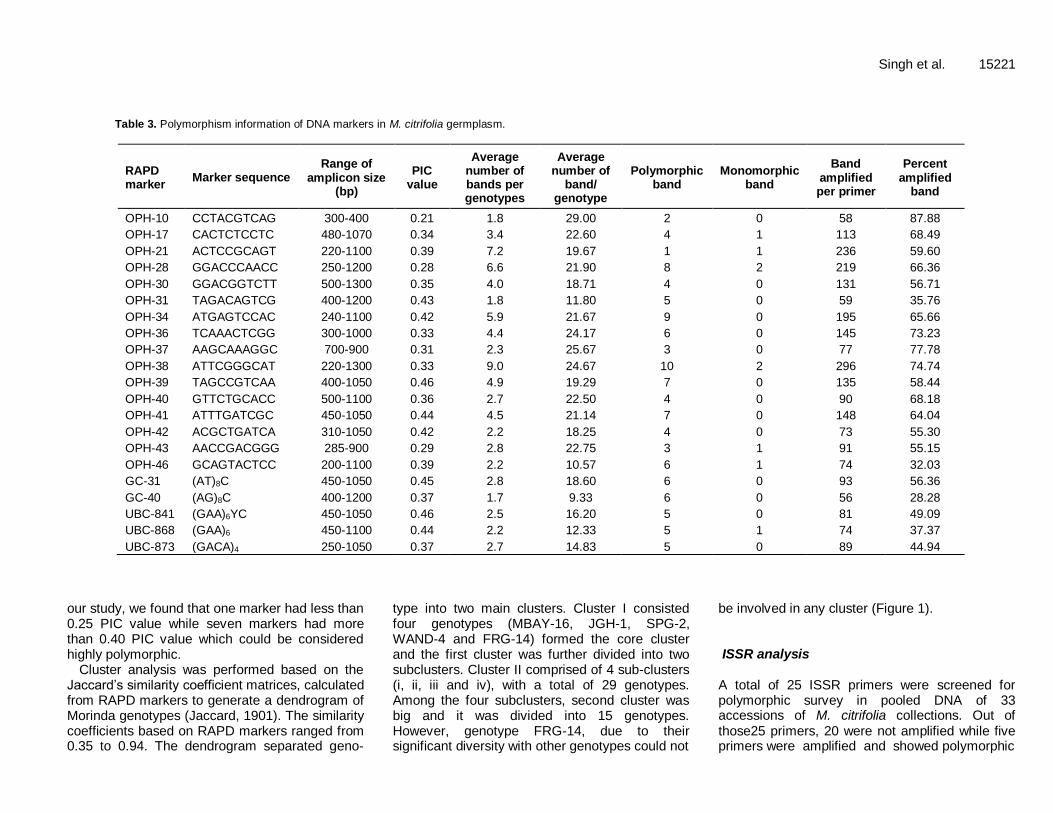
Table 3. Polymorphism information of DNA markers in M. citrifolia germplasm.
RAPD marker
Marker sequence Range of
amplicon size (bp)
PIC value
Average number of bands per genotypes
Average number of
band/ genotype
Polymorphic band
Monomorphic band
Band amplified per primer
Percent amplified
band
OPH-10 CCTACGTCAG 300-400 0.21 1.8 29.00 2 0 58 87.88
OPH-17 CACTCTCCTC 480-1070 0.34 3.4 22.60 4 1 113 68.49
OPH-21 ACTCCGCAGT 220-1100 0.39 7.2 19.67 1 1 236 59.60
OPH-28 GGACCCAACC 250-1200 0.28 6.6 21.90 8 2 219 66.36
OPH-30 GGACGGTCTT 500-1300 0.35 4.0 18.71 4 0 131 56.71
OPH-31 TAGACAGTCG 400-1200 0.43 1.8 11.80 5 0 59 35.76
OPH-34 ATGAGTCCAC 240-1100 0.42 5.9 21.67 9 0 195 65.66
OPH-36 TCAAACTCGG 300-1000 0.33 4.4 24.17 6 0 145 73.23
OPH-37 AAGCAAAGGC 700-900 0.31 2.3 25.67 3 0 77 77.78
OPH-38 ATTCGGGCAT 220-1300 0.33 9.0 24.67 10 2 296 74.74
OPH-39 TAGCCGTCAA 400-1050 0.46 4.9 19.29 7 0 135 58.44
OPH-40 GTTCTGCACC 500-1100 0.36 2.7 22.50 4 0 90 68.18
OPH-41 ATTTGATCGC 450-1050 0.44 4.5 21.14 7 0 148 64.04
OPH-42 ACGCTGATCA 310-1050 0.42 2.2 18.25 4 0 73 55.30
OPH-43 AACCGACGGG 285-900 0.29 2.8 22.75 3 1 91 55.15
OPH-46 GCAGTACTCC 200-1100 0.39 2.2 10.57 6 1 74 32.03
GC-31 (AT)8C 450-1050 0.45 2.8 18.60 6 0 93 56.36
GC-40 (AG)8C 400-1200 0.37 1.7 9.33 6 0 56 28.28
UBC-841 (GAA)6YC 450-1050 0.46 2.5 16.20 5 0 81 49.09
UBC-868 (GAA)6 450-1100 0.44 2.2 12.33 5 1 74 37.37
UBC-873 (GACA)4 250-1050 0.37 2.7 14.83 5 0 89 44.94
our study, we found that one marker had less than 0.25 PIC value while seven markers had more than 0.40 PIC value which could be considered highly polymorphic.
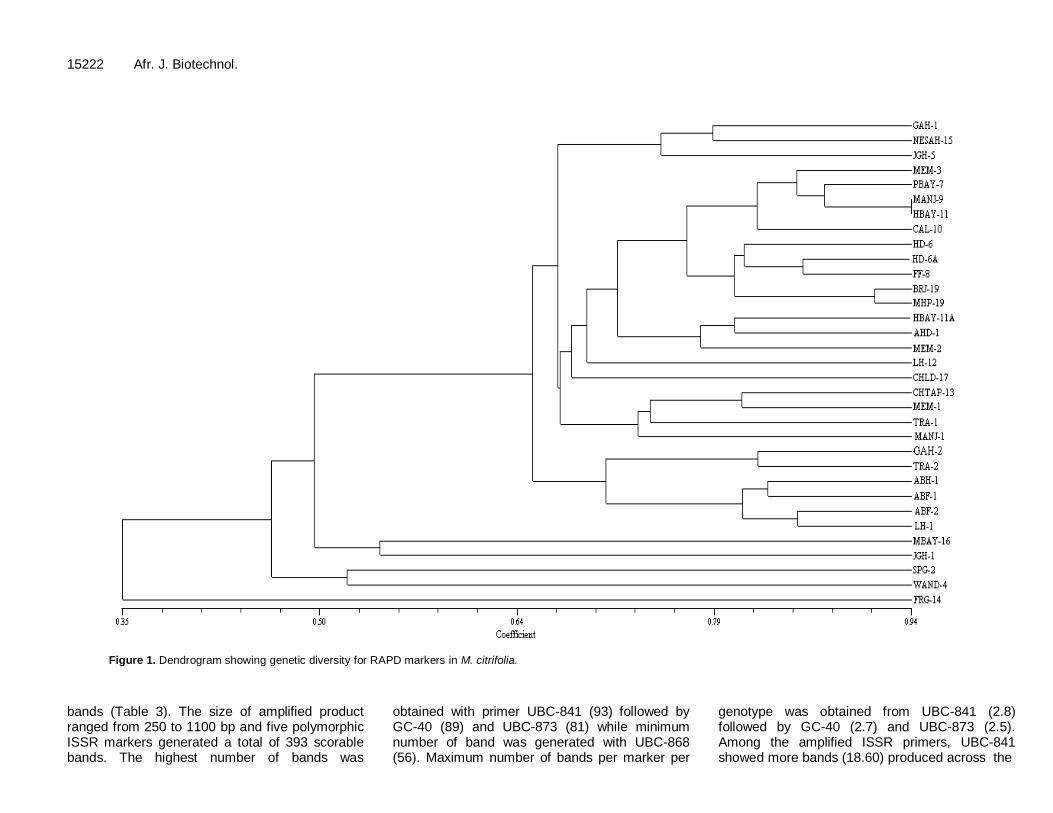
Cluster analysis was performed based on the Jaccard’s similarity coefficient matrices, calculated from RAPD markers to generate a dendrogram of Morinda genotypes (Jaccard, 1901). The similarity coefficients based on RAPD markers ranged from 0.35 to 0.94. The dendrogram separated geno-
type into two main clusters. Cluster I consisted four genotypes (MBAY-16, JGH-1, SPG-2, WAND-4 and FRG-14) formed the core cluster and the first cluster was further divided into two subclusters. Cluster II comprised of 4 sub-clusters (i, ii, iii and iv), with a total of 29 genotypes. Among the four subclusters, second cluster was big and it was divided into 15 genotypes. However, genotype FRG-14, due to their significant diversity with other genotypes could not
be involved in any cluster (Figure 1). ISSR analysis A total of 25 ISSR primers were screened for polymorphic survey in pooled DNA of 33 accessions of M. citrifolia collections. Out of those25 primers, 20 were not amplified while five primers were amplified and showed polymorphic
15222 Afr. J. Biotechnol.
Figure 1. Dendrogram showing genetic diversity for RAPD markers in M. citrifolia.
bands (Table 3). The size of amplified product ranged from 250 to 1100 bp and five polymorphic ISSR markers generated a total of 393 scorable bands. The highest number of bands was
obtained with primer UBC-841 (93) followed by GC-40 (89) and UBC-873 (81) while minimum number of band was generated with UBC-868 (56). Maximum number of bands per marker per
genotype was obtained from UBC-841 (2.8) followed by GC-40 (2.7) and UBC-873 (2.5). Among the amplified ISSR primers, UBC-841 showed more bands (18.60) produced across the
Singh et al. 15223
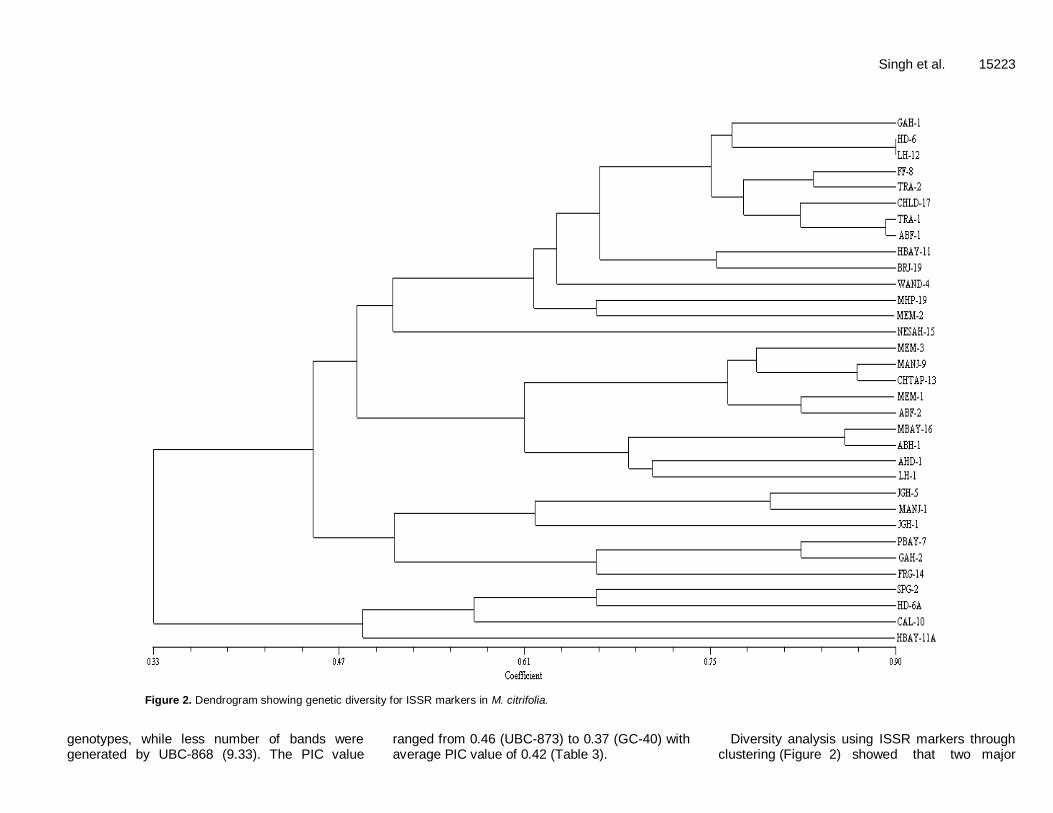
Figure 2. Dendrogram showing genetic diversity for ISSR markers in M. citrifolia.
genotypes, while less number of bands were generated by UBC-868 (9.33). The PIC value
ranged from 0.46 (UBC-873) to 0.37 (GC-40) with average PIC value of 0.42 (Table 3).
Diversity analysis using ISSR markers through clustering (Figure 2) showed that two major
15224 Afr. J. Biotechnol.
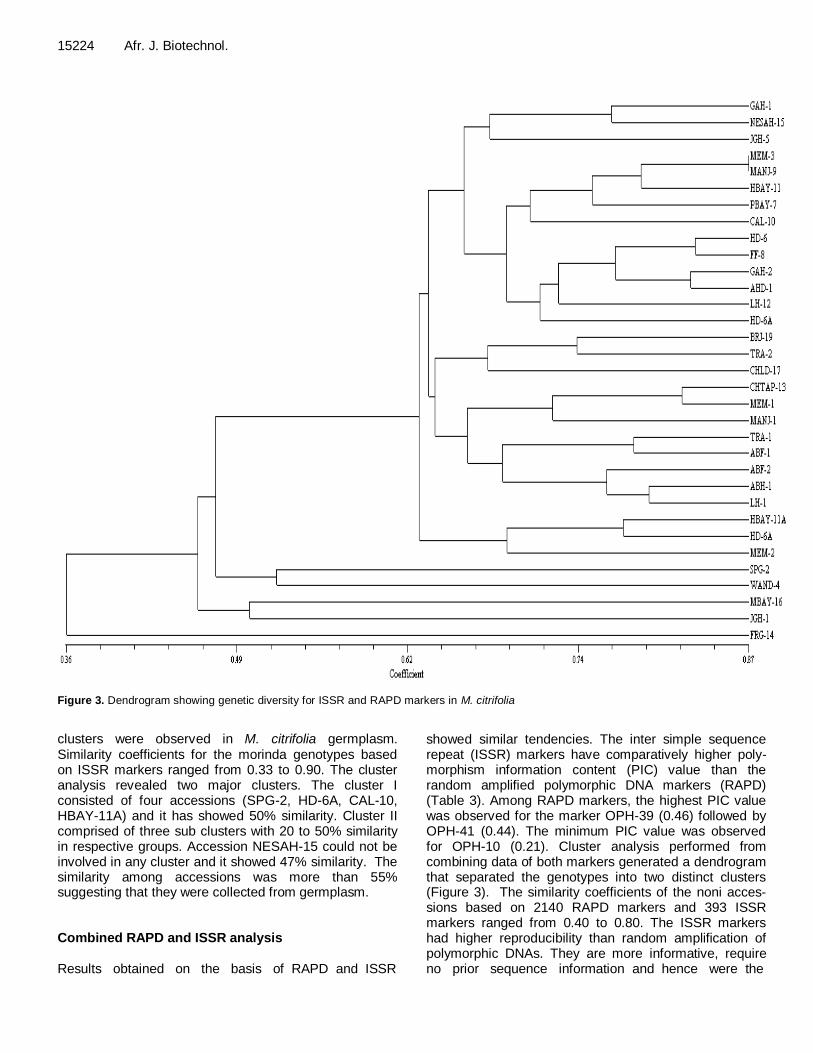
Figure 3. Dendrogram showing genetic diversity for ISSR and RAPD markers in M. citrifolia
clusters were observed in M. citrifolia germplasm. Similarity coefficients for the morinda genotypes based on ISSR markers ranged from 0.33 to 0.90. The cluster analysis revealed two major clusters. The cluster I consisted of four accessions (SPG-2, HD-6A, CAL-10, HBAY-11A) and it has showed 50% similarity. Cluster II comprised of three sub clusters with 20 to 50% similarity in respective groups. Accession NESAH-15 could not be involved in any cluster and it showed 47% similarity. The similarity among accessions was more than 55% suggesting that they were collected from germplasm. Combined RAPD and ISSR analysis Results obtained on the basis of RAPD and ISSR
showed similar tendencies. The inter simple sequence repeat (ISSR) markers have comparatively higher poly-morphism information content (PIC) value than the random amplified polymorphic DNA markers (RAPD) (Table 3). Among RAPD markers, the highest PIC value was observed for the marker OPH-39 (0.46) followed by OPH-41 (0.44). The minimum PIC value was observed for OPH-10 (0.21). Cluster analysis performed from combining data of both markers generated a dendrogram that separated the genotypes into two distinct clusters (Figure 3). The similarity coefficients of the noni acces-sions based on 2140 RAPD markers and 393 ISSR markers ranged from 0.40 to 0.80. The ISSR markers had higher reproducibility than random amplification of polymorphic DNAs. They are more informative, require no prior sequence information and hence were the
markers of choice. The findings in this study are in conformity with the earlier reports of Singh et al. (2011).
RAPD are expressed as dominant markers, because amplification of products proceeds in the presence of a pair of sequence homologous to that of the primer on either one or both homologous chromosomes (Williams et al., 1990). The ISSR techniques are not more difficult for marker development than RAPD, and require a small amount of DNA for amplification (Zietkiewicz et al., 1994). The ISSR technique allows amplifying alternate parts of the genome and was described as a good approach in parallel to RAPD (Powell et al., 1996). Results of this study show that the RAPD and ISSR marker systems were efficient and useful for the assessment of genetic diversity of M. citrifolia at molecular level. Conclusion In conclusion, the results of the recent studies confirm that morphological marker and molecular markers were useful for the examination of genetic diversity within morinda germplasm. The study reveals great variation in M. citrifolia in Andaman and Nicobar Islands where the crop was originated. It is confirmed that both marker systems (morphology and molecular) could be used as complementary methods in population diversity and effectively exploit germplasms for plant breeding. REFERENCES
Abraham Z, Senthilkumar R, Joseph JK (2008). Collection of plant genetic resources from Andaman and Nicobar Islands. Genet. Resour. Crop Evol., 55: 1279-1289.
Botstein D, White RL, Skolnick M, Davis RW (1980). Construction of a genetic linkage map in man using restriction fragment length polymorphisms. Am. J. Hum. Genet., 32: 314-331.
Bushnell OA, Fukuda M, Makinodian T (1950). The antibacterial properties of some plants found in Hawaii. Pac. Sci. 4: 167-183.
Don RH, Cox PT, Wainwright BJ, Baker K, Mattick JS (1991).
'Touchdown' PCR to circumvent spurious priming during gene amplification. Nucleic Acids Res. 19: 4008.
Doyle JJ, Doyle JL (1990). Isolation of plant DNA from fresh tissue.
Focus, 12: 13-15. Esselman EJ, Jianqiang L, Crawford DJ, Windus JL, Wolfe AD (1999).
Clonal diversity in the rare Calamagrostis porteri ssp. insperata
(Poaceae): comparative results for allozymes and random amplified polymorphic DNA (RAPD) and inter-simple sequence repeat (ISSR) markers. Mol. Ecol., 8: 443-451.
Jaccard P (1901). Etude de la distribution florale dans une portion des Alpes et du Jura. Bull. Soc. Vaudoise Sci. Nat., 37: 547-579.
Karp A, Seberg O, Buiatti M (1996). Molecular techniques in the
assessment of botanical diversity. (Lond), Ann. Bot., 78: 143-149. Liu G, Bode A, Ma WY, Sang S, Ho CT, Dong Z (2001). Two novel
glycosides from the fruits of Morinda citrifolia (noni) inhibit AP-1
transactivation and cell trans formation in the mouse epidermal JB6 cell line. Cancer Res., 61: 5749-56.
Singh et al. 15225 Lombard V, Dubreuil P, Dillman C, Baril CP (2001). Genetic distance
estimators based on molecular data for plant registration and protection: a review. Acta Hortic., 546: 55-63.
Lu J, Knox MR, Ambrose MJ, Brown JKM, Ellis THN (1996). Comparative analysis of genetic diversity in pea assessed by RFLP- and PCR-based meth-ds. Theor. Appl. Genet., 93: 1103-1111.
McClatchey W (2002). From Polynesian Healers to Health Food Stores: Changing Perspectives of Morinda citrifolia (Rubiaceae). Integr.
Cancer Ther., 1(2): 110-120.
McGregor CE, Lambert CA, Greyling MM, Louw JH, Warnich L (2000). A comparative assessment of DNA fingerprinting techniques (RAPD, ISSR, AFLP and SSR) in tetraploid potato (Solanum tuberosum L.)
germplasm. Euphytica, 113: 135-144. Nelson SC (2001). Noni cultivation in Hawaii. Fruits Nutr., 4: 1-4. Powell W, Morgante M, Andre C, Hanafey M, Vogel J, Tingey, Rafalski
A (1996). The comparison of RAPD, RAPD, AFLP and SSR (microsatellite) markers for germplasm analysis. Mol. Breed., 2: 225-238.
Ramanatha RV, Hodgkin T (2002). Genetic diversity and conservation and utilization of plant genetic resources. Plant Cell, Tissue Organ. Cult. 68:1-19.
Rethinam P, Sivaraman K (2007). Noni (Morinda citrifolia L) the Miracle
Fruit - A Holistic Review. Int J. Noni Res., 2: 1-34. Rohlf FJ (1998). NTSYS-PC. Numerical taxonomy and multivariate
analysis system, version 2.00. Exeter Software, Setauket, NY. Roldan-Ruize IE, Calsyn TJ, Gilliand R, Coll MJT, Vaneijk, De Loose M
(2000). Estimating genetic conformity between related ryegrass
(Lolium) varieties. 2. AFLP characterization. Mol. Breed., 6: 593-602. Rossetto M, Jezierski G, Hopper SD, Dixon KW (1999). Conservation
genetics and clonality in two critically endangered eucalypts from the
highly endemic south-Western Australian flora. Biol. Conser., 88: 321-331.
Singh DR, Srivastava AK, Srivastava A, Srivastava RC (2011). Genetic
diversity among three Morinda species using RAPD and ISSR markers. Ind. J. Biotech., 10: 285-293.
Spooner D, Treuren R, De Vicente MC (2005). Molecular markers for
genebank management. IPGRI Technical Bulletin No. 10. International Plant Genetic Resources Institute, Rome, Italy.
Waki J, Okpul T, Komolong M (2008a). A descriptor list for morphological characterisation of Noni (Morinda citrifolia L). South
Pac. J. Nat. Sci., 10: 61-66. Waki J, Okpul T, Komolong MK (200b). Assessing the extent of diversity
among noni (Morinda citrifolia L.) genotypes of Morobe Province,
Papua New Guinea. South Pac. J. Nat. Sci., 26: 11-24. Wang M, West B, Jensen C, Nowicki D, Su C, Palu A, Anderson G
(2002). Morinda citrifolia (Noni): A literature review and recent
advances in Noni Research. Acta Pharmacol. Sin., 23(12): 1127-
1141. Williams JG, Kubelik AR, Livak KJ, Rafalski JA, Tingey SV (1990). DNA
polymorphisms amplified by arbitrary markers are useful as genetic markers. Nucleic Acids Res., 18: 6531-6535.
Zietkiewicz E, Rafalski A, Labuda D (1994). Genome fingerprinting by
simple sequence repeat (SSR) anchored polymerase chain reaction amplification. Genomics, 20: 176-183.