dixon technologies 390 - moneycontrol.com
TRANSCRIPT
An
nu
al
Re
po
rt A
na
lysi
s FY
20
The domestic manufacturing story is leading the path for Dixon and it sits comfortably with a diversified product mix, client mix and fungible manufacturing facilities which can be adjusted to make use of any unutilized capacity. It has been successful in backward integration, improving operational efficiencies and design capabilities to continue on its growth trajectory. It continues to transition from the OEM model to ODM model of doing business, which should improve its margins going forward. The PLI scheme is another opportunity for Dixon, which can provide a boost to its scaling up plans. The company has already made 2 applications under the PLI scheme.
Transitioning from OEM to ODM model The company’s business model is undergoing a strategic shift from OEM (Original Equipment Manufacturing) to ODM (Original Design Manufacturing). This has been possible on the back of backward integration across key segments and fungible assets which enhances the operating leverage. The ODM model includes a designing component as compared to an only licensed outsourced manufacturing under the OEM model. This value add should improve margins of the company going ahead.
Huge market potential for EMS The EMS (Electronic Manufacturing Services) market size in FY20 was ~US$6 bn and is expected to grow at a CAGR of 47% from 2020 to 2025 as per the Dixon FY20 annual report. The growth drivers for this market would be rising manufacturing costs in other economies, growing labour costs in China and the continuing trend of bigger OEMs to outsource manufacturing.
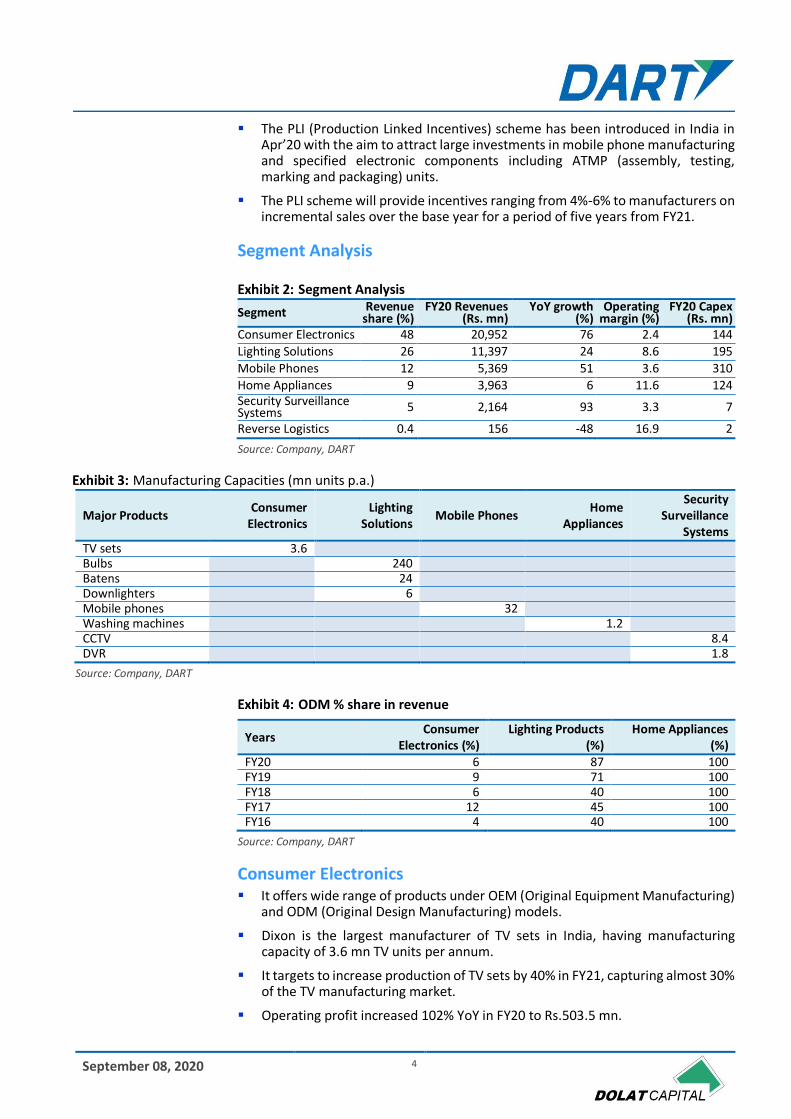
Confidence to increase capacities Recent notification to curb imports on LED TVs has given Dixon the confidence to increase capacity from 3.6 mn units in FY20 to 5.5 mn units by Q4FY21, which would take care of 40% of the Indian requirement. It plans to increase capacity in battens and downlighters and target 25% share in the Indian market. The company incurred a capex of Rs.836 mn in FY20, majority (Rs.310 mn) of which was for the mobile phones segment.
Indian Government incentivizing domestic manufacturing The PMP (Phased Manufacturing Programme) scheme was introduced in Apr’17 with an approach for import substitution by putting custom duties on parts and components to incentivize assembly followed by component localization. In 2020, the Government launched PLI (Production Linked Incentives) scheme for mobile phones with incentives upto Rs.410 bn over 5 years. Additionally, domestic companies would be incentivized better for mobile phones having ex-factory prices below Rs.15,000. This augurs well for Dixon, which has already made 2 applications under the PLI scheme.
Foraying into new segments Set top boxes is an emerging business vertical for Dixon and should start contributing meaningfully to the revenues and profitability from FY21. The company has entered the medical electronics segment and has signed a MOU with Molbio for manufacturing Truelab Quattro Real Time Quantitative micro PCR (Polymerise Chain Reaction) Analyzer machines. These machines are capable of performing multiple tests per day for critical infectious diseases like COVID-19. It has been validated and approved by ICMR to conduct COVID-19 tests.
CMP Rs 8,920
Target / Downside Rs 6,500 / 27%
BSE Sensex 38,506
NSE Nifty 11,334
Scrip Details
Equity / FV Rs 116mn / Rs 10
Market Cap Rs 101bn
US$ 1bn
52-week High/Low Rs9,000/Rs2,430
Avg. Volume (no) 75,758
NSE Symbol DIXON
Bloomberg Code DIXON IN
Shareholding Pattern Jun'20(%)
Promoters 36.1
MF/Banks/FIs 21.9
FIIs 12.3
Public / Others 29.7
Company Relative to Sensex
VP Research: Vinod Chari Tel: +91 22 40969776
E-mail: [email protected]
Associate: Pranav Lala Tel: +9122 40969722
E-mail: [email protected]
90
150
210
270
330
390
Se
p-1
9
Oct-
19
Nov-1
9
Dec-1
9
Jan
-20
Feb-2
0
Ma
r-20
Ap
r-20
Ma
y-2
0
Jun
-20
Jul-2
0
Au
g-2
0
Se
p-2
0
DIXON SENSEX
Dixon Technologies
Sell
September 08, 2020

September 08, 2020 2
Annual Report Macro View Particulars
Key Management No changes during the year.
Board of Directors No changes during the year.
Auditors No changes.
M/s. S.N. Dhawan & Co. LLP continue to be the statutory auditors of the company.
Latest Credit Ratings Ratings for bank loan facilities were at Long Term ICRA A+ and short Term A1+.
Ratings for Commercial Papers were at ICRA A1+.
Pledged Shares No shares were pledged during the year.
Key Holders
Category of Shareholder (%) FY2020 FY2019
A. Promoters & Promoter Group* 34.67 37.05
B. Public Shareholding 65.33 62.95
Total 100.00 100.00
*The entire promoter stake is held by one individual, the executive chairman, Mr. Sunil Vachani.
FY20 Performance & Developments
Capex incurred was Rs.836 mn in FY20 as compared to Rs.879 mn in FY19.
It acquired the remaining 50% of its 50:50 JV for Padget Electronics Pvt. Ltd. It is in the business of manufacturing, selling, exporting, repairing or dealing in mobile phones and components.
Incorporated a wholly owned subsidiary, Dixon Electro Appliances Pvt. Ltd. for the purpose of manufacturing and dealing in consumer durables and electronic appliances.
Credit limit of 2 bank loan facilities were enhanced from Rs.4.4 bn to Rs.7.4 bn and from Rs.7.4 bn to Rs.103 bn respectively.
Commercial papers were enhanced from Rs.250 mn to Rs.500 mn.
Mr. Sunil Vachani's (Executive Chairman) remuneration was Rs.50 mn, of which 51.5% were commissions.
Mr. Atul Lall's (Managing Director) remuneration was Rs. 46.2 mn of which 61.4% were commissions.
Mr. Saurabh Gupta's (CFO) remuneration was Rs.40.1 mn of which 3% were commissions.
Total forex outgo increased 83.8% YoY in FY20 to Rs.21.5 bn. This forms 48.9% of FY20 sales. Forex earnings were only Rs.35.6 mn in FY20, a degrowth of 86.1% YoY.

September 08, 2020 3
Industry Overview
The following table is a snapshot of the segmental industry size and expected CAGR as described in the Dixon FY20 Annual Report:
Segmental Industry Size
Segment 2019 Value (Rs. bn)
2023 E Value (Rs. bn)
4 yr value CAGR (%)
2019 Volume (mn unit p.a.)
2023 E Volume (mn unit p.a.)
4 yr volume CAGR (%)
LED TV 220 322 10 14 21 10.7 LED Lighting 188 300 12.4
Mobile Phones 1,600 (FY20) 2,000 (FY23E) 5.7 Washing Machines 104 (FY20) 146 (FY23E) 8.9 7 10 9.3
Source: Company, DART
The demand drivers for the following segments were discussed in detail in the annual report and are as
follows:
The mobile phone segment is expected to be at an inflection point and was discussed in much detail:
Last 3 years has seen an influx of manufacturing units for mobile handsets and their components/sub-assemblies with 268 units being set up over that period.
India is the world’s second largest smartphone market at annual volumes of 150-160 mn units.
India has been imposing duties on imported mobiles in a bid to push domestic manufacturing.
TV Market LED Lighting Washing Machines
Security Systems
1.Demand for smart TV due to increased digital penetration
2.Higher & cheaper content consumption
3.Falling prices of entry-level TVs
4.Increasing multi-TV homes in the urban market
5.Replacement from CRT & Plasma TV to LED
6.Reduction in replacement cycle
1.Rising awareness of energy efficiency and cost awareness of LED lighting
2.Innovative & differentiated products
1.Growing working population
2.Growing nuclear families
3.Rising domestic home labour costs
1.Increase in organized real estate sector
2.Rise in threat perception
3.Growing crime rates
4.Data thefts
5.Remote monitoring
6.Growth in public infrastructure
September 08, 2020 4
The PLI (Production Linked Incentives) scheme has been introduced in India in Apr’20 with the aim to attract large investments in mobile phone manufacturing and specified electronic components including ATMP (assembly, testing, marking and packaging) units.
The PLI scheme will provide incentives ranging from 4%-6% to manufacturers on incremental sales over the base year for a period of five years from FY21.
Segment Analysis
Segment Analysis
Segment Revenue share (%)
FY20 Revenues (Rs. mn)
YoY growth (%)
Operating margin (%)
FY20 Capex (Rs. mn)
Consumer Electronics 48 20,952 76 2.4 144
Lighting Solutions 26 11,397 24 8.6 195
Mobile Phones 12 5,369 51 3.6 310
Home Appliances 9 3,963 6 11.6 124 Security Surveillance Systems 5 2,164 93 3.3 7
Reverse Logistics 0.4 156 -48 16.9 2
Source: Company, DART
Manufacturing Capacities (mn units p.a.)
Major Products Consumer
Electronics Lighting
Solutions Mobile Phones
Home Appliances
Security Surveillance
Systems TV sets 3.6 Bulbs 240 Batens 24 Downlighters 6 Mobile phones 32 Washing machines 1.2 CCTV 8.4 DVR 1.8
Source: Company, DART
ODM % share in revenue
Source: Company, DART
Consumer Electronics
It offers wide range of products under OEM (Original Equipment Manufacturing) and ODM (Original Design Manufacturing) models.
Dixon is the largest manufacturer of TV sets in India, having manufacturing capacity of 3.6 mn TV units per annum.
It targets to increase production of TV sets by 40% in FY21, capturing almost 30% of the TV manufacturing market.
Operating profit increased 102% YoY in FY20 to Rs.503.5 mn.
Years Consumer
Electronics (%) Lighting Products
(%) Home Appliances
(%) FY20 6 87 100 FY19 9 71 100 FY18 6 40 100 FY17 12 45 100 FY16 4 40 100
September 08, 2020 5
The company expects this segment to deliver sustained growth over the near term on the back of addition of new customers, increasing order book from anchor customers and expectation of adding some marquee clients. Some major customers are Xioami, Samsung, Panasonic, TCL, Llyod, Flipkart, Philips, Toshiba, Hisense, Nokia, etc.
It is doubling the assembly and process lines for LCM and PCBA so as to reduce delivery time.
Lighting Solutions
It is one of the top global manufacturers of indoor lighting and LED bulbs. It manufactures 45% of the bulbs in the Indian market.
The company has expanded offerings to electronic board designing, mechanical and light source and package designing.
98% of production is done under ODM model for all major brands.
Operating profit increased 48% YoY in FY20 to Rs.977 mn on account of improvement in operational efficiency, backward integration and strong relationship with existing clients.
Completed backward integration of all major products.
Started exporting to Malaysia, Indonesia and Mexico.
Invested in process automation for key products.
Major clients are Signify, Panasonic Life Solutions, Wipro, Bajaj, Syska, Orient, Havells, Polycab, Luminous.
Mobile Phones
It currently manufactures feature phones, smart phones, and PCBA for mobiles.
100% of products is under OEM model for all major brands.
Operating profit increased 157% YoY in FY20 to Rs.191 mn on account of new customer acquisitions and economies of scale.
The underutilized capacity of mobile phone plant was modified to produce set-up boxes.
Major customers are Samsung, LG, Gionee, Panasonic, Karbonn.
Home Appliances
It designs and manufactures washing machines, including 6-10kg range of semi-automatic versions.
Operating profit increased 25% YoY in FY20 to Rs.461 mn, aided by cost control measures.
Subdued market conditions in H2FY20 resulted in large inventory for customers, which led to weak order booking.
Manufacturing of fully automatic washing machines is set to commence at the new Tirupati plant by Nov’20.
Major customers are Samsung, Godrej, Panasonic, Lloyd, Flipkart, Haier, Voltas-Beko, Reliance, etc.
Security Surveillance Systems
This segment was launched in 2018 and the company manufactures CCTVs and DVRs.
September 08, 2020 6
The company had entered into a JV with Aditya Infotech Ltd. in 2017 for manufacturing of security devices like CCTV, IP cameras and DVR. The “CP Plus” trademark is owned by Aditya Infotech Ltd., which has a market share of ~24%.
100% of the production is under OEM model for all major brands.
Operating profit increased 497% YoY in FY20 to Rs.72 mn.
The business was under some pressure due to its discretionary nature.
The shift in technology from analog camera to IP cameras should help the company improve margins in this segment.
Reverse Logistics
It provides repair and refurbishment services for various products under this segment. The products for which these services are provided include set top boxes, mobile phones, LCD & LED TVs, LED panels, currency-counting machines and PoS terminals.
This business is strategic in nature, to enhance stickiness with customers by providing them end-to-end solutions.
Operating profit increased 254% YoY in FY20 to Rs.26 mn.
The business turnaround happened on account of a strategic partnership with a leading TV brand for refurbishment and panel repairs.
It is in talks with major brands for providing services for the export market in the near term.
Profit and Loss Analysis Revenues grew 47.4% YoY in FY20 to Rs.44,001 mn led by good performance of
the consumer electronics segment.
Revenues from two customers of the group represented ~49.6% of the group’s total revenue.
Gross margins fell from 12.6% in FY19 to 12.3% in FY20.
EBITDA grew 62.5% YoY in FY20 to Rs.2,283 mn.
EBITDA margin improved by 55 bps YoY in FY20 to 5.07% on the back of operating leverage.
PAT grew 90.4% YoY in FY20 to Rs.1,205 mn, aided by lower tax rate.
PAT margin improved 64 bps YoY in FY20 to 2.74%.
Employee cost increased 40.6% YoY in FY20 to Rs.1,180 mn.
Other expenses increased 27.1% YoY in FY20 to Rs.1,989 mn. ~85% of this increase is attributed to increase in contractor wages, which stood at Rs.1,086 mn in FY20.
Effective tax rate decreased from 32.5% in FY19 to 23.1% in FY20.
September 08, 2020 7
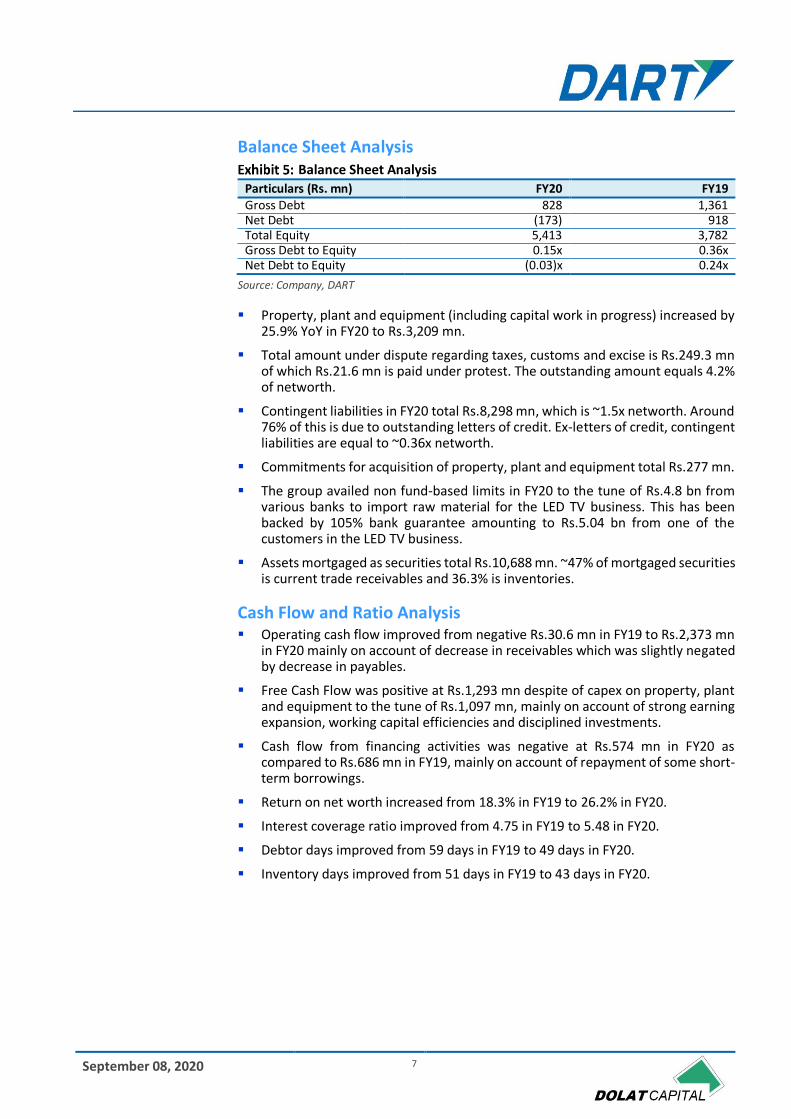
Balance Sheet Analysis Balance Sheet Analysis
Particulars (Rs. mn) FY20 FY19 Gross Debt 828 1,361 Net Debt (173) 918 Total Equity 5,413 3,782 Gross Debt to Equity 0.15x 0.36x Net Debt to Equity (0.03)x 0.24x
Source: Company, DART
Property, plant and equipment (including capital work in progress) increased by 25.9% YoY in FY20 to Rs.3,209 mn.
Total amount under dispute regarding taxes, customs and excise is Rs.249.3 mn of which Rs.21.6 mn is paid under protest. The outstanding amount equals 4.2% of networth.
Contingent liabilities in FY20 total Rs.8,298 mn, which is ~1.5x networth. Around 76% of this is due to outstanding letters of credit. Ex-letters of credit, contingent liabilities are equal to ~0.36x networth.
Commitments for acquisition of property, plant and equipment total Rs.277 mn.
The group availed non fund-based limits in FY20 to the tune of Rs.4.8 bn from various banks to import raw material for the LED TV business. This has been backed by 105% bank guarantee amounting to Rs.5.04 bn from one of the customers in the LED TV business.
Assets mortgaged as securities total Rs.10,688 mn. ~47% of mortgaged securities is current trade receivables and 36.3% is inventories.
Cash Flow and Ratio Analysis Operating cash flow improved from negative Rs.30.6 mn in FY19 to Rs.2,373 mn
in FY20 mainly on account of decrease in receivables which was slightly negated by decrease in payables.
Free Cash Flow was positive at Rs.1,293 mn despite of capex on property, plant and equipment to the tune of Rs.1,097 mn, mainly on account of strong earning expansion, working capital efficiencies and disciplined investments.
Cash flow from financing activities was negative at Rs.574 mn in FY20 as compared to Rs.686 mn in FY19, mainly on account of repayment of some short-term borrowings.
Return on net worth increased from 18.3% in FY19 to 26.2% in FY20.
Interest coverage ratio improved from 4.75 in FY19 to 5.48 in FY20.
Debtor days improved from 59 days in FY19 to 49 days in FY20.
Inventory days improved from 51 days in FY19 to 43 days in FY20.
September 08, 2020 8
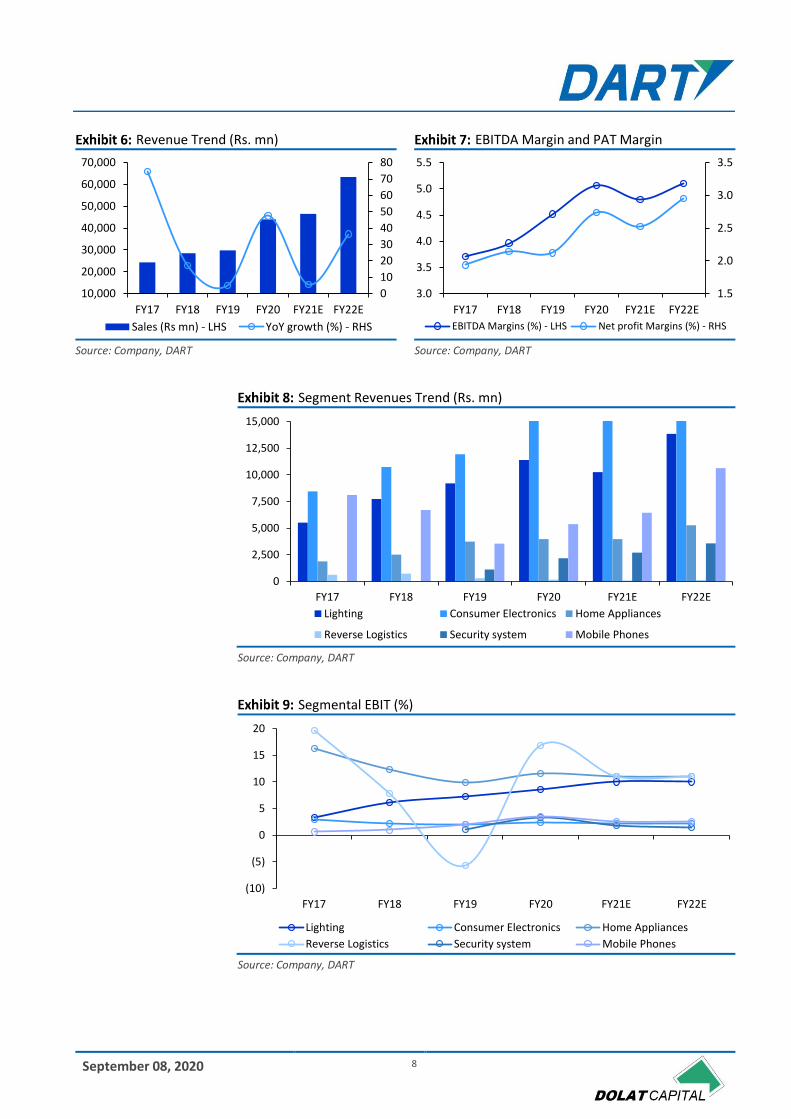
Revenue Trend (Rs. mn) EBITDA Margin and PAT Margin
Source: Company, DART Source: Company, DART
Segment Revenues Trend (Rs. mn)
Source: Company, DART
Segmental EBIT (%)
Source: Company, DART
0
10
20
30
40
50
60
70
80
10,000
20,000
30,000
40,000
50,000
60,000
70,000
FY17 FY18 FY19 FY20 FY21E FY22E
Sales (Rs mn) - LHS YoY growth (%) - RHS
1.5
2.0
2.5
3.0
3.5
3.0
3.5
4.0
4.5
5.0
5.5
FY17 FY18 FY19 FY20 FY21E FY22E
EBITDA Margins (%) - LHS Net profit Margins (%) - RHS
0
2,500
5,000
7,500
10,000
12,500
15,000
FY17 FY18 FY19 FY20 FY21E FY22E
Lighting Consumer Electronics Home Appliances
Reverse Logistics Security system Mobile Phones
(10)
(5)
0
5
10
15
20
FY17 FY18 FY19 FY20 FY21E FY22E
Lighting Consumer Electronics Home Appliances
Reverse Logistics Security system Mobile Phones
September 08, 2020 9
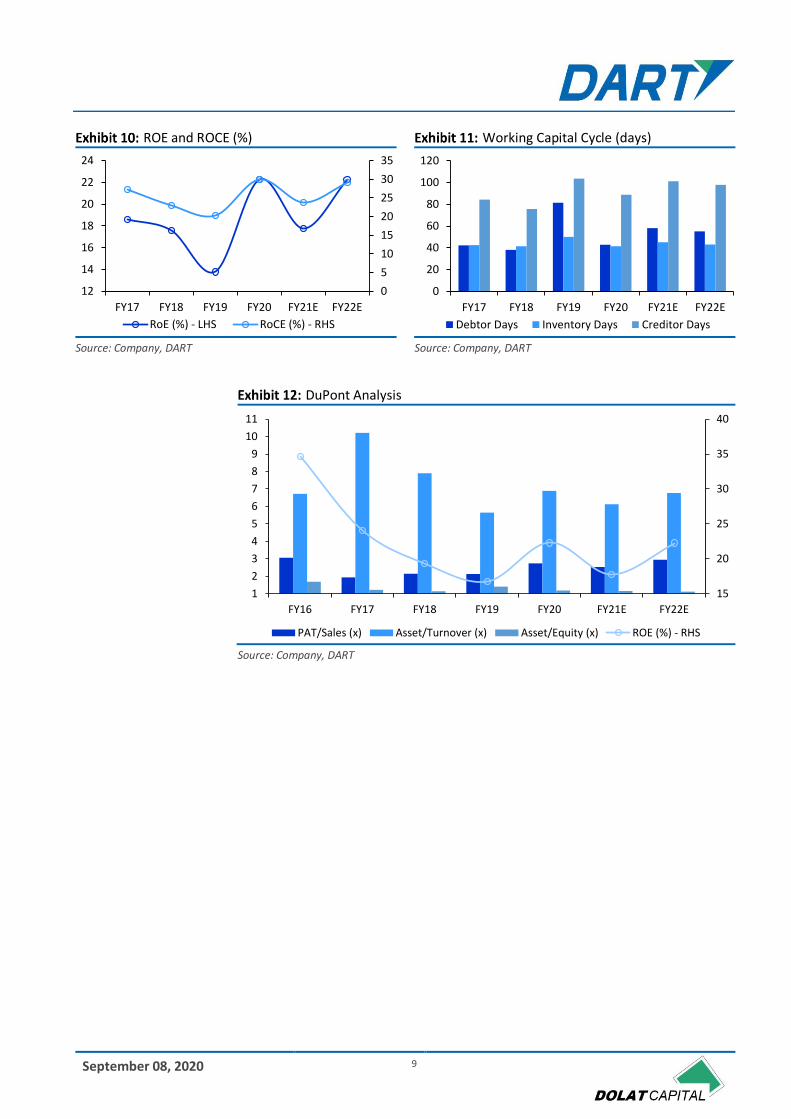
ROE and ROCE (%) Working Capital Cycle (days)
Source: Company, DART Source: Company, DART
DuPont Analysis
Source: Company, DART
0
5
10
15
20
25
30
35
12
14
16
18
20
22
24
FY17 FY18 FY19 FY20 FY21E FY22E
RoE (%) - LHS RoCE (%) - RHS
0
20
40
60
80
100
120
FY17 FY18 FY19 FY20 FY21E FY22E
Debtor Days Inventory Days Creditor Days
15
20
25
30
35
40
1
2
3
4
5
6
7
8
9
10
11
FY16 FY17 FY18 FY19 FY20 FY21E FY22E
PAT/Sales (x) Asset/Turnover (x) Asset/Equity (x) ROE (%) - RHS
September 08, 2020 10
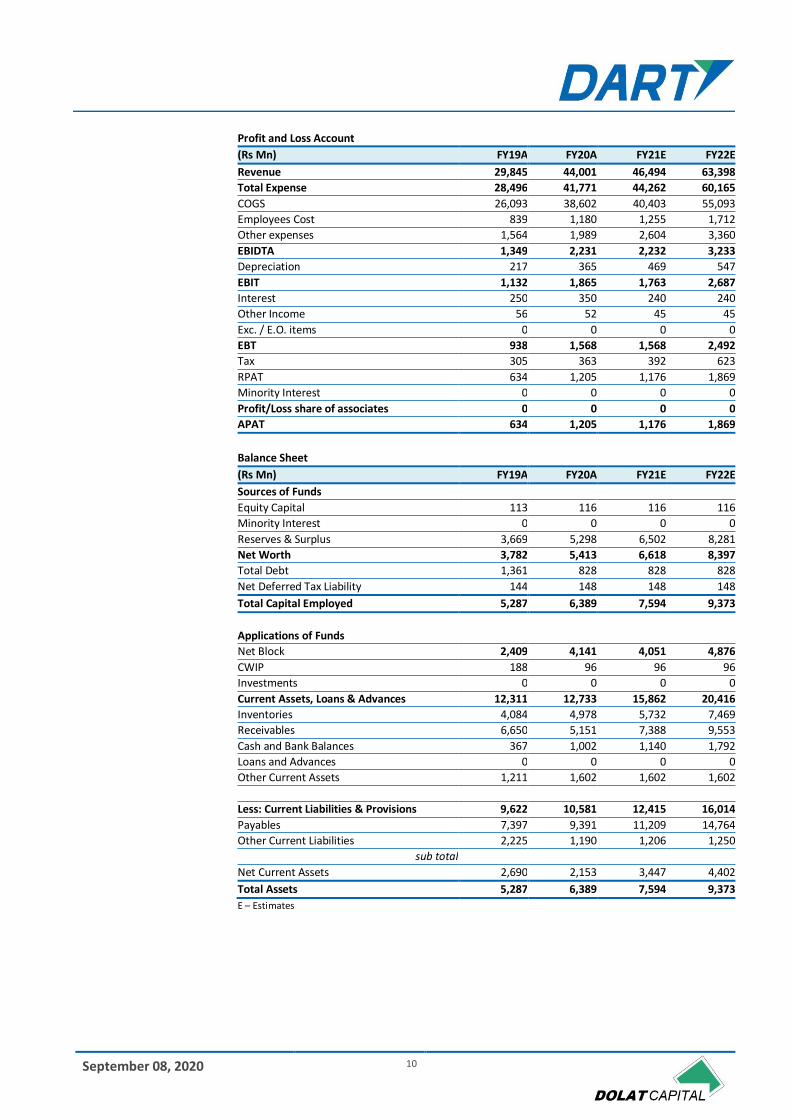
Profit and Loss Account
(Rs Mn) FY19A FY20A FY21E FY22E
Revenue 29,845 44,001 46,494 63,398
Total Expense 28,496 41,771 44,262 60,165
COGS 26,093 38,602 40,403 55,093
Employees Cost 839 1,180 1,255 1,712
Other expenses 1,564 1,989 2,604 3,360
EBIDTA 1,349 2,231 2,232 3,233
Depreciation 217 365 469 547
EBIT 1,132 1,865 1,763 2,687
Interest 250 350 240 240
Other Income 56 52 45 45
Exc. / E.O. items 0 0 0 0
EBT 938 1,568 1,568 2,492
Tax 305 363 392 623
RPAT 634 1,205 1,176 1,869
Minority Interest 0 0 0 0
Profit/Loss share of associates 0 0 0 0
APAT 634 1,205 1,176 1,869
Balance Sheet
(Rs Mn) FY19A FY20A FY21E FY22E
Sources of Funds
Equity Capital 113 116 116 116
Minority Interest 0 0 0 0
Reserves & Surplus 3,669 5,298 6,502 8,281
Net Worth 3,782 5,413 6,618 8,397
Total Debt 1,361 828 828 828
Net Deferred Tax Liability 144 148 148 148
Total Capital Employed 5,287 6,389 7,594 9,373
Applications of Funds
Net Block 2,409 4,141 4,051 4,876
CWIP 188 96 96 96
Investments 0 0 0 0
Current Assets, Loans & Advances 12,311 12,733 15,862 20,416
Inventories 4,084 4,978 5,732 7,469
Receivables 6,650 5,151 7,388 9,553
Cash and Bank Balances 367 1,002 1,140 1,792
Loans and Advances 0 0 0 0
Other Current Assets 1,211 1,602 1,602 1,602
Less: Current Liabilities & Provisions 9,622 10,581 12,415 16,014
Payables 7,397 9,391 11,209 14,764
Other Current Liabilities 2,225 1,190 1,206 1,250
sub total
Net Current Assets 2,690 2,153 3,447 4,402
Total Assets 5,287 6,389 7,594 9,373
E – Estimates

September 08, 2020 11
Important Ratios
Particulars FY19A FY20A FY21E FY22E
(A) Margins (%)
Gross Profit Margin 12.6 12.3 13.1 13.1
EBIDTA Margin 4.5 5.1 4.8 5.1
EBIT Margin 3.8 4.2 3.8 4.2
Tax rate 32.5 23.1 25.0 25.0
Net Profit Margin 2.1 2.7 2.5 2.9
(B) As Percentage of Net Sales (%)
COGS 87.4 87.7 86.9 86.9
Employee 2.8 2.7 2.7 2.7
Other 5.2 4.5 5.6 5.3
(C) Measure of Financial Status
Gross Debt / Equity 0.4 0.2 0.1 0.1
Interest Coverage 4.5 5.3 7.3 11.2
Inventory days 50 41 45 43
Debtors days 81 43 58 55
Average Cost of Debt 28.3 32.0 29.0 29.0
Payable days 90 78 88 85
Working Capital days 33 18 27 25
FA T/O 12.4 10.6 11.5 13.0
(D) Measures of Investment
AEPS (Rs) 56.1 106.6 104.0 165.4
CEPS (Rs) 75.2 139.0 145.5 213.7
DPS (Rs) 2.0 5.3 4.3 6.8
Dividend Payout (%) 3.6 5.0 4.1 4.1
BVPS (Rs) 334.7 479.1 585.7 743.1
RoANW (%) 18.3 26.2 19.5 24.9
RoACE (%) 19.9 26.6 20.3 24.9
RoAIC (%) 28.0 36.2 29.8 38.3
(E) Valuation Ratios
CMP (Rs) 8920 8920 8920 8920
P/E 159.1 83.6 85.7 53.9
Mcap (Rs Mn) 1,00,797 1,00,797 1,00,797 1,00,797
MCap/ Sales 3.4 2.3 2.2 1.6
EV 1,01,791 1,00,624 1,00,485 99,834
EV/Sales 3.4 2.3 2.2 1.6
EV/EBITDA 75.5 45.1 45.0 30.9
P/BV 26.7 18.6 15.2 12.0
Dividend Yield (%) 0.0 0.1 0.0 0.1
(F) Growth Rate (%)
Revenue 5.0 47.4 5.7 36.4
EBITDA 19.7 65.4 0.0 44.9
EBIT 16.1 64.8 (5.5) 52.4
PBT 6.3 67.1 0.0 58.9
APAT 4.0 90.2 (2.4) 58.9
EPS 4.0 90.2 (2.4) 58.9
Cash Flow
(Rs Mn) FY19A FY20A FY21E FY22E
CFO 108 3,579 806 2,339
CFI (863) (2,005) (379) (1,371)
CFF 681 (940) (288) (317)
FCFF (755) 1,575 427 968
Opening Cash 441 367 1,002 1,140
Closing Cash 367 1,002 1,140 1,792
E – Estimates
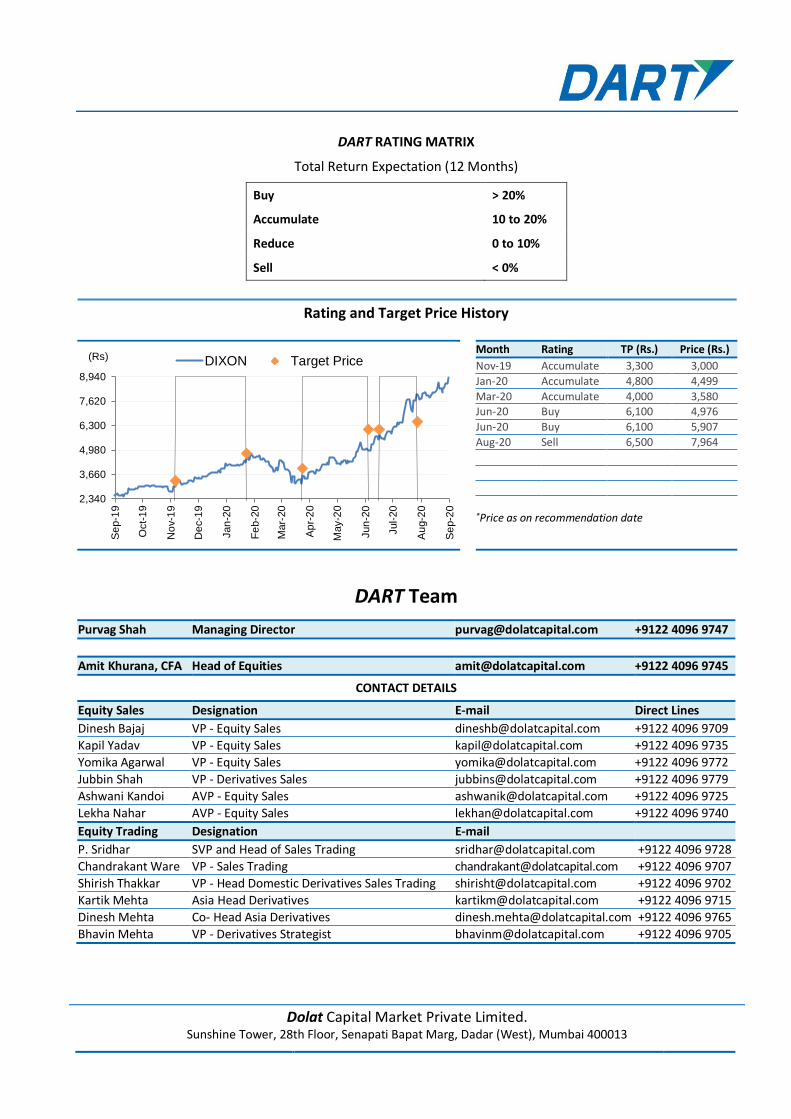
DART RATING MATRIX
Total Return Expectation (12 Months)
Buy > 20%
Accumulate 10 to 20%
Reduce 0 to 10%
Sell < 0%
Rating and Target Price History
Month Rating TP (Rs.) Price (Rs.)
Nov-19 Accumulate 3,300 3,000
Jan-20 Accumulate 4,800 4,499
Mar-20 Accumulate 4,000 3,580 Jun-20 Buy 6,100 4,976
Jun-20 Buy 6,100 5,907
Aug-20 Sell 6,500 7,964
*Price as on recommendation date
DART Team
Purvag Shah Managing Director [email protected] +9122 4096 9747
Amit Khurana, CFA Head of Equities [email protected] +9122 4096 9745
CONTACT DETAILS
Equity Sales Designation E-mail Direct Lines
Dinesh Bajaj VP - Equity Sales [email protected] +9122 4096 9709
Kapil Yadav VP - Equity Sales [email protected] +9122 4096 9735
Yomika Agarwal VP - Equity Sales [email protected] +9122 4096 9772
Jubbin Shah VP - Derivatives Sales [email protected] +9122 4096 9779
Ashwani Kandoi AVP - Equity Sales [email protected] +9122 4096 9725
Lekha Nahar AVP - Equity Sales [email protected] +9122 4096 9740
Equity Trading Designation E-mail
P. Sridhar SVP and Head of Sales Trading [email protected] +9122 4096 9728
Chandrakant Ware VP - Sales Trading [email protected] +9122 4096 9707
Shirish Thakkar VP - Head Domestic Derivatives Sales Trading [email protected] +9122 4096 9702
Kartik Mehta Asia Head Derivatives [email protected] +9122 4096 9715
Dinesh Mehta Co- Head Asia Derivatives [email protected] +9122 4096 9765
Bhavin Mehta VP - Derivatives Strategist [email protected] +9122 4096 9705
2,340
3,660
4,980
6,300
7,620
8,940
Se
p-1
9
Oct-
19
No
v-1
9
De
c-1
9
Jan
-20
Fe
b-2
0
Mar-
20
Ap
r-2
0
May-2
0
Jun
-20
Jul-
20
Au
g-2
0
Se
p-2
0
(Rs) DIXON Target Price
Dolat Capital Market Private Limited. Sunshine Tower, 28th Floor, Senapati Bapat Marg, Dadar (West), Mumbai 400013

Our Research reports are also available on Reuters, Thomson Publishers, DowJones and Bloomberg (DCML <GO>)
Analyst(s) Certification The research analyst(s), with respect to each issuer and its securities covered by them in this research report, certify that: All of the views expressed in this research report accurately reflect his or her or their personal views about all of the issuers and their securities; and No part of his or her or their compensation was, is, or will be directly or indirectly related to the specific recommendations or views expressed in this research report.
I. Analyst(s) and Associate (S) holding in the Stock(s): (Nil)
II. Disclaimer: This research report has been prepared by Dolat Capital Market Private Limited. to provide information about the company(ies) and sector(s), if any, covered in the report and may be distributed by it and/or its affiliated company(ies) solely for the purpose of information of the select recipient of this report. This report and/or any part thereof, may not be duplicated in any form and/or reproduced or redistributed without the prior written consent of Dolat Capital Market Private Limited. This report has been prepared independent of the companies covered herein. Dolat Capital Market Private Limited. and its affiliated companies are part of a multi-service, integrated investment banking, brokerage and financing group. Dolat Capital Market Private Limited. and/or its affiliated company(ies) might have provided or may provide services in respect of managing offerings of securities, corporate finance, investment banking, mergers & acquisitions, financing or any other advisory services to the company(ies) covered herein. Dolat Capital Market Private Limited. and/or its affiliated company(ies) might have received or may receive compensation from the company(ies) mentioned in this report for rendering any of the above services. Research analysts and sales persons of Dolat Capital Market Private Limited. may provide important inputs to its affiliated company(ies) associated with it. While reasonable care has been taken in the preparation of this report, it does n ot purport to be a complete description of the securities, markets or developments referred to herein, and Dolat Capital Market Private Limited. does not warrant its accuracy or completeness. Dolat Capital Market Private Limited. may not be in any way responsible for any loss or damage that may arise to any person from any inadvertent error in the information contained in this report. This report is provided for information only and is not an inv estment advice and must not alone be taken as the basis for an investment decision. The investment discussed or views expressed herein may not be suitable for all investors. The user assumes the entire risk of any use made of this information. The information contained herein may be changed without notice a nd Dolat Capital Market Private Limited. reserves the right to make modifications and alterations to this statement as they may deem fit from time to time. Dolat Capital Market Private Limited. and its affiliated company(ies), their directors and employees may; (a) from time to time, have a long or short position in, and buy or sell the securities of the company(ies) mentioned herein or (b) be engaged in any other transaction involving such securities and earn brokerage or other compensation or act as a market maker in the financial instruments of the company(ies) discussed herein or act as an advisor or lender/borrower to such company(ies) or may have any other potential conflict of interests with respect to any recommendation and other related information and opinions. This report is neither an offer nor solicitation of an offer to buy and/or sell any securities mentioned herein and/or not an official confirmation of any transaction. This report is not directed or intended for distribution to, or use by any person or entity who is a citizen or resident of or located in any locality, state, country or other jurisdiction, where such distribution, publication, availability or use would be contrary to law, regulation or which would subject Dolat Capital Market Private Limited. and/or its affiliated company(ies) to any registration or licensing requirement within such jurisdiction. The securities described herein may or may not be eligible for sale in all jurisdictions or to a certain category of investors. Persons in whose possession this report may come, are required to inform themselves of and to observe such restrictions.
For U.S. Entity/ persons only: This research report is a product of Dolat Capital Market Private Limited., which is the employer of the research analyst(s) who has prepared the research report. The research analyst(s) preparing the research report is/are resident outside the United States (U.S.) and are not associated persons of any U.S. regulated broker-dealer and therefore the analyst(s) is/are not subject to supervision by a U.S. broker-dealer, and is/are not required to satisfy the regulatory licensing requirements of FINRA or required to otherwise comply with U.S. rules or reg ulations regarding, among other things, communications with a subject company, public appearances and trading securities held by a research analyst account.
This report is intended for distribution by Dolat Capital Market Private Limited. only to "Major Institutional Investors" as defined by Rule 15a-6(b)(4) of the U.S. Securities and Exchange Act, 1934 (the Exchange Act) and interpretations thereof by U.S. Securities and Exchange Commission (SEC) in reliance on Rule 15a 6(a)(2). If the recipient of this report is not a Major Institutional Investor as specified above, then it should not act upon this report and return the same to the sender. Further, this report may not be copied, duplicated and/or transmitted onward to any U.S. person or entity.
In reliance on the exemption from registration provided by Rule 15a-6 of the Exchange Act and interpretations thereof by the SEC in order to conduct certain business with Major Institutional Investors, Dolat Capital Market Private Limited. has entered into an agreement with a U.S. registered broker-dealer Ltd Marco Polo Securities Inc. ("Marco Polo"). Transactions in securities discussed in this research report should be effected through Marco Polo or another U.S. registered broker dealer/Entity as informed by Dolat Capital Market Private Limited. from time to time.
Dolat Capital Market Private Limited.
Corporate Identity Number: U65990DD1993PTC009797 Member: BSE Limited and National Stock Exchange of India Limited.
SEBI Registration No: BSE - INB010710052 & INF010710052, NSE - INB230710031& INF230710031, Research: INH000000685 Registered office: Office No. 141, Centre Point, Somnath, Daman – 396 210, Daman & Diu
Board: +9122 40969700 | Fax: +9122 22651278 | Email: [email protected] | www.dolatresearch.com