dna-methylation patterns in cotton (gossypium … · 2018 january edition | | innovative...
TRANSCRIPT

2018 January Edition |www.jbino.com | Innovative Association
J.Bio.Innov7 (1), pp: 96-113, 2018 |ISSN 2277-8330 (Electronic)
Basel Saleh
DNA-METHYLATION PATTERNS IN COTTON (GOSSYPIUM HIRSUTUM L.) UNDER SALT STRESS
Basel Saleh
Department of Molecular Biology and Biotechnology, Atomic Energy Commission of Syria, P.O. Box 6091,
Damascus, Syria.
(Received on Date: 16 December 2017 Date of Acceptance:20 January 2018)
ABSTRACT
Coupled Restriction Enzyme Digestion-Random Amplification (CRED-RA) technique was
employed to assess DNA methylation patterns induced into four cotton varieties under salt
stress. Two salt-tolerant [(Niab78 (N78) and Deir-Ezzor22 (DE22)] and two salt-sensitive
[Deltapine50 (DP50) and Aleppo118 (A118)] cotton varieties exposed to 0 (control) and 200
mM NaCl (stressed) for 7 weeks. Data presented herein mentioned that, salinity induced
variation in DNA methylation profile among the 4 tested cotton varieties. Salt-tolerant
varieties exhibited highest methylation level compared to sensitive one. In this respect, the
highest methylated bands (MB) (35 and 36 bands) number, hemi-methylation ratio% (17 and
15%), full methylation ratio% (10 and 8%) and methylation ratio% (32 and 31%) were recorded
into DE22 followed by N78 salt–tolerant variety for control and treated plants, respectively.
However, the two salt-sensitive varieties showed the lowest values regarding the previous
parameters. Data presented herein revealed that, MB and methylation ratio% could be
served as useful parameters to detect DNA epigenetic changes induced by salt stress in
plants breeding program. Therefore, CRED-RA technique could be considered as a potential
tool to study epigenetic mechanisms for salinity tolerance screening in cotton.
Keywords: DNA-methylation, Cotton, CRED-RA technique, Salt stress.
No: of Tables: 6 No: of Figures: 1 No: of References: 31

2018 January Edition |www.jbino.com | Innovative Association
J.Bio.Innov7 (1), pp: 96-113, 2018 |ISSN 2277-8330 (Electronic)
Basel Saleh
INTRODUCTION
Cotton is one of few economic important
fiber crops cultivated worldwide.
According to recent reports 2014/15, world
cotton cultivated area recorded to be
33.83 million hectares of which Syria
occupied 0.06 million hectares; with
estimated cotton Syrian production of
65000 metric tons (USDA 2015). Salinity is
one of the most serious and biggest
problems in Mediterranean region. It has
demonstrated that, approximately 50% of
irrigated soil in Syria suffers from salinity
which caused the departure of vast areas
of agricultural lands from the scope of
investment (Saleh 2012a).Overall, when
plants grow in unfavorable environmental
conditions e.g. salt stress, they develop
different mechanisms to escape their
exposure to this constraint. In this respect,
they tend to minimize their life cycle or to
induce DNA methylation process in order
to avoid the stress harmful effects
(Dyachenko et al., 2006; Yaish 2013). DNA
methylation as an epigenetic DNA
changes has been discovered too earlier
for the first time by Avery et al. (1944), and
could play an essential role in genes
expression regulation.DNA methylation has
a potential value in plant breeding
program. This importance could be
manifested by: agricultural traits improving
e.g. flowering time, plant height (Fieldes et
al., 2005), creating of new materials for
plants breeding e.g. in Brassica oleracea
(Salmon et al., 2008) and in cotton
(Gosspium hirsutum L.) (Keyte et al., 2006).
The DNA methylation advantages I) could
be inherited for several generations
(Kakutani 2002) even for hundreds years; II)
It is reversible phenomena e.g. DNA
methylation variation in white clover and
hemp plants are similar before and after
metal stress (Aina et al., 2004). Yaish et al.
(2013) reported that abiotic stress caused
alteration in few genes expression e.g.
induction of some modified histones as
affected by DNA methylation, leading to
stress tolerance enhancement. Labra et al.
(2002) and Guangyuan et al. (2007)
reported that 10-1000 mM NaCl may cause
not alteration in DNA methylation, but also
DNA mutation. Similar findings have also
been demonstrated in rape )Brassica
napus L.( exposed to potassium
dichromate (Labra et al., 2004).
Previously, Tsaftaris et al. (2000),
investigated expression of 35 genes
between hybrids and their respective
parents using HPLC chromatography and
CRED-RA techniques. The previous study
mentioned DNA methylation differences
among the different genotypes may be
linked to hybrid vigor. Zhong and Wang
(2007) reported that CRED-RA technique
could be successfully used for salinity
tolerance screening in wheat (Triticum
aestivum L.), where wheat salt-sensitive
variety had a lowest DNA methylation level
than the salt-tolerant one.Zhong et al.
(2009) applied methylation-sensitive
amplified polymorphism (MSAP) technique
to investigate DNA methylation induced by
NaCl in two wheat (T. aestivum L.) cultivars
differed in their salinity tolerance. The
previous study revealed DNA methylation
changes in stressed plants compared to
their reference control. Where, CCGG
2018 January Edition |www.jbino.com | Innovative Association
J.Bio.Innov7 (1), pp: 96-113, 2018 |ISSN 2277-8330 (Electronic)
Basel Saleh
sequences was more methylated in control
salt tolerant cultivar compared to other
tested sensitive one. It has been indicated
also that, these alterations could be served
as a useful mechanism in plant salt
tolerance. Whereas, Peng and Zhang
(2009) reported different DNA methylation
patterns induced by different abiotic
stresses (chilling, planting density, salt stress
and heavy metals….). The previous
investigation suggested that plants
adaptation via abiotic stress; and this
phenomena was heritable that arise in
response to stress. This phenomenon plays
an important role for salt tolerance
improving in plant breeding programs.
Indeed, Demirkiran et al. (2013) applied
the same technique to study barley
(Hordeum vulgare L. cv. Tokak) genetic
variation produced in vitro culture via salt
stress (0, 50 and 100 mM NaCl) for 20 days.
The previous study showed that, salinity
induced some genetic variations in root
DNA but not in shoot DNA. While, the
highest NaCl concentration lead to DNA
methylation variation especially in shoot.
Moreover, Marconi et al. (2013) used MSAP
tool to investigate the impact of salt stress
on DNA methylation changes in two B.
napus var. oleifera cultivars differ in their
salinity tolerance. The previous study
revealed that, DNA methylation increased
in sensitive-salt cultivar, while it decreases
in salt-tolerant one under 100 mmol/l NaCl.
Otherwise, 19 amplicons were polymorphic
linked to DNA alterations. Recently, Wang
et al. (2015) applied Methyl-Sensitive
Amplification Polymorphism (MSAP)
technique to investigate DNA methylation
patterns among 3 cotton accessions
differed in their salinity tolerance. Indeed,
Lu et al. (2015) used MSAP technique to
detect DNA methylation profiles between
2 cotton accessions differed in their salinity
tolerance.
It has been mentioned that CRED-RA
technique has been also employed for
other purposes e.g. Temel et al. (2008),
used this technique to investigate
epigenetic variability in callus culture of
barley (H. vulgare cv. Zafer-160). The
previous study revealed that, 16 RAPD
primers out of 20 RAPD tested primers
yielded 103 amplicons in mature embryos
of barley after 24 weeks. Whereas,
Sokolova et al. (2014), investigated the
impact of UV-C on DNA methylation in
corne seeds on their germination rate and
seedling resistance to UV-C stress. This study
showed that DNA methylation induced by
UV-C has different effects on previous
tested parameters. More recently, Sun et
al. (2015) investigated DNA methylation
profiles in maize hybrids and their parents.
The previous study showed that maize
parents exhibited highest total relative
methylation levels and higher number of
demethylation events compared to their
respective hybrids. As yet, few recent
researches focused on DNA methylation
patterns investigation towards salt stress in
cotton using MSAP technique (Wang et al.,
2015; Lu et al., 2015). To our knowledge of
the salinity tolerance in cotton cultivated in
Syria has been focused on physiological,
biochemical and molecular studies (Saleh
2012a; 2016). However, epigenetic effects
on cotton salinity tolerance based on

2018 January Edition |www.jbino.com | Innovative Association
J.Bio.Innov7 (1), pp: 96-113, 2018 |ISSN 2277-8330 (Electronic)
Basel Saleh
CRED-RA technique have not yet been
examined in detail. Thereby, CRED-RA
technique has been applied with the hope
for screening of different DNA bands which
differently methylated among 4 cotton
varieties differ in their salt tolerance
degree. So the current study focused on
DNA methylation patterns evaluation
within the same enzyme for each
examined variety separately on one hand.
On the other hand, to give overview
image about DNA methylation profiles
among different examined cotton
varieties. Genotyping variation among
these varieties in their salinity tolerance
level was previously assessed at
physiological, biochemical and genetic
levels.
MATERIALS AND METHODS
Plant materials and growth conditions
Four cultivated cotton (G. hirsutum L.)
varieties have been previously selected on
the basis of their wide range of tolerance
towards salinity [(Niab78 (N78) and Deir-
Ezzor22 (DE22) as salt-tolerant (Saleh
2012a); whereas; Deltapine50 (DP50) and
Aleppo118 (A118) as introduced salt-
sensitive varieties]. Seeds of upland cotton
(G. hirsutum L.) were provided by the
General Commission for Scientific
Agricultural Research of Syria (GCSAR).
Growth conditions and experiment design
were carried out in a greenhouse for 7
weeks (five replicates/treatment) as
previously described by Saleh (2012a).
Genomic DNA extraction
Plant genomic DNA was extracted from
cotton young leaves including the control
and stressed plants (200 mM NaCl) using
CTAB (cetyltrimethylammonium bromide)
protocol as previously described by Doyle
and Doyle (1987).
Leaves tissue (150 mg) were ground in
liquid nitrogen, the powder was transferred
to a 2 ml Eppendorf tube, mixed with 0.9 ml
of extraction buffer (100 mM Tris-HCl, pH
8.0, 1.4 M NaCl, 20 mM EDTA, 0.0018 ml β-
mercaptoethanol, 2% CTAB), and
incubated at 65°C for 20 min. DNA was
extracted with one volume of a
chloroform:isoamyl alcohol mix (24:1, v/v)
and centrifuged at 12,000 g for 10 min at
4°C. The aqueous phase was transferred to
a fresh tube, and the DNA was
precipitated with an equal volume of cold
isopropanol and kept at -20°C for 10 min.
Then centrifuged at 12,000 g for 10 min at
4°C, the supernatant was discarded; DNA
was then spooled out and washed with 1
M ammonium acetate and 100% ethanol.
The cleaned DNA pellet was air dried and
dissolved in 0.1 ml of 0.1x TE buffer (1 mM
Tris-HCl, 0.1 mM EDTA, pH 8.0). After
addition of 0.005 ml of RNase (10 mg/ml),
and incubation for 30 min at 37°C. DNA
concentration was quantified by DNA
Fluorimeter at 260/280 nm and adjusted to
final concentration of 10 pmol. DNA was
stored at -80°C until needed.
CRED-RA assay
CRED-RA technique based on potential of
HpaII and MspI restriction enzymes to
recognize the same cut sequence, but
with different restriction efficiency based
2018 January Edition |www.jbino.com | Innovative Association
J.Bio.Innov7 (1), pp: 96-113, 2018 |ISSN 2277-8330 (Electronic)
Basel Saleh
on the methylation status of the cytosine
residues. MspI and HpaII enzymes are
isoschizomers which differ in their CpG
sensitivity. Where, HpaII cannot cut, if the
inner cytosine is methylated while MspI
can. Thereby, HpaII was methylation
sensitive, while, MspI was methylation
insensitive one.One µg of genomic DNA for
each variety including control and stressed
plants was separately digested with HpaII
(ER0511, Fermentas) and MspI (ER0541,
Fermentas) restriction enzymes in final
volume of 0.02 ml according to
manufacturers’ recommendations. The
digested DNA was considered as DNA
template for PCR amplification with RAPD
primers. Where, 20 RAPD (17 primers
belonging to Operon Technologies Inc.,
USA, and 3 primers from the University of
British Columbia) (Table 1) were tested for
detection of DNA methylation patterns
induced into four cotton varieties under
salt stress. CRED-RA performed as the same
for RAPD marker as previously described by
Williams et al. (1990). The PCR products
were separated on a 1.8% ethidium
bromide-stained agarose gel (Bio-Rad) in
0.5xTBE buffer. Electrophoresis was
performed for 2-h at 85 V and visualized
with a UV transilluminator. Band sizes were
determined by comparison with a VC
100bp plus DNA Ladder (Vivantis).
DNA methylation patterns analysis
As previously reported, HpaII and MspI
isoschizomers could recognize CCGG sites
with differences DNA methylation sensitivity
(Yang et al., 2011). Thereby, different
bands patterns could be detected by
CRED-RA technique using digested DNA by
above enzyme, as template for PCR
amplification.
In this respect, three bands types could be
revealed using this technique: Type I: when
HpaII and MspI are active in methylation of
both strands (band presented in both
samples); Type II: when HpaII is sensitive
and MspI is inactive in methylation of both
strands (band presented in HpaII and
absent in MspI in both samples). While the
type III: when MspI is active and HpaII is not
sensitive to cytosine methylation (band
presented in MspI and absent in HpaII in
both samples) (Yang et al., 2011).
Consequently, the proved pattern could
be gave an image of DNA methylation
level. NaCl stress induced polymorphism
pattern included the appearance and
disappearance of some types of bands,
not only with each enzyme digestion within
the same individual; but also between
stressed plants compared to their
respective control for the same individual.
RESULTS AND DISCUSSION
DNA change patterns induced by NaCl
stress, within the same enzyme into the four
studied cotton varieties were presented in
Tables 2-5. Firstly, DNA epigenetic changes
induced by NaCl treatment within each
variety have been screened separately
(Tables 2-5). That could be allowed
somewhat to understand salinity tolerance
differences among the 4 tested cotton
varieties. Data obtained herein showed
DNA methylation alteration induced by
NaCl stress compared to their respective

2018 January Edition |www.jbino.com | Innovative Association
J.Bio.Innov7 (1), pp: 96-113, 2018 |ISSN 2277-8330 (Electronic)
Basel Saleh
control for each variety separately. One
RAPD primer (OPV03) of examined 20
RAPD primers gave (6 bands in total) no
polymorphic bands in the four studies
cotton varieties. Thereby, 19 RAPD primers
were used for screening DNA-methylation
patterns under salt stress of NaCl.
DNA epigenetic changes induced by NaCl
treatment between HpaII and MspI under
control and stress conditions, among the
four studied cotton varieties have been
investigated (Table 6). DNA methylation
change patterns yielded by CRED-RA with
UBC159 primer was illustrated in Figure 1.
Genetic modification as a critical indicator
could be manifested by DNA methylation.
Since, under normal conditions, 20-30% of
cytosine may be methylated in the nuclear
genome (Lu et al., 2015). However, plant
exposure to unfavorable conditions such
as salinity stress caused increasing in DNA
methylation degree (Wang et al., 2015).
DNA methylated bands under control and
stressed conditions in 4 cotton varieties
were evaluated between control and
treated plants within the same examined
enzyme for each variety and also between
HpaII compared to MspI profiles for the
same individual. Total bands (TB) yielded
by CRED-RA technique were estimated for
each variety. In this regards, estimated TB
number was in the following order of A118
˃ DP50 ˃ DE22 ˃ N78. Where, this value was
recorded to be 134 and 139 TB for A118
and found to be 99 and 97 for N78 with
HpaII and MspI, respectively.
Overall, salt tolerant varieties (N78 and
DE22) exhibited highest TB with HpaII
compared to MspI (Tables 2-3). Contrary
trends was observed in salt-sensitive (DP50
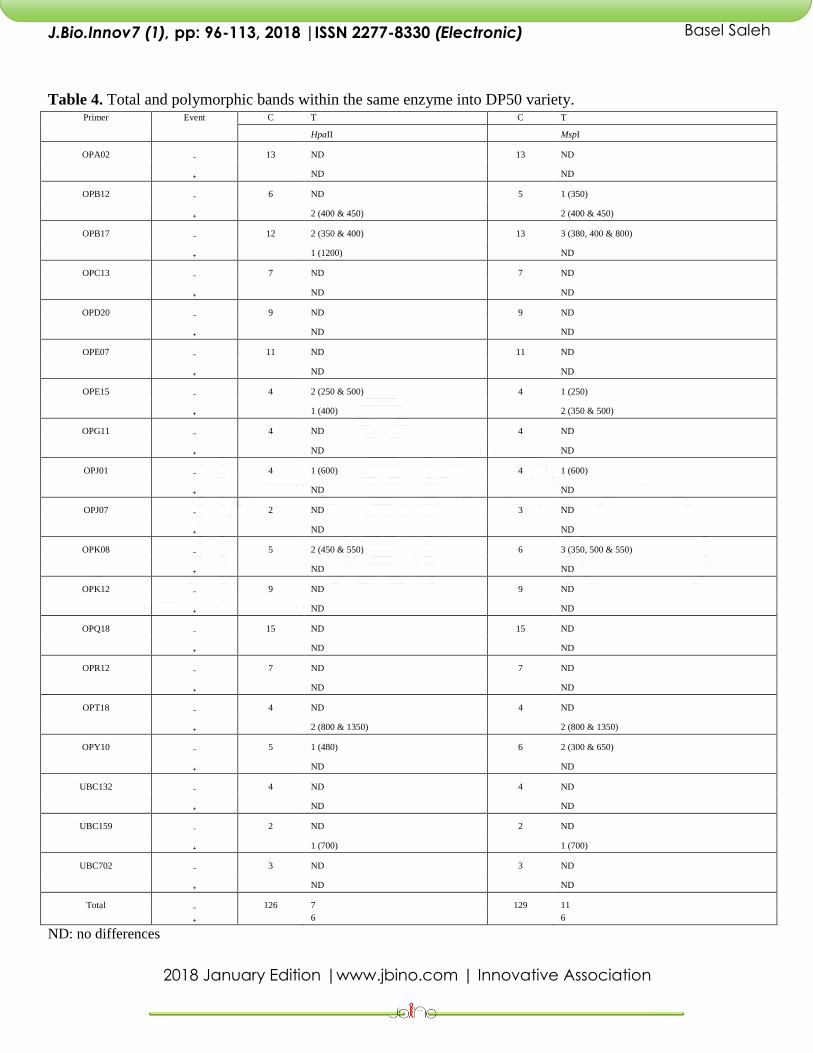
and A118) varieties (Tables 4-5).
As for the polymorphic bands (PB)
generated by CRED-RA technique,
between treated plants and their
respective control, they were also
screened. For N78 var. CRED-RA technique
produced 70 and 72 PB with HpaII
compared to MspI, respectively in treated
plants compared to their respective
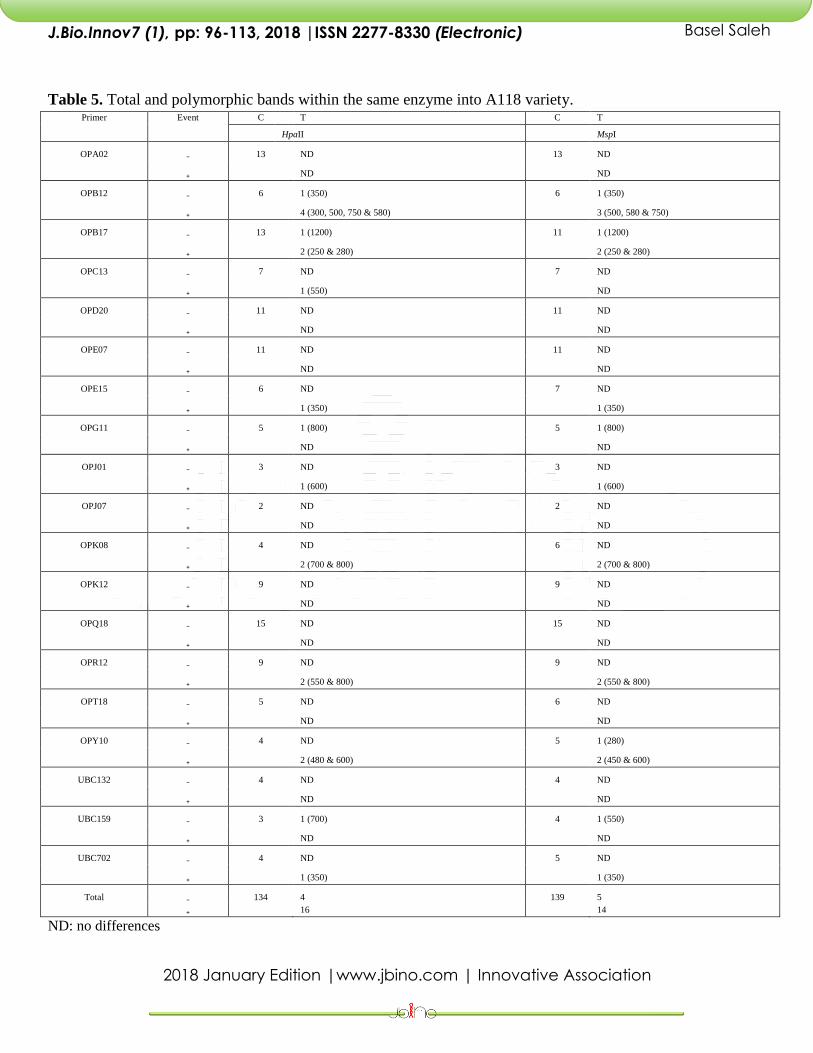
control. While, in A118 var. these values
were recorded to be 20 and 19 PB with
HpaII compared to MspI, respectively
(Tables 2, 5).It worth noting that, the salt-
tolerant varieties (N78 and DE22) exhibited
highest PB ratio than the salt-sensitive one.
In this regards, the polymorphism level (P%)
varied according to the tested variety and
salt stress conditions. Where, the highest P%
was recorded for N78 (70.7 and 74.2%),
followed by DE22 (53.2 and 63.6%) with
HpaII and MspI, respectively. While, the
lowest P% value was recorded for DP50
salt-sensitive var. (10.3 and 13.2%) followed
by A118 (14.9 and 13.7%) with HpaII and
MspI, respectively. Overall, in salt-tolerant
var. MspI treated plants exhibited highest
PB compared to HpaII. Indeed, treated
plants exhibited highest PB compared to
their respective control with both HpaII and
MspI enzymes.From data presented in
Tables 2-4, it worth noting that, examined
OPB12 primer gave the highest
polymorphic characteristic bands
compared to the other tested primers into
three cotton varieties (N78, DE22 and
A118) with 17, 16 and 8 PB,
respectively.Otherwise, Polymorphism
patterns of CRED-RA products after PCR

2018 January Edition |www.jbino.com | Innovative Association
J.Bio.Innov7 (1), pp: 96-113, 2018 |ISSN 2277-8330 (Electronic)
Basel Saleh
amplification between HpaII and MspI
were presented in different manners
according to the RAPD tested primers. All
over, in sensitive-salt varieties, MspI and
HpaII digestions amplified patterns were
mainly monomorphic in most case.
Comparative DNA methylation patterns
induced by NaCl treatment among the 4
studied cotton varieties have been carried
out. CRED-RA technique revealed different
patterns DNA methylation in both salt-
tolerant and salt-sensitive cotton varieties.
However, methylated bands number was
less in salt-sensitive than tolerant once
(Table 6). Where, salt-tolerant varieties
showed higher polymorphic DNA patterns
when the same sample cut with the two
examined enzymes HpaII and MspI in the
contrary, to salt-sensitive varieties. Thereby,
salt-tolerant varieties exhibited highest
methylated sits compared to the sensitive
once (Table 6). In this respect, the highest
methylated bands (MB) were recorded to
be 35 and 36 MB in DE22 followed by N78
with 15 and 19 MB for control and treated
plants, respectively. While, the lowest MB
were presented in salt-sensitive varieties of
DP50 and A118 control and treated plants.
Otherwise, methylation ratio% was also
higher in salt-tolerant varieties for both
control and treated plants than the
sensitive once. In this respect, DE22
exhibited the highest methylation ratio%
with 31.8 and 31.4%; followed by N78 with
14.9 and 17.6% for control and treated
plants, respectively. Overall, DE22 followed
by N78 var. exhibited highest total MB,
hemi-methylation ratio% and full
methylation ratio% than the other tested
sensitive one (Table 6). Our data were in
accordance with recent findings of Wang
et al. (2015) and Lu et al. (2015) in salt
tolerance screening in cotton using MSAP
technique. Wang et al. (2015) reported
that methylated loci were recorded to be
64.3% and 86.2% for CCRI35 salt-tolerant for
control and their respective cotton stressed
plants, respectively. Whereas, it was 71.4%
and 84.8% for Zhong07 salt-tolerant; and
75.8% and 68.1% for CCRI12 salt-sensitive
cotton accession for control and their
respective cotton stressed plants,
respectively. Whereas, Lu et al. (2015) used
also MSAP technique to detect DNA
methylation leaves patterns induced by
NaCl into two cotton varieties differ in their
salt stress tolerance. The previous
investigation revealed that Zhong07, a salt-
tolerant cotton variety exhibited more
demethylation than methylation loci using
MSAP technique. Whereas, ZhongS9612, a
salt-sensitive cotton variety showed
different tendency. This epigenetic
variation could be related to varietal
differences. The previous study showed
that total bands amplified were recorded
to be 341 and 307, total bands methylated
85 and 80, ratio of methylated bands 24.93
and 26.06% and full methylated ratio 20.82
and 20.85% for Zhong07 and ZhongS961,
respectively.
Thereby, the highest MB combined with
highest methylation ratio% recorded into
DE22 and N78 varieties could be explain
genotyping variation in their salinity
tolerance level compared to the other
tested varieties. This finding makes it
possible that MB, and methylation ratio%

2018 January Edition |www.jbino.com | Innovative Association
J.Bio.Innov7 (1), pp: 96-113, 2018 |ISSN 2277-8330 (Electronic)
Basel Saleh
could be served and considered as an
epigenetic marker for plants salinity
tolerance screening in plants breeding
program. Similar findings were reported in
salt-tolerant wheat (T. aestivum L.) (Zhong
and Wang 2007). Previously, Dyachenko et
al. (2006) reported that, plant DNA
methylation could be considered as one of
fewer mechanisms involved in plants salt
tolerance.Other recent investigation
however showed that, the lowest
estimated genomic template stability
(GTS%) values recorded for the two salt-
tolerant varieties (N78 and DE22) [Where,
GTS% was recorded to be 36.7, 26.4, 79.1
and 58.2% for N78, DE22, DP50 and A118
cotton varieties respectively exposed to
salt stress (0 and 200 mM NaCl for 7 weeks)
using the RAPD marker (Saleh 2016)] could
explain their salinity tolerance compared
to the other tested varieties.In Saleh
(2012b) investigation, AFLP analysis in
cotton revealed a level of polymorphism
(P%) of 50.569% using twenty-one AFLP PCs
primer combinations. Due to the narrow
genetic base of cotton germplasm that
cotton breeders have been utilizing and
low efficiency of traditional selection
methods, cultivar improvement in cotton
has slowed down in the past 10–15 years
(Saleh 2012b).
In the current study, it worth noting that,
increased P% within the same variety
under salt stress (NaCl) application
between control and treated plants in salt
tolerant varieties. This finding could be
reflected in the lowest estimated GTS%
value recorded for N78 and DE22 varieties
(Saleh 2016) compared to salt-sensitive
once. However, the lowest estimated GTS%
value recorded for N78 and DE22 varieties
could be related to genetic variability
getting new protein induction in relation to
salinity tolerance. Similarly, Yaish (2013)
reported that, DNA methylation under salt
stress conditions lead to individual gene
expression diversity of the same plant
species. Otherwise, salt-tolerant varieties
revealed increased in methylated sits in
treated plants compare to their respective
control. This could be explain by the fact
that, polymorphism in nucleotides
occurrence, lead to best recognition sits in
treated plants than their respective
control. This observation was in
accordance of Demirkiran et al. (2013) in
barley.

2018 January Edition |www.jbino.com | Innovative Association
J.Bio.Innov7 (1), pp: 96-113, 2018 |ISSN 2277-8330 (Electronic)
Basel Saleh
Figure 1. DNA methylation alteration patterns produced by CRED-RA with UBC159 primer in the four cotton tested
varieties under stressed conditions (200 mM NaCl) compare to their respective control. M: a VC 100bp plus DNA Ladder
(Vivantis).
(bp)
500
1000
3000
N78 DE22
DP50
A118
MspI HpaII
C T C T C T C T M
MspI HpaII MspI HpaII MspI HpaII MspI HpaII MspI HpaII MspI HpaII MspI HpaII

2018 January Edition |www.jbino.com | Innovative Association
J.Bio.Innov7 (1), pp: 96-113, 2018 |ISSN 2277-8330 (Electronic)
Basel Saleh
Table 1. Tested RAPD primers used in the current study in terms of primer sequence and G+C content (%).
Primer Nº Primer name Primer sequence 5'-3' G+C content (%)
1 OPA02 TGCCGAGCTG 70
2 OPB12 CCTTGACGCA 60
3 OPB17 AGGGAACGAG 60
4 OPC13 AAGCCTCGTC 60
5 OPD20 GGTCTACACC 60
6 OPE07 AGATGCAGCC 60
7 OPE15 ACGCACAACC 60
8 OPG11 TGCCCGTCGT 70
9 OPJ01 CCCGGCATAA 60
10 OPJ07 CCTCTCGACA 60
11 OPK08 GAACACTGGG 60
12 OPK12 TGGCCCTCAC 70
13 OPQ18 AGGCTGGGTG 70
14 OPR12 ACAGGTGCGT 60
15 OPT18 GATGCCAGAC 60
16 OPV03 CTCCCTGCAA 60
17 OPY10 CAAACGTGGG 60
18 UBC132 AGGGATCTCC 60
19 UBC159 GAGCCCGTAG 70
20 UBC702 GGGAGAAGGG 70

2018 January Edition |www.jbino.com | Innovative Association
J.Bio.Innov7 (1), pp: 96-113, 2018 |ISSN 2277-8330 (Electronic)
Basel Saleh
Table 2. Total and polymorphic bands within the same enzyme into N78 variety. Primer Event C T C T
HpaII MspI
OPA02 ₋ 11 5 (650, 900, 1100, 1550, 1850) 11 7 (400, 650, 900, 1100, 1350, 1850 & 2400)
₊ 3 (600 & 1500) 2 (600 & 1500)
OPB12 ₋ 5 5 (350, 650, 750, 900 & 1000) 5 3 (650, 750 & 1000)
₊ 5 (300, 400, 450, 600 & 800) 4 (400, 450, 600 & 850)
OPB17 ₋ 10 3 (300, 350 & 500) 11 4 (150, 300, 350 & 500)
₊ 2 (650 & 1200) 3 (650, 1200 & 1500)
OPC13 ₋ 5 1 (550) 4 ND
₊ 3 (600, 800 & 900) 3 (600, 800 & 900)
OPD20 ₋ 13 7 (350, 380, 400, 500, 700, 1500 & 2500) 11 5 (400, 500, 700, 1500 & 2500)
₊ 1 (550) 2 (350, 550)
OPE07 ₋ 6 1 (250) 6 1 (250)
₊ 2 (400 & 800) 2 (400 & 800)
OPE15 ₋ 3 ND 5 2 (300 & 550)
₊ 3 (350, 800 & 1000) 3 (350, 800 & 1000)
OPG11 ₋ 4 ND 4 ND
₊ 2 (400 & 700) 2 (400 & 700)
OPJ01 ₋ 3 ND 3 ND
₊ 2 (800 & 2000) 3 (600, 800 & 2000)
OPJ07 ₋ 2 ND 2 ND
₊ 1 (2000) ND
OPK08 ₋ 5 ND 4 ND
₊ 1 (700) 5 (450, 600, 700, 800 & 1500)
OPK12 ₋ 5 ND 3 ND
₊ 1 (500) 4 (350, 550, 600 & 700)
OPQ18 ₋ 7 2 (300 & 400) 7 2 (300 & 450)
₊ 2 (350 & 550) 2 (350 & 550)
OPR12 ₋ 2 ND 2 ND
₊ 3 (550, 700 & 800) 3 (550, 700 & 800)
OPT18 ₋ 4 ND 4 ND
₊ ND 1 (400)
OPY10 ₋ 4 2 (500 & 550) 5 1 (300)
₊ 6 (400, 450, 650, 700, 800 & 900) 5 (400, 650, 700, 800 & 900)
UBC132 ₋ 5 2 (200 & 600) 5 2 (200 & 600)
₊ 1 (650) 1 (650)
UBC159 ₋ 2 ND 2 ND
₊ 3 (700, 800 & 1200) 3 (700, 800 & 1200)
UBC702 ₋ 3 ND 3 1 (800)
₊ 6 (350, 500, 600, 800, 900 & 1200) 3 (350, 500 & 600)
Total ₋ 99 25 97 24
₊ 45 48
ND: no differences

2018 January Edition |www.jbino.com | Innovative Association
J.Bio.Innov7 (1), pp: 96-113, 2018 |ISSN 2277-8330 (Electronic)
Basel Saleh
Table 3. Total and polymorphic bands within the same enzyme into DE22 variety. Primer Event C T C T
HpaII MspI
OPA02 ₋ 15 4 (450, 550, 650 & 850) 15 4 (480, 650, 1000 & 1500)
₊ 1 (600) 1 (600)
OPB12 ₋ 7 4 (200, 450, 700 & 900) 5 4 (600, 700, 900 & 1000)
₊ 3 (350, 400 & 550) 5 (350, 400, 450, 550 & 800)
OPB17 ₋ 10 ND 8 2 (200 & 280)
₊ 4 (450, 480, 900 & 1100) 3 (600, 900 & 1100)
OPC13 ₋ 4 ND 4 ND
₊ 2 (600 & 800) 2 (600 & 800)
OPD20 ₋ 12 3 (900, 1500 & 2500) 13 5 (380, 400, 650, 1500 & 2500)
₊ 1 (550) 1 (550)
OPE07 ₋ 10 ND 10 1 (350)
₊ ND ND
OPE15 ₋ 10 3 (750, 1500 & 2000) 9 4 (600, 1500 & 2000)
₊ 3 (300, 400 & 500) 3 (350 & 400)
OPG11 ₋ 4 ND 4 ND
₊ 2 (400 & 600) 2 (400 & 600)
OPJ01 ₋ 3 ND 2 1 (450)
₊ 3 (600, 700 & 2000) 3 (550, 650 & 2000)
OPJ07 ₋ 3 1 (2000) 2 ND
₊ ND 1 (2000)
OPK08 ₋ 4 1 (250) 6 2 (250 & 300)
₊ 6 (450, 500, 550, 600, 700 & 800) 3 (450, 650 & 750)
OPK12 ₋ 8 1 (1200) 6 1 (400)
₊ ND 2 (500 &800)
OPQ18 ₋ 8 2 (900 & 1350) 9 1 (400)
₊ 2 (400 & 500) 1 (850)
OPR12 ₋ 7 3 (250, 350 & 600) 5 2 (2200 & 3000)
₊ 1 (550) 2 (550 & 900)
OPT18 ₋ 4 ND 4 ND
₊ 1 (1850) 1 (1850)
OPY10 ₋ 6 1 (250) 5 1 (500)
₊ 4 (400, 750, 800 & 900) 7 (300, 350, 400, 650, 750, 800 & 900)
UBC132 ₋ 5 2 (200 &600) 5 2 (200 &600)
₊ 1 (1500) 1 (1500)
UBC159 ₋ 3 ND 2 ND
₊ 5 (700, 850, 950, 1100 & 1200) 4 (700, 800, 1200 & 1500)
UBC702 ₋ 3 ND 4 ND
₊ 3 (350, 500 & 600) 4 ( 350, 600, 900 & 1100)
Total ₋ 126 25 118 30
₊ 42 45
ND: no differences
2018 January Edition |www.jbino.com | Innovative Association
J.Bio.Innov7 (1), pp: 96-113, 2018 |ISSN 2277-8330 (Electronic)
Basel Saleh
Table 4. Total and polymorphic bands within the same enzyme into DP50 variety. Primer Event C T C T
HpaII MspI
OPA02 ₋ 13 ND 13 ND
₊ ND ND
OPB12 ₋ 6 ND 5 1 (350)
₊ 2 (400 & 450) 2 (400 & 450)
OPB17 ₋ 12 2 (350 & 400) 13 3 (380, 400 & 800)
₊ 1 (1200) ND
OPC13 ₋ 7 ND 7 ND
₊ ND ND
OPD20 ₋ 9 ND 9 ND
₊ ND ND
OPE07 ₋ 11 ND 11 ND
₊ ND ND
OPE15 ₋ 4 2 (250 & 500) 4 1 (250)
₊ 1 (400) 2 (350 & 500)
OPG11 ₋ 4 ND 4 ND
₊ ND ND
OPJ01 ₋ 4 1 (600) 4 1 (600)
₊ ND ND
OPJ07 ₋ 2 ND 3 ND
₊ ND ND
OPK08 ₋ 5 2 (450 & 550) 6 3 (350, 500 & 550)
₊ ND ND
OPK12 ₋ 9 ND 9 ND
₊ ND ND
OPQ18 ₋ 15 ND 15 ND
₊ ND ND
OPR12 ₋ 7 ND 7 ND
₊ ND ND
OPT18 ₋ 4 ND 4 ND
₊ 2 (800 & 1350) 2 (800 & 1350)
OPY10 ₋ 5 1 (480) 6 2 (300 & 650)
₊ ND ND
UBC132 ₋ 4 ND 4 ND
₊ ND ND
UBC159 ₋ 2 ND 2 ND
₊ 1 (700) 1 (700)
UBC702 ₋ 3 ND 3 ND
₊ ND ND
Total ₋ 126 7 129 11
₊ 6 6
ND: no differences
2018 January Edition |www.jbino.com | Innovative Association
J.Bio.Innov7 (1), pp: 96-113, 2018 |ISSN 2277-8330 (Electronic)
Basel Saleh
Table 5. Total and polymorphic bands within the same enzyme into A118 variety. Primer Event C T C T
HpaII MspI
OPA02 ₋ 13 ND 13 ND
₊ ND ND
OPB12 ₋ 6 1 (350) 6 1 (350)
₊ 4 (300, 500, 750 & 580) 3 (500, 580 & 750)
OPB17 ₋ 13 1 (1200) 11 1 (1200)
₊ 2 (250 & 280) 2 (250 & 280)
OPC13 ₋ 7 ND 7 ND
₊ 1 (550) ND
OPD20 ₋ 11 ND 11 ND
₊ ND ND
OPE07 ₋ 11 ND 11 ND
₊ ND ND
OPE15 ₋ 6 ND 7 ND
₊ 1 (350) 1 (350)
OPG11 ₋ 5 1 (800) 5 1 (800)
₊ ND ND
OPJ01 ₋ 3 ND 3 ND
₊ 1 (600) 1 (600)
OPJ07 ₋ 2 ND 2 ND
₊ ND ND
OPK08 ₋ 4 ND 6 ND
₊ 2 (700 & 800) 2 (700 & 800)
OPK12 ₋ 9 ND 9 ND
₊ ND ND
OPQ18 ₋ 15 ND 15 ND
₊ ND ND
OPR12 ₋ 9 ND 9 ND
₊ 2 (550 & 800) 2 (550 & 800)
OPT18 ₋ 5 ND 6 ND
₊ ND ND
OPY10 ₋ 4 ND 5 1 (280)
₊ 2 (480 & 600) 2 (450 & 600)
UBC132 ₋ 4 ND 4 ND
₊ ND ND
UBC159 ₋ 3 1 (700) 4 1 (550)
₊ ND ND
UBC702 ₋ 4 ND 5 ND
₊ 1 (350) 1 (350)
Total ₋ 134 4 139 5
₊ 16 14
ND: no differences

2018 January Edition |www.jbino.com | Innovative Association
J.Bio.Innov7 (1), pp: 96-113, 2018 |ISSN 2277-8330 (Electronic)
Basel Saleh
Table 6. DNA methylation changes in the 4 tested cotton varieties under control and stressed conditions.
Type N78 DE22 DP50 A118
C T C T C T C T
I 86 112 98 118 130 124 132 154
II 4 13 22 23 3 3 8 5
III 11 6 13 13 2 9 1 5
Total amplified bands 101 131 133 154 135 136 141 164
Total methylated bands1 15 19 35 36 5 12 9 10
Hemi-methylation ratio2 (%) 3.960 9.924 16.541 14.935 2.222 2.206 5.674 3.049
Full methylation ratio3 (%) 10.891 4.580 9.774 8.442 1.481 6.618 0.709 3.049
Methylation ratio4 (%) 14.891 17.580 31.774 31.442 4.481 9.618 8.709 8.049
Type I: band presented in both samples; Type II: band presented in HpaII and absent in MspI in both samples; Type III: band presented in MspI and
absent in HpaII in both samples. 1Total methylated bands = II+III; 2Hemi-methylation ratio = II/I+II+III; 3Full methylation ratio = III/I +II+III; 4Methylation ratio = II+III/I+II+III.
Plants developed different protective
mechanisms against salt stress. Thereby,
DNA methylation could be considered as
one of fewer epigenetic mechanisms
regulating gene expression in salt stress
adaptation. In this regards, Zhong and
Wang (2007) reported that methylation
level was related to observed difference in
wheat salt tolerance. Where, the wheat
salt-tolerant exhibited higher DNA
methylation level compared to salt-
sensitive one after 10 days of salt stress
application. Otherwise, Zemach et al.
(2010) reported that DNA methylation is
usually caused inactivated gene
expression and vice versa. Indeed,
different genes involved in abtiotic stress
are methylated in different manners that
could suggest that methylation process
could play an important role in plants salt
stress adaptation.
Whereas, Karan et al. (2012) investigated
DNA methylation pattern induced by 150
mM NaCl in four rice genotypes differ in
their salinity tolerance level. The previous
study mentioned that no methylation
pattern was specific for salt or sensitive
genotypes. While, significant correlation
was observed between salt treatment and
methylation level in shoots into the four
tested genotypes. This finding was also
observed in root of only salt-sensitive one.
Indeed, Karan et al. (2012) reported that
the association between methylation
pattern variation and salt tolerance has
been observed only in some cases
suggesting that many methylation
modifications seem to be not ‘‘directed’’.
Overall, DNA methylation could be
appeared as one of fewer mechanisms
adopted by plants for enhancing their
salinity tolerance. Thus, the observed
differences in cotton salt tolerance among
the four examined cotton varieties could
be attributed to differences methylation
levels. These findings were coherent with

2018 January Edition |www.jbino.com | Innovative Association
J.Bio.Innov7 (1), pp: 96-113, 2018 |ISSN 2277-8330 (Electronic)
Basel Saleh
previous reports (Zhong and Wang 2007;
Peng and Zhang 2009).
CONCLUSION
DNA-methylation pattern was detected in
stressed cotton plants and their respective
control into 4 cotton varieties subjected to
0 and 200 mM NaCl for 7 weeks using
CRED-RA technique. Salt stress application
in cotton caused epigenetic variation. In
this regards, N78 and DE22 (salt-tolerant
varieties) exhibited highest DNA
methylation levels compared to sensitive
once (DP50 and A118 varieties). Data
observed in the current investigation
supported previous physiological,
biochemical and molecular studies carried
out in the same cotton varieties; especially,
the lowest estimated GTS% values
recorded for the two salt-tolerant varieties
(N78 and DE22) compared to the other
sensitive once. This observed variation
could be exploiting in plant breeding
program for improving salinity tolerance in
cotton germplasm.
ACKNOWLEDGEMENTS
I thank Professor Ibrahim Othman (director
general of AECS) and Professor Nizar MirAli
(head of Molecular Biology and
Biotechnology Department in AECS) for
their support, and also the Plant
Biotechnology Group for technical
assistance.
REFERENCES
Aina, R., Sgorbati, S., Santagostino, A.,
Labra, M., Ghiani, A. and Citterio, S. 2004.
Specific hypomethylation of DNA is
induced by heavy metals in white clover
and industrial hemp. Physiol. Plant., 121:
472–480.
Avery, O.T., Macleod, C.M. and McCarty,
M. 1944. Studies on the chemical nature of
the substance inducing transformation of
pneumococcal types: induction of
transformation by a desoxyribonucleic
acid fraction isolated from pneumococcus
type Iii. J. Exp. Med., 79: 137–158.
Demirkiran, A., Marakli, S., Temel, A. and
Gozukirmizi, N. 2013. Genetic and
epigenetic effects of salinity on in vitro
growth of barley. Genet. Mol. Biol., 36: 566-
570.
Doyle, J.J. and Doyle, J.L. 1987. A rapid
DNA isolation procedure for small
quantities of fresh leaf tissue. Phytochem.
Bull., 19: 11–15.
Dyachenko, O.V., Zakharchenko, N.S.,
Shevchuk, T.V., Bohnert, H.J., Cushman J.C.
and Buryanov, Y.I. 2006. Effect of
hypermethylation of CCWGG sequences
in DNA of Mesembryanthemum
crystallinum plants on their adaptation to
salt stress. Biochemistry (Moscow)., 71: 461–
465.
Fieldes, M.A., Schaeffer, S.M., Krech, M.J,
Brown, J.C. 2005. DNA hypomethylation in
2018 January Edition |www.jbino.com | Innovative Association
J.Bio.Innov7 (1), pp: 96-113, 2018 |ISSN 2277-8330 (Electronic)
Basel Saleh
5-azacytidine-induced early-flowering lines
of flax. Theor. Appl. Genet., 111: 136–49.
Guangyuan, L., Xiaoming, W., Biyun, C.,
Gao, G. and Kun, X. 2007. Evaluation of
genetic and epigenetic modification in
rape-seed (Brassica napus) induced by salt
stress. J. Integr. Plant. Biol., 49: 1599–1607.
Kakutani, T. 2002. Epi-alleles in plants:
inheritance of epigenetic information over
generations. Plant Cell. Physiol., 43: 1106–
1011.
Karan, R., DeLeon, T., Biradar, H. and
Subudhi, P.K. 2012. Salt stress induced
variation in DNA methylation pattern and
its influence on gene expression in
contrasting rice genotypes. PLoS ONE., 7: 1-
10.
Keyte, A.L., Percifield, R., Liu, B. and
Wendel, J.F. 2006. Infraspecific DNA
methylation polymorphism in cotton
(Gossypium hirsutum L.). J. Hered., 97: 444–
450.
Labra, M., Ghiani, A., Citterio, S., Sgorbati,
S., Sala, F., Vannini, C., Ruffini-Castiglione,
M. and Bracale, M. 2002. Analysis of
cytosine methylation pattern in response to
water deficit in pea root tips. Plant. Biol., 4:
694–699.
Labra, M., Grassi, F., Imazio, S., Di Fabio, T.,
Citterio, S., Sgorbati, S. and Agradi, E. 2004.
Genetic and DNA-methylation changes
induced by potassium dichromate in
Brassica napus L. Chemosphere., 54: 1049–
1058.
Lu, X., Zhao, X., Wang, D., Yin, Z., Wang, J.,
Fan, W., Wang, S., Zhang, T. and Ye, W.
2015.Whole-genome DNA methylation
analysis in cotton (Gossypium hirsutum L.)
under different salt stresses. Turk. J. Biol., 39:
396-406.
Marconi, G., Pace, R., Traini, A., Raggi, L.,
Lutts, S., Chiusano, M., Guiducci, M.,
Falcinelli, M., Benincasa, P. and Albertini, E.
2013. Use of MSAP markers to analyse the
effects of salt stress on DNA methylation in
Rapeseed (Brassica napus var. oleifera).
PLoS ONE., 8: 1-16.
Peng, H. and Zhang, J. 2009. Plant genomic
DNA methylation in response to stresses:
Potential applications and challenges in
plant breeding. Prog. Nat. Sci., 19: 1037–
1045.
Saleh, B. 2012a. Effect of salt stress on
growth and chlorophyll content of some
cultivated cotton varieties grown in Syria.
Commun. Soil. Sci. Plant Anal., 43: 1976 -
1983.
Saleh, B. 2012b. Characterization of some
upland cotton varieties using AFLP and NIR
techniques. Agriculture
(Poľnohospodárstvo)., 58: 85−92.
Saleh, B. 2016. DNA changes in cotton
(Gossypium hirsutum L.) under salt stress as
revealed by RAPD marker. Adv. Hortic. Sci.,
30: 13-21.

2018 January Edition |www.jbino.com | Innovative Association
J.Bio.Innov7 (1), pp: 96-113, 2018 |ISSN 2277-8330 (Electronic)
Basel Saleh
Salmon, A., Clotault, J., Jenczewski, E.,
Chable, V. and Manzanares-Dauleux, M.J.
2008. Brassica oleracea displays a high
level of DNA methylation polymorphism.
Plant Sci., 174: 61–70.
Sokolova, D.A., Vengzhen, G.S. and
Kravets, A.P. 2014. The effect of DNA
methylation modification polymorphism of
corn seeds on their germination rate,
seedling resistance and adaptive capacity
under UV-C exposure. Am. J. Plant. Biol., 1:
1-14.
Sun, L.F., Liu, T.J., Shan, X.H., Su, S.Z., Li,
S.P., Yuan, Y.P. and Zhang, J. 2015. Analysis
of DNA cytosine methylation patterns in
maize hybrids and their parents. Biol.
Plant., 59: 266-272.
Temel, A., Kartal, G. and Gozukirmizi, N.
2008. Genetic and epigenetic variation in
barley calli cultures. Biotechnol. Biotechnol.
Equip., 22: 911-914.
Tsaftaris, A.S., Polidoros, A.N. and Tani, E.
2000. Gene regulation and its role in hybrid
vigor and stability of performance.
Genetika., l32: 189-201.
USDA, 2015. Cotton: World Markets and
Trade; Foreign Agricultural Service/USDA -
Office of Global Analysis November 2015.
Wang, B., Fu, R., Zhang, M., Ding, Z., Chang,
L., Zhu, X., Wang, Y., Fan, B., Ye, W. and
Yuan, Y. 2015. Analysis of methylation-
sensitive amplified polymorphism in
different cotton accessions under salt stress
based on capillary electrophoresis. Genes
Genom., 37: 713–724.
Williams, J.G.K., Kubelik, A.R., Livak, K.J.,
Rafalski, J.A. and Tingey, S.V. 1990. DNA
polymorphisms amplified by arbitrary
primers are useful as genetic markers.
Nucleic Acids Res., 18: 653l-6535.
Yaish, M.W. 2013. DNA Methylation-
associated epigenetic changes in stress
tolerance of plants. G.R. Rout and A.B. Das
(Eds.). Mol. Stress Physiol. Plants., 17: 427-440.
Yang, C., Zhang, M., Niu, W., Yang, R.,
Zhang, Y., Qiu, Z., Sun, B. and Zhao, Z. 2011.
Analysis of DNA methylation in various
swine tissues. PLoS ONE., 6: 1-9.
Zemach, A., McDaniel, I.E., Silva, P. and
Zilberman, D. 2010. Genome-wide
evolutionary analysis of eukaryotic DNA
methylation. Science., 328: 916–919.
Zhong, L. and Wang, J.B. 2007. The role of
DNA hypermethylation in salt resistance of
Triticum aestivum L. J. Wuh. Botan. Res.
Wuh. Hub., 25: 102–104.
Zhong, L., Xu, Y. and Wang, J. 2009. DNA-
methylation changes induced by salt stress
in wheat Triticum aestivum. Afr. J.
Biotechnol., 8: 6201-6207.