do socially responsible firms pay more taxes? angela k...
TRANSCRIPT

Do Socially Responsible Firms Pay More Taxes?
Angela K. Davis University of Oregon
David A. Guenther University of Oregon
Linda K. Krull
University of Oregon
Brian M. Williams Indiana University
ABSTRACT: We investigate the relation between corporate tax payments and corporate social responsibility. Because existing theory and empirical studies find inconsistent evidence on the relation between these constructs, we investigate whether the two activities act as complements or substitutes. We estimate the relation between measures of corporate social responsibility and (1) the amount of corporate taxes paid, and (2) the amount invested in tax lobbying activities using both ordinary least squares and a system of simultaneous equations. We find consistent evidence that corporate social responsibility is negatively related to five-year cash effective tax rates and positively related to tax lobbying expenditures. Our evidence suggests that, on average, corporate social responsibility and tax payments act as substitutes. Keywords: corporate social responsibility; tax avoidance; Global Reporting Initiative Data Availability: Data are available from sources identified in the paper Corresponding author: Professor David A. Guenther Lundquist College of Business 1208 University of Oregon Eugene, OR 97403-1208 Phone: (541) 346-5384, Fax:(541) 346-3341, email: [email protected] emails of non-corresponding authors: Angela K. Davis: [email protected] Linda K. Krull: [email protected] Brian M. Williams: [email protected] Funding from the Finance and Securities Analysis Center at the Lundquist College of Business is gratefully acknowledged. The authors are also grateful for helpful comments from Magali Delmas (a discussant), Mike Russo, Brady Williams and seminar participants at the University of Oregon, the 2013 University of North Carolina Tax Symposium and the 2013 Universities of British Columbia, Oregon, and Washington Conference.

Do Socially Responsible Firms Pay More Taxes?
ABSTRACT: We investigate the relation between corporate tax payments and corporate social responsibility. Because existing theory and empirical studies find inconsistent evidence on the relation between these constructs, we investigate whether the two activities act as complements or substitutes. We estimate the relation between measures of corporate social responsibility and (1) the amount of corporate taxes paid, and (2) the amount invested in tax lobbying activities using both ordinary least squares and a system of simultaneous equations. We find consistent evidence that corporate social responsibility is negatively related to five-year cash effective tax rates and positively related to tax lobbying expenditures. Our evidence suggests that, on average, corporate social responsibility and tax payments act as substitutes. Keywords: corporate social responsibility; tax avoidance; Global Reporting Initiative

1
Do Socially Responsible Firms Pay More Taxes?
I. INTRODUCTION
Recent anecdotal evidence suggests that some stakeholders of public companies regard
corporate tax payments as socially responsible while others consider them irrelevant in a
corporate social responsibility (CSR) context. For example, Margaret Hodge, the chair of the
United Kingdom’s Parliament Committee on Public Accounts, recently accused Starbucks,
Google, and Amazon of immoral behavior due to “using the letter of tax laws both nationally and
internationally to immorally minimize their tax obligations” (Lawless 2012). Similarly, The
Guardian (UK) newspaper reported on February 14, 2009 “nearly 60 percent of financial
directors in the UK do now regard tax as an ethical issue.” On the other hand, the same
newspaper article states that respondents to a survey of tax directors “were unanimous in saying
that the payment of corporation tax is not at present a social issue relevant to CSR.”
Discussions of taxes in corporate sustainability reports also provide mixed evidence on
the importance of tax payments in a CSR context. International organizations like the Global
Reporting Initiative (GRI) seek to influence CSR activities by issuing guidelines for
sustainability reporting. The GRI guidelines recommend that firms provide detailed information
on tax payments because what is “frequently desired by users of sustainability reports is the
organization’s contribution to the sustainability of a larger economic system” (GRI 2011, 25),
suggesting that the GRI considers corporate tax payments as a positive contribution to social
welfare. However, some corporations argue in their sustainability reports that taxes hurt
innovation, production, job creation, and economic development, which suggests that tax
payments detract from social welfare. Similarly, some corporations state that they actively lobby

2
to lower corporate taxes because lower corporate taxes will lead to increased economic
development.
This diversity of perspectives motivates our research question: Are CSR activities and
corporate tax payments complements or substitutes? To investigate this question, we examine the
relation between measures of corporate social responsibility and both corporate tax payments and
tax lobbying activity. Our evidence provides insight into whether managers or other influential
stakeholders of socially responsible firms regard the payment of corporate taxes as
complementing the firm's CSR activities. Understanding the relation between taxes and
corporate social responsibility is important because existing research (Lanis and Richardson
2012; Huseynov and Klamm 2012; Landry, Deslandes, and Fortin 2013; Hoi, Wu, and Zhang
2013; Watson 2015), reporting guidelines (GRI 2011), and theory on CSR (Friedman 1970;
Carroll 1979; Garriga and Mele 2004; Mackey, Mackey, and Barney 2007; McGee 2010)
suggest competing predictions about the relation between CSR and taxes.
How firms jointly choose the extent to which they engage in CSR and tax avoidance
likely reflects how engaging in one activity affects the costs and benefits of the other. If firms
view paying taxes in the same way they view CSR activities, then the two activities act as
complements. In this case, we expect a positive relation between corporate tax payments and
measures of CSR. This prediction is consistent with CSR theories developed in the business and
society literature suggesting that firms have social obligations that extend beyond maximizing
shareholder wealth (Carroll 1979; Garriga and Mele 2004; Mackey et al. 2007). Under this

3
theory, firms that value CSR will dedicate resources to socially responsible activities that do not
necessarily maximize economic performance.1
Conversely, firms may view paying taxes as detracting from social welfare because tax
payments reduce innovation, job growth, and economic development. For example, Djankov,
Ganser, McLiesh, Ramalho, and Shleifer (2008, 4) find "a consistent and large adverse effect of
corporate taxes on both investment and entrepreneurship." If this is the case, we expect corporate
tax payments and CSR to act as substitutes, with a negative relation between the two measures.
Researchers also argue that for-profit corporations are more efficient than governments in
allocating resources. For example, McGee (2010, 41) states that “keeping resources in the private
sector results in benefits to society because the private sector utilizes resources more efficiently
than the public sector.” Porter and Kramer (2006, 92) argue that "when a well-run business
applies its vast resources, expertise, and management talent to problems that it understands and
in which it has a stake, it can have a greater impact on social good than any other institution or
philanthropic organization." This perspective suggests that socially responsible firms may
dedicate resources to CSR activities, but neither managers nor other influential stakeholders
necessarily consider the payment of corporate taxes to be the best means by which to accomplish
their social responsibility goals. Moreover, under this view paying less taxes can result in greater
social benefits.
Tax payments and CSR also act as substitutes if firms that engage in aggressive tax
avoidance increase their CSR activities to offset any negative perceptions. Existing research
argues that CSR activities can be used to temper the effects of negative events, such as fraud
1 At the extreme firms may even pay more corporate taxes than legally required. See the Associated Press news story "Starbucks Promises to Pay More UK Tax" (December 6, 2012) in which Starbucks responded to criticism that its low UK taxes were "immoral" by agreeing to pay "somewhere in the range of 10 million pounds in each of the next two years" regardless of whether the company is profitable.

4
accusations or environmental disasters, or to offset negative public perceptions about the firm
(Fombrun, Gardberg and Barnett 2000; Godfrey, Merrill and Hansen 2009).
Other theories on CSR suggest that decisions about CSR and tax avoidance are unrelated.
For example, Friedman (1970) argues that firms should engage in socially responsible activities
only when such activities maximize shareholder wealth. Under this view, firms will dedicate
resources to CSR activities only to the extent that they align with the overarching goal of
maximizing shareholder wealth. Consistent with this theory, Dhaliwal, Li, Tsang, and Yang
(2011) and Lev, Petrovits, and Radhakrishnan (2010) find that firms with higher measures of
CSR have lower cost of capital and higher revenue growth, respectively. If tax avoidance and
CSR both maximize firm value independently of one another, we expect managers to engage in
each activity independently of the other, and therefore there will be no relation between CSR and
corporate tax payments.
We examine the five-year cash effective tax rates (ETRs) for a sample of U.S. public
corporations that also have data on the MSCI annual data set of environmental, social, and
governance (ESG) ratings of publicly traded companies. We focus only on U.S. corporations
since the way managers and other stakeholders regard taxes in the context of corporate social
responsibility may differ across countries.2 To identify socially responsible firms, we construct a
CSR index for the period 2002 through 2011 following the approach in Kim, Park, and Wier
(2012).
We find that the CSR index is negatively related to five-year cash ETRs, and these results
are driven by firms with high CSR indices. We find similar results using only the subset of
2 For example, Lanis and Richardson (2012) find that higher levels of CSR disclosure are associated with lower corporate tax avoidance for a sample of 408 Australian firms, suggesting that Australian firms deemed to be more socially responsible pay more taxes.

5
categories in the CSR index that relate to “community,” which includes such activities as
charitable giving, innovative giving, community engagement, and community impact. This
evidence is consistent with corporate tax payments and CSR acting as substitutes because firms
view taxes as detracting from social welfare and/or because they engage in CSR, in part, to offset
negative perceptions associated with low tax payments.
We also examine the relation between tax lobbying behavior and CSR and find that the
CSR index is positively related to tax lobbying. This result is consistent with our finding of a
negative relation between cash ETRs and CSR and corroborates our evidence that socially
responsible firms do not necessarily regard the payment of corporate taxes as complementing
CSR activities.
We do not attempt to establish causality in the relation between CSR and tax payments;
our goal is to determine how firms choose the extent to which they jointly engage in CSR and tax
avoidance given that the costs and benefits of engaging in one activity potentially affect the costs
and benefits of the other. This lack of a defined causal relationship and the possibility that
investment in one activity influences the payoff from the other suggests that the extent of
engagement in each activity may be determined simultaneously. We therefore estimate CSR and
tax avoidance using a system of simultaneous equations. Results using simultaneous equations
are consistent with ordinary least squares.
We distinguish our research question and results from a recent study by Hoi et al. (2013),
which also examines the relation between tax avoidance and CSR activities. Hoi et al. provide
evidence that firms with “excessive irresponsible CSR activities” have a higher likelihood of
engaging in “extremely aggressive tax avoidance policies.” Our research question and setting
differ from this study in two important ways. First, Hoi et al. focus on a subset of firms with poor

6
CSR, so their CSR measures include only activities that negatively affect a firm’s stakeholders.
In contrast, we take a more comprehensive approach and study the full spectrum of CSR activity
using an aggregate measure of CSR activity, as well as measures that capture firms in the high
and low quintiles of CSR activity, and measures that capture CSR strengths and concerns
separately. Second, Hoi et al. focus on “extremely aggressive tax avoidance policies” such as tax
sheltering, which may constitute illegal tax fraud, and Fin 48 reserves, which represent tax
savings on uncertain tax positions. We study a broader spectrum of legal tax avoidance by using
cash ETRs.3 Although Hoi et al. show that their results are robust to using cash ETRs, their
results differ from ours and focus on socially irresponsible firms. In contrast to their result that
low CSR firms avoid more taxes, we provide new evidence that high CSR firms avoid more
taxes, which suggests that CSR and taxes act as substitutes rather than complements, or that CSR
and taxes are substitutes for a different set of firms than Hoi et al. consider.
Our results make two important contributions to research on taxes and CSR. First, our
results help in understanding the types of activities that managers or other influential
stakeholders consider to be socially responsible. We find a negative relation between tax
payments and two measures of CSR. Assuming that managers allocate resources to activities that
they or other influential stakeholders consider important in a CSR context, this result suggests
that influential stakeholders of socially responsible firms do not, on average, consider corporate
tax payments to complement CSR activities. Our results suggest that tax payments and CSR act
as substitutes, at least for some firms. This result also highlights the potential tradeoff between
3 The importance of the idea that tax avoidance should be “legal” is evidenced by an example from General Electric’s 2010 Citizenship Report, which states: “GE has taken criticism recently regarding its U.S. tax obligations. Like any business or individual, we do like to keep our tax rate low. But we fully comply with the law and there are no exceptions. GE acts with integrity in relation to our tax obligations wherever we operate. At the same time, we have a responsibility to our shareowners to reduce our tax costs as the law allows. Under any system, GE will comply and pay what we owe.”

7
corporate tax payments and other economic activities that promote social welfare. While higher
corporate tax payments provide governments with more revenue to spend on social welfare,
firms that focus on after-tax profitability may be able to increase social welfare in other ways,
such as investment in infrastructure, R&D, and job creation. Although we do not specifically
address the relation between corporate tax payments and social welfare, our results suggest that
the relation is more complex than that reflected in some prior research.
Our results also provide evidence about the type of information that may be valued in
sustainability reports, an important public policy question. This evidence should be useful to
organizations such as the GRI and UN Global Compact that produce sustainability reporting
guidelines, as well as to the corporations that produce CSR reports. Current guidelines appear to
view corporate tax payments as contributing to the social welfare of the communities in which
the corporation operates, suggesting that paying more taxes is better from a social welfare
standpoint. Our results suggest that in the U.S. the payment of more tax is not, on average,
considered an important complement to CSR.
II. CORPORATE SOCIAL RESPONSIBILITY AND TAXES
Corporate social responsibility can be broadly defined as voluntary firm actions designed
to improve social or environmental conditions (Mackey et al. 2007). Our research question
provides insight into whether managers or other influential stakeholders of socially responsible
firms consider the payment of corporate taxes an important complement to CSR activities,
suggesting they view CSR and taxes as complements, or whether stakeholders consider tax
payments as detracting resources from CSR, suggesting they view CSR and taxes as substitutes.
While corporate tax payments are not entirely voluntary, managers do make choices regarding

8
the extent to which their firms engage in tax planning that reduces the amount of taxes paid.
Managers also decide whether to engage in lobbying to lower corporate taxes. One potential way
to understand the relation between CSR and taxes would be to examine how managers discuss
taxes in the firm's sustainability report. As discussed in the next section, we examine a sample of
sustainability reports and observe that the treatment of taxes is inconsistent across reports.
Corporate Taxes and Sustainability Reporting
Two observations suggest inconsistencies in how corporate tax payments are treated in
sustainability reports issued by corporations. First, there appears to be a lack of uniform
treatment of tax information in sustainability reports, despite GRI reporting guidelines that
clearly emphasize the importance of tax disclosures. Second, some firms for which CSR appears
to be important report no tax information at all or report that they promote or lobby for
legislation that lowers corporate taxes.
As currently written, the GRI guidelines for sustainability reporting suggest that more
socially responsible firms will pay more taxes. For example, the first core economic indicator
suggested by GRI is “direct economic value generated and distributed, including [...] payments
to capital providers and governments” (GRI 2011, 26). Similarly, the UN Global Compact (UN
2009, 40) encourages participants to engage in a “core business partnership” in which partners
collaborate to, among other things, “generate tax revenues.”
Despite this positive relation between corporate tax payments and public welfare
suggested by sustainability reporting guidelines, differences exist in how firms view and report
taxes in their sustainability reports. Some firms such as Analog Devices report taxes in a manner
consistent with the current guidelines and state that they contribute to the community “through

9
the ongoing operation of our business and taxes.” Other firms discuss taxes in their sustainability
reports as being harmful to innovation and economic development. For example, Intel states in
its 2011 Corporate Responsibility Report that it “believes in promoting tax policies that
encourage innovation and competition around the world. [...] the location of our facilities can be
substantially affected by the tax and economic development policies of potential host countries.”
Some sustainability reports also discuss the fact that large public corporations affect tax
policy through their lobbying activities, which, in turn, affect social welfare.4 Many of these
firms argue that they are engaging in good corporate citizenship by actively lobbying to lower
the tax payments of businesses, a stance in direct contrast to how the issue of corporate tax
payments is framed by the current GRI reporting guidelines. For example, in their 2011
sustainability report, 3M Corporation states that their top objective in terms of public policy
issues is “to make the case for tax reform and lower corporate tax rates for a level global playing
field.” In their 2011 sustainability report 3M rates tax policy as more important than either health
or environmental concerns, underscoring the importance they attribute to lowering corporate tax
payments.
To understand how taxes and tax information are disclosed in sustainability reports, we
examine forty sustainability reports selected randomly from sample firms in the MSCI ESG
annual data set from 2009 to 2011 that have high quality sustainability reports.5 We find that in
nineteen (47.5 percent) of these reports the firm either does not make any tax disclosures at all,
or refers the reader to the firm’s Form 10-K for tax information. We also observe wide variation
in the amount and quality of tax information that firms report, and find both positive and
4 GRI Sustainability Reporting Guidelines version 3.1 includes lobbying activities as a core society performance indicator. 5 We identify firms with high quality sustainability reports as those with Reporting Quality (CGOV_str_D) equal to one. We discuss these data in more detail in Section III.

10
negative statements about taxes in the forty reports that we examined. Positive statements about
taxes focus on the importance of the firm’s tax payments to the social welfare of the community.
For example, ConocoPhillips states “Our global operations contribute substantially to social and
economic development […] For example, our direct economic contributions during 2011
included: Taxes – Our operations generated $14.9 billion in total tax revenue to governments.”
Negative statements about corporate taxes generally argue that high tax rates discourage
innovation and investment and harm job creation, and therefore hurt the ability of the firm to
contribute to social welfare. For example, 3M states “Tax reform is essential to ensuring the
long-term competitiveness of American businesses and workers. 3M believes business tax
reform should focus on a significant reduction of the corporate income tax rate.”
The fact that many companies do not provide tax information in their sustainability
reports does not necessarily mean the companies are not in compliance with CSR reporting
guidelines. GRI, for example, only requires companies to report on items that are material. In
discussing materiality in the context of sustainability reporting, GRI states (2011, 8): “Relevant
topics and indicators are those that may reasonably be considered important for reflecting the
organization’s economic, environmental, and social impacts, or influencing the decisions of
stakeholders, and, therefore, potentially merit inclusion in the report. Materiality is the threshold
at which topics or indicators become sufficiently important that they should be reported.” GRI
gives an example of a two-dimensional matrix on which to assess materiality, with the vertical
axis reflecting “Influence on Stakeholder Assessments and Decisions” and the horizontal axis
reflecting “Significance of Economic, Environmental, and Social Impacts.”
Firms vary widely in how they present taxes on the matrix. In Intel’s matrix “Taxes” is
the lowest rated item on the vertical axis labeled “Importance to Multiple Stakeholders” and is

11
also rated to the left of (i.e., below) the “medium” line on the horizontal axis labeled “Impact on
Intel’s Business.” From this matrix one could conclude that corporate taxes are not very
important to either Intel or its stakeholders. UPS rates “Taxes Paid” high on the vertical axis of
its matrix, indicating relatively high importance to stakeholders, but to the far left (i.e., very low)
on the horizontal axis, indicating low influence on UPS’s business success. In contrast, Symantec
does not show taxes on its materiality matrix. In spite of the differences in how taxes are
portrayed in their CSR reports, all three of the aforementioned firms are in the top 10 percent of
all firms in terms of CSR scores.
The above discussion illustrates that for firms for which CSR is important, the firm may
or may not treat corporate tax payments as an important (or material) item compared with other
CSR items in their reports. This anecdotal evidence suggests that there is no clear relation
between the importance of CSR to a firm and its corporate tax payments, despite the clear link
between tax receipts and the ability of governments to fund social services and the GRI
guidelines stating that companies should disclose their tax payments. This lack of consistency
suggests that the relation between firms’ CSR activities and tax payments is an empirical
question.
The Relation between CSR and Tax Payments
Existing theories and empirical evidence from the CSR literature also suggest that there
are differing views about the relation between tax payments and a firm's other CSR activities.
We discuss these different views below.
Arguments Suggesting a Positive Relation between CSR and Tax Payments
Theories developed in the business and society literature (Margolis and Walsh 2003)
suggest that firms must consider the interests of all stakeholders, which can sometimes cause the
12
firm to engage in socially responsible activities that are not profit-maximizing (Mackey et al.
2007). For example, in his model of corporate social performance, Carroll (1979) identifies
economic, ethical, legal, and discretionary responsibilities as four basic expectations of CSR.
Consistent with Carroll’s model, Kim, Park, and Weir (2012) find evidence that managers
engage in CSR activities to meet ethical expectations rather than in response to opportunistic
incentives. Also consistent with this model, Avi-Yonah (2008) argues that from a CSR
perspective, firms should not engage in tax avoidance by using transactions that lack a business
purpose, even if the tax avoidance strategy is legal. Christensen and Murphy (2004, 37) state
“paying taxes is perhaps the most fundamental way in which private and corporate citizens
engage with broader society.” Taken together, these theories suggest a positive relation between
CSR and corporate tax payments.
Anecdotal evidence suggests that public corporations are sensitive to how their tax
payments are perceived by stakeholders. For example, public corporations sometimes take
actions to make their tax payments appear larger than they really are. A July 23, 2012 New York
Times article reports “Apple Inc., already the world’s most valuable company, understates its
profits compared with other multinationals. It’s building up an overlooked asset in the form of
billions of dollars, tucked away for tax bills it may never pay.”6 Apple responded to criticism
that it’s taxes were too low by making the following statement in an April 28, 2012 article in the
New York Times: “In the first half of fiscal year 2012 our U.S. operations have generated almost
$5 billion in federal and state income taxes, including income taxes withheld on employee stock
gains, making us among the top payers of U.S. income tax.” It is interesting to note that Apple
6 Many U.S. multinational corporations designate unremitted foreign earnings as permanently reinvested earnings, a designation that allows them to avoid recognizing the potential U.S. tax liability on these earnings. Apple, however, recognizes the potential U.S. tax expense in earnings, a practice that is considered conservative from an accounting perspective but may also make it appear that Apple pays more taxes than it does.

13
includes the amount of taxes paid by its employees on stock option compensation income in the
tax payments it discloses in its sustainability report.
Arguments Suggesting No Relation or a Negative Relation between CSR and Tax Payments
Traditional economic theories suggest that firms will dedicate resources to CSR activities
only to the extent that they align with the overarching goal of maximizing shareholder wealth.
Consistent with this theory, Dhaliwal et al. (2011) find a negative relation between CSR and cost
of capital, and Lev et al. (2010) find evidence of a positive association between CSR activity and
revenue growth. Thus, under traditional economic theory, we would expect managers to engage
in tax avoidance to the extent it maximizes shareholder wealth. If both tax avoidance and CSR
are mechanisms to maximize firm value, we expect no direct relation between CSR and
corporate tax payments.
However, if firms view paying taxes as detracting from social welfare because tax
payments reduce innovation, job growth, and economic development, then the two activities act
as substitutes. In this case we expect a negative relation between corporate tax payments and
measures of CSR. Theoretical and empirical studies in economics have demonstrated that
corporate taxes tend to decrease investment. For example, Hines (2006, 2) states that "a large
body of evidence suggests [...] that international investment, and international tax avoidance, are
strongly influenced by tax policies," and "there is every reason to expect countries to benefit
from tax reductions as capital becomes more internationally mobile.” Djankov et al. (2008, 4)
find "a consistent and large adverse effect of corporate taxes on both investment and
entrepreneurship."

14
Some researchers also argue that for-profit corporations are more efficient than
governments in allocating resources. For example, McGee (2010) states that “keeping resources
in the private sector results in benefits to society because the private sector utilizes resources
more efficiently than the public sector.” Lantos (2001) argues that "humanitarian CSR is favored
over government welfare in that the aid is voluntarily, more personally, and perhaps more
efficiently bestowed, whereas state contributions come via the inefficiency and plodding pace of
government bureaucracy and legislators through faceless bureaucrats." Porter and Kramer (2006,
92) argue that "when a well-run business applies its vast resources, expertise, and management
talent to problems that it understands and in which it has a stake, it can have a greater impact on
social good than any other institution or philanthropic organization." Hines, Horwitz, and
Nichols (2010) and Henderson and Malani (2009) make similar arguments. Malani and Posner
(2007, p 2019) give the following example: "Google has recently announced, with great fanfare,
that it will operate the world's first (to our knowledge) 'for-profit charity.' Google's plan appears
to be to finance a for-profit business that will, among other things, develop new technology to
improve water supplies in Kenya." This perspective suggests that managers and stakeholders of
socially responsible firms may not consider the payment of corporate taxes to be the best means
by which to accomplish their social responsibility goals. In fact, this argument suggests that
paying taxes detracts from social welfare.
Consistent with this argument, we find that negative statements about corporate taxes in
firms’ sustainability reports generally argue that high tax rates discourage innovation and
investment and harm job creation, which limit firms’ ability to contribute to social welfare.
Qualitative evidence presented in Preuss (2010) and Sikka (2010) is also consistent with this
argument. Preuss finds that firms based in tax havens claim to engage in socially responsible

15
business practices and Sikka finds that firms identifying themselves as socially responsible
engage in tax avoidance. More generally, as a firm’s after-tax profits increase, its impact on
social welfare through infrastructure investment and job creation may increase, which both
improves the income level of the community (through employee salaries and payments to
suppliers and contractors) and increases other sources of tax revenue, including payroll taxes and
employee taxes on salaries. Similarly, firms that avoid taxes have a greater capacity to invest in
socially responsible activities. These arguments suggest a negative relation between CSR and
corporate tax payments.
Other existing research argues that an additional basis for finding a negative relation
between CSR and taxes arises when firms engage in CSR to create “moral capital” to reduce the
consequences of their involvement in negative events or publicity (Fombrun et al. 2000; Godfrey
et al. 2009). Fombrun et al. (2000, 93) suggest that since regulators are members of the
community and legislators are elected by members of the community, they “are more likely to
grant the benefit of the doubt to strong corporate citizens.” Consistent with a tempering effect of
CSR, Godfrey et al. (2009) find that the decline in shareholder value after a negative event is
smaller for firms that engage in CSR than for firms that do not. This research suggests that some
firms strategically engage in CSR to create a more favorable reputation among various
stakeholders and reduce the possibility of negative attention or regulatory action directed at
aggressive tax practices and the consequences of such attention or action.7
7 Some activities that improve social welfare also decrease tax payments through tax credits. For example, expenditures on energy saving technology improve the environment while at the same time generating tax credits. As an example, a May 6, 2013 press release by General Electric states "Today GE’s renewable energy business announced 1 gigawatt of new U.S. wind turbine orders following the ruling of the production tax credit on January 1, 2013."

16
Empirical Evidence on the Relation between CSR and Tax Payments
Based on the above discussion, the payment of corporate taxes may be viewed differently
from other expenses that a firm incurs to promote social welfare, suggesting that the link
between a firm’s CSR activities and the amount of corporate taxes paid is an empirical question.
Existing studies that investigate the relation between CSR and tax payments find mixed results.
The results of several studies suggest either a positive or negative relation between CSR
and tax payments, although these studies differ from ours in either the sample firms or the
measures used. Studies suggesting a positive relation find that firms with low CSR ratings (or
high measures of CSR "concerns") have lower ETRs (Garcia 2014; Hoi et al. 2013; Huseynov
and Klamm 2012), Australian firms with high levels of CSR disclosure have higher ETRs (Lanis
and Richardson 2012), and self-reported "tax disputes" with the taxing authorities are higher for
firms with low CSR ratings (Lanis and Richardson 2015). On the other hand, studies have found
that U.S. firms exhibit no relation between CSR strengths and tax rates (Hoi et al. 2013;
Huseynov and Klamm 2012), Canadian firms in the highest CSR rating terciles are more tax
aggressive than firms in the middle tercile (Landrey et al. 2013), and the relation between CSR
and taxes for U.S. firms is mixed and depends on firm profitability (Watson 2015) or lobbying
activities (Garcia 2014).
We provide additional empirical evidence on the relation between CSR and tax payments
using a large sample of U.S. firms. We consider firms’ strengths and concerns together because
this measure provides an assessment of the overall extent to which a firm values CSR. For
example, consider two firms, where Firm A has four concerns and no strengths, and Firm B has
four concerns and nine strengths. Considering both strengths and concerns, it appears that Firm
A does not value CSR (strengths minus concerns equals negative four), whereas Firm B does

17
value CSR (strengths minus concerns equals positive five). Looking at strengths and concerns
separately, both firms appear to place the same value on CSR (total concerns of four). Thus,
netting strengths and concerns captures a broader picture of the importance a firm places on CSR
than focusing on strengths and weaknesses separately.8 We also focus on cash ETRs because
these measures capture a broader range of tax avoidance activities than measures intended to
capture aggressive tax reporting behavior.
We supplement our tests of the relation between CSR and taxes by studying the relation
between CSR and tax lobbying expenditures. Existing research finds that firms that spend more
on tax lobbying have lower effective tax rates (Brown, Drake, and Wellman 2014; Hill et al.
2012). Because tax lobbying is a means to reduce tax payments, the relation between CSR and
tax lobbying provides evidence about whether socially responsible firms view tax payments as
contributing to or detracting from social welfare. Therefore, these tests help corroborate our
evidence on the relation between CSR and tax payments.
III. EMPIRICAL TESTS
Sample
Our sample initially consists of all firms for which data are available on Compustat for
the years 2002 through 2011. Our initial sample begins in 2002 because coverage in the CSR
database was greatly expanded for 2002 and later years. Because our empirical tests require five
years of data to calculate both cash ETR and the CSR Index, our final sample includes the years
2006 through 2011. Data on the CSR index and sustainability reporting, which we use to
construct our CSR measures, come from the MSCI annual data set of environmental, social, and
8 For comparison purposes, we also report results that examine strengths and concerns separately to be consistent with Hoi et al. (2013).

18
governance ratings of publicly traded companies. This database was previously referred to as the
KLD database.
According to Kim et al. (2012), “KLD uses a combination of surveys, financial
statements, and articles in the popular press and academic journals, as well as government
reports, to assess social performance along dimensions such as corporate governance,
community, diversity, employee relations, environment, product, and exclusionary screen
categories including alcohol, gambling, military contracting, nuclear power, and tobacco.” To
assess a company’s level of social responsibility, KLD examines both positive indicators
(strengths) and negative indicators (concerns). Numerous scholarly studies use the KLD data to
operationalize the CSR construct (e.g., Turban and Greening 1997; Waddock and Graves 1997;
Szwajkowski and Figlewicz 1999) and note that the KLD data are a widely used, influential, and
highly regarded measure of CSR (Waddock 2003; Chatterji, Levine and Toffel 2009; Mattingly
and Berman 2006).
Following Kim et al. (2012) we construct CSR index scores based on the following five
KLD categories: community, diversity, employee relations, environment, and product. We also
follow Kim et al. (2012) in that we exclude the category for corporate governance, since the link
between corporate governance and corporate tax avoidance has been studied previously (Desai
and Dharmapala 2006; Armstrong, Blouin, Jagolinzer, and Larker 2014; Lisowsky, Robinson,
and Schmidt 2012), and is different from the link between CSR and taxes that is the focus of our
study.9 We construct a CSR index score by adding one for each identified strength, subtracting
9 The KLD data include seven total categories: community, diversity, employee relations, environment, product, governance, and human rights. We follow Kim et al. (2012) and exclude human rights as well as governance. Results are not sensitive to including human rights and governance in the CSR index. We discuss these tests in more detail in the Sensitivity Tests section.

19
one for each identified concern, and summing across all strengths and concerns for each firm-
year.10
To obtain a measure of a firm’s tax payments, we use the five-year cash ETR proposed
by Dyreng, Hanlon, and Maydew (2008), equal to the sum of taxes paid for a five year period
divided by the sum of the pretax income less the sum of special items for the same five year
period. We obtain firms’ tax lobbying expenditures from the publicly available database
maintained by the Center for Responsive Politics, which provides data on firm lobbying
expenditures related to thirty issues, and we only use data on a firm’s tax lobbying.11 Our use of
this lobbying data is consistent with prior research (e.g., Hill, Kubick, Lockhart, and Wan 2012).
Our final sample combines observations with data on both the Compustat and MSCI ESG
databases for a given year. We assume that lobbying activity is zero for firms without data on the
lobbying database. We eliminate observations for firms incorporated outside of the U.S.,
observations with five-year cash ETRs greater than 1 or less than 0, and observations with
missing data for any of our regression variables.12 This process results in a final sample of 5,588
observations.
Research Design
We test the relation between CSR and taxes using the following regression model:
DEPVARi,t = β0 + β1CSRi,t + ΣβkCONTROLSk + ε N. (1)
10 The KLD dataset is updated each year and exhibits some variation across time. For example, the mean within firm standard deviation of the CSR index score is 1.01. 11 The Center for Responsive Politics website (https://www.opensecrets.org/lobby/) provides data that classifies lobbying expenditures by firm into several different categories. We find data for 407 of the 5,588 firm years in our final sample. We merge this data with our sample based on firm name. 12 To evaluate the effect of eliminating firm-years with cash ETRs less than zero and greater than one, we re-estimate all equations by including these observations and winsorizing all ETRs at zero and one. Inferences are unchanged.

20
DEPVAR is one of three different variables:
Cash_ETR = five-year sum from year t-4 to year t of cash taxes paid (Compustat data item TXPD) divided by the five-year sum of pre-tax income (PI) less special items (SPI). To allow for meaningful interpretation, firms are required to have a Cash ETR between 0 and 1.
Lobby(0/1) = an indicator variable equal to 1 if the firm reported lobbying expenditures
for tax purposes in the current year and 0 otherwise. Lobby_Exp = the firm’s total reported lobbying expenditures for tax purposes divided by
lagged total assets (AT). We employ two measures of CSR:
CSR_Index = total strengths minus total concerns in the MSCI ESG five social rating categories: community, diversity, employee relations, environment, and product.
Community = total strengths minus total concerns in the MSCI ESG “Community”
category. The coefficient on CSR captures the relation between CSR and tax payments. A positive
coefficient would suggest that CSR and taxes are complements, whereas a negative coefficient
would suggest that they are substitutes. CONTROLS consist of two sets of control variables that
differ depending on whether the dependent variable is the Cash ETR or one of the lobbying
measures. We define these measures in the Appendix.
When Cash_ETR is the dependent variable, we include control variables that existing
literature finds to be important determinants of tax avoidance including Size, Leverage,
intangible assets (Intang), tax benefit of stock options (Tax_Bnft_Opt), pre-tax profitability
(PTROA), growth (MTB), foreign income (For_Inc), selling, general, and administrative expense
(SG&A), research and development (R&D), net operating loss carryforward (NOLCF Amount,
NOLCF Indicator), property, plant and equipment (PP&E), corporate governance (Governance),
Cash, Excess Cash, and Financial Constraints. In tests of the relation between corporate social

21
responsibility measures and lobbying activities we include control variables from Hill, Kelly,
Lockhart, and Van Ness (2013) including Size, pre-tax profitability (PTROA), growth (MTB),
access to lawmakers (Capital), and number of lawmakers (Electoral College). In addition, all
regressions have year and industry fixed effects, where industry is based on the SIC two digit
industry classifications. All t-statistics are calculated using standard errors clustered by firm and
year. Regressions using the five-year Cash ETR as the dependent variable use mean values of all
regression variables measured over the same five-year period as the ETR. Regressions using
lobbying as the dependent variable use annual values for all variables. All continuous
independent variables are winsorized at the first and ninety-ninth percentiles.
Results
Table 1 presents descriptive statistics for the variables used in our tests. The mean of
CSR_Index is negative, indicating that the average firm has more “concerns” than “strengths”
using the KLD ratings. Mean and median Cash_ETR is approximately 26 percent, which is lower
than the 35 percent statutory U.S. corporate income tax rate but similar to prior research. The
mean ratio of foreign income to total income (For_Inc) is 41 percent, while the median is 16
percent, suggesting that most firms have a relatively small amount of foreign income. The
Pearson correlation between Cash_ETR and CSR_Index is -0.046, consistent with CSR activities
and tax payments being substitutes rather than complements. We next present multivariate
regression tests that include variables to control for other factors that affect Cash ETRs.
Cash_ETR Results
Table 2 presents results of estimating Equation (1) when the dependent variable is the
five-year Cash ETR. Since Cash_ETR is measured over five years, all other regression variables
22
are the mean values over the same five-year period. Column (1) presents results with only
industry and year fixed effects, while Column (2) contains all of the control variables. The
coefficient on CSR_Index is significantly negative in both columns indicating that firms with
higher CSR indices pay lower taxes than other firms.13 In Column (2) the coefficient on
CSR_Index is -0.003. This result suggests that a one unit increase in CSR_Index is associated
with a 0.3 percentage point decrease in Cash_ETR or alternatively that moving from the 25th
percentile to the 75th percentile of CSR_Index results in a 0.66 percentage point decrease in
Cash_ETR.14 While this result is economically modest, it does suggest that cash taxes paid by
the firm is decreasing in the corporate social responsibility score, consistent with CSR and tax
payments acting as substitutes rather than complements.
To more directly address our research question, we conduct separate analyses for firms
with high and low CSR indices. We create dummy variables to indicate those firms in the highest
or lowest quintiles of CSR_Index and include these as independent variables in Equation (1)
(replacing CSR_Index). Results of estimating this regression are presented in Table 3. The results
in Columns (1) and (2) suggest that those observations in the highest quintile of CSR_Index have
significantly lower values of Cash_ETR than other firms, but firms in the lowest quintile of
CSR_Index do not have significantly different values of Cash_ETR than other firms. This result
suggests that the firms that are rated highly for social responsibility drive the negative relation
between taxes and CSR indices reported in Table 2. In Column (2), the coefficient on CSR
Highest Quintile is -0.017. This result suggests that after controlling for various other
13 We also estimate Equation (1) separately by year and find the coefficients on CSR_Index are negative for each year in the sample period and are statistically significant in 2007 and 2011. The coefficient on CSR Highest Quintile (Table 4) is also negative in every year and significant in three of the six years. These results are consistent with our expectations given the loss of statistical power with smaller sample sizes. 14 The 25th to 75th percentile of CSR Index ranges from -1.4 to 0.8 [(0.8 - -1.4) x 0.003 = 0.0066].

23
determinants of tax avoidance, firms in the highest quintile of CSR scores pay 1.7 percent less
(as a percentage of pretax income) in taxes than other firms.15
Simultaneous Equations Estimation
Although we seek only to provide evidence on association, not causation, we recognize
that it is possible that CSR activities and corporate tax avoidance are endogenous. For example,
one argument is that firms might engage in CSR to offset the negative perceptions of tax
avoidance. In this case the benefits of CSR depend in part on the level of tax avoidance and the
costs of tax avoidance depend on the level of CSR. We attempt to control for some of this
endogeneity by estimating a three-stage least squares model.16 Specifically, we estimate the
following system of equations:
Cash_ETRi,t = β0 + β1CSR_Indexi,t + β2Sizei,t + β3Leveragei,t + β4Intangi,t + β5Tax_Bnft_Opti,t
+ β6PTROAi,t + β7MTBi,t + β8For_Inci,t + β9SG&Ai,t + β10R&Di,t + β11NOLCF_Amounti,t
+ β12NOLCF_Indicatori,t + β13PP&Ei,t + β14Governancei,t + β15Cashi,t + β16Excess_Cashi,t
+ β17Financial Constraintsi,t + ΣβjIndustryj + ΣβtYeart + εi,t (2)
15 The economic significance of this effect seems reasonable and in line with existing studies related to cash effective tax rates. For example, Hoi et al. (2013) find that firms with high negative CSR pay 3.4 percent less in taxes (as a percent of taxable income) than other firms and Chen et al. (2010) find that family firms pay 1.2 percent less in taxes (as a percent of taxable income) than non-family firms. 16 We use three-stage least squares because its use of covariances allows for a more efficient and precise estimate of the coefficients than a two-stage least squares model (Kennedy 1996, 161). Our results are nearly identical using two-stage least squares.

24
CSR_Indexi,t = α0 + α1Cash_ETRi,t + α2Sizei,t + α3Leveragei,t + α4Intangi,t + α5PTROAi,t
+ α6MTBi,t + α7SG&Ai,t + α8R&Di,t + α9NOLCF_Amounti,t + α10NOLCF_Indicatori,t
+ α11PP&Ei,t + α12Governancei,t + α13Cashi,t + α14Excess_Cashi,t + α15Financial Constraintsi,t
+ α16CSR_Transparencyi,t + ΣαjIndustryj + ΣαtYeart + εi,t (3)
where CSR_Transparency equals the five-year average of an indicator variable equal to one if a
firm is defined as having a strength in the governance category “Reporting Quality
CGOV_str_D” from MSCI ESG database. This variable provides a measure of the quality of a
firm’s social responsibility reporting, specifically whether the firm is particularly effective in
reporting on a wide range of social and environmental performance measures, or is exceptional
in reporting one particular measure. We expect that CSR_Index will be positively associated with
CSR reporting quality. All other variables are as defined as in Equation (1).17 We exclude
CSR_Transparency from Equation (2) as we do not expect the quality of a firm’s CSR reporting
to be a determinant of the cash taxes paid by a firm, and we exclude Tax_Bnft_Opt and For_Inc
from Equation (3) as we do not expect that the tax benefit from stock options or the percent of
foreign income to be determinants of corporate social responsibility scores. Table 4 presents the
results of this estimation. In Column (1), similar to our previous results we find a negative and
significant coefficient on CSR_Index. Furthermore, the magnitude of the coefficient is about
twice as large in this specification relative to the OLS regression presented in Table 2 Column
(2). Taken together, we view this as evidence that firms that engage in greater amounts of
socially responsible activities also avoid more taxes.
17 To develop the empirical equation for CSR, we attempt to be conservative by including many of the variables in the Cash ETR model that are potentially related to the CSR Index. This conservative approach ensures that we control for the extent to which these variables determine both CSR and Cash ETR and results in an equation similar to Jo and Na (2012) and Callan and Thomas (2011).
25
Tax Lobbying Results
A detailed examination of sustainability reports indicates that some firms argue that they
are engaging in good corporate citizenship by lobbying for reduced business taxes. To provide
empirical evidence on this question, we test whether firms that are more socially responsible
engage in more tax lobbying activities. Table 5 reports results of estimating Equation (1) when
the dependent variable is Lobby(0/1), an indicator variable equal to one in the year a firm incurs
expenditures on tax lobbying and zero otherwise. We estimate Equation (1) using a logistic
regression model. Columns (1) and (2) contain only year and industry fixed effects, and Columns
(3) and (4) report results with all control variables included. Columns (1) and (3) use CSR_Index
as an independent variable, and Columns (2) and (4) use indicator variables equal to one if the
firm is in the highest or lowest quintile of CSR_Index. Results are similar in all of the regression
specifications. We find a significant positive relation between tax lobbying and both measures of
CSR. This result suggests that those firms that are more socially responsible are also more likely
to engage in tax lobbying. These results are economically significant, because an increase from
the 25th to 75th percentile of the CSR_Index is associated with a 16.5 percent increase in the
probability of tax lobbying, and firms in the highest quintile of CSR_Index have approximately a
158 percent higher probability of lobbying for taxes than other firms.18
Table 6 reports results of estimating Equation (1) when the dependent variable is
Lobby_Exp, the amount spent by the firm on tax lobbying activities scaled by lagged assets
during the year. Columns (1) and (2) contain only year and industry fixed effects, and Columns
(3) and (4) report results with all control variables included. Columns (1) and (3) use CSR_Index
as an independent variable, and Columns (2) and (4) use indicator variables equal to one if the
18 CSR Index odds are calculated as (e^ 0.073) per a one unit increase.

26
firm is in the highest or lowest quintile of CSR_Index. Results are similar in all of the regression
specifications, and are similar to those of Table 5. We find a significant positive relation between
the amount spent on tax lobbying and both measures of CSR. This result suggests that those
firms that are more socially responsible also spend more on tax lobbying. These results are
economically modest, as an increase from the 25th to 75th percentile of the CSR_Index is
associated with a 0.44 percent increase in the amount spent on tax lobbying, and firms in the
highest quintile of CSR_Index spend approximately 1.3 percent more (as a percent of lagged
assets) on lobbying for taxes than other firms. Overall, the results in Tables 2 through 6 suggest
that firms that are more socially responsible pay less in corporate taxes and engage in more tax
lobbying activities, consistent with CSR and taxes acting as substitutes rather than complements.
Sensitivity Tests
Alternative CSR Measures
In calculating our main measure of corporate social responsibility, we follow Kim et al.
(2012) and sum the strengths and weaknesses in five of the seven CSR categories to create an
average CSR score, which we term CSR_Index. As an alternative measure, we include all seven
KLD categories in the CSR_Index and find consistent results.
In addition, it is possible that weaknesses and strengths are not equivalent, or that the
association between positive CSR activities and taxes is different than the association between
negative CSR activities and taxes. To test this possibility, we follow Hoi et al. (2013) and
construct three measures of CSR activity. The first, Sum of Negative CSR, is the sum of CSR
concerns from MSCGI ESG’s five social rating categories: community, diversity, employee
relations, environment, and product. The second, High Negative CSR, is an indicator variable

27
equal to one if a firm has more than three CSR concerns. Finally, we also construct the variable
Sum of Positive CSR, which is the sum of CSR strengths from MSCGI ESG’s five social rating
categories: community, diversity, employee relations, environment, and product.
Table 7 presents the results of re-estimating Equation (1) with these alternative measures
of CSR. In Columns (1) and (2) we use the variable definitions above. In Columns (3) and (4) we
add MSCGI ESG’s governance strengths to the Sum of Positive CSR and governance concerns to
the Sum of Negative CSR because Hoi et al. (2013) include governance in their measures. In line
with this addition of governance, we code High Negative CSR equal to one if a firm has more
than four CSR concerns and zero otherwise.19 In each estimation, we find a negative and
significant coefficient on Sum of Positive CSR and insignificant coefficients on Sum of Negative
CSR and High Negative CSR. Taken together, these results are consistent with our main results
and suggest that firms that engage in more socially responsible activities avoid more taxes.20
Notably, these results are contrary to the results in Hoi et al. (2013) who find that firms with high
negative CSR have lower cash ETRs and find no association between CSR strengths and Cash
ETRs. Thus, the results of our study provide new evidence that CSR and taxes act as substitutes
rather than complements.
To further investigate whether our results are sensitive to how we construct our CSR
index we conduct an additional test using an alternative CSR index measure. Because the effects
of tax payments on the social welfare of a corporation’s community are most similar to the MSCI
ESG category of “Community,” we construct an alternative index using just the ratings from the
19 Results are similar if we continue to code High Negative CSR equal to one if a firm has more than 3 CSR concerns. 20 All results are similar when we also include human rights in the construction of these three variables.

28
community category.21 We re-estimate Tables 2-6 substituting Community for CSR_Index. With
one exception, in each specification we find similar results using this alternate measure. The
exception is in Table 5 Column 3. In the original specification CSR_Index is positive and
significant indicating that firms with higher social responsibility indices have a higher likelihood
of lobbying for taxes. In our alternative specification when we substitute Community for
CSR_Index we find a positive but insignificant coefficient on Community (t statistic = 1.28).
Executive Characteristics
Prior research such as Dyreng, Hanlon and Maydew (2010) finds that executives play an
important role in corporate tax avoidance. In untabulated sensitivity tests, we control for
managerial characteristics by including controls for the age and gender of the CEO in our main
regressions. We find similar results after including these variables as controls.22
IV. CONCLUSION
We investigate the relation between the CSR ratings of U.S. public corporations and both
the amount of taxes paid by the firm and the amount of tax lobbying in which the firm engages.
We find that a CSR index is negatively related to five-year cash ETRs, and positively related to
tax lobbying activities. Our results are robust to a simultaneous equations model, and we also
find similar results using alternative measures of CSR. Overall we find that, on average, socially
responsible firms do not pay more corporate taxes than other firms. This evidence suggests that
21 The community category consists of four strengths and one concern. Strengths are as follows: (1) Charitable Giving, (2) Innovative Giving, (3) Community Engagement, and (4) Other Strengths. The one concern included in the community category is Community Impact, which measures the severity of controversies related to a firm’s interactions with communities in which it does business. 22 Information on age and gender is unavailable for some firms in our sample. Therefore, this robustness test is estimated using a smaller sample of observations that have non-missing information in EXECUCOMP for CEO age and gender.

29
managers or other influential stakeholders of socially responsible firms do not view the payment
of corporate taxes as complementing CSR activities.
While the results of this study are consistent with anecdotal evidence that suggests that
using legal means to reduce taxes is not considered to be a socially undesirable activity, they are
inconsistent with existing research that finds that low CSR firms avoid more taxes. In contrast to
these studies, we provide new evidence that high CSR firms avoid more taxes, which suggests
that CSR and taxes act as substitutes rather than complements. In comparing other studies to
ours, important differences in both our sample composition and the measurement of our variables
contribute to differences in results. First, our measure of CSR excludes the corporate governance
category. The link between corporate governance and tax avoidance has been studied previously
and is different than the link between CSR and taxes, which is the focus of our study. Second,
existing studies eliminate observations with negative pre-tax income. Since we use a five-year
cash effective tax rate, we only eliminate observations with average negative earnings over five
years. Thus, our results are less likely to suffer from the bias documented in Henry and Sansing
(2014). Moreover, Watson (2015) finds that firms with low profitability have a different relation
between positive CSR activities and tax avoidance than high profitability firms, which provides
an example of how sample composition can contribute to differences in results. We also use a
long run measure of tax avoidance that averages out variation in effective tax rates due to
profitability, accounting differences, and one-time events.
Thus, our results provide evidence that the relation between corporate tax payments and
social welfare is perhaps more complex than is currently understood and reflected in the current
sustainability reporting guidelines. As such, our results provide important evidence that increases
our understanding of the relation between corporate tax avoidance and social responsibility.

30
Our results also have implications for corporate stakeholders who view CSR as an
important part of a public company's activities and tax policy makers considering tax reform
legislation. Although Brooks, Hillenbrand and Money (2015, 78) argue that “firms must
acknowledge the plurality of their stakeholders and may need to reconcile the potentially mixed
signals arising from the various groups,” the results of our study suggest that, at least for U.S.
public corporations, the payment of taxes is not viewed as an important socially responsible
activity by an influential subset of firms’ stakeholders. As pointed out by Brooks et al. (2015, 2),
“governments themselves are involved in a game where they trade off corporation tax revenue in
anticipation of higher employment and other taxes from additional economic activity if foreign
direct investment is encouraged by a favourable regime.” If policy makers are trying to improve
social welfare, understanding this trade-off is important in the design of tax laws. Finally, our
results present evidence for only one short period of time, and it may be the case that
stakeholders’ views on corporate taxes as a socially responsible activity will change or are
changing. For example, recent evidence from the U.K. suggests that public pressure may have
forced some firms to disclose tax shelter activities (Dyreng, Hoopes and Wilde 2014). If this
represents a growing trend, then public pressure may mitigate the impact of tax rules on
corporate investment decisions, at least for a subset of firms.

31
Appendix Variable Definitions
Cash_ETR = the 5 year sum (from year t-4 to year t) of cash taxes paid (TXPD)
divided by the 5-year sum of pre-tax income (PI) less special items (SPI). In order to allow for meaningful interpretation firms are required to have a Cash ETR between 0 and 1.
Size = log of total assets (AT)
MTB = price per share (PRCC_F) times total common shares outstanding (CSHO) over book value of equity (CEQ)
Leverage = long-term debt (DLTT) plus short-term debt (DLC) scaled by lagged total assets (AT)
Intang = intangible assets (INTAN) divided by lagged total assets (AT)
Tax_Bnft_Opt = tax benefit of stock options (TXBCOF) divided by lagged total assets (AT)
PTROA = pretax income (PI) divided by lagged total assets (AT)
For_Inc = absolute value of pretax foreign income (PIFO) divided by the absolute value of total pretax income (PI)
SG&A = SG&A equals selling, general and administrative expense (XSGA) divided by lagged total assets (AT).
R&D = Research and development expenditures (XRD) divided by lagged total assets (AT). If XRD is missing we set R&D equal to zero.
PPE = property, plant and equipment (PPENT) divided by lagged total assets (AT)
NOLCF Amount = net operating loss carry forward (TLCF) divided by lagged total assets (AT).
NOLCF Indicator = 1 if a firm has a net operating loss carryforward (TLCF) and zero otherwise.
Cash = cash holdings (CHE) divided by lagged total assets (AT).
Governance = the number of corporate governance strengths (CGOV_STR_NUM) less the number of corporate governance concerns (CGOV_CON_NUM) in MSCI ESG database.
Excess Cash = is measured following Fresard and Salva (2010) and is the error term from the regression of:

32
Ln (Cash / Total Assets) = B0 + B1Ln (Total Assets) + B2(Net Working Capital / Total Assets) + B3(R&D / Total Assets) + B4(Market Value / Total Assets) + B5(Capital Expenditures / Total Assets) + B5(Total Dividends Paid / Total Assets) + B6(Total Debt / Total Assets) + Industry Effects + Year Effects + e
Financial Constraints = the size-age index developed by Hadlock and Pierce (2010).
CSR_Index = total strengths minus total concerns in MSCI ESG five social rating categories: community, diversity, employee relations, environment, and product.
Community = total strengths minus total concerns in MSCI ESG “community” category
Lobby(0/1) = an indicator variable equal to one if the firm reported lobbying expenditures for tax purposes in the current year and zero else.
Lobby_Exp = The firm’s total reported lobbying expenditures for tax purposes scaled by lagged total assets.
Capital = an indicator variable equal to one if a firm is headquartered in the capital city of its state of incorporation, and zero else.
Electoral College = the number of electoral votes in the state in which the firm is located.

33
REFERENCES
Armstrong, C., J. Blouin, A. Jagolinzer, and D. Larker. 2014. Corporate Governance, Incentives, and Tax Avoidance. Working paper, University of Pennsylvania.
Associated Press. “Starbucks Promises to Pay More UK Tax”. Yahoo news. December 6, 2012.
http://news.yahoo.com/starbucks-promises-pay-more-uk-tax-134801286--finance.html. Avi-Yonah, R. 2008. Aggressive tax behaviour and corporate social responsibility in Beyond
Boundaries: Developing Approaches to Tax Avoidance and Tax Risk Management. Oxford University Centre for Business Taxation. 137-138.
Brooks, C., C. Hillenbrand and K. Money. 2015. What Stakeholders Expect from Corporations
When It Comes to Paying Tax: Corporate Reputation and Optimal Tax Planning. Working paper, University of Reading.
Brown, J., K. Drake, and L. Wellman. 2014. The Benefits of a Relational Approach to Corporate
Political Activity: Evidence from Political Contributions to Tax Policymakers. Working paper, Arizona State University.
Carroll, A. 1979. A three-dimensional conceptual model of corporate performance. Academy of
Management 4 (4): 497-505. Chatterji, A., D. Levine, and M. Toffel. 2009. How well do social ratings actually measure
corporate social responsibility? Journal of Economics and Management Strategy 18 (1): 125–169.
Chen, S., X. Chen, Q. Chneg, and T. Shevlin. 2010. Are family firms more tax aggressive than
non-family firms? Journal of Financial Economics 95 (1): 41-61. Christensen, J. and R. Murphy. 2004. The social irresponsibility of corporate tax avoidance:
taking CSR to the bottom line. Development 47: 37-44. Desai, M. A. and D. Dharmapala. 2006. Corporate tax avoidance and high-powered incentives.
Journal of Financial Economics 79: 145-179. Dhaliwal, D., O. Li, A. Tsang, and G. Y. Yang. 2011. Voluntary nonfinancial disclosure and the
cost of equity capital: The initiation of corporate social responsibility reporting. The Accounting Review 86 (1): 59–100.
Djankov, S., T. Ganser, C. McLiesh, R. Ramalho and A. Shleifer. 2008. The effect of corporate
taxes on investment and entrepreneurship. Working paper, National Bureau of Economic Reserarch.
Dyreng, S., M. Hanlon, and E. Maydew. 2008. Long-run corporate tax avoidance. The
Accounting Review 83 (1): 61-82.

34
Dyreng, S., M. Hanlon and E. Maydew. 2010. The effects of executives on corporate tax
avoidance. The Accounting Review 85 (4): 1163-1189. Dyreng, S., J. Hoopes and J. Wilde. 2014. Public Pressure and Corporate Tax Behavior. Working
paper, Duke University, Ohio State University and University of Iowa. Fombrun, C., N. Gardberg, and M. Barnett, 2000. Opportunity platforms and safety nets:
Corporate citizenship and reputational risk. Business and Society Review 105, 85-106. Friedman, M. 1970. The social responsibility of business is to increase its profits. New York
Times (September 13): 122-126. Fresard, L. and C. Salva. 2010. The value of excess cash and corporate governance: Evidence
from U.S. cross-listings. Journal of Financial Economics 98, 359-384. Garcia, J. 2014. The Influence of Corporate Social Responsibility on Lobbying Effectiveness:
Evidence from Effective Tax Rates. Working paper, University of Waterloo. Garriga, E. and D. Mele. 2004. Corporate social responsibility theories: Mapping the territory.
Journal of Business Ethics 53 (1/2): 51-71. Global Reporting Initiative. 2011. Sustainability Reporting Guidelines version 3.1.
https://www.globalreporting.org/resourcelibrary/G3.1-Sustainability-Reporting-Guidelines.pdf.
Godfrey, P., C. Merrill, and J. Hansen, 2009. The relationship between corporate social
responsibility and shareholder value: An empirical test of the risk management hypothesis. Strategic Management Journal 30, 425-445.
Hadlock, C.J., and J. Pierce. 2010. New evidence on measuring financial constraints: Moving
beyond the KZ Index. 2010. Review of Financial Studies 23 (5) 1909-1940. Henderson, T. and A. Malani. 2009. Corporate philanthropy and the market for altruism.
Columbia Law Review 109; 571. Henry, E. and R. Sansing. 2014. Data Truncation Bias and the Mismeasurement of Corporate
Tax Avoidance. Working paper, University of Tennessee, Knoxville and Dartmouth College.
Hill, M., T. Kubick, B. Lockhart, and H. Wan. 2012. The Effectiveness of Political Tax
Minimization. Working paper, University of Nebraska. Hill, M., G. Kelly, B. Lockhart, and R. Van Ness. 2013. Determinants and effects of corporate
lobbying. Financial Management 42 (4): 931-957.

35
Hines, J. 2006. Corporate taxation and international competition. Working paper, University of Michigan and National Bureau of Economic Research.
Hines, J., J. Horwitz and A. Nichols. 2010. The attack on nonprofit status: a charitable
assessment. Michigan Law Review 108; 1179-1220. Hoi, C.K., Wu, Q., Zhang, H. 2013. Is corporate social responsibility (CSR) associated with tax
avoidance? Evidence from irresponsible CSR activities. The Accounting Review 88 (6): 2025-2059.
Huseynov, F. and B. Klamm. 2012. Tax avoidance, tax management, and corporate social
responsibility. Journal of Corporate Finance 18: 804-827. Jo, H. H. Na. 2012) Does CSR reduce firm risk? Evidence from controversial industry sectors.
Journal of Business Ethics 110: 441-456. Kennedy, P. 1996. A Guide to Econometrics, 3rd edition. MIT Press. Kim, Y., M. Park, and B. Wier. 2012. Is earnings quality associated with corporate social
responsibility? The Accounting Review 87 (3): 761–796 Lawless, J. 2012. UK lawmakers seek end to corporate tax avoidance. Associated Press. Landry, S., M. Deslandes and A. Fortin. 2013. Tax aggressiveness, corporate social
responsibility, and ownership structure. Journal of Accounting, Ethics and Public Policy. 14 (3): 611-645
Lanis, R. and G. Richardson. 2012. Corporate social responsibility and tax aggressiveness: An
empirical analysis. Journal of Accounting and Public Policy 31: 86-108. Lanis, R. and G. Richardson. 2015. Is corporate social responsibility performance associated
with tax avoidance? Journal of Business Ethics 127: 439-457. Lantos, G. 2001. The boundaries of strategic corporate social responsibility. Journal of
Consumer Marketing 18; 595 – 632. Lev, B., C. Petrovits, and S. Radhakrishnan. 2010. Is doing good good for you? How corporate
charitable contributions enhance revenue growth. Strategic Management Journal (31): 182-200.
Lisowsky, P., L. Robinson, and A. Schmidt. 2012. Do Publicly Disclosed Tax Reserves Tell Us
About Privately Disclosed Tax Shelter Activity? Working paper, University of Illinois. Mackey, A., T. Mackey, and J. Barney. 2007. Corporate social responsibility and firm
performance: Investor preferences and corporate strategies. The Academy of Management Review 32 (3): 817-835.

36
Malani, A. and E.Posner. 2007. The case for for-profit charities." Virginia Law Review 93; 2017. Margolis, J. and J. Walsh. 2003. Misery loves companies: rethinking social initiatives by
business. Administrative Science Quarterly 48: 268-305. Mattingly, J. E., and S. Berman. 2006. Measurement of corporate social action: Discovering
taxonomy in the Kinder Lydenburg Domini ratings data. Business and Society 45 (1): 1–27.
McGee, R. W. 2010. Ethical Issues in Transfer Pricing. Manchester Journal of International
Economic Law. 7 (2) 24-41. Porter, M. and M. Kramer. 2006. The link between competitive advantage and corporate social
responsibility. Harvard Business Review 78; 92. Preuss, L. 2010. Tax avoidance and corporate social responsibility: you can’t do both, or can
you? Corporate Governance 10 (4): 365-374. Sikka, P. 2010. Smoke and mirrors: Corporate social responsibility and tax avoidance.
Accounting Forum 34: 153-168. Szwajkowski, E., and R. Figlewicz. 1999. Evaluating corporate performance: A comparison of
the Fortune reputation survey and the Socrates social ranking database. Journal of Managerial Issues 11 (2): 137–154.
Turban, D. B., and D. W. Greening. 1997. Corporate social performance and organizational
attractiveness to prospective employees. Academy of Management Journal 40 (3): 658–672.
United Nations. 2009. The Practical Guide to the United Nations Global Compact. United
Nations Global Compact Office. http://www.unglobalcompact.org/docs/ communication_on_progress/Tools_and_Publications/Practical_Guide_2008.pdf.
Waddock, S. A. 2003. Stakeholder performance implications of corporate responsibility. Internal
Journal of Business Performance Management 5 (2/3): 113–124. Waddock, S., and S. Graves. 1997. The corporate social performance—Financial performance
link. Strategic Management Journal 18 (4): 303–319. Watson, L. 2015. Corporate social responsibility, tax avoidance, and earnings performance.
Journal of the American Taxation Association (forthcoming)..

37
Table 1 Descriptive Statistics
Variablea N Mean Std Dev 25th Pctl 50th Pctl 75th Pctl Cash ETR 5,588 0.260 0.131 0.179 0.259 0.331 CSR_Index 5,588 -0.106 2.077 -1.400 -0.400 0.800 Size 5,588 7.461 1.449 6.433 7.300 8.347 Leverage 5,588 0.220 0.180 0.066 0.200 0.324 Intang 5,588 0.248 0.224 0.063 0.190 0.377 Tax_Bnft_Opt 5,588 0.001 0.003 0.000 0.000 0.001 PTROA 5,588 0.107 0.087 0.051 0.095 0.152 MTB 5,588 3.427 2.622 1.748 2.506 3.721 For_Inc 5,588 0.413 0.714 0.000 0.158 0.558 SG&A 5,588 0.256 0.195 0.112 0.221 0.349 R&D 5,588 0.031 0.051 0.000 0.002 0.042 NOLCF Amount 5,588 0.054 0.118 0.000 0.005 0.051 NOLCF Indicator 5,588 0.468 0.448 0.000 0.400 1.000 PPE 5,588 0.281 0.240 0.104 0.204 0.375 Governance 5,588 -0.396 0.614 -0.800 -0.400 0.000 Cash 5,588 0.184 0.182 0.050 0.114 0.267 Excess Cash 5,588 0.014 0.977 -0.548 0.163 0.737 Financial Constraints 5,588 -3.903 0.525 -4.477 -3.795 -3.476 Lobby 0/1 5,588 0.071 0.256 0.000 0.000 0.000 Lobby_Exp 5,588 0.009 0.044 0.000 0.000 0.000 Capital 5,588 0.003 0.175 0.000 0.000 0.000 Electoral College 5,588 8.295 10.234 3.000 3.000 10.000
aCash_ETR is defined as the 5 year sum (from year t-4 to year t) of cash taxes paid (TXPD) divided by the 5-year sum of pre-tax income less special items (SPI). In order to allow for meaningful interpretation firms are required to have a Cash ETR between 0 and 1. CSR_Index is defined as total strengths minus total concerns in MSCI ESG five social rating categories: community, diversity, employee relations, environment, and product. Size is defined as the log of total assets (AT). Leverage is defined as long term debt (DLTT) plus short term debt (DLC) scaled by lagged total assets (AT). Intang is defined as intangible assets (INTAN) divided by lagged total assets (AT). Tax_Bnft_Opt is defined as the tax benefit of stock options (TXBCOF) divided by lagged total assets (AT). PTROA is defined as pretax income (PI) divided by lagged total assets (AT). MTB is defined as price per share (PRCC_F) times total common shares outstanding (CSHO) over book value of equity (CEQ). For_Inc is defined as the absolute value of pretax foreign income (PIFO) divided by the absolute value of pretax total

38
income (PI). SG&A is defined as selling, general and administrative expense (XSGA) divided by lagged total assets (AT). R&D is defined as research and development expense (XRD) divided by lagged total assets (AT). NOLCF Amount is defined as the amount of tax loss carryforward (TLCF) divided by lagged total assets (AT). NOLCF Indicator is an indicator variable equal to one if a firm has a non-zero tax loss carryforward (TLCF) and zero else. PPE is net property, plant and equipment (PPENT) divided by lagged total assets (AT). Governance is defined as the number of corporate governance strengths (CGOV_STR_NUM) less the number of corporate governance concerns (CGOV_CON_NUM) in MSCI ESG database. Cash is defined as cash and cash equivalents (CHE) divided by lagged total assets (AT). Excess Cash is measured following Fresard and Salva (2010). Financial Constraints is measured using the index developed by Hadlock and Pierce (2010). Lobby(0/1) is an indicator variable equal to one if the firm reported lobbying expenditures for tax purposes in the current year and zero else. Lobby_Exp is defined as the firm’s total reported lobbying expenditures for tax purposes scaled by lagged total assets. Capital is an indicator variable equal to one if a firm is headquartered in the capital city of its state of incorporation and zero else. Electoral College is equal to the number of electoral college votes in the state in which the firm is located. All continuous independent variables are winsorized at the 1st and 99th percentiles.

39
Table 2 Relation between Taxes and CSR
VARIABLEa Predicted Sign (1) (2) CSR_Index ? -0.004*** -0.003**
(-2.71) (-2.00) Size - -0.012***
(-4.76) Leverage - -0.055***
(-2.90) Intang - -0.015
(-0.73) Tax_Bnft_Opt - -1.168**
(-1.99) PTROA ? 0.027
(0.65) MTB + -0.003
(-0.25) For_Inc - 0.020***
(4.02) SG&A - 0.038**
(2.13) R&D - -0.174**
(-2.20) NOLCF Amount - -0.234***
(-8.36) NOLCF Indicator - 0.003
(0.47) PP&E - -0.035
(-1.61) Governance ? 0.001
(0.18) Cash ? -0.137***
(-5.13) Excess Cash ? 0.016***
(3.69) Financial Constraints - -0.017**
(-2.56) Constant ? 0.312*** 0.415***
(4.24) (6.05) Year Effects Yes Yes Industry Effects Yes Yes Observations 5,588 5,588 R-squared 0.109 0.197 *,**, and *** indicate statistical significance at the 0.10, 0.05 and 0.01 levels, respectively (two-tailed tests). t-Statistics are in parentheses and are calculated based on heteroskedasticity-robust standard errors clustered by firm and year. aThe dependent variable is Cash_ETR, defined as the 5 year sum (from year t-4 to year t) of cash taxes paid (TXPD) divided by the 5-year sum of pre-tax income less special items (SPI). In order to allow for meaningful
40
interpretation firms are required to have a Cash ETR between 0 and 1. CSR_Index is defined as total strengths minus total concerns in MSCI ESG five social rating categories: community, diversity, employee relations, environment, and product. Size is defined as the log of total assets (AT). Leverage is defined as long term debt (DLTT) plus short term debt (DLC) scaled by lagged total assets (AT). Intang is defined as intangible assets (INTAN) divided by lagged total assets (AT). Tax_Bnft_Opt is defined as the tax benefit of stock options (TXBCOF) divided by lagged total assets (AT). PTROA is defined as pretax income (PI) divided by lagged total assets (AT). MTB is defined as price per share (PRCC_F) times total common shares outstanding (CSHO) over book value of equity (CEQ). For_Inc is defined as the absolute value of pretax foreign income (PIFO) divided by the absolute value of pretax total income (PI). SG&A is defined as selling, general and administrative expense (XSGA) divided by lagged total assets (AT). R&D is defined as research and development expense (XRD) divided by lagged total assets (AT). NOLCF Amount is defined as the amount of tax loss carryforward (TLCF) divided by lagged total assets (AT). NOLCF Indicator is an indicator variable equal to one if a firm has a non-zero tax loss carryforward (TLCF) and zero else. PPE is net property, plant and equipment (PPENT) divided by lagged total assets (AT). Governance is defined as the number of corporate governance strengths (CGOV_STR_NUM) less the number of corporate governance concerns (CGOV_CON_NUM) in MSCI ESG database. Cash is defined as cash and cash equivalents (CHE) divided by lagged total assets (AT). Excess Cash is measured following Fresard and Salva (2010). Financial Constraints is measured using the index developed by Hadlock and Pierce (2010).
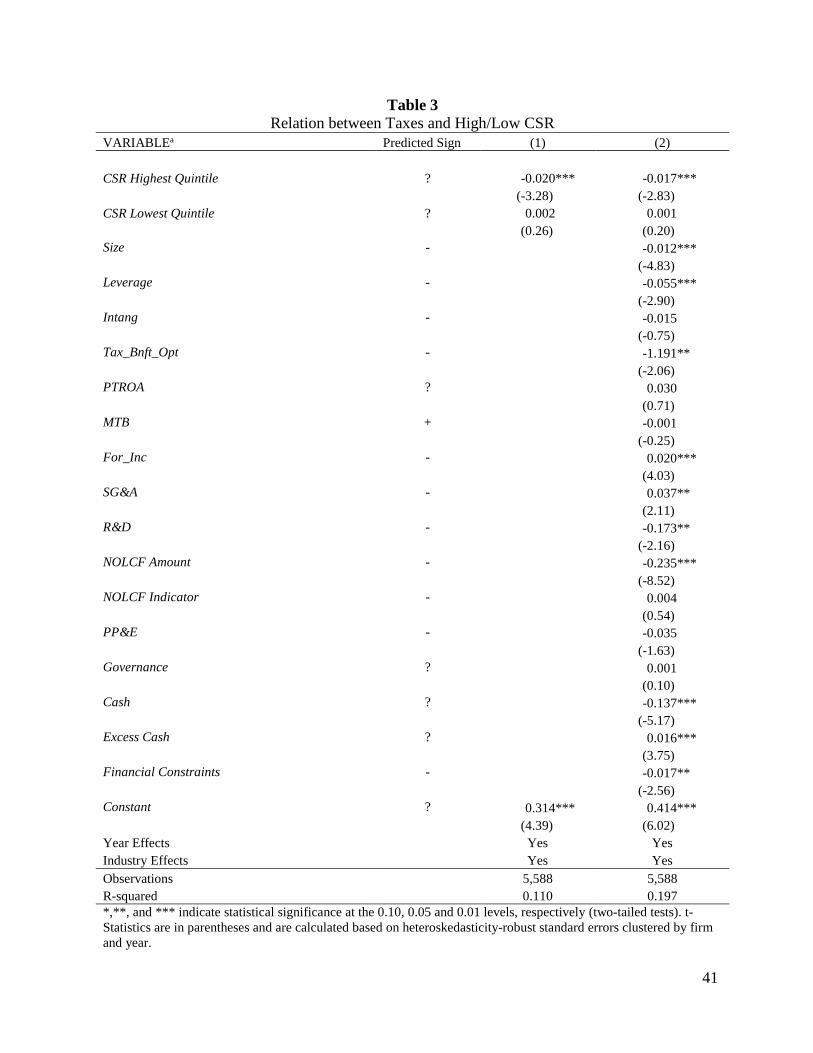
41
Table 3 Relation between Taxes and High/Low CSR
VARIABLEa Predicted Sign (1) (2) CSR Highest Quintile ? -0.020*** -0.017***
(-3.28) (-2.83) CSR Lowest Quintile ? 0.002 0.001
(0.26) (0.20) Size - -0.012***
(-4.83) Leverage - -0.055***
(-2.90) Intang - -0.015
(-0.75) Tax_Bnft_Opt - -1.191**
(-2.06) PTROA ? 0.030
(0.71) MTB + -0.001
(-0.25) For_Inc - 0.020***
(4.03) SG&A - 0.037**
(2.11) R&D - -0.173**
(-2.16) NOLCF Amount - -0.235***
(-8.52) NOLCF Indicator - 0.004
(0.54) PP&E - -0.035
(-1.63) Governance ? 0.001
(0.10) Cash ? -0.137***
(-5.17) Excess Cash ? 0.016***
(3.75) Financial Constraints - -0.017**
(-2.56) Constant ? 0.314*** 0.414***
(4.39) (6.02) Year Effects Yes Yes Industry Effects Yes Yes Observations 5,588 5,588 R-squared 0.110 0.197 *,**, and *** indicate statistical significance at the 0.10, 0.05 and 0.01 levels, respectively (two-tailed tests). t-Statistics are in parentheses and are calculated based on heteroskedasticity-robust standard errors clustered by firm and year.
42
aThe dependent variable is Cash_ETR, defined as the 5 year sum (from year t-4 to year t) of cash taxes paid (TXPD) divided by the 5-year sum of pre-tax income less special items (SPI). In order to allow for meaningful interpretation firms are required to have a Cash ETR between 0 and 1. CSR Highest Quintile is an indicator variable equal to one if a firm is in the highest quintile of CSR_Index and zero else. CSR Lowest Quintile is an indicator variable equal to one if a firm is in the lowest quintile of CSR_Index and zero else. CSR_Index is defined as total strengths minus total concerns in MSCI ESG five social rating categories: community, diversity, employee relations, environment, and product. Size is defined as the log of total assets (AT). Leverage is defined as long term debt (DLTT) plus short term debt (DLC) scaled by lagged total assets (AT). Intang is defined as intangible assets (INTAN) divided by lagged total assets (AT). Tax_Bnft_Opt is defined as the tax benefit of stock options (TXBCOF) divided by lagged total assets (AT). PTROA is defined as pretax income (PI) divided by lagged total assets (AT). MTB is defined as price per share (PRCC_F) times total common shares outstanding (CSHO) over book value of equity (CEQ). For_Inc is defined as the absolute value of pretax foreign income (PIFO) divided by the absolute value of pretax total income (PI). SG&A is defined as selling, general and administrative expense (XSGA) divided by lagged total assets (AT). R&D is defined as research and development expense (XRD) divided by lagged total assets (AT). NOLCF Amount is defined as the amount of tax loss carryforward (TLCF) divided by lagged total assets (AT). NOLCF Indicator is an indicator variable equal to one if a firm has a non-zero tax loss carryforward (TLCF) and zero else. PPE is net property, plant and equipment (PPENT) divided by lagged total assets (AT). Governance is defined as the number of corporate governance strengths (CGOV_STR_NUM) less the number of corporate governance concerns (CGOV_CON_NUM) in MSCI ESG database. Cash is defined as cash and cash equivalents (CHE) divided by lagged total assets (AT). Excess Cash is measured following Fresard and Salva (2010). Financial Constraints is measured using the index developed by Hadlock and Pierce (2010).

43
Table 4 Simultaneous Equations Model: Three-Stage Least Squares
DV = Cash_ETR DV = CSR_Index VARIABLEa (1) (2) CSR_Index -0.006** (-2.11) Cash ETR -3.203* (-1.90) Size -0.011*** 0.260*** (-4.46) (8.10) Leverage -0.057*** -0.884*** (-4.45) (-4.49) Intang -0.014 0.348** (-1.25) (2.09) Tax_Bnft_Opt -1.261** (-1.98) PTROA 0.031 0.994*** (1.25) (2.88) MTB -0.001 0.062*** (-0.24) (5.55) For_Inc 0.020*** (8.07) SG&A 0.043*** 1.510*** (3.31) (8.17) R&D -0.156*** 4.507*** (-3.06) (5.97) NOLCF Amount -0.237*** -1.649*** (-14.20) (-3.73) NOLCF Indicator 0.004 0.141** (0.86) (2.36) PP&E -0.035** 0.111 (-2.48) (0.52) Governance 0.002 0.024 (0.68) (0.53) Cash -0.136*** -0.010 (-7.50) (-0.27) Excess Cash 0.017*** 0.106** (6.31) (2.21) Financial Constraints -0.017*** -0.149** (-4.03) (-2.31) CSR Transparency 3.879*** (24.79) Constant 0.397*** -4.446*** (8.75) (-4.67) Year Effects Yes Yes Industry Effects Yes Yes Observations 5,588 5,588 R-squared 0.195 0.346 *,**, and *** indicate statistical significance at the 0.10, 0.05 and 0.01 levels, respectively (two-tailed tests). t-Statistics are in parentheses.

44
aCash_ETR is defined as the 5 year sum (from year t-4 to year t) of cash taxes paid (TXPD) divided by the 5-year sum of pre-tax income less special items (SPI). In order to allow for meaningful interpretation firms are required to have a Cash ETR between 0 and 1. CSR_Index is defined as total strengths minus total concerns in MSCI ESG five social rating categories: community, diversity, employee relations, environment, and product. Size is defined as the log of total assets (AT). Leverage is defined as long term debt (DLTT) plus short term debt (DLC) scaled by lagged total assets (AT). Intang is defined as intangible assets (INTAN) divided by lagged total assets (AT). Tax_Bnft_Opt is defined as the tax benefit of stock options (TXBCOF) divided by lagged total assets (AT). PTROA is defined as pretax income (PI) divided by lagged total assets (AT). MTB is defined as price per share (PRCC_F) times total common shares outstanding (CSHO) over book value of equity (CEQ). For_Inc is defined as the absolute value of pretax foreign income (PIFO) divided by the absolute value of pretax total income (PI). SG&A is defined as selling, general and administrative expense (XSGA) divided by lagged total assets (AT). R&D is defined as research and development expense (XRD) divided by lagged total assets (AT). NOLCF Amount is defined as the amount of tax loss carryforward (TLCF) divided by lagged total assets (AT). NOLCF Indicator is an indicator variable equal to one if a firm has a non-zero tax loss carryforward (TLCF) and zero else. PPE is net property, plant and equipment (PPENT) divided by lagged total assets (AT). Governance is defined as the number of corporate governance strengths (CGOV_STR_NUM) less the number of corporate governance concerns (CGOV_CON_NUM) in MSCI ESG database. Cash is defined as cash and cash equivalents (CHE) divided by lagged total assets (AT). Excess Cash is measured following Fresard and Salva (2010). Financial Constraints is measured using the index developed by Hadlock and Pierce (2010). CSR Transparency is an indicator variable equal to one if a firm is defined as having a strength in the governance category “CGOV_str_D” from MSCI ESG database.

45
Table 5 Relation between Tax Lobbying Activity and CSR – Logit Model
VARIABLEa Predicted
Sign (1) (2) (3) (4) CSR_Index ? 0.255*** 0.073*
(8.29) (1.88) CSR Highest Quintile ? 1.879*** 0.950***
(8.59) (3.82) CSR Lowest Quintile ? 0.120 0.299
(0.36) (1.21) Size + 1.042*** 1.023***
(9.46) (9.16) PTROA + 0.506 0.222
(0.47) (0.20) MTB + 0.034 0.030
(1.05) (0.93) Capital - 0.019 0.002
(0.02) (0.00) Electoral College ? -0.021 -0.021
(-1.28) (-1.27) Constant 0.182 -0.215 -9.087*** -9.126***
(0.15) (-0.19) (-7.10) (-7.30) Year Effects Yes Yes Yes Yes Industry Effects Yes Yes Yes Yes Observations 5,588 5,588 5,588 5,588 R-squared 0.168 0.177 0.336 0.346 *,**, and *** indicate statistical significance at the 0.10, 0.05 and 0.01 levels, respectively (two-tailed tests). t-Statistics are in parentheses and are calculated based on heteroskedasticity-robust standard errors clustered by firm and year aThe dependent variable is Lobby(0/1), an indicator variable equal to one if the firm reported lobbying expenditures for tax purposes in the current year and zero otherwise. CSR_Index is defined as total strengths minus total concerns in MSCI ESG five social rating categories: community, diversity, employee relations, environment, and product. CSR Highest Quintile is an indicator variable equal to one if the firm is in the highest quintile of CSR_Index and zero else. CSR Lowest Quintile is an indicator variable equal to one if a firm is in the lowest quintile of CSR_Index and zero else. Size is defined as the log of total assets (AT). MTB is defined as price per share (PRCC_F) times total common shares outstanding (CSHO) over book value of equity (CEQ). PTROA is defined as pretax income (PI) divided by lagged total assets (AT). Capital is an indicator variable equal to one if a firm is headquartered in the capital city of its state of incorporation and zero else. Electoral College is equal to the electoral college votes in the state in which the firm is located.
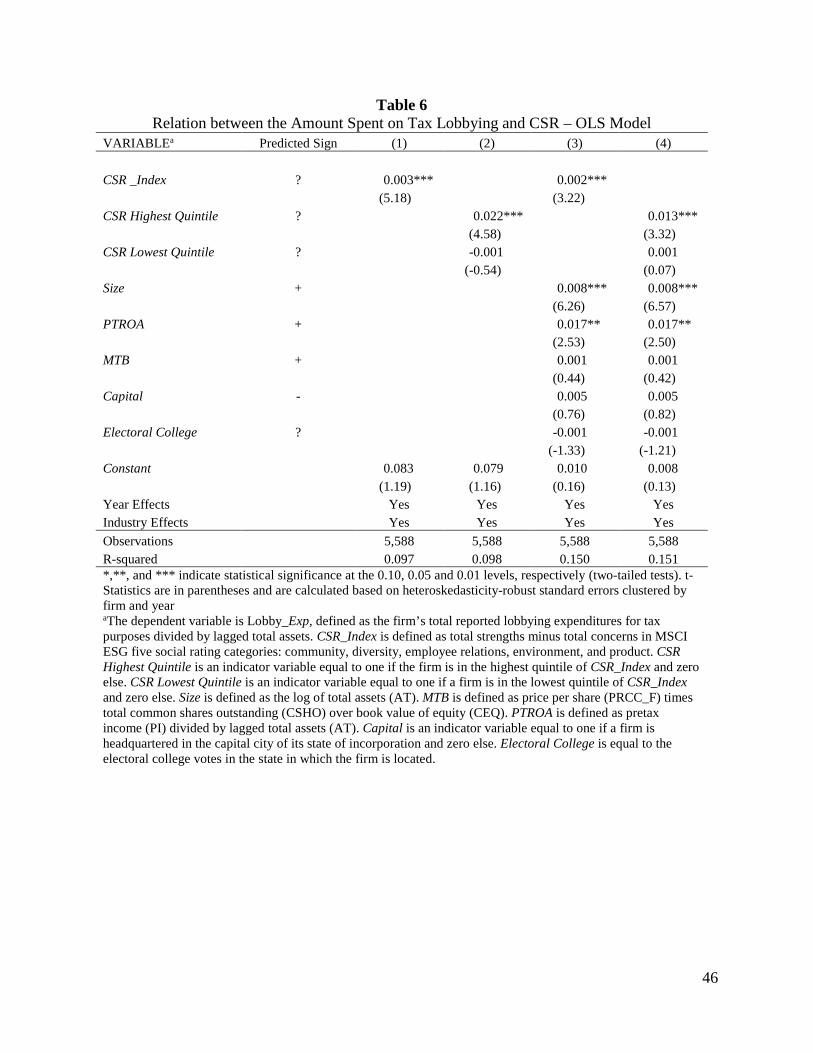
46
Table 6 Relation between the Amount Spent on Tax Lobbying and CSR – OLS Model
VARIABLEa Predicted Sign (1) (2) (3) (4) CSR _Index ? 0.003*** 0.002***
(5.18) (3.22) CSR Highest Quintile ? 0.022*** 0.013***
(4.58) (3.32) CSR Lowest Quintile ? -0.001 0.001
(-0.54) (0.07) Size + 0.008*** 0.008***
(6.26) (6.57) PTROA + 0.017** 0.017**
(2.53) (2.50) MTB + 0.001 0.001 (0.44) (0.42) Capital - 0.005 0.005 (0.76) (0.82) Electoral College ? -0.001 -0.001
(-1.33) (-1.21) Constant 0.083 0.079 0.010 0.008
(1.19) (1.16) (0.16) (0.13) Year Effects Yes Yes Yes Yes Industry Effects Yes Yes Yes Yes Observations 5,588 5,588 5,588 5,588 R-squared 0.097 0.098 0.150 0.151 *,**, and *** indicate statistical significance at the 0.10, 0.05 and 0.01 levels, respectively (two-tailed tests). t-Statistics are in parentheses and are calculated based on heteroskedasticity-robust standard errors clustered by firm and year aThe dependent variable is Lobby_Exp, defined as the firm’s total reported lobbying expenditures for tax purposes divided by lagged total assets. CSR_Index is defined as total strengths minus total concerns in MSCI ESG five social rating categories: community, diversity, employee relations, environment, and product. CSR Highest Quintile is an indicator variable equal to one if the firm is in the highest quintile of CSR_Index and zero else. CSR Lowest Quintile is an indicator variable equal to one if a firm is in the lowest quintile of CSR_Index and zero else. Size is defined as the log of total assets (AT). MTB is defined as price per share (PRCC_F) times total common shares outstanding (CSHO) over book value of equity (CEQ). PTROA is defined as pretax income (PI) divided by lagged total assets (AT). Capital is an indicator variable equal to one if a firm is headquartered in the capital city of its state of incorporation and zero else. Electoral College is equal to the electoral college votes in the state in which the firm is located.

47
Table 7 Splitting Corporate Social Responsibility Scores
Variable Split Variable Split Governance
Added to Index Governance Added
to Index VARIABLEa (1) (2) (3) (4) Sum of Negative CSR 0.002 0.002 (0.95) (1.02) High Negative CSR 0.001 0.006 (0.08) (0.67) Sum of Positive CSR -0.003** -0.003** -0.003** -0.003** (-2.20) (-2.29) (-2.29) (-2.37) Size -0.011*** -0.012*** -0.011*** -0.012*** (-3.27) (-3.51) (-3.46) (-3.51) Leverage -0.056*** -0.055*** -0.056*** -0.056*** (-2.98) (-2.93) (-2.98) (-2.94) Intang -0.017 -0.015 -0.017 -0.016 (-0.86) (-0.77) (-0.83) (-0.77) Tax_Bnft_Opt -1.189** -1.165** -1.178** -1.167** (-2.04) (-1.97) (-2.01) (-1.97) PTROA 0.027 0.027 0.028 0.028 (0.64) (0.66) (0.66) (0.66) MTB -0.001 -0.001 -0.001 -0.001 (-0.25) (-0.23) (-0.24) (-0.23) For_Inc 0.020*** 0.020*** 0.020*** 0.020*** (4.00) (4.02) (4.01) (4.02) SG&A 0.038** 0.039** 0.038** 0.039** (2.19) (2.21) (2.19) (2.20) R&D -0.178** -0.173** -0.176** -0.173** (-2.25) (-2.19) (-2.21) (-2.18) NOLCF Amount -0.232*** -0.234*** -0.233*** -0.234*** (-8.19) (-8.30) (-8.24) (-8.29) NOLCF Indicator 0.003 0.003 0.003 0.0031 (0.39) (0.47) (0.42) (0.47) PP&E -0.036* -0.035 -0.036* -0.035 (-1.65) (-1.63) (-1.65) (-1.63) Governance 0.001 0.001 0.003 0.004 (0.28) (0.26) (0.53) (0.74) Cash -0.138*** -0.137*** -0.137*** -0.137*** (-5.14) (-5.13) (-5.14) (-5.12) Excess Cash 0.016*** 0.017*** 0.016*** 0.016*** (3.72) (3.71) (3.71) (3.71) Financial Constraints -0.016** -0.017** -0.016** -0.016**

48
(-2.51) (-2.55) (-2.51) (-2.54) Constant 0.413*** 0.412*** 0.416*** 0.413*** (6.06) (5.94) (6.06) (6.01) Year Effects? Yes Yes Yes Yes Industry Effects? Yes Yes Yes Yes Observations 5,588 5,588 5,588 5,588 R-squared 0.196 0.197 0.197 0.197
*,**, and *** indicate statistical significance at the 0.10, 0.05 and 0.01 levels, respectively (two-tailed tests). ). t-Statistics are in parentheses and are calculated based on heteroskedasticity-robust standard errors clustered by firm and year. aThe dependent variable is Cash_ETR, defined as the 5 year sum (from year t-4 to year t) of cash taxes paid (TXPD) divided by the 5-year sum of pre-tax income less special items (SPI). In order to allow for meaningful interpretation firms are required to have a Cash ETR between 0 and 1. Size is defined as the log of total assets (AT). Sum of Negative CSR is the sum of CSR concerns from MSCGI ESG STAT’s five social rating categories: community, diversity, employee relations, environment, and product. High Negative CSR is an indicator variable equal to one if a firm has more than 3 CSR concerns. Sum of Positive CSR is the sum of CSR strengths from MSCGI ESG STAT’s five social rating categories: community, diversity, employee relations, environment, and product. Size is defined as the log of total assets (AT). Leverage is defined as long term debt (DLTT) plus short term debt (DLC) scaled by lagged total assets (AT). Intang is defined as intangible assets (INTAN) divided by lagged total assets (AT). Tax_Bnft_Opt is defined as the tax benefit of stock options (TXBCOF) divided by lagged total assets (AT). PTROA is defined as pretax income (PI) divided by lagged total assets (AT). MTB is defined as price per share (PRCC_F) times total common shares outstanding (CSHO) over book value of equity (CEQ). For_Inc is defined as the absolute value of pretax foreign income (PIFO) divided by the absolute value of pretax total income (PI). SG&A is defined as selling, general and administrative expense (XSGA) divided by lagged total assets (AT). R&D is defined as research and development expense (XRD) divided by lagged total assets (AT). NOLCF Amount is defined as the amount of tax loss carryforward (TLCF) divided by lagged total assets (AT). NOLCF Indicator is an indicator variable equal to one if a firm has a non-zero tax loss carryforward (TLCF) and zero else. PPE is net property, plant and equipment (PPENT) divided by lagged total assets (AT). Governance is defined as the number of corporate governance strengths (CGOV_STR_NUM) less the number of corporate governance concerns (CGOV_CON_NUM) in MSCI ESG database. Cash is defined as cash and cash equivalents (CHE) divided by lagged total assets (AT). Excess Cash is measured following Fresard and Salva (2010). Financial Constraints is measured using the index developed by Hadlock and Pierce (2010).