do voting machine cause lost votes?
DESCRIPTION
Do Voting Machine Cause Lost Votes?. 17.871 Spring 2012. 2000 Presidential Election. 2000 Presidential Election. 2000 Presidential Election. How do we know if some voting machines are more prone to “lost votes” than others?. - PowerPoint PPT PresentationTRANSCRIPT

Do Voting Machine Cause Lost Votes?
17.871Spring 2012

2000 Presidential Election

2000 Presidential Election
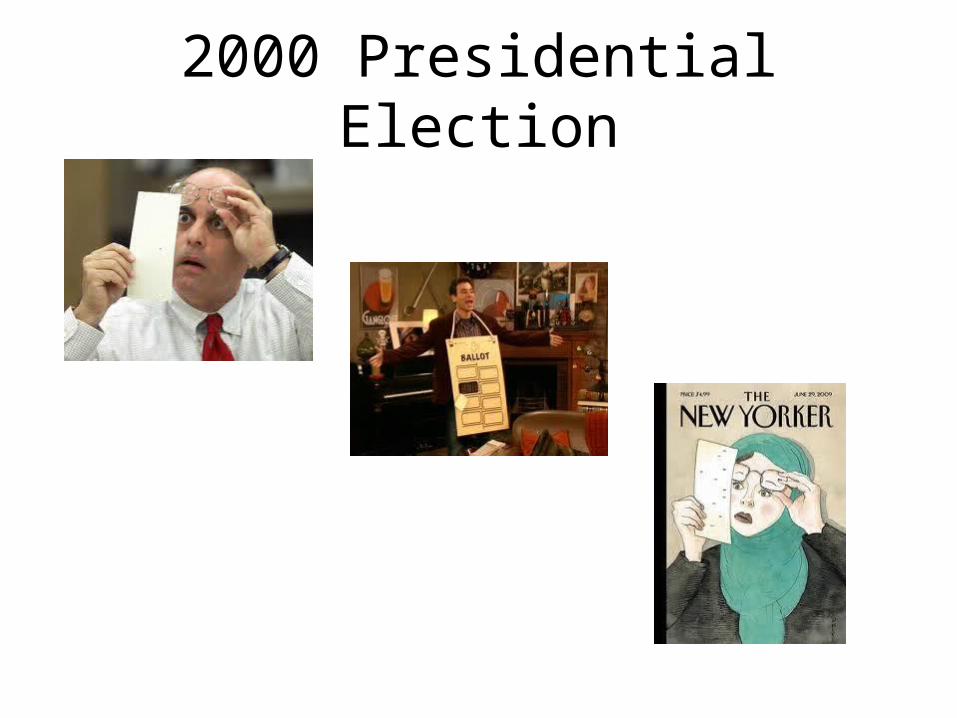
2000 Presidential Election

How do we know if some voting machines are more prone to “lost votes” than others?
If some are prone to more lost votes than others, how big of a problem is it?

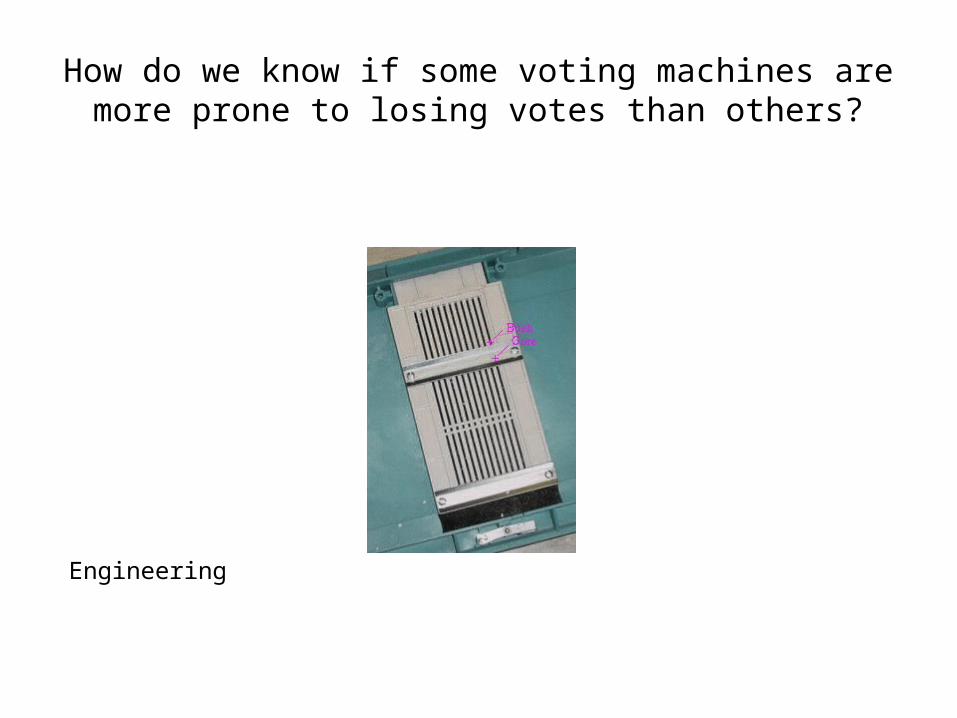
How do we know if some voting machines are more prone to losing votes than others?

How do we know if some voting machines are more prone to losing votes than others?
Law

How do we know if some voting machines are more prone to losing votes than others?
Engineering
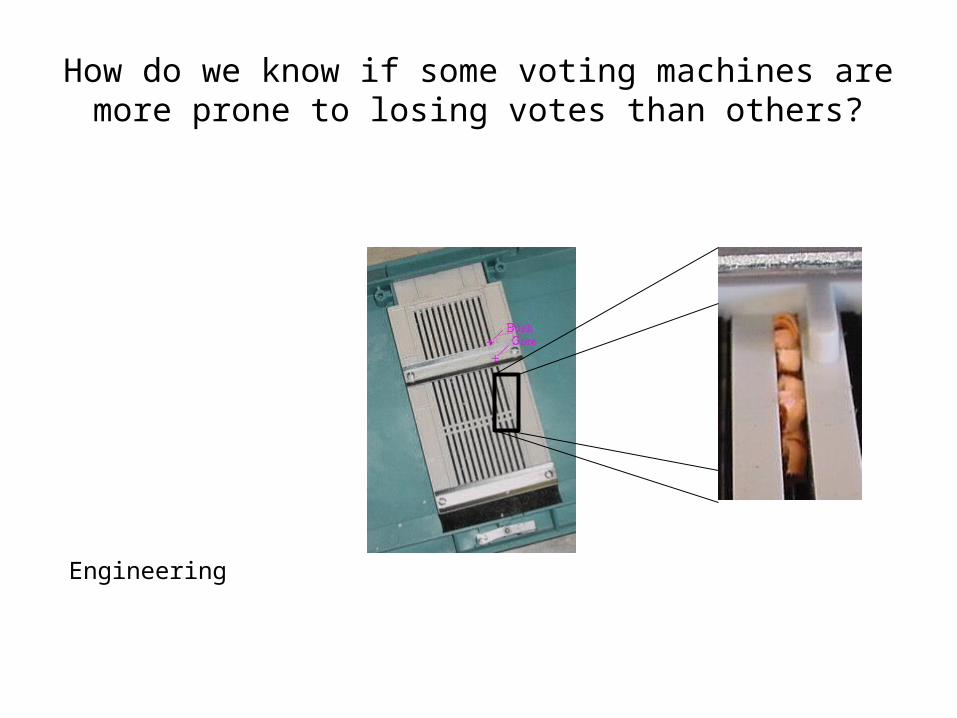
How do we know if some voting machines are more prone to losing votes than others?
Engineering
How do we know if some voting machines are more prone to losing votes than others?
Engineering
Tech.Under-
vote pct.Over-vote
pct.Lost vote
pct.Number of
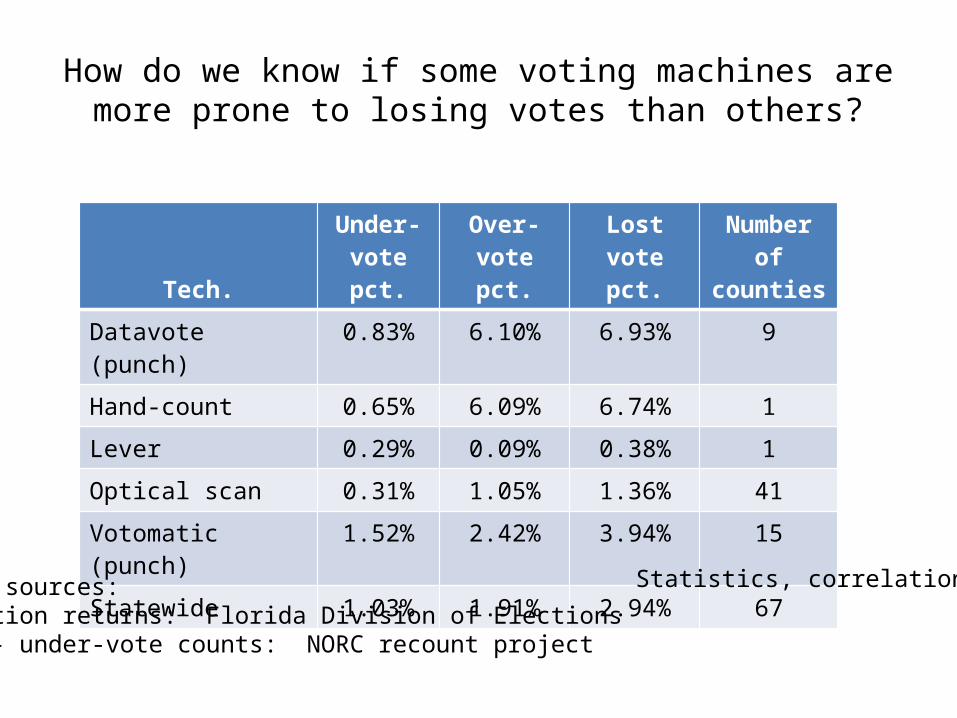
countiesDatavote (punch) 0.83% 6.10% 6.93% 9
Hand-count 0.65% 6.09% 6.74% 1
Lever 0.29% 0.09% 0.38% 1
Optical scan 0.31% 1.05% 1.36% 41
Votomatic (punch) 1.52% 2.42% 3.94% 15
Statewide 1.03% 1.91% 2.94% 67
Data sources:Election returns: Florida Division of ElectionsOver- under-vote counts: NORC recount project
How do we know if some voting machines are more prone to losing votes than others?
Statistics, correlational

An Aside: The Butterfly Ballot Mattered

Number of ballot columns
Technology 1 2 Total
Datavote (punch) 7.09%(7)
6.73%(2)
6.93%(9)
Hand-count 6.74%(1)
6.74%(1)
Lever 0.38%(1)
0.38%(1)
Optical scan 0.89%(27)
7.03%(14)
1.36%(41)
Votomatic (punch) 2.91%(13)
8.07%(2)
3.94%(15)
Total 2.06%(48)
7.81%(19)
2.94%(67)
Many Columns Are Bad

Machine in 2000
Machine in 1988: Votomatic Lever Opscan DRE TotalVotomatic -0.52%
(171)-1.96%(179)
-0.40%(8)
-0.98%(365)
Lever -0.69%(2)
-0.08%(114)
-0.24%(65)
0.66%(111)
0.03%(294)
Opscan -1.42%(74)
-0.84%(1)
-1.33%(75)
DRE -1.92%(35)
Total -0.92%(215)
-0.08%(119)
-1.29%(616)
-0.94%(65)
-0.81%(1,402)
Note: the table isn’t complete, although the totals in the columns and rows reflect the entire table
How do we know if some voting machines are more prone to losing votes than others?
(Quasi-)Experimental

Some points relevant to 17.871
• Political science can provide a service to society by framing questions causally, and reducing complicated matters to clear observables.
• Addressing important questions of public policy requires creative combinations of insight, data, and method.

Relevant to the Syllabus (to come)
• Statistics

Relevant to the Syllabus (to come)
• Statistics• Mechanics

Relevant to the Syllabus (to come)
• Statistics• Mechanics• Project