do whole-school reform programs boost student performance · do whole-school reform programs boost...
TRANSCRIPT
Do Whole-School Reform Programs Boost Student Performance?
The Case of New York City
Final Report
Submitted to the Smith-Richardson Foundation by
Robert Bifulco Carolyn Bordeaux
William Duncombe John Yinger
June 28, 2002

Table of Contents Chapter 1: Introduction and Executive Summary 1 Chapter 2: Review of the Literature on Whole-School Reform 11 Chapter 3: Whole-School Reform Efforts in New York City and the Study Sample 29 Chapter 4: Data Sources and Variable Measurement 45 Chapter 5: Analysis of the Implementation of Whole-School Reform 61 Chapter 6: Evaluation Methodology 103 Chapter 7: Evaluation Results: 141
The Effectiveness of Whole-School Reform in New York City Chapter 8: Conclusions 191 References 198 Attachment 1: Proposed Data-Collection Workplan 202 (Memo dated February 14, 2000) Attachment 2: Principal Surveys of Policies and Practices in New York City Schools 203 Attachment 3: Cover Letters Used for Principal Survey 278
Chapter 1: Introduction
This document is the final report on the project titled “Do Whole-School Reform
Programs Boost Student Performance? The Case of New York City.”
This project began over two years ago. The early stages of the project were devoted to
data collection. Student-level data were collected from the New York City Board of Education’s
Division of Accountability and Assessment. This work was completed in February 2000. School
and teacher data were collected from the New York State Education Department and the New
York City Board of Education. This step was completed in March 2002. The next step, which
was completed in June 2000, was to interview people involved in the implementation of whole-
school reform in New York City. Among others, we interviewed Robert Slavin, president and
founder of Success for All, Ben Burdsell, President and Founder of More Effective Schools,
Christine Emmons, Director of Evaluation and Research for the School Development Program,
officials from New York City schools responsible for implementing whole-school reform, and
officials from the New York State Education Department responsible for overseeing these
efforts.
Another large part of our data collection effort involved designing and administering a
telephone survey of current and former principals in the schools in our study sample. This
process is described in Attachment 1 and the survey instruments are provided as Attachment 2.
This part of our data collection was completed in August 2000.
The rest of 2000 was devoted to developing measures of program implementation and to
preparation of the final data set. The final implementation measures are described at length in
Chapter 5 of this report. The final data set blends all the sources of data, after extensive checks
for accuracy and consistency.
Development of the research design for the project began in 2000. Preliminary research
plans were presented at three professional conferences, the American Education Finance
Association (March 2000), the American Association for Budgeting and Financial Management
(October 2000), the Association for Public Policy Analysis and Management (November 2000).
These plans were revised in response to comments received at these conferences and from other
colleagues and on the basis of extensive conversations among the people on the research team.
The data analysis was conducted largely in 2001. A preliminary version of the main
results was presented the American Education Finance Association (March 2001) and updated
results were presented at the same conference the following year (March 2002). The results were
further refined and expanded to produce this report and other products associated with this
project.
Chapters 2, 3, 4, 6, and 7 of this report were drafted by Robert Bifulco, under the
supervision of William Duncombe and John Yinger. Chapter 5 was drafted by Carolyn Bordeaux
and William Duncombe. The final chapter was a group effort, and the entire manuscript was
edited by John Yinger.
This project has produced a variety of products, in addition to this report, and several
more products are in the works. Preliminary methodological designs for this study were
presented in Bifulco (2000) and Bifulco, Duncombe, and Yinger (2000). The main product, on
which this report draws heavily, is Robert Bifulco’s Ph.D. dissertation (Bifulco 2001), which
was supervised by William Duncombe and John Yinger. So far, one journal article and one book
chapter have been drawn from this dissertation, Bifulco (forthcoming a, forthcoming b). Several
other papers are under preparation for submission to a professional journal, including one
presenting the study’s main substantive results.
This report contains eight chapters, including this one. Chapter 2 reviews the literature on
whole-school reform programs, with a focus on the programs evaluated in this report. Chapter 3
explains what motivated whole-school reform efforts in New York City and describes the
schools in our sample. Chapter 4 describes the data set assembled for the project. Chapter 5 turns
2

to the implementation analysis. It discusses what we learned about variation in the
implementation of whole-school reform programs across schools. Chapter 6 describes our
evaluation methodology, and Chapter 7 presents our findings, that is, it presents what we found
about the effectiveness of whole-school reform in New York City. The final chapter presents our
key conclusions.
3

1.2. Executive Summary
This report explores the effectiveness of whole-school reform efforts in New York City
in the 1990s. Whole-school reform plans attempt to change the operation of public schools in
comprehensive, fundamental ways in order to boost student performance. They are used
throughout the country, particularly in schools with many low-income students, and are now
supported, in many cases, by federal funding. This study takes advantage of unique
circumstances in New York City to investigate the impact on student performance of extensive
efforts to implement whole-school reform.
New York City is an excellent place to study whole-school reform because so many
schools there have turned to whole-school reform as a way to deal with poor average student
performance. New York State programs to identify and assist low-performing schools led to the
adoption of whole-school reform in 56 elementary schools in the mid-1990s. During the same
period, 2 of the 32 community school districts in New York City decided to encourage whole-
school reform. As a result, whole-school reform models were adopted by all 19 elementary
schools in one district and 6 elementary schools in the other (followed by 3 more a few years
later). Additional initiatives by the Chancellor of the New York City schools and by the federal
government boosted the total number of elementary schools in the City using whole-school
reform to over 100.
Despite their popularity in New York City and elsewhere, whole-school reform plans are
not supported by extensive empirical evidence. Many studies of whole-school reform plans exist,
but they often focus on one or two demonstration sites, which receive far more attention than a
large sample of public schools could expect; they usually do not investigate impacts beyond the
elementary school years; and they usually were not conducted by independent researchers. This
study addresses all of these limitations in the current research. We examine a large number of
4

schools implementing whole-school reform, we investigate impacts through fifth grade for some
of the students in our sample; and we have no connection with any of the program designers.
This study does not make use of random assignment, sometimes considered the best
methodology for evaluating a program such as whole-school reform. In fact, however, random
assignment has some serious limitations for investigating this topic. In order for some schools to
be randomly assigned to the treatment group, that is, the group in which whole-school reform is
implemented, a researcher must identify a larger set of schools set of schools interested in whole-
school reform and then randomly deny some of them the ability to implement a whole-school
reform plan. This is obviously a difficult task, and it has been attempted only a few times even
on the moderate scale of about 10 treatment schools. Moreover, because studies based on random
assignment are small in scale and difficult to arrange, the treatment schools in these studies are
inevitably demonstration schools, in the sense that they receive far more attention than would the
average school in a large-scale effort to implement whole-school reform. The approach in this
study therefore has three major advantages over random assignment: it examines the impacts of
a large-scale whole-school reform effort, it does not focus on demonstration schools, and it can
determine whether the impact of whole-school reform on student achievement depends on the
extent to which the whole-school reform model was actually implemented.
Before evaluating program impacts, we explore program implementation. Our
contributions are to develop several measures of the extent to which whole-school reform
programs are actually implemented. In particular, we examine the diffusion of key components
of whole-school reform models into comparison-group schools, and we develop summary
measure of program implementation in treatment-group schools. The summary measures, which
are based on surveys conducted by the program developers, provide a way to observe variation in
implementation across the elementary schools adopting the School Development Program (SDP)
or Success for All (SFA).
5
The diffusion analysis, which is based on surveys developed and conducted for this
project, reveals that key elements of SDP are widely used by both treatment and comparison
schools. In contrast, the reading programs associated with SFA are well implemented in SFA
schools but are not widely dispersed elsewhere. We also find some evidence that suggests a
steady increase in the extent to which SDP and SFA are implemented during the first 3 to 5 years
of the program. However, there is wide variation in implementation across schools.
The basic approach of this study is to compare the test-score performance of students in
schools that adopted whole-school reform with the performance of students in comparable
schools that did not take this step. The treatment group is limited to schools that adopted a
whole-school reform model in either the 1994-95, 1995-96, or 1996-97 school year. We can
observe student performance through the 1998-99 school year, so we can follow all the students
in our sample for at least three years following model adoption. To ensure an adequate number
of schools with any given whole-school reform model, the treatment group also is restricted to
elementary schools that adopted School Development Program (SDP), Success for All (SFA), or
More Effective Schools (MES). A total of 49 schools met these criteria and were included in the
treatment group. We then used a stratified, random sampling technique to select comparison
schools from among the elementary schools in New York City that consistently fell short on
student performance but did not adopt whole-school reform. The final sample contains 42
comparison schools.
We obtained data on individual students from the New York City Board of Education.
These data covered all students who were in third grade in one of the sample schools during
either the 1994-95, 1996-97 or 1998-99 school years, but the amount of data varied by cohort.
For a student in third grade in 1994-95 (assuming that student remained in the New York City
public school system and was not absent for or exempted from any tests), the data included test
scores for each year from second through seventh grade. For students in third grade in 1996-97,
6

the data include scores for third grade through fifth grade. For students in third grade in 1998-99,
the data provide only third grade scores.
The data set also contains additional information on each student, including the student’s
date of birth, sex, ethnicity (native American, Asian, Hispanic, black, or white), and home
language, and whether the student was eligible for free or reduced-priced lunch. These data for
individual students were combined with data for schools, obtained from both the New York City
Board of Education and the New York State Department of Education. School measures in the
data set include information on enrollments; student ethnic and socioeconomic characteristics;
class sizes; teacher and staff education, experience and salaries; student and teacher attendance
rates, student suspensions; and aggregate results on several statewide and citywide testing
programs.
As it turns out, a substantial number of students in each cohort are missing one or more
test scores. In estimating the impacts of whole-school reform on student performance, we can
only use those observations for which test scores are reported, so our estimates are based on a
non-random selection of students. To test the sensitivity of our results to the potential selection
bias from this non-random selection, we estimate all our equations both with and without a
standard selection correction term.
To estimate the impact of each whole-school reform model on student performance, we
rely primarily on comparisons between students who attended schools that adopted whole-school
reform and students who attended the schools in the comparison group. Deriving valid estimates
of model impacts from such comparisons poses a host of challenges. The primary difficulty is
created by the self-selected nature of the treatment groups. Schools that decided to adopt whole-
school reform, and the students that attend them, are different than schools that choose not to
adopt, and their students.
7

We argue that the best way to estimate the impact of whole-school reform under these
circumstances is with a difference-in-difference estimator, which accounts for the unobserved
fixed factors and the unobserved linear time trend for each school. In other words, this approach
eliminates the possibility of self-selection bias from any factor except unobserved nonlinear time
trends at each school.
The problem that arises in our study, and in most other studies of whole school reform, is
that we do not have enough data to implement a difference-in-difference estimator for many of
the students in our sample. Thus, we use the cohort of students for which we have the best data
to identify limited-information methods that yield the same inferences as the full-information
difference-in-difference estimator. We find that an instrumental-variables procedure meets this
test. As a result, we use an instrumental-variables procedure to identify program impacts for
student cohorts with less-than-complete information. Our methodological findings should be of
interest to other scholars studying whole-school reform, who typically do not have complete
information, either.
The decision to adopt SDP does not show any significant, positive impacts until the 1998
and 1999 school years. During these later years it shows a positive impact on the reading
performance of fourth graders and a positive impact on the math performance of third graders. In
keeping with the claims of model developers, this suggests that it may take several years before
efforts to implement SDP begins to influence student performance. Note, however, that these
positive impact estimates during later implementation years are small and are not robust across
estimation methods, perhaps because elements of SDP are widely used in the comparison
schools.
The decision to adopt More Effective School (MES) shows several statistically
significant positive impact estimates, particularly on reading during 1996 and 1997. Further
analyses of the positive impacts observed for students in third grade in 1999 suggest that these
8

estimates are driven by significant gains made by students who attended an MES school during
the 1995-96 and/or 1996-97 school years. Overall, the pattern of estimates for MES suggests that
the decision to adopt this model had significant impacts during 1995-96 and 1996-97 school
years, which may have been partially lost during the 1997-98 and 1998-1999 school years. This
result might be explained by the fact the MES trainers stopped working with these schools after
the 1996-97 school year.
SFA shows statistically significant, negative impacts for fifth grade reading. In addition,
students who were in third grade in 1998-99 and who attended a SFA school only during second
and/or third grade scored lower in reading and math than comparison group students. One
plausible explanation for these negative impacts is that, in keeping with the model’s emphasis on
preventing reading failures in the early grades, the decision to adopt SFA diverts resources and
attention away from later elementary school grades (3-5) to the detriment of the students in these
grades. In other words, we cannot observe whether or not SFA has a positive impact on student
performance during the early elementary school grades, but we can observe that any gains that
arise during these grades are offset by losses in the later elementary school grades.
Finally, we ask, for SDP and SFA, whether the small impacts of these whole-school
reform models on student performance are a reflection of poor implementation of these models
by school officials. We find that impacts of SDP were unambiguously higher in schools with
higher quality program implementation. These findings are consistent with possibility that better
implementation would boost program impacts, but we cannot rule out the alternative possibility
that schools more able to implement elements of the SDP model were already more effective
schools. The results for SFA are more ambiguous, but we find some evidence consistent with the
view that more effective implementation of SFA’s prescriptions are associated with more
positive impacts on student performance.
9

Overall, our results indicate that whole-school reforms may have small positive impacts
on student performance, but low-performing schools should not expect whole-school reform to
be a panacea. In addition, any school deciding to adopt a whole-school reform model should
recognize that careful, sustained implementation may be necessary for positive program impacts
to emerge.
10

Chapter 2: Review of the Literature on Whole-School Reform
2.1. Introduction
Whole-school reform has emerged as one of the leading strategies for improving school
productivity, particularly in urban schools that serve disadvantaged and minority students.
Recent initiatives include the Comprehensive School Reform Demonstration program first
enacted by Congress in 1997. Reauthorized in 2002 for $260 million, this program provides
grants to schools to adopt “research-based” school-wide reform models. Also in 1997, the New
Jersey Supreme Court issued a ruling in response to school finance litigation requiring hundreds
of schools across the state to adopt a particular whole-school reform program (Goertz and
Edwards 1999). In addition to these high-profile initiatives, several large urban districts
including Memphis, Miami-Dade, and New York City have undertaken ambitious efforts to
implement whole-school reform models. As a result of efforts such as these, whole-school
reform models had been adopted in over 10,000 schools by the 2000-2001 school year.
Two things distinguish this school reform strategy. The first is a focus on the individual
school as the unit of improvement, which distinguishes whole-school reform from strategies that
focus on system-wide policies and larger governing institutions. The second distinguishing
feature is an emphasis on addressing multiple aspects of school operations in a coordinated
fashion, including decision making, resource allocation, classroom organization, curriculum,
parental involvement, and student support. This distinguishes whole-school reform from
traditional school level interventions, which have tended to focus on one or another of these
issues in piecemeal fashion.

Barnett (1996) reviews three of the most widely disseminated whole-school reform
models: Success for All, the School Development Program, and Accelerated Schools.1 This early
assessment concluded that “all three models can be implemented as described by their
developers without substantial increases in per pupil school expenditures,” but that the “evidence
for the models’ effects on educational outcomes for disadvantaged children is more ambiguous.”
Other studies have come to similar conclusions and have called for more research on whole-
school reform models. A recent publication of the National Research Council concluded that
whole-school reform designs have “achieved popularity in spite rather than because of strong
evidence of effectiveness” (Ladd and Hansen 1999: 153).
This chapter reviews the previous evidence on the impacts of the three whole-school
reform models examined in this study. After considering the evidence on each of three models
separately, we provide a general statement of the shortcomings of this evidence, and explain how
this study helps to address some of these shortcomings.
2.2. Success for All
Among the leading whole-school reform models, Success for All (SFA) has placed the
most emphasis on evaluation. Program developers and others closely associated with the
developers have conducted evaluations of 29 program sites in 11 different districts across the
country (Slavin and Madden in press). In these evaluations, each SFA school is matched with a
comparison school, and then each student in the SFA school is matched with a student in the
comparison school based on kindergarten or first-grade test scores. Each cohort of students
entering kindergarten after adoption of SFA is followed through the third grade and in most
cases through the fifth grade. In a meta-analysis of these evaluations, Slavin and Madden (in
press) find that, on average, SFA students performed higher than comparison group students on 1 Success for All is the program mandated by the New Jersey Supreme Court.
12

multiple measures of reading skills. Average effect sizes ranged from 0.39 to 0.62 with the
largest gains in Grade 5. Effects for students who score in the lowest quartile on pre-tests were
larger, ranging from 1.03 in first grade to 1.68 in fourth grade. Slavin et al. (1994) report that not
only were program effects positive on average, but also that they have been positive in all but
one of the individual program sites evaluated (among those evaluations conducted prior to 1994).
Assessments by independent researchers have found less consistent results. In an
independent analysis of the original pilot sites in Baltimore, Venezky (1994) finds that although
SFA students outperformed students in comparison schools, positive impacts were limited to
kindergarten. As a result, SFA students remained below average and continued to fall further
below grade-level each year. A study by Smith, Ross, and Casey (cited in Jones, Gottfredson,
and Gottfredson 1997) evaluates sites in four different cities, and concludes that there were
positive program effects in three of the four cities. However, positive effects were not found for
all grades and one of the cities showed positive program effects only after two of the four
treatment-control school pairs were dropped because the control school used instructional
practices similar to those prescribed by SFA.
The research design used in the SFA studies is superior to those used in many whole-
school reform evaluations. Nonetheless, several concerns can be raised. Jones, Gottfredson, and
Gottfredson (1997) question the reliance on student assessments not used for more general
evaluation purposes. Results from independent studies suggest that higher performance by SFA
students on the tests selected by program evaluators may be due partly to greater familiarity with
the tasks required by the tests. Ross and Smith (1994) found that SFA students scored higher
than comparison group students on the tests used in the program developer’s evaluations, but
could not find similar effects using results from the Tennessee Comprehensive Assessment
13

Program. Borman and Hewes (2001) examine the five original model sites in Baltimore, and
estimate model impacts on scores from district-wide reading tests in eighth grade. Evaluations of
these sites by program developers suggest effect sizes in fifth grade greater than 0.50. Borman
and Hewes estimate effect sizes of 0.27. These smaller effects may be due to smaller gains by
SFA students than comparison students during middle school. Alternatively, they suggest that
SFA impacts on general accountability measures are smaller than the effects estimated by
program developers.
Along with questions of construct validity, evaluations conducted by program developers
are susceptible to potential selection biases. SFA is implemented only in schools where 80
percent of the faculty agrees to adopt the program in a secret ballot. Evaluations conducted by
program developers typically do not indicate whether a similar vote was taken in the comparison
schools. If comparisons schools would not have agreed to program adoption, it might reflect
unobserved differences in school climate or faculty characteristics. These differences, rather than
adoption of SFA, might account for any observed differences in student performance.
Finally, the 29 sites included in these evaluations are not a representative sample of SFA
schools. Six of the schools are initial model sites that received extensive and close attention from
the program designers. In addition, local problems ended evaluations of other sites prematurely.
Slavin (1997) argues that prescriptive models like SFA “are expected to work in nearly all
schools that make an informed, uncoerced decision to implement them and have adequate
resources to do so.” He presents this as one of the primary advantages of SFA over more
facilitative approaches to whole-school reform. However, existing evaluations of SFA provide
little evidence for this assertion. The purpose of most studies has been to evaluate program
effects on the reading achievement in cases where implementation has been successful. One
14

study that explicitly assesses implementation quality across multiple sites found that schools do
indeed vary in how well they implement the program and that this variation influences program
effectiveness (Smith, Ross, and Nunnery 1997).
Little attention has been paid to the effects of SFA in subjects other than reading. In a
comparison of one SFA school with a matched control school, Jones, Gottfredson, and
Gottfredson (1997) find that effects on math tests for first and second graders were negative.
This suggests that gains in reading may come at the expense of development in other subjects.
Borman and Hewes (2001) find that the effects of SFA on eighth grade math scores are smaller
than the effects on eighth grade reading scores, but still positive.
Two recent studies provide more generalizable findings on the impacts of SFA. Sanders
et al. (2000) compare test score gains, adjusted for student socioeconomic characteristics, in 22
schools that adopted SFA between 1995-96 and 1997-98 to gains made in 23 comparison
schools. The study examines average gains made during fourth and fifth grade across five
subjects (math, reading, language, science, and social science), each assessed by the Tennessee
Comprehensive Assessment Program. It finds that in the year prior to adoption, the schools that
adopted SFA show adjusted gains about 92 percent as large as the gains in the 23 comparison
group schools. By 1999, two to four years after adoption, the 22 SFA schools show adjusted
gains 110 percent as large as the gains in the comparison group schools. Hurley et al. (2001)
examines all 111 of the schools in Texas that adopted SFA between 1994 and 1997. The analysis
compares the percentage of students in grades 3-5 scoring above proficiency on the reading
portion of the Texas Assessment and Accountability System in the year prior to adoption and
during 1998 (one to four years after adoption). The percent above proficiency improved for all
Texas schools, but increases were greater for SFA schools. Increases in the percentage of blacks
15

scoring above proficiency were, on average, 5.62 percentage points greater in SFA schools than
in non-SFA schools.
These two studies address several shortcomings of earlier studies. The sample of schools
examined is not restricted to pilot sites where special efforts have been made to ensure
implementation, and outcomes used for more general accountability purposes are examined.
They also examine more recent versions of the model that include curriculum for later grades
and in subjects other than reading. However, the studies do not address potential biases due to
the fact that SFA schools are self-selected. It is possible that adopting schools were more
concerned with raising test scores,2 or had leadership more capable of securing the consensus
required to adopt Success for All.
In sum, it remains difficult to draw precise conclusions about the impact of SFA on
student achievement. Independent evaluations suggest that SFA does not have positive impacts
everywhere, and that average effects are smaller than indicated by the program developers’
evaluations. Nonetheless, recent studies in Tennessee and Texas suggest that, on average,
performance on assessments used for general accountability improves more in SFA schools than
in other schools. More work is needed to determine if improvements in reading are accompanied
by improvements or declines in other subjects.
2.3. The School Development Program
Several evaluations of the School Development Program (SDP) focus on implementation.
These studies, which primarily rely on case-study methodologies, have identified several factors
that facilitate or impede implementation. Factors that make successful and sustained
2 The schools in both studies adopted SFA in the context of high profile state accountability systems. Such systems place greater pressures to improve test scores on some schools than others, e.g., schools identified as low-performing. Schools under greater pressure might be more likely to adopt SFA, and also more likely to pursue other means of raising test scores, such as preparation in test taking skills.
16

implementation more likely include: district support for the model; positive interpersonal
relationships among staff and between staff and parents; competent district or school facilitators
who have experience working with school management teams; commitment to change among the
staff; perception among the staff that problems addressed by the model match the needs of the
school; principal commitment to the model; and access to on-going training. Factors that can
impede implementation include negative experiences with previous school reform programs and
teachers resistance to parental involvement (Haynes et al. 1996; Millsap et al. 1997).
These findings suggest that SDP implementation might be problematic in many urban
settings. Many urban districts and schools suffer frequent superintendent, principal and staff
turnover. As a result, maintaining district, principal or staff support for even a few years can be
difficult. In addition, given the “policy churn” characteristic of many urban school districts and
the multitude of reforms that staff in urban schools are asked to implement (Hess 1998), staff in
troubled schools are likely to have had negative experiences with previous reform programs.
Three recent, independent evaluations provide information about the effects of SDP on
student academic achievement.3 Cook et al. (1998) examine 13 program schools and 10 non-
program schools in Prince George’s County, and Cook, Hunt, and Murphy (1998) compare 10
program schools with 9 non-program schools in Chicago. Both studies matched several pairs of
schools on the basis of test scores and racial composition, and then randomly assigned one
school from each pair to adopt SDP. Both studies focus on students in the middle school grades,
and use multiple measures of student outcomes prior to and following exposure to the School
Development Program. In addition, both studies used student and teachers surveys to obtain
measures of implementation and school climate.
3 Of the studies conducted by program developers that examine student outcomes, only two use designs sufficiently rigorous to provide estimates of model impacts, and neither of these studies examines academic outcomes. For a review of program developer studies see Haynes et al. (1996).
17

Researchers in Prince George’s County found that efforts to implement SDP had virtually
no impact on either the schools or their students. They found no evidence that either student or
staff perceptions of school climate were improving faster in SDP schools than in comparison
schools. Adoption of the model did not have any significant effects on measures of psychological
well-being or conventional school behaviors. Finally, academic achievement gains among the
treatment group students were statistically indistinguishable from gains observed for the control
group students.
In Chicago findings were more positive. Both student and teacher ratings of their school’s
academic climate were approximately the same in the treatment and comparison group schools
during the Spring of the first year of program implementation. By the end of the study, however,
ratings of academic climate in SDP schools were higher than in the comparison group schools.
However, neither student nor staff ratings of social climate in SDP schools improved relative to
the control schools. All schools in the Chicago study reported more acting out as students age,
but the rate of increase was less steep in SDP schools than in the treatment schools. The rate of
decrease in disapproval of misbehavior was also smaller and increases in the ability to control
anger were greater in SDP schools than comparison schools. Finally, researchers found that
students in SDP schools made small but statistically significant gains in both math and reading
relative to students in comparison schools. Particularly, while pre-adoption scores for SDP
students were about 3 percentile points lower than the scores of comparison students on both
reading and math tests, the mean scores of the two groups were the same after four years.
A third study in Detroit has recently been completed by Abt Associates. In this study,
nine schools selected to adopt the School Development Program through a competitive
application process were compared to a set of matched comparison schools. Student achievement
18

measures were obtained from the district assessment program; staff and parent surveys were used
to assess implementation, school climate and parent attitudes; and researchers made regular site
visits to each treatment group school. The evaluators found considerable variation in
implementation across the SDP schools. Moreover, comparison group schools showed SDP-like
structures and processes to as great an extent as the treatment group schools, reflecting the
general diffusion of collaborative planning and management processes. Given these findings on
implementation, it is not surprising that average levels of achievement and average achievement
gains did not differ among students enrolled in SDP schools and those enrolled in comparison
schools. Nor were staff ratings of academic and social climate in SDP schools different than in
the comparison schools (Millsap et al. 2001).
The evaluation team reports three additional findings that reflect more positively on the
School Development Program. First, the three SDP schools that implemented the model most
successfully showed larger achievement gains than their matched comparison schools. Second,
these same schools showed larger improvements in implementing SDP structures and processes
than did comparison group schools that also showed high levels of those structures and
processes. Third, both SDP and comparison group schools that exhibited high levels of SDP-like
structures and processes reported more positive academic and social climate, and higher
achievement levels. The authors’ interpret these findings as evidence that the structures and
processes prescribed by SDP create a more positive school climate which in turn helps to
improve student learning, and that under certain conditions, model adoption can help to establish
the prescribed structures and processes.
Two considerations cast doubt on this interpretation. First, the SDP adopters were
selected through a competitive application process. Thus, although the three high-implementing
19
SDP schools matched their comparison schools on several observed characteristics, they
probably differed from those schools in unobserved ways that predisposed them for
improvement. Second, high student achievement is likely to engender positive academic and
social climate in a school, and in turn, positive planning and management processes. This
alternative explanation for the observed relationship between achievement, climate and SDP
structures and processes gains support from the fact that, while students in schools with superior
climates and more of the prescribed structures showed higher levels of achievement, they did not
show greater gains in achievement.
The conditions for implementing SDP in Prince George’s, Chicago and Detroit were at
least as good, and probably better, than in typical, low-performing urban schools. In each study,
the adopting schools were in districts that supported SDP and were provided more resources for
training and implementation than in the typical model site. Moreover, adopting schools in
Chicago and Detroit demonstrated a desire to adopt SDP, and in Detroit were required to
demonstrate a capacity to implement the model. Even under these conditions, SDP could not
demonstrate consistently positive impacts on students. The lack of significant differences, on
average, between SDP adopters and other schools might be due, in part, to the diffusion of
collaborative decision making processes and other SDP principles beyond model adopters. Each
of these three studies suggests that most schools, regardless of whether or not they have officially
adopted SDP, are implementing key SDP structures and processes. However, even if the
diffusion of collaborative decision making and other SDP-like processes has made schools in
general more productive, these studies still suggest that adoption of the SDP does not provide an
especially effective way to accelerate the diffusion of these beneficial practices.
20

These findings do not imply that adopting SDP cannot be useful for some schools. The
modest, positive impacts found in the Chicago study and the fact that some schools in Detroit
appear to have benefited from adoption, suggests that the model can be a useful part of school
improvement efforts. Model adoption may help to focus for improvement efforts in schools that
are ready to improve, have expressed a commitment to SDP principles, and have support from
the district and from program developers.
2.4. More Effective Schools
The More Effective Schools model is based on the effective schools research conduct
during the 1970s and 1980s. The effective schools literature represents a mostly inductive form
of research. After using one method or another to identify schools with higher than expected
levels of student performance, these studies assess the characteristics and practices of these
schools through some combination of surveys, in-depth interviews and direct observation. The
goal in these studies is to identify a set of characteristics and practices that are commonly found
across effective schools.
Problems with the methods these early studies used to identify high performers, to
measure or otherwise identify their characteristics, and to determine which characteristics are
common across schools have been identified by several reviewers (Purkey and Smith 1983;
Good and Brophy 1986; Levine and Lezotte 1990). More recent effective schools studies have
tried to address these criticisms (Teddlie and Stringfield 1993). However, there are more
fundamental reasons why this type of research does not provide evidence for the efficacy of the
More Effective Schools model or for the validity of its theoretical assumptions. First, a finding
that many effective schools share a given set of characteristics does not imply that all or most
schools that have those characteristics are effective. Strictly, such a finding does not even imply
21

that schools with more of those characteristics (or a certain level of each of those characteristics)
are more likely to be effective. Second, even if most schools with a given set of characteristics
are effective, this does not imply that those characteristics cause the school to be effective.
Finally, even if a given set of characteristics can be shown to cause school effectiveness, it does
not imply that those characteristics can be deliberately established. Nor would such a finding
demonstrate that the school planning process prescribed by More Effective Schools will
consistently lead to the establishment effective school characteristics and practices.
More recent studies have tried to test the conclusions of the effective schools literature
concerning the relationship between school characteristics and student achievement using large
sample, cross-sectional analyses (Witte and Walsh 1990; Chubb and Moe 1990; Zigarelli 1995).
Overall these studies provide support for the conclusion that most effective schools show at least
some of the correlates of effective schools. However, given the unavoidable difficulties of
identifying causal relationships from passive-observational studies of this kind, the evidence that
the correlates of effective schools cause higher levels of achievement provided by these studies is
limited. Also, these studies provide no evidence that adoption of the school planning process
prescribed by More Effective Schools will consistently generate the effective school correlates.
Assessment of these claims requires experimental and quasi-experimental program evaluations.
Our search of the literature uncovered only two evaluations of school improvement
efforts that used the effective schools model developed at the National Center of Effective
Schools Research and Development.4 Miller, Cohen, and Sayre (1984) evaluate a school
improvement project conducted in a large Kentucky school district during the 1982-83 school
4I found several evaluations of other school improvement programs that were described as being based on the effective schools literature. However, the descriptions in these evaluations either did not provide any detail on the improvement model or revealed the program to be sufficiently different from the More Effective Schools model being evaluated in this study. None of these evaluations used designs that could provide estimates of program impacts.
22

year. Ten of the 87 elementary schools in the district participated in a pilot program based on the
Creating Effective Schools guide developed by Brookover et al. (1982). The individuals who led
the implementation efforts also conducted the evaluation. They compared mean levels of math
and reading achievement in the ten pilot schools at the end of the first program year to the mean
achievement levels in the other 77 elementary schools in the district. They used regression
procedures to control for the pre-adoption level of achievement, the percent of students eligible
for free- and reduced-price lunch, the percent of non-white students, and the attendance rate in
each school. Their analysis revealed that significantly larger achievement gains were made in the
project schools in both math and reading.
These findings are surprising. The improvement process used in this case is expected to
take a few years to transform a school’s culture and practices. In addition, the evaluators describe
low levels of commitment to the improvement process among district officials and some
principals, and limited training for leadership teams. Given this, it is unlikely that achievement
gains at the pilot schools are solely a result of the program.
Sudlow (1986) evaluates improvement efforts initiated during the 1983-84 school year in
the Spencerport School District in New York.5 A questionnaire was administered to staff during
each of the first three years after the program was initiated to determine the extent to which the
seven correlates of effective schools were in place. The study defined a correlate as an area of
strength in the school, if two-thirds of the staff indicated that it was in place. The number of
strength areas, using this criteria, increased for each school over the course of the study. The
study also compares student achievement in the first three years following program adoption to
achievement in the year preceding model adoption. However, without comparing the changes in
5According to the Association for Effective Schools, Inc. website, these improvement efforts in Spencerport are the origins of the version of the effective school process used in the More Effective Schools model.
23

achievement at the treatment schools to changes at other schools or examining what other
changes may have taken place in individual treatment schools or the district as whole, these
comparisons cannot be interpreted as program impacts.
Overall, then, there is little empirical evidence about the impacts of More Effective
Schools. Evidence from passive observational studies provides some evidence that the correlates
of effective schools do influence student performance. However, there is virtually no evidence
that the More Effective Schools process can be consistently implemented across a variety of
settings, or that once implemented it will result in higher levels of the seven correlates. Thus,
there is little evidence that the More Effective Schools model improves student performance.
2.5. Shortcomings of Existing Research
Some extensive, high quality evaluations have been conducted for the School
Development Program and Success for All. The same cannot be said for More Effective Schools.
However, even for the School Development Program and Success for All, existing evidence is
far from conclusive. The preceding review reveals several shortcomings with existing research
on comprehensive school reform.
2.2.1. Lack of Independent Evaluations
Because of their strong incentives for showing program success, program developers are
often not in the best position to objectively evaluate the effectiveness of their programs. Many of
the evaluations conducted by program developers are good-faith efforts to provide objective
results, but despite good intentions, beliefs and pressures can strongly affect evaluations.
2.2.2. Small Number of Sites Evaluated
We were able to find only two studies of a total of 15 schools in two districts for More
Effective Schools. Neither of these provided interpretable and convincing evidence about model
24
impacts. Until the recent studies of Prince George’s County, Chicago, and Detroit, the School
Development Program had been evaluated in only a handful of sites. Even including these
studies, and even for Successful for All, a program that has emphasized evaluation from the
beginning, the proportion of program sites that have been evaluated is small.
2.2.3. Lack of Information on Model Interactions
An important question for policymakers is whether or not the impact of a whole-school
reform model varies depending on the circumstances under which it is adopted. For instance,
should we expect model impacts to be different when the decision to adopt is driven by higher-
level mandates than when interest in adoption comes from within the school? Are impacts
greater for schools when there is evidence of a district level commitment to the model? On the
one hand, these schools might have more support for implementation efforts than a school that
has decided to adopt a model on its own. On the other hand, if schools adopt solely because of
pressure from the district, we might expect less internal commitment to the model.
School officials who are considering whether or not to adopt a model, or who are trying
to pick among different models, should know if model impacts are likely to vary with school
and/or student characteristics. For instance, if the impacts of a model depend upon the quality
with which it implemented, then model impacts will vary with factors that influence a school’s
ability to implement the program. We also might suspect that a well-implemented model will
make a greater difference in some schools than others. For instance, because Success for All
provides extensive guidance regarding classroom practices, we might suspect that it adds more
value in schools with a large share of inexperienced or poorly trained teachers. Or, since the
School Development Program is designed to help schools from poor and minority backgrounds,
25

we might expect it to add more value in a school with larger proportions of poor and/or minority
students.
Unfortunately, however, existing studies provide no information on this key issue.
2.2.4. Focus on Short-Term Results
Many existing studies only examine a student’s performance in schools in the first few
years after program implementation. Some program developers maintain that observable
improvement in academic performance may require significantly more time. Thus, failure to
show improved student performance after one or two years does not necessarily imply that the
program has been or will be ineffective. On the other hand, gains that appear in the early years
after implementation might disappear in later years, thereby undermining claims of program
effectiveness. Nevertheless, only a small number of evaluations have examined school
performance three or more years after program adoption.
2.2.5. Inadequate Methods of Estimating Model Impacts
Isolating the effects of a school-wide reform model on student achievement requires
some method of controlling for potential preexisting differences in student and organizational
characteristics between adopting and non-adopting schools. Existing evaluations use various
methods to achieve this including random assignment, matching, and regression analysis. The
problem with the matching and regression procedures that have been used is that they only
control for limited set of differences between adopting and non-adopting schools. For instance,
the matching procedures used in the Success for All studies do not consider potential differences
in the resources available to schools, most importantly the quantity and quality of teachers.
Many variables that have important influences on student performance and/or the impact
of whole-school reform models are inherently difficult to measure, such as student and staff
26

motivation. Given the process by which schools decide to adopt a whole-school reform model,
we might expect differences in these unobserved factors between adopting and non-adopting
schools. For example, the fact that 80 percent of the staff in SFA schools endorsed the decision
to adopt in a blind vote while the comparison schools did not suggests that these schools might
have important unobserved differences in staff attitudes and/or cohesiveness.
Randomized assignment ensures that the process by which schools are selected into
treatment group status is independent of the schools characteristics or pre-treatment outcomes.
However, another form of bias can emerge in experimental studies if not every school assigned
to the treatment group goes forward with whole-school reform or if some of the schools drop out
of the study. For example, in the evaluation of the School Development Program in Chicago,
four of the treatment group schools and one of the control group schools dropped out of the
study. Because schools that drop out of the study are likely to differ from those that do not, this
differential attrition may introduce differences between the treatment and comparison groups. A
similar bias can arise if highly motivated teachers shift to schools that are randomly selected to
be in the treatment group.
2.6. Contributions of Our Study
Several of the more serious shortcomings in past evaluations of whole-school reform
have been addressed by more recent studies. The evaluation of the School Development Program
in Prince George’s County and Chicago, which utilize random assignment of schools, are
particularly high quality. The current study contributes to these emerging efforts to evaluate
whole-school reform models in several ways.
27

First, this study was initiated and conducted by independent researchers who are not
affiliated with any of the three whole-school reform models evaluated here or with the New York
City public schools that adopted them.
Second, compared with all but a few recent studies of whole-school reform, a large
number of model sites are included in our study. Although the number of schools in our samples
is not so large that it can avoid all size-based limitations on our ability to estimate model
impacts, we are able to estimate these impacts in an unusually large number of sites.
Third, the conditions under which the schools in this study adopted whole-school reform
differ from the conditions under which schools examined in other studies made this decision. By
comparing model impacts from our study to impact estimates from other studies, we might learn
something about the effectiveness of whole-school reform models across different types of
settings. In addition, within the sample of schools in our study, we explore how the
implementation and effectiveness of whole-school reform efforts varied across schools and
students.
Finally, we carefully explore the usefulness of methods that make use of student data
from more than one time period and that make use of models of the process by which schools
and students select into a treatment groups for estimating the impacts of whole-school reform.
These methodological examinations, as well as our efforts to apply various methods in this
particular context, should help to provide guidance for future efforts to evaluate whole-school
reform models using quasi-experimental data.
28

Chapter 3: Whole School Reform Efforts in New York City and the Study Sample
3.1. Introduction
This study uses a quasi-experimental research design to estimate the impacts of three
different whole-school reform models on a total of 49 New York City elementary schools. The
purpose of this chapter is are to outline the process that led to whole-school reform efforts in
these schools and to explain our sample-selection procedures. The first section describes the
efforts to adopt whole-school reform models in New York City. The second section describes the
procedures and criteria used to select the sample of schools used in the study. A third section
summarizes the advantages and disadvantage of this sample for purposes of evaluating whole-
school reform.
3.2. Whole-School Reform Efforts in New York City
More than 100 New York City schools have adopted one or more whole-school reform
model in the last several years. In this section we describe the various conditions under which
these adoptions have taken place.
3.2.1. Schools Under Registration Review
One of the largest and earliest efforts to promote whole-school reform in New York City
schools occurred as part of the New York State Education Department’s (NYSED’s) Registration
Review Program. Established in 1989, this program is intended to identify and improve low-
performing schools. The overwhelming majority of the schools in the state that are under
registration review (SURRs) are in New York City. For several years, the most prominent
element of NYSED’s efforts to improve schools under registration review was the Models of
Excellence Initiative. Under this initiative, established in 1993, SED collaborated with the New

York City Board of Education (NYCBOE) to facilitate and fund the adoption of whole-school
reform models in SURRs. Models that have been supported under this initiative include the
Comer School Development Program, More Effective Schools, Success for All, Accelerated
Schools, Efficacy and Basic Schools. During the period in which NYSED offered the Models of
Excellence Initiative, 56 of the 109 New York City elementary and middle schools labeled as
SURRs chose to adopt one of these models (NYSED, undated).
3.2.2. Community School District Initiatives
In addition to these efforts, two of the 32 community school districts in New York City
undertook their own efforts to promote the adoption of whole-school reform. By the 1994-95
school year, one of these districts had begun implementing the Comer School Development
program in each of the 19 schools in its jurisdiction. The other district has encouraged its
elementary schools to adopt Success for All. In the 1995-96 and 1996-97 school years, six
elementary schools in this district adopted this whole-school reform model. In total, 79 schools
in New York City adopted a whole-school reform program between 1993 and 1997.1
3.2.3. Recent Initiatives
In the last three school years (1998-1999, 1999-2000, and 2000-2001), efforts to adopt
whole-school reforms in New York City have expanded rapidly. This expansion has been driven
by three initiatives. First, most of the remaining of the elementary schools in the district
encouraging the use of Success for All adopted that model sometime during the last three years.
Second, the Chancellor of the New York City public schools has established a Chancellor’s
district for low-performing schools. A large number of long-time and recently identified SURRs
1Two of the schools from the district that encouraged adoption of Success for All were SURRs that participated in the Models of Excellence Initiative.
30

have been removed from their community school districts and placed under the authority of the
Chancellor’s district. In addition to receiving enhanced resources, each of the schools in the
Chancellor’s district has been required to adopt Success for All. Finally, NYSED’s Model of
Excellence Initiative has been replaced by the federal Comprehensive School Reform
Demonstration (CSRD). Unlike the Models of Excellence Initiative, the CSRD is not targeted
exclusively or even primarily toward SURRs. The CSRD also supports a different set of whole-
school reform models. Models that have been adopted by New York City schools under auspices
of the CSRD include America’s Choice, Ventures in Education, Success for All, Modern Red
School House, Basic Schools, Accelerated Schools, and More Effective Schools.
3.3. Sample Selection
The set of schools used for this study include a subset of all the New York City schools
that have adopted a whole-school reform model and a set of comparison schools that have not
adopted whole-school reforms. In this section, we discuss the criteria used to limit the treatment
group sample and describe the procedure used to select the comparison-group schools.
3.3.1. Treatment Group Sample
The treatment group sample in this study is limited to schools that adopted a whole-
school reform model in either the 1994-95, 1995-96, or 1996-97 school year. Model developers
argue that whole-school reforms can take from three to five years to implement, and that impacts
on student performance should not be expected before all the model components have been
implemented. The data obtained from the New York City Board of Education for purposes of
this study allow us to follow student performance through the 1998-99 school year. The
treatment group sample is limited to schools that adopted a whole school reform model by the
31

1996-97 school year to ensure that we could follow students for at least three years following
model adoption. Schools adopting prior to 1994 were dropped primarily because of difficulties in
collecting the data needed to evaluate them. Because model emphases and implementation
strategies evolve overtime, we were also concerned that the impact of a model implemented
eight to ten years ago might be different than the impact of the same model implemented today.
The treatment group sample is further limited to include only schools that adopted School
Development Program (SDP), Success for All (SFA), or More Effective Schools (MES). The
number of schools adopting other models between 1994 and 1997 was insufficient to provide
reliable estimates of model impacts. The study is limited to elementary schools for a similar
reason. There were too few junior-high or middle schools adopting any single model to allow for
reliable impact estimates.
To identify treatment group schools meeting these sampling criteria, we contacted the
Office of New York City School and Community Services in NYSED and requested a list of
schools that had participated in the Models of Excellence Initiative. In addition, we contacted the
two community school districts that had undertaken their own efforts to implement whole-school
reform. In total, this generated a list of 49 elementary schools that adopted either SDP, SFA, or
MES during either the 1994-95, 1995-96, or 1996-97 school year. Table 3-1 indicates the
number of schools that have adopted each model, as well as when and how they came to adopt.
The set of schools summarized in the top panel of Table 3-1 are SURRs that adopted a
whole-school reform model in response to the Models of Excellence Initiative. In total, 26 SURR
elementary schools adopted one of the three models during the fall of 1994, 1995, or 1996—12
adopted SDP, 11 adopted MES, and 3 adopted SFA. In addition, 16 elementary schools adopted
32

SDP as the result of a community school district initiative and another six schools adopted
Success for All because that model was encouraged by their community school district. We also
identified one school that adopted More Effective Schools on its own. In all, 27 schools adopted
one of these models in the fall of 1994, including 25 that adopted the School Development
Program; 13 schools adopted one of these models in the fall of 1995; and 9 adopted in the fall of
1996.
3.3.2. The Comparison Group Sample
The highly non-random process by which this set of schools was selected suggests that
comparison schools should be carefully matched with the adopting schools on variables that
influence student performance. However, both Cook and Campbell (1979) and Mohr (1988)
argue that attempting to match treatment and control group members on observed variables can
increase the likelihood of inter-group differences on unobserved variables. In our case, SURRs
that chose to adopt a whole-school reform model are likely to show a pre-adoption pattern of
student performance similar to that of the SURRs that chose not to adopt, but the fact that these
SURRs chose not to adopt a whole-school reform model suggests that they might differ
systematically from the adopting schools. Unobserved variables related to the quality of
leadership or the level of internal conflict might not be the same, for example, in the two groups
of schools.
Cook and Campbell (1979) and Mohr (1988) suggest that random selection of the
comparison group can help to reduce the threat posed by unobserved heterogeneity. Random
selection can also produce misleading results, however, if the relationship between observable
variables and student performance (or the impact of treatment on this relationship) is different in
33

the treatment group than in the set of schools from which the comparison group is randomly
selected. A comparison group randomly selected from all the schools in New York City would
include some high-performing schools and might even include some of the top elementary
schools in the city, which rank among the best in the state. With this type of comparison group,
we cannot isolate the impact of whole-school reform in low-performing schools.
In order to balance the advantages and disadvantages of matching and random sampling,
a stratified, random sampling approach was used. The selection process used is depicted in
Figure 3-1. Beginning with all New York City elementary and middle schools, all schools from a
set of community school districts that face a considerably different service delivery
environment,2 and all schools that have adopted a whole-school reform model were dropped.
This left 377 elementary schools.
Next, three different sampling frames were created corresponding to each of the three
years in which whole-school reform models were adopted—1994-95, 1995-96, and 1996-97.
Each sampling frame consists of schools that scored below a specified criterion on the statewide
testing program for each of the three years preceding the relevant adoption year. The criterion
used to determine each of the three sampling frames was: 55 percent or fewer students scoring
above the state reference point (SRP) on the 3rd grade PEP reading test or 70 percent or fewer
students scoring above the SRP on the 3rd grade PEP math test.3 A school had to meet the
criterion in each of the three years leading up to the adoption year. This left 104 schools in the
2These districts serve few poverty students in comparison with districts that have adopting schools, and in the typical year, do not have any schools with aggregate levels of performance that fall below the state criteria used to identify schools for registration review. They are districts 11 in the Bronx, districts 14, 21, and 22 in Brooklyn, district 25 in Queens and district 31, Staten Island. 3The SRP is a minimum competency standard that was used to identify students in need of remedial help.
34
1994-95 sampling frame, 96 schools in the 1995-96 sampling frame, and 108 schools in the
1996-97 sampling frame.
Each sampling frame was then split into equal-sized quartiles based on levels of
performance. The measure of performance used to rank schools and form quartiles was the
percent of students above the SRP on the 3rd grade reading PEP test averaged across the three
years preceding the relevant adoption year. Each sampling frame and each quartile within each
sample frame were kept separate for the purposes of selection; that is, the sampling frames were
not pooled. Several schools appeared in more than one sampling frame, but no schools appeared
in more than one quartile within the same sampling frame.
The last step in the sampling procedure was to randomly select an equal number of
schools from each performance quartile. A total of 28 schools were selected from the 1994-95
sampling frame (seven from each quartile), 12 from the 1995-96 sampling frame (three from
each quartile) and 12 from the 1996-97 sampling frame (three from each quartile). Since some
schools were selected from more than one sampling frame, there are 42 comparison schools in
the final sample.4
Two things are worth noting about the criterion used to determine each sampling frame.
First, the criterion is different than that used by NYSED to identify schools for registration
review. The NYSED criteria for SURR identification were: 65 percent above the state reference
point (SRP) on the 3rd grade Pupil Evaluation Program (PEP) reading test; 65 percent above the
SRP on the 6th grade PEP reading; 85 percent above the SRP on the 8th grade PEP reading; 75
percent above the SRP on the third grade PEP math; and 75 percent above the SRP on the 6th
grade PEP math. A school was identified for registration review if it fell below any one of these
35
criteria and had shown a three-year pattern of decline on one of the criteria it failed to meet.5
Once it had been identified, a school had to meet a rather stringent set of criteria for
improvement before it could be removed from the list.6 Thus, although some of the schools
selected for the comparison group were SURRs that were encouraged, but chose not to
participate in the Models of Excellence Initiative, many were neither SURR schools nor schools
targeted by the Models of Excellence initiative.
Second, for any of the three reference years, approximately 10 percent of the treatment
group schools would not have met the criterion used to determine the sampling frames. For these
10 percent of the treatment group schools, aggregate measures of performance during the three
years preceding the sampling frame year were higher than at any of the schools that could have
been selected into the comparison group.7 Nonetheless, the vast majority of treatment schools
would have met the criterion used to determine the sampling frame, and a significant number of
treatment schools showed levels of performance far lower than the sampling frame criterion.
This criterion, together with stratification into performance quartiles, resulted in a comparison
group with a distribution of pre-adoption performance much closer to that of the treatment group
than would have been selected using a sampling frame criterion that each of the treatment
schools met.
4Schools from different sampling frames were pooled only after selection was completed. 5 The process for identifying schools for registration review has since been revised, but all of the schools that participated in the Models of Excellence Initiative were identified for registration review under these rules. 6 Thus, a SURR school participating in the Models of Excellence Initiative did not necessarily show a three-year pattern of declining test scores prior to model adoption. Many of these SURRs were identified for registration review several years before they adopted a whole-school reform model. In these cases, the schools merely failed to raise the percent above of the SRP enough to be removed from registration review in the years preceding model adoption. 7 This is true for two reasons. First, a school that showed more than 55 percent of students above the SRP in reading and more than 70 percent above the SRP in math for one of the last three years could still find its way onto the SURR list, or fail to find its way off the list. Second, although the majority did meet the sampling frame criterion,
36

3.2.3. Comparison of Treatment- and Comparison-Group Schools
Table 3-2 compares the treatment-group schools with the comparison-group schools
along several dimensions potentially related to post-adoption performance. These figures are
taken from the year prior to model adoption, or in the case of the comparison schools, from the
year preceding the earliest sampling frame from which the school was selected. The data sources
from which these measures were obtained are described in Chapter 4.
This table shows several important similarities between the treatment and comparison
groups. The student bodies of each group of schools are almost entirely non-white. On average,
the schools in each group show a high percentage of students who are eligible for free lunch,
although SDP schools show a somewhat lower percentage. Measures of teacher resources are
roughly similar across schools, except that SFA adopters show higher percentages of teachers
with certification in their field of assignment.
Perhaps the most important measure of the comparability of the treatment and
comparison group schools is their level of student performance prior to adoption of whole-school
reform. The last two rows of Table 3-2 show the percent of third grade students who scored
above the statewide reference point (SRP) on the New York State Pupil Evaluation Program
(PEP) tests in reading and math. The SRP is a minimum competency standard, which until 1998-
99 was used to identify students for remedial assistance, including Title I services. These pre-
adoption performance measures are similar across all groups of schools with the exception that
SDP schools show a higher average percentage of students above the SRP in third grade reading
than do the other groups.
some of the schools in the district that required adoption of the Comer School Development Program were higher performers.
37

Despite these similarities, there are also important differences among the groups.
Roughly one-half of the SDP and SFA schools, all but one of the MES schools, and just over
one-third of the comparison schools were identified for registration review either prior to model
adoption or some time afterwards. Thus, a comparison school is less likely to have been a SURR
school than schools in any of the treatment groups. Schools that adopted MES show substantially
larger average enrollment than the comparison schools. Also, although schools in each group
have predominantly non-white populations, MES adopters have higher percentages of Hispanic
than black students, while SDP and SFA schools have higher percentages of black students. The
average percentages of black and Hispanic students in the comparison schools are closer to
equal. Related to these differences in ethnic composition are differences in the percentage of
students with limited English proficiency.
In sum, there are important similarities between the treatment and comparison groups
along some dimensions, but important differences along others. This implies that simple,
unadjusted comparisons of the treatment and comparison groups are unlikely to provide accurate
estimates of the impacts of whole-school reform models. Adjusting estimates of program impacts
for the observable differences identified in Tables 3-2 can be done in a relatively simple manner
using regression analysis. More difficult is the challenge of adjusting for potential unobserved
differences between the treatment and comparison that might confound estimates of model
impacts. Methods for addressing this challenge are discussed in Chapter 6.
3.4. Advantages and Disadvantages of Our Study Sample
New York City provides an excellent opportunity for evaluating whole-school reform
models for several reasons. First, it allows the examination of a large number of non-pilot, model
38

sites. As a result, a study of the New York experience can lead to more general conclusions
about the effectiveness of whole-school reforms than are permitted by case studies of a small
number of pilot sites. Generalizability is furthered enhanced by the variety of initiatives under
which efforts to implement whole-school reforms were undertaken in New York City. These
include district, state, and federal level programs similar to other top-down initiatives that are
driving much of the recent expansion of whole-school reform models.
Although assessment of the New York City experience can provide more generalizable
findings than many existing studies, efforts in New York City are different from whole-school
reform efforts elsewhere in a number of ways. The operating environment for schools in large
urban districts like New York City is often markedly different than the environment in suburban
and rural school districts. Urban school environments are marked by a multiplicity of
stakeholders, high rates of administrator and teacher turnover, high rates of student mobility, and
multiple reform initiatives. Consequently, the challenges of implementing whole-school reform
in large urban environments may be greater than elsewhere. In addition, the majority of schools
that have adopted whole-school reform models in New York City are schools that show low
levels of student performance, a feature that often magnifies these challenges to implementing
whole-school reform. Thus, examination of the experience of New York City schools cannot
provide conclusions about the effectiveness of whole-school reform programs in schools outside
large urban areas, or in schools within large urban areas that show relatively high levels of
student performance. Fortunately, low-performing, urban schools are the primary target of most
whole-school reform models, including the three examined in this study.
39

Focusing on schools adopting reforms between 1994 and 1997 allows us to examine
impacts a number of years after model adoption. However, this timing limits the generalizability
of our study in two ways. First, the variation in conditions under which whole school reform was
adopted are limited. In particular, schools that adopted under the Chancellor district’s mandate
and under the CSRD program are not included in our treatment-school sample. Second, whole-
school reform models change program emphases and implementation strategies as they learn and
gain experience over time. Thus, examining the results of models implemented several years ago
does not necessarily indicate what we can expect from future efforts to implement whole-school
reform models. In selecting schools to study, we have tried to strike a balance between
examining an adequate number of years following adoption and examining versions of the
models that are recent enough to still be relevant.
The primary challenge posed by this sample is that the set of schools that adopted a
whole-school reform model is not a random selection of New York City schools. The majority of
the schools that adopted whole-school reform models were identified as low-performing schools
by NYSED and chose to implement a model in response to identification. The other adopting
schools are from community school districts that made a unique commitment to supporting
model implementation. Thus, the schools that adopted reform models differ in important ways
from the non-adopting schools. Obtaining valid estimates of program effects depends on the
ability to control for these potential differences between adopting and non-adopting schools.
A second major disadvantage of this evaluation setting is related to the diffusion of
whole-school reforms. As is the case with most large urban school districts, the schools in New
York City have been subject to numerous reform initiatives. Some of these initiatives incorporate
40

important elements of one or more of the whole-school reform models we are examining. In
1994, for example, in response to regulations issued by the state, the New York City Board of
Education adopted a school-based management and shared-decision making plan. As part of this
initiative each school in New York City was required to establish a school-based management
team and the City made efforts to train members of these teams in collaborative decision-
making. Collaborative school management, however, is an important component of many whole-
school reform models.
In addition, whole-school reform models have been well publicized over the past decade.
Consequently, key elements of these models may well have been implemented by schools that
have not expressly adopted a specific whole-school reform model. This general diffusion of key
model elements complicates the interpretation of any evaluation findings. Appropriately
interpreting our findings hinges on distinguishing between the effects of the services provided by
whole-school reform model organizations and the effects of the school characteristics and
practices advocated by the whole-school reform models.
41
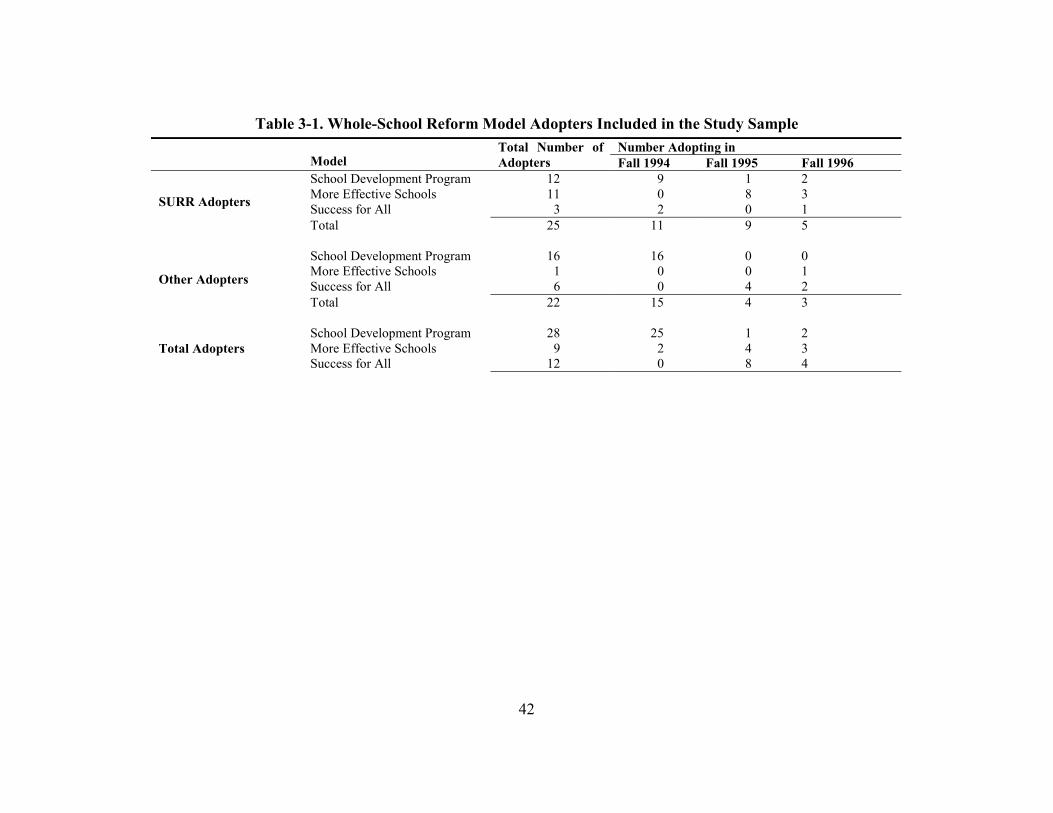
42
Table 3-1. Whole-School Reform Model Adopters Included in the Study Sample
Number Adopting in Model
Total Number of Adopters Fall 1994 Fall 1995 Fall 1996
School Development Program 12 9 1 2 More Effective Schools 11 0 8 3 Success for All 3 2 0 1 SURR Adopters
Total 25 11 9 5
School Development Program 16 16 0 0 More Effective Schools 1 0 0 1 Success for All 6 0 4 2 Other Adopters
Total 22 15 4 3
School Development Program 28 25 1 2 More Effective Schools 9 2 4 3 Total Adopters Success for All 12 0 8 4
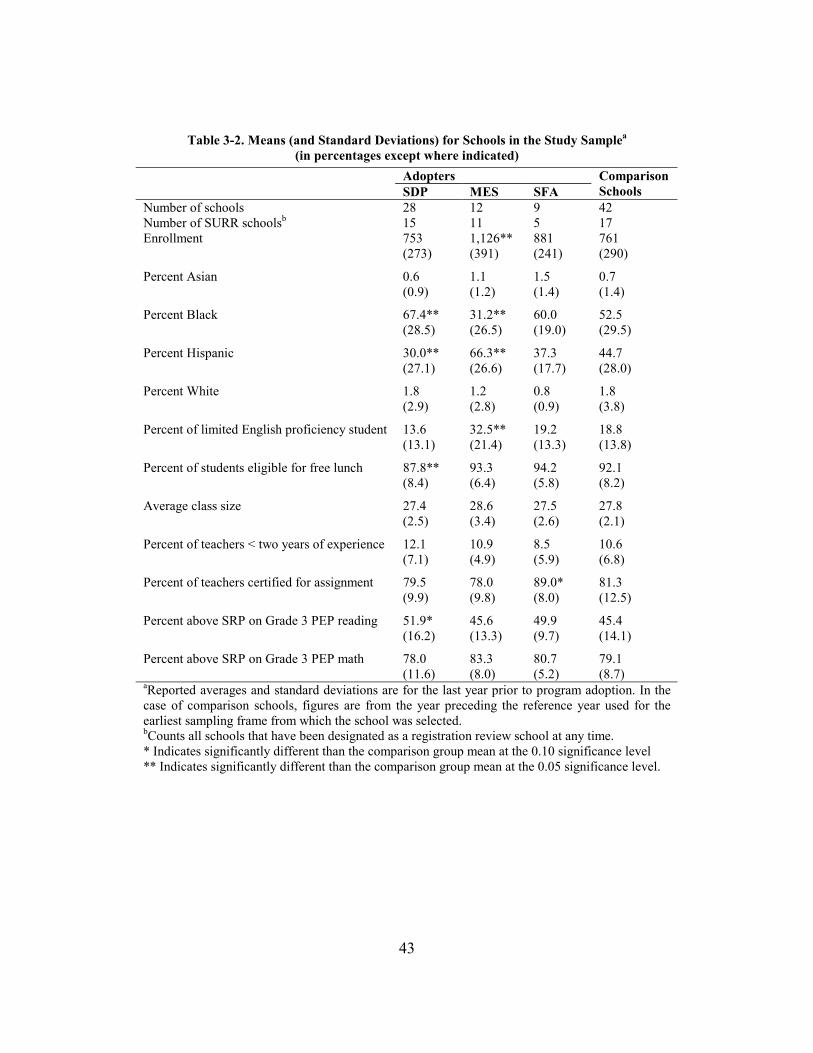
43
Table 3-2. Means (and Standard Deviations) for Schools in the Study Samplea
(in percentages except where indicated)
Adopters SDP MES SFA
Comparison Schools
Number of schools 28 12 9 42 Number of SURR schoolsb 15 11 5 17 Enrollment 753
(273) 1,126** (391)
881 (241)
761 (290)
Percent Asian 0.6 (0.9)
1.1 (1.2)
1.5 (1.4)
0.7 (1.4)
Percent Black 67.4** (28.5)
31.2** (26.5)
60.0 (19.0)
52.5 (29.5)
Percent Hispanic 30.0** (27.1)
66.3** (26.6)
37.3 (17.7)
44.7 (28.0)
Percent White 1.8 (2.9)
1.2 (2.8)
0.8 (0.9)
1.8 (3.8)
Percent of limited English proficiency student 13.6 (13.1)
32.5** (21.4)
19.2 (13.3)
18.8 (13.8)
Percent of students eligible for free lunch 87.8** (8.4)
93.3 (6.4)
94.2 (5.8)
92.1 (8.2)
Average class size 27.4 (2.5)
28.6 (3.4)
27.5 (2.6)
27.8 (2.1)
Percent of teachers < two years of experience 12.1 (7.1)
10.9 (4.9)
8.5 (5.9)
10.6 (6.8)
Percent of teachers certified for assignment 79.5 (9.9)
78.0 (9.8)
89.0* (8.0)
81.3 (12.5)
Percent above SRP on Grade 3 PEP reading 51.9* (16.2)
45.6 (13.3)
49.9 (9.7)
45.4 (14.1)
Percent above SRP on Grade 3 PEP math 78.0 (11.6)
83.3 (8.0)
80.7 (5.2)
79.1 (8.7)
aReported averages and standard deviations are for the last year prior to program adoption. In the case of comparison schools, figures are from the year preceding the reference year used for the earliest sampling frame from which the school was selected. bCounts all schools that have been designated as a registration review school at any time. * Indicates significantly different than the comparison group mean at the 0.10 significance level ** Indicates significantly different than the comparison group mean at the 0.05 significance level.
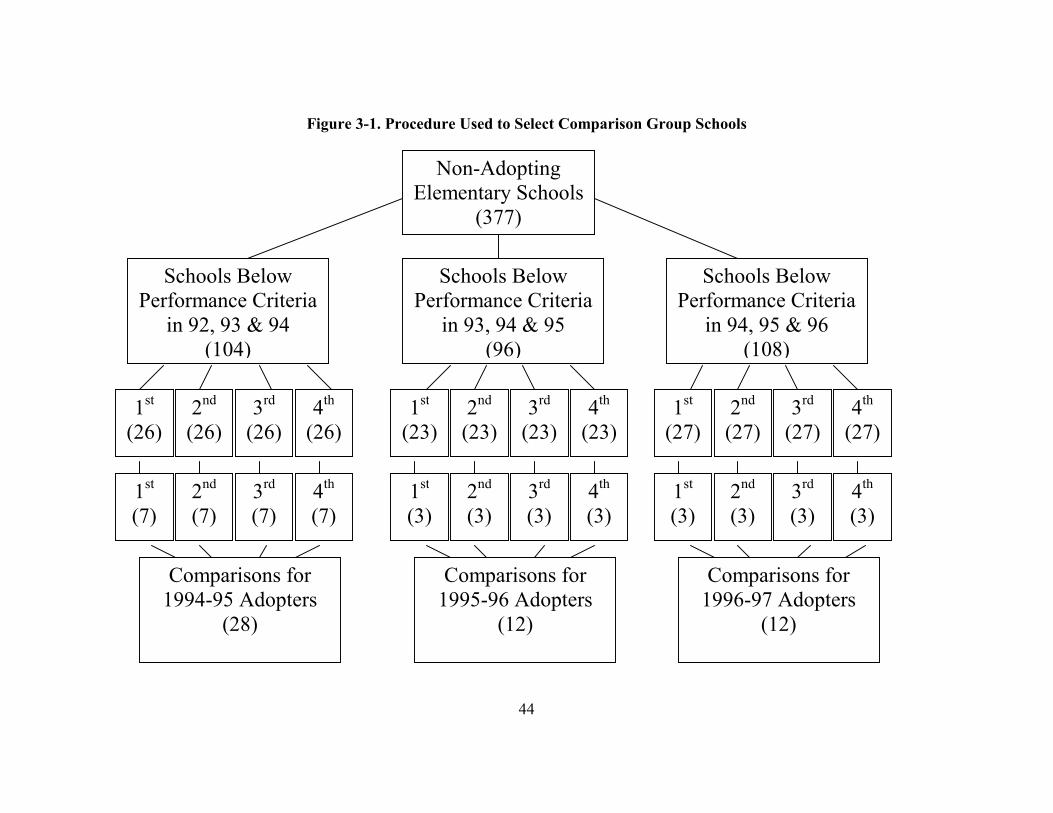
44
Figure 3-1. Procedure Used to Select Comparison Non-Adopting
Elementary Schools(377)
Schools Below Performance Criteria
in 92, 93 & 94 (104)
Schools Below Performance Criteria
in 93, 94 & 95 (96)
1st (26)
2nd (26)
3rd (26)
4th
(26)1st
(23)2nd
(23)3rd
(23)4th
(23)
1st (7)
2nd (7)
3rd (7)
4th
(7)1st
(3)2nd
(3)3rd
(3)4th (3)
Comparisons for 1994-95 Adopters
(28)
Comparisons for 1995-96 Adopters
(12)
Group Schools
Schools Below Performance Criteria
in 94, 95 & 96 (108)
1st
(27)2nd
(27)3rd
(27)4th
(27)
1st
(3)2nd
(3)3rd
(3)4th
(3)
Comparisons for 1996-97 Adopters
(12)

Chapter 4: Data Sources and Variable Measurement
4.1. Introduction
The data available on the schools selected for the study include individual level data on
three cohorts of students from each school and school level data. This chapter describes the data
obtained from administrative files maintained by the New York City Board of Education
(NYCBOE) and the New York State Education Department, which are used in the analysis of
model impacts. Additional data used to assess implementation of whole-school reform at
particular schools is described in the next chapter. Section 4.2 describes the sources of the data,
and section 4.3 compares the data for treatment and comparison schools.
4.2. Data Sources
The data collected for this study include variables to describe individual students and
variables to describe individual schools. The sources for these two types of data are discussed in
turn.
4.2.1 Student-Level Data
The New York City Board of Education (NYCBOE) provided access to individual
student data files for the purposes of this study. Taken from the NYCBOE’s Biofile, these files
provide data on all students who were in third grade in one of the sample schools during either
the 1994-95, 1996-97, or 1998-99 school years. For each student included, these files contain
scores on citywide tests of math and reading for each year that the student took those exams. For
a student in third grade in 1994-95, assuming that student has remained in the New York City
public school system and was not absent for or exempted from any tests, the file would include
the test scores for each year from second grade through seventh grade. For students in third grade
in 1996-97, the files include scores for third grade through fifth grade. For students in third grade
in 1998-99, the files provide only third grade scores.1
These files also provide a snapshot of additional information on each student from each
year that the student has been enrolled in New York City public schools. These snapshots
indicate what school the student attended, the date the student was admitted to that school, the
grade to which the student was assigned, the student’s eligibility for English as a Second
Language (ESL) services, and the student’s home zip code. The grade assignment code indicates
the student’s special education status. Thus, we can tell if, and often when, a student moved,
changed schools, or changed eligibility for ESL or special education services. We can also tell if
the student was held back in a grade. Because the files only provide a single snapshot from each
year, however, multiple changes within a given year (i.e., between snapshots) may be missed.
The files also indicate the number of days the student attended and the number of days the
student was absent each school year.
Finally, the files include demographic and other information that does not change from
year-to-year. These variables include the student’s date of birth, sex, ethnicity (native American,
Asian, Hispanic, black, or white), and home language. The data also contain an indicator of
whether or not the student was eligible for free or reduced-priced lunch during the 1998-99
school year. Unfortunately, the NYCBOE chose not to provide indicators of free lunch eligibility
for years prior to 1998-99.
1The Board of Education did not test second grade students after the Spring of 1994, and thus second grade scores are not available for later cohorts.
46

4.2.2 School-Level Data
These student-level files were linked with school-level data obtained from other New
York City Board of Education and New York State Education Department data systems. These
data sources include the Institutional Master File (IMF) and Personnel Master Files (PMF) taken
from the NYSED’s Basic Education Data System (BEDS), and the NYCBOE’s Annual School
Reports. These data sources contain a large number of school-level measures including
information on enrollments; student ethnic and socioeconomic characteristics; class sizes;
teacher and staff education, experience, and salaries; student and teacher attendance rates,
student suspensions; and aggregate results on several statewide and citywide testing programs.
Measures from the IMF and PMF files are available for each school year from 1975-76 through
1999-2000. We were only able to obtain Annual School Reports for the years 1996-97 through
1998-1999, but the NYCBOE did provide school-level test score measures used in the Annual
School Reports for the years 1989-1990 through 1998-1999.
We were also able to determine whether or not the school attended by a student in a given
year had:
�� adopted a whole-school reform model, and if so the year in which the model was adopted;
�� been identified for registration review, and if so, the year in which it was identified; �� been removed from registration review, and if so, the year in which it was removed; �� been placed in the Chancellor’s district; and/or �� been redesigned as part of the registration review process, and if so, when the
redesign took place.
47

The information on registration review status and redesign efforts was obtained from the
NYSED Office of New York City School and Community Services. Whether or not a school had
been placed in the Chancellor’s district was obtained from a list of Chancellor’s district schools
on the New York City Board of Education website. We were unable to tell from this source when
a school in the Chancellor’s district had been placed there.
4.2.3. Data Assembly and Imputation
The major data sources used in this study are summarized in Table 4-1. These data
sources were used to assemble linkable school and student level data sets. The school level data
set includes measures from 1989-90 through 1998-99 for all New York City elementary, middle
and junior high schools. To assemble this data set, we began by aggregating teacher information
contained in the BEDS-PMF files to the school level. We then merged the school level
information from the BEDS-PMF with additional school-level information from the BEDS-IMF
files and from the New York City Board of Education’s Annual School Reports. In some cases,
variables constructed using data from the BEDS could also be constructed using data from the
Annual School Reports. For instance, both the BEDS-IMF and the Annual School Report
provide enrollment counts by ethnic group. If the value of a variable obtained from the BEDS
differed from the value obtained from the Annual School Reports, the value from the BEDS was
used.
A large number of New York City schools are missing enrollment data in the 1999 BEDS
file used for this study. In fact, 474 of the 852 New York City elementary and middle schools are
missing enrollment counts for the 1998-99 school year, and all of these are missing 1998-99
48
e
u
counts of LEP and free lunch students. To fill this gap in the BEDS data, we used information
from the Annual School Reports.
More specifically, the following procedure was used to impute missing enrollment, LEP,
and free lunch data. First, we posited the following linear relationship between the value of the
variable for school j in year t obtained from the BEDS, , and the value obtained from the
Annual School Reports,
bedsjtX
,asrjtX
(IV-1) beds asrjt jt j jtX a bX u� � � �
In effect, this equation expresses changes over time in the value of a variable taken from the
BEDS as a function of changes over time in values of the same variable for the same school
obtained from Annual School Report. Estimates of the parameters a, b and uj were obtained
using the Generalized Least Squares random effects estimator and data available for the 1996-97
through 1998-99 school years. Next, predicted values of were calculated
using these parameter estimates. If the actual value of was missing, it was filled in with
this predicted value. Through this procedure, 458 of the 474 missing enrollment values, 854 of
the 872 missing LEP values, and 857 of the 872 missing free-lunch values were imputed.
beds asrjt jX a bX� � �
bedsjtX
After work on the school level dataset was completed, three student level data sets were
assembled. The first consists of students who were assigned to a third grade, general education
program in one of the 91 schools in the study sample during the 1994-95 school year. The second
consists of students assigned to the third grade, general education program in one of the schools
in the study sample during the 1996-97 school year. The third consists of students assigned to the
third grade, general education program in one of the schools in the study sample during the
49
1998-99 school year. These three student-level data sets were each merged with the school-level
data to create the data sets used for the analyses presented in Chapter 7.
The only student-level variables with a significant number of missing values were the test
score variables and the variable indicating whether or not the student was eligible for free lunch
in 1999.2 The analyses in Chapter 7 are concerned with explaining variation in the test score
variables, and thus it is not appropriate to use assumptions about variation in these scores to
impute missing values. Consequently, missing test scores were not imputed. We did, however,
impute missing values of the variable indicating eligibility for the free lunch.
In total, 2,086 of the 10,576 of students in third grade in 1994-95, 1,749 of the 11,319
students in third grade in 1996-97, and 1,391 of the 11,253 students in third grade in 1998-99 are
missing a free-lunch eligibility indicator. To impute these missing values, the following
procedure was used. First, a logit model was used to estimate the relationship between free lunch
eligibility, and a student’s home language, ethnicity and home zip code in the sample of students
who did have a free lunch eligibility indicator. The estimated logit equation was then used to
calculate the probability that a given student was eligible for free lunch in 1999. If this
probability was equal to or greater than 0.50, then the missing value was replaced with a 1
indicating that the student was eligible for free-lunch. Otherwise, the missing value was replaced
with a 0.
4.3. Extent and Distribution of Missing Test Scores
As indicated, a substantial number of students in each cohort are missing either reading
or math test scores for one or more of the years that we observe them. In most cases, a missing
50

test score indicates that the student did not take that particular test that year. There are four
reasons why a student might not have taken a test in a given year. First, the student may have
been exempt from taking the test because he or she was classified as a special education student
and his or her Individual Education Plan does not require participation in the citywide testing
program. Second, a student classified as limited in English proficiency may have been exempted
from the citywide reading exam, and also from the math test if a version of the test translated
into the student’s home language was not available. Third, a student would not have been tested
if he or she was absent the day that the test is administered. Finally, students who had left the
New York City public school system were, of course, not tested.
Table 4-2 indicates the extent of missing test scores in each of the study samples. Of the
10,576 students from the cohort in third grade in 1994-95, 41.5 percent are missing at least one
test score between 1993-94 and 1996-97, and 32.0 percent are missing at least one math test
score. Of the 11,319 students from the cohort in third grade in 1996-97, 37.6 percent are missing
at least one reading test score and 32.3 percent are missing at least one math score. Of the 11,253
students from the cohort in third grade in 1998-99, 23.9 do not have any reading test scores and
17.3 do not have any math test scores.
Table 4-3 shows how the missing test scores are distributed across the treatment and
comparison groups. Given the reasons why a student might not have a test score in a given year,
we would expect the percentages of students missing test scores to differ across these groups. In
particular, because the More Effective Schools group has higher percentages of students whose
home language is other than English and who are eligible for ESL services, we would expect
2If a student was not explicitly marked as being eligible for English as a Second Language services it was assumed that the student was not eligible during that year. Similarly, if a student’s home language was not marked as a
51

them to have higher percentages of students with missing test scores. Similarly, we would expect
the School Development Program and Success for All groups, who have lower percentages of
students eligible for ESL services, to have fewer students with missing test scores. Because
students cannot take a translated version of the reading test, we would also expect differences
between the groups to be greater for reading tests. This is precisely what we see.
Not only are missing test scores distributed unevenly across treatment and comparison
groups, but also students with missing test score values are different than students without
missing test scores. Tables 4-4 compares students with missing test scores and those without on
several variables. In general, this table shows that students with missing test scores are more
likely than students without missing test scores to be male, to be Asian or Hispanic, to be eligible
for free lunch, to speak a language other than English at home, to be eligible for ESL services,
and to have changed schools.
To further explore the relationship between student characteristics and the likelihood of
having a missing a test score, we conducted probit analyses of the probability that a student has a
complete set of test scores. The results of these analyses are presented in Table 5-5. Analyses
were conducted separately for reading and math scores, and for each of three cohorts used in this
study. In the first three columns of Table 5-5, the left-side variable is a dummy variable taking
the value of 1 if the student is not missing any reading test scores and 0 if the student is missing
at least one test score that we would expect to observe. The figures presented in this table are
coefficients representing the independent effect of each variable on the probability of having a
complete set of test scores. In the last three columns the dependent variable takes the value of 1
if the student is not missing any math test scores and 0 otherwise.
language other than English, it was assumed that the home language is English.
52

Four variables consistently show up as significant determinants of the probability that a
student will have a complete set of test scores: the sex of the student, eligibility for free lunch,
eligibility for ESL services, and whether or not the student has changed schools. Speaking a
language other than English at home also significantly reduces the likelihood of having a
complete set of test scores for the 1994-95 and the 1998-99 cohorts. In most cases, after
controlling for poverty and ESL status, a student’s ethnicity does not show an independent effect
on the probability of having a complete set of test scores. The exceptions are that Asian students
are less likely to have a complete set of math test scores than the reference group (in this case
Native Americans) in the cohorts of students in third grade in 1994-95 and in 1998-99. This may
reflect that fact that the Asian language translations of the math tests are not readily available.
In most cases, the treatment group to which a student belongs does not appear to have an
independent relationship with the probability of having a complete set of test scores. This
suggests that the differences between the treatment and comparison groups in the percentage of
students with missing values that we saw in Table 4-3 are driven primarily by other observed
differences between the groups, most notably differences in the percent of ESL students.
Nonetheless, there are some cases in which treatment group membership appears to have an
independent relationship to the probability of having missing test scores, even after controlling
other student characteristics. In particular, in the cohort in third grade in 1994-95 members of the
SDP group are more likely to have a complete set of reading test scores, and members of the
SFA group are more likely to have a complete set of math scores. In the cohort of students in the
third grade in 1998-99, students who attend MES schools are less likely to have a complete set of
test scores.
53
In estimating the impacts of whole-school reform on student performance, we can only
use those observations for which test scores are reported. This means that rather than using the
entire population of students in each cohort of students, we must rely on a non-random selection
of students. Our procedure for dealing with this issue in estimating the impacts of whole-school
reform models is discussed in Chapter 6.
54
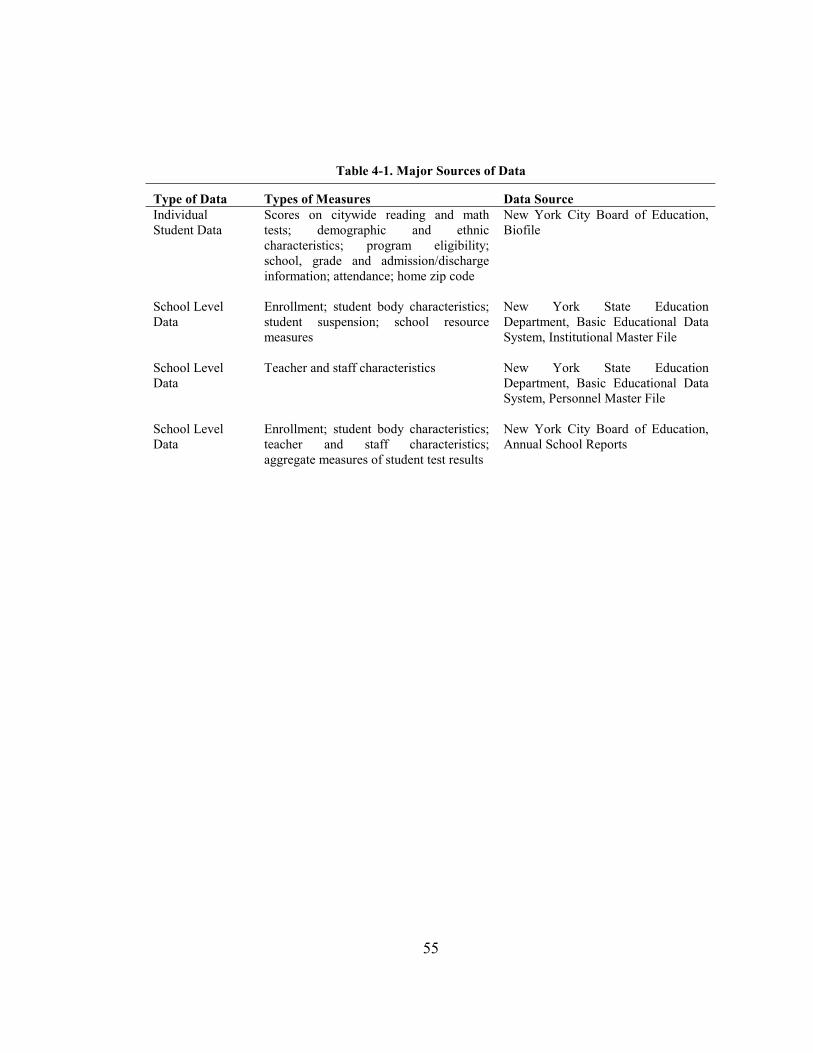
Table 4-1. Major Sources of Data
Type of Data Types of Measures Data Source Individual Student Data
Scores on citywide reading and math tests; demographic and ethnic characteristics; program eligibility; school, grade and admission/discharge information; attendance; home zip code
New York City Board of Education, Biofile
School Level Data
Enrollment; student body characteristics; student suspension; school resource measures
New York State Education Department, Basic Educational Data System, Institutional Master File
School Level Data
Teacher and staff characteristics New York State Education Department, Basic Educational Data System, Personnel Master File
School Level Data
Enrollment; student body characteristics; teacher and staff characteristics; aggregate measures of student test results
New York City Board of Education, Annual School Reports
55

Table 4-2. Number and Percentage of Students with
Missing Test Score Data
Number of Students
Percent of Students
Cohort of Students in Third Grade in 1994-95 Total Students 10,576 100.0 Missing One or More Reading Score 4,394 41.5 Missing One or More Math Score 3,389 32.0 Cohort of Students in Third Grade in 1996-97 Total Students 11,319 100.0 Missing One or More Reading Score 4,252 37.6 Missing One or More Math Score 3,654 32.3 Cohort of Students in Third Grade in 1998-99 Total Students 11,253 100.0 Missing One or More Reading Score 2,686 23.9 Missing One or More Math Score 1,951 17.3
56

Table 4-3. Distribution of Students with Missing Test Score Data Across Treatment- and Comparison-Group Students
SDP MES
Number Percent Number Percent Cohort of Students in Third Grade in 1994-95 Total Students 2,576 100.0 1,943 100.0 Missing One or More Reading Score 887 34.4 1,015 52.2 Missing One or More Math Score 794 30.8 685 35.3 Cohort of Students in Third Grade in 1996-97 Total Students 2,649 100.0 1,899 100.0 Missing One or More Reading Score 902 34.1 831 43.8 Missing One or More Math Score 864 32.6 657 34.6 Cohort of Students in Third Grade in 1998-99 Total Students 2,685 100.0 1,797 100.0 Missing One or More Reading Score 488 18.2 591 32.9 Missing One or More Math Score 446 16.6 403 22.4 SFA Comparisons Number Percent Number Percent Cohort of Students in Third Grade in 1994-95 Total Students 1,168 100.0 5,198 100.0 Missing One or More Reading Score 468 40.1 2,273 43.7 Missing One or More Math Score 327 28.0 1,802 34.7 Cohort of Students in Third Grade in 1996-97 Total Students 1,219 100.0 5,855 100.0 Missing One or More Reading Score 466 38.2 2,211 37.8 Missing One or More Math Score 395 32.4 1,895 32.4 Cohort of Students in Third Grade in 1998-99 Total Students 1,261 100.0 6,174 100.0 Missing One or More Reading Score 331 26.2 1,475 23.9 Missing One or More Math Score 211 16.7 1,065 17.2
57
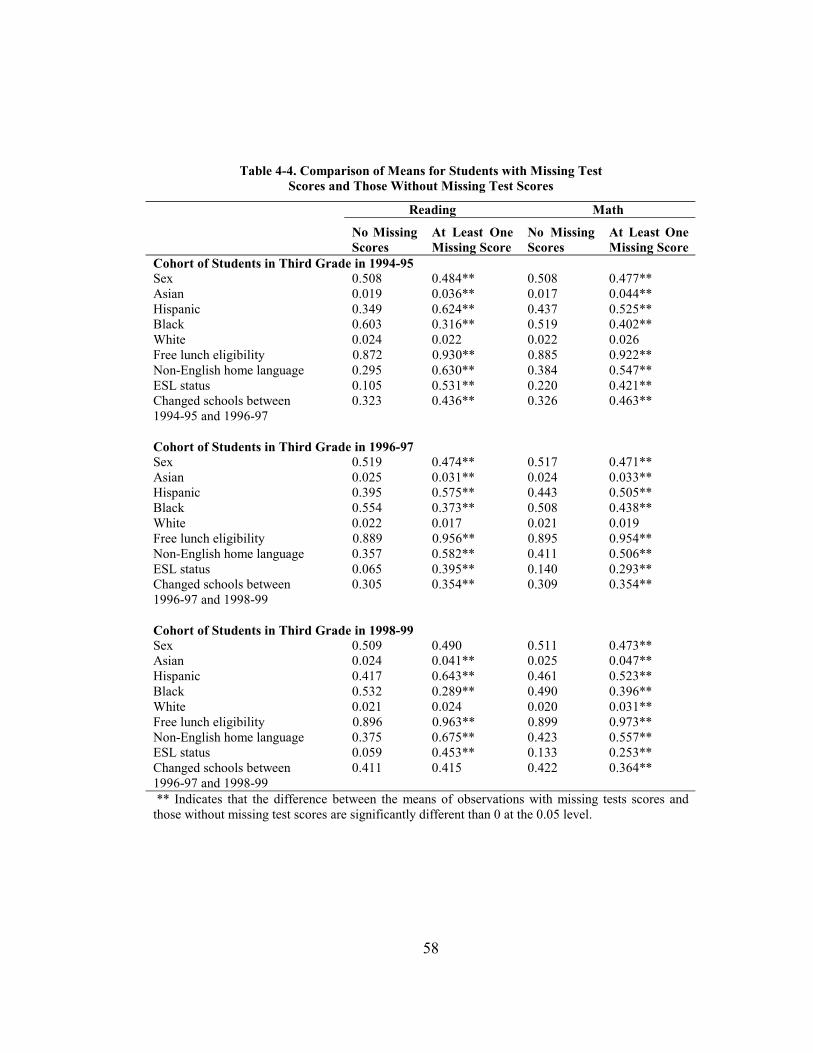
Table 4-4. Comparison of Means for Students with Missing Test Scores and Those Without Missing Test Scores
Reading Math
No Missing Scores
At Least One Missing Score
No Missing Scores
At Least One Missing Score
Cohort of Students in Third Grade in 1994-95 Sex 0.508 0.484** 0.508 0.477** Asian 0.019 0.036** 0.017 0.044** Hispanic 0.349 0.624** 0.437 0.525** Black 0.603 0.316** 0.519 0.402** White 0.024 0.022 0.022 0.026 Free lunch eligibility 0.872 0.930** 0.885 0.922** Non-English home language 0.295 0.630** 0.384 0.547** ESL status 0.105 0.531** 0.220 0.421** Changed schools between 1994-95 and 1996-97
0.323 0.436** 0.326 0.463**
Cohort of Students in Third Grade in 1996-97 Sex 0.519 0.474** 0.517 0.471** Asian 0.025 0.031** 0.024 0.033** Hispanic 0.395 0.575** 0.443 0.505** Black 0.554 0.373** 0.508 0.438** White 0.022 0.017 0.021 0.019 Free lunch eligibility 0.889 0.956** 0.895 0.954** Non-English home language 0.357 0.582** 0.411 0.506** ESL status 0.065 0.395** 0.140 0.293** Changed schools between 1996-97 and 1998-99
0.305 0.354** 0.309 0.354**
Cohort of Students in Third Grade in 1998-99 Sex 0.509 0.490 0.511 0.473** Asian 0.024 0.041** 0.025 0.047** Hispanic 0.417 0.643** 0.461 0.523** Black 0.532 0.289** 0.490 0.396** White 0.021 0.024 0.020 0.031** Free lunch eligibility 0.896 0.963** 0.899 0.973** Non-English home language 0.375 0.675** 0.423 0.557** ESL status 0.059 0.453** 0.133 0.253** Changed schools between 1996-97 and 1998-99
0.411 0.415 0.422 0.364**
** Indicates that the difference between the means of observations with missing tests scores and those without missing test scores are significantly different than 0 at the 0.05 level.
58
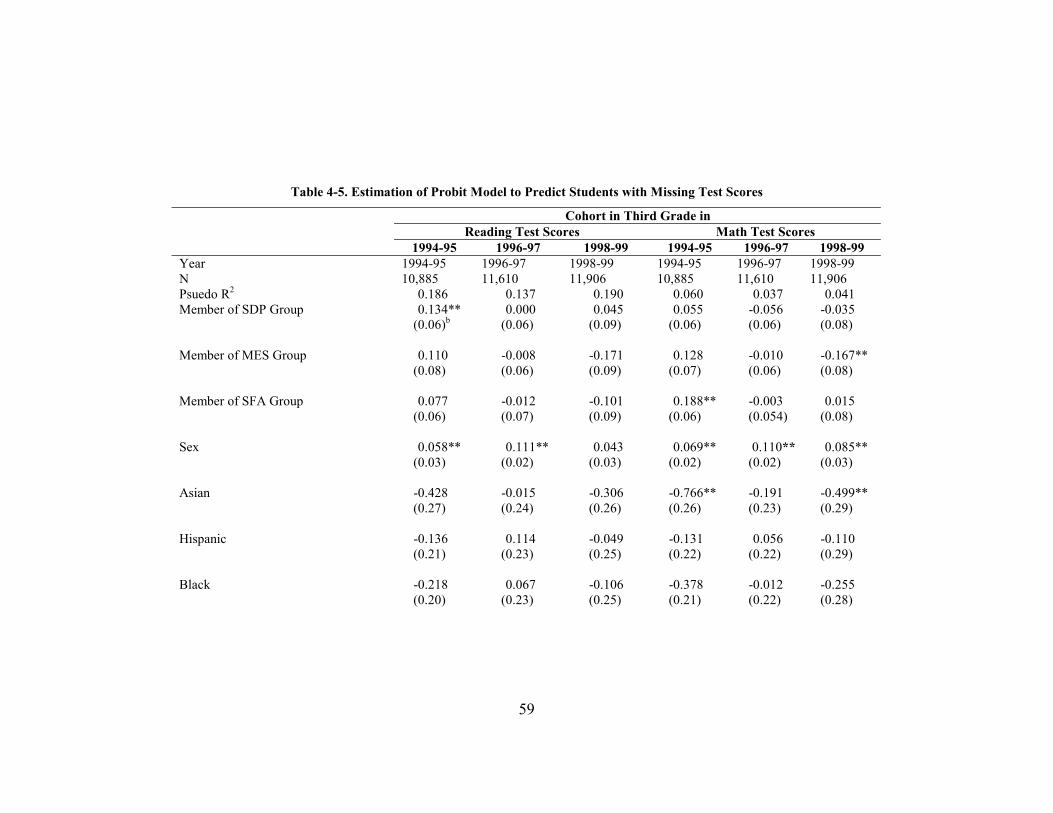
Table 4-5. Estimation of Probit Model to Predict Students with Missing Test Scores
Cohort in Third Grade in Reading Test Scores Math Test Scores
1994-95 1996-97 1998-99 1994-95 1996-97 1998-99Year 1994-95 1996-97 1998-99 1994-95 1996-97 1998-99N
10,885 11,610 11,906 10,885 11,610 11,906 Psuedo R2 0.186 0.137 0.190 0.060 0.037 0.041
Member of SDP Group 0.134**
(0.06)b 0.000
(0.06)
0.045 (0.09)
0.055 (0.06)
-0.056 (0.06)
-0.035 (0.08)
Member of MES Group 0.110 (0.08)
-0.008 (0.06)
-0.171 (0.09)
0.128 (0.07)
-0.010 (0.06)
-0.167** (0.08)
Member of SFA Group 0.077 (0.06)
-0.012 (0.07)
-0.101 (0.09)
0.188** (0.06)
-0.003 (0.054)
0.015 (0.08)
Sex 0.058**(0.03)
0.111** (0.02)
0.043 (0.03)
0.069** (0.02)
0.110** (0.02)
0.085** (0.03)
Asian -0.428(0.27)
-0.015 (0.24)
-0.306 (0.26)
-0.766** (0.26)
-0.191 (0.23)
-0.499** (0.29)
Hispanic -0.136(0.21)
0.114 (0.23)
-0.049 (0.25)
-0.131 (0.22)
0.056 (0.22)
-0.110 (0.29)
Black -0.218(0.20)
0.067 (0.23)
-0.106 (0.25)
-0.378 (0.21)
-0.012 (0.22)
-0.255 (0.28)
59
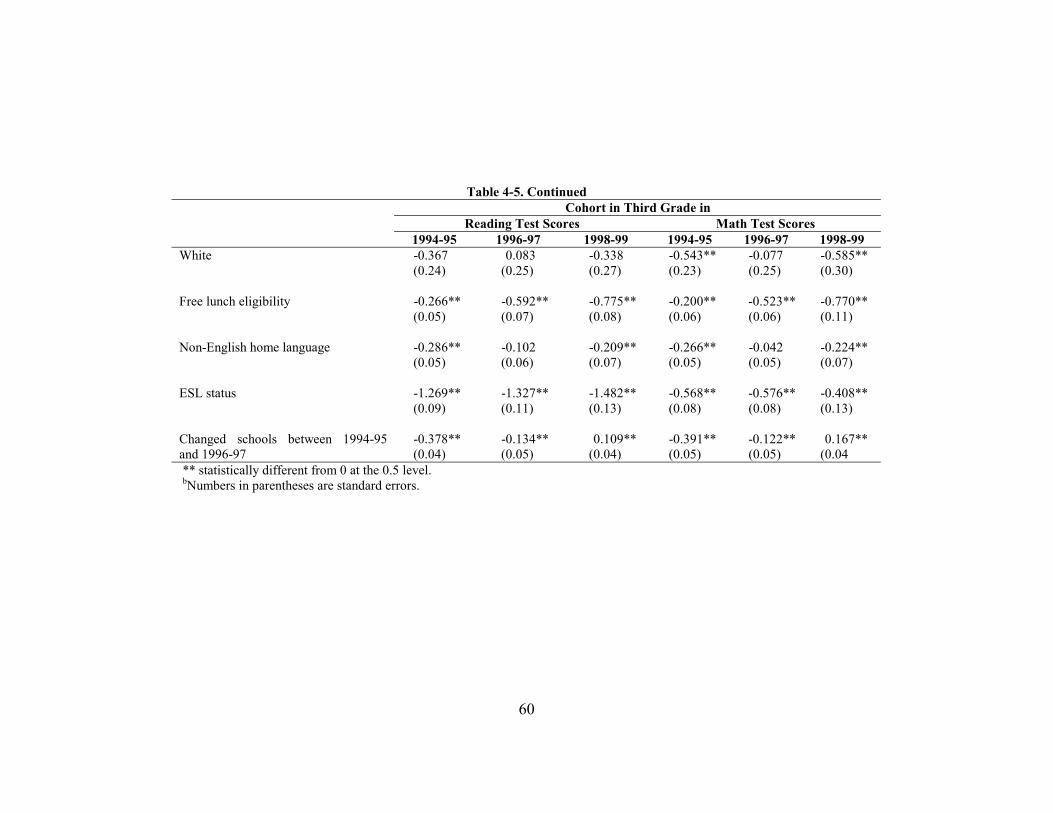
Table 4-5. Continued Cohort in Third Grade in
Reading Test Scores Math Test Scores 1994-95 1996-97 1998-99 1994-95 1996-97 1998-99
White -0.367(0.24)
0.083 (0.25)
-0.338 (0.27)
-0.543** (0.23)
-0.077 (0.25)
-0.585** (0.30)
Free lunch eligibility -0.266** (0.05)
-0.592** (0.07)
-0.775** (0.08)
-0.200** (0.06)
-0.523** (0.06)
-0.770** (0.11)
Non-English home language -0.286** (0.05)
-0.102 (0.06)
-0.209** (0.07)
-0.266** (0.05)
-0.042 (0.05)
-0.224** (0.07)
ESL status -1.269** (0.09)
-1.327** (0.11)
-1.482** (0.13)
-0.568** (0.08)
-0.576** (0.08)
-0.408** (0.13)
Changed schools between 1994-95 and 1996-97
-0.378** (0.04)
-0.134** (0.05)
0.109** (0.04)
-0.391** (0.05)
-0.122** (0.05)
0.167** (0.04
** statistically different from 0 at the 0.5 level. bNumbers in parentheses are standard errors.
60

Chapter 5: Model Implementation
5.1. Introduction
“If whole-school reforms practiced truth-in-advertising, even the best would carry a warning label like this: “Works if implemented. Implementation variable” (Olson 1999: 28).
Implementing whole-school reforms is complex even under the best of circumstances.
They typically involve fundamental change to at least several of the fundamental institutions in
schools—organization and governance, curriculum, classroom practice, school culture, and
parental participation. Most members of the school community are affected either directly or
indirectly, and they are often asked to play different roles and to devote additional time to school
improvement. In addition, the programs are often specifically designed to be used in low-
performing urban schools, which face challenging educational and fiscal environments and have
difficulty recruiting high quality staff. It is little wonder that “study after study has found that
implementation is often problematic and inconsistent, even at school sites that have been
identified as exemplars” (Olson 1999: 28).
Given the complexity of these programs and the widespread view that “implementation
dominates outcomes” (Berends et al. 2001: 23), it is important even in a summative evaluation to
examine the level of program implementation among model schools. However, assessing
implementation of these programs across models and schools sites can be difficult for several
reasons. First, each whole-school design is unique in its philosophy, in key model components,
and in the roles teachers, administrators, and other professional staff are supposed to play.
Second, many of the models are, by design, meant to be adapted to the unique circumstances of a
particular school and school district. Third, the models themselves evolve in response to
problems identified in previous implementation efforts. Fourth, there may be large variation even
in the same school between administrators and teachers, and among teachers on their assessment

of implementation success. In a recent national study of whole-school reforms, RAND found that
within-school variation in assessments of implementation was often significantly higher than
between-school variation (Berends et al. 2001: Table 4.4). Thus, developing a measure of
implementation across different schools, different models, and different years is often like hitting
a moving target.
Despite these challenges, we have drawn from several sources of information to develop
a set of implementation measures for New York City elementary schools in our sample,
particularly for the School Development Program (SDP) and Success for All (SFA). The
objectives of our implementation analysis are threefold: (1) to develop implementation measures
across time that can be used in the summative evaluation as treatment variables; (2) to examine
model diffusion across schools in the treatment group and comparison group to inform the
summative evaluation results; and (3) to compare alternative models’ success in achieving
intermediate goals, such as increasing parental participation. We begin this chapter with a brief
review of the implementation research on whole-school reforms to inform our own
implementation analysis. We will then describe the sources of data used in this study, and the
construction of implementation measures. Based on the survey of principals conducted as part of
this project (CPR principals survey), we examine diffusion of model components across
treatment and comparison groups, and make several other cross-model comparisons. Among the
key sources of information for our analysis are several surveys carried out by the program offices
for SDP and SFA. Based on these surveys we have constructed several implementation measures
for these programs across several years that are used in the summative evaluation.
5.2. Review of Implementation Research
In the last decade a body of research on implementation of whole-school reforms has
emerged. The number of published implementation studies remains relatively small, however,
and most studies focus on just one reform model. Recently, several studies have examined
62
implementation of several models associated with the New American Schools (NAS) program
(Berends et al. 2001; Smith et al. 1998). Despite this emerging body of research, “researchers are
a long way from a full understanding of the conditions that lead to a successful implementation.”
(Olson 1999: 28) This research has made it clear that most models share a few core elements,
but any implementation study will also have to consider the unique elements of each model, and
the different school districts where they are adopted. The following is a brief review of some of
the key conclusions from this implementation literature.
In one of the most comprehensive evaluations done of whole-school reform models,
RAND examined a sample of over 100 NAS schools in 10 urban school districts representing 7
different reform models (Berends et al. 2001). One of the key elements of this study was teacher
surveys conducted in each school in 1997 and 1998. To handle the differences across models,
they broke the survey into two parts: a section examining common core elements of each model
and a section to assess “design team specific” elements. Among the core elements they
considered six factors: parent/community involvement, link of student assessments and
standards, teacher monitoring of student progress, student grouping, teacher development and
collaboration, and performance expectations. They found significant differences across models
and sites in the level of implementation in these core elements, with SFA consistently having one
of the highest implementation scores. After several years of improvement, implementation levels
hit a plateau well below full implementation in most schools. The most variation in
implementation ratings occurred in assessment of the level of student grouping and parental
involvement, and there was little reduction over time in the implementation differences across
schools. With regard to implementation of the design specific elements, they found that variation
in the assessment of implementation by teachers in the same school was often twice as high as
variation across schools using the same model. Even within the same model, large differences
63

across schools in implementation quality persisted three to four years after initial
implementation.
The RAND study identifies different stages of implementation and some of the key
elements of implementation in each stage. During the first stage in the process, a school
considers different reform models and selects a particular model to implement. Successful
implementation may depend on whether the school and its staff participate in this decision so
that the model selected can be carefully targeted to the specific needs of the student body and
skills of the staff. Schools often make poor choices because of time constraints, lack of
consultation with staff, and top-down imposition of reforms on schools.1 Schools making a poor
initial choice are seldom successful in sustaining long-run implementation of the model (Smith et
al. 1998). In the initial implementation stage, the assistance provided by the model developer, the
support of the principal, the availability of financial resources to fund staff training, and the
hiring of a program facilitator are especially important.
Assuming a model survives the initial implementation stage in a school, the challenge is
to sustain funding and staff support. External sources of funds for initial implementation are
often from the federal government or private foundations, and they typically last for only a few
years. If the district is not willing or able to provide ongoing financial support, the school may
have to reduce staff development or cut specialized staff supporting the reform model.
Maintaining the enthusiasm of staff for the reform is also important for successful
implementation, particularly if the staff has provided significant additional time to support the
reform. Even for a school they classified as a “fast starter,” Smith et al. (2001) found that
Although there is strong overall support by the faculty of the design, they also have experienced frustration over the amount of work, time, and personal money required to make it successful. They feel that the
64
1 A prime recent example is in New Jersey where “under a May 1998 ruling in New Jersey’s long-running Abott v. Burke funding-equity lawsuit, schools in 30 poor districts were required to adopt whole-school reform models by 2001.” (Hendrie, 2001, 12) A study of implementation of these reforms found very uneven implementation in part, because schools were rushed into selecting a model without soliciting staff support due to tight timelines.
increased amount of work would not be so overwhelming if other things could be taken away... In one teacher’s words, “We’re here until six o’clock at night... We take things home...We’re here on Saturdays doing something; we are physically exhausted.” (p. 314)
Model developers often understate the substantial “opportunity cost” of additional time school
staff contribute to implement a reform model.2
Long-term successful implementation of a model also depends on the ability of the
school staff and model developer to adapt the reform model to changing circumstances and
leadership. The imposition of new state standards, standardized tests, and curriculum often
require the model developer to help the school adapt its program. An even more serious
challenge for a school is when there is a change in leadership in the school or district. Nowhere
was this more evident than in Memphis, Tennessee, which became “Exhibit A in the push for
comprehensive school reform in the mid-1990s” (Viadero 2001: 19). Then-Superintendent
Gerry House required all 160 schools in the 118,000-student district to adopt a comprehensive
school-reform model. Despite what appeared to be ideal conditions for success and promising
early results, the Memphis City School District decided to dismantle this program in 2001. This
change was made one year after Gerry House resigned as superintendent, and Johnnie Watson
took her place. The decision to end the district’s involvement with whole-school reforms was
based in part on the district’s evaluation of student performance on standardized exams in
mathematics, reading and English. According to this study, very few of the models showed any
significant gains in student achievement, including Roots and Wings (Success for All) and
Accelerated Schools.3
2 King (1994) provides one of the few attempts to estimate the cost of staff time associated with implementing three of the most popular whole-school reforms, including Success for All, and School Development Program.
65
3 The evaluation prepared by the district used test score changes by individual students who had been in a program for at least a year, against performance by students that had not been exposed to a program. An alternative set of evaluations, headed by Professor Stephen Ross of the University of Memphis, found improvements in student performance particularly after several years. Ross et al. (2000) used a measure of student value-added in their evaluation, and compared reform schools to schools in Memphis that had not reformed at that point, and to average
While providing relatively little solid evidence on what types of models work in
particular environments, these studies have highlighted some of the key tradeoffs and challenges
confronting schools implementing these models.
�� Use of externally developed models, which often are carefully designed and tested and have strong developer support, can “fall victim to a variety of local factors, such as politics, careerism, and turnover of critical staff” (Nunnery 1998: 286).
�� Reform strategies, which focus “on changing organizational cultures and structures as
a prerequisite for reform” (Nunnery 1998: 288); provide teachers and administrators the opportunity to adopt models to local conditions. However, these reforms may fail in the typical Title 1 school, which doesn’t “have great principals, teachers, or superintendents and can’t get them.” (Olson 1999: 29).
�� Allowing adaptation of the reform model to changes in state standards, local
priorities, and leadership, can help assure the long-term survival of the reform, but can undermine the core principals and strategies that are designed to make the model work.
�� Selling a reform model as simply requiring redirection of Title I funds can increase
the number of schools and districts willing to adopt the reform, but may put long-term success at risk by underestimating the staff time and other resources required for successful implementation.
Besides providing some evidence on implementation success, several of these studies
also try to include implementation information in a summative evaluation of whole-school
reform. The RAND study makes a simple comparison between average gains in student
performance in treatment schools to non-treatment schools in the district. It then compares the
number of cases in which the treatment schools did better by city and design team. Treatment
schools were more likely to show performance gains compared to other schools in their district
in cities/design teams combinations exhibiting higher implementation success (Berends et al.
2001). Several studies of SDP also attempt to link implementation and program performance.
Cook et al. (1999 and 2000) develop an implementation index to assess how “Comer-like” each
performance of students in similar grades in all Tennessee schools. They found gains in student performance from 1995 until 1999, but the gains began to drop off in 2000.
66

school is in two different urban school districts. This index is then used as the treatment variable
in a multi-level model of student performance gains.
5.3. Sources of Data
A full scale formative evaluation typically involves data collection from a number of
sources including: 1) principal surveys, 2) teacher surveys, 3) parent and student surveys, 4)
observation of key meetings or classroom practice, and 5) interviews of school leaders, model
facilitators, and program developers. Most studies use only a few of these methods. The RAND
study, for example, relied on teacher surveys in two different years (Berends et al. 2001). Smith
et al., (1998) in their evaluation of NAS schools in Memphis, Tennessee used interviews of
principals, several teacher surveys, teacher focus groups, and 12 one-hour classroom
observations. In one of the most rigorous formative evaluations of a whole-school reform, Cook,
et al. (2000), used annual surveys of students (5 years worth) on school social and academic
climate, annual surveys of staff (teachers, administrators, supporting staff) on program
implementation, measures of school social and academic climate, and ethnographic studies of
key meetings and classroom practice.
Our assessment of implementation is based on three sources of data: 1) interviews with
program staff, program facilitators, and key education officials; 2) a phone survey of present and
former principals in treatment and comparison schools in our sample; and 3) surveys across
several years by model developers for SDP and SFA in two community school districts in New
York City. In this section we briefly describe these sources of information, and how they are
being used in our analysis.
5.3.1. Key Informant Interviews
While not a central part of the implementation measures used in this chapter, interviews
were conducted with key individuals involved in some capacity with implementation of whole-
school reforms in New York City. The primary objective of the interviews was to find out more
67

about the implementation of a particular program in a specific school in our sample. The key
informants provided a valuable perspective on the implementation of these programs, and in a
few cases were the only source of information, namely, SURR schools for which the principal
did not respond to our survey. The following is a brief description of the interview methods,
content, and sample.
The interviews were conducted either in person or by telephone by Robert Bifulco and
used a semi-structured format. A list of questions was developed in advance, which the
interviewer tried to get answered over the course of the interview. As is typical in interviews of
this type, however, the interviewee often preferred the freedom to pursue subjects in more depth
or discuss topics not on the list. The interviews were taped, transcribed, and summarized. The
interviews followed roughly the organization of the survey (discussed below), and the data
provided extensive information both on general issues in implementation and on implementation
in particular schools.
Interviews were conducted from February through July of 2000, and 25 people were
interviewed. The people interviewed include trainers or local coordinators for the three models
(SDP, SFA, and MES), staff of the New York City Board of Education or New York State
Education Department, staff involved in coordinating school reform efforts in the City, and
model developers and their staff.
Besides serving as a source of implementation information on individual schools, the key
informant interviews provided significant details about state and district involvement in
implementation, particularly for low-performing schools (in New York classified as Schools
under Registration Review, SURR), the interaction of program developers and school and district
staff, the types of training and support provided the schools, and the many impediments to
successful program implementation. In addition, we had some of the key informants look at the
principal survey we were using to get their feedback on how it might be revised.
68
5.3.2. CPR Principal Survey
According to the original design of this project, the principal source of implementation
information was going to be a survey of present and former principals in treatment and
comparison schools. Given the summative nature of the evaluation and the limited resources
available for the survey, the implementation assessment was going to be limited in scope. The
objectives of the survey were: (1) to provide some context for each school on the level of
support internally and externally for reform; (2) to provide an overall assessment of whether key
components of the model were implemented; and (3) to evaluate how much diffusion of the core
components of the models had occurred between treatment and comparison schools. The third
objective builds on the finding in several previous studies of SDP schools that there was
significant diffusion of model elements to the control groups (Cook et al. 1999 and 2000). The
surveys were going to be targeted to principals of treatment group schools that were currently
serving in the schools (in the 1999-2000 school year) and principals running the school at the
point of model adoption. The objective was to provide a rough time series of implementation
measures that could be used in conjunction with the student and school data in the summative
evaluation.
This design had to be modified. We encountered difficulties identifying and finding
former principals but also, as discussed below, discovered detailed implementation surveys
conducted by the developers of SDP and SFA. As a result, we decided not to use the information
gathered in the CPR survey to measure program implementation, but instead used this
information to assess diffusions and to conduct across-model comparisons.
5.3.2.1. Survey implementation
The survey was generally conducted over the telephone with the principal or the
69

principal’s designee.4 Graduate students at Syracuse University conducted the interviews. These
students went through several training sessions supervised by the Survey Director, Robert
Bifulco, and one of the faculty sponsors, William Duncombe. To assure consistency, each
student was provided a telephone “script” that they were to follow in conducting the interview.
One of the training sessions was conducted after the pilot test both to get feedback on required
survey modifications and to adjust the interview protocol. As noted earlier, it is difficult to assure
consistent implementation of a survey of this type, because the interviewee often wants to
control the interview process. Interviewers were trained to allow some flexibility in the interview
process but also to strive for consistency across surveys.
Implementation of the survey of school personnel in New York City involved several
steps. First, we obtained names, addresses and phone numbers for the sample schools and any
former principals. In some cases, particularly for former principals, we were not successful in
obtaining contact information. Second, the superintendent of the community school district
where the elementary school was located was contacted for permission to allow principals in the
district to participate in the survey. We were able to obtain permission from all but one
community school superintendent.
Third, we conducted a pre-test of the survey instrument among non-sample schools in
New York City, New Jersey, and Connecticut. The procedure for conducting these interviews is
the same as for the final survey, except the principal was asked at the end of the interview
process to evaluate the survey instruments. Based on comments of these principals, and certain
key informants, revisions were made to the survey instrument.
Fourth, one week prior to the phone survey, a written copy of the survey was sent to the
principals, along with a cover letter indicating what the nature of the study was, who was
sponsoring it, and that they would be contacted in a week to schedule a formal phone interview.
704 The breakdown of survey respondents is 45 current principals, 8 former principals, 1 current teacher, 3 current
(Cover letters sent as part of the survey process are included as an attachment to this report.)
The principals were encouraged to review briefly the survey prior to the interview. To encourage
participation, they were also told that there was the potential of a $1,000 cash award to the
school for principals who participated. (This award was given to a randomly selected participant
at the end of the survey process.) Due to the challenging environment that many of these
principals work in, making contact with the principals for the interview was often difficult. In
many cases a number of phone calls were required to reach the principal, and some follow-up
letters and surveys were sent. In a few cases, the principals only agreed to complete an
abbreviated version of the survey. The following is a breakdown of survey participation:5
�� Full survey completed 60
�� Short survey completed 3
�� Refused to participate 41
�� District refusal 7
�� Unable to contact 7
�� Total surveys 118
Response rate 53%
5.3.2.2. Survey Content
Developing a survey instrument to be used for multiple models can be challenging,
because of the unique features of each model. Consistent with the approach used in the RAND
study (Berends, 2001), we tried to incorporate a common set of questions for all principals, and
assistant principals, 2 professional developers, and 1 administrative assistant. 5 For 4 schools we had data from current and former principals, one of these had switched from MES to SFA between principals. For these, we selected the data from the latter principal, since we wanted data based on current perceptions of the depth of program implementation. However, for those questions where principals were asked to report historical information, such as how the model was adopted, former principal responses were used, as they were likely to have better institutional knowledge of these particular issues. Not all respondents are principals.
71

some unique questions associated with a particular whole-school reform model. The core
questions facilitate across-model comparisons and provide information on extent of model
diffusion. The other questions provide more specific information on the implementation of each
model.
The survey instrument was divided into three sections. (Copies of the four survey
instruments are included as an attachment to this report.)
1. Background questions: This part is used to establish how long principals have been in the school, what positions they have held, and whether they were there when the program was adopted.
2. Implementation efforts: This part of the survey is designed first to establish the
process used for selecting this model, the major catalyst for adoption, and the level of staff support. Second, it is used to describe the initial implementation process, including staff training, support from model developers and districts, and additional resources available in the schools. Third, it is used to document whether the model is still in use in the school, and, if not, whether another model has been adopted.
3. School policies and practices: The heart of the survey is designed to establish which
practices and policies are being used in the school along with their perceived effectiveness. Practices include planning and management, curriculum and assessment, reading programs, student support services, parental involvement, and school climate.
These sections are repeated in all surveys, but a few specific questions are added to surveys of
treatment schools to get at specific model practices.
5.3.2.3. Development of Measures
In developing the implementation variables from the survey, variables to be used in our
analysis of diffusion, our goals were: (1) to capture as accurately as possible the extent of
exposure to a whole school reform component and (2) to combine variables into composites that
would increase the precision with which the underlying construct is measured. For many
variables we had other research looking at similar constructs in the same school. So for the SDP
we had surveys from other researchers that asked similar questions about the effectiveness of the
school’s Mental Health Team, for example. We tested the reliability test of our score by looking
72
at the correlation between school scores across survey instruments (where the schools were the
same). In other words, we tested whether the scores captured the same underlying phenomenon.
We then constructed implementation measures based on those questions or combinations of
questions that most closely correlated with similar questions on other instruments.
In creating implementation variables, we were also wanted to come up with composites
of questions that were measuring similar underlying phenomena. For this task we used the
Chronbach alpha test to examine whether combining variables increased the precision of the
measure of a phenomenon. In conducting this step, however, we did not rely entirely on this test.
In some cases we decided it was important to have separate measures for different dimensions of
an activity (e.g., Do parents attend parent meetings? Does the school have a parent team?),
whereas in other cases we decided to combine responses in order to consolidate the measure of a
single phenomenon.
5.3.3. Emmons Survey of SDP
Some of the CPR interviews were conducted with program developers (or staff) for the
three models evaluated in the study. Out of these interviews we discovered that detailed
implementation surveys were conducted in all schools in one community school district in New
York City (District 13) for the School Development Program (SDP). Because of the extensive
nature of these surveys and their availability over multiple years, we used them to construct
implementation variables that can be used in the summative evaluation.
5.3.3.1. Survey Implementation
Using a questionnaire developed and revised over a number of years by SDP developers
and evaluators, implementation data were collected in the spring of 1995, 1997, and 1999. For
each wave of data collection, the questionnaire was distributed to all staff members and selected
parents to gauge opinions about the functioning of SDP. Individual responses to survey items are
73
not available to us; instead, the summary report of survey results aggregated to the school level is
used as the basis of the implementation measures used in this study (Emmons 1999).
While the SDP implementation report does not give response rates for individual schools,
it does indicate that this rate was generally less than 50 percent. The overall response rate for all
schools was roughly constant across all three surveys. However, the set of respondents changed
from one wave to the next (Emmons 1999). The percentage of respondents that were female,
African American, and members of the School Planning and Management Team increased in
each wave of the survey. Thus, survey results used in our analysis may not be representative of
all school staff and may not be strictly comparable across years.
5.3.3.2. Survey Content
The questionnaire is titled “School Implementation Questionnaire—Revised (SIQR),”
and was developed by Christine Emmons, Norris Haynes, Thomas Cook, and James Comer in
1995. The SIQR is designed to measure the extent to which schools are implementing the
structure and principles of the SDP. The survey consists of over 100 questions relating to key
elements of the SDP program. Most of the questions ask respondents to rate performance of
various aspects of the program on a Likert scale from one to five, with one being “not at all” or
“never” and five being “a great deal” or “always.” Respondents were also given the option of
“don’t know.” After receiving the surveys from each school, Dr. Emmons averaged the scores
for each question to come up with an overall score for the school. Then she combined these
average scores into indices to construct the following variables for each school (the abbreviations
for the data analysis tables are in brackets):
�� School Planning and Management Team (SPMT) Effectiveness �� Mental Health Team (MHT) Effectiveness �� Parent Team (PT) Effectiveness �� Comprehensive School Plan (CSP) Effectiveness �� SPMT Child Centeredness �� MHT Child Centeredness �� PT Child Centeredness
74
�� General Child Centeredness �� SPMT Guiding Principles6 �� MHT Guiding Principles �� PT Guiding Principles �� Parent Participation �� District Support �� Feelings of Inclusion
To create an overall implementation score for each school, she averaged the scores for SPMT
Effectiveness, MHT Effectiveness, PT Effectiveness, and CSP Effectiveness.
5.3.3.3. Imputation of Missing Information
The overall implementation score provides an excellent variable for the elementary
schools we are studying. In three cases, two in 1995 and one in 1997, implementation measures
for a particular school were not reported. In these cases, implementation ratings were imputed.
To impute missing values a change factor was computed by dividing the average 1995 rating by
the average 1997 rating, and then multiplying this by the 1997 value for this school. The 1997
missing value was imputed by dividing the 1995 measure for that variable by the change factor.7
5.3.4. SFA Implementation Survey
The CPR surveys also uncovered the fact that, as part of the standard replication process,
Success for All (SFA) trainers conduct regular assessments of implementation progress. These
assessments, like those of SDP, provide extensive information on implementation that we can
use to construct implementation variables.
The SFA assessments are typically conducted twice a year and involve direct observation
of classrooms, tutoring sessions, staff meetings, and student-assessment procedures. The trainers
conducting the assessments use an extensive checklist detailing each component of the model.
For the schools we are evaluating, SFA trainers used three different assessment instruments
between 1996 and 2000. Staff in the program office for SFA provided us copies of these
6 These refer to the SDP guiding principles of “consensus, collaboration and no-fault decision-making.”
75

assessments for each of the SFA adopters in this study for the school years 1996-97 through
1998-99. Only one school is missing an evaluation for one of these school years, and most
schools have evaluations for each semester. The data, however, are not complete either across
school years or across semesters.
5.3.4.1. Survey Content
There are many similarities among the three instruments, but also significant differences.
Each instrument is divided into major model components including: assessment and regrouping,
tutoring, staff development and support, early learning, curriculum (Reading Roots and Reading
Wings), and family support. Table 5-1 summarizes the characteristics of each instrument in
terms of what is included, and the rating scale. Instrument 1, which was used during the 1996-97
school year and at the beginning of the 1997-98 school year, provides implementation ratings for
16 different model components using a 5 point scale. Instrument 2 was used only during the
spring of 1998 and includes an expanded set of categories and a different rating system.
Instrument 3 uses most of the model elements identified in Instrument 2, but they are grouped
into 14 categories. The rating scale was also different.
The overall components of implementation that are measured across all three instruments
are:
�� Assessment and regrouping �� Tutoring for reading �� Staff development and support �� Early learning �� Reading Roots �� Reading Wings 5.3.4.2. Development of Measures Developing a consistent set of measures for SFA implementation across time was
challenging because of changes in the survey instrument. The following is a brief discussion of
7 Additionally, one elementary school in the District 13 was dropped, because it adopted SDP in 1992, which was
76

the steps we took to develop such measures. The first step was to remove Instrument 2 from the
dataset, effectively taking out the evaluation data for the 1997-98 school year. Instrument 2 is not
very comparable to the other two, both because it does not have a method of deriving overall
scores and because it is difficult to interpret across its two dimensions. In addition, we do not
have any data for one of the nine schools for this school year. The key issue then becomes
matching the 1996-97 school year, when schools were evaluated using Instrument 1, to the 1998-
99 school year, when Instrument 3 was used. (Instrument 3 was also used in the 1999-2000
school year, but the scores for this year were not used because of incomplete student-level test
score data).
Developing overall component scores for Instrument 3 was relatively straightforward
because sub-component scores could be averaged. Instrument 1 asked evaluators to rate, which
“Stage” of development a school had reached, with the Stages scored one through five. For the
Reading Roots, Reading Wings, Early Learning and Tutoring components, however, evaluators
often marked not one but several “Stages” and indicated different degrees of implementation
within each Stage. So an evaluator might indicate that “few” teachers practiced at Stage 1, “half”
at Stage 2, and “few” at Stage 3. While these rankings were sometimes difficult to interpret, we
took averages of these types of score, weighting the “few” as 0.25, “half” at 0.5, “most” at 0.75
and “all” at 1.0.
The second step was deriving component scores across school years. Most of these
schools deployed the SFA program in the 1995-96 and 1996-97 school years. While we
considered averaging the scores for a single school year, schools were at different stages in the
fall 1996, with some just beginning the program and others having had a year or more
experience. In order to obtain as comparable a score as possible for an initial deployment period,
we used the second semester for the 1996-97 school year (or the spring 1997 score). Taking this
77outside the scope of our sample.

later score also allowed us to sidestep both missing evaluations for the fall 1996 semester and a
number of missing scores that evaluators had hedged on because they did not think that the
program was sufficiently implemented to even receive an evaluation. Spring 1997 data was
missing for one school that only did an assessment in the fall of 1996. However, this school
started the SFA program in 1994 so the fall 1996 score is likely to represent an initial full
deployment score. Similarly, for the 1998-99 school year, we took the spring 1999 scores. Again,
this allowed us to sidestep some missing evaluations and derive a score for a common endpoint
of implementation.
The third step is developing standardizing component scores across instruments. While
we considered several methods for matching Instruments 1 and 3, in the end we settled on the
most straightforward method. We had the most information for Instrument 3 – at least three
semesters of data. Looking at trend lines for the scores across these three semesters we noted that
over time the scores (generally) moved up. Thus, we assumed that scores between Instrument 1
from the early years of implementation and Instrument 3, the later years, would increase steadily
or even jump since a year is missing between the two sets of scores. The following table displays
the conversion of Instrument 3 scores into a 1-5 scale.
Instrument 3 Score Converted Score
1-30 1
31-60 2
61-90 3
91-120 4
121-150 5
78

Also, since a “100” score on Instrument 3 is the equivalent of full implementation, this seemed to
be a fair match with a “Stage 4” on Instrument 1, which usually indicated that the program
elements were fully deployed. A “Stage 5” on Instrument 1 appears to indicate a superior
program, thus a level of effort and excellence beyond the basic adoption and use of the
programmatic components. In short, the scales appear to roughly match both intuitively and
numerically.
We then adjusted the scores slightly, first by looking at the previous semester scores and
then by assessing the strength of the score. If a previous semester score was a “3”and the current
semester score was a “5” but had been a “121” on the Instrument 3 scale, it meant that the “5”
was borderline. If key informants thought that performance was good but not excellent, then the
score would be adjusted down to a “4”. Generally, we focused on “downgrading” since so many
schools clustered in the 4-5 range, it appeared that evaluators tended to score a school high rather
than low in order to be encouraging. The object of the adjustments was to see if some schools
were closer to average, so scores on the margin between 3 and 4 were most carefully examined.
This adjustment process resulted in five “4s” being adjusted to “3s” and one “5” being adjusted
to a “4”. The Reading Roots scores were most affected by this shift.
The last step is dealing with missing values. Where a component was missing (one school
had no Early Learning component), the school was given the score of “1” for that component,
that is, we assumed that piece of the SFA program was not implemented or was not in place in
that school. In two schools the “tutoring” component had apparently been discontinued for the
spring semester by the school district. However, we had scores for the fall semester and
following year. In one case, the school had high scores both before and after this semester, so it
was given an average score (3). The idea is that the students were not receiving the treatment for
the full year. The other had low scores before and after and so was given a low score;
presumably, the students had received little benefit before and little after.
79
5.4. Diffusion and Across-Model Comparisons
Whole-school reforms are often introduced into large urban districts, which have
undergone a range of education “reforms” over the years. New York City is no exception. Other
reforms may include some of the core elements of a specific whole-school reform model. Thus,
the comparison group schools may share some of the same features as treatment schools. For
example Cook et al. (1999) found in Prince George’s County, Maryland, that the control schools
rated almost as high on a scale of “Comer-like” features as the treatment schools, and
experienced just as rapid an increase in these features after the SDP was introduced into
treatment schools. This occurred, in part, because these schools had been exposed previously to
principles from the Effective School Movement, which share some common characteristics with
SDP. In addition, “further diffusion between program and control schools probably occurred
during district-wide in-service training sessions.” (Cook et al. 1999: 584) Significant diffusion
may account for the lack of student performance differences found in this study.
An important part of a summative evaluation is to determine the extent of diffusion of
key elements of the treatment to the control group. In this section, we present evidence on
diffusion for both SDP and SFA. We also make across-model comparisons on implementation
for other common elements in these models. For example, how do these models compare in
terms of parental involvement, and curriculum alignment? The major source used for this
analysis is the CPR principal survey discussed previously. We begin this section with a
classification of districts that will be useful in the diffusion analysis.
5.4.1. District Classification
The initial selection of treatment and comparison schools was based, in part, on New
York City Board of Education records on model adoption. From the original 60 surveys, we
dropped two Comer schools that only filled out the short survey and found that several other
schools had duplicate interviews from current and former principals. In the end, 55 schools had
80
complete CPR surveys. The principal surveys indicate that some schools are currently using
different models than recorded in the Board of Education records. To help keep track of each
district’s experience, we use the following classification scheme for each district, whole-school
reform model, and year:
A. Recorded by the New York City School District as the type of model adopted. B. Reported by the school principal as the model currently in use. C. A model to which a school has been exposed (as been confirmed through key
informants or principal accounts). D. The model implemented over the long-term, defined as three or more years using the
model.
Table 5-2 provides some indication of the way school use of different models has shifted
over time. For SFA, only 8 schools in our sample were initially recorded in this model, most of
which were in District 19. All these schools maintained implementation over the whole sample
period. In addition, 7 other schools recently adopted SFA, including four comparison-group
schools. Most of these adoptions reflect placement in the Chancellor’s district for low-
performing schools. Fourteen schools are recorded as having adopted SDP, nine in District 13 as
part of a district-wide program. Two of the remaining five schools have either adopted another
model or stopped using SDP. All eight of the MES schools were classified as SURR schools and
were encouraged to adopt a reform model. Only four currently use the program, however; the
remaining schools either switched to SFA or do not currently use a reform model.8 Finally,
several of the comparison schools claim to have adopted SFA, MES, or some other model.
Each of the classifications has different implications for the assessment of
implementation. For the diffusion analysis we use either the model that the school was exposed
to during our sample period or the model the school used for three or more years. For examining
current implementation outcomes across models, we use the model that the principal says is
currently in use (1999-2000 school year).
81

5.4.2. Model Diffusion
The CPR principal survey included core elements of both the School Development
Program (SDP) and Success for All (SFA). Using these core questions, which were asked of all
principals in the sample, we are able to estimate the degree of diffusion. Because the elements of
More Effective Schools (MES) are less clearly defined, we only focused on diffusion with regard
to SDP and SFA.
5.4.2.1. Diffusion of SDP
The Comer program, SDP, places an emphasis on making school management more
inclusive by bringing in parents and a range of staff to participate in a set of three key
management teams: the School Planning and Management Team (SPMT), the Mental Health
Team (MHT), and the Parent Team (PT). Together these groups work to develop a
Comprehensive School Plan (CSP) in a process that is intended to build consensus around how
the school needs to change.
In terms of diffusion, the issue is the extent to which this model, with its emphasis on
broad-based, inclusive decision-making, has been implemented more frequently in Comer
schools than in non-Comer schools. Key elements that we examined were whether schools had
the three Comer-style “teams” in place and how effective the principal thought these teams were.
In addition, we asked whether the school developed either a CSP or “Comer-style” methods of
consensus building. Note that when assessing effectiveness of implementation across schools, we
used classification D, that is, we focused on the schools that had implemented a particular whole-
school reform model for three or more years and continued to use that model. Schools that have
recently adopted a reform for the first time are grouped with the comparison schools.
82
8 Two MES schools have dropped MES and recently adopted SFA. For this analysis, we recorded these schools as having been exposed to SFA (as opposed to MES), since we are not looking at diffusion of MES characteristics but only Comer and SFA.

As indicated in Tables 5-3 and 5-4, almost all schools have the key Comer school
elements in place and the non-Comer schools tend to rank themselves higher in terms of the
effectiveness of these model components. MES schools, which have a model similar to the
Comer (SDP) model, rank themselves particularly high on SDP elements. These conclusions
hold regardless of how we subdivide the sample (i.e., whether we use a different district
classification).
�� School Planning and Management Team (SPMT): All schools in the survey reported having a management team. When comparing the means across SFA, SDP, MES and Comparison schools, the SFA and SDP schools generally rank their SPMT effectiveness lower than the other groups and lower than the mean for all schools (Table 5-3, column 1). Both SDP and MES schools are more likely to have parental involvement in the SPMT, particularly compared to SFA (Table 5-4, column 4).
�� Mental Health Team (MHT): All but four schools have some form of mental health
team. One of these is a SFA school and three are comparison schools. The SFA schools rank their Mental Health Team the lowest. Again, SDP schools rank the effectiveness of their MHT lower than the Comparison or MES schools (Table 5-3, column 2).
�� Parent Team (PT): Only 37 out of 55 schools have a parent team. SFA schools in
particular are less likely to have a Parent Team – of nine SFA schools only four have a parent team. However, ten of twelve SDP schools have a parent team. Four of five MES schools have a parent team, and 19 out of 29 Comparison schools have a parent team. SDP and MES are apparently very likely to implement this component. To measure the effectiveness of the Parent Teams, we looked at the frequency of meetings and the overall level of parental participation in school. Generally, we find that SDP schools rate themselves lower than all schools in terms of parent team participation. However, they rate themselves higher than SFA schools for parental participation overall, which is not surprising given that most SFA schools do not even have a Parent Team (Table 5-4, columns 2 and 3).
�� Comprehensive School Plan (CSP): All schools appear to have a comprehensive
school plan. Looking at scores for CSP effectiveness and the integration of the CSP into the planning and management process, we find that SDP schools rank themselves lower than all the other schools, on average.
�� Comer School Development Program principles of consensus building: All
schools were asked to describe the levels of consensus in their school. While SDP schools ranked themselves slightly higher than SFA schools, they were also slightly lower than the Comparison schools.
83
Generally the Comer schools rank themselves lower than the comparison schools and
MES schools for the effectiveness of SDP model elements. There could be a number of
explanations, which include:
�� Lack of support among principals: As will be further discussed in the across-
model analysis, Comer principals appear to be unenthusiastic about their program. On average, Comer school principals rank principal support low and district support high, while MES schools rank principal and staff support very high and district support low.
�� Comer principals know of what they speak: Another possible explanation is that
Comer school principals know what they are talking about when they rank effectiveness, and because they are more familiar with what “good” implementation looks like, they are more reasonable in their estimates.
�� More difficult environment: Finally, the schools that are actually implementing
whole school reform models may have the most difficult student populations and so have the most difficulty implementing these management policies. However, Comer schools may actually face a less difficult environment than the schools adopting other models or the Comparison schools.9
5.4.2.2. Diffusion of SFA Key SFA model characteristics revolve around the reading program and related changes
in curriculum, class time, and student grouping. In particular, SFA emphasizes a 90-minute
reading period, during which students are organized into small groups by reading levels. This
grouping should be based on reading level and thus, may cut across grade levels. SFA also
emphasizes regular assessments of reading abilities and regrouping based on these assessments.
To determine the diffusion of SFA model characteristics, we asked schools whether they
had 90-minute reading periods, whether the classes during these periods were smaller than
during the rest of the day, whether students were grouped by reading level and (as necessary)
across grade levels, and finally whether they used certified reading teachers. As these SFA
84
9 Comer schools have the lowest percentage of LEP students and the lowest enrollment levels. They have the highest percentage of students in school all year (or the lowest level of turnover) but the worst average in terms of levels of attendance. MES model schools appear to be more likely to have a higher percentage of LEP students. SFA schools appear to have higher student turnover and the MES and Comparison schools have, on average, significantly higher enrollment.

characteristics are relatively concrete, we do not have information on the effectiveness of
implementation in SFA versus non-SFA schools.
In the CPR survey we found that six schools had just begun implementation of the SFA
program in the 1999-2000 school year. These schools are included in this analysis because they
have clearly incorporated SFA-like characteristics into their curriculum. Because we are focusing
on whether the basic structure of the SFA program is in place, we use classification C, namely,
whether the school was exposed to the model.10 The following is a summary of findings with
regard to diffusion of SFA elements (Tables 5-5 and 5-6).
�� 90 minute reading period: All schools report having a 90-minute period for reading.
�� Smaller class sizes: Using smaller class sizes for reading is not unheard of in other schools but is a primary characteristic of SFA schools. While SFA schools are clearly more apt to use small reading classes, forty percent still do not. MES schools appear to be the least likely to use small reading classes.
�� Homogenous student grouping: Unlike smaller class size, which requires some
reallocation of resources, the homogenous student grouping for the reading period appears to be a widely diffused policy measure. All but one SFA schools, as well as a large share of the comparison group schools, use homogenous grouping for reading. SDP schools are the least likely to implement this particular policy.
�� Grouping students across grade levels: As with smaller class sizes, this component
appears to be consistently in place in the SFA schools, but much less used in all other schools.
�� Use of certified reading instructors: While not necessarily a distinguishing element
of SFA, the use of Certified Reading Instructors provides some indication of the emphasis on reading and the resources dedicated to reading instruction in a particular school. Generally, it appears that there is a somewhat heavier use of certified reading instructors for the smaller classes offered during the reading program and for tutoring in SFA schools.
�� SFA core: Aggregating all five of these elements into a measure of the SFA core, we
can summarize the level of diffusion of SFA-type reading programs to other schools. Almost all of the SFA schools use three or more elements (86.7%), compared to a
85
10 If we leave the schools that have just implemented SFA in the Comparison group, then we find that the Comparison group has an artificially high number of schools with SFA-like characteristics. Since we are using “exposure” to program characteristics, the one Comer school that dropped the model was added back in for Comer, raising the number of Comer schools from 12 to 13 (otherwise it would be counted as a Comparison school). Adding this school back in does not change the substance of the analysis. MES schools that recently adopted SFA (there are two) are counted as having SFA exposure.
much lower percent for the other models or Comparison group. The SDP schools, in particular, do not implement SFA-like reading programs.
The diffusion analysis with regard to SFA-like reading programs provides much stronger
evidence that these elements have not generally diffused to non-SFA schools. SFA also promotes
the use of a management team and parental participation. On these elements, SFA schools tend
to score lower than most other treatment and control schools.
5.4.2.3. Across-Model Differences
Besides examining the diffusion of key model elements, it is also possible to use the CPR
principal survey to examine other across-model differences. We looked at whether there are
significant differences in the school activities, school environment, or intermediate outputs of the
program that could impact program effectiveness. We examined, for example, the level of
parental participation, the alignment of curriculum, the school climate, and the level of
inclusiveness on teams. These intermediate outputs could all be viewed as desirable goals for a
school that could be affected by the whole-school reform model. For this analysis, we used
classification B, namely, the model that a school reports using currently.
�� Parental involvement: Our measure for parental participation overall is simply a subjective assessment of the level of parental involvement. The measure of parental participation at school functions is more objective; it is the principal’s estimate of the percentage of parents that show up for school functions. Generally, across all measures, one sees that MES schools rank themselves higher than other schools. SFA schools tend to rank themselves at the bottom (Table 5-7).
�� Curriculum alignment with the English Language Arts (ELA) test: From the
CPR Survey we have two measures of curriculum alignment. One is a self-assessment (by the principal) of the effectiveness of the ELA alignment process (Table 5-7). The other is a question about the actual number of years that the curriculum has been aligned. We also asked a question about whether the school had a “curriculum alignment team” but almost all schools had such a team. Generally, with curriculum alignment we also find that SFA schools lag both in terms of their self-assessment of effectiveness and in terms of the number of years that the curriculum has actually be aligned. The SDP schools appear to have aligned their curricula well, and alignment is similar in MEA and comparison-group schools.
�� School climate: The CPR survey asked a series of questions about school climate,
including how well the schools were able to focus classroom time on instruction,
86
whether adults exhibit high expectations of students, and whether the staff is sensitive to ethnic and cultural differences. We also asked how safe and orderly the school was. These measures were averaged to obtain a general “school climate” score. We also broke out “safe and orderly” school measures. Generally, the SFA and Comer school principals rank their schools lower on these measures than MES or comparison school principals (Table 5-7).
�� Inclusiveness on the SMPT: Generally, the models seem to be equally inclusive of
administrators and teachers in the SPMT (Table 5-8). SDP and MES schools appear to be most consistently inclusive of all staff (such as teachers aides) and parents. MES schools rank themselves as superlative on all fronts. That SDP and MES should rank themselves higher on these elements is not surprising given their similar focus on inclusive management processes.
�� Levels of teacher, principal and district support for model implementation: The
MES school principals rank their schools strikingly low on district support and high on staff and principal support (Table 5-9). Conversely, SDP principals rank their schools low on principal and staff support and relatively high on district support.
The analysis of implementation across models presents some striking differences that
could affect estimated model impacts on student performance. SFA does relatively poorly on
parental participation and on curriculum alignment with New York’s 4th grade ELA exam. The
latter result is not surprising considering the use in SFA of a prescribed curriculum. SDP schools
seemed to do well on inclusiveness, but not in terms of the school climate or support within the
school. MES school principals, on the other hand, seem to rank their schools highly on all
measures except district support. SDP principals are less enthusiastic about the model relative to
MES schools, and therefore have a tendency to be more pessimistic about the efficacy of the
program. It should be noted that these conclusions may simply describe the specific
circumstances of these schools, and not reflect generally on SDP or MES.
5.5. Emmons Survey Results for SDP Schools
As discussed previously, the Emmons survey was completed by staff in SDP schools in
1995, 1997, and 1999. The survey results are summarized in Emmons (1999), and school-level
aggregate indices are reported for 14 different items in the survey. Four of the items are
combined into an overall implementation measure. Despite some changes in the sample
87

responding to the survey across time, this survey presents a reasonably consistent picture of
implementation in these schools.
Table 5-10 summarizes the survey results for 1995, 1997, and 1999 for the overall index.
The first three columns of Table 5-10 are the implementation variables used in the summative
evaluation reported in Tables 7-10 to 7-12 in Chapter 7. In addition, implementation summaries
are provided for the four key components used to construct the overall index. Overall there was a
modest (17 percent) improvement in average implementation during this four-year period (3.18
to 3.72). Fourteen of the 15 schools experienced increasing implementation, in some cases
implementation indices rose dramatically. Implementation improved steadily in most schools
over this period, as indicated by the strong positive correlation between 1995 and 1999 scores
(0.68). While it is certainly not possible to rule out sample selection or construct validity
problems, the overall picture suggests that the vast majority of these schools had reached
reasonably strong levels of implementation by 1999.
Schools’ scores on the components of this index all experienced growth between 1995
and 1999, on average. The growth in the effectiveness of the school planning and management
team (SPMT) and use of a comprehensive school plan (CSP) were particularly strong. Given that
the CSP is one of the key outputs produced by the SPMT, it is not surprising that schools tend to
have similar ratings on both, with a correlation of 0.91 in 1995. To a somewhat lesser degree,
each school tends to have similar ratings for the other categories, with the correlation between
categories in the same year usually between 0.70 and 0.90. While there is significant variation in
implementation scores across schools, it appears that when implementation of one element is
perceived by school staff as having improved, the other elements are rated as having improved as
well.
88

5.6 Survey Results for SFA Schools
The SFA organization regularly surveys participating schools on their progress in
implementing the program. As discussed previously, three different survey instruments were
used in New York City during the time period of this study (Table 5-1). To calculate
implementation scores, we averaged the fall 1996 and spring 1997 scores (Instrument 1), and the
fall 1998 and spring 1999 scores (Instrument 3). Table 5-11 reports implementation scores for 9
schools in District 19. The overall score is an average of the six individual items. As discussed
previously, we tried to make the results in Instrument 1 and 3 comparable, but comparisons
across years should still be interpreted with caution.
The first two columns of Table 5-11 are the implementation variables used in the
summative evaluation reported in Tables 7-10 to 7-12 in Chapter 7. Overall there was a
substantial (29 percent) improvement in average implementation during this two-year period
(3.01 to 4.0). All but one of the schools experienced increasing implementation, and in some
cases implementation indices rose dramatically. Implementation improvements did vary in
magnitude across the schools over this period, as indicated by the moderate positive correlation
between 1997 and 1999 scores (0.34). While measurement problems may account for part of this
increase (i.e., problems rescaling these surveys to make them similar), the overall picture
certainly suggests that the vast majority of these schools had reached reasonably strong levels of
implementation by 1999, when all but two had scores of 4 out of 5.
All six components to the overall index experienced growth between 1997 and 1999, on
average. The growth in implementation of the reading tutoring programs, early learning, and
Reading Roots programs were particularly strong. While overall the improvements in
implementation were consistent across model components, the variation across schools for all
but the Early Learning component was high. The correlation between 1997 and 1999 scores for
Reading Roots and Reading Wings was negative, and for staff development the correlation was
89
close to zero. The correlation across model elements varies widely, particularly for the 1996-97
surveys. For example, implementation scores on “assessments and regrouping” is negatively
correlated with “reading tutoring,” and weakly positively correlated with all other elements
besides “staff development.” By 1999, these correlations were all highly positive suggesting a
much stronger link between assessment and regrouping and the other elements of SFA. In one
case, however, the correlation remains only moderate in 1999,namely, the relationship between
tutoring and Reading Roots and Reading Wings. While a number of schools made major
progress in implementing a tutoring program by 1999, three schools remain at an early stage of
implementation.
5.7. Conclusions
Whole-school reform models are complex enterprises that require the cooperation of a
number of key actors inside and outside the school. It is little wonder that the implementation
track record for most models has been spotty at best. The limited research linking
implementation and student performance suggests that strong program implementation is the
“sine qua non for student change” (Cook et al. 1999: 543).
Unfortunately, accurately measuring program implementation, particularly across
models, is difficult, and ideally should consider the perspectives of a number actors (particularly
administrators, teachers, and parents). A full-scale formative evaluation was beyond the scope
and resources of this project. Instead, we have set the more modest goal of developing
implementation measures that can add depth to the summative evaluation. One objective has
been to examine diffusion of key model elements to comparison group schools. For this task, we
have used primarily a survey of principals conducted as part of this project, supplemented with
interviews of key informants. The second objective is to develop overall implementation
measures for each model that vary across time. Using detailed surveys developed by the program
staff for the School Development Program (SDP) and Success for All (SFA), we have
90
constructed summary implementation measures for elementary schools in several community
school districts in New York City.
The analysis of diffusion indicates key elements of SDP have diffused widely among
both treatment and comparison schools. In fact, SDP schools are no more likely to implement
some of these elements than are comparison group schools. Schools affiliated with the More
Effective Schools (MES) program actually rank higher on many of these program elements than
SDP schools. In contrast, SFA-like reading programs are well implemented in SFA schools but
are not widely dispersed to other schools.
A comparison of these programs in their achievement of intermediate goals, such as
raising parental participation, reveals that the MES program appears to have been the most
successful. MES schools rank high on parental involvement, school climate, curriculum
alignment, inclusiveness, and staff support. By contrast, SFA schools are ranked below average
on all of these. SDP schools do well on inclusiveness and curriculum alignment, but are below
average on the other criteria.
Finally, we have developed overall implementation measures for the SDP and SFA
models using results of surveys developed by the program offices. Survey results for both
models indicate a steady increase in model implementation in the first 3 to 5 years of the
program. However, there is wide variation in the level of implementation across schools,
particularly during the early years of implementation, and for specific model elements. While
implementation of these two models in two community school districts in New York City
appears to be improving, participating schools are not necessarily more successful in
implementing some of the key model elements than are MES or comparison-group schools.
91

Table 5-1: Description of Success For All Implementation Surveys
Years Used
Measures of Elements
Measures of Programmatic Components
Instrument 1 Fall 1996- Nov. 1997 Evaluators rate elements of implementation across the dimensions of In Place, Immediate Next Steps and Future Plans.
Evaluators then give overall ratings for the “stage of implementation” for a particular component of the SFA program (e.g. g, etc.). The stages ranged from 1 to 5 for 16 major implementation components and sub-components – some of the larger programmatic components only have sub-component ratings (see example below)
Instrument 2 Dec. 1997 – Spring 1998
This instrument asks evaluators to rate elements across two dimensions. One evaluates whether an element is In Place, Immediate Next Steps, and Future Plans. The second dimension is to determine whether within each of these categories the school has Fully Met Goals, Met Most Goals, Met Some Goals or Met Few or None
There is no rating for overall implementation of key program components.
Instrument 3 Fall 1998-Spring 2000 Evaluators rate the level of implementation on a scale of 1-3, with 2 indicating that the school had implemented an element and 3 indicating a very high level of implementation. If all the elements receive “2s” then the school is judged to have “full implementation,” though clearly many who have outstanding levels of implementation will receive scores above the full implementation score.
The scores for each element are summed (some are weighted by a double count) to develop an overall implementation measure for a set of 14 overall implementation components and sub-components). Instrument 3 does not have the “family involvement” score that Instrument 1 has.
92
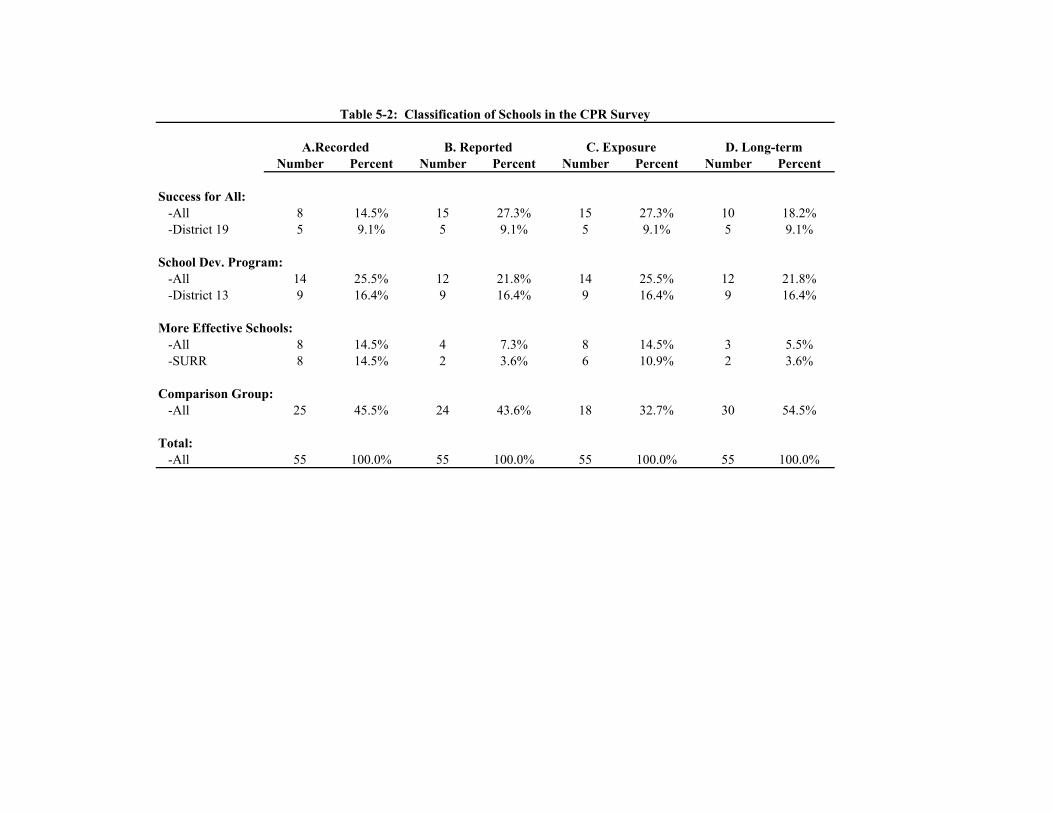
Number Percent Number Percent Number Percent Number Percent
Success for All: -All 8 14.5% 15 27.3% 15 27.3% 10 18.2% -District 19 5 9.1% 5 9.1% 5 9.1% 5 9.1%
School Dev. Program: -All 14 25.5% 12 21.8% 14 25.5% 12 21.8% -District 13 9 16.4% 9 16.4% 9 16.4% 9 16.4%
More Effective Schools: -All 8 14.5% 4 7.3% 8 14.5% 3 5.5% -SURR 8 14.5% 2 3.6% 6 10.9% 2 3.6%
Comparison Group: -All 25 45.5% 24 43.6% 18 32.7% 30 54.5%
Total: -All 55 100.0% 55 100.0% 55 100.0% 55 100.0%
Table 5-2: Classification of Schools in the CPR Survey
A.Recorded B. Reported C. Exposure D. Long-term
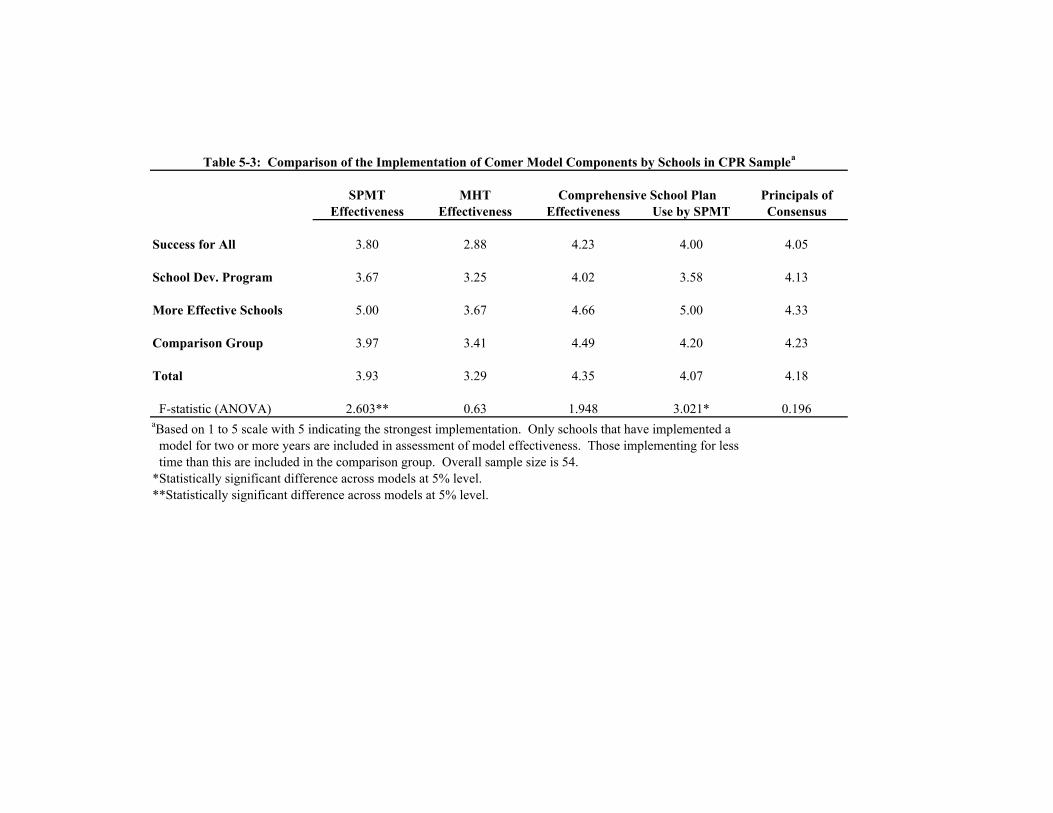
SPMT MHT Principals ofEffectiveness Effectiveness Effectiveness Use by SPMT Consensus
Success for All 3.80 2.88 4.23 4.00 4.05
School Dev. Program 3.67 3.25 4.02 3.58 4.13
More Effective Schools 5.00 3.67 4.66 5.00 4.33
Comparison Group 3.97 3.41 4.49 4.20 4.23
Total 3.93 3.29 4.35 4.07 4.18
F-statistic (ANOVA) 2.603** 0.63 1.948 3.021* 0.196aBased on 1 to 5 scale with 5 indicating the strongest implementation. Only schools that have implemented a model for two or more years are included in assessment of model effectiveness. Those implementing for less time than this are included in the comparison group. Overall sample size is 54.*Statistically significant difference across models at 5% level.**Statistically significant difference across models at 5% level.
Comprehensive School Plan
Table 5-3: Comparison of the Implementation of Comer Model Components by Schools in CPR Samplea
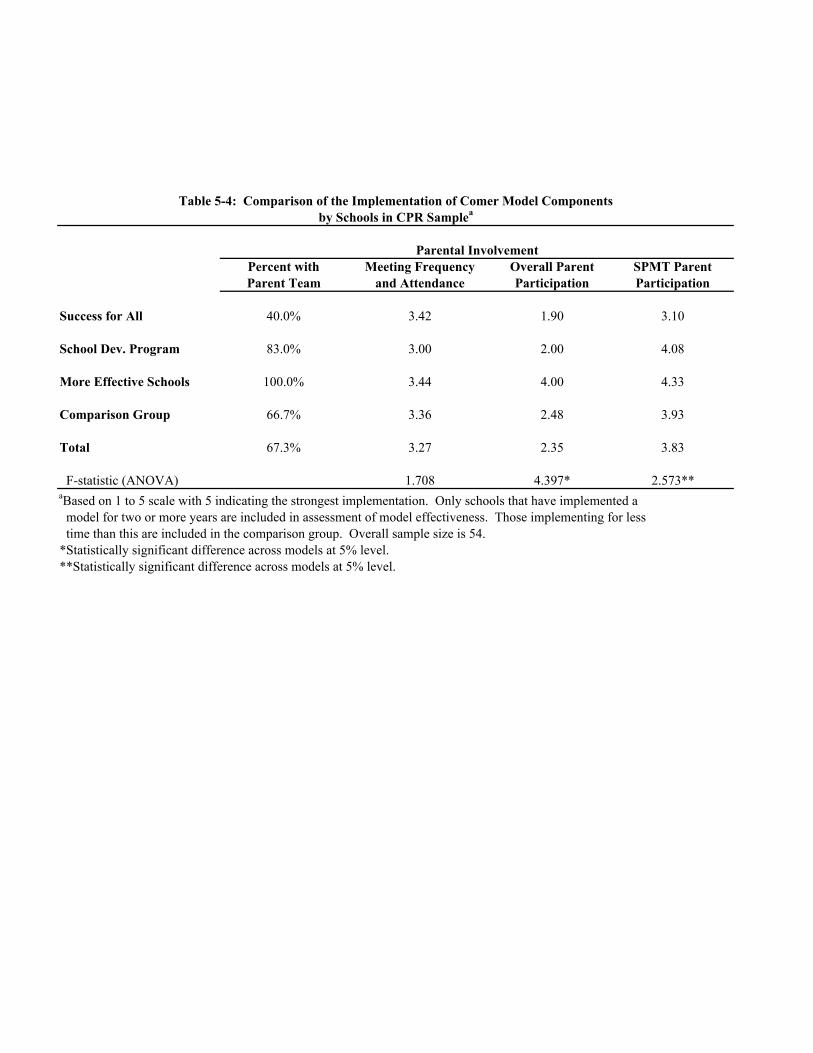
Percent with Meeting Frequency Overall Parent SPMT ParentParent Team and Attendance Participation Participation
Success for All 40.0% 3.42 1.90 3.10
School Dev. Program 83.0% 3.00 2.00 4.08
More Effective Schools 100.0% 3.44 4.00 4.33
Comparison Group 66.7% 3.36 2.48 3.93
Total 67.3% 3.27 2.35 3.83
F-statistic (ANOVA) 1.708 4.397* 2.573**aBased on 1 to 5 scale with 5 indicating the strongest implementation. Only schools that have implemented a model for two or more years are included in assessment of model effectiveness. Those implementing for less time than this are included in the comparison group. Overall sample size is 54.*Statistically significant difference across models at 5% level.**Statistically significant difference across models at 5% level.
Table 5-4: Comparison of the Implementation of Comer Model Components
Parental Involvement
by Schools in CPR Samplea
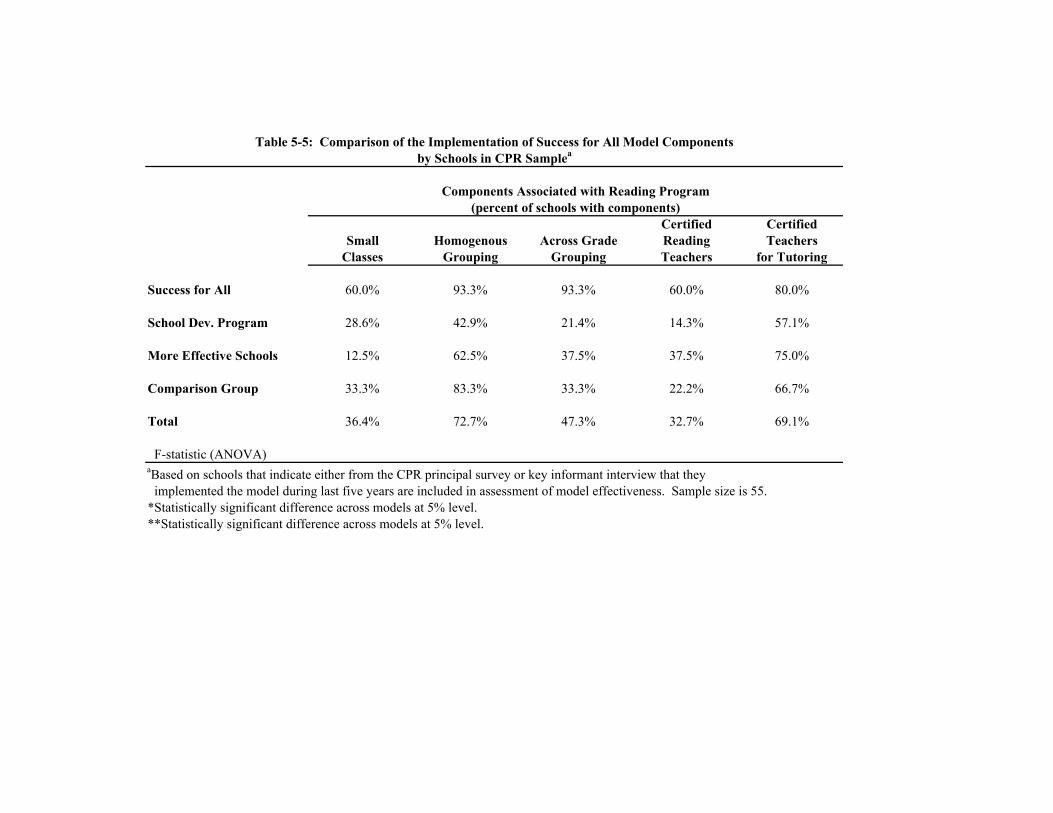
Certified CertifiedSmall Homogenous Across Grade Reading Teachers
Classes Grouping Grouping Teachers for Tutoring
Success for All 60.0% 93.3% 93.3% 60.0% 80.0%
School Dev. Program 28.6% 42.9% 21.4% 14.3% 57.1%
More Effective Schools 12.5% 62.5% 37.5% 37.5% 75.0%
Comparison Group 33.3% 83.3% 33.3% 22.2% 66.7%
Total 36.4% 72.7% 47.3% 32.7% 69.1%
F-statistic (ANOVA)aBased on schools that indicate either from the CPR principal survey or key informant interview that they implemented the model during last five years are included in assessment of model effectiveness. Sample size is 55.*Statistically significant difference across models at 5% level.**Statistically significant difference across models at 5% level.
Table 5-5: Comparison of the Implementation of Success for All Model Componentsby Schools in CPR Samplea
(percent of schools with components)Components Associated with Reading Program

0 1 2 3 4 5
Success for All 0.0% 6.7% 6.7% 26.7% 13.3% 46.7%
School Dev. Program 28.6% 14.3% 35.7% 14.3% 0.0% 7.1%
More Effective Schools 0.0% 25.0% 37.5% 25.0% 12.5% 0.0%
Comparison Group 0.0% 33.3% 33.3% 5.6% 16.7% 11.1%
Total 7.3% 20.0% 27.3% 16.4% 10.9% 18.2%
F-statistic (ANOVA)aBased on schools that indicate either from the CPR principal survey or key informant interview that they implemented the model during last five years are included in assessment of model effectiveness. Sample size is 55.*Statistically significant difference across models at 5% level.**Statistically significant difference across models at 5% level.
by Schools in CPR SampleaTable 5-6: Comparison of the Implementation of Success for All Model Components
Number of Core Components of SFA Implemented (Percent of Schools in Sample)

Overall School Function Effectivenessa Years Aligned Climate Safe/Orderly
Success for All 1.86 3.01 2.67 1.13 3.82 3.87
School Dev. Program 2.00 3.08 3.00 4.00 3.61 3.83
More Effective Schools 3.50 4.00 4.00 1.75 4.54 5.00
Comparison Group 2.63 3.36 3.63 1.96 4.16 4.33
Total 2.35 3.25 3.25 2.16 3.98 4.15
F-statistic (ANOVA) 4.397* 3.946* 5.807* 6.275* 4.395* 3.801*aBased on 1 to 5 scale with 5 indicating the strongest implementation. Based on classification B--school principal has identified this as the current model in use. Overall sample size is 54.*Statistically significant difference across models at 5% level.**Statistically significant difference across models at 5% level.
Table 5-7: Cross Model Comparison of Intermediate Outputs of Programs (average)
Curriculum AlignmentParental Participationa School Alignmenta

Teacher Administrator Parent Other
Success for All 4.43 4.57 3.62 3.50
School Dev. Program 4.33 4.67 4.17 4.08
More Effective Schools 5.00 5.00 5.00 4.25
Comparison Group 4.50 4.79 4.00 3.83
Total 4.48 4.72 4.02 3.83
F-statistic (ANOVA) 0.525 0.68 3.021* 0.69aBased on 1 to 5 scale with 5 indicating the strongest implementation. Based on classification B-- school principal has identified this as the current model in use. Overall sample size is 54.*Statistically significant difference across models at 5% level.**Statistically significant difference across models at 5% level.
Table 5-8: Cross Model Comparison of Inclusiveness in School Management Process (average)
Participation Level in SMPTa
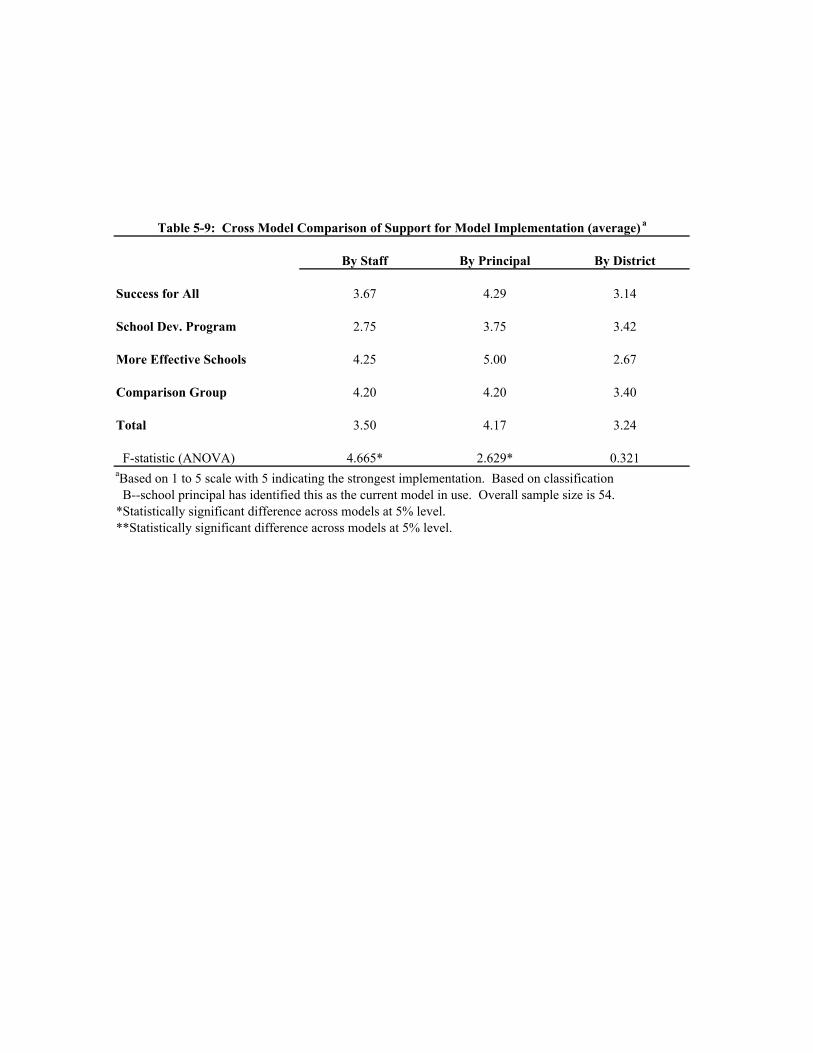
By Staff By Principal By District
Success for All 3.67 4.29 3.14
School Dev. Program 2.75 3.75 3.42
More Effective Schools 4.25 5.00 2.67
Comparison Group 4.20 4.20 3.40
Total 3.50 4.17 3.24
F-statistic (ANOVA) 4.665* 2.629* 0.321aBased on 1 to 5 scale with 5 indicating the strongest implementation. Based on classification B--school principal has identified this as the current model in use. Overall sample size is 54.*Statistically significant difference across models at 5% level.**Statistically significant difference across models at 5% level.
Table 5-9: Cross Model Comparison of Support for Model Implementation (average) a

School 1995 1997 1999 1995 1999 1995 1999 1995 1999 1995 19991 2.78 3.48 3.05 2.75 3.34 2.54 2.58 2.88 2.96 2.95 3.322 3.67 4.00 4.15 3.77 4.19 3.40 4.03 4.04 4.30 3.48 4.103 3.22 3.31 4.15 3.44 3.85 2.99 3.92 3.13 4.49 3.34 4.324 3.38 3.57 3.66 3.52 3.89 2.67 2.88 3.68 3.98 3.64 3.905 2.83 4.10 4.45 2.50 4.60 3.31 4.56 3.13 3.84 2.39 4.796 3.31 3.62 4.19 3.38 4.20 3.00 4.08 2.90 4.20 3.97 4.287 3.00 2.94 3.32 2.97 3.37 3.32 3.45 2.67 3.04 3.06 3.408 2.92 3.45 3.65 2.56 3.65 2.46 3.59 3.74 3.78 2.94 3.589 3.09 3.18 3.82 3.01 3.88 2.42 3.66 3.48 3.75 3.45 3.97
10 2.14 2.20 2.59 2.09 3.44 1.63 1.53 2.63 1.73 2.25 3.6511 3.10 2.35 3.48 2.83 3.57 3.25 3.38 3.21 3.27 3.12 3.7012 4.06 4.12 4.31 4.05 4.38 3.73 4.09 4.31 4.38 4.14 4.4213 4.26 3.54 4.05 4.27 4.37 4.08 3.94 4.47 3.53 4.21 4.3714 3.00 3.44 3.70 3.09 4.04 2.81 2.90 2.89 4.13 3.21 3.7115 2.89 2.96 3.25 2.95 3.34 3.12 2.96 2.80 2.88 2.68 3.81
Average 3.18 3.35 3.72 3.15 3.87 2.98 3.44 3.33 3.62 3.26 3.95SD 0.52 0.56 0.52 0.60 0.42 0.60 0.77 0.60 0.74 0.59 0.42Correlations between years (1995 and 1999):
Correlations across variablesOverall (1995) with: 0.96 0.81 0.84 0.90Overall (1999) with: 0.88 0.93 0.88 0.84
SPMT (1995) with: 0.74 0.74 0.91SPMT (1999) with: 0.72 0.68 0.88
MHT (1995) with: 0.54 0.57MHT (1999) with: 0.76 0.72
MHT (1995) with: 0.68MHT (1999) with: 0.56aOverall index is based on average of these four components. See Emmons (1999) for description. SPMT is school planning and management team, MHT is the mental health team, PT is the parent team, and CSP is the comprehensive school plan. Values in bold are imputed.bResults for overall index used in the summative evaluation in Chapter 7 (Tables 7-10 to 7-12).
Table 5-10: Summary Results for the Emmons Survey of SDP Schools in District 13a
Overallb SPMT MHT PT CSP
0.360.68 0.55 0.72 0.50

School 1996-97 1998-99 1996-97 1998-99 1996-97 1998-99 1996-97 1998-99 1996-97 1998-99 1996-97 1998-99 1996-97 1998-991 2.79 3.00 3.00 4.00 3.00 3.00 2.50 2.00 2.50 3.00 2.75 3.00 3.00 3.002 3.04 2.17 4.00 3.00 4.00 3.00 2.75 2.00 1.00 1.00 3.50 2.00 3.00 2.003 3.22 4.17 4.00 5.00 4.00 5.00 4.00 5.00 1.00 3.00 3.30 3.00 3.00 4.004 3.58 5.00 4.00 5.00 4.50 5.00 2.00 5.00 4.75 5.00 3.25 5.00 3.00 5.005 3.84 4.67 5.00 5.00 5.00 5.00 2.25 5.00 3.38 5.00 3.43 5.00 4.00 3.006 3.42 4.00 4.00 5.00 5.00 4.00 2.13 4.00 3.00 3.00 3.13 4.00 3.25 4.007 3.13 4.33 4.00 5.00 3.50 5.00 2.00 3.00 3.13 4.00 2.94 5.00 3.19 4.008 2.00 4.00 4.00 5.00 2.00 5.00 1.00 1.00 1.38 4.00 1.69 5.00 1.94 4.009 2.89 4.67 5.00 5.00 4.00 5.00 1.00 2.13 4.00 2.75 5.00 2.44 4.00
Average 3.10 4.00 4.11 4.67 3.89 4.44 2.18 3.38 2.47 3.56 2.97 4.11 2.98 3.67SD 0.53 0.89 0.60 0.71 0.96 0.88 0.91 1.87 1.24 1.24 0.55 1.17 0.56 0.87
Correlations between years (1996-97 and 1998-99):
Correlations across variablesOverall (1996-97) with: 0.33 0.93 0.41 0.59 0.88 0.88Overall (1998-99) with: 0.92 0.90 0.66 0.91 0.86 0.81
Assessment (1996-97) with: 0.46 -0.33 0.09 0.17 0.17Assessment (1998-99) with: 0.87 0.50 0.81 0.81 0.82
Staff Dev. (1996-97) with: 0.30 0.46 0.84 0.75Staff Dev. (1998-99) with: 0.48 0.78 0.80 0.71
Tutoring (1996-97) with: -0.26 0.64 0.47Tutoring (1998-99) with: 0.44 0.22 0.40
Early Learning (1996-97) with: 0.24 0.45Early Learning (1998-99) with: 0.91 0.66
Reading Roots (1996-97) with: 0.79Reading Roots (1998-99) with: 0.66aOverall index is based on average of these six components. bResults for overall index used in the summative evaluation in Chapter 7 (Tables 7-10 to 7-12).
Table 5-11: Summary Results for the SFA Survey of SFA Schools in District 19a
Assessment StaffOverallb and Regrouping Development Reading Tutoring Early Learning Reading Roots Reading Wings
0.34 0.39 0.07 0.46 0.69 -0.38 -0.27

Chapter 6: Evaluation Methodology
6.1. Introduction
To estimate the impact of each whole-school reform model on student performance, we
rely primarily on comparisons between students who attended schools that adopted whole-school
reform and students who attended the schools in the comparison group described in chapter 3.
Deriving valid estimates of model impacts from such comparisons poses a host of challenges.
The primary difficulty is created by the self-selected nature of the treatment groups. Schools that
decided to adopt whole-school reform, and the students that attend them, are different than
schools that choose not to adopt, and their students. Obtaining valid estimates of model impacts
will depend on our ability to statistically control for these differences.
Some of the recent and planned evaluations of whole-school reform models use
randomized assignment to help identify model impacts. In addition to the evaluations of the
School Development Program in Prince George’s County and in Chicago discussed in Chapter 2,
a study funded by the U.S. Department of Education will employ a random experimental design
to evaluate the effects of Success for All. The advantage of randomized assignment is that we
can expect no differences, on average, between treatment and comparison group schools at the
time of model adoption. As a result, any ensuing differences between the two groups can be
attributed to model adoption, and statistical adjustments are unnecessary. Despite this
considerable advantage, there are several reasons researchers cannot rely solely on randomized
assignment to evaluate whole-school reform models.
First, given the cost of experimental studies, they are likely to be too limited in both size
and number to provide sufficiently precise impact estimates for most of the whole-school reform
models in use. Because these models involve the whole school, researchers cannot randomly

assign individual students or teachers within a school. Randomization must occur at the school
level. As a practical matter, it is difficult and expensive to recruit a large number of schools to
participate in a randomized experiment. In finite samples, particularly if they are small,
differences between the treatment and comparison groups may arise due to sampling error,
making it difficult to draw conclusions from the impact estimates provided.
Perhaps more importantly, by explicitly linking implementation and evaluation, an
experimental design creates incentives for model developers to provide special support to ensure
successful implementation. This situation deviates significantly from what is likely to happen in
any large-scale implementation effort, in which the nature of implementation varies widely from
one school to the next. The important question for policy makers is not whether the adoption of
whole school reform models can lead to improved student performance in certain cases that
receive special attention, but whether policies that encourage or mandate whole-school reform in
a large number of schools can be expected to foster consistent improvement.
Because quasi-experimental approaches do not strive to control the implementation
environment, are less expensive, and allow for the examination of a large number of
implementation sites, they have an important role to play in obtaining a full understanding of the
impacts of whole-school reform models. In this chapter we consider the many challenges
involved in obtaining valid estimates of the impacts of whole-school reform from quasi-
experimental data. Many of these problems are inherent to the evaluation of whole-school
reform, while some are raised specifically by the nature of the data available for this study. Each
section of this chapter examines a specific set of methodological issues, and explains the
strategies we use to address these issues. The chapter is followed by a lengthy appendix, which
104

uses an informative subset of our data to compare the various strategies we have considered for
addressing potential self-selection biases.
6.2. Definition of the Treatment
Schools that decide to adopt a particular model of whole-school reform will vary in how
well they implement that model. Moreover, the principles and practices associated with many
models have diffused beyond the schools that have made an explicit decision to adopt whole-
school reform. As a result, it is possible that an adopting school represents a particular model less
truly than some non-adopting schools. This raises a question about how to define and measure
the intervention represented by a whole-school reform model.
Differences between schools that decide to adopt a whole-school reform model, and
schools that are able to implement that model’s prescriptions is analogous to the distinction
between individuals assigned to a treatment group and those who actually receive the treatment
in randomized experiments (Rouse, 1997). Consider the following model of whole-school
reform:
(1) 0 1 * 2jt jt jt jtM D W A u� �� � � �
where jtM is a rating on a scale from 0 to 5 of the extent to which school has implemented the
key components of a whole-school reform model during year t ,
j
*jtD is a dichotomous variable
indicating whether school j has made a decision to adopt the model during or prior to year t , and
is a vector of school characteristics that might influence a schools ability to implement the
model. If full implementation of model prescriptions was automatic, and diffusion of model
practices was absent, then � and � � ���In practice, however, school
characteristics do influence the extent to which a school can implement a model’s prescriptions,
and thus the parameters in Equation (1) are unknown.
jtW
1 5� 0 1 2 0A� � �
105
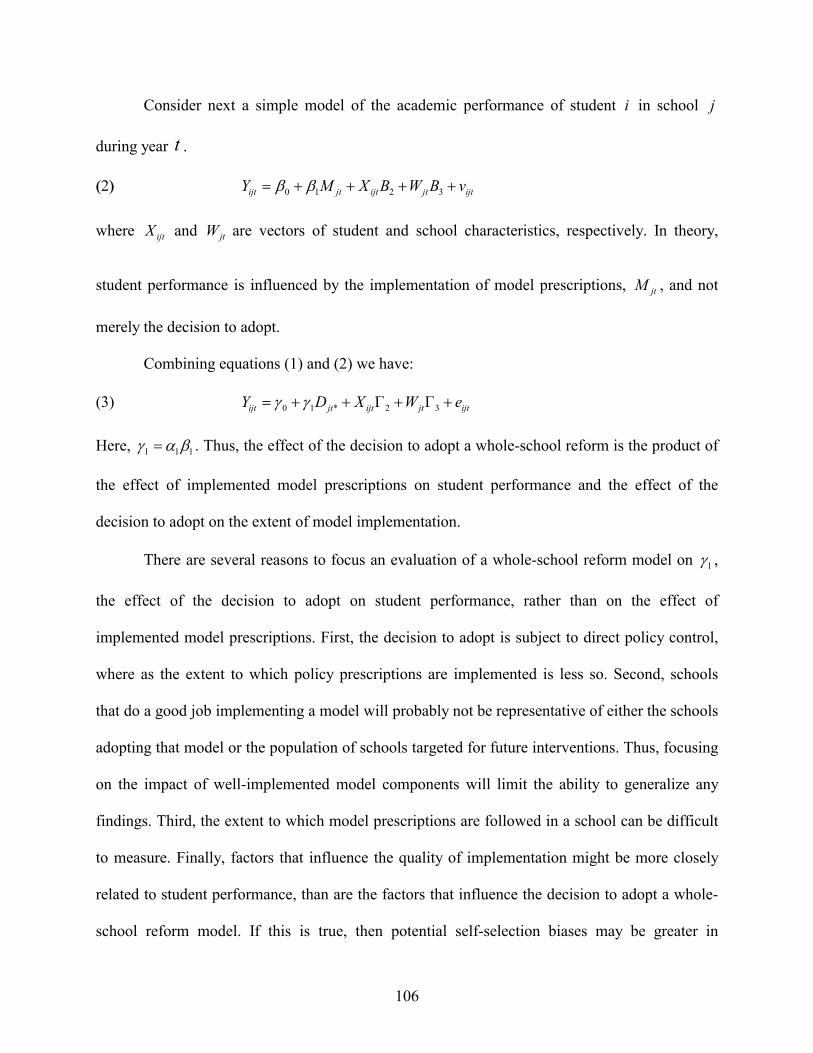
Consider next a simple model of the academic performance of student i in school
during year .���
j
t
���� � � 0 1 2 3ijt jt ijt jt ijtY M X B W B� �� � � � � v
where ijtX and �are vectors of student and school characteristics, respectively. In theory,
student performance is influenced by the implementation of model prescriptions,
jtW
jtM , and not
merely the decision to adopt.
Combining equations (1) and (2) we have:
(3) 0 1 * 2 3ijt jt ijt jt ijtY D X W� � � � � � �� � e
1Here, � � . Thus, the effect of the decision to adopt a whole-school reform is the product of
the effect of implemented model prescriptions on student performance and the effect of the
decision to adopt on the extent of model implementation.
1 1� �
There are several reasons to focus an evaluation of a whole-school reform model on � �
the effect of the decision to adopt on student performance, rather than on the effect of
implemented model prescriptions. First, the decision to adopt is subject to direct policy control,
where as the extent to which policy prescriptions are implemented is less so. Second, schools
that do a good job implementing a model will probably not be representative of either the schools
adopting that model or the population of schools targeted for future interventions. Thus, focusing
on the impact of well-implemented model components will limit the ability to generalize any
findings. Third, the extent to which model prescriptions are followed in a school can be difficult
to measure. Finally, factors that influence the quality of implementation might be more closely
related to student performance, than are the factors that influence the decision to adopt a whole-
school reform model. If this is true, then potential self-selection biases may be greater in
1
106
analyses that attempt to estimate the effect of model implementation in Equation (2), than in
analyses that attempt to estimate the effect of the decision to adopt in Equation (3).
Thus, the analyses in this study focus primarily on the impact of the decision to adopt a
whole-school reform model on student performance. The disadvantage of this focus is apparent if
the decision to adopt is found not to have a large impact on student performance. A researcher
cannot determine whether this finding arises because the model’s principles and prescriptions do
not reliably help to improve student performance, or because those principles and prescriptions
were not consistently realized in the treatment-group schools. To shed light on this issue, we also
ask whether the impact of the decision to adopt depends on the quality of implementation across
schools.
6.3. Accounting for Self-Selection
Our primary objective is to obtain estimates of � �in Equation (3) that can be interpreted
as the average impact of the decision to adopt the whole-school reform model, that is, as the
average difference between a student’s observed performance and what would have been
observed if the school attended by that student had not adopted whole-school reform. Ordinary
least squares or maximum likelihood estimates of Equation (3) will provide unbiased and
consistent estimates of � under the following conditions: the treatment indicator,
1
1 jtD , is
uncorrelated with the error term e ; the functional form of the student performance equation is
correct; and the right-hand side variables are measured without error. Each of these conditions is
potentially problematic and will be discussed in turn. In this section, we focus on potential
correlation between the treatment indicator and the error term in the student performance
equation. The other two problems are addressed in sections 6.4 and 6.5, respectively.
ijt
107
We are concerned about two potential sources of correlation between the treatment
variable and the error term in the student performance equation. First, if the unobserved school
factors that influence the decision to adopt a whole-school reform also independently influence
student performance, then jtD and ijte will be correlated. This type of self-selection bias is quite
plausible. For instance, a school with a strong leader as principal or with collegial staff relations
might be more likely to establish the consensus needed to make a decision to adopt. These
factors, which are difficult to measure, are also likely to have positive affects on student
performance independent of the decision to adopt. Alternatively, a school whose staff lacks
many of the skills needed to work with the student population in the school might have more to
gain from model adoption and thereby be more likely to adopt. These hypothetical examples
illustrate not only the plausibility that the decision to adopt and the error in the student
performance equation are correlated, but also that the correlation could be positive or negative.
Thus, it is not clear, a priori, whether the bias due to the fact that schools self-select is positive or
negative.
The choices made by parents about where to send their children to school creates a
second potential source of self-selection bias. To see this, consider a case in which schools are
chosen to adopt whole-school reform through random assignment. In this case, we would expect
the average characteristics of students in adopting schools, both observed and unobserved, to be
the same as those in other schools at the time of adoption (Bloom, Bos, and Lee 1999). This
implies that the treatment indicator and the error term in Equation (3) are uncorrelated.
Nonetheless, differences between the students who attend adopting schools and those who attend
other schools can emerge in ensuing years as students move into and out of the two sets of
schools. If parents’ decisions about where to send their children to school are responsive to the
108

decisions of schools to adopt whole-school reform, then we might expect unobserved differences
between the students in adopting and in non-adopting schools to emerge. If these unobserved
differences are related to student performance, then correlation between jtD and in Equation
(3) reemerges.
ijte
1
Given the limited information parents have about whole-school reform models and the
magnitude of other considerations that influence parents’ decisions about where to send their
children to school, the likelihood of this type of bias in evaluations of whole-school reform
models is low. Consequently, the discussions that follow largely ignore this issue, and focus on
addressing the self-selection of schools into the treatment group. As it turns out, the methods we
use are likely to address both types of selection bias, but more analysis of the potential problems
that arise from parents’ decisions would clearly be valuable.
6.3.1. The Value-Added Estimator
The first strategy for addressing self-selection that we consider is to use what is
commonly referred to as a value-added specification of the student performance equation.
(4) 0 1 2 ( 1) 3 4ijt jt j t ijt jt ijtY D Y X W�
� � � � � � � �� � � e
This equation differs from Equation (3) by including a lagged measure of student performance
on the right-hand side.
Including a lagged performance measure on the right-hand side reflects the cumulative
nature of the education process, and is intended to capture the effect of past learning on students’
educational performance. One might think that including this lagged performance measure
1 If one is concerned with the impact of a whole-school reform model on the aggregate level of student performance in a school, then one would not want to control for changes in student population caused by the school’s decision to adopt. If changes in student population are driving the increase in aggregate student performance, and adoption of the model is driving changes in student population, then controlling for these changes would lead to underestimates of program impacts. However, if one is concerned with estimating the average impact of a whole-school reform model on the performance of individual students, then changes in school populations are a potential source of bias.
109

addresses self-selection bias by absorbing the systematic components of the error term that might
be correlated with the treatment indicator. It does so, however, only if the unobserved factors that
influence the decision to adopt do not also influence the rate at which student performance
grows. This assumption is unlikely to hold for two reasons.
First, students with different motivation or ability levels are likely to show different rates
of performance growth. This possibility might be adequately addressed by allowing the effect of
the lagged performance measure to vary across students. For instance, Ferguson and Ladd (1996)
estimate a student performance equation that includes a lagged measure of student performance
plus an interaction between this measure and a dichotomous variable indicating whether or not
the student’s lagged performance measure is above the sample average. Using this specification
they find that students who perform well in one year gain more during the next year as well.
Even if we were able to eliminate the correlation between the decision to adopt and
unobserved student characteristics that influence student performance by allowing the impact of
the lagged performance measure to vary across students, performance growth is still likely to be
influenced by unobserved school factors that also influence the school’s decision to adopt whole-
school reform. This second source of correlation between jtD and in Equation (4) is more
difficult to address and implies that simple value-added models estimated by OLS or maximum
likelihood might not eliminate self-selection bias.
ijte
Another problem with relying value-added estimates is raised by the fact the in many
cases the year is a post-adoption year. Even if the value-added estimates of the impacts of
whole-school reform are not biased by self-selection, they only reflect the impacts of adoption on
student performance gains made during year . In some cases, treatment impacts might be
1t �
t
110
realized prior to year t . In an analysis of the Tennessee STAR experiment, for example, Krueger
(1997) finds that the positive effect of being enrolled in a small class occurs primarily in the first
year (and then persists). These impacts would be missed by estimates of value-added equations
that use data from the second, third or fourth years of implementation. We address this issue by
examining the impact of whole-school reform during as many of the years following the decision
to adopt as our data allow.
�
6.3.2. Difference-in-Differences
Repeated measures for individual students both prior to and following model adoption
can help to address self-selection bias. One way to exploit repeated measures of individual
students is to construct a difference-in-differences estimator. Let Y and Y be the average
performance of students attending schools that have adopted a whole-school reform model
during two consecutive years following adoption, let Y and Y be two consecutive
measures of performance prior to model adoption, and let Y , , and Y be the
average performance of comparison group students during the same years. The difference-in-
differences estimator is
mt
ctY�
1m
t�
*c
t
*m
t
c
*1tm
1 Yt * 1tc
�
1 1* * 1 * * 11 {( ) ( )} {( ) ( )}tt tt t t tm m m m c c c c
tY Y Y Y Y Y Y Y� �� �
� � � � � � ��
More sophisticated methods adjust the comparison used to construct the difference-in-
differences estimator for changes in observable factors that are unaffected by model adoption,
but which might independently affect student performance. One way to implement this approach
is by differencing Equation (4):
(5) * 1 * 2 ( 1) ( * 1) * 3
* 4 *
( ) ( ) ( )( ) ( )
ijt ijt jt jt j t j t ijt ijt
jt jt ijt ijt
Y Y D D Y Y X XW W e e
� �
� � � � � � � �
� � � �
� � �
111
Here t is a post-adoption year, t is the year prior and is also a post-adoption year, is a pre-
adoption year, and is the year prior to t . The maximum likelihood estimate of � in this
equation tells us the difference between the annual performance gains observed for those
attending whole-school reform schools and the performance gains observed for the comparison
group students controlling for the annual performance gains observed prior to the decision to
adopt whole-school reform, and for any changes in observed student or school factors that are
not influenced by whole-school reform. This estimate will be an unbiased estimate of the impact
of whole-school reform on student performance only if the right-hand side variables are
measured without error; the functional form is correct; and ( is uncorrelated with
treatment status.
1� *t
( * 1)t � * 1
*ijt ijte e� )
)
)
)
)
The assumption that in Equation (5) is uncorrelated with treatment status is
more plausible than the corresponding assumption that in Equation (4) is uncorrelated with
treatment status. This is true because the effects of unobserved school characteristics on a
school’s decision to adopt a whole-school reform model, which are buried in e , are likely to be
more or less constant over time. Assuming a student has not changed schools, any time-invariant
effects on student performance are differenced out of in Equation (5). What are left in
are changes in the effects of unobserved school characteristics on student
performance. It is plausible to argue that these changes either are unrelated to the decision to
adopt a whole-school reform model, or are themselves part of the changes caused by the decision
to adopt whole-school reform.
*( ijt ijte e�
ijte
( ijte �
ijt
*ijte
*( ijt ijte e�
The validity of the assumption that in Equation (5) is uncorrelated with
treatment status depends upon the growth trajectories that we expect students to follow as they
*( ijt ijte e�
112

move through elementary school. If annual growth rates of individual students tend to be
constant as they move through elementary school, even if those rates differ across students, then
there is little reason to think ( is correlated with treatment status. If, however, growth
tends to either accelerate or decelerate as students move through schools, and the rate of
acceleration varies systematically either across students or across schools, then the assumption
may not hold. Since little is known about student growth trajectories, it is difficult to assess the
plausibility of assuming a random distribution of acceleration (or deceleration) in growth rates
across students.
*ijt ijte e� )
6.3.3. Instrumental Variables
Difference-in-differences can provide defensible estimates of the impacts of whole-
school reform. However, implementing this estimator requires at least two measures of student
performance prior to the adoption of a whole-school reform model. Observers of whole-school
reform argue that it may take several years before a whole-school reform model can be fully
implemented and for improvements in student performance to be realized. Thus, the most
interesting student cohorts to examine in an evaluation of whole-school reform are those that are
in the school several years after initiation of the reform. In the case like ours, where we are
examining elementary schools, two years of student test scores prior to model adoption are
unlikely to be available for these “most interesting” cohorts. Consequently, an alternative
approach to addressing self-selection bias is needed.
Instrumental variables (IV) estimators seek to overcome the self-selection problem by
bringing in information about the selection process. This approach requires a set of variables that
meets two conditions. The first condition is that the variables must help to predict whether or not
school j attended by student has adopted a whole-school reform model. The second condition i
113

is that the variables must be uncorrelated with the unobserved factors that influence student
performance.
In our search for appropriate instruments, we have drawn on the expectation that a school
will be more likely to adopt a given model if other schools in the district have adopted the model.
We expect this for several reasons. The presence of other adopting schools in the district makes
it more likely that a school will have information on a model, thereby reducing search costs;
provides opportunities for jointly purchased training, potentially reducing implementation costs;
and might enhance the perceived professional advantages of adoption. Whether the presence of
other adopting schools in the district is uncorrelated with unobserved influences on student
performance depends on the reasons why those other schools in the district adopted.
Consider the following set of equations:
(4) 0 1 2 ( 1) 3 4ijt jt j t ijt jt ijtY D Y X W�
� � � � � � � �� � � e
(6.J) 1 2( , ,..., , , )jt jt jt Njt kt jtD f Z Z Z D v�
(6.K) 1 2( , ,..., , , )kt kt kt Nkt jt ktD g Z Z Z D v� ;cov[ , ] 0;cov[ , ] 0;jt jt jt ktj k e v v v� � �
Equations (6.J) and (6.K) predict the decision of j and , respectively, to adopt a particular
whole-school reform model, where
k
j and k are different schools from the same district. ntjZ
( 1,2,... )n � N
)
)
are measurable school-level predictors and represents the influence of
unobserved school characteristics on the decision to adopt. Assume that the influence of
unobserved variables on the school’s decision to adopt is correlated with the influence of
unobserved variables on student performance . This assumption implies that
jtv
( jtv
( ijte jtD is
114

correlated with the unobserved effects in Equation (4), which causes maximum likelihood
estimates of equation (4) to be biased and inconsistent.
Because schools in the same district may draw their students from similar populations
and use a similar, district-level hiring process, we might suspect that unobserved characteristics
of students and teachers in schools j and are correlated, that is, . If the
unobserved variables that influence school k ’s decision to adopt also influence student
performance and are shared with school
k cov[ , ] 0jt ktv v �
j , then school ’s propensity to adopt a whole-school
reform model will be correlated with student performance in school j, that is i.e., co .
This implies that the number of schools in the district that have adopted, may not be an
exogenous source of variation in a school’s decision to adopt.
k
v[ ,jtv e ] 0ijt �
If, however, the decision of school k is driven primarily by observed characteristics of the
school, ktZ , then these observed characteristics may provide suitable instruments. By
supposition, ktZ are determinants of school ’s propensity to adopt, and if school ’s decision
to adopt influences school
k k
j ’s decision, then kZ will also provide good predictors of school j ’s
decision to adopt. It is also unlikely that observed characteristics of school k have any direct
influence on student performance in school j . Nonetheless, the observed variables in school k ,
kZ , might be correlated with the unobserved characteristics of school k that influence both the
decision to adopt and student performance. If so, kZ might be correlated with the error term in
the student performance equation, Equation (1). Fortunately, it is possible to test for such
correlation using over-identification tests.2
2 Over-identification tests require that the number of instruments used is greater than the number of right-hand side variables in the student performance equation treated as endogenous. A common over-identification test involves regressing the residual from the two-stage least squares estimation of the student performance equation on the
115

Two things are worth noting about this instrumental-variables strategy. First, the
instruments suggested here isolate variation in a school’s decision to adopt a whole-school
reform model that is unrelated to unobserved school-level characteristics that influence student
performance. Nonetheless, correlation between treatment status and unobserved student
characteristics that influence student performance may arise if parental choices about where to
live, and hence where to send their children to school, are influenced by whole-school reform
adoption decisions. This type of selection problem is different because it involves behavioral
responses to the whole-school reform adoption decision, not the decision itself. If, for example,
parents of children with unobserved characteristics that boost performance move from
elementary school districts without whole-school reform to districts with whole-school reform,
estimates of the impact of whole-school reform might be biased upward. The IV estimators
based on the instruments discussed here will correct for this selection problem, too, if it is a one-
time, school-level phenomenon, that is, if it can be characterized as part of an unobserved
school-level fixed effect. These estimators will not correct for this problem, however, if it
influences test-score trends over time in individual schools. We have no reason to believe that
parental decisions about where to live alter test-score time trend, but we also cannot rule out this
possibility or correct for it with any instruments available for our study.
Second, although instrumental-variable estimators can provide consistent estimates of
model impacts, these estimates may still be biased in finite samples. The magnitude of bias in
finite samples depends on the sample size, the number of instruments, and the amount of
variation in treatment status predicted or explained by the instruments. Bound, Jaeger, and Baker
exogenous variables in that equation and the instruments. The R-square from this regression multiplied by the size of the sample used is a chi-square statistic with degrees of freedom equal to the number of instruments minus the number of right-hand side variables treated as endogenous. If this statistic exceeds a specified critical value, then we reject the null-hypotheses that the instruments are exogenous, which suggests the instruments used are inappropriate.
116

(1995) demonstrate that such bias can be quite serious when the instruments are weak predictors
of treatment status. Thus, IV estimates of model impacts in finite samples tend to be sensitive to
the choice of instruments, and if instruments are poorly correlated with treatment status,
particular IV estimates can be quite misleading.
6.3.4. Our Strategy
Both the difference-in-differences and the IV strategy can help to address potential self-
selection bias. Of the two approaches, the difference-in-difference strategy is preferable. The
difference-in-differences estimator addresses self-selection biases due both to school decisions
and to parental decisions, while the IV estimator considered here only addresses the former. In
addition, the difference-in-differences estimator does not suffer from small-sample bias.
However, the data available for estimating model impacts is insufficient to implement the
difference-in-differences estimator for the majority of students in our sample. Thus, the estimates
we present in the next chapter rely on the value-added and instrumental- variable estimators.
There is, however, a subsample of students for whom we do have sufficient data to
implement the difference-in-differences estimator. In the appendix to this chapter we use this
subsample of students to implement each of the estimation strategies discussed above. This
exercise demonstrates that if careful attention is paid to the choice of instruments, then our
instrumental-variable strategy can provide estimates of model impacts similar to those provided
by the difference-in-differences estimator. This provides increased confidence in the
instrumental-variable estimates presented in the next chapter.
6.4. Model Specification
Successful estimation of the impact of whole-school reform depends on proper
specification of the student performance equation. As written above, Equation (4) assumes that
117
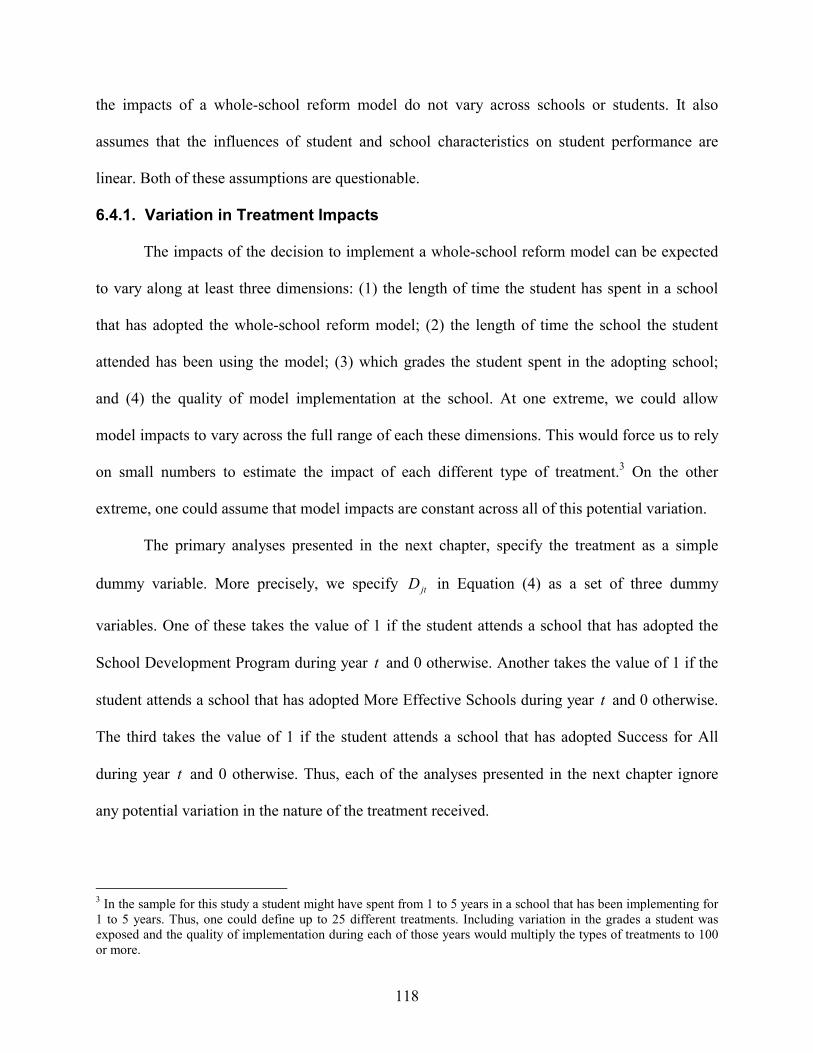
the impacts of a whole-school reform model do not vary across schools or students. It also
assumes that the influences of student and school characteristics on student performance are
linear. Both of these assumptions are questionable.
6.4.1. Variation in Treatment Impacts
The impacts of the decision to implement a whole-school reform model can be expected
to vary along at least three dimensions: (1) the length of time the student has spent in a school
that has adopted the whole-school reform model; (2) the length of time the school the student
attended has been using the model; (3) which grades the student spent in the adopting school;
and (4) the quality of model implementation at the school. At one extreme, we could allow
model impacts to vary across the full range of each these dimensions. This would force us to rely
on small numbers to estimate the impact of each different type of treatment.3 On the other
extreme, one could assume that model impacts are constant across all of this potential variation.
The primary analyses presented in the next chapter, specify the treatment as a simple
dummy variable. More precisely, we specify jtD in Equation (4) as a set of three dummy
variables. One of these takes the value of 1 if the student attends a school that has adopted the
School Development Program during year and 0 otherwise. Another takes the value of 1 if the
student attends a school that has adopted More Effective Schools during year t and 0 otherwise.
The third takes the value of 1 if the student attends a school that has adopted Success for All
during year and 0 otherwise. Thus, each of the analyses presented in the next chapter ignore
any potential variation in the nature of the treatment received.
t
t
3 In the sample for this study a student might have spent from 1 to 5 years in a school that has been implementing for 1 to 5 years. Thus, one could define up to 25 different treatments. Including variation in the grades a student was exposed and the quality of implementation during each of those years would multiply the types of treatments to 100 or more.
118

Nevertheless, the analyses taken together do provide information about how whole-
school reform model impacts might vary with the length of time a student is exposed, with the
length of time the school has been implementing and with the grades during which a student has
been exposed. This is true because each of the analyses conducted looks at a different cohort of
students, and each cohort has been exposed to a different variation of the treatment. More
particularly, the analyses in this chapter provide separate estimates of each whole-school reform
model on each of the following:
�� the third, fourth and fifth grade performance of students who were in third grade in 1994-
95; �� the third, fourth and fifth grade performance of students who were in third grade in 1996-
97; and
�� the third grade performance of students who were in third grade in 1998-99.
Each of these analyses tells us something different about the impacts of whole-school
reform. Put differently, each analysis tells us something about a different variation of the
treatment.
�� Analysis of the fifth grade test scores of students in third grade in 1994-95 indicates the
impact of each model on students who have been exposed to whole-school reform from one to three years in the later elementary school grades during the early stages of model implementation.
�� Analysis of the fifth grade tests scores of students in third grade in 1996-97 tells us the
impact of each model on students in later elementary school grades three to five years after the decision to adopt.
�� Analysis of the third grade test scores of students in third grade in 1996-97 indicates the
impact of the model on the performance of students who attended an school in the early stages of whole-school reform implementation during their early elementary school years.
119
�� Analysis of the 1998-99 test scores of students in third grade in 1998-99 will indicate the impact of the model on the performance of students who attended a school in the later stages of whole-school reform implementation during their early elementary school years.
In order to allow for variation in treatment impacts within the last of these analyses we also
estimated an alternative specification of the student performance equation that allows model
impacts to vary with the length of time a student has been exposed to the model.
6.4.2. Specification of Control Variables
In choosing a set of control variables to include in the student performance equation,
variables that are potential determinants of student performance and that might themselves be
influenced by the adoption of whole-school reform create a dilemma. Consider a variable that
has a positive influence on student performance. If adoption of whole-school reform increases
that variable, and this in turn leads to an improvement in student performance, then that
improvement should be attributed to the decision to adopt whole-school reform. Thus, including
this variable in the student performance equation can lead estimation procedures to “over-adjust”
comparisons of the treatment and comparison group, and thus introduce bias into the estimates of
model impacts. However, the level of this variable is also influenced by other factors that have
nothing to do with whole-school reform. Thus, failure to include this variable in the student
performance equation creates the risk of omitting an alternative explanation of performance
differences between the treatment and comparison groups, and thus creating bias of a different
kind. Deciding whether or not to include such a variable requires judgment about which horn of
the dilemma represents a greater risk of introducing bias. This must be decided on a case-by-case
basis.
The student-level variables that we have chosen to include in the analyses are all dummy
variables and include indicators of gender, ethnicity, eligibility for free lunch in 1999, whether or
120

not the student’s home language is other than English, and whether or not the student is in a
lower grade than expected. Gender, ethnicity, free-lunch eligibility and home language are
included as proxies for the quality of learning experiences outside of school and potential social
and cultural influences on student motivation. It is clear that these variables are not influenced by
the adoption of whole-school reform. Whether or not student is in a grade lower than expected,
however, is the result of choices made by parents, students and/or school officials. Such choices
could be influenced by whole-school reform efforts. Nevertheless, it is important to include this
variable in the analysis. This importance can be illustrated by the following hypothetical case.
Two students, both of whom are in fourth grade during 1997-1998, each experience a gain in
their NCE reading score of 5 points between 1998 and 1999. One of the students, however, was
retained in fourth grade for the 1998-99 school year. His 1999 test score reflects his performance
on the fourth grade test and is normed against other fourth graders. A 5 point test score gain for
this student is not as large an improvement as a 5 point gain for the student who moved onto fifth
grade in 1998-99, who took the fifth grade version of the test and whose score was normed
against fifth graders.4
Among the school-level variables used in the estimations are the log of the number of
students enrolled in the school, the percentage of students in the school who are eligible for free
lunch, the percentage of students who are Hispanic, and the percentage of students who have
limited English proficiency (LEP). These student-body characteristics are intended to capture the
potential influence of peers on student academic performance, via social pressure, role models,
or influence on the allocation of resources within the school.
4 An alternative is to drop these students from the estimation altogether. Since, the proportion of students in a grade lower than expected is small, this makes little difference for estimates of model impacts.
121
In addition to these school level variables, the models that we estimate include average
class-size, the percentage of teachers with fewer than two years experience, and the percentage
of teachers who are certified to teach in their field of assignment. These controls are intended as
measures of the quantity and quality of teacher resources available in the student’s school.
Clearly, the decisions of school administrators about what teachers to select for their school, and
of teachers about whether to transfer into or out of a particular school, can be influenced by a
school’s decision to adopt a whole-school reform model. Thus, we need to carefully consider the
interpretation of models that include these variables compared to those that do not.
When measures of teacher resources are not included in the student performance
equation, the resulting estimates of treatment impacts indicates the effect of whole-school reform
on student performance in the adopting school. It is important to note that if positive impacts on
students in adopting schools are achieved by enticing higher-quality teachers to transfer from
other schools, then improvements at adopting schools might come at the expense of declines at
other schools. Estimates from regressions that include measures of teacher resources indicate
whether whole-school reform improves the efficiency of adopting schools. If improved student
performance is achieved by increasing the number of highly qualified teachers, this should be
interpreted as an increase in school resources, not an increase in the efficiency with which
resources are used. An increase in efficiency is an unequivocally positive outcome because it
allows for improved student outcomes at adopting schools without undermining performance at
other schools.5
Finally an indicator of whether or not the school attended by the student is a registration-
review school is included in the estimations. This variable is meant to control for other
122

improvement efforts that might have coincided with the decision to adopt whole-school reform
and which thereby provide alternative possible explanations for any observed improvement in
school efficiency.
6.4.3. Sample Attrition
The analyses in this study focus on the impacts of whole-school reform on three cohorts
of students—those in third grade in 1994-95, those in third grade in 1996-97, and those in third
grade in 1998-99. As indicated in Chapter 4, however, we do not observe the performance of
every student in these three cohorts. A substantial proportion of students is missing test-score
data. Across the three cohorts, approximately 34.2 percent of students are missing at least one
reading test score, and 27.1 percent are missing at least one math test score. The percentage of
students missing the test scores needed for a specific analysis is greater or less than these figures,
depending on the cohort and school years examined. As demonstrated in Chapter 4, the students
with missing test scores are not a random selection of all students.
Whether or not missing test scores bias estimates of whole-school reform model impacts
depends on the answers to two questions. The first is whether or not a student’s enrollment in a
school that has adopted a whole-school reform model is independently related to that student’s
having a test score reported. Table 4-5 shows that this relationship is not strong. Nonetheless,
there are cases in which enrollment in a whole-school reform model has a significant influence
on the probability of observing a complete set of test scores, even after controlling for other
student characteristics. The second question is whether or not students with missing test scores
would, if they were tested, tend to show lower (or higher) levels of performance, or different
5 As a practical matter the decision to include measures of teacher characteristics in the student performance equation has little effect on the estimates of whole-school reform impacts. Thus, in chapter 7, we only present results from estimations that include controls for teacher characteristics.
123

rates of performance growth, then otherwise similar students for whom we do observe test
scores. This cannot be observed directly, but is certainly possible.
For some of our analyses, this missing test score issue is potentially compounded by the
fact that students in one of our sample schools in third grade might have moved to a school
outside our sample during or prior to the year we are examining. For example, of the 7,975
students in the cohort of students in third grade in 1994-95 who have the two consecutive years
of reading test scores required to estimate a value-added student performance equation, 6,205
(78.5 percent) have moved to a school not included in the treatment or comparison group by fifth
grade.
Although, we have the ability to follow these students into schools outside our sample,
including these students in our analysis creates two problems. First, students who move out of
our sample schools almost always move into a school that has not adopted a whole-school
reform model. Thus, the set of students attending a school that has not adopted whole-school
reform during a given year includes students who have moved, while the set of students
attending adopting schools includes only those who have not moved. Since, movers are likely to
differ from non-movers in important ways, this situation creates a potential source of bias.
Second, the schools into which these students have moved, might be substantially different in
terms of student-body characteristics, resources and efficiency than the schools that have adopted
whole-school reform. Comparison of student performance in whole-school reform schools with
the performance of students in markedly different schools can produce misleading estimates of
the impacts of whole-school reform. For these reasons, our primary analyses are conducted using
only those students who have remained in one of our treatment and/or comparison group
124

schools.6 If student mobility rates are different in schools that have adopted whole-school reform
than in comparison-group schools, and students who change schools show different levels of
performance (or rates of performance growth), controlling for other differences, then dropping
movers from our sample could create an additional source of bias.
In sum, excluding students with missing test scores or student who have moved to
schools outside our sample may introduce selectivity bias into estimates of model impacts.7 In
order to test and control for this potential source of bias, we employ a Heckman two-step
selection correction procedure (Heckman 1979). This procedure involves using probit analysis to
estimate the effect of exogenous student characteristics on the probability of having the test
scores needed for a particular analysis and remaining in one of our sample schools. The
estimated probabilities are then used to compute what is known as an inverse Mills ratio or
Heckman selection correction term. Including this term in the student performance equation
effectively controls for the additional impact that a treatment variable might have on test scores
via its influence on whether or not a test score is observed. The empirical models presented in
Chapter 7 are estimated with and without this selectivity correction.
To further check the sensitivity of our estimates to the exclusion of movers, we also
conduct an alternative set of analyses in which movers are included. Two student-level control
variables, in addition to those describes above, are included in these alternative regressions. The
first is a dichotomous variable indicating whether or not the student has changed schools
sometime between second and fifth grade. This variable is intended to control for any differences
between movers and non-movers. The second is a dichotomous variable indicating whether or
6 As handful of students in each cohort moved from one sample school to another school that is also in the sample. These students are also included in our primary analyses. 7 This should not be confused with the self-selection bias discussed above, which is a separate issue.
125
not the student has moved during the current year. Including this variable controls for the effects
on student performance of disruptions associated with changing schools.
6.4.4. Standard Errors
Two features of the data and models used in our analyses complicate the estimation of
standard errors. First, inclusion of a Heckman selection term means that the performance
equations estimated have heteroscedastic disturbance terms (Green 1997). Second, the data have
a nested structure with students nested within schools, which implies that correlation among the
disturbances for students from the same school is a distinct possibility. For these reasons, we
calculate robust standard errors using STATA’s cluster option, which uses a generalization of the
Huber-White procedure (StataCorp 2001).
6.5. Measurement Error
One concern with any production function analysis is that standardized tests are imperfect
measures of student performance, even in the domains they are designed to assess. Thus, the
lagged measures of student performance in Equations (4) and (5) are measured with error.
Although we expect that this error is randomly distributed across students, it nonetheless can
result in biased estimates of all the coefficients in these equations (Green, 1997), including those
intended to capture the impact of whole-school reform. One strategy for addressing bias due to
measurement error makes use of an instrumental variable for the lagged performance measure. In
the value-added model, Equation (4), a test-score from a year prior to the year of the lagged test-
score can provide a suitable instrument. In the difference-in-differences model, Equation (5), the
test score from year t Y , can provide an appropriate instrument for ( ) . If
these instruments are uncorrelated with the error around the lagged measure of student
performance (and since this error is randomly distributed they should be), and are good
*( * 1)1, ij t �
� ( 1) ( * 1)ij t ij tY Y� �
�
126

predictors of the lagged performance measure, then these alternative estimations will reduce the
amount of bias due to measurement error.
127
Appendix: A Comparison of Alternative Estimation Strategies
In this chapter, we have discussed three strategies for estimating the impact of whole-
school reform on student performance (a value-added approach, difference-in-differences, and
instrumental variables). We have argued that the difference-in-differences estimator provides the
most defensible estimates of model impacts. Unfortunately, this estimator requires two measures
of performance prior to a student’s exposure to whole-school reform, which is unavailable for
most of the students in the three cohorts examined here.
There is, however, a subsample of students for whom the data needed to implement the
difference-in-differences estimator is available. In this appendix, we implement each of the three
estimators we have discussed using this subsample of students. Assuming that the difference-in-
differences estimates are unbiased, the results from this empirical exercise suggest that the value-
added model may provide biased estimates of model impacts and that the use of appropriate
instruments can help remove part or all of this bias.
A.1. Data
The subsample used for this exercise includes students from the cohort in third grade in
1994-95 who attended a school that adopted whole-school reform in either 1995-96 or 1996-97.
These students each have at least two years of pre-exposure test scores—namely their second-
and third-grade test scores. Schools that adopted whole-school reform in 1995-96 or 1996-97
include 10 schools that adopted More Effective Schools (MES), 7 that adopted Success for All
(SFA), and 3 that adopted the School Development Program (SDP). Because the number of
schools adopting SDP is so small, the impact estimates are relatively imprecise and unstable.
Thus, only students from MES and SFA adopters are included in these analyses.
128

In addition to these treatment-group students, students who attended third grade during
1994-95 at a subset of the comparison group schools are included in the sample. The subset of
comparison group schools includes those that were selected from the sampling frames that
showed aggregate levels of performance similar to the treatment group schools in the three years
preceding the 1995-96 school year or the three years preceding the 1996-97 school year.8 This
subset includes 21 of the comparison group schools.
The cohort of students in third grade during the 1994-95 school year in one of these 17
treatment group or 21 comparison group schools totals 4,173. However, the samples of students
used for these analyses were limited in two ways. First, the most data-intensive estimator
examined in this section requires a test score for each year from 1993-94 through 1996-97 (that
is, from second through fifth grade). To avoid confounding differences in impact estimates due
to the choice of estimator with those due to sample differences, any student who was missing a
test score in any of these years was dropped from the sample. Second, the analyses here examine
the performance of students during the 1996-97 school year. Many of the students who attended
one of our sample schools in 1994-95 no longer did so in 1996-97. The students who were no
longer in one of the treatment or comparison group schools during 1996-97 were dropped. The
resulting sample used for the analyses of reading scores includes 2,070 students. In order to
correct for potential biases that this sample selection might create, a Heckman selection
correction term based on the predicted probability of being in the sample was calculated and
included in the estimation procedures used here
Summary statistics for the outcome measures, treatment variables, and covariates used to
specify the regression equations are provided in Table 6-1. The outcome measure is the
individual student’s normal curve equivalent (NCE) score on the citywide test of reading. The
8 See the description of the procedure used to select the comparison group schools in Chapter 3.
129

New York City Board of Education changed reading tests in 1995-96 from the Degrees of
Reading Power to the reading component of the California Achievement Test-Series 5. Because
the NCE is a standardized test score, centered on 50, performance measures from these two
different tests have the same interpretation and are commensurable. Nonetheless, we might
expect a change in tests to affect test performance. The estimation procedures used here
implicitly control for this change by including comparison group students who took the same
tests in the same years as the treatment group students.
The validity of the estimators considered here requires correct specification of the
functional form of the student performance equation. With two exceptions, each of the covariates
listed in Table 6-1 is entered into the regression equation linearly. As indicated in Table 1,
enrollment is entered into the regression equation in log form, which was found to fit the data
better. In addition, residual plots suggested that the lagged measure of student performance has a
non-linear effect on the present year’s student performance. In particular, students who score
above average in the lagged year tend to show greater gains in the current year. To allow for this
non-linearity, students with NCE scores above 50 in the lagged year were identified and the
resulting indicator variable (=1 if NCE>50, =0 otherwise) is interacted with the lagged score. An
extensive set of additional quadratic and interaction terms were entered into the equation both
singly and in various combinations. In most cases these non-linear terms had statistically
insignificant effects, and in the few cases where significant effects were found, these had
insubstantial influence on the estimated impacts of the whole-school reform models. As a result,
these variables were not included in the final estimations.
The last variable in Table 6-1 requires comment. As discussed further below, several
characteristics of other elementary schools in the community school district, excluding the
130

school in which the student is enrolled, were tested as potential instruments for the decision to
adopt a whole-school reform model. In the course of testing the appropriateness of these
variables as instruments, it was discovered that the average percent of students eligible for free
lunch in the district had a significant, independent effect on student reading performance. One
plausible explanation is that this measure is capturing a degree of concentrated poverty in the
school that is not adequately captured by the school-level free lunch variable. In any case, the
average percentage of students eligible for free lunch across other schools in the district is
included as an additional school-level variable in the student performance equations.
A.2. Estimation and Results
The results from each estimation procedure are presented in Table 6-2. The estimated
impacts of MES and SFA are for students in the later elementary grades in schools that have
been implementing whole-school reform for one or two years. The estimated coefficients on the
MES and SFA variables indicate the average impact of the decision to adopt these models on
student gains during the 1996-97 school year. These estimates miss any model impacts realized
during the 1995-96 school year. In addition, whole-school reform developers and many
independent observers agree that whole-school reform can take several years to begin showing
positive impacts on student performance. Finally, these are estimates of the decision to adopt a
model, and do not control for quality of implementation. For these reasons, conclusions about the
efficacy of More Effective Schools and Success for All should not be drawn from the results
presented here. Nevertheless, these analyses do serve to illustrate the methodological issues
discussed in this chapter.
Consider first the value-added estimates presented in Column (1). This model was
estimated using ordinary least squares and the Huber-White procedure for calculating robust
131
standard errors. Although we are primarily concerned with the estimated effects of MES and
SFA, several other results in column one deserve comment. The estimated coefficient on the
lagged measure of student performance is highly significant. This estimate indicates the rate at
which past learning decays over the time. The significant, positive coefficient on the lagged
dependent variable for higher-scoring students indicates that students who score well in one year
retain more and/or gain more during the next year than do lower performing students. Among the
other student-level covariates the variable indicating whether or not a student repeated a grade
has the largest impact. If we expect that repeaters are slower learners, the positive coefficient on
this variable might seem perverse. For most students who have been retained, however, the
lagged measure of performance is normed against the original cohort, while the current year
performance measure is normed against a younger cohort. Thus, we expect a positive coefficient
on this variable. The Heckman selection correction is also significant confirming the need to
control for potential sample selection biases created by using only students with no missing test
scores who remained in one of our sample schools.
Among the school-level variables, the percentage of students classified as LEP and the
percentage students who are Hispanic both have significant impacts in opposing directions.
Students in schools currently under registration review show smaller performance gains.
Whether this is due to negative effects of the registration review intervention, or to the effects of
unobserved characteristics of schools under registration review is not clear. Finally, the negative
effect of the percentage of teachers who are certified and positive effect of class-size are
perverse. These last two results, which are robust across several specifications, are difficult to
explain.
132

The decision to adopt MES shows a small, statistically insignificant, positive impact on
student performance, while the decision to adopt SFA shows a larger, statistically significant,
negative impact. The later result suggests that initial disruptions created by efforts to implement
SFA, and possible diversions of school resources, have a negative effect on students in the later
elementary school grades. However, because unobserved school factors that influence student
performance gains are also expected to influence the decision to adopt whole-school reform, we
suspect that the estimates in column one are biased.
The second column of Table 6-2 presents difference-in-differences estimates. These
estimates were obtained by subtracting the 1994-95 values of each of the variables in Table 1
from the 1996-97 values and using the differenced values to estimate the regression equation. In
the case of the lagged dependent variable, the 1993-94 value is subtracted from the 1995-96
value. Differencing eliminates any variables that are constant over time, and thus many of the
student-level variables, including the Heckman selection term, drop out of the model in column
two. In addition, much of the variation in school-level covariates is eliminated, and as a result,
these variables have little influence in the model. The coefficient on the lagged dependent
variable indicates the relationship between 1994-1996 (2nd grade to 4th grade) gains and 1995-97
(3rd grade to 5th grade) gains. Because the differences in gains realized from these overlapping
periods are determined by differences between the 1994-1995 (3rd grade) gain and the 1996-97
(5th grade) gain, this coefficient is determined primarily by the relationship between student
gains prior to model adoption and student gains following model adoption. The highly significant
coefficient here indicates that pre-adoption gains are positive predictors of post-adoption gains.
The negative coefficient on the interaction term immediately below the lagged performance
measure indicates that students who scored below 50 in the 1994, but above 50 in 1996 showed
133
smaller post-adoption gains than otherwise similar students. This might be explained by
regression to the within-student mean. Finally, the variable indicating whether or not the student
was retained shows even stronger positive impacts than in Column (1). Because students retained
are likely to have shown negative gains during the pre-test period (that is why they were
retained), but positive gains in the year they are retained (when they are compared to younger
students), this result is expected.
The difference-in-differences estimates in Column (2) indicate that the decision to adopt
More Effective Schools had a negative, but still small and statistically insignificant impact on
student performance. The decision to adopt Success for All shows a negative impact that is
similar, although slightly larger, than the one found using the value-added model. The
difference-in-differences estimates in column two can be interpreted as the impact of MES and
SFA on gains in student performance between 1996 and 1997, controlling for student gains made
prior to model adoption and other changes in observable school characteristics. These are valid
estimates of model impacts, if the effects of unobserved factors that influence both the decision
to adopt whole-school reform and student performance are constant over time. This is more
plausible than the assumption required by the value-added estimator, namely, that unobserved
factors influencing student performance are unrelated to the decision to adopt whole-school
reform. Thus, the estimates in column two are more defensible than those in column one. The
difference between the two sets of estimates suggests that the estimates of model impacts
obtained from the simple, value-added model do suffer from selection bias, although the bias in
this sample appears to be minimal for SFA.
The third column of Table 6-2 attempts to improve upon the value-added estimates in
column one by using two-stages least squares, which is an instrumental variables (IV) estimator.
134

We used two criteria to select a set of instruments from among the several observed
characteristics of other schools in the same district. First, the instruments chosen must be
uncorrelated with the error term in the student performance equation. If the number of
instruments used is greater than the number of endogenous right-hand side variables (in this case
the MES and SFA indicators), it is possible to formally test for correlation between the
instruments and the error term (Wooldridge 1999). Second, the instruments must be good
predictors of the endogenous variables. In finite samples, IV estimates are biased in the direction
of OLS estimates with the size of the bias depending on the strength of the relationship between
the instruments and the endogenous variables. Bound, Jaeger, and Baker (1995) suggest that
examining the F-statistic on the excluded instruments in the first-stage regression is useful in
gauging the bias of the IV estimator.
The instrument set used to generate the estimates presented in Table 6-2 includes the
following measures from other schools in the same district: the log of the average enrollment; the
average percentage of students who are Hispanic, the average percentage of teachers with fewer
than two years experience, the average percentage of teachers who are certified in their field of
assignment, and the square of the average percentage of teachers who are certified. In choosing
this instrument set, we first narrowed many different combinations of instruments to those for
which the null hypotheses that the instruments are uncorrelated with the error term in the student
performance equation could not be rejected. Among these sets of instruments, the one used has
the highest partial F-statistic in the first-stage regressions.
Results for the control variables are similar to those obtained in column one. The
estimated impacts of the decisions to adopt MES and SFA are, however, different. In particular,
the IV estimates in Column (3) are closer to the difference-in-differences estimates in Column
135
(2) than to the value-added estimates in column one. In the case of SFA, the IV and difference-
in-differences estimates are virtually identical. However, the standard errors for the IV estimators
are larger and thus the inferences differ. Whereas the estimated impacts of SFA are statistically
significant at the 0.05 level in both columns one and two, they are significant only at the 0.10
level in Column (3).
It is important to note that the IV estimates are sensitive to the choice of instruments.
Suppose, for example, that we fail to recognize the independent relationship between student
performance and the average percentage of students eligible for free lunch in the other schools in
the district and therefore include this variable as an instrument in the first-stage regression rather
than as an independent variable in the second-stage regression. In this case, we would reject the
null hypothesis that the instruments are uncorrelated with error term in the student performance
equation, and the impact estimates are markedly biased. Specifically, estimated coefficients for
MES and SFA are –4.501 and –4.851, respectively, in this misspecified model. Alternatively,
suppose we drop the average percentage of students who are Hispanic and the average
percentage of teachers who are new from our set of instruments. Here, we do not reject the null
hypothesis that the instruments are uncorrelated with the error term in the performance equation,
but the relationships between this alternative set of instruments and the MES and SFA indicators
is weaker than in the full set used to generate the estimates in Table 6-2. As a result, the
estimated impacts obtained using this alternative set of instruments, 0.007 for MES and –3.383
for SFA, are closer to the value-added estimates in column one of Table 6-2 than are the IV-
estimates presented in the third column of Table 6-2.
To assess the extent of bias from measurement error, we re-estimated the models in Table
6-2 using an instrument for the lagged performance measures in each model. In the value-added
136

models, the 1995 reading score was used as an instrument for the 1996 score. In the difference-
in-differences model we used the 1994 reading score as an instrument for the difference between
the 1996 and 1994 scores. The results of these alternative estimations are presented in Table 6-3.
The point estimates differ from the point estimates in Table 6-2, but the qualitative pattern of
results is the same. Assuming that the difference-in-differences estimates are our best estimates,
and are unbiased, these results indicate that the value-added estimates are biased. In fact, the bias
appears greater in Table 6-3 than in Table 6-2. The last column of Table 6-3 shows that using
instruments for the MES and SFA indicators, as well as for the lagged measure of student
performance, reduces the bias of the value-added measures and provides impact estimates closer
to the difference-in-differences estimates.
137
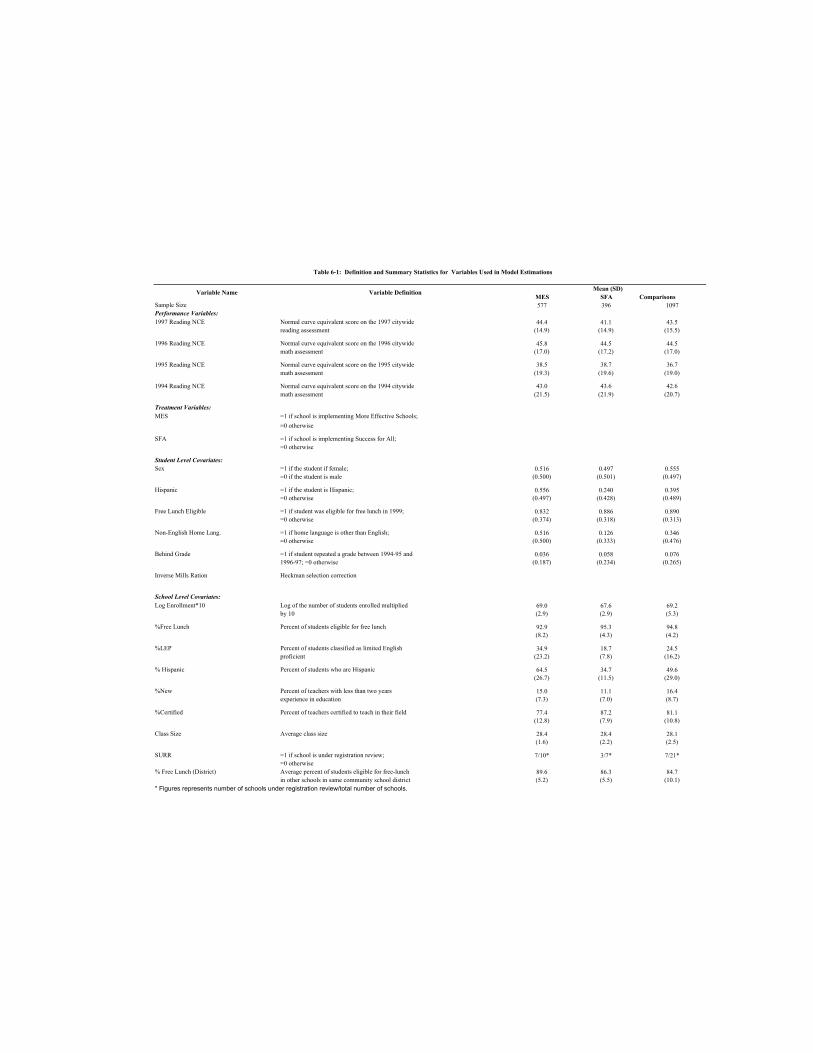
MES SFA ComparisonsSample Size 577 396 1097Performance Variables:1997 Reading NCE Normal curve equivalent score on the 1997 citywide 44.4 41.1 43.5
reading assessment (14.9) (14.9) (15.5)
1996 Reading NCE Normal curve equivalent score on the 1996 citywide 45.8 44.5 44.5math assessment (17.0) (17.2) (17.0)
1995 Reading NCE Normal curve equivalent score on the 1995 citywide 38.5 38.7 36.7math assessment (19.3) (19.6) (19.0)
1994 Reading NCE Normal curve equivalent score on the 1994 citywide 43.0 43.6 42.6math assessment (21.5) (21.9) (20.7)
Treatment Variables:MES =1 if school is implementing More Effective Schools;
=0 otherwise
SFA =1 if school is implementing Success for All; =0 otherwise
Student Level Covariates:Sex =1 if the student if female; 0.516 0.497 0.555
=0 if the student is male (0.500) (0.501) (0.497)
Hispanic =1 if the student is Hispanic; 0.556 0.240 0.395=0 otherwise (0.497) (0.428) (0.489)
Free Lunch Eligible =1 if student was eligible for free lunch in 1999; 0.832 0.886 0.890=0 otherwise (0.374) (0.318) (0.313)
Non-English Home Lang. =1 if home language is other than English; 0.516 0.126 0.346=0 otherwise (0.500) (0.333) (0.476)
Behind Grade =1 if student repeated a grade between 1994-95 and 0.036 0.058 0.0761996-97; =0 otherwise (0.187) (0.234) (0.265)
Inverse Mills Ration Heckman selection correction
School Level Covariates:Log Enrollment*10 Log of the number of students enrolled multiplied 69.0 67.6 69.2
by 10 (2.9) (2.9) (5.3)
%Free Lunch Percent of students eligible for free lunch 92.9 95.3 94.8(8.2) (4.3) (4.2)
%LEP Percent of students classified as limited English 34.9 18.7 24.5proficient (23.2) (7.8) (16.2)
% Hispanic Percent of students who are Hispanic 64.5 34.7 49.6(26.7) (11.5) (29.0)
%New Percent of teachers with less than two years 15.0 11.1 16.4experience in education (7.3) (7.0) (8.7)
%Certified Percent of teachers certified to teach in their field 77.4 87.2 81.1(12.8) (7.9) (10.8)
Class Size Average class size 28.4 28.4 28.1(1.6) (2.2) (2.5)
SURR =1 if school is under registration review; 7/10* 3/7* 7/21*=0 otherwise
% Free Lunch (District) Average percent of students eligible for free-lunch 89.6 86.3 84.7in other schools in same community school district (5.2) (5.5) (10.1)
* Figures represents number of schools under registration review/total number of schools.
Mean (SD)Variable Name Variable Definition
Table 6-1: Definition and Summary Statistics for Variables Used in Model Estimations

Value-Added OLS Difference-in-Differences Value-Added IVa(Robust S.E.) (Robust S.E.) (Robust S.E.)
Treatment Variables:MES 0.573 -0.782 -0.152
(0.790) (1.575) (3.163)
SFA -2.944** -3.598** -3.596*(0.938) (1.601) (2.058)
Student Level Covariates:Lagged reading score 0.621** 0.225** 0.620**
(0.032) (0.024) (0.031)
Lagged reading score if > 50 0.038** -0.026** 0.038**(0.017) (0.013) (0.017)
Sex -0.092 -0.174(0.391) (0.512)
Hispanic 0.854 0.916(0.789) (0.778)
Free Lunch Eligible -0.262 -0.237(0.641) (0.671)
Non-English Home Lang 1.812** 2.107(1.104) (1.718)
Behind Grade 5.806** 13.156** 5.769**(1.044) (1.178) (1.045)
Heckman Selection Correction -5.618** -6.514*(1.044) (3.365)
School Level Covariates:Log Enrollment*10 0.156* -0.017 0.140
(0.086) (0.041) (0.116)
%Free Lunch -0.110 0.114 -0.126(0.053) (0.088) (0.081)
%LEP 0.072** 0.048 0.075**(0.029) (0.053) (0.033)
% Hispanic -0.088** 0.059 -0.089**(0.018) (0.193) (0.021)
%New -0.004 0.029 -0.006(0.034) (0.077) (0.038)
%Certified -0.092** 0.034 -0.090**(0.032) (0.056) (0.033)
Class Size 0.326* -0.138 0.356*(0.161) (0.279) (0.207)
SURR -2.206** 0.496 -2.020**(0.577) (0.758) (0.800)
% Free Lunch (District) -0.161** -0.429 -0.154**(0.034) (0.403) (0.052)
a. MES and SFA are treated as endogenous.* Significant at 0.10 level ** Significant at 0.05 level
Table 6-2: Estimated Impacts of Whole-School Reform Models on 1997 Reading Scores
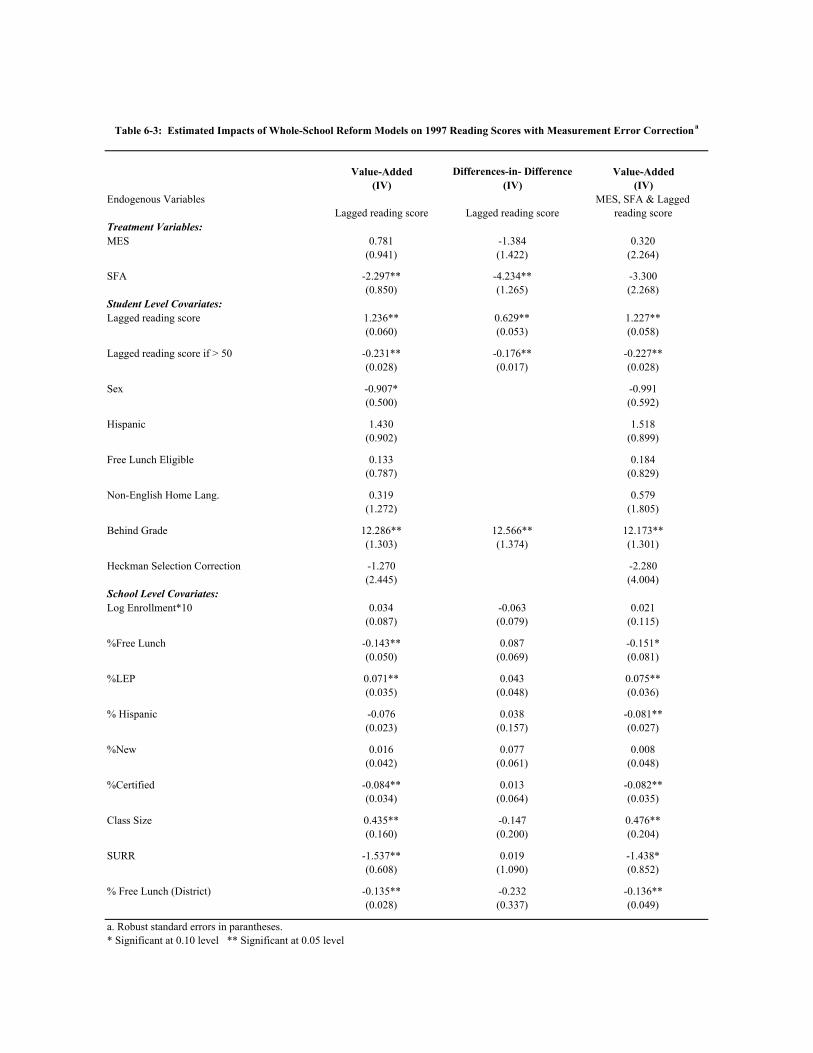
Value-Added Differences-in- Difference Value-Added(IV) (IV) (IV)
Endogenous VariablesLagged reading score Lagged reading score
MES, SFA & Lagged reading score
Treatment Variables:MES 0.781 -1.384 0.320
(0.941) (1.422) (2.264)
SFA -2.297** -4.234** -3.300(0.850) (1.265) (2.268)
Student Level Covariates:Lagged reading score 1.236** 0.629** 1.227**
(0.060) (0.053) (0.058)
Lagged reading score if > 50 -0.231** -0.176** -0.227**(0.028) (0.017) (0.028)
Sex -0.907* -0.991(0.500) (0.592)
Hispanic 1.430 1.518(0.902) (0.899)
Free Lunch Eligible 0.133 0.184(0.787) (0.829)
Non-English Home Lang. 0.319 0.579(1.272) (1.805)
Behind Grade 12.286** 12.566** 12.173**(1.303) (1.374) (1.301)
Heckman Selection Correction -1.270 -2.280(2.445) (4.004)
School Level Covariates:Log Enrollment*10 0.034 -0.063 0.021
(0.087) (0.079) (0.115)
%Free Lunch -0.143** 0.087 -0.151*(0.050) (0.069) (0.081)
%LEP 0.071** 0.043 0.075**(0.035) (0.048) (0.036)
% Hispanic -0.076 0.038 -0.081**(0.023) (0.157) (0.027)
%New 0.016 0.077 0.008(0.042) (0.061) (0.048)
%Certified -0.084** 0.013 -0.082**(0.034) (0.064) (0.035)
Class Size 0.435** -0.147 0.476**(0.160) (0.200) (0.204)
SURR -1.537** 0.019 -1.438*(0.608) (1.090) (0.852)
% Free Lunch (District) -0.135** -0.232 -0.136**(0.028) (0.337) (0.049)
a. Robust standard errors in parantheses.* Significant at 0.10 level ** Significant at 0.05 level
Table 6-3: Estimated Impacts of Whole-School Reform Models on 1997 Reading Scores with Measurement Error Correctiona

Chapter 7: Evaluation Results
7.1. Introduction
This chapter presents the results of our analyses, and is divided into three substantive
sections: the first presents our school-level analysis, the second presents our student-level
analysis of the decision to implement a whole-school reform model, and the third presents our
analysis of the extent to which model impacts are influenced by the quality of implementation.
To be more specific, Section 7.2 presents the results from analyses conducted using
school-level measures of student performance. Although these school-level analyses suffer from
a lack of precision, they indicate that the School Development Program (SDP) and Success for
All (SFA) had little discernible impact on the percentage of students scoring above minimum
competency on state tests of math and reading. In fact, during the first year following adoption,
efforts to implement SFA appear to have had negative impacts on the percentage of third graders
scoring above minimum competency in reading. The results for More Effective Schools (MES)
are more encouraging. The estimated impacts of the decision to adopt MES on the percentage
above minimum competency in reading are positive for each year following adoption and
become larger in later years. The estimated impacts are statistically significant only during the
third year, however, and no discernible impacts on math are found.
Section 7.3 presents results from student level analyses designed to estimate the average
impacts of the decision to adopt whole-school reform on citywide tests of reading and math.
These analyses represent the core of the evaluation. Impact estimates are presented separately for
three cohorts of students. The results of these analyses are roughly consistent with the findings
from the school-level analyses, and can be summarized as follows.
�� SDP shows no discernible impacts on student performance until 1998 or 1999, four or five years after the initial decision to adopt. Even in 1998 and 1999, indications of positive impacts are small and not robust across estimation methods. The most favorable estimates indicate that by 1999, third graders who attended a SDP school for an average
of 3.38 years were scoring 0.16 standard deviations higher in math than would have been expected in the absence of the decisions to adopt the School Development Program.
�� We find some evidence that the decision to adopt MES had a positive impact on reading
performance during the 1995-96 and 1996-97 school years across all grade levels (except grade 5). These impacts were at least partly lost due to lower than expected gains during the 1997-98 school year. Analyses of math performance show a similar pattern of results, but estimated impacts on math scores tend not to be statistically significant. This pattern of findings might be explained by the fact that MES trainers were actively engaged with adopting schools only during the 1995-96 and 1996-97 school years.
�� SFA shows negative impacts on the fifth-grade reading gains of both the cohort in third
grade during 1994-95 and the cohort in third grade in 1996-97. We also find indications of negative impacts on the reading and the math performance of students who were in third grade in 1998-99 and who spent only second and/or third grade in a SFA school. We did not find evidence that the decision to adopt SFA had any significant, positive impacts on performance to offset these losses. Taken at face value, our findings suggest that the decision to adopt SFA might have led schools to divert attention and resources away from the later grades (3-5) towards earlier grades (K-2) to the detriment of students in the later grades.
The results from the first two sections focus on the impact of the decision to adopt a
whole-school reform model, ignoring questions of implementation quality. What is not clear
from these results is whether model effectiveness is diminished by inconsistent implementation
across the schools in our sample. Section 7.4 tries to shed light on this question by examining
how the impact of the decisions to adopt SDP and SFA vary by quality of implementation. In the
case of SDP, stronger implementers unequivocally show more positive impacts than weaker
implementers. These findings are consistent with hypothesis that the overall impact of SDP was
diminished by inconsistent implementation. However, we cannot rule out the possibility that
schools more able to implement the model’s prescriptions were more effective than schools less
prepared for implementation prior to model adoption. The results for SFA are more ambiguous,
but do show some evidence that stronger implementation of the model is associated with more
positive impacts.
142
7.2. School Level Analysis
The school-level panel data set described in Chapter 4 provides ten consecutive years of
student performance and other measures aggregated at the school level. These data allow us to
implement an interrupted time-series analysis. Interrupted time-series analysis is widely known
in the program-evaluation literature (Cook and Campbell 1979), and Bloom (1999, 2001) has
demonstrated its usefulness for estimating the impacts of whole-school reform. The approach
uses measures of performance prior to the adoption of whole-school reform to project levels of
performance in the years following model adoption. The deviation of observed performance
from projected performance is interpreted as the impact of the whole-school reform model.
The analysis is implemented using the following school-level regression model (Bloom
2001):
(1) 1( 1 ... ) tjt t j j jt T jt jtY a a b t D F D FT X C e� � � � � � � � j
This is a two-way fixed-effects model with a year-effect and a school-effect that varies over
time. represents an aggregate measure of student performance in school j in year t. The
“intercept term” consists of a year-specific component, , and a school-specific component that
varies over time, . The “treatments” are specified by a series of dummy variables,
jtY
ta
j ja b t� jtFt
, each indicating whether or not school j has been implementing a whole-school
reform model for t years. Thus,
( 1, )t � ...,T
1 jtF is 1 if school j is in its first year of implementing a whole-
school reform model in year t , and 0 in all other years. tD ( 1,..., )t �
1
T represents the average
impact of the whole-school reform model on the aggregate level of student performance in
schools that have been implementing the model for t years. Thus, D can be interpreted as the
model impact after one-year of implementation, 2D as the impact after two years, and so on.
represents a set of school-level covariates and their effects. jtX C
143

The analyses presented here use the percentage of students above the state reference point
(SRP) on the third-grade reading and math PEP tests as the aggregate measures of school
performance. The PEP tests are statewide exams that were administered by the New York State
Education Department until 1998, and the SRP is a cutoff point, which was used to identify
students for remedial services. We have measures of the percentage of students above the SRP
for each school in our sample from 1989 through 1998. Identifying the pre-adoption pattern of
performance and interpreting deviations from that pattern as model impacts requires a consistent
measure of student performance for several years prior to model adoption. Also, because whole-
school reforms can take a number of years to implement and show impacts, it is desirable to
examine the same measure of performance for several years following adoption. The percentage
above the SRP on the third grade PEP tests are the only measures available for an adequate
number of years prior to and following model adoption.
The school-specific effects in Equation (1), , control for unobserved school-level
factors whose cumulative affects on aggregate student performance vary according to a linear
time trend. This specification allows the estimated pre-adoption pattern of performance to follow
a linear trend. Dropping b t from the model would constrain the projected level of performance
in each post-adoption year to equal the mean level of performance in the years prior to model
adoption. Adding a third term, would allow the estimated pattern of performance to follow
a non-linear trend.
j ja b t�
j
22 jb t
Specifying a linear performance trend has some advantages over these alternatives.
Unlike a model that only uses the mean level of pre-adoption performance to project post-
adoption performance, including lets the data determine whether or not pre-adoption scores
are following a trend. Also, allowing the linear time-trend reduces threats of serial correlation
that can affect time-series and panel data models. Including b t in the model would allow the
jb t
22 j
144

data to determine whether or not the pre-adoption performance trend is linear or non-linear.
Given the limited number of pre-adoption test scores available for each school, however, it is
unlikely that three temporal parameters ( , and ba jb 2j) can be estimated precisely. Imprecise
estimates of these parameters can cause misleading projections of post-adoption performance. Of
course, fear that the linear trend parameter will be imprecisely estimated, thereby causing
misleading performance projections, also provides a reason to drop from the model. Thus, we
present results from models estimated with and without b t .
jb t
j
Two terms in Equation (1) help to control for effects of other changes that might have
coincided with model adoption. First, inclusion of the year fixed-effects, , adjusts the measure
of the average deviation from trend for citywide factors that may have affected the test results in
a given year. More precisely, it controls for factors that were experienced by both the schools
that adopted whole-school reform models and the comparison schools that did not. This means
that the only changes that can provide alternative explanations for the estimated deviations from
trend are changes that systematically affected the treatment group schools, but not the
comparisons. Second, measures of school-level characteristics, , provide controls for school-
level factors that might have changed in a non-linear fashion, and which might provide
alternative explanations of the observed deviations from trend. School-level covariates used in
the analyses presented here include enrollment, the percentage of students with limited English
proficiency, the percentage of teachers with fewer than two years experience, the percentage of
teachers certified in their field of assignment, average class-size, and whether or not the school
was identified for registration review. Additional measures might be useful but were not
available for each of the years in the time-series.
ta
jtX
Equation (1) is estimated using ordinary least squares with dummy variables to identify
the year effects and school effects, and interactions between a year counter and school dummies
to capture the slope of the performance trend. In the analyses presented here, impacts are
145

estimated using observations from 1989 to 1998. Alternative estimates were computed using
only observations from 1992 to 1998. Dropping earlier observations did not substantially change
any of the estimated impacts and the results are not reported here. Standard errors are estimated
using the Huber/White procedure to account for non-constant error variances across schools.
The results of the analyses are presented in Table 7-1. We find a few significant
differences between estimates obtained from the specifications that include a linear trend in pre-
adoption performance and those obtained from the specifications that rely solely on the pre-
adoption means to project post-adoption performance. The estimated linear trend parameters are
significantly different than zero in a majority of cases, which is reflected in the higher values of
the R-squared for the models that include a linear trend term. Also, the models that do not
include the linear trend are more likely to suffer from serially correlated errors, as indicated by
Durbin-Watson statistics well-below two for these two specifications. For these reasons the
discussion here focuses on the results from the specifications that include a linear trend term,
which are reported in the first two columns of Table 7-1.
Neither the School Development Program (SDP) nor Success for All (SFA) show
statistically significant positive impacts. Point estimates of the effect of SDP on reading are
virtually zero during the first year of implementation, positive during the second year, and
negative during the third and fourth year. For math, the SDP estimates are all close to zero. In no
case do efforts to implement SDP show significant impacts on the percentage of students scoring
above the SRP. The only significant estimates for SFA is the negative impact on reading during
the first year of implementation. This result might be due to the disruption in classroom
processes that accompanies efforts to implement a prescriptive model like SFA.
The estimated impacts of More Effective Schools (MES) on reading performance come
the closest to showing the pattern one might expect. Estimated impacts for each year are positive
and become larger the longer the school has used the program. This pattern suggests that
146

improvements in school practice develop incrementally and benefits to students accumulate over
time. Due to the imprecision of these estimates, however, the results are significantly different
than zero only in the third year after implementation. Note that the third-year estimates are based
on only the eight schools that adopted MES during the 1995-96 school year. The larger impact
estimates during the third year might reflect greater improvement for these earlier adopters than
for the schools that adopted MES during the 1996-97 school year. Estimated impacts of MES on
math are positive, but small and statistically insignificant.
The comparisons between treatment and control schools reflected in these impact
estimates have been adjusted to account for differences in the level and trend of pre-adoption
student performance as well as differences in changes on measured school characteristics.
However, there may have been changes experienced by the treatment group schools, but not by
the comparison group schools (or vice-versa), that are unrelated to model adoption, and that are
not captured either by the covariates included in our model or by the school-specific performance
trends. Perhaps the most relevant possibilities here are changes in school leadership (the
principal, district superintendent, or some other change agent) that might have coincided with
model adoption. The fact that our estimates are averaged across multiple schools reduces the
plausibility of attributing observed deviations from performance trends (or lack thereof) to
idiosyncratic changes that might have occurred at individual schools. However, the majority of
SDP adopters are from one district and the majority of SFA adopters from another. Thus, our
treatment schools are concentrated in a small set of community school districts, which makes it
more likely that a significant portion of the treatment group experienced changes unrelated to
model adoption that were not experienced by the comparison group schools.
Another potential threat to the validity of these impact estimates arises from changes in
the unobserved characteristics of the students attending treatment schools that may not have
occurred in the comparison schools. Two things might cause such differential changes. First,
147
larger proportions of the schools in the treatment groups than in the comparison group were
schools under registration review. A community school district might respond to a school’s
SURR designation, and the consequent pressures to improve aggregate student performance
measures, by taking steps to modify the mix of students in the school. We do not know how
often, if at all, districts took such measures. Second, depending on school assignment policies
within a district, parents who are attracted to a certain model might be able to move their
students into a treatment school. Likewise parents who don’t like a particular model might
remove their children from an adopting school. Such changes in student mix can create changes
in the aggregate level of student performance in a school, even if the model has no effect on how
much individual students learn.
Even if we believe that these alternative explanations for the observed deviations from
school performance trends are unlikely, the power of our school-level analyses to detect program
impacts is limited. The dependent variable in this analysis is the percentage above the state
reference point on the grade-three state reading assessment. The state reference point (SRP) is a
minimum competency standard, and changes in the percentage above minimum competency tell
us about the impact of whole-school reform efforts on students who are close to that standard.
Changes in this measure tell us little about the impacts of whole-school reform on students who
are far below or far above the standard. Thus, it is possible that the whole-school reform models
do little to improve the performance of students just below minimum competency, but do more
to improve the performance of students far below and/or far above minimum competency.
Alternatively, it may be that these models do consistently lead to improved student performance,
but the improvements are too small to significantly change the proportion of students that score
above or below a given threshold such as the SRP. For these reasons, it is important to move
beyond aggregate measures of performance, and examine how individual test scores were
affected by the adoption of whole-school reform.
148

7.3. Student-Level Analysis: Average Impact of the Decision to Adopt
We conduct our student-level analysis for three different cohorts: students in the third
grade in 1994-95; students in the third grade in 1996-97; and students in the third grade in 1998-
99. We now turn to a discussion of our student-level results for each of these cohorts.
7.3.1. The Cohort of Students in Third Grade in 1994-95
Table 7-2 presents several estimates of a value-added student performance equation
designed to explain variation in 1997 reading performance across students who were in third
grade in one of our treatment or comparison group schools during the 1994-95 school year. The
measures of reading performance used in these estimations are NCE scores on the citywide test
of reading administered by the New York City Board of Education. In addition to dichotomous
variables indicating whether or not the student attended a school that had decided to adopt a
whole-school reform model, independent variables used in the regression equations include a
measure of reading performance from the 1995-96 school year, an interaction between this
lagged test score and a dichotomous variable indicating whether or not the lagged score was
above 50 (the national average), a series of dichotomous variables capturing individual student
characteristics, and a set of school-level measures including student-body characteristics, teacher
characteristics, average class-size, and whether or not the school was under registration review.
We present results based on various estimators. In each case, the standard errors presented in
Table 7-2 were calculated using the Huber-White sandwich estimator.
Two of the 91 schools in our sample serve only grades K-4. These schools, which were
included in the school-level analyses in the previous section, both adopted the More Effective
Schools model. Since the analyses in Table 7-2 focus on fifth-grade performance, they do not
include students from these two schools. In fact, students from these two schools are not
included in any of the student-level analyses presented in this section.
149
Column (1) presents OLS estimates of model impacts computed using students who have
reading test scores reported for both 1996 and 1997, and who remained in one of our sample
schools during 1997. These estimates indicate that the School Development Program (SDP) and
More Effective Schools (MES) had virtually no affect on the 1996-97 reading gains of students
in this cohort. The estimate for Success for All (SFA) indicates that students scored
approximately 2.22 NCEs lower than they would have if the schools they were attending had not
adopted SFA. However, because unobserved school factors that influence student performance
gains are also expected to influence the decision to adopt whole-school reform, we suspect that
the estimates in column one are biased.
Column (2) attempts to improve upon the estimates in Column (1) by using two-stage
least squares, which is an instrumental-variables (IV) estimator. Drawing on the rationale
developed in Chapter 6, we focused on the characteristics of other schools in the same district as
potential instruments for the decision to adopt each whole school reform model. The instrument
set used to generate the estimates presented in Column (2) includes the following measures from
other schools in the same district: the average percentage of students eligible for free-lunch, the
average percentage of students eligible for free lunch squared, the average percentage of students
with limited English proficiency (LEP), the average percentage of students who are Hispanic, the
average percentage of teachers with fewer than two years experience, the number of schools in
the district under registration review (SURR), and the number of SURRs squared. Interactions
between several of these variables are also included as instruments. In choosing this instrument
set, we first narrowed many different combinations of instruments to those combinations for
which the null hypotheses that the instruments are uncorrelated with the error term in the student
performance equation could not be rejected in an over-identification test. Among these sets of
instruments, we present results from one which showed relatively high partial F-statistics in the
150

first-stage regression, and which provided relatively precise estimates of model impacts. The
results of the first-stage regressions are presented in Table 7-2A.
The estimated impact of SDP in the second column of Table 7-2 is negative, the
estimated impact of MES is positive, and the estimated impact of SFA is negative. Only the
estimate for SFA is statistically different from zero. The NCE scale is designed to have a
standard deviation of approximately 21. Thus, these estimates indicate the efforts to implement
SFA had a negative impact of approximately 0.20 standard deviations on reading performance.
The statistically insignificant point estimates for SDP and MES represent impacts of minus 0.10
and plus 0.11 standard deviations, respectively.
That SDP and MES show small and statistically insignificant impacts on the performance
of this cohort is not surprising. The students in this cohort who attended a whole-school reform
school did so in the later elementary school grades, for one to three years, in a school that was in
the early stages of model implementation. Given that it can take several years to implement the
key components of these whole-school reform models and to change ingrained school practices,
it would be surprising if we did see large impacts on this cohort. Nor is it surprising that we
found negative impacts for Success for All. The primary focus of SFA is preventing reading
failures beginning in the early grades. Not only did the students in this cohort not experience the
model during the periods that it is most likely to have benefited them, but given the model’s
focus on the early grades and the difficulty of implementing as extensive a model as SFA, one
might suspect that resources and energy were diverted away from these students.
One concern about the estimates in Columns (1) and (2) is that they are computed using a
non-random selection of students from the schools in the study sample—namely, students who
are not missing test scores and students who did not move to a school outside our study sample.
To assess the potential effect of this sample selection, we re-estimated the value-added student
performance equation using a Heckman two-step selection correction. The results of these
151
estimations are presented in Columns (3) and (4).1 The impact estimates obtained when the
Heckman selection correction is used are similar to the estimates obtained when selection issues
are ignored. Note also that the coefficient on the Heckman selection term in both the OLS and IV
estimations is statistically indistinguishable from zero (see Lambda in Table 7-2B). These results
suggest that sample selection bias is not a significant issue.
As a second check for sample selection bias, we re-estimated the student performance
equation with the students who moved to a school outside our study sample included in the
sample. This new sample includes 75.7 percent of all the students in the cohort rather than the
58.9 percent used to compute the estimates in Columns (1) and (2). These students are scattered
across 458 different schools rather than being restricted to the 89 schools in our study sample. In
order to adequately control for differences between movers and non-movers in this sample, we
added several variables to the student performance equation. First, we added a set of indicator
variables that take on the value of 1 if a student attended a school that was implementing a
particular whole-school reform model during a previous year but not during the current year. The
purpose of including these variables is to ensure that the estimates of model impacts are based on
the comparison of treatment group students with students who have not been exposed to whole-
school reforms.2 We also added dummy variables indicating whether or not the student changed
schools between 1994 and 1997, and whether or not the student had changed school during the
most recent year, 1996-97. The first of these variables controls for fixed, otherwise unobserved
average differences between students who change schools and those who do not. The second
“mover” variable controls for the disruption/adjustment effects of changing schools. Results
from this alternative estimation are presented in Columns (5) and (6) of Table 7-2. The estimates
1 Results of the first stage probit for this procedure are presented in Table VII-2B.
152
2 To save space, the coefficient estimates on these variables are not reported in Table 7-2. In all cases the coefficient estimates were small and statistically indistinguishable from zero.
in these columns are similar to those in Columns (1) and (2), providing further evidence that
sample selection is not influencing the impact estimates.3
A second concern with the estimates presented in Columns (1) and (2) is that
standardized tests are imperfect measures of student performance, even in the domains they are
designed to assess. Thus, lagged student performance is measured with error. Although we
expect that this error is randomly distributed across students, it nonetheless introduces bias and
inconsistency into the coefficient estimates presented in Columns (1) and (2). To assess the
extent of this bias, we re-estimated the student performance equation, using the 1995 reading
performance score (a two-year lag) as an instrument for the 1996 score (a one-year lag). Since
the measurement error around the 1996 test score is random, it is uncorrelated with the 1995 test
score. In addition, the 1995 test score is a good predictor of the 1996 score. Thus, the 1995 test
score is a suitable instrument for the 1996 test score, and these estimations reduce the amount of
bias due to measurement error (Green 1997). The results of these alternative estimates, presented
in Columns (7) and (8), are similar to those in Columns (1) and (2), indicating that measurement
error is not creating substantial bias.
One limitation of the estimates in Table 7-2 is that they only represent the impact of
whole-school reform efforts on the growth in student performance during the 1996-97 school
year. Many of the treatment group schools initiated whole-school reform efforts prior to the
1996-97 school year in either 1994-95 or 1995-96. The impacts that whole-school reform efforts
may have had on students in these earlier years are not reflected in the estimates in Table 7-2.
Table 7-3 presents the results of analyses designed to determine if whole-school reform efforts
had impacts on this cohort of students prior to the 1996-97 school year.
153
3 We also estimated the sample selection and measurement error models using this sample. The results were similar both to the estimates in columns (5) and (6) of Table 7-2, and to the sample selection and measurement error estimates obtained using only students who did not change schools.
The top panel of Table 7-3 shows estimates computed using students who attended a
school that adopted a whole-school reform model during either the 1994-95 or 1995-96 school
years along with the comparison-group students. Separate student performance equations were
estimated to explain variation in the 1996 reading performance (controlling for the 1995 reading
performance), and the 1997 reading performance (controlling for the 1996 reading performance).
The bottom panel of Table 7-3 presents estimates computed using students who attended the 25
schools that adopted SDP in 1994-95 and the comparison-group students. Separate value-added
student performance equations were estimated to explain variation in the 1995, 1996, and 1997
reading performance. Since no schools adopted MES during the 1994-95 school year and only
two adopted SFA by this time, estimates for these two models are not reported in the bottom
panel.
Considering the bottom panel first, efforts to implement SDP show a small, positive
impact on average during the first year of implementation, and small, negative impacts during
the second and third years. None of the impact estimates in the bottom panel are statistically
different from zero. The estimated impacts of SDP in the top panel are computed using a slightly
different sample schools, but are similar to the corresponding estimates in the bottom panel. The
decision to adopt MES shows positive estimated impacts on the reading performance of this
cohort. Adding the 1996 and 1997 estimates indicates that students in schools that adopted MES
in the fall of 1995, scored between 2.6 NCEs (OLS estimates) and 9.0 NCEs (IV estimates)
higher in reading than we would have expected, if the schools had not decided to adopt the
model. This impact represents a gain of 0.12 to 0.43 standard deviations over two years. SFA in
contrast shows no evidence of positive impacts on reading during the 1995-96 school year, and
as in Table 7-2, shows negative impacts during the 1996-97 school year.
Table 7-4 presents estimates of the impacts of each whole-school reform model on the
average math performance of this cohort. The top panel of Table 7-4 presents estimates of the
154
impacts of whole-school reform on the 1997 math scores of students who attended one of the
treatment group schools in 1995 and who remained in a treatment-group school in 1997. These
estimates control for each student’s 1996 math performance and all of the other student and
school measures used to estimate impacts on reading. The estimates in the top panel correspond
to the estimates for reading that are presented in Columns (1) and (2) of Table 7-2. The middle
panel of Table 7-4 presents estimates calculated using only treatment-group students who
attended schools that adopted whole-school reform in 1994-95 and 1995-96. Estimated impacts
on the 1996 math score (controlling for the 1995 math score), and on the 1997 math score,
controlling for the 1996 math score), were calculated separately. The estimates in this panel
correspond to the estimated impacts on reading presented in the top panel of Table 7-3.
Similarly, the bottom panel of Table 7-4 presents estimated impacts of SDP on math scores,
which correspond to the estimated impacts on reading in the bottom panel of 7-3.
The first thing to notice about the results in Table 7-4 is that the instrumental variable
estimates, in most cases, are less precise then the corresponding estimates in Tables 7-2 and 7-3.
This reflects the difficulty of specifying a combination of instruments that pass the over-
identification test we used and that also provide adequate predictions of the decision to adopt.
The estimated impacts on the 1996 performance presented in the middle panel are especially
imprecise. Given the weakness of the instrument set used here, the instrumental variable
estimates in this column may be biased.
Substantially, the results in Table 7-4 suggest that the decisions to adopt whole-school
reform had little discernible impact on student math performance. Only three of the estimates in
Table 7-4 are significantly different than zero—the OLS estimate of the impact of MES on
performance gains made during 1996-97 (top panel), the IV estimate of the impact of the SDP on
performance gains made during the 1995-96 school year (middle panel), and the OLS estimate of
gains in SDP schools during the 1994-95 school year. The estimates are significant only at the
155

0.10 level and are not robust to choice of estimation method. The finding that the decision to
adopt one of these whole-school reform models did not have a significant impact on student
performance in math is not surprising giving that this cohort of students was exposed to the
models only during the later elementary school grades in schools that were in the early stages of
model implementation.
7.3.2. The Cohort of Students in Third Grade in 1996-97
Table 7-5 presents estimates of the impact of whole-school reform on the 1997, 1998 and
1999 reading scores of the cohort of students in third grade in 1996-97. Basically, these estimates
indicate the impact of each model on reading gains made through third grade, during fourth
grade, and during fifth grade in schools that had been implementing whole-school reform for
several years. Since these represent the model impacts a few years after the initial decision to
adopt they are more indicative of the success of whole-school reform efforts than the estimates in
Tables 7-2 and 7-3.
It should be noted that students from three of the schools included in the analyses
presented in Tables 7-2 and 7-3 are not included in these analyses. These three schools were each
registration-review schools that were either required to adopt Success for All during the 1998-99
school year or were substantially redesigned and opened as new schools during 1998-99. Two of
these schools were originally SDP adopters and one is from the comparison group.
There are no test scores for this cohort from years prior to 1996-97, and thus impacts on
student performance during the spring of 1997 were computed using what we referred to as a
levels specification. In this specification, the coefficients on the variables indicating whether or
not the student attended a school that had chosen to adopt a whole-school reform model are
interpreted as the cumulative impact of attending a whole-school reform school for N years,
where N is the average number of years that students in the treatment group had been attending a
156
whole-school reform school by the Spring of 1997. For the sample used here, N=2.62 for SDP,
N=1.49 for MES and N=1.53 for SFA.
The results of these estimations are presented in the first two columns of Table 7-5. The
OLS estimates suggest that the decisions to adopt SDP and SFA had virtually no impact on the
third-grade test scores of students in this cohort. Students in schools that adopted MES, however,
appear to score about 3.34 NCEs higher than observationally similar students in observationally
similar schools. Note that these estimates are roughly similar to the results of the school level,
interrupted time series analyses presented in Table 7-1. Nonetheless, it remains unclear whether
these estimates reflect the true impact of each model, or merely unobserved differences between
treatment and comparison group schools that existed before whole-school reform efforts were
initiated.
To better identify the true impacts of whole-school reform efforts, we implemented the
instrumental variable strategy discussed in Chapter 6. If the characteristics of other schools in the
same district are good predictors of a school’s decision to adopt a whole-school reform and are
unrelated to the error term in the student performance equation, then this strategy will provide
consistent estimates of the impacts of whole-school reform. We used an over-identification test
to check the instrument set used in column two for correlation with the error term from the
student performance equation, and could not reject the null that these instruments are
uncorrelated with the second-stage error term. Thus, the instrumental-variable estimator used in
column two appears to be consistent. In addition, the partial-F statistics for the excluded
instruments in first-stage regression suggest that the instruments are statistically significant
predictors of the decision to adopt.4 Unfortunately, the estimates provided in Column (2) are
157
4 The instrument set used includes the average percentage of students with limited English proficiency, Hispanic students, new teachers in other schools in the district, and the number of other school in the district under registration review. In addition, interactions between some of these variables and school level variables were included in the instrument set. The partial F-statistics in the first stage regressions were 6.44 for SDP, 5.22 for MES, and 2.47 for SFA.
imprecise, which limits the conclusions that we can draw. Nonetheless these estimates are
suggestive. In particular, they suggest that MES did have a significant impact on the third-grade
performance of this cohort of students, which cannot be attributed to pre-existing difference
between schools that adopt this model and the comparison group schools. The estimated impacts
of SDP and SFA are not statistically significant.
The equations presented in Columns 3-6 of Table 7-5 were estimated using a value-added
specification of the student performance equation using students who had reading scores for both
the current year and the lag year, and who remained in one of our sample schools during the year
being examined.5 The OLS estimates in Table 7-5 suggest that whole-school reform efforts had
virtually no effects in either 1998 or 1999. In contrast, the IV estimates suggest that SDP had
positive impacts during 1997-98, which were maintained during 1998-99. MES produced
negative impacts during the 1997-98 school year and smaller, positive effects during the 1998-99
school year, but neither of these estimates is statistically significant. SFA had negative impacts
during both 1997-98 and 1998-99, and the latter are significantly different from zero.
In order to examine the influence of sample selection, each of the models in Table 7-5
was re-estimated using a Heckman correction procedure (as in Columns (3) and (4) of Table 7-
2). For the value-added specifications we computed alternative estimates with the students who
changed schools included in the sample and using a measurement error correction (as in columns
5-8 of Table 7-2). These alternative estimates (not reported) suggest that neither selection nor
measurement error has a substantial influence on the estimates reported in Table 7-5.
The estimates in Table 7-5 suggests that SDP had little effect during the early stages of
implementation, but may have begun having small positive impacts by 1998, which in most
cases, is four years after the initial decision to adopt. There are three potential explanations for
158
this pattern of results. First, because it takes several years for the adoption of SDP to begin
changing school and classroom practices, positive results on not expected until several years
after the initial adoption year. Alternatively, we might suspect that older students are more
susceptible to the social problems in a school that the SDP is designed to address, and thus the
model only influences the performance of student in later elementary school grades. Finally,
SDP focuses attention on the non-academic dimensions of child-development, and changes along
these dimensions either take several years to realize or to begin influencing academic
performance. This last explanation suggests that SDP might only benefit students who remain in
a model school for a number of years.
The estimates in Table 7-5 also suggest that the efforts to implement MES had
substantial, positive impacts on 1996-97 reading performance, but that some of these positive
impacts were diminished by lower-than-expected gains during the 1997-98 school year. MES
officials indicated to us that they provided support services to schools that adopted their model
only through the 1996-97 school year. The possibility that adopting schools were unable to
sustain the changes in school practices promoted by early adoption efforts once the MES trainers
left might explain the partial dissipation of gains during 1997-98. Note, however, that the impact
estimates in Table 7-5 suggest that positive impacts realized prior to the 1997 were not
completely lost, so that by fifth grade students who attended a MES adopter were still showing
higher levels of performance than they would have in the absence of the efforts to implement
MES.
Finally, the results in Tables 7-5 suggest that SFA did not have discernible impacts on the
performance of this cohort of students prior to 1997, and had considerable negative impacts
during 1997-98 and 1998-99. Spring 1999 is between three and five years after the initial
5 The number of students used in the analysis of 1998 test scores is greater than in the analysis of 1999 scores for two reasons. First, students are more likely to have reading scores from 1997 and 1998, then from 1998 and 1999. Second, students are more likely to have moved out of the school they attended during 1996-97 by 1998-99 than by
159
decision to adopt SFA. This suggests that the negative impacts of SFA are not merely transitional
effects due to disruptions that arise when a school is changing classroom practices. A more likely
explanation is that any benefits that SFA creates for students in the early elementary school
grades is achieved by diverting resources away from children in the later elementary school
grades.
Table 7-6 shows the estimated impacts of whole-school reform efforts on the math
performance of this cohort. The first two columns present the results from estimating a level-
based specification of the student performance equation designed to explain variation in 1997
math scores. Here the impact estimates represent the cumulative impact of attending a whole-
school reform school for N years prior to and including third grade, where N=2.62 for SDP,
N=1.49 for MES and N=1.53 for SFA. Columns 3-6 present the results of estimating a value-
added version of the student performance equation designed to explain performance gains made
during the 1997-98 and 1998-99 school years, that is, in fourth and fifth grade.
Although there are some differences, the estimated impacts of the whole-school reform
models on the math performance of this cohort are similar to the estimated impacts on reading.
The decision to adopt SDP shows little impact through third grade, and slightly larger, but still
statistically insignificant gains in 1997-98 and 1998-99. The decision to adopt MES appears to
have some positive impact through third grade, at least some of which is lost due to lower than
expected performance gains during fourth grade. The decision to adopt SFA shows mostly
negative, but statistically insignificant, impacts throughout the period. In contrast to the results
for reading, SFA does not appear to have a negative impact on math performance of fifth graders
during the 1998-99 year.
1601997-98.

7.3.3. The Cohort of Students in Third Grade in 1998-99
In some ways, the impacts of whole-school reform efforts on the cohort in third grade in
1999 are the most interesting for policy makers. Many of the adopting schools examined here
had decided to adopt whole-school reform before these students entered school, and in all cases
schools in the study sample that adopted whole-school reform models had done so by the time
these students began first grade. On average, students from this cohort that attended a School
Development Program (SDP) school in 1998-99 had been doing so for an average of 3.38 years.
The corresponding figures for More Effective Schools (MES) and Success for All (SFA) are 3.12
and 3.04, respectively. Thus, these are students who by third grade are in schools that have been
implementing a whole-school reform model for three to five years, and have been in an adopting
school for an average of about three years between kindergarten and third grade.
The data available for this cohort do not allow us to obtain estimates of model impacts in
which we can have complete confidence. In particular, lagged performance measures are not
available and we have to rely entirely on a levels-type specification of the performance equation.
As indicated above, if there are any unobserved differences between treatment and comparison
group students due either to the way that a school chooses to adopt a whole-school reform model
or to the way that students select themselves into schools, then OLS estimates will suffer from
omitted variable bias. In principle, instrumental-variable estimates of a levels-type specification
can provide consistent estimates of model impacts. In this case, however, we were unable to find
an instrument set that could both pass muster on the over-identification test and provide
sufficiently precise estimates of model impacts. Thus, we only present results from the OLS
estimates.
The estimates for this cohort are presented in Table 7-7. Only students with an observed
test score in 1998-99 are used. As in Tables 7-5 and 7-6, students from the two MES schools that
do not serve grade 5 and from the two SDP schools and one comparison group school that were
161
either redesigned or adopted SFA during 1998-99 are not included in these analyses. Alternative
estimates were calculated using the Heckman selection correction procedure; the results indicate
that sample selection does not have a substantial influence on impact estimates.
The decision to adopt SDP shows positive impacts on both the reading and math
performance of this cohort, although only the impact on math is statistically significant. Students
in schools that have adopted SDP have average math scores that are 0.16 standard deviations
higher than those of students in the comparison group. The impact on math for this cohort is
larger than the impact on the cohort in third grade in 1996-97, which was statistically
indistinguishable from zero. The fact that a statistically significant positive impact on third grade
scores shows up only for this later cohort suggests that it may take several years before efforts to
implement SDP begin showing positive impacts.
The estimated impacts of MES are also positive for both reading and math. In this case,
only the impact on reading scores is statistically significant. The point estimate in column one
implies that students who attended a school that has adopted MES score 0.14 standard deviations
higher in reading than students in the comparison group. The estimated impacts on the third-
grade performance of this cohort (in both math and reading) are slightly smaller than the
estimated impacts on the third-grade performance of the cohort in 1996-97. Thus, the estimates
in Table 7-7 are consistent with the pattern of impacts suggested by the analysis of the earlier
cohort: positive impacts during the 1995-96 and 1996-97 school years, when model trainers were
providing support, were partially lost due to smaller than expected gains during 1997-98 and
1998-99.
SFA shows no statistically significant impacts on the performance of students in this
cohort. Given the emphasis SFA places on reading, negligible impacts on math performance are
not completely unexpected. However, the lack of significant impacts on reading is surprising. Of
course, our estimations do not rule out the possibility that students in the schools that decided to
162

adopt SFA are for some unobserved reason more difficult to educate than the students in the
comparison schools.
If the differences between the performance of treatment and comparison group students
are due to differences in school quality rather than unobserved student characteristics, then we
would expect student impact estimates to be larger for students who have spent more time in
whole-school reform adopters than for those who have spent less time in those schools. To test
this hypothesis we estimated an alternative specification of the student performance equation. In
this alternative specification the impacts of the decision to adopt each whole-school reform
model are allowed to vary with the number of years the student has attended a school that has
adopted the model. The impact estimates from this analysis are presented in Table 7-8.
The impact estimates for SDP are slightly larger for students who have been exposed to
the model for only one or two years than for students exposed for three or four years. The
differences in impacts across these groups, however, are small enough to be attributed to random
noise. The fact the impacts estimates vary little with the length of time a student has been
attending a SDP school suggests that differences in the performance of students in these schools
and students in the comparison group might be due to unobserved student differences rather than
difference in school quality.
The impact estimates for MES show a pattern that is consistent with school quality
differences and with the analyses of the 1996-97 cohort. Students who attended MES schools for
only one or two years, 1997-98 and 1998-99, show negligible and even negative effects. In
contrast, students who attended MES for three or four years (including 1995-96 and/or 1996-97)
show larger, positive effects. This pattern of results is consistent with the hypotheses that schools
that adopted MES were able to improve instruction during the first years after implementation,
when model trainers were present, but that these improvements were not maintained. Thus, only
163
those students who attended MES adopters during the first years of implementation show any
benefits.
SFA also shows more positive impacts for students exposed for three or four years than
for students exposed for only one or two years. Impacts for the latter are negative and in two
cases statistically significant, and impacts for the former are positive, although not statistically
significant. At least two explanations are consistent with these results. The first is that students
attending SFA schools have unobserved characteristics that work to lower their academic
performance. According to this explanation, exposure to SFA curricula and practices does
benefit students, but it is not until they are exposed for three or four years that the original
deficits can be overcome. A second explanation is that SFA only benefits students during the
earliest grades (kindergarten and first grade) and these benefits come at the cost of slower
learning in grades 2 and 3. Findings from the earlier analyses, which use value-added
specifications and find negative impacts in the later grades, lend support for the second of these
two explanations.
7.3.4. Summary of Findings
Table 7-9 provides a summary of results presented in this section. The presentation of
estimates in this table provides a picture of the overall impact of whole-school reform efforts in
New York City during the 1996 to 1999 period.
The decision to adopt the School Development Program (SDP) does not show any
significantly, positive impacts until the 1998 and 1999 school years. During these later years it
shows a positive impact on the reading performance of fourth graders and a positive impact on
the math performance of third graders. In keeping with the claims of model developers, this
suggests that it may take several years before efforts to implement SDP begins to influence
student performance. Note, however, that these positive impacts estimates during later
implementation years are small and are not robust across estimation methods.
164

The decision to adopt More Effective School (MES) shows several statistically
significant positive impact estimates, particularly on reading during 1996 and 1997. Further
analyses of the positive impacts observed for students in third grade in 1999 suggest that these
estimates are driven by significant gains made by students who attended an MES school during
the 1995-96 and/or 1996-97 school years. Overall, the pattern of estimates for MES suggests that
the decision to adopt this model had significant impacts during 1995-96 and 1996-97 school
years, which may have been partially lost during the 1997-98 and 1998-1999 school years. As
noted above, this result might be explained by the fact the MES trainers stopped working with
these schools after the 1996-97 school year.
Success for All (SFA) shows statistically significant, negative impacts for fifth grade
reading. In addition, we saw in Table 7-9 that students who were in third grade in 1998-99 and
who attended a SFA school only during second and/or third grade scored lower in reading and
math than comparison group students. One plausible explanation for these negative impacts is
that, in keeping with the model’s emphasis on preventing reading failures in the early grades, the
decision to adopt SFA diverts resources and attention away from later elementary school grades
(3-5) to the detriment of the students in these grades. Unfortunately, we are not able to provide
much direct evidence to say whether or not these losses during the later grades are compensated
for by positive impacts of SFA during the early elementary school grades.
7.4. Variation in Model Impacts by Quality of Implementation
The results from the preceding sections suggest that the School Development Program
(SDP) and Success for All (SFA) had little or no positive impact on student performance.
However, the analyses above do not tell us whether the decisions to adopt SDP and SFA failed to
show more positive impacts because the policies and practices advocated by the models were
ineffective, or because these policies and practices could not be consistently implemented in
these New York City schools. This section tries to shed light on this question by examining
165
whether or not the impacts of the decisions to adopt SDP and SFA varied with the quality of
model implementation.
The measures of implementation that we use were derived from implementation
assessments conducted by the SDP and SFA developers themselves. The assessment instruments
used and measures of implementation quality derived from these assessments are described in
Chapter 5. These measures include indications of the overall quality of implementation for
schools from the community school district that undertook a district wide effort to implement
SDP, and for all nine of the SFA schools in our sample. For these SDP schools we have
measures of implementation quality from the 1994-95, 1996-97 and 1998-99 school years. For
the SFA schools, we have two measures of implementation quality from the 1996-97 school year
and from the 1998-99 school year. Developer assessments are not available for the More
Effective Schools model, or for the other SDP schools in our sample, and thus we do not include
measures of implementation quality for these schools in the analyses presented here.
Incorporating the implementation measures into our analyses is a matter of re-specifying
the treatment variables to allow the estimated treatment impacts to vary across schools achieving
different levels of implementation. In the analyses presented here, we use two alternative
specifications of the treatment that allow impacts to vary by implementation quality.
In the first alternative, specification A, we replace the single, dichotomous treatment
variable use in the analyses above with a set of two dichotomous variables. One of these, ijML ,
equals 1 if the student attends a school that adopted a whole-school reform model and that has an
implementation rating that is lower than the median rating. The other, ijMH , equals 1 if the
student attends a school that adopted a whole-school reform model and that has an
implementation rating that is higher than the median rating: This equation can be written as:
(2) 0 1 2 3 4ijt jt jt ijt jt ijtY MH MH X W� e� � � � � � � � � �
166

where is a measure of student performance, and ijtY ijtX and �are vectors of student and
school level control variables (including a lagged measure of student performance).
jtW
An alternative specification, specification B, allows the treatment impact to vary as a
continuous function of implementation quality. Starting with the performance equation used in
the analyses above:
(3) 0 1 2 3 4ijt jt ijt ijt jt ijtY D Y X W� e� � � � � � � � � �
(where jtD equals one if the student attends a school that has adopted a whole-school reform
model, and zero otherwise), we assume that �1 varies as a function of implementation quality:
(4) � �1 0 1 , jt avg tM M� � � � � �
Here (Mjt – Mavg,t) is the overall implementation rating for school j expressed as a deviation from
the mean implementation rating for all schools that adopted the same model. Substituting (4) into
(3) we get:
(5) � �0 0 1 , 2 3 4ijt jt jt jt avg t ijt ijt jt ijtY D D M M Y X W� � � � � � � � � � � � � � e
In this equation, � is the average impact of the decision to adopt the whole-school reform
model, and � is how much the impact varies given a one unit increase in the quality of
implementation obtained.
0
1
As in the analyses above, estimations are carried out separately for each of the three
cohorts. In all cases, the estimations here use the same student performance measures and the
same set of student and school level control variables that are used in the analyses presented in
Section 7.3. The specification of the student performance equation depends on the cohort being
examined and the data available for that cohort. In our examination of students in third grade in
1994-95 we used value-added specifications of the student performance equation. For the cohort
in third grade in 1996-97 we use a levels-type specification to examine their third grade (1996-
167
97) performance and a value-added specification to examine their fifth grade (1998-99)
performance. For the cohort in third grade in 1998-99 we use a levels-type specification of the
student performance equation.
Each of the estimation procedures presented here uses the same sample of students that is
used in the corresponding analysis in Tables 7-2 through 7-8. We also computed alternative
estimates using samples that dropped all students who were originally selected into the sample
because they attended a MES school or a SDP school for which there are no implementation
measures. In no case did these alternative estimations provide substantially different results than
the results obtained using the whole sample. Re-estimating each equation using the Heckman
selection correction procedure also did not substantially affect the results.
Only OLS estimates are presented. In section 7.3, characteristics of other schools in the
district were used as instruments for the decision to adopt a whole-school reform model. In these
analyses, all of the SDP adopters for whom measures of implementation are available are from
the same district. Consequently, there is little variation in the characteristics of other schools in
the district, and the variables used earlier are poor predictors of the quality of implementation.
Consequently, instrumental-variable estimates of model impacts are very imprecise and unstable
with respect to specification changes. In Tables 7-2 through 7-8, we saw that instrumental-
ariable estimates did, in some cases, provide different estimates of model impacts than OLS
estimates of the same equation. This implies that OLS estimates in those cases suffer from self-
selection bias. The threat of selection bias may be worse in these analyses. Particularly, if
schools that have the capacity to successfully implement a whole-school reform model differ in
unobserved ways from schools that lack that capacity, or from a random selection of comparison
schools, then the OLS estimates presented below may be biased. Consequently, the results that
follow must be regarded as suggestive, not definitive.
168

7.4.1. The Cohort of Students in Third Grade in 1994-95
Table 7-10 presents the results of our analyses for the cohort of students in third grade in
1994-95. The top panel presents results obtained using the specification in which we replace the
single, dichotomous treatment variable with a set of two dichotomous variables—one indicating
attendance at a strong implementer and one indicating attendance at a weak implementer
(specification A). The bottom panel presents impact estimates obtained using the specification in
which the dichotomous variable indicating whether or not the school has decided to adopt is
interacted with a measure of how well the school implemented the model (specification B).
The first column presents the estimated impacts on 1995 reading performance. As in the
corresponding analyses in Table 7-3 we only include SDP adopters in these estimations. The
third column presents estimated impacts on the 1995 math performance. For both reading and
math, the strong implementers show more positive impacts than the weak implementers
(specification A), and the impacts tend to increase as the implementation rating increases
(specification B). For neither reading nor math, however, is their any indication that the
differences in impacts across implementation levels are statistically significant. This lack of
significant differences is not surprising. SDP is not expected to have impacts on student
performance until the school’s new policies and practices have had a chance to influence student
development along other dimensions. Thus this cohort of students may not have had time to
benefit from even well implemented models. Alternatively, we might imagine that a model’s
policies and practices need to be implemented with some minimum level of consistency and
thoroughness before they can substantially affect the learning experiences of the students in a
school. The fact that model impacts in the first few years after model adoption do not vary with
the quality of implementation, suggests that none (or very few) of the schools were able to
achieve this threshold level of consistency and thoroughness during the first year of
implementation.
169
The second and fourth columns of Table VII-10 present the estimated impacts on the
1997 (i.e. fifth-grade) performance of this cohort of students. Since value-added estimates
represent the impacts realized during the 1996-97 school year, we use measures of SDP
implementation taken from 1997 only. For SFA we used an average of the implementation
ratings obtained from assessments conducted during the fall of 1996 and the spring of 1997.
For SDP, estimates from both specifications again suggest that strong implementation of
the model had more positive impacts than weak implementation of the model. In this case, the
differences between the impacts of strong implementation and weak implementation in
Specification A are statistically significant. Strong implementation appears to have had
significantly positive impacts on math performance. These results suggest that schools that were
able to faithfully implement the SDP model began to offer improved educational experiences for
their students by 1996-97. These impacts were not detected in the analysis above because
similarly positive impacts were not realized in schools where implementation less successful.
For SFA, the results are more ambiguous. In the case of reading, impacts appear to be
virtually the same across different levels of implementation. For math, impacts appear to become
less negative as the quality of implementation increases. Given that SFA focuses primarily on
reading, it is unclear why the quality of implementation would matter for math when it does not
matter for reading. One possibility is that SFA did in fact help students improve their reading
skills, but that the citywide reading assessment was not sensitive to these improvements. These
undetected improvements in reading, in turn, had salutary effects on student math performance.
Another possibility is that schools that did a better job implementing SFA were already more
effective in teaching math than schools that did a poor job implementing SFA prior to any of the
decisions to adopt SFA.
170
7.4.2. The Cohort of Students in Third Grade in 1996-97
Table 7-11 presents the results of our analyses for the cohort in third grade in 1996-97.
The first and third columns examine the third-grade performance of these students. Because test
scores prior to third grade are not available for this cohort, the estimates presented in these
columns were obtained using a levels-type specification of the student performance equation. In
a levels-type specification, impact estimates represent the cumulative impacts of a model over
the average number of years students in the treatment group have been exposed to the model.
Because the quality of implementation over a number of years might influence a model’s
cumulative impacts, we used the average of all implementation ratings prior to 1997 in these
estimations. This means that, we used an average of the 1995 and 1997 SDP ratings, and SFA
implementation ratings from fall 1996 and spring 1997.
The estimates in the first and third column again suggest that strong implementation of
SDP had more positive impacts than weak implementation of SDP on both math and reading
scores. The estimates in the bottom panel of Table 7-11 indicate that a one-unit increase in the
quality of implementation is associated with 5.67-NCE increase in student reading performance
and a 8.98-NCE increase in student math performance. Both of these estimates are statistically
significant. The standard deviation in implementation ratings across the SDP schools in our
sample is 0.509, which means a one-unit increase in the quality of implementation is equivalent
to two standard deviations. Thus, a two-standard-deviation increase in the quality of SDP
implementation is associated with a 0.27-standard-deviation increase in the third-grade reading
performance and a 0.43-standard-deviation increase in the third-grade math performance of this
cohort. Of course, with no lagged measure of student performance included in these estimations
and no instruments used to control for potential self-selection of schools these estimates are
particularly susceptible to potential selection biases. If stronger implementers tend to have higher
performing students (controlling for observed student characteristics) or were more effective
171
schools prior to the decision to adopt, then these differences between strong and weak
implementers cannot be attributed to SDP.
Strong implementation of SFA also is associated with more positive (less negative)
impacts than weak implementation of SFA, although the differences are statistically significant
only for math. The estimates in the bottom of Table 7-11 indicate that a one-unit increase in the
quality of implementation increases student reading scores by 2.73 NCEs and math scores by
4.18 NCEs. The standard deviation for the implementation ratings used here is 0.467, which
implies that a two-standard-deviation increase in implementation quality is associated with a
0.13-standard-deviation increase in reading performance and a 0.20-standard-deviation increase
in math performance. It is not clear whether these estimates reflect the possibility that schools
more able to implement SFA have more able students (controlling for observable factors), the
possibility that more effective schools are better able to implement SFA, or the possibility that
SFA have a positive impact.
The second and fourth columns of Table 7-11 show the estimated impacts of whole-
school reform on the 1999 (fifth-grade) performance of this cohort of students. These estimates
are from a value-added specification of the student performance equation, which control for
student performance in the prior year, and thus, might be less susceptible to some of the
problems that might arise with the estimates in Columns (1) and (3). Since these estimates
represent the impacts of whole-school reform during the 1998-99 school year, we use measures
of implementation from that year only in the empirical specification of the student performance
equation.
For SDP, stronger implementation continues to show more positive impacts than weaker
implementation. However, the difference that a one-unit increase in implementation quality
makes is much smaller and is no longer statistically significant. For SFA, strong implementation
actually leads to more negative impacts on reading performance than does weak implementation.
172

One explanation for this is that schools that more faithful follow the SFA prescriptions are forced
to divert more resources from the later elementary school grades than do those schools that
implement the SFA prescriptions less completely. However, the differences between strong
implementation and weak implementation are not statistically significant in either specification
A or B. Strong implementation of SFA still shows more positive impacts on math than does
weak implementation, but the differences are much smaller than in Column (3).
Why higher quality of implementation is associated with significantly higher student test
scores in the 1997 analysis, but not in the 1999 analysis is unclear. One possibility, is that
policies and practices advocate by SDP and SFA have greater positive impacts during the early
elementary school grades, and that these positive impacts are not compounded by similar impacts
in the later elementary grades. A second possibility is that using a value-added specification of
the student performance equation provides more adequate control for differences in student
ability across strong and weak implementers. The latter possibility suggests that the estimated
impacts of increased implementation quality in Columns (1) and (3) might be spurious.
7.4.3. The Cohort of Students in Third Grade in 1998-99
Table 7-12 presents estimated impacts of whole-school reform on the third grade
performance for the cohort in third grade in 1998-99. Because prior measures of student
performance are not available, a levels-type specification of the student performance equation
was used for this analysis. Since most of the treatment group students in this cohort attended a
whole-school reform school during the years 1995-96 or 1996-97 through 1998-99, an average of
all implementation measures between 1996 and 1999 were used in these estimations.
For both SDP and SFA, for both math and reading, and in both specifications, strong
implementation shows more positive impacts than weak implementation. In each case, the
differences between strong and weak implementation appear to be substantial. However, because
of imprecision in some of the estimates, differences are only significant for SFA in specification
173
B. The point estimates in the bottom panel of Table 7-12 imply that a 2-standard-deviation
increase in the quality with which SDP is implemented is associated with a 0.12-standard-
deviation increase in reading scores and a 0.13-standard-deviation increase in math scores. For
SFA, these estimates indicate that a two-standard-deviation increase in implementation quality is
associated with a 0.13-standard-deviation increase in reading scores and a 0.19-standard-
devaiation increase in math scores.
It seems reasonable to expect that the quality of implementation would make the biggest
difference for this cohort of students. These students were exposed to the models several years
after the initial decision to adopt. If the effects of implementation are cumulative, then we would
expect the quality of implementation to have its greatest effects during these years. Also, these
students were exposed to the models during the early elementary school grades, which is
arguably when these models have the greatest impact (particularly for SFA). That the quality of
implementation does appear to make the largest difference for this group is, then, suggestive. It
suggests that the lack of consistent impacts for these models is the result of inconsistent
implementation, rather than the inefficacy of the policies and practices advocate by the models.
Because they do not deal with potential selection bias, however, these results can only be
regarded as suggestive.
7.4.4. Summary
Perhaps more than anything, the analyses in this section demonstrate the difficulty of
testing the hypotheses underlying whole-school reform models in a quasi-experimental
evaluation of this kind. The variables used to identify exogenous variation in the decision to
adopt a whole-school reform model were not appropriate instruments for variation in the quality
of implementation. This is unfortunate because there is reason to suspect that OLS estimates of
the influence of implementation quality may be more susceptible to selection bias than estimates
of the impact of the decision to adopt. It is not implausible to think that observed student
174
characteristics and school resources can control for most of the differences between the schools
that adopt whole-school reforms and those that do not. However, it is more difficult to argue that
there are not important, unobserved differences between schools with the capacity to implement
a whole-school reform model and those lacking that capacity. Thus, definitive identification of
the impacts of implementation quality requires some method of addressing the selection bias
issue.
Nevertheless, the results in this section are suggestive. For SDP, stronger implementation
shows more positive impacts than weak implementation in all cases, that is, for all cohorts, in all
grades, for both reading and math, and in both specifications. These differences between strong
and weak implementation, however, are not always statistically significant. The positive
relationship between implementation quality and model impact is consistent with the hypotheses
that when SDP prescriptions are faithfully implemented the educational experience of students is
improved, and that the lack of consistent impacts, on average, across SDP adopters is due to
inconsistent implementation.
The results for Success for All are more ambiguous. In none of the estimates obtained
from value-added specifications of the student performance equation did the impact of SFA on
reading vary significantly with the quality of implementation. Value-added estimates of the
impact on math did vary with implementation quality. However, given SFA’s focus on reading
and its failure to show positive impacts on reading even in schools achieving high levels of
implementation, it seems likely that higher math performance in stronger implementers is due to
preexisting differences between schools with the capacity to implement and those that lack that
capacity. Nonetheless, the estimates from levels-type specification of the student performance
equation indicate that students in schools that achieved high levels of implementation score
higher than similar students in SFA schools that had less success implementing the model,
particular among third graders in 1998-99. This suggests that when SFA’s prescriptions are
175
properly implemented, the model can help to improve the performance of students in the lower
elementary school grades, and that difficultly implementing SFA might explain the inconsistent
effects across the New York City schools in our sample.
176
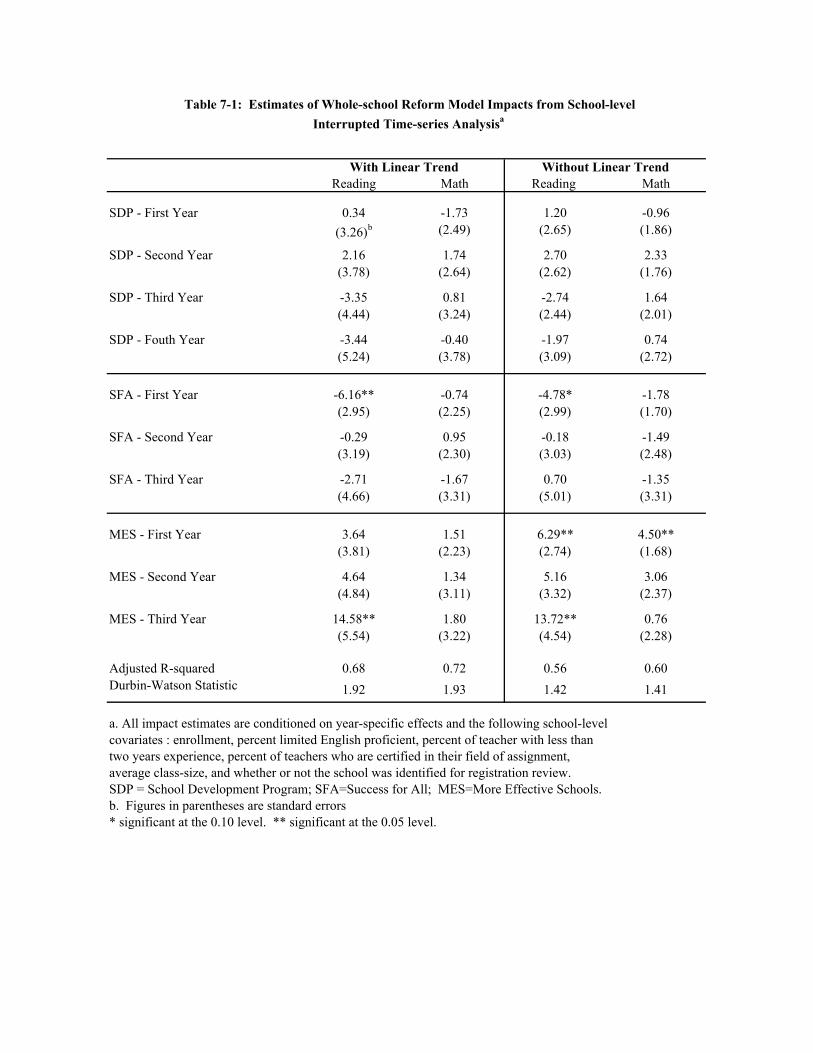
With Linear Trend Without Linear TrendReading Math Reading Math
SDP - First Year 0.34 -1.73 1.20 -0.96(3.26)b (2.49) (2.65) (1.86)
SDP - Second Year 2.16 1.74 2.70 2.33(3.78) (2.64) (2.62) (1.76)
SDP - Third Year -3.35 0.81 -2.74 1.64(4.44) (3.24) (2.44) (2.01)
SDP - Fouth Year -3.44 -0.40 -1.97 0.74(5.24) (3.78) (3.09) (2.72)
SFA - First Year -6.16** -0.74 -4.78* -1.78(2.95) (2.25) (2.99) (1.70)
SFA - Second Year -0.29 0.95 -0.18 -1.49(3.19) (2.30) (3.03) (2.48)
SFA - Third Year -2.71 -1.67 0.70 -1.35(4.66) (3.31) (5.01) (3.31)
MES - First Year 3.64 1.51 6.29** 4.50**(3.81) (2.23) (2.74) (1.68)
MES - Second Year 4.64 1.34 5.16 3.06(4.84) (3.11) (3.32) (2.37)
MES - Third Year 14.58** 1.80 13.72** 0.76(5.54) (3.22) (4.54) (2.28)
Adjusted R-squared 0.68 0.72 0.56 0.60Durbin-Watson Statistic 1.92 1.93 1.42 1.41
a. All impact estimates are conditioned on year-specific effects and the following school-level covariates : enrollment, percent limited English proficient, percent of teacher with less thantwo years experience, percent of teachers who are certified in their field of assignment, average class-size, and whether or not the school was identified for registration review.SDP = School Development Program; SFA=Success for All; MES=More Effective Schools.b. Figures in parentheses are standard errors* significant at the 0.10 level. ** significant at the 0.05 level.
Table 7-1: Estimates of Whole-school Reform Model Impacts from School-level Interrupted Time-series Analysisa
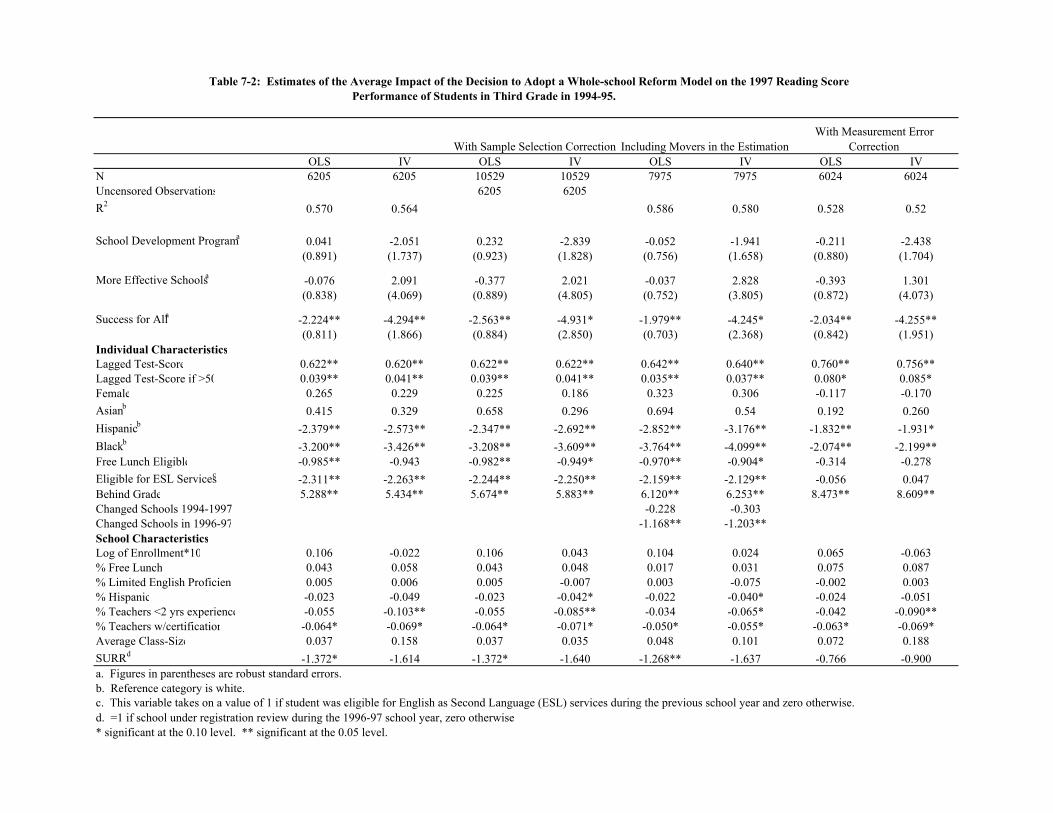
OLS IV OLS IV OLS IV OLS IVN 6205 6205 10529 10529 7975 7975 6024 6024Uncensored Observations 6205 6205R2 0.570 0.564 0.586 0.580 0.528 0.52
School Development Programa 0.041 -2.051 0.232 -2.839 -0.052 -1.941 -0.211 -2.438(0.891) (1.737) (0.923) (1.828) (0.756) (1.658) (0.880) (1.704)
More Effective Schoolsa -0.076 2.091 -0.377 2.021 -0.037 2.828 -0.393 1.301(0.838) (4.069) (0.889) (4.805) (0.752) (3.805) (0.872) (4.073)
Success for Alla -2.224** -4.294** -2.563** -4.931* -1.979** -4.245* -2.034** -4.255**(0.811) (1.866) (0.884) (2.850) (0.703) (2.368) (0.842) (1.951)
Individual CharacteristicsLagged Test-Score 0.622** 0.620** 0.622** 0.622** 0.642** 0.640** 0.760** 0.756**Lagged Test-Score if >50 0.039** 0.041** 0.039** 0.041** 0.035** 0.037** 0.080* 0.085*Female 0.265 0.229 0.225 0.186 0.323 0.306 -0.117 -0.170Asianb 0.415 0.329 0.658 0.296 0.694 0.54 0.192 0.260Hispanicb -2.379** -2.573** -2.347** -2.692** -2.852** -3.176** -1.832** -1.931*Blackb -3.200** -3.426** -3.208** -3.609** -3.764** -4.099** -2.074** -2.199**Free Lunch Eligible -0.985** -0.943 -0.982** -0.949* -0.970** -0.904* -0.314 -0.278Eligible for ESL Servicesc -2.311** -2.263** -2.244** -2.250** -2.159** -2.129** -0.056 0.047Behind Grade 5.288** 5.434** 5.674** 5.883** 6.120** 6.253** 8.473** 8.609**Changed Schools 1994-1997 -0.228 -0.303Changed Schools in 1996-97 -1.168** -1.203**School CharacteristicsLog of Enrollment*10 0.106 -0.022 0.106 0.043 0.104 0.024 0.065 -0.063% Free Lunch 0.043 0.058 0.043 0.048 0.017 0.031 0.075 0.087% Limited English Proficien 0.005 0.006 0.005 -0.007 0.003 -0.075 -0.002 0.003% Hispanic -0.023 -0.049 -0.023 -0.042* -0.022 -0.040* -0.024 -0.051% Teachers <2 yrs experience -0.055 -0.103** -0.055 -0.085** -0.034 -0.065* -0.042 -0.090**% Teachers w/certification -0.064* -0.069* -0.064* -0.071* -0.050* -0.055* -0.063* -0.069*Average Class-Size 0.037 0.158 0.037 0.035 0.048 0.101 0.072 0.188SURRd -1.372* -1.614 -1.372* -1.640 -1.268** -1.637 -0.766 -0.900a. Figures in parentheses are robust standard errors.b. Reference category is white.
d. =1 if school under registration review during the 1996-97 school year, zero otherwise* significant at the 0.10 level. ** significant at the 0.05 level.
c. This variable takes on a value of 1 if student was eligible for English as Second Language (ESL) services during the previous school year and zero otherwise.
Including Movers in the Estimation
Performance of Students in Third Grade in 1994-95.Table 7-2: Estimates of the Average Impact of the Decision to Adopt a Whole-school Reform Model on the 1997 Reading Score
With Sample Selection CorrectionWith Measurement Error
Correction

R2
Lagged Test-Score -0.0002 (.0004)d 0.0001 (.0005) 0.0002 (.0004)Lagged Test-Score if >50 -0.0002 (.0002) 0.0001 (.0002) -0.0002 (.0002)Female -0.0046 (.0063) 0.0099 (.0064) -0.0005 (.0038)Asian -0.025 (.0456) 0.1349* (.0689) 0.1104* (.0605)Hispanic -0.0272 (.0428) 0.0785** (.0295) -0.0108 (.0200)Black -0.0297 (.0456) 0.0735** (.0329) -0.0159 (.0246)Free Lunch Eligible -0.0095 (.0235) 0.0411 (.0443) -0.0128 (.0145)Eligible for ESL Services -0.0178 (.0172) 0.0110 (.0214) 0.0174 (.0180)Behind Grade -0.0220 (.0204) 0.0566** (.0235) -0.0070 (.0177)Log of Enrollment*10 -0.0434** (.0015) 0.0136 (.0155) -0.0066 (.0103)% Free Lunch -0.0007 (.0042) -0.0037 (.0045) -0.0010 (.0030)% Limited English Proficient -0.0011 (.0039) 0.0019 (.0055) 0.0073** (.0031)% Hispanic -0.0020 (.0029) 0.0049 (.0041) -0.0043* (.0025)% Teachers <2 yrs experience -0.0001 (.0050) 0.0078 (.0051) -0.0056 (.0042)% Teachers w/certification 0.0001 (.0033) 0.0035 (.0033) -0.0014 (.0025)Average Class-Size -0.0508** (.0228) -0.0109 (.0285) 0.0125 (.0162)SURR -0.0724 (.0680) 0.1981** (.0725) 0.0397 (.0608)Excluded Instrumentsb
Avg % Free Lunch 0.2313 (.1495) -0.0026 (.1098) 0.5563** (.1721)Avg % Free Lunch Squared 0.0027** (.0013) 0.0003 (.0009) -0.0043** (.0015)Avg % Hispanic 0.0146** (.0032) 0.0084** (.0033) 0.0004 (.0025)Avg. % Teachers<2 yrs experience 1.4078** (.4944) 0.2159 (.4315) -1.1772** (.5541)# of SURRc -0.1170 (.1593) -0.2273 (.1907) -0.1811 (.1377)# of SURR squared 0.0056** (.0029) 0.0104** (.0034) -0.0002 (.0026)Avg % free lunch X avg. % Teachers<2 yrs expAvg % Hispanic X # of SURR -.0029** (.0006) -.0022** (.0007) -0.0007 (.0005)Avg. % Teachers<2 yrs exp X # of SURRPartial F for Excluded InstrumentsProb. > Fa. The results of the second stage equation are presented in column (2) of Table 7-2.b. All averages are unweighted average for other elementary schools in the same community school districtc. Number of schools in the community school districts under registration review, not including this school.d. Figures in parentheses are standard errors.* significant at the 0.10 level. ** significant at the 0.05 level.
Table 7-2A: Results of First Stage Regressions for Two Stage Least Square Procedures a
0.0117* (.0063)
.0127 (.0113) -0.0157* (.0080)
-.0147** (.0057) -.0026 (.0051)
3.02**0.003
-.01268 (.0094)
28.88**0.000
2.98**0.004
SDP MES SFA0.544 0.433 0.512
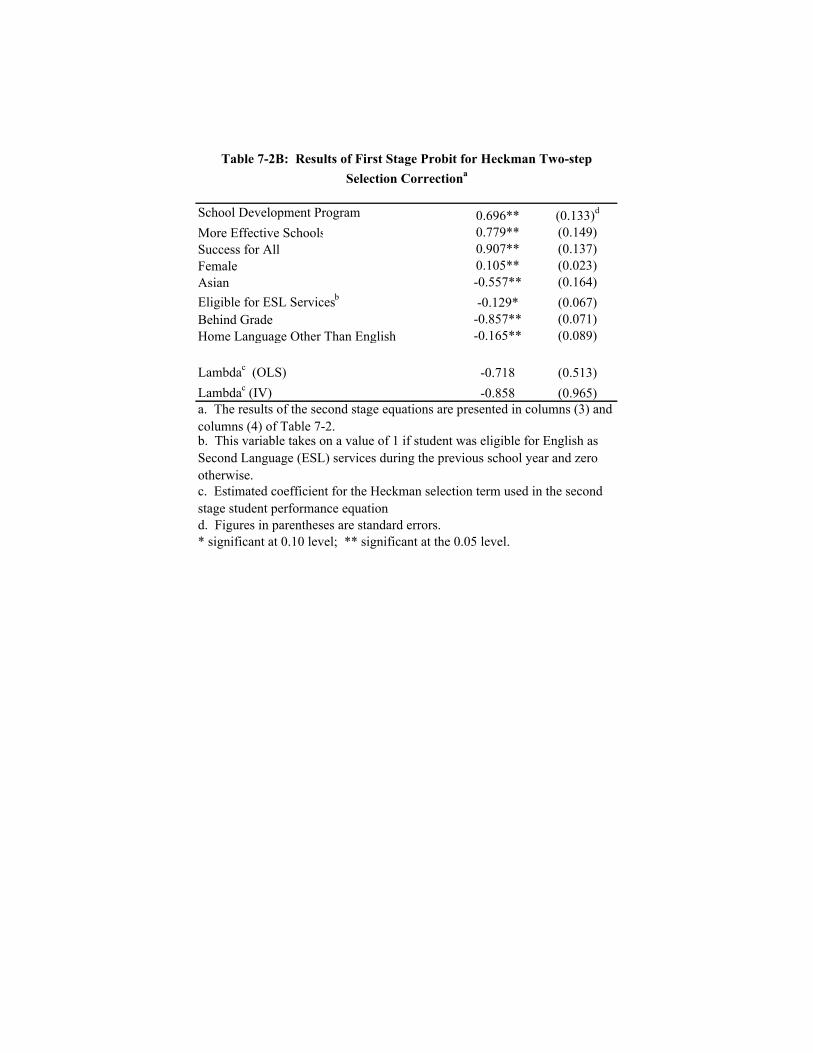
School Development Program 0.696** (0.133)d
More Effective Schools 0.779** (0.149)Success for All 0.907** (0.137)Female 0.105** (0.023)Asian -0.557** (0.164)Eligible for ESL Servicesb -0.129* (0.067)Behind Grade -0.857** (0.071)Home Language Other Than English -0.165** (0.089)
Lambdac (OLS) -0.718 (0.513)Lambdac (IV) -0.858 (0.965)
d. Figures in parentheses are standard errors.* significant at 0.10 level; ** significant at the 0.05 level.
b. This variable takes on a value of 1 if student was eligible for English as Second Language (ESL) services during the previous school year and zero otherwise.
Table 7-2B: Results of First Stage Probit for Heckman Two-step Selection Correctiona
a. The results of the second stage equations are presented in columns (3) and columns (4) of Table 7-2.
c. Estimated coefficient for the Heckman selection term used in the second stage student performance equation
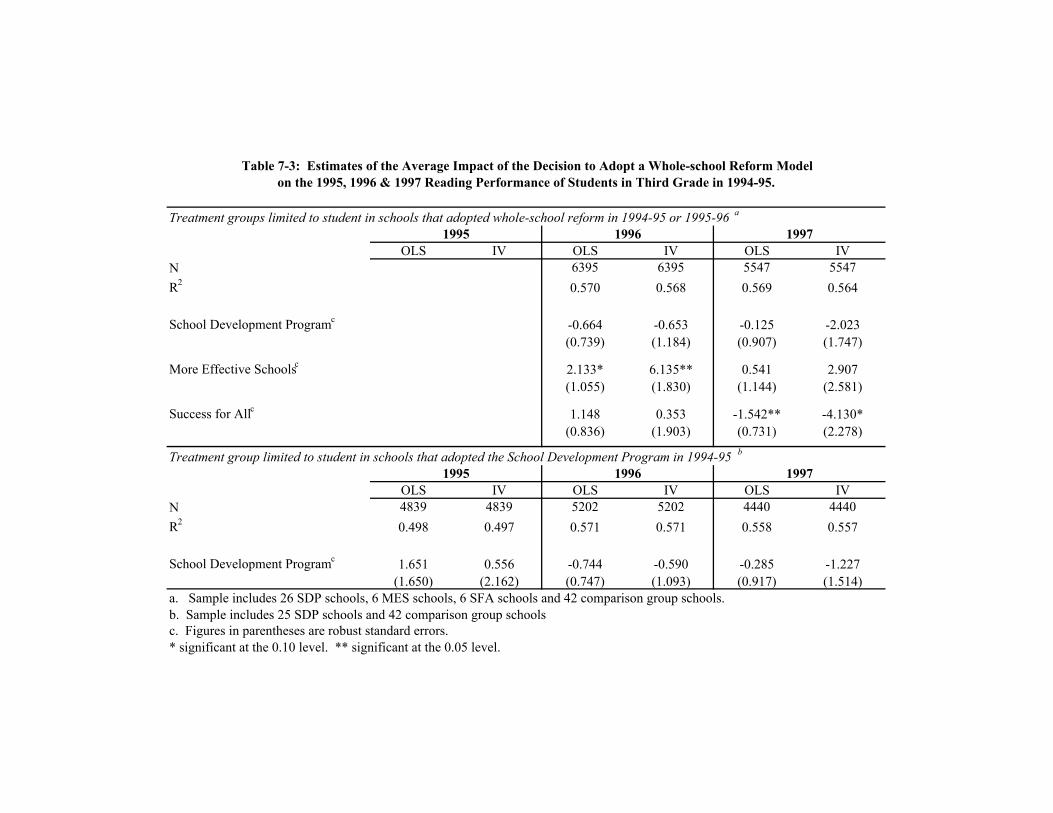
Treatment groups limited to student in schools that adopted whole-school reform in 1994-95 or 1995-96 a
OLS IV OLS IV OLS IVN 6395 6395 5547 5547R2 0.570 0.568 0.569 0.564
School Development Programc -0.664 -0.653 -0.125 -2.023(0.739) (1.184) (0.907) (1.747)
More Effective Schoolsc 2.133* 6.135** 0.541 2.907(1.055) (1.830) (1.144) (2.581)
Success for Allc 1.148 0.353 -1.542** -4.130*(0.836) (1.903) (0.731) (2.278)
Treatment group limited to student in schools that adopted the School Development Program in 1994-95 b
OLS IV OLS IV OLS IVN 4839 4839 5202 5202 4440 4440R2 0.498 0.497 0.571 0.571 0.558 0.557
School Development Programc 1.651 0.556 -0.744 -0.590 -0.285 -1.227(1.650) (2.162) (0.747) (1.093) (0.917) (1.514)
c. Figures in parentheses are robust standard errors.* significant at the 0.10 level. ** significant at the 0.05 level.
Table 7-3: Estimates of the Average Impact of the Decision to Adopt a Whole-school Reform Modelon the 1995, 1996 & 1997 Reading Performance of Students in Third Grade in 1994-95.
a. Sample includes 26 SDP schools, 6 MES schools, 6 SFA schools and 42 comparison group schools.b. Sample includes 25 SDP schools and 42 comparison group schools
1995
1995 1996 1997
1996 1997

Using all treatment group and comparison group students a
OLS IV OLS IV OLS IVd
N 6346 6346R2 0.613 0.609
School Development Program 0.209 -0.570(1.110)e (1.720)
More Effective Schools 2.281* -1.811(1.258) (3.955)
Success for All -1.278 -1.027(1.331) (2.420)
Treatment groups limited to student in schools that adopted whole-school reform in 1994-95 or 1995-96 b
OLS IV OLS IV OLS IVN 6570 6570 5666 5666R2 0.581 0.550 0.617 0.616
School Development Program -0.989 -5.049* 0.130 -0.444(1.160) (2.696) (1.158) (1.817)
More Effective Schools 2.208 15.911 1.013 -2.324(1.758) (10.433) (1.732) (3.532)
Success for All 0.183 -1.544 -0.408 -0.269(1.217) (5.699) (1.604) (2.827)
Treatment group limited to student in schools that adopted the School Development Program in 1994-95 c
OLS IV OLS IV OLS IVN 5410 5410 5321 5321 4512 4512R2 0.441 0.441 0.574 0.572 0.626 0.626
School Development Program 2.894* 1.806 -1.264 0.836 0.202 -0.716(1.550) (2.532) (1.208) (1.921) (1.164) (1.614)
e. Figures in parentheses are robust standard errors.* significant at the 0.10 level. ** significant at the 0.05 level.
d. First stage regression results for these estimates are presented in Table VII-4A
b. Sample includes 26 SDP schools, 6 MES schools, 6 SFA schools and 42 comparison group schools.c. Sample includes 25 SDP schools and 42 comparison group schools
Table 7-4: Estimates of the Average Impact of the Decision to Adopt a Whole-school Reform Modelon the 1995, 1996 & 1997 Math Performance of Students in Third Grade in 1994-95.
1995 1996 1997
a. Sample includes 28 SDP schools, 10 MES schools, 9 SFA schools, and 42 comparison group schools.
1995
1995 1996 1997
1996 1997

OLS IV OLS IV OLS IVN 8340 8340 6846 6846 5758 5758R2 0.057 0.017 0.537 0.525 0.563 0.556
School Development Programa 0.701 -1.818 -0.051 2.781* 0.907 0.905(1.412) (3.257) (0.884) (1.494) (0.795) (1.107)
More Effective Schoolsa 3.336** 16.887** 0.025 -3.848 0.617 2.318(1.667) (6.959) (1.015) (2.946) (0.579) (2.679)
Success for Alla -0.541 3.888 0.511 -2.267 -0.457 -4.088**(1.327) (6.377) (1.085) (2.249) (0.947) (1.966)
Individual CharacteristicsLagged Test-Score 0.607** 0.612** 0.671** 0.668**Lagged Test-Score if >50 0.028** 0.025** -0.001 -0.001Female 4.244** 4.182** 0.540** 0.563** 1.123** 1.161**Asianb 1.450 1.353 1.564 4.055* 6.655** 6.976**Hispanicb -7.342** -8.283** -3.014* -1.295 1.006 0.929Blackb -10.432** -11.927** -3.563* -1.776 -0.688 -0.772Free Lunch Eligible -7.342** -6.575** -1.337** -1.674** -1.280** -1.157Eligible for ESL Servicesc -6.161** -6.393** 0.747 0.672 -1.407** -1.398*Changed Schools in 1996-97 -2.180** -2.141**Behind Grade 5.407** 5.395** 0.006 0.401School CharacteristicsLog of Enrollment*10 -0.060 -0.350 0.088 0.271* 0.162 0.206% Free Lunch -0.127* -0.130 -0.146** -0.065 -0.041 -0.012% Limited English Proficient 0.010 -0.066 0.021 0.067 0.026 0.001% Hispanic -0.021 -0.051 0.013 0.023 -0.015 -0.015% Teachers <2 yrs experience -0.175** -0.175 -0.119** -0.075 -0.085* -0.077% Teachers w/certification -0.094 -0.131 0.022 0.074* 0.048 0.072**Average Class-Size 0.529** 0.889** -0.151 -0.358* -0.058 -0.112SURRd -1.474 -5.427 -1.558** -1.347 -0.289 -0.633a. Figures in parentheses are robust standard errors.b. Reference category is white.
d. =1 if school under registration review during the current school year, zero otherwise* significant at the 0.10 level. ** significant at the 0.05 level.
c. This variable takes on a value of 1 if student was eligible for English as Second Language (ESL) services during the previous school year and zero otherwise.
1997Levels Specification Value-Added Specification Value-Added Specification
Table 7-5: Estimates of the Average Impact of the Decision to Adopt a Whole-school Reform Model on the 1997, 1998 & 1999 Reading Performance of Students in Third Grade in 1996-97
1998 1999

OLS IV OLS IV OLS IVN 9158 9158 7376 7376 5940 5940R2 0.070 0.070 0.589 0.582 0.615 0.608
School Development Programa 0.538 0.681 0.832 0.875 0.132 1.461(1.641) (2.198) (1.049) (1.862) (0.748) (1.358)
More Effective Schoolsa 4.051* 3.539 -1.907 -8.098* 1.130 -1.878(2.292) (3.748) (1.849) (4.193) (0.683) (2.185)
Success for Alla -1.826 -1.372 -1.353 -1.274 1.473** -0.868(1.506) (2.954) (1.261) (2.423) (0.719) (1.644)
Individual CharacteristicsLagged Test-Score 0.688** 0.695** 0.552** 0.544**Lagged Test-Score if >50 0.077** 0.077** 0.029** 0.032**Female -0.301 -0.303 -0.313 -0.309 0.502* 0.514*Asianb 7.034** 7.124** 4.189* 5.013** 3.411* 4.158**Hispanicb -7.682** -7.603** -0.439 -0.156 -0.110 -0.017Blackb -10.066** -9.986** -2.633* -2.351* -0.850 -0.776Free Lunch Eligible -7.339** -7.369** -1.088 -1.493* -1.455** -1.953**Eligible for ESL Servicesc -8.459** -8.464** -1.391 -1.356 -0.881 -1.025Changed Schools in 1996-97 -5.098** -5.104**Behind Grade 9.326** 9.560** 1.619 1.853School CharacteristicsLog of Enrollment*10 -0.071 -0.058 0.364* 0.411* 0.089 0.212% Free Lunch -0.140 -0.141* -0.128* -0.111 0.027 0.077% Limited English Proficient 0.066 -0.068 -0.011 0.078 -0.019 0.009% Hispanic -0.056 -0.053 0.034 0.023 0.025 0.031% Teachers <2 yrs experience -0.197** -0.193* -0.072 -0.051 -0.056 -0.050% Teachers w/certification -0.057 -0.058 0.045 0.055 0.029 0.058Average Class-Size 0.751** 0.736** -0.358* -0.455* -0.053 -0.264SURRd -3.142** -3.066* -0.033 0.861 -0.581 -0.799a. Figures in parentheses are robust standard errors.b. Reference category is white.
d. =1 if school under registration review during the current school year, zero otherwise* significant at the 0.10 level. ** significant at the 0.05 level.
Table 7-6: Estimates of the Average Impact of the Decision to Adopt a Whole-school Reform Model on the
1998 19991997
1997, 1998 and 1999 Math Perforamnce of Students in Third Grade in 1996-97
c. This variable takes on a value of 1 if student was eligible for English as Second Language (ESL) services during the previous school year and zero otherwise.
Levels Specification Value-Added Specification Value-Added Specification

Reading MathN 8567 9302R2 0.058 0.069
School Development Programa 1.936 3.342**(1.245) (1.324)
More Effective Schoolsa 2.872** 2.489(1.361) (1.544)
Success for Alla 0.667 0.295(1.265) (1.680)
Individual CharacteristicsFemale 3.325** 0.353Asianb 2.066 3.962Hispanicb -3.523 -3.621*Blackb -5.034** -6.326**Free Lunch Eligible -3.892** -3.097**Eligible for ESL Servicesc -6.091** -8.091**Changed Schools between 1996 & 1999 0.583 -0.899*Changed Schools in 1998-99 -2.323** -3.232**School CharacteristicsLog of Enrollment*10 -0.205 -0.170% Free Lunch -0.208** -0.211**% Limited English Proficient 0.103 0.055% Hispanic -0.025 -0.011% Teachers <2 yrs experience -0.146** -0.117*% Teachers w/certification 0.052 0.056Average Class-Size 0.142 0.274SURRd -2.371** -3.041**a. Figures in parentheses are robust standard errors.b. Reference category is white.
d. =1 if school under registration review during 1998-99, zero otherwise* significant at the 0.10 level. ** significant at the 0.05 level.
c. This variable takes on a value of 1 if student was eligible for English as Second Language (ESL) services during the previous school year and zero otherwise.
Table 7-7: Estimates of the Average Impact of the Decision to Adopt aWhole-school Reform Model on the 1999 Performance of Students in Third
Grade in 1998-99

Readinga Matha
N 8567 9302R2 0.059 0.070
SDP - Year One 1.516 1.542(1.636) (1.755)
SDP - Year Two 2.270 3.177*(1.854) (1.636)
SDP - Year Three 0.968 3.071*(1.349) (1.652)
SDP - Year Four 1.493 2.768*(1.344) (1.429)
MES - Year One -1.039 -0.020(1.885) (1.417)
MES - Year Two 0.094 -1.174(1.414) (1.696)
MES - Year Three 3.168* 2.488(1.812) (1.882)
MES - Year Four 2.996 3.186(2.071) (2.019)
SFA - Year One -1.623 -3.043*(1.325) (1.779)
SFA - Year Two -3.781* -2.220(2.166) (2.304)
SFA - Year Three 1.401 0.572(2.315) (1.607)
SFA - Year Four 1.389 2.884(1.342) (2.480)
a. Figures in parentheses are robust standard errors.* significant at the 0.10 level. ** significant at the 0.05 level.
Table 7-8: Estimated Impacts of the Decision to Adopt a Whole-school Reform Model on the 1999 Performance of Students in
Third Grade in 1998-99 (By Number of Years Student has been Exposed)

OLS IV OLS IV OLS IV OLS IV
On the Reading ScoresSDP Third Gradea 0.701 1.936 Fourth Gradeb -0.664 -0.653 -0.051 2.781* Fifth Gradeb 0.041 -2.051 0.907 0.905MES Third Gradea 3.336** 2.872**
Fourth Gradeb 2.133* 6.135** 0.025 -3.848 Fifth Gradeb -0.076 2.091 0.617 2.318SFA Third Gradea -0.541 0.667 Fourth Gradeb 1.148 0.353 0.511 -2.267 Fifth Gradeb -2.224** -4.294** -0.457 -4.088**
On the Math ScoresSDP Third Gradea 0.538 3.342** Fourth Gradeb -0.989 -5.049* 0.832 0.875 Fifth Gradeb 0.209 -0.570 0.132 1.461MES Third Gradea 4.051* 2.489 Fourth Gradeb 2.208 15.911 -1.907 -8.098* Fifth Gradeb 2.281* -1.811 1.130 -1.878SFA Third Gradea -1.826 0.295 Fourth Gradeb 0.183 -1.544 -1.353 -1.274 Fifth Gradeb -1.278 -1.027 1.473** -0.868
* significant at the 0.10 level. ** significant at the 0.05 level.
Table 7-9: A Summary of the Estimated Impacts of Whole-school Reform
a. Estimates are from levels specification of the student performance equation and are interpreted as the cumulative impact of each model over the average length of time the students in the treatment group have been attending a school that has adopted the model. (Precise estimates for this specification could not be obtained using the IV estimator)
b. Estimates are from value-added specification of the student performance equation and are interpreted as the impact of each model on the gains made during the year specified.
1998 199919971996

1995 1997 1995 1997N 4839 6205 5410 6346R-squared 0.498 0.571 0.443 0.615
SDP - Strong Implementation 2.365 1.491 5.295** 3.357**(1.868)a (1.200) (1.951) (1.632)
SDP - Weak Implementation 0.507 -1.543 2.029 -1.901(2.421) (1.150) (2.352) (2.083)
SFA - Strong Implementation -2.337** -0.961(1.020) (2.017)
SFA - Weak Implementation -2.061** -1.488(0.882) (1.132)
1995 1997 1995 1997N 4839 6205 5410 6346R-squared 0.498 0.570 0.441 0.614
SDP 1.786 0.039 2.961* 0.254(1.729) (0.887) (1.540) (1.105)
SDP*Implementation Rating 1.015 0.906 0.590 2.440(2.900) (0.930) (3.707) (2.293)
SFA -2.241* -1.386(0.847) (1.090)
SFA*Implementation Rating 0.262 3.975**(1.022) (1.765)
a. Figures in parentheses are robust standard errors.* significant at the 0.10 level. ** significant at the 0.05 level.
Value-Added OLS Value-Added OLS
Specification A
Specification B
Value-Added (OLS) Value-Added (OLS)
Reading Math
Table 7-10: Estimates of Whole-School Reform Model Impacts on the Performance of Students in Third Grade in 1994-95, Controlling for Quality of Implementation
Reading Math

Levels Value-Added Levels Value-Added(OLS) (OLS) (OLS) (OLS)1997 1999 1997 1999
N 8340 5758 9158 5940R-squared 0.058 0.564 0.075 0.615
SDP - Strong Implementation 2.040 1.226 4.389 0.655(2.547)a (1.162) (2.854) (1.148)
SDP - Weak Implementation -0.532 -0.934 -0.751 -0.102(2.065) (1.162) (2.304) (1.581)
SFA - Strong Implementation 0.522 -1.240 0.421 1.854**(1.282) (1.410) (1.443) (0.726)
SFA - Weak Implementation -2.182 -0.262 -4.086** 0.802(1.707) (0.667) (1.342) (0.788)
Levels Value-Added Levels Value-Added(OLS) (OLS) (OLS) (OLS)1997 1999 1997 1999
N 8340 5758 9158 5940R-squared 0.060 0.564 0.077 0.615
SDP 1.010 0.825 0.989 0.111(1.325) (0.785) (1.479) (0.751)
SDP*Implementation Rating 5.673** 1.694 8.977** 0.660(2.121) (1.105) (2.078) (1.329)
SFA -0.730 -0.541 -2.068 1.446**(1.311) (0.939) (1.330) (0.658)
SFA*Implementation Rating 2.728 -0.587 4.181** 0.673*(1.759) (0.574) (1.780) (0.377)
a. Figures in parentheses are robust standard errors.* significant at the 0.10 level. ** significant at the 0.05 level.
Math
Table 7-11: Estimates of Whole-School Reform Model Impacts on the Performance of Students in Third Grade in 1996-97, Controlling for Quality of Implementation
Reading MathSpecification A
Specification BReading

Reading MathLevels (OLS) Levels (OLS)
1999 1999N 8567 9302R-squared 0.059 0.069
SDP - Strong Implementation 2.704 4.080(2.517)a (2.690)
SDP - Weak Implementation 1.663 1.885(0.878) (2.013)
SFA - Strong Implementation 0.878 1.171(1.149) (2.307)
SFA - Weak Implementation -0.214 -1.433(1.748) (1.824)
Reading MathLevels (OLS) Levels (OLS)
1999 1999N 8567 9302R-squared 0.060 0.072
SDP 2.026 3.446**(1.256) (1.332)
SDP*Implementation Rating 2.577 2.764(2.145) (2.558)
SFA 0.599 0.322(1.132) (1.335)
SFA*Implementation Rating 2.953** 4.394**(0.810) (1.982)
a. Figures in parentheses are robust standard errors.* significant at the 0.10 level. ** significant at the 0.05 level.
Table 7-12: Estimates of Whole-School Reform Model Impacts on the Performance of Students in Third Grade in 1998-99, Controlling for
Quality of Implementation
Specification A
Specification B

Chapter 8: Conclusions
8.1 Benefits from a Quasi-Experimental Design
Our first main conclusion concerns the broad approach to studying the impacts of whole-
school reform. Although many studies have touted random assignment as the best method (or
even the only legitimate method) for determining whether whole-school reform boost student
performance, we conclude that quasi-experimental designs, such as the one used in this report,
have several key advantages over random assignment. First, studies based on random assignment
are difficult to set up and almost inevitably are restricted to a small number of schools; after all, a
school must agree to participate in the study without knowing whether it will be a treatment site.
Quasi-experimental designs face no such limitation, as demonstrated by our analysis of 49
schools that adopted a whole-school reform model.
Second, studies based on random assignment are almost inevitably studies of
demonstration sites, that is, sites that are intended to show what happens when a whole-school
reform model is fully and carefully implemented by the model developers. Because each school
cannot possibly receive so much attention in a large-scale implementation of whole-school
reform, which will be required if whole-school reform is to have a major impact, a study based
on random assignment cannot reveal what will happen with a large-scale implementation. A
related advantage of a quasi-experimental design is that it can observe variation in the quality of
implementation and therefore, at least in principle, determine the extent to which the impact of a
whole-school reform model depends on the care with which that model is implemented.
8.2 The Need to Correct for Missing Test Scores
Another important issue raised by our research is that any study based on test scores for
individual students should recognize and correct for the problem of missing test scores. In our
data set, many students are missing at least one test score. In most cases, a missing test score
indicates that the student did not take that particular test that year, either because of an absence

on the relevant day or because of some kind of exemption. The analysis must be conducted, of
course, only on students with a complete set of test scores, so one must be concerned about
selection bias that might arise because of differences between treatment and comparison schools
in the share and type of students who take all their tests. Our approach is to develop and estimate
a model that explains whether a student takes all the relevant tests and to use this model to
correct for potential selection bias. All of our equations to determine the impact of whole-school
reform are estimated with and without this selection correction. We find that in most cases this
correction does not significantly alter our estimates of program impacts.
8.3 The Need to Consider Implementation Quality
Because whole-school reform models involve the cooperation of so many actors within a
school, from teachers to administrators to parents, program implementation is a very challenging
topic to study. In this project, we make a contribution to an understanding of program
implementation by developing several measures of program implementation. In particular, we
examine the diffusion of key components of whole-school reform models into comparison-group
schools, and we develop summary measure of program implementation in treatment-group
schools. The summary measures provide a way to observe variation in implementation across the
elementary schools adopting the School Development Program (SDP) or Success for All (SFA).
The analysis of diffusion, which is based on surveys conducted for this project, reveals
that key elements of SDP are widely used by both treatment and comparison schools. In fact,
SDP schools are no more likely to implement some of these elements than are comparison group
schools. Under these circumstances, an analysis of SDP may understate the impact of these
elements on student performance. Moreover, schools affiliated with the More Effective Schools
(MES) program actually rank higher on many of these program elements than SDP schools. In
contrast, the reading programs associated with SFA are well implemented in SFA schools but are
not widely dispersed elsewhere.
192

The analysis of implementation in SDP and SFA schools, which is based on surveys
conducted by the program developers, indicates a steady increase in model implementation in the
first 3 to 5 years of the program. However, there is wide variation in implementation across
schools, particularly during the early years of implementation and for specific model elements,
and some of the measures are difficult to compare across time. Schools clearly gain experience in
how to implement these programs, but some schools still are able to implement the programs
more fully than are others.
8.4 Dealing with Potential Self-Selection Bias
The key challenge facing a study of whole-school reform that does not involve random
assignment is to deal with the potential bias that can arise because each school must decide for
itself whether to adopt a whole-school reform. In more technical terms, the school’s decision
about whether to adopt whole-school reform leads a possible correlation between unobserved
school characteristics and student performance, a correlation that can lead to bias in any estimate
of the impact of whole-school reform. We argue that the best way to estimate the impact of
whole-school reform under these circumstances is with a difference-in-difference estimator,
which accounts for the unobserved fixed factors and the unobserved linear time trend for each
school. In other words, this approach eliminates the possibility of self-selection bias from any
factor except unobserved nonlinear time trends at each school.
The problem that arises in our study, and in most other studies of whole school reform, is
that we do not have enough data to implement a difference-in-difference estimator for many of
the students in our sample. To deal with this problem, we follow a three-step strategy. First, we
identify alternative methods that can be estimated with data available for other cohorts. Second,
we compare the estimated impacts from these methods with the estimated impacts from the
difference-in-difference method for the cohort with the most complete data. Under the
assumption that the difference-in-difference estimate is unbiased, any differences between this
193

method and other methods are signs of bias. Third, we identify the methods that yield the impact
estimates closest to impact estimates from the difference-in-difference method, that is, the
methods that are the least biased. The methods identified in this way are, of course, the ones we
rely upon to estimate program impacts for cohorts with incomplete data.
We find that OLS regressions produce biased results, even in a “value-added”
specification, which includes a previous test score. We also find, however, that there is much less
evidence of self-selection bias in a value-added specification when an instrumental variables
procedure is used to account for the endogeneity of the decision to adopt a whole-school reform
model. Moreover, the bias can be lowered still further by treating the previous test score as
endogenous. Indeed, this approach almost always yields the same inferences as the difference-in-
difference approach.
These findings lead us to rely on a value-added, instrumental-variables procedure when
the data are not available for a difference-in-difference estimator. Our results also should give
some comfort to other scholars studying whole-school reform who do not have enough data for a
difference-in-difference approach, but who can use instrumental variables.
8.5 Whole-School Reform and Student Performance
We estimate the impact of whole-school reform for the three whole-school reform models
(SDP, MES, and SFA) for three different student cohorts. SDP does not have a discernible
impact on student performance until 1998 or 1999, four or five years after the initial decision to
adopt. The most favorable estimates indicate that by 1999, third graders who attended a SDP
school for an average of 3.38 years were scoring 0.16 standard deviations higher in math than
would have been expected in the absence of the decisions to adopt the School Development
Program. In keeping with the claims of model developers, these results suggest that it may take
several years before efforts to implement SDP begin to influence student performance. Even
several years after implementation, however, the estimated positive impacts are small and are not
194
robust across estimation methods. To some degree, the small magnitude of these estimated
impacts may reflect our finding, discussed above, that some elements of SDP are widely used in
comparison schools.
We find some evidence that the decision to adopt MES had a positive impact on reading
performance during the 1995-96 and 1996-97 school years across all grade levels (except grade
5). These impacts were partially offset by negative impacts during the 1997-98 school year.
Analyses of math performance show a similar pattern of results, but estimated impacts on math
scores tend not to be statistically significant. This pattern might be explained by the fact that
MES trainers were actively engaged with adopting schools only during the 1995-96 and 1996-97
school years. In other words, the positive impacts of MES adoption on student performance may
reflect the involvement of MES trainers in adopting schools rather than sustainable changes in
school operations.
We find that SFA has a negative impact on the fifth-grade reading gains of both the
cohort in third grade during 1994-95 and the cohort in third grade in 1996-97. We also find
indications of negative impacts on the reading and the math performance of students who were in
third grade in 1998-99 and who spent only second and/or third grade in a SFA school. We did
not find evidence that the decision to adopt SFA had any significant, positive impacts on
performance to offset these losses. SFA focuses on reading in the early grades. These findings
suggest that the decision to adopt SFA may have lowered performance in the later grades (3 to 5)
by diverting attention and resources away from theses grades towards earlier ones (K to 2).
These results are not very encouraging. Taken as a whole, they indicate that the massive
experimentation with whole-school reform in New York City has done little to boost the
performance of students in low-performing schools. We find some positive impacts from SDP on
math performance after several years of implementation, but these impacts are small and do not
appear in all of our estimations. A somewhat more hopeful possibility, which we cannot directly
195
test, is that the small estimated impact from the formal adoption of SDP reflects the diffusion of
SDP practices into comparison schools. We also find some positive impacts from MES on both
math and reading, but these impacts appear to depend on the active involvement of the MES
trainers and start to disappear when the participating schools are left on their own. Finally, we
find that the impacts of SFA are actually negative. The most likely explanation for this finding is
that SFA results in a reallocation of resources away from grades 3 through 5 toward the earlier
grades. We cannot estimate the impact of SFA in the earlier grades, but our findings indicate that
if it does have a positive impact in those grades, this impact is offset, or more than offset, by it
negative impact later on.
8.6 Implementation Quality and the Impact of Whole-School Reform
These results lead directly to the issue of implementation. Are the small impacts of these
whole-school reform models on student performance a reflection of poor implementation of
these models by school officials? We explore this question for two of these models, SDP and
SFA, for which we have extensive information on implementation quality developed by the
program sponsors.
In the case of SDP, we find that program impacts were unambiguously higher in schools
with higher quality program implementation. This result holds for all cohorts, in all grades, for
both reading and math, and for two different ways of measuring implementation quality. These
findings are consistent with the possibility that better implementation would boost program
impacts, but we cannot rule out the alternative possibility that schools more able to implement
elements of the SDP model were already more effective schools before program adoption. The
results for SFA are more ambiguous, but we find some evidence consistent with the view that
more effective implementation of SFA’s prescriptions is associated with more positive impacts
on student performance. This suggests that the poor performance of SFA in New York City
might reflect problems that arose in program implementation. By the end of the sample period,
196
however, the vast majority of SFA schools were given high implementation ratings by the SFA
developers, so there does not appear to be much room for improvement on this front.
Overall, our results indicate that whole-school reforms may have small positive impacts
on student performance, but low-performing schools should not expect whole-school reform to
be a panacea. In addition, any school deciding to adopt a whole-school reform model should
recognize that careful, sustained implementation may be necessary for positive program impacts
to emerge.
197

References Barnett, W. Steven. 1996. “Economics of School Reform: Three Promising Models.” In Helen
F. Ladd (ed.), Holding Schools Accountable: Performance-Based Reform in Education. Washington, DC: The Brookings Institution.
Berends, Mark, Sheila Nataraj Kirby, Scott Naftel, and Christopher McKelvey. 2001.
Implementation and Performance in New American Schools. Santa Monica, CA: RAND. Bifulco, Robert. Forthcoming (a). “Can Whole-School Reform Improve the Productivity of
Urban Schools: The Evidence on Three Models.” In Christopher Roelke, and Jennifer King Rice (eds.), Fiscal Issues in Urban Schools. Greenwich, CT: Information Age Publishing.
Bifulco, Robert. Forthcoming (b). “Estimating The Impacts of Whole-School Reform Models:
A Comparison of Methods.” Evaluation Review. Bifulco, Robert. 2001. “Do Whole-School Reform Models Boost Student Performance:
Evidence from New York City.” Unpublished Ph.D. Dissertation, Syracuse University. Bifulco, Robert. 2000. “Do Whole-School Reform Models Boost Student Performance: An
Evaluation Design for the Case of New York City.” Presented at the Annual Conference of the American Education Finance Association, March.
Bifulco, Robert, William Duncombe, and John Yinger. 2000. “Do Whole-School Reform
Models Boost Student Performance: Preliminary Results from New York City.” Presented at the Annual Conference of the Association of Public Policy Analysis and Management, November.
Bloom, Howard S. 2001. Measuring the Impacts of Whole-School Reforms: Methodological
Lessons from an Evaluation of Accelerated Schools. New York: Manpower Demonstration Research Corporation.
Bloom, Howard S., Johannes M. Bos, and Suk-Won Lee. 1999. “Using Cluster Random
Assignment to Measure Program Impacts: Statistical Implications for the Evaluation of Education Programs.” Evaluation Review 23(4):445-469.
Borman, Geoffrey D. and Gina M. Hewes. 2001. “The Long-Term Effects and Cost-
Effectiveness of Success for All.” Center on Research for the Education of Students Placed at Risk, Baltimore, MD: Johns Hopkins University.
Bound, John, David A. Jaeger, and Regina M. Baker. 1995. “Problems With Instrumental
Variables Estimation When the Correlation Between the Instruments and the Endogenous Explanatory Variable is Weak.” Journal of the American Statistical Association 90:443-450.
Brookover, Wilbur B., Laurence Beamer, Helen Efthim, D. Hathaway, Lawrence Lezotte, S.
Miller, J. Passalacqua, and L. Tornatzky. 1982. Creating Effective Schools: An In-
198

Service Program for Enhancing School Learning Climate and Environment. Holmes Beach, FL: Learning Publications.
Chubb, John E., and Terry M. Moe. 1990. Politics, Markets, and America’s Schools.
Washington, DC: The Brookings Institution. Cook, Thomas D., Robert Murphy, and H. David Hunt. 2000. “Comer’s School Development
Program in Chicago: A Theory-Based Evaluation.” American Education Research Journal 37(2):535-597.
Cook, Thomas D., Farah-Naaz Habib, Meredith Phillips, Richard A. Settersten, Shobha Shagle,
and Serdar M. Degirmencioglu. 1999. “Comer’s School Development Program in Prince George’s County, Maryland: A Theory-Based Evaluation.” American Education Research Journal 36(3):543-597.
Cook, Thomas D., Farah-Naaz Habib, Meredith Phillips, Richard A. Settersten, and Serdar M.
Degirmencioglu. 1998. “Comer’s School Development Program in Prince George’s County, Maryland: A Theory-Based Evaluation.” Working Paper No. 98-25, Institute for Policy Research, Evanston, IL: Northwestern University.
Cook, Thomas D., H. David Hunt, and Robert F. Murphy. 1998. “Comer’s School Development
Program in Chicago: A Theory-Based Evaluation.” Working Paper No. 99-26, Institute for Policy Research, Evanston, IL: Northwestern University.
Cook, Thomas D., and Donald T. Campbell. 1979. Quasi-Experimentation: Design and
Analysis Issues for Field Settings. Boston: Houghton Mifflin. Ferguson, Ronald, and Helen F. Ladd. 1996. “How and Why Money Matters: An Analysis of
Alabama Schools.” In Helen F. Ladd (ed.), Holding Schools Accountable: Performance-Based Reform in Education. Washington, DC: The Brookings Institution.
Green, William H. 1997. Econometric Analysis, Third Edition. Upper Saddle River, NJ: Prentice
Hall. Haynes, Norris M., Christine L. Emmons, Sara Gebreyesus, and Michael Ben-Avie. 1996. “The
School Development Program Evaluation Process.” In James P. Comer, Norris M. Haynes, Edward T. Joyner, and Michael Ben-Avie (eds.), Rallying the Whole Village: The Comer Process for Reforming Education. New York: Teachers College Press.
Heckman, James J. 1979. “Sample Selection Bias as a Specification Error.” Econometrica
47:153-161. Hess, Frederick M. 1998. “Policy Churn and the Plight of Urban School Reform.” In Paul E.
Peterson and Bryan C. Hassel (eds.), Learning from School Choice. Washington, D.C.: Brookings Institution Press.
Hurley, Eric A., Anne Chamberlain, Robert E. Slavin, and Nancy E. Madden. 2001. “Effects of
Success for All on TAAS Reading: A Texas Statewide Evaluation.” Phi Delta Kappan 82:750-756.
199
Jones, Elizabeth M., Gary D. Gottfredson, and Denise C. Gottfredson. 1997. “Success for
Some: An Evaluation of a Success for All Programs.” Evaluation Review 21(6):643-70. Kruger, Alan B. 1999. “Experimental Estimates of Education Production Functions.” Quarterly
Journal of Economics CXIV:497-532. Ladd, Helen F., and Janet S. Hansen. 1999. Making Money Matter: Financing America’s
Schools. Washington DC: National Academy Press. Miller, Stephen K., Shelley R. Cohen, and Kathleen A. Sayre. 1984. “The Jefferson County
Effective Schools Project: Description and Analysis of Outcomes.” Presented at the 1984 Annual Meeting of the American Educational Research Association, New Orleans, LA.
Millsap, Mary Ann, Anne Chase, Nancy Brigham, and Beth Gamse. 1997. “Evaluation of
‘Spreading the Comer School Development Program and Philosophy: Final Implementation Report’.” Cambridge, MA: Abt Associates, Inc.
Millsap, Mary Ann, Anne Chase, Dawn Obiedallah, and A. Perez-Smith. 2001. “Evaluation of
The Comer School Development Program in Detroit, 1994-1999: Methods and Results.” Presented at the Annual Meetings of the Association for Public Policy Analysis and Management, Washington, DC.
New York State Education Department. Undated. Improving Student Achievement: Models of
Excellence. Albany, NY: New York State Education Department. Nunnery, John. 1998. “Reform Ideology and the Locus of Development Problem in Education
Restructuring: Enduring Lessons from Studies of Educational Innovation.” Education and Urban Society 30(3):277-295.
Olson, Lynn. 1999. “Following the Plan.” Education Week April 14:28-30. Purkey, Stewart C., and Marshall S. Smith. 1983. “Effective Schools: A Review.” The
Elementary School Journal 83(4):427-52. Ross, Steven M., Marty Alberg, Lana J. Smith, Rebecca Anderson, Linda Bol, Amy Dietrich,
Deborah Lowther, and Leslie Phillipsen. 2000. “Using Whole-School Restructuring Designs to Improve Educational Outcomes: The Memphis Story at Year 3.” Teaching and Change 7(Winter):111-126.
Ross, Steven M., and Lana J. Smith. 1994. “Effects of the Success for All Model on Kindergarten
Through Second-Grade Reading Achievement, Teachers’ Adjustment and Classroom-School Climate at an Inner-City School.” Elementary School Journal 95:121-38.
Rouse, Cecilia E. 1998. “Private School Vouchers and Student Achievement of the Milwaukee
Parental Choice Program.” Quarterly Journal of Economics CXIII:553-602. Sanders, William L., S. Paul Wright, Steven M. Ross, and L. Weiping Wang. 2000. “Value-
Added Achievement Results for Three Cohorts of Roots and Wings Schools in Memphis:
200

1995-1999 Outcomes.” Center for Research in Education Policy, Memphis, TN: University of Memphis.
Slavin, Robert E. 1997. “Sand, Bricks, and Seeds: School Change Strategies and Readiness for
Reform.” Center for Research on the Education of Students Placed at Risk, Baltimore, MD: Johns Hopkins University.
Slavin, Robert E., and Nancy A. Madden. In Press. “Research on Achievement Outcomes of
Success for All: A Summary and Response To Critics.” Phi Delta Kappa. Slavin, Robert E., Nancy A. Madden, Lawrence J. Dolan, Barabara A. Wasik, Steven M. Ross,
and Lana J. Smith. 1994. “‘Whenever and Wherever We Choose’: The Replication of Success for All.” Phi Delta Kappan 75(8):639-47.
Smith, Lana J., Steven M. Ross, Mary McNelis, Martha Squires, Rebecca Wasson, Sheryl
Maxwell, Karen Weddle, Leslie Nath, Anna Grehan, and Tom Buggey. 1998. “The Memphis Restructuring Initiative: Analysis of Activities and Outcomes that Affect Implementation Success.” Education and Urban Society 30(3):296-325.
Smith, Lana J., Steven M. Ross, and J. Nunnery. 1997. “Increasing the Chances of Success for
All: the Relationship Between Program Implementation Quality and Student Achievement at Eight Inner-City Schools.” Presented at the 1997 Annual Meeting of the American Educational Research Association, Chicago, IL.
Statacorp. 2001. Stata Statistical Software: Release 7.0. College Station, TX: Stata Corporation. Sudlow, Robert E. 1986. “Spencerport Central Schools More Effective Schools/Teaching
Project Third Annual Report.” Spencerport, NY: Spencerport Central Schools. Teddlie, Charles, and Sam Stringfield. 1993. Schools Make a Difference: Lessons Learned from
a 10-Year Study of School Effects. New York: Teachers College Press. Venezky, R.L. 1994. An Evaluation of Success for All. Final Report to the France and Merrick
Foundations. Department of Educational Studies, Newark: University of Delaware. Viadero, Debra. 2001. “Memphis Scraps Redesign Models in All its Schools.” Education Week
July 11. Witte, John F., and Daniel J. Walsh. 1990. “A Systematic Test of the Effective Schools Model.”
Educational Evaluation and Policy Analysis 12(2):188-212. Wooldridge, J.M. 1999. Introductory Econometrics: A Modern Approach. Mason, OH: South-
Western College Publishing. Zigarelli, Michael A. 1995. “An Empirical Test of Conclusions from Effective Schools
Research.” The Journal of Educational Research 32(1):103-9.
201
Attachment 1: Proposed Data-Collection Workplan

Survey Schedule Draft as of April 13, 2000
April 13 Mail Survey to pilot test sample April 15 Interviewer Training Session 1 April 18 – May 5 Conduct pilot test May 6 Interviewer Training Session 2 May 8 – May 12 Revise survey instruments and protocols May 15 Mail survey to study sample May 20 Interviewer Training Session 3 May 22 First payment to interviewers initiated May 22 – May 31 Initial contacts with principals May 31 First payment to interviewers received June 1 – June 30 Complete survey June 30 Second payment to interviewers initiated July 15 Second payment to interviewers received

Attachment 2: Principal Surveys of Policies and Practices in New
York City Schools

Questionnaire on POLICIES AND PRACTICES
in New York City Schools
This questionnaire is part of a larger research project designed to evaluate the impact of whole- school reform models in New York City. The purpose of the questionnaire is to obtain information on the current policies and practices in schools that have and schools that have not adopted whole-school reforms. The responses you provide will be used in conjunction with responses to similar questionnaires by other principals from New York City schools. The responses you provide will not be identified with you personally or your school in any report that results from the project.
Person Interviewed:_____________ School:_______________________District:______________________ Position Current Principal
Former Principal Other_____________
Interviewer:___________________ Date Completed:_______________
Robert Bifulco, Survey Director The Center for Policy Research 426 Eggers Hall Syracuse University Syracuse, NY 13244 315 443-9056

SYRACUSE UNIVERSITY
MAXWELL SCHOOL OF CITIZENSHIP AND PUBLIC AFFAIRS
CENTER FOR POLICY RESEARCH
Questionnaire on POLICIES AND PRACTICES
in New York City Schools
This questionnaire is part of a larger research project designed to evaluate the impact of whole- school reform models in New York City. The purpose of the questionnaire is to obtain information on the current policies and practices in schools that have and schools that have not adopted whole-school reforms. The responses you provide will be used in conjunction with responses to similar questionnaires by other principals from New York City schools. The responses you provide will not be identified with you personally or your school in any report that results from the project. Robert Bifulco, Survey Director The Center for Policy Research 426 Eggers Hall Syracuse University Syracuse, NY 13244 315 443-9056

I. Background Questions I would like to begin with some background questions concerning your tenure and the positions you have held at your current school. 1. When were you first assigned to work at your current school? Please indicate the month and
year of your first assignment to the school, even if the assignment was in a position other than principal.
2. Please circle the position that you assumed when you were first assigned to your current
school.
Teacher Assistant Principal
Pupil Support Service Staff Principal Professional Developer Other: __________________________________ (please specify)
3. When did you first become the principal at your current school? Please indicate the month
and year that you were first appointed either interim acting principal or principal at this school.

II. Whole-School Reform Models The term “whole-school reform models” refers to a set of nationally disseminated school improvement programs that are designed to address multiple aspects of school operations. These models include, but are not limited to, the Comer School Development Program, Success for All, More Effective Schools, Accelerated Schools, Efficacy, and Basic Schools. 4. During the time you have worked at your current school, has the school adopted or used any
of the following whole-school reform models? (Please circle each whole-school model that has been adopted.)
Comer School Development Program Accelerated Schools Success for All Efficacy More Effective Schools Basic Schools
Other (please specify): If your school has not adopted or used any whole-school reform model during the time that you have worked there, then SKIP questions 5 - 22, and proceed to Section III of the questionnaire. 5. For each of the models that you circled (or listed) in response to question 4, please indicate
the school year during which implementation of the model was initiated.
Model Year Initiated ______________________________ _______________ ______________________________ _______________ ______________________________ _______________

6. For each of the models that you circled (or listed) in response to question 4, please indicate
whether or not your school is currently using the model.
Model Is the Program Currently Used? (Please circle the appropriate response) ______________________________ YES NO ______________________________ YES NO ______________________________ YES NO 7. Of the models you circled and/or listed in response to question 4, please indicate which one
is most central to the school’s current improvement efforts. Questions 8 – 22 ask about efforts to implement the model that you identified in response to question 7. These questions may require you to remember conditions and activities from several years ago.

8. Was the decision to adopt the model voted on by the school’s professional staff?
YES NO DON”T KNOW 9. Which of the following best describes how the decision to adopt the model was made?
(Please circle the ONE response that most accurately describes the process.)
District-driven: The district wanted the program and pushed the school to adopt. Principal-driven: The principal wanted the program and pushed the decision to adopt. Consultative: The principal in consultation with members of the professional staff decided to
adopt. Bottom-up: A number of professional staff members and/or parents actively expressed interest in the program and pushed the decision to adopt.
Don’t Know: I did not work at the school when the decision to adopt was made.
10. How would you describe the level of commitment to implementing the model exhibited by most of the professional staff at the time the decision to adopt was made? (Please circle one and only one rating.)
VERY LOW LOW MODERATE HIGH VERY HIGH
(If you were not working at your current school when the decision to adopt the model was made, then indicate the level of commitment to implementing the model among the professional staff when you were first assigned to the school.)
11. Over the course of time, would you say that the level of commitment to implementing the model exhibited by most of the professional staff: (Please circle the ONE most accurate response.)
INCREASED STEADILY
DECREASED STEADILY
FLUCTUATED REMAINED THE SAME

12. Please rate your own level of commitment to implementing the model at the time that the decision to adopt was made. (Please circle one and only one rating.)
VERY LOW LOW MODERATE HIGH VERY HIGH
(If you were not the principal at your current school when the decision to adopt the model was made, then indicate your own level of commitment to implementing the model when you first became principal of the school.)
13. Over the course of time, would you say your own level of commitment to implementing the
model: (Please circle the ONE most accurate response.)
INCREASED STEADILY
DECREASED STEADILY
FLUCTUATED REMAINED THE SAME
14. Approximately how many days of training on the model have you received? (Please circle
one and only one response.)
6 OR MORE 4 OR 5 2 OR 3 1 OR LESS 15. For each group listed below please indicate how many people from your school have
received training from the model developers.
Teachers
10 OR MORE
7 - 9 4 - 6 1 – 3 0
Administrators (other than yourself)
10
OR MORE
7 - 9
4 - 6
1 – 3
0
Other Professional Staff
10
OR MORE
7 - 9
4 - 6
1 – 3
0
Parents
10
OR MORE
7 - 9
4 - 6
1 – 3
0

16. Considering those people in each group who have received training from the model developers, how many days of training has the typical person received:
Teachers
6 OR MORE 4 OR 5 2 OR 3 1 OR LESS
Administrators (other than yourself)
6 OR MORE
4 OR 5
2 OR 3
1 OR LESS
Other Professional Staff
6 OR MORE 4 OR 5 2 OR 3 1 OR LESS
Parents
6 OR MORE
4 OR 5
2 OR 3
1 OR LESS
17. During the time you have worked at the school, how many times have the model developers
visited the school site to provide training or to assess implementation?
6 OR MORE 4 OR 5 2 OR 3 1 OR LESS 18. Have teachers and administrators who first joined the school in the years following initial
implementation efforts been provided training on the model?
YES NO
If YES, please indicate who has provided this training.
Model Developers
YES
NO
District Staff
YES
NO
Other School Staff
YES
NO

19. Was anyone in the school assigned to facilitate implementation of the model?
YES NO
If YES, what proportion of the program facilitator’s time was devoted to implementing the model? (Please circle the ONE most accurate response.)
100% 75% 50% 25% 20. How many additional positions were provided to the school for purposes of implementing the
model?
Type of Position
Number Added
Teachers:
Administrators:
Other Professionals:
Teacher Aides:
21. How many staff has your district office assigned to serve as district-level facilitators for the
model?
Number: ___________ 22. Please rate the district’s efforts to facilitate implementation of the model. (Please circle one
and only one rating.)
POOR FAIR GOOD VERY GOOD EXCELLENT

III. School Policies and Practices This section asks questions about several different aspects of your school. Please answer these questions based on current conditions at the school. A. Planning and Management Many of the questions in this section ask about the “school planning and management team.” This team may be referred to in your school as the school improvement team, the site-based management team, the shared decision-making team, the leadership team or something else. The term “school planning and management team” should be understood as referring to any team consisting of some combination of teachers and other school staff, parents, and administrators that addresses general school policy, planning, or management issues. 23. Does your school have a school planning and management team?
YES NO If the answer to question 23 is NO, then SKIP questions 24 – 34, and proceed to Section B. 24. How frequently does the school planning and management team meet? (Please circle the
ONE most accurate response.)
WEEKLY TWICE A MONTH
MONTHLY ONCE EVERY TWO MONTHS
QUARTERLY
25. How often do 90% or more of the team members attend the school planning and management
team meetings? (Please circle one and only one rating.)
NEVER SELDOM SOMETIMES OFTEN VERY OFTEN

26. For each set of school planning and management team members listed below, please indicate how actively they participate in the decision-making processes of the team.
NOT AT ALL
VERY
Teachers
1 2 3 4 5
Administrators
1 2 3 4 5
Other Professionals
1 2 3 4 5
Parents 1 2 3 4 5 27. Consider the level of agreement and disagreement among the school planning and
management team members. How would you describe:
VERY LOW
LOW
MODERATE
HIGH
VERY HIGH
a. The level of conflict among team members
1
2
3
4
5
b. The level of consensus among team members concerning academic goals for the school
1
2
3
4
5
c. The level of consensus among team members concerning social goals for the school
1
2
3
4
5
28. Has the school planning and management team developed a comprehensive school plan?
YES NO If the answer to question 28 is NO, then SKIP questions 29 - 31

29. To what extent does the comprehensive school plan establish strategies for: NOT AT
ALL
A GREAT DEAL
a. achieving the school’s academic goals?
1
2
3
4
5
b. achieving the school’s social goals?
1
2
3
4
5
c. meeting the school’s staff development
needs?
1
2
3
4
5
d. improving parental involvement?
1
2
3
4
5
30. Below are listed several types of data and analyses that might inform school planning. Please
indicate the extent to which each type of data has been used by the school planning and management team in developing the school’s comprehensive school plan.
NOT AT ALL
SOMEWHAT A GREAT DEAL
Written surveys of school staff
1
2
3
Written surveys of parents
1
2
3
Results on state assessments
1
2
3
Results on citywide assessments
1
2
3
Results on other classroom assessments
1
2
3
Student assessment results disaggregated by student groups
1
2
3
Student assessment results disaggregated by test item
1
2
3

31. How often does the school planning and management team refer to the comprehensive school plan to organize and plan programs? (Please circle one and only one response.)
NEVER SELDOM SOMETIMES OFTEN VERY OFTEN 32. Please rate the school planning and management team’s efforts to:
POOR
FAIR
GOOD
VERY GOOD
EXCELLENT
a. communicate its goals and plans to other school staff and parents
1
2
3
4
5
b. enlist other school staff to participate in activities supporting school improvement
1
2
3
4
5
c. enlist parents in school improvement activities
1
2
3
4
5
d. monitor the progress of school improvement activities
1
2
3
4
5
e. use feedback to modify its goals and plans
1
2
3
4
5
33. To what extent do the school planning and management team’s activities influence teaching
and learning at the classroom level? (Please circle one and only one response.)
NOT AT ALL
A GREAT DEAL
1 2 3 4 5 34. Overall, how effective is the school planning and management team at your school? (Please
circle one and only one rating.)
INEFFECTIVE
VERY EFFECTIVE
1 2 3 4 5

B. Curriculum and Assessment 35. Has your community school district office developed district-level curriculum guides based
on state standards?
YES NO
If YES, please indicate the school year during which the curriculum guides were first used.
Curriculum Area
School Year
English Language Arts
Mathematics
36. Has a team of professional staff members at your school been formed to assess and/or
improve the alignment between the school’s curricula and state learning standards?
YES NO
37. How would you describe the efforts of the teaching staff to align the school’s curricula with
state standards? (Please circle one and only one rating.)
POOR FAIR GOOD VERY GOOD
EXCELLENT
38. Have teachers at your school been provided any training on how to assess student progress
toward state standards?
YES NO 39. Overall how would you describe the efforts of the school staff to monitor the academic
progress of students in the school? (Please circle one and only one rating.)
POOR FAIR GOOD VERY GOOD
EXCELLENT

C. The Reading Program 40. Has the school established a daily 90-minute reading period for grades K-3?
YES NO If the answer to question 40 is NO, then SKIP questions 41 - 44. 41. Is the number of students in each class smaller during the 90-minute reading period than
during the rest of the school day?
YES NO
If YES, how much smaller? 42. In order to achieve smaller class sizes during the 90-minute reading period, additional staff
must be used to provide instruction. What type of staff is used to teach the additional classes offered during the reading period? (Please circle each of the following that applies.)
Certified Reading Teachers
Other Types of Teachers
Teacher Aides Other
43. Are students grouped homogeneously by reading performance level during the 90-minute
reading period?
YES NO 44. Are students grouped across grade levels during the 90-minute reading period?
YES NO

45. Does the school provide individual or small group tutoring for students at risk of falling below grade-level in reading?
YES NO If the answer to question 45 is NO, then SKIP questions 46 - 48. 46. Approximately what percentage of students identified as at risk of falling below grade-level
are provided individualized tutoring?
0% – 24% 25% - 49% 50% - 74% 75% - 100%
47. Who provides individual tutoring at your school? (Please circle each of the following that
applies.)
Certified Reading Teachers
Other Types of Teachers
Teacher Aides Other
48. When are individual tutoring sessions provided? (Please circle each of the following that
applies.)
During School After School On Weekends During the Summer

D. Student Support Services This section asks about mechanisms and processes to address personal and social problems that might impede learning. 49. Does the school have a team that is responsible for identifying and addressing the personal
and social problems of individual students?
YES NO If the answer to 49 is NO, then SKIP questions 50 & 51 50. To what extent does this team: NOT AT
ALL
A GREAT DEAL
a. work with teachers to help them with students facing personal or social problems?
1
2
3
4
5
b. provide training to teachers and staff related to children’s social development?
1
2
3
4
5
c. help teachers and staff to foster a positive social atmosphere in the school?
1
2
3
4
5
51. Please rate the effectiveness of this team in identifying and addressing student problems.
(Please circle one and only one rating.)
POOR FAIR GOOD VERY GOOD
EXCELLENT

E. Parental Involvement In this section the parent involvement team refers to any group consisting primarily of parents and school staff that plans and organizes programs to encourage parents’ involvement in the school and in the education of their children. 52. Does the school have a parent involvement team?
YES NO If the answer to question 52 is NO, then SKIP questions 53 & 54. 53. How frequently does the parent involvement team meet? (Please circle the ONE most
accurate response.)
WEEKLY TWICE A MONTH
MONTHLY ONCE EVERY TWO MONTHS
QUARTERLY
54. How often do 90% or more of the parent team members attend these meetings? (Please
circle one and only one rating.)
NEVER SELDOM SOMETIMES OFTEN VERY OFTEN 55. What percent of parents attend: a. parent/teacher conferences?
0% - 5%
6% - 20%
21% - 50%
51% - 75%
76% - 100%
b. open house (or parents’ night)?
0% - 5%
6% - 20%
21% - 50%
51% - 75%
76% - 100%
c. meetings of the PTO (or PTA)?
0% - 5%
6% - 20%
21% - 50%
51% - 75%
76% - 100%
56. Please rate the quality of parental involvement at the school. (Please circle one and only one
rating.)
POOR FAIR GOOD VERY GOOD
EXCELLENT

F. School Climate 57. Please rate each of the following aspects of the school climate and culture. NOT AT
ALL
VERY
a. How consistently do adults in the school
exhibit high expectations for student learning?
1
2
3
4
5
b. How safe and orderly is the school?
1
2
3
4
5
c. How effectively are teachers in the school
able to focus classroom time on instruction?
1
2
3
4
5
d. How sensitive are school staff to the social
and psychological needs of students?
1
2
3
4
5
e. How sensitive are school staff to ethnic and
cultural differences in the school?
1
2
3
4
5
f. How well does the professional staff work
together?
1
2
3
4
5
SYRACUSE UNIVERSITY
MAXWELL SCHOOL OF CITIZENSHIP AND PUBLIC AFFAIRS
CENTER FOR POLICY RESEARCH
Questionnaire on IMPLEMENTATION OF THE
COMER SCHOOL DEVELOPMENT PROGRAM in New York City Schools
This questionnaire is part of a larger research project designed to evaluate the impact of whole- school reform models in New York City. The purpose of the questionnaire is to obtain information that will help the project researchers understand and assess efforts to implement the Comer School Development Program. The responses you provide will be used in conjunction with responses to similar questionnaires by other principals from New York City schools that have adopted the Comer School Development Program. The responses you provide will not be identified with you personally or your school in any report that results from the project. Robert Bifulco, Survey Director The Center for Policy Research 426 Eggers Hall Syracuse University Syracuse, NY 13244 315 443-9056

I. Background Questions This questionnaire is concerned with efforts to implement the Comer School Development Program at «School» in «District». In order to assess your familiarity with this school during the period when efforts to implement the Comer School Development Program were undertaken, this section asks a few preliminary questions. 1. Please indicate the month and year of your first assignment to «School», even if the
assignment was in a position other than principal. 2. Did you work at «School» during the «Year_Adopted» school year?
YES NO
If YES, please indicate the position that you occupied during that year.
Teacher Assistant Principal
Pupil Support Service Staff Principal Professional Developer Other: __________________________________ (please specify)
1

II. Implementation Efforts This part of the questionnaire asks about the efforts to implement the Comer School Development Program at «School». These questions will require you to remember conditions and activities from several years ago. A. The Decision to Adopt The first set of questions in this section asks about the conditions at the school at the time the decision to adopt the Comer School Development Program was made. If you were not working in «School» when the decision to adopt the Comer School Development Program was made, then SKIP questions 3 and 4. 3. Was the decision to adopt the Comer School Development Program voted on by the school’s
professional staff?
YES NO 4. Which of the following best describes how the decision to adopt the Comer School
Development Program was made? (Please circle the ONE response that most accurately describes the process.)
District-driven: The district wanted the program and pushed the school to adopt. Principal-driven: The principal wanted the program and pushed the decision to adopt. Consultative: The principal in consultation with members of the professional staff decided to
adopt. Bottom-up: A number of professional staff members and/or parents actively expressed interest in the program and pushed the decision to adopt.
2

5. How would you describe the level of commitment to implementing the Comer School Development Program exhibited by most of the professional staff at the time the decision to adopt was made? (Please circle one and only one rating.)
VERY LOW LOW MODERATE HIGH VERY HIGH
(If you were not working at «School» when the decision to adopt the Comer School Development Program was made, then indicate the level of commitment to implementing the Comer School Development Program among the professional staff when you were first assigned to the school.)
6. Over the course of the time that you have worked at «School», would you say that the level of commitment to implementing the Comer School Development Program exhibited by most of the professional staff: (Please circle the ONE most accurate response.)
INCREASED STEADILY
DECREASED STEADILY
FLUCTUATED REMAINED THE SAME
7. Please rate your own level of commitment to implementing the Comer school development
program at the time that the decision to adopt was made. (Please circle one and only one rating.)
VERY LOW LOW MODERATE HIGH VERY HIGH
(If you were not the principal at «School» when the decision to adopt the Comer School Development Program was made, then indicate your own level of commitment to implementing the Comer School Development Program when you first became principal of the school.)
8. Over the course of the time that you have worked at «School», would you say your own level
of commitment to implementing the Comer School Development Program: (Please circle the ONE most accurate response.)
INCREASED STEADILY
DECREASED STEADILY
FLUCTUATED REMAINED THE SAME
3

B. Training Provided The next set of questions concern the training on the Comer School Development Program that was provided for you and members of the professional staff at «School». 9. Did you ever attend the Comer Principal’s Academy at Yale University in New Haven,
Connecticut?
YES NO
If YES, please indicate the month and year during which you attended. 10. Not including the Comer Principal’s Academy at Yale University, approximately how many
training sessions on the Comer School Development Program have you attended? (Please circle one and only one response.)
6 OR MORE 4 OR 5 2 OR 3 1 OR LESS 11. For each group listed below please indicate how many people received training from Comer
School Development Program staff during the first three years of program implementation.
Teachers
10 OR MORE
7 - 9 4 - 6 1 - 3 0
Administrators (other than yourself)
10
OR MORE
7 - 9
4 - 6
1 - 3
0
Other Professional Staff
10
OR MORE
7 - 9
4 - 6
1 - 3
0
Parents
10
OR MORE
7 - 9
4 - 6
1 - 3
0
4

12. Considering those people in each group who did receive training from Comer School Development Program staff, how many days of training did the typical person receive?
Teachers
6 OR MORE 4 OR 5 2 OR 3 1 OR LESS
Administrators (other than yourself)
6 OR MORE
4 OR 5
2 OR 3
1 OR LESS
Other Professional Staff
6 OR MORE 4 OR 5 2 OR 3 1 OR LESS
Parents
6 OR MORE
4 OR 5
2 OR 3
1 OR LESS
13. During the time you have worked at «School», how many times have Comer School
Development Program staff visited the school site to provide training or to assess implementation?
6 OR MORE 4 OR 5 2 OR 3 1 OR LESS 14. Have teachers and administrators who first joined the school in the years following initial
implementation efforts been provided training on the Comer School Development Program?
YES NO
If YES, please indicate who has provided this training.
Comer School Development Program Staff
YES
NO
District Staff
YES
NO
Other School Staff
YES
NO
5

C. Staffing Provided This section asks about what staff was provided to support implementation of the Comer School Development Program during the first three years of program implementation. 15. Was anyone in «School» assigned to facilitate implementation of the Comer School
Development Program?
YES NO
If YES, what proportion of the program facilitator’s time was devoted to implementing the Comer School Development Program? (Please circle the ONE most accurate response.)
100% 75% 50% 25% 16. How many additional positions were provided to the school, for purposes of implementing
the Comer School Development Program?
Type of Position
Number Added
Teachers:
Administrators:
Other Professionals:
Teacher Aides:
17. How many district office staff did «District» assign to serve as Comer School Development
Program facilitators?
Number: ___________ 18. Please rate «District»’s efforts to facilitate implementation of the Comer School
Development Program. (Please circle one and only one rating.)
POOR FAIR GOOD VERY GOOD EXCELLENT
6

D. Current Implementation Efforts 19. Is «School» currently using the Comer School Development Program?
YES NO
If NO, please indicate the year that implementation efforts were discontinued and why they were discontinued.
a. Year program was discontinued:
b. Reason program was discontinued: 20. During the time since the Comer School Development Program was initially adopted at
«School», has the school adopted any other reform model?
YES NO
If YES, please circle each of the models listed below that has been adopted, and indicate the school year during which it was adopted.
Model
Year Adopted Model
Year Adopted
Success for All
Efficacy
More Effective Schools
Basic Schools
Accelerated Schools
Other: (Please specify)
7

III. School Policies and Practices This section asks questions about several different aspects of your school. Please answer these questions based on current conditions at the school. A. Planning and Management Many of the questions in this section ask about the “school planning and management team.” This team may be referred to in your school as the school improvement team, the site-based management team, the shared decision-making team, the leadership team or something else. The term “school planning and management team” should be understood as referring to any team consisting of some combination of teachers and other school staff, parents, and administrators that addresses general school policy, planning, or management issues. 21. Does your school have a school planning and management team?
YES NO If the answer to question 21 is NO, then SKIP questions 22 – 32, and proceed to Section B. 22. How frequently does the school planning and management team meet? (Please circle the
ONE most accurate response.)
WEEKLY TWICE A MONTH
MONTHLY ONCE EVERY TWO MONTHS
QUARTERLY
23. How often do 90% or more of the team members attend the school planning and management
team meetings? (Please circle one and only one rating.)
NEVER SELDOM SOMETIMES OFTEN VERY OFTEN
8

24. For each set of school planning and management team members listed below, please indicate how actively they participate in the decision-making processes of the team.
NOT AT ALL
VERY
Teachers
1 2 3 4 5
Administrators
1 2 3 4 5
Other Professionals
1 2 3 4 5
Parents 1 2 3 4 5 25. Consider the level of agreement and disagreement among the school planning and
management team members. How would you describe:
VERY LOW
LOW
MODERATE
HIGH
VERY HIGH
a. The level of conflict among team members
1
2
3
4
5
b. The level of consensus among team members concerning academic goals for the school
1
2
3
4
5
c. The level of consensus among team members concerning social goals for the school
1
2
3
4
5
26. Has the school planning and management team developed a comprehensive school plan?
YES NO If the answer to question 26 is NO, then SKIP questions 27 – 29.
9

27. To what extent does the comprehensive school plan establish strategies for: NOT AT
ALL
A GREAT DEAL
a. achieving the school’s academic goals?
1
2
3
4
5
b. achieving the school’s social goals?
1
2
3
4
5
c. meeting the school’s staff development
needs?
1
2
3
4
5
d. improving parental involvement?
1
2
3
4
5
28. Below are listed several types of data and analyses that might inform school planning. Please
indicate the extent to which each type of data has been used by the school planning and management team in developing the school’s comprehensive school plan.
NOT AT ALL
SOMEWHAT A GREAT DEAL
Written surveys of school staff
1
2
3
Written surveys of parents
1
2
3
Results on state assessments
1
2
3
Results on citywide assessments
1
2
3
Results on other classroom assessments
1
2
3
Student assessment results disaggregated by student groups
1
2
3
Student assessment results disaggregated by test item
1
2
3
10

29. How often does the school planning and management team refer to the comprehensive school plan to organize and plan programs? (Please circle one and only one response.)
NEVER SELDOM SOMETIMES OFTEN VERY OFTEN 30. Please rate the school planning and management team’s efforts to:
POOR
FAIR
GOOD
VERY GOOD
EXCELLENT
a. communicate its goals and plans to the other school staff and parents
1
2
3
4
5
b. enlist other school staff to participate in activities supporting school improvement
1
2
3
4
5
c. enlist parents in school improvement activities
1
2
3
4
5
d. monitor the progress of school improvement activities
1
2
3
4
5
e. use feedback to modify its goals and plans
1
2
3
4
5
31. To what extent do the school planning and management team’s activities influence teaching
and learning at the classroom level? (Please circle one and only one response.)
NOT AT ALL
A GREAT DEAL
1 2 3 4 5 32. Overall, how effective is the school planning and management team at your school? (Please
circle one and only one rating.)
INEFFECTIVE
VERY EFFECTIVE
1 2 3 4 5
11

B. Curriculum and Assessment 33. Has your community school district office developed district-level curriculum guides based
on state standards?
YES NO
If YES, please indicate the school year during which the curriculum guides were first used.
Curriculum Area
School Year
English Language Arts
Mathematics
34. Has a team of professional staff members at your school been formed to assess and/or
improve the alignment between the school’s curricula and state learning standards?
YES NO
35. How would you describe the efforts of the teaching staff to align the school’s curricula with
state standards? (Please circle one and only one rating.)
POOR FAIR GOOD VERY GOOD
EXCELLENT
36. Have teachers at your school been provided any training on how to assess student progress
toward state standards?
YES NO 37. Overall how would you describe the efforts of the school staff to monitor the academic
progress of students in the school? (Please circle one and only one rating.)
POOR FAIR GOOD VERY GOOD
EXCELLENT
12

C. The Reading Program 38. Has the school established a daily 90-minute reading period for grades K-3?
YES NO If the answer to question 38 is NO, then SKIP questions 39 - 42. 39. Is the number of students in each class smaller during the 90-minute reading period than
during the rest of the school day?
YES NO
If YES, how much smaller? 40. In order to achieve smaller class sizes during the 90-minute reading period, additional staff
must be used to provide instruction. What type of staff are used to teach the additional classes offered during the reading period? (Please circle each of the following that applies.)
Certified Reading Teachers
Other Types of Teachers
Teacher Aides Other
41. Are students grouped homogeneously by reading performance level during the 90-minute
reading period?
YES NO 42. Are students grouped across grade levels during the 90-minute reading period?
YES NO
13

43. Does the school provide individual or small group tutoring for students at risk of falling below grade-level in reading?
YES NO If the answer to question 43 is NO, then SKIP questions 44 - 46. 44. Approximately what percentage of students identified as at risk of falling below grade-level
are provided individualized tutoring?
0% – 24% 25% - 49% 50% - 74% 75% - 100%
45. Who provides individual tutoring at your school? (Please circle each of the following that
applies.)
Certified Reading Teachers
Other Types of Teachers
Teacher Aides Other
46. When are individual tutoring sessions provided? (Please circle each of the following that
applies.)
During School After School On Weekends During the Summer
14

D. Student Support Services This section asks about mechanisms and processes to address personal and social problems that might impede learning. 47. Does the school have a team that is responsible for identifying and addressing the personal
and social problems of individual students?
YES NO If the answer to 47 is NO, then SKIP questions 48 & 49. 48. To what extent does this team: NOT AT
ALL
A GREAT DEAL
a. work with teachers to help them with students facing personal or social problems?
1
2
3
4
5
b. provide training to teachers and staff related to children’s social development?
1
2
3
4
5
c. help teachers and staff to foster a positive social atmosphere in the school?
1
2
3
4
5
49. Please rate the effectiveness of this team in identifying and addressing student problems.
(Please circle one and only one rating.)
POOR FAIR GOOD VERY GOOD
EXCELLENT
15

E. Parental Involvement In this section the parent involvement team refers to any group consisting primarily of parents and school staff that plans and organizes programs to encourage parents’ involvement in the school and in the education of their children. 50. Does the school have a parent involvement team?
YES NO If the answer to question 50 is NO, then SKIP questions 51 & 52. 51. How frequently does the parent involvement team meet? (Please circle the ONE most
accurate response.)
WEEKLY TWICE A MONTH
MONTHLY ONCE EVERY TWO MONTHS
QUARTERLY
52. How often do 90% or more of the parent team members attend these meetings? (Please
circle one and only one rating.)
NEVER SELDOM SOMETIMES OFTEN VERY OFTEN 53. What percent of parents attend: a. parent/teacher conferences?
0% - 5%
6% - 20%
21% - 50%
51% - 75%
76% - 100%
b. open house (or parents’ night)?
0% - 5%
6% - 20%
21% - 50%
51% - 75%
76% - 100%
c. meetings of the PTO (or PTA)?
0% - 5%
6% - 20%
21% - 50%
51% - 75%
76% - 100%
54. Please rate the quality of parental involvement at the school. (Please circle one and only one
rating.)
POOR FAIR GOOD VERY GOOD
EXCELLENT
16

F. School Climate 55. Please rate each of the following aspects of the school climate and culture. NOT AT
ALL
VERY
a. How consistently do adults in the school
exhibit high expectations for student learning?
1
2
3
4
5
b. How safe and orderly is the school?
1
2
3
4
5
c. How effectively are teachers in the school
able to focus classroom time on instruction?
1
2
3
4
5
d. How sensitive are school staff to the social
and psychological needs of students?
1
2
3
4
5
e. How sensitive are school staff to ethnic and
cultural differences in the school?
1
2
3
4
5
f. How well does the professional staff work
together?
1
2
3
4
5
17

Questionnaire on IMPLEMENTATION OF
SUCCESS FOR ALL in New York City Schools
This questionnaire is part of a larger research project designed to evaluate the impact of whole- school reform models in New York City. The purpose of the questionnaire is to obtain information that will help the project researchers understand and assess efforts to implement Success for All. The responses you provide will be used in conjunction with responses to similar questionnaires by other principals from New York City schools that have adopted Success for All. The responses you provide will not be identified with you personally or your school in any report that results from the project.
Person Interviewed:_____________ School:_______________________District:______________________ Position Current Principal
Former Principal Other_____________
Interviewer:___________________ Date Completed:_______________
Robert Bifulco, Survey Director The Center for Policy Research 426 Eggers Hall Syracuse University Syracuse, NY 13244 315 443-9056

SYRACUSE UNIVERSITY
MAXWELL SCHOOL OF CITIZENSHIP AND PUBLIC AFFAIRS
CENTER FOR POLICY RESEARCH
Questionnaire on IMPLEMENTATION OF
SUCCESS FOR ALL in New York City Schools
This questionnaire is part of a larger research project designed to evaluate the impact of whole- school reform models in New York City. The purpose of the questionnaire is to obtain information that will help the project researchers understand and assess efforts to implement Success for All. The responses you provide will be used in conjunction with responses to similar questionnaires by other principals from New York City schools that have adopted Success for All. The responses you provide will not be identified with you personally or your school in any report that results from the project. Robert Bifulco, Survey Director The Center for Policy Research 426 Eggers Hall Syracuse University Syracuse, NY 13244 315 443-9056

I. Background Questions This questionnaire is concerned with efforts to implement Success for All at «School» in «District». In order to assess your familiarity with this school during the period when efforts to implement Success for All were undertaken, this section asks a few preliminary questions. 1. Please indicate the month and year of your first assignment to «School», even if the
assignment was in a position other than principal. 2. Did you work at «School» during the «Year_Adopted» school year?
YES NO
If YES, please indicate the position that you occupied during that year.
Teacher Assistant Principal
Pupil Support Service Staff Principal Professional Developer Other: __________________________________ (please specify)
1

II. Implementation Efforts This part of the questionnaire asks about the efforts to implement Success for All at «School». These questions will require you to remember conditions and activities from several years ago. A. The Decision to Adopt The first set of questions in this section asks about the conditions at the school at the time the decision to adopt Success for All was made. If you were not working in «School» when the decision to adopt Success for All was made, then SKIP questions 3 and 4. 3. Was the decision to adopt Success for All approved by 80% or more of the school’s staff in a
vote by secret ballot?
YES NO 4. Which of the following best describes how the decision to adopt Success for All was made?
(Please circle the ONE response that most accurately describes the process.)
District-driven: The district wanted the program and pushed the school to adopt. Principal-driven: The principal wanted the program and pushed the decision to adopt. Consultative: The principal in consultation with members of the professional staff decided to
adopt. Bottom-up: A number of professional staff members and/or parents actively expressed interest in the program and pushed the decision to adopt.
2

5. How would you describe the level of commitment to implementing Success for All exhibited by most of the professional staff at the time the decision to adopt was made? (Please circle one and only one rating.)
VERY LOW LOW MODERATE HIGH VERY HIGH
(If you were not working at «School» when the decision to adopt Success for All was made, then indicate the level of commitment to implementing Success for All among the professional staff when you were first assigned to the school.)
6. Over the course of the time that you have worked at «School», would you say that the level of commitment to implementing Success for All exhibited by most of the professional staff: (Please circle the ONE most accurate response.)
INCREASED STEADILY
DECREASED STEADILY
FLUCTUATED REMAINED THE SAME
7. Please rate your own level of commitment to implementing Success for All at the time that
the decision to adopt was made. (Please circle one and only one rating.)
VERY LOW LOW MODERATE HIGH VERY HIGH
(If you were not the principal at «School» when the decision to adopt Success for All was made, then indicate your own level of commitment to implementing Success for All when you first became principal of the school.)
8. Over the course of the time that you have worked at «School», would you say your own level
of commitment to implementing Success for All: (Please circle the ONE most accurate response.)
INCREASED STEADILY
DECREASED STEADILY
FLUCTUATED REMAINED THE SAME
3

B. Training Provided The next set of questions concern the training on Success for All that was provided for you and members of the professional staff at «School». 9. Did you ever attend a week-long training session at Johns Hopkins University in Baltimore?
YES NO
If YES, please indicate the month and year during which you attended. 10. How many other people from «School» attended training sessions at Johns Hopkins
University in Baltimore?
Type of Position
Number Who Attended
Teachers:
Administrators:
Other Professionals:
Teacher Aides:
11. Did Success for All staff members visit the school for three days to train the full school staff?
YES NO
If YES, please indicate the month and year when this training took place.
4

12. How many times did Success for All staff conduct follow-up visits to «School» during its
first year of implementation? (Please circle one and only one response.)
MORE THAN 3 TIMES
2 OR 3 TIMES
ONE TIME
ZERO TIMES
DON’T KNOW
13. How many times did Success for All staff conduct follow-up visits to «School» after the first
year of implementation? (Please circle the one most accurate response.)
MORE THAN 3 TIMES
PER YEAR
2 OR 3 TIMES
PER YEAR
ONE TIME
PER YEAR
ZERO TIMES
PER YEAR
DON’T KNOW
14. Have teachers and administrators who first joined the school in the years following initial
implementation efforts been provided training on Success for All?
YES NO
If YES, please indicate who has provided this training.
Comer School Development Program Staff
YES
NO
District Staff
YES
NO
Other School Staff
YES
NO
5

C. Staffing Provided This section asks about what staff was provided to support implementation of Success for All during the first three years of program implementation. 15. Was anyone in «School» assigned to facilitate implementation of Success for All?
YES NO
If YES, what proportion of the program facilitator’s time was devoted to implementing Success for All? (Please circle the ONE most accurate response.)
100% 75% 50% 25% 16. How many additional positions were provided to the school, for purposes of implementing
Success for All?
Type of Position
Number Added
Teachers:
Administrators:
Other Professionals:
Teacher Aides:
17. How many district office staff did «District» assign to serve as Success for All facilitators?
Number: ___________ 18. Please rate «District»’s efforts to facilitate implementation of Success for All. (Please circle
one and only one rating).
POOR FAIR GOOD VERY GOOD EXCELLENT
6

D. Current Implementation Efforts 19. Is «School» currently using Success for All?
YES NO
If NO, please indicate the year that implementation efforts were discontinued and why they were discontinued.
a. Year program was discontinued:
b. Reason program was discontinued: 20. During the time since Success for All was initially adopted at «School», has the school
adopted any other reform model?
YES NO
If YES, please circle each of the models listed below that has been adopted, and indicate the school year during which it was adopted.
Model
Year Adopted Model
Year Adopted
School Development Program
Efficacy
More Effective Schools
Basic Schools
Accelerated Schools
Other: (Please specify)
7

III. School Policies and Practices This section asks questions about several different aspects of your school. Please answer these questions based on current conditions at the school. A. Planning and Management Many of the questions in this section ask about the “school planning and management team.” This team may be referred to in your school as the school improvement team, the site-based management team, the shared decision-making team, the leadership team or something else. The term “school planning and management team” should be understood as referring to any team consisting of some combination of teachers and other school staff, parents, and administrators that addresses general school policy, planning, or management issues. 21. Does your school have a school planning and management team?
YES NO If the answer to question 21 is NO, then SKIP questions 22 – 32, and proceed to Section B. 22. How frequently does the school planning and management team meet? (Please circle the
ONE most accurate response.)
WEEKLY TWICE A MONTH
MONTHLY ONCE EVERY TWO MONTHS
QUARTERLY
23. How often do 90% or more of the team members attend the school planning and management
team meetings? (Please circle one and only one rating.)
NEVER SELDOM SOMETIMES OFTEN VERY OFTEN
8

24. For each set of school planning and management team members listed below, please indicate how actively they participate in the decision-making processes of the team.
NOT AT ALL
VERY
Teachers
1 2 3 4 5
Administrators
1 2 3 4 5
Other Professionals
1 2 3 4 5
Parents 1 2 3 4 5 25. Consider the level of agreement and disagreement among the school planning and
management team members. How would you describe:
VERY LOW
LOW
MODERATE
HIGH
VERY HIGH
a. The level of conflict among team members
1
2
3
4
5
b. The level of consensus among team members concerning academic goals for the school
1
2
3
4
5
c. The level of consensus among team members concerning social goals for the school
1
2
3
4
5
26. Has the school planning and management team developed a comprehensive school plan?
YES NO If the answer to question 26 is NO, then SKIP questions 27 – 29.
9

27. To what extent does the comprehensive school plan establish strategies for: NOT AT
ALL
A GREAT DEAL
a. achieving the school’s academic goals?
1
2
3
4
5
b. achieving the school’s social goals?
1
2
3
4
5
c. meeting the school’s staff development
needs?
1
2
3
4
5
d. improving parental involvement?
1
2
3
4
5
28. Below are listed several types of data and analyses that might inform school planning. Please
indicate the extent to which each type of data has been used by the school planning and management team in developing the school’s comprehensive school plan.
NOT AT ALL
SOMEWHAT A GREAT DEAL
Written surveys of school staff
1
2
3
Written surveys of parents
1
2
3
Results on state assessments
1
2
3
Results on citywide assessments
1
2
3
Results on other classroom assessments
1
2
3
Student assessment results disaggregated by student groups
1
2
3
Student assessment results disaggregated by test item
1
2
3
10

29. How often does the school planning and management team refer to the comprehensive school plan to organize and plan programs? (Please circle one and only one response.)
NEVER SELDOM SOMETIMES OFTEN VERY OFTEN 30. Please rate the school planning and management team’s efforts to:
POOR
FAIR
GOOD
VERY GOOD
EXCELLENT
a. Communicate its goals and plans to other school staff and parents
1
2
3
4
5
b. Enlist other school staff to participate in activities supporting school improvement
1
2
3
4
5
c. Enlist parents in school improvement activities
1
2
3
4
5
d. Monitor the progress of school improvement activities
1
2
3
4
5
e. Use feedback to modify its goals and plans
1
2
3
4
5
31. To what extent do the school planning and management team’s activities influence teaching
and learning at the classroom level? (Please circle one and only one response.)
NOT AT ALL
A GREAT DEAL
1 2 3 4 5 32. Overall, how effective is the school planning and management team at your school? (Please
circle one and only one rating.)
INEFFECTIVE
VERY EFFECTIVE
1 2 3 4 5
11

B. Curriculum and Assessment 33. Has your community school district office developed district-level curriculum guides based
on state standards?
YES NO
If YES, please indicate the school year during which the curriculum guides were first used.
Curriculum Area
School Year
English Language Arts
Mathematics
34. Has a team of professional staff members at your school been formed to assess and/or
improve the alignment between the school’s curricula and state learning standards?
YES NO
35. How would you describe the efforts of the teaching staff to align the school’s curricula with state standards? (Please circle one and only one rating.)
POOR FAIR GOOD VERY GOOD
EXCELLENT
12

C. The Reading Program 36. Has the school established a daily 90-minute reading period for grades K-3?
YES NO If the answer to question 36 is NO, then SKIP questions 37 - 40. 37. Is the number of students in each class smaller during the 90-minute reading period than
during the rest of the school day?
YES NO
If YES, how much smaller? 38. In order to achieve smaller class sizes during the 90-minute reading period, additional staff
must be used to provide instruction. What type of staff are used to teach the additional classes offered during the reading period? (Please circle each of the following that applies.)
Certified Reading Teachers
Other Types of Teachers
Teacher Aides Other
39. Are students grouped homogeneously by reading performance level during the 90-minute
reading period?
YES NO 40. Are students grouped across grade levels during the 90-minute reading period?
YES NO
13

41. How consistently do teachers at your school use the instructional activities prescribed by Success for All during the 90-minute reading period? (Please circle one and only one.)
NEVER SELDOM SOMETIMES OFTEN VERY OFTEN 42. Please indicate how consistently 8-week assessments are used to regroup students and/or
assign students for additional help? (Please circle one and only one.)
NEVER SELDOM SOMETIMES OFTEN VERY OFTEN 43. Does the school provide individual or small group tutoring for students at risk of falling
below grade-level in reading?
YES NO If the answer to question 43 is NO, then SKIP questions 44 - 46. 44. Approximately what percentage of students identified as at risk of falling below grade-level
are provided individualized tutoring?
0% – 24% 25% - 49% 50% - 74% 75% - 100%
45. Who provides individual tutoring at your school? (Please circle each of the following that
applies.)
Certified Reading Teachers
Other Types of Teachers
Teacher Aides Other
46. When are individual tutoring sessions provided? (Please circle each of the following that
applies.)
During School After School On Weekends During the Summer
14

D. Student Support Services This section asks about mechanisms and processes to address personal and social problems that might impede learning. 47. Does the school have a team that is responsible for identifying and addressing the personal
and social problems of individual students?
YES NO If the answer to 47 is NO, then SKIP questions 48 & 49 48. To what extent does this team: NOT AT
ALL
A GREAT DEAL
a. work with teachers to help them with students facing personal or social problems?
1
2
3
4
5
b. provide training to teachers and staff related to children’s social development?
1
2
3
4
5
c. help teachers and staff to foster a positive social atmosphere in the school?
1
2
3
4
5
49. Please rate the effectiveness of this team in identifying and addressing student problems.
(Please circle one and only one rating.)
POOR FAIR GOOD VERY GOOD
EXCELLENT
15

E. Parental Involvement In this section the parent involvement team refers to any group consisting primarily of parents and school staff that plans and organizes programs to encourage parents’ involvement in the school and in the education of their children. 50. Does the school have a parent involvement team?
YES NO If the answer to question 50 is NO, then SKIP questions 51 & 52 51. How frequently does the parent involvement team meet? (Please circle the ONE most
accurate response.)
WEEKLY TWICE A MONTH
MONTHLY ONCE EVERY TWO MONTHS
QUARTERLY
52. How often do 90% or more of the parent team members attend these meetings? (Please
circle one and only one rating.)
NEVER SELDOM SOMETIMES OFTEN VERY OFTEN 53. What percent of parents attend: a. parent/teacher conferences?
0% - 5%
6% - 20%
21% - 50%
51% - 75%
76% - 100%
b. open house (or parents’ night)?
0% - 5%
6% - 20%
21% - 50%
51% - 75%
76% - 100%
c. meetings of the PTO (or PTA)?
0% - 5%
6% - 20%
21% - 50%
51% - 75%
76% - 100%
54. Please rate the quality of parental involvement at the school. (Please circle one and only one
rating.)
POOR FAIR GOOD VERY GOOD
EXCELLENT
16

F. School Climate 55. Please rate each of the following aspects of the school climate and culture. NOT AT
ALL
VERY
a. How consistently do adults in the school
exhibit high expectations for student learning?
1
2
3
4
5
b. How safe and orderly is the school?
1
2
3
4
5
c. How effectively are teachers in the school
able to focus classroom time on instruction?
1
2
3
4
5
d. How sensitive are school staff to the social
and psychological needs of students?
1
2
3
4
5
e. How sensitive are school staff to ethnic and
cultural differences in the school?
1
2
3
4
5
f. How well does the professional staff work
together?
1
2
3
4
5
17

Questionnaire on IMPLEMENTATION OF
MORE EFFECTIVE SCHOOLS in New York City
This questionnaire is part of a larger research project designed to evaluate the impact of whole- school reform models in New York City. The purpose of this questionnaire is to get information that will help the project researchers understand and assess efforts to implement the More Effective Schools model. The responses you provide will be used in conjunction with responses to similar questionnaires by other principals from New York City schools that have adopted the More Effective Schools model. The responses you provide will not be identified with you personally or your school in any report that results from the project.
Person Interviewed:_____________ School:_______________________District:______________________ Position Current Principal
Former Principal Other_____________
Interviewer:___________________ Date Completed:_______________
Robert Bifulco, Survey Director The Center for Policy Research 426 Eggers Hall Syracuse University Syracuse, NY 13244 315 443-9056

SYRACUSE UNIVERSITY
MAXWELL SCHOOL OF CITIZENSHIP AND PUBLIC AFFAIRS
CENTER FOR POLICY RESEARCH
Questionnaire on IMPLEMENTATION OF
MORE EFFECTIVE SCHOOLS in New York City
This questionnaire is part of a larger research project designed to evaluate the impact of whole- school reform models in New York City. The purpose of this questionnaire is to get information that will help the project researchers understand and assess efforts to implement the More Effective Schools model. The responses you provide will be used in conjunction with responses to similar questionnaires by other principals from New York City schools that have adopted the More Effective Schools model. The responses you provide will not be identified with you personally or your school in any report that results from the project. Robert Bifulco, Survey Director The Center for Policy Research 426 Eggers Hall Syracuse University Syracuse, NY 13244 315 443-9056

I. Background Questions This questionnaire is concerned with efforts to implement the More Effective Schools model at «School» in «District». In order to assess your familiarity with this school during the period when efforts to implement the More Effective Schools model were undertaken, this section asks a few preliminary questions. 1. Please indicate the month and year of your first assignment to «School», even if the
assignment was in a position other than principal. 2. Did you work at «School» during the «Year_Adopted» school year?
YES NO
If YES, please indicate the position that you occupied during that year.
Teacher Assistant Principal
Pupil Support Service Staff Principal Professional Developer Other: __________________________________ (please specify)
1

II. Implementation Efforts This part of the questionnaire asks about the efforts to implement the More Effective Schools model at «School». These questions will require you to remember conditions and activities from several years ago. A. The Decision to Adopt The first set of questions in this section asks about the conditions at the school at the time the decision to adopt the More Effective Schools model was made. If you were not working in «School» when the decision to adopt the More Effective Schools Model was made, then SKIP questions 3 and 4. 3. Was the decision to adopt the More Effective Schools model voted on by the school’s
professional staff?
YES NO 4. Which of the following best describes how the decision to adopt the More Effective Schools
model was made? (Please circle the ONE response that most accurately describes the process.)
District-driven: The district wanted the program and pushed the school to adopt. Principal-driven: The principal wanted the program and pushed the decision to adopt. Consultative: The principal in consultation with members of the professional staff decided to
adopt. Bottom-up: A number of professional staff members and/or parents actively expressed interest in the program and pushed the decision to adopt.
2

5. How would you describe the level of commitment to implementing the More Effective Schools model exhibited by most of the professional staff at the time the decision to adopt was made? (Please circle one and only one rating.)
VERY LOW LOW MODERATE HIGH VERY HIGH
(If you were not working at «School» when the decision to adopt the More Effective Schools model was made, then indicate the level of commitment to implementing the More Effective Schools model among the professional staff when you were first assigned to the school.)
6. Over the course of the time that you have worked at «School», would you say that the level of commitment to implementing the More Effective Schools model exhibited by most of the professional staff: (Please circle the ONE most accurate response.)
INCREASED STEADILY
DECREASED STEADILY
FLUCTUATED REMAINED THE SAME
7. Please rate your own level of commitment to implementing the More Effective Schools
model at the time that the decision to adopt was made. (Please circle one and only one rating.)
VERY LOW LOW MODERATE HIGH VERY HIGH
(If you were not the principal at «School» when the decision to adopt the More Effective Schools model was made, then indicate your own level of commitment to implementing the More Effective Schools model when you first became the principal of the school.)
8. Over the course of the time that you have worked at «School», would you say your own level
of commitment to implementing the More Effective Schools model: (Please circle the ONE most accurate response.)
INCREASED STEADILY
DECREASED STEADILY
FLUCTUATED REMAINED THE SAME
3

B. Training Provided The next set of questions concern the training on the More Effective Schools model that was provided for members of the professional staff in «School» and «District». 9. Did a district-wide team from «District» participate in training on the Effective Schools
research and improvement process?
YES NO
If YES, please indicate the month and year when this training was provided. 10. During the initial year of model implementation, the More Effective Schools trainers
typically offer a two-part workshop for school improvement team members. Each session is done over two days, usually in the fall. The sessions are used to develop a multi-year plan for improving the school based on effective schools research. Did school improvement team members from «School» participate in this workshop?
YES NO
If YES, please indicate how many individuals from each of the groups listed below attended.
Number of Team Members
Teachers
Administrators
Other Professional Staff
Parents
4

11. Not including the workshops asked about in questions 9 and 10, how many days of training on effective schools research and the More Effective Schools model have you received? (Please circle the one most accurate response)
6 OR MORE
4 OR 5 2 OR 3 1 OR LESS
12. How many times did a More Effective Schools trainer visit «School» to provide feedback
and technical assistance during its first year of implementation? (Please circle one and only one response.)
MORE THAN 3 TIMES
2 OR 3 TIMES
ONE TIME
ZERO TIMES
DON’T KNOW
13. Did More Effective School trainers conduct workshops with the teachers at «School» to help
align the school’s curricula with state standards?
YES NO
If YES, please indicate the month and year that these workshops took place. 14. Have teachers and administrators who first joined the school in the years following initial
implementation efforts been provided training on the More Effective Schools Model?
YES NO
If YES, please indicate who has provided this training.
More Effective Schools Staff
YES
NO
District Staff
YES
NO
Other School Staff
YES
NO
5

C. Staffing Provided This section asks about what staff was provided to support implementation of the More Effective Schools model during the first three years of program implementation. 15. Was anyone in «School» assigned to facilitate implementation of the More Effective Schools
model?
YES NO
If YES, what proportion of the program facilitator’s time was devoted to implementing the More Effective Schools model? (Please circle the ONE most accurate response.)
100% 75% 50% 25% 16. How many additional positions were provided to the school, for purposes of implementing
the More Effective Schools model?
Type of Position
Number Added
Teachers:
Administrators:
Other Professionals:
Teacher Aides:
17. How many district office staff did «District» assign to serve as More Effective Schools
model facilitators?
Number: ___________ 18. Please rate «District»’s efforts to facilitate implementation of the More Effective Schools
model. (Please circle one and only one rating).
POOR FAIR GOOD VERY GOOD EXCELLENT
6

D. Current Implementation Efforts 19. Is «School» currently using the More Effective Schools model?
YES NO
If NO, please indicate the year that implementation efforts were discontinued and why they were discontinued.
a. Year program was discontinued:
b. Reason program was discontinued: 20. During the time since the More Effective Schools model was initially adopted at «School»,
has the school adopted any other reform model?
YES NO
If YES, please circle each of the models listed below that has been adopted, and indicate the school year during which it was adopted.
Model
Year Adopted Model
Year Adopted
School Development Program
Efficacy
Success for All
Basic Schools
Accelerated Schools
Other: (Please specify)
7

III. School Policies and Practices This section asks questions about several different aspects of your school. Please answer these questions based on current conditions at the school. A. Planning and Management Many of the questions in this section ask about the “school planning and management team.” This team may be referred to in your school as the school improvement team, the site-based management team, the shared decision-making team, the leadership team or something else. The term “school planning and management team” should be understood as referring to any team consisting of some combination of teachers and other school staff, parents, and administrators that addresses general school policy, planning, or management issues. 21. Does your school have a school planning and management team?
YES NO If the answer to question 21 is NO, then SKIP questions 22 – 32, and proceed to Section B. 22. How frequently does the school planning and management team meet? (Please circle the
ONE most accurate response.)
WEEKLY TWICE A MONTH
MONTHLY ONCE EVERY TWO MONTHS
QUARTERLY
23. How often do 90% or more of the team members attend the school planning and management
team meetings? (Please circle one and only one rating.)
NEVER SELDOM SOMETIMES OFTEN VERY OFTEN
8

24. For each set of school planning and management team members listed below, please indicate how actively they participate in the decision-making processes of the team.
NOT AT ALL
VERY
Teachers
1 2 3 4 5
Administrators
1 2 3 4 5
Other Professionals
1 2 3 4 5
Parents 1 2 3 4 5 25. Consider the level of agreement and disagreement among the school planning and
management team members. How would you describe:
VERY LOW
LOW
MODERATE
HIGH
VERY HIGH
a. The level of conflict among team members
1
2
3
4
5
b. The level of consensus among team members concerning academic goals for the school
1
2
3
4
5
c. The level of consensus among team members concerning social goals for the school
1
2
3
4
5
26. Has the school planning and management team developed a comprehensive school plan?
YES NO If the answer to question 26 is NO, then SKIP questions 27 – 29.
9

27. To what extent does the comprehensive school plan establish strategies for: NOT AT
ALL
A GREAT DEAL
a. achieving the school’s academic goals?
1
2
3
4
5
b. achieving the school’s social goals?
1
2
3
4
5
c. meeting the school’s staff development
needs?
1
2
3
4
5
d. improving parental involvement?
1
2
3
4
5
28. Below are listed several types of data and analyses that might inform school planning. Please
indicate the extent to which each type of data has been used by the school planning and management team in developing the school’s comprehensive school plan.
NOT AT ALL
SOMEWHAT A GREAT DEAL
Written surveys of school staff
1
2
3
Written surveys of parents
1
2
3
Results on state assessments
1
2
3
Results on citywide assessments
1
2
3
Results on other classroom assessments
1
2
3
Student assessment results disaggregated by student groups
1
2
3
Student assessment results disaggregated by test item
1
2
3
10

29. How often does the school planning and management team refer to the comprehensive school plan to organize and plan programs? (Please circle one and only one response.)
NEVER SELDOM SOMETIMES OFTEN VERY OFTEN 30. Please rate the school planning and management team’s efforts to:
POOR
FAIR
GOOD
VERY GOOD
EXCELLENT
a. communicate its goals and plans to other school staff and parents
1
2
3
4
5
b. enlist other school staff to participate in activities supporting school improvement
1
2
3
4
5
c. enlist parents in school improvement activities
1
2
3
4
5
d. monitor the progress of school improvement activities
1
2
3
4
5
e. use feedback to modify its goals and plans
1
2
3
4
5
31. To what extent do the school planning and management team’s activities influence teaching
and learning at the classroom level? (Please circle one and only one response.)
NOT AT ALL
A GREAT DEAL
1 2 3 4 5 32. Overall, how effective is the school planning and management team at your school? (Please
circle one and only one rating.)
INEFFECTIVE
VERY EFFECTIVE
1 2 3 4 5
11

B. Curriculum and Assessment 33. Has your community school district office developed district-level curriculum guides based
on state standards?
YES NO
If YES, please indicate the school year during which the curriculum guides were first used.
Curriculum Area
School Year
English Language Arts
Mathematics
34. Has a team of professional staff members at your school been formed to assess and/or
improve the alignment between the school’s curricula and state learning standards?
YES NO
35. How would you describe the efforts of the teaching staff to align the school’s curricula with
state standards? (Please circle one and only one rating.)
POOR FAIR GOOD VERY GOOD
EXCELLENT
36. Have teachers at your school been provided any training on how to assess student progress
toward state standards?
YES NO 37. Overall how would you describe the efforts of the school staff to monitor the academic
progress of students in the school? (Please circle one and only one rating.)
POOR FAIR GOOD VERY GOOD
EXCELLENT
12

C. The Reading Program 38. Has the school established a daily 90-minute reading period for grades K-3?
YES NO If the answer to question 38 is NO, then SKIP questions 39 - 42. 39. Is the number of students in each class smaller during the 90-minute reading period than
during the rest of the school day?
YES NO
If YES, how much smaller? 40. In order to achieve smaller class sizes during the 90-minute reading period, additional staff
must be used to provide instruction. What type of staff are used to teach the additional classes offered during the reading period? (Please circle each of the following that applies.)
Certified Reading Teachers
Other Types of Teachers
Teacher Aides Other
41. Are students grouped homogeneously by reading performance level during the 90-minute
reading period?
YES NO 42. Are students grouped across grade levels during the 90-minute reading period?
YES NO
13

43. Does the school provide individual or small group tutoring for students at risk of falling below grade-level in reading?
YES NO If the answer to question 43 is NO, then SKIP questions 44 - 46. 44. Approximately what percentage of students identified as at risk of falling below grade-level
are provided individualized tutoring?
0% – 24% 25% - 49% 50% - 74% 75% - 100%
45. Who provides individual tutoring at your school? (Please circle each of the following that
applies.)
Certified Reading Teachers
Other Types of Teachers
Teacher Aides Other
46. When are individual tutoring sessions provided? (Please circle each of the following that
applies.)
During School After School On Weekends During the Summer
14

D. Student Support Services This section asks about mechanisms and processes to address personal and social problems that might impede learning. 47. Does the school have a team that is responsible for identifying and addressing the personal
and social problems of individual students?
YES NO If the answer to 47 is NO, then SKIP questions 48 & 49. 48. To what extent does this team: NOT AT
ALL
A GREAT DEAL
a. work with teachers to help them with students facing personal or social problems?
1
2
3
4
5
b. provide training to teachers and staff related to children’s social development?
1
2
3
4
5
c. help teachers and staff to foster a positive social atmosphere in the school?
1
2
3
4
5
49. Please rate the effectiveness of this team in identifying and addressing student problems.
(Please circle one and only rating.)
POOR FAIR GOOD VERY GOOD
EXCELLENT
15

E. Parental Involvement In this section the parent involvement team refers to any group consisting primarily of parents and school staff that plans and organizes programs to encourage parents’ involvement in the school and in the education of their children. 50. Does the school have a parent involvement team?
YES NO If the answer to question 50 is NO, then SKIP questions 51 & 52. 51. How frequently does the parent involvement team meet? (Please circle the ONE most
accurate response.)
WEEKLY TWICE A MONTH
MONTHLY ONCE EVERY TWO MONTHS
QUARTERLY
52. How often do 90% or more of the parent team members attend these meetings? (Please
circle one and only one rating.)
NEVER SELDOM SOMETIMES OFTEN VERY OFTEN 53. What percent of parents attend: a. parent/teacher conferences?
0% - 5%
6% - 20%
21% - 50%
51% - 75%
76% - 100%
b. open house (or parents’ night)?
0% - 5%
6% - 20%
21% - 50%
51% - 75%
76% - 100%
c. meetings of the PTO (or PTA)?
0% - 5%
6% - 20%
21% - 50%
51% - 75%
76% - 100%
54. Please rate the quality of parental involvement at the school. (Please circle one and only one
rating.)
POOR FAIR GOOD VERY GOOD
EXCELLENT
16

F. School Climate 55. Please rate each of the following aspects of the school climate and culture. NOT AT
ALL
VERY
a. How consistently do adults in the school
exhibit high expectations for student learning?
1
2
3
4
5
b. How safe and orderly is the school?
1
2
3
4
5
c. How effectively are teachers in the school
able to focus classroom time on instruction?
1
2
3
4
5
d. How sensitive are school staff to the social
and psychological needs of students?
1
2
3
4
5
e. How sensitive are school staff to ethnic and
cultural differences in the school?
1
2
3
4
5
f. How well does the professional staff work
together?
1
2
3
4
5
17

Attachment 3: Cover Letters Used for Principal Survey
Final survey cover letter sent to principals:
CENTER FOR POLICY RESEARCH
May 15, 2000 «Name», «Current_Position» «School» «Address_1» «Address_2», «State» «Zip_Code» Dear «Last_name»: The Center for Policy Research at Syracuse University is conducting a study of whole-school reform efforts in New York City, and we need your help. The study is being funded by the Smith-Richardson Foundation and has been approved by the New York City Board of Education. The whole-school reform models we are examining are Success for All, the Comer School Development Program, and More Effective Schools. As part of the study, we will interview a selection of current and former principals from schools that have implemented one of these models, as well as a selection of principals from schools that have not. We have notified each Community School District Superintendent of our intention to seek principals’ participation. In the next week, you will be contacted by a member of our research team. If you agree to participate in our study, this person will schedule a time to conduct a telephone interview with you. The questions that will be asked during this interview are enclosed. It will be helpful if you take a few moments to review the enclosed questionnaire prior to the scheduled interview, so that you can consult any records or colleagues that might help you answer the questions that are asked. The interview itself will take approximately 30 minutes. We realize that your time is valuable. In return for your agreement to participate in our study, we will enter your school in a pool to win one of three $1,000 awards from the Center for Policy Research. These awards will be made in August 2000 and can be used for any purpose the school chooses. If you are selected for an award, but are not currently working at a school, the award will be made to the school (or schools) of your choice. In addition, we will send you a copy of the report that results from our study. All information that you provide will be kept confidential. The responses you provide will be used in conjunction with responses to similar questionnaires by other individuals familiar with efforts to implement whole school reform models in New York City. We will not report any information that can be used to make judgements about any specific school. The member of our research team who contacts you will be happy to answer any questions that you have about the study. If you agree to participate in this study please complete the Approval to Conduct Research form, and return it in the enclosed envelope. Sincerely, Robert Bifulco Research Associate
426 E G G E R S H A L L / S Y R A C U S E , N E W Y O R K 13244-1020 / (315) 443-3114 / F A X (315) 443-1081 / http://www-cpr.maxwell.syr.edu

Letter sent to Community School District Superintendents:
May 15, 2000 «Name», «Title» «District» «Address_1_» «Address_2», «State» «Zip» Dear «Last_Name»: The Center for Policy Research at Syracuse University is conducting a study of whole-school reform efforts in New York City. The study is being funded by the Smith-Richardson Foundation and has been approved by the New York City Board of Education. The models we are examining are Success for All, the Comer School Development Program and More Effective Schools. As part of the study, we will interview a selection of principals from schools that have implemented one of these models, as well as a selection of principals from schools that have not. The purpose of the survey is to compare the policies and practices of the various schools selected. A summary description of our study is enclosed. We have selected a sample of current and former principals from 95 different schools in New York City to interview. The schools are drawn from 21 different Community School Districts. The principles from «District» included in our sample are listed on the attached page. Each of these principals will be contacted by a member of our research team by the end of May. If the principal agrees to participate, this person will schedule a time to conduct a telephone interview. The interview will take approximately 30 minutes. We realize that a principal’s time is valuable. If a principal agrees to participate in our study, we will enter his or her school in a pool to win one of three $1,000 awards from the Center for Policy Research, to be awarded in August, 2000. In addition, a copy of the report that results from our study will be available to principals and district officials upon request. All information provided by principals will be kept confidential. We will not report any information that can be used to make judgements about the practices of any specific school. Principal’s names will not be used in any report that results from the project. If you have any questions concerning our study, please contact me, Robert Bifulco, at 315-443-9056. If your approval is required to interview principals in «District», please notify us as soon as possible. Sincerely, Robert Bifulco Research Associate
426 E G G E R S H A L L / S Y R A C U S E , N E W Y O R K 13244-1020 / (315) 443-3114 / F A X (315) 443-1081 / http://www-cpr.maxwell.syr.edu
Thank you letter sent to principals:
August 28, 2000 «Name», «Current_Position» «School» «Address_1» «Address_2», «State» «Zip_Code» Dear «Last_name»: Toward the end of last school year, you were contacted by a member of our research team and asked to participate in an interview covering policies and reform efforts at your school. We are writing you now to express our sincere thanks for your participation in our study. The success of our efforts to evaluate whole-school reform efforts in New York City depends on gaining reliable information on what has taken place in the schools in our study sample. Your help in providing this information has been indispensable and is greatly appreciated. The data collection phase of our project is now complete. We obtained information from 63 of the 118 principals that we attempted to interview. Six additional New York City principals helped us by responding to early drafts of our interview instrument. We have also obtained information from whole-school reform program developers, State Education Department officials, and several community school district staff members. We want to thank all of those who helped us. We will use the information we have collected to evaluate whole-school reform models. The models we will evaluate include the Comer School Development Program, Success for All and More Effective Schools. The purposes of our analyses will be to determine what difference these models have made in the policies and practices of the schools that implemented them, and to assess the impacts of these changes. Our hope is that our findings will be useful for federal and state policy makers in deciding whether or not to support these models, and to school administrators like you who may need to choose among different school improvement strategies.
We will complete our analyses and prepare a report of our results during the coming year. The information you have provided will remain strictly confidential. We will not use names of any particular individuals or schools in our report. Upon completion of our study, we will send all those who have helped us an executive summary of our final report along with information on how to obtain the full project report. We would be greatly interested in any feedback or comments you may have at that time on the results of our study. In our initial correspondence with you, we offered your school a chance to win one of three $1,000 awards in return for agreeing to participate in our study. Three winners have been drawn from the 69 principals who either granted us an interview or allowed us to interview someone in their school. These individuals and their schools will be contacted during the next week to arrange payment of their awards. If you have any questions about our study please do not hesitate to contact me. Again thank you for the time and effort you have taken to help make our project a success. Sincerely, Robert Bifulco
426 E G G E R S H A L L / S Y R A C U S E , N E W Y O R K 13244-1020 / (315) 443-3114 / F A X (315) 443-1081 / http://www-cpr.maxwell.syr.edu
Pilot test letter sent to pilot schools: April 13, 2000 «Name», «Current_Position» «School_Name» «Address_1» «Address_2», «State» «Zip_Code» Dear Sir or Madam: My name is Robert Bifulco and I am a graduate student at Syracuse University. I am part of a research team that is examining whole-school reform efforts in New York City. The purpose of this letter is to explain our study and ask you if you would be will to participate. The purpose of our study is to determine how efforts to implement whole-school reform influence school practices and policies. The models that we will examine are Success for All, the Comer School Development Program and More Effective Schools. As part of the study, I am planning to interview a selection of principals from schools that have implemented one of these models, as well as a selection of principals from schools that have not implemented whole-school reform. Over the next two weeks, I will be conducting a pilot test of my interview questionnaire. A select number of principals from schools in New York City and elsewhere will be invited to participate. The purpose of the pilot test interviews is to determine if the questionnaire is appropriate and to refine the interview protocols. Although the information provided in the interviews will not be used in my analyses, completion of pilot interviews is crucial for the success of the project. In the next week, you will receive a call from a member of my research team. If you agree to participate in the pilot test, this person will schedule a time to conduct an interview with you. The questions that you will be asked during the interview are enclosed. The interview will last approximately 30 minutes. All information that you provide will be kept confidential. The responses you provide will not be used or reported in any form. The member of our research team who contacts you will be happy to answer any questions that you have about the study. I hope you will be able to help us, and thank you in advance for any time and effort you are able to give. Sincerely, Robert Bifulco Ph.D. Candidate