document: lat-pr-01967section 8.c thermal design1 glast lat projectcdr/cd-3 review, may 12-16 2003...
Post on 21-Dec-2015
213 views
TRANSCRIPT

Document: LAT-PR-01967 Section 8.C Thermal Design 1
GLAST LAT Project
CDR/CD-3 Review, May 12-16 2003
Jeff Wang
LMCO
LAT Thermal Engineer
Gamma-ray Large Gamma-ray Large Area Space Area Space TelescopeTelescope
LAT Thermal Systems LAT Thermal Systems AnalysisAnalysis
Document: LAT-PR-01967 Section 8.C Thermal Design 2
GLAST LAT Project
CDR/CD-3 Review, May 12-16 2003 AgendaAgenda
• Introduction• Design trade analyses performed and results• Thermal systems overview• Thermal parameters
– Requirements and interfaces– Analysis parameters, environments, and case definitions
• Analysis update– Hot- and cold-cases analyses– Survival-case analysis– Other non-design case analyses– Failure-case analyses
• Thermal Control System Design• Summary and Further Work
Document: LAT-PR-01967 Section 8.C Thermal Design 3
GLAST LAT Project
CDR/CD-3 Review, May 12-16 2003LAT Thermal Systems OverviewLAT Thermal Systems Overview
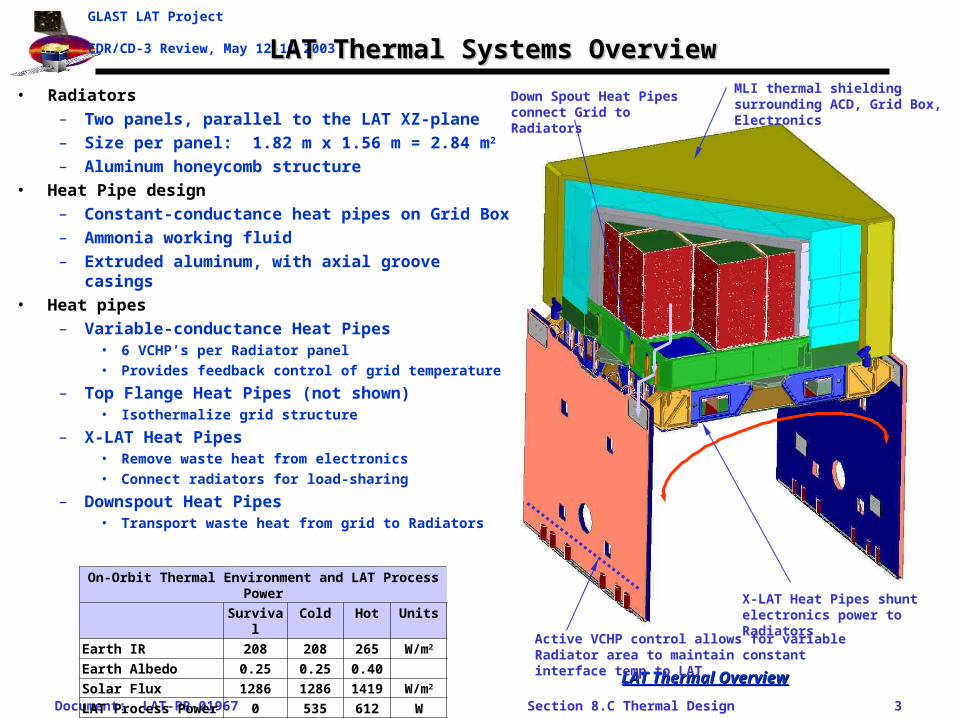
• Radiators
– Two panels, parallel to the LAT XZ-plane
– Size per panel: 1.82 m x 1.56 m = 2.84 m2
– Aluminum honeycomb structure
• Heat Pipe design
– Constant-conductance heat pipes on Grid Box
– Ammonia working fluid
– Extruded aluminum, with axial groove casings
• Heat pipes
– Variable-conductance Heat Pipes• 6 VCHP’s per Radiator panel• Provides feedback control of grid temperature
– Top Flange Heat Pipes (not shown)• Isothermalize grid structure
– X-LAT Heat Pipes• Remove waste heat from electronics• Connect radiators for load-sharing
– Downspout Heat Pipes• Transport waste heat from grid to Radiators
On-Orbit Thermal Environment and LAT Process Power
Survival Cold Hot Units
Earth IR 208 208 265 W/m2
Earth Albedo 0.25 0.25 0.40
Solar Flux 1286 1286 1419 W/m2
LAT Process Power 0 535 612 W
MLI thermal shielding surrounding ACD, Grid Box, Electronics
X-LAT Heat Pipes shunt electronics power to Radiators
LAT Thermal OverviewLAT Thermal Overview
Active VCHP control allows for variable Radiator area to maintain constant interface temp to LAT
Down Spout Heat Pipes connect Grid to Radiators

Document: LAT-PR-01967 Section 8.C Thermal Design 4
GLAST LAT Project
CDR/CD-3 Review, May 12-16 2003Downspout and X-LAT Heat PipesDownspout and X-LAT Heat Pipes
Document: LAT-PR-01967 Section 8.C Thermal Design 5
GLAST LAT Project
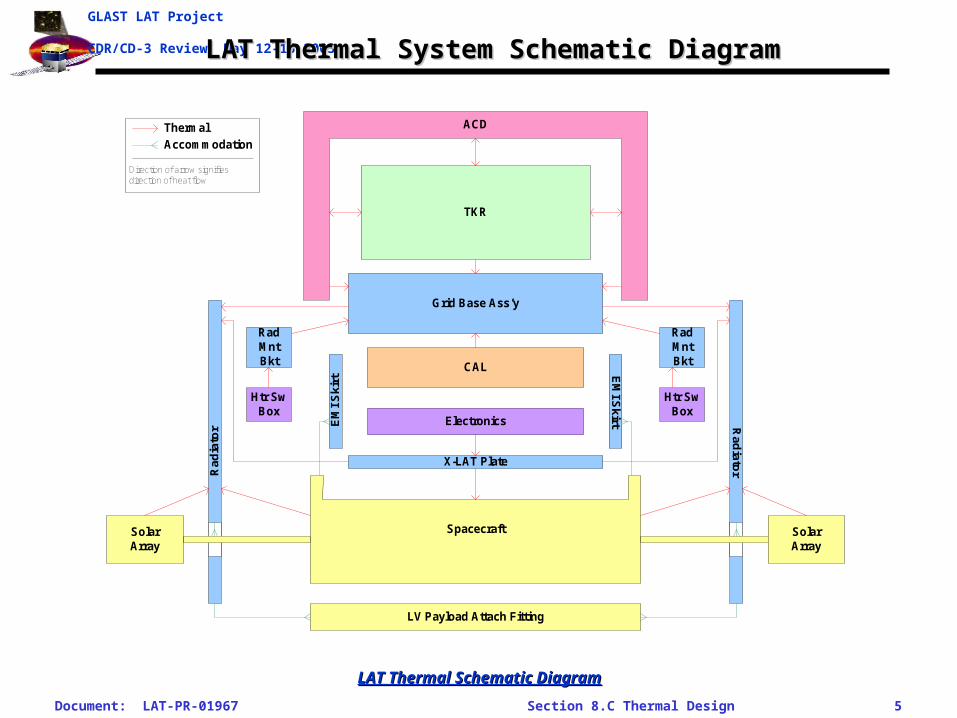
CDR/CD-3 Review, May 12-16 2003LAT Thermal System Schematic DiagramLAT Thermal System Schematic Diagram
Rad
iato
rRad
iato
r
Grid Base Ass’y
CAL
TKR
ACD
X-LAT Plate
EM
I S
kir
tRadMntBkt
Electronics
Htr SwBox
Spacecraft
LV Payload Attach Fitting
EM
I Skirt
RadMntBkt
Htr SwBox
SolarArray
SolarArray
Thermal
Accommodation
Direction of arrow signifiesdirection of heat flow
LAT Thermal Schematic DiagramLAT Thermal Schematic Diagram
Document: LAT-PR-01967 Section 8.C Thermal Design 6
GLAST LAT Project
CDR/CD-3 Review, May 12-16 2003Internal Thermal Design Changes Since Delta-PDRInternal Thermal Design Changes Since Delta-PDR
The following design changes have been incorporated in the CDR thermal model• Added high emissivity black paint to TKR sidewalls
– Lowers peak TKR temperature by radiatively coupling modules together
– Raises ACD survival temperature and lowers TKR hot-case peak temperature by improving radiative coupling between the two
• Connected TKR to Grid with 4 heat straps/module
– Increases temperature gradient across the thermal joint
– Improves thermal joint reliability compared to Delta-PDR thermal gasket design
• Replaced outer ACD MLI blanket layer with germanium black kapton (FOSR before)
– Preferred by subsystem, since MLI is unsupported
– Marginally raises survival case temperatures
• Increased total LAT power (w/o reservoirs) to 615 W (was 602W)
– Total is still within the 650 W allocation• CAL and TKR power increased 21.6 W• Electronics power dropped 8.3 W• ACD power remained about the same
– Net effect is to raise hot-case peak temperatures for the TKR and CAL
• Added S-bend to VCHP transport section
– Results in net drop in survival heater power needs • Reduces survival-case heat leak out of Grid• Increases anti-freeze radiator heater power
– Improves flexibility for better compliance at integration
– Increases transport capacity requirement on VCHP’s
Document: LAT-PR-01967 Section 8.C Thermal Design 7
GLAST LAT Project
CDR/CD-3 Review, May 12-16 2003LAT Thermal Interface Design Changes Since Delta-PDRLAT Thermal Interface Design Changes Since Delta-PDR
The following interface changes have been incorporated in the CDR thermal model
• Increased Radiator area to 2.78 m2 but decreased efficiency by shortening it– Modified Radiator aspect ratio at request of Spectrum to
accommodate solar arrays
– This change results in slightly higher LAT hot-case temperatures
• Finalized Radiator cut-outs– Added cut-outs for solar array launch locks
– Increased size of cut-out for solar array mast
– This change results in slightly higher LAT hot-case temperatures
Document: LAT-PR-01967 Section 8.C Thermal Design 8
GLAST LAT Project
CDR/CD-3 Review, May 12-16 2003Trade Studies Since Delta-PDRTrade Studies Since Delta-PDR
• Solar Array interface for survival/cold cases– Delta-PDR total survival grid + anti freeze heater power calculated to
be 171 watts (28.0 watts reservoirs) 191 W Total
– Using the Spectrum PDR Solar Array, survival heater power increased to 244 W (28 W for reservoirs)
– With no solar array, total survival heater power increased to 330 watts
– Conclusion: using the Spectrum Astro PDR solar array in the LAT cold- and survival-case models was agreed as reasonable
• Reservoir size reduction– Desire to maximize radiator area and temperature margins
– Used Delta-PDR model to assure that smaller reservoir could totally close heat pipes for survival and provide adequate cold case control
– Reduced size provides more condenser length
– Conclusion: reduce reservoir size from Delta PDR volume of 288 cc to 75 cc. This produces a net gain of 100 mm in condenser length
Document: LAT-PR-01967 Section 8.C Thermal Design 9
GLAST LAT Project
CDR/CD-3 Review, May 12-16 2003Thermal Systems Peer Review RFA StatusThermal Systems Peer Review RFA Status
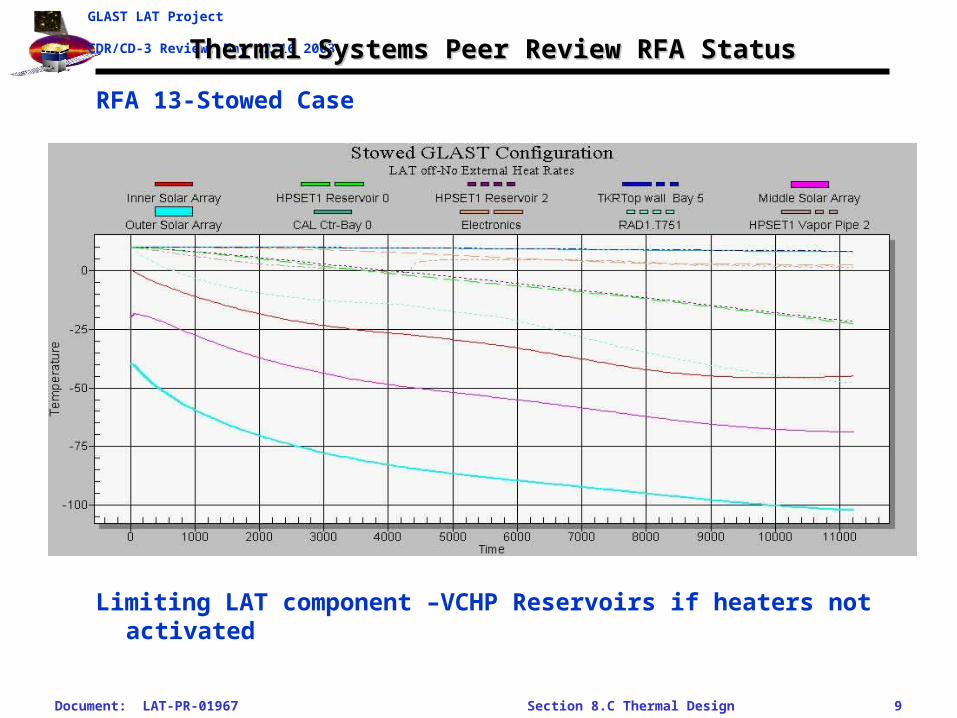
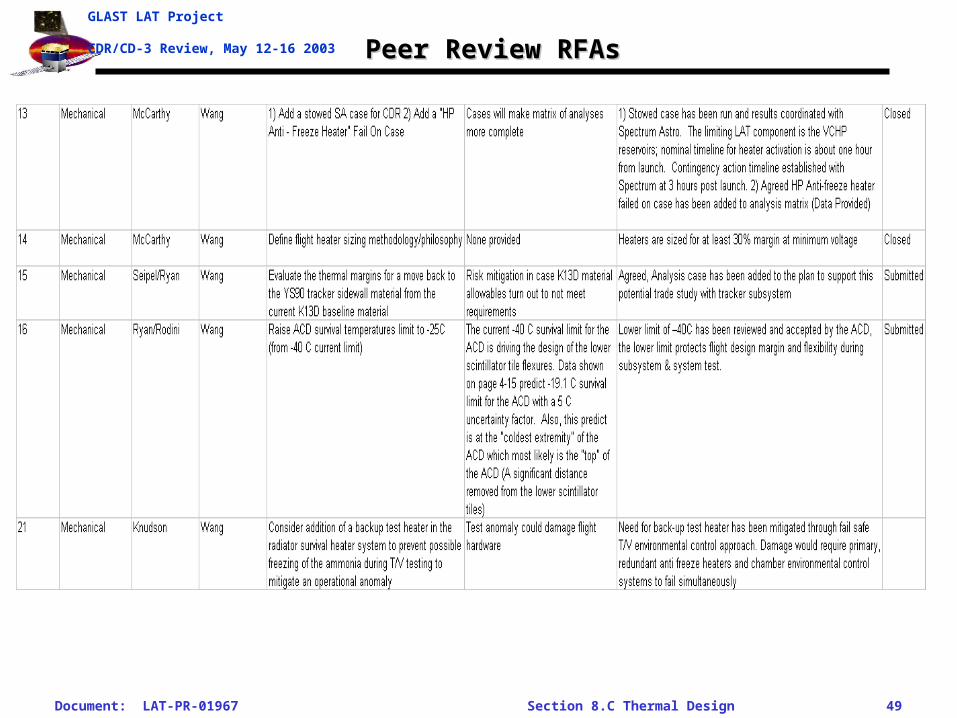
RFA 13-Stowed Case
Limiting LAT component –VCHP Reservoirs if heaters not activated
Document: LAT-PR-01967 Section 8.C Thermal Design 10
GLAST LAT Project
CDR/CD-3 Review, May 12-16 2003Thermal Systems Peer Review RFA StatusThermal Systems Peer Review RFA Status
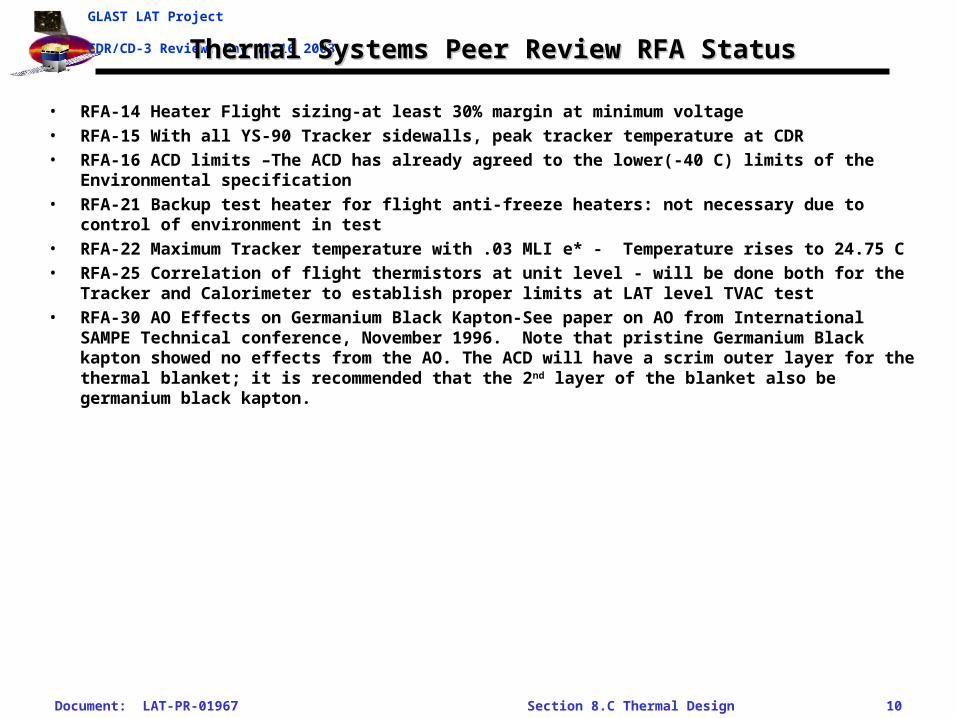
• RFA-14 Heater Flight sizing-at least 30% margin at minimum voltage
• RFA-15 With all YS-90 Tracker sidewalls, peak tracker temperature at CDR
• RFA-16 ACD limits –The ACD has already agreed to the lower(-40 C) limits of the Environmental specification
• RFA-21 Backup test heater for flight anti-freeze heaters: not necessary due to control of environment in test
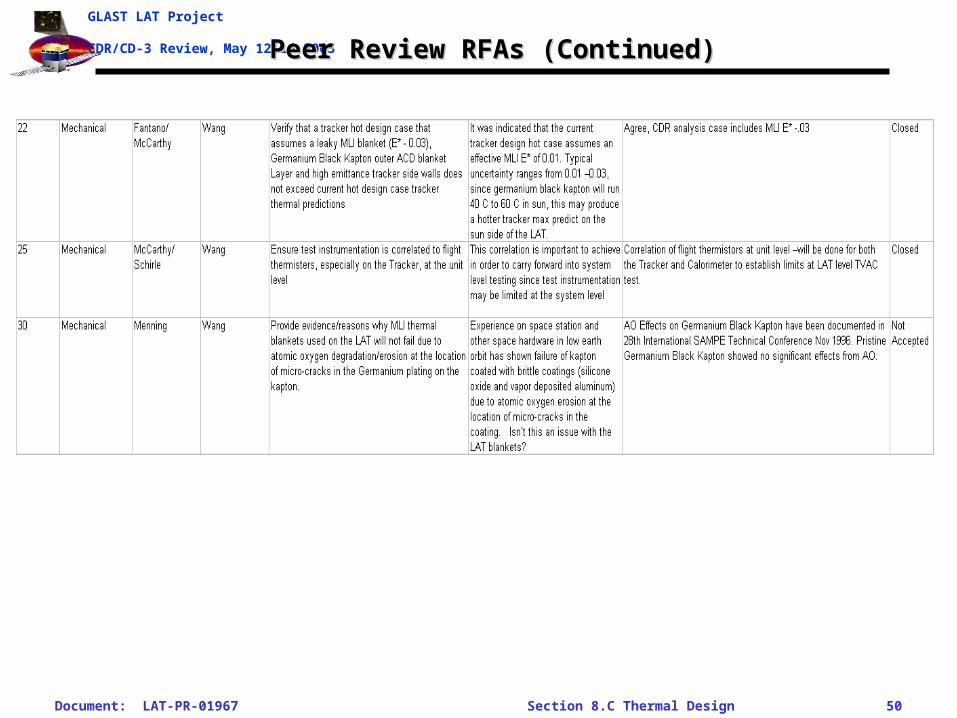
• RFA-22 Maximum Tracker temperature with .03 MLI e* - Temperature rises to 24.75 C
• RFA-25 Correlation of flight thermistors at unit level - will be done both for the Tracker and Calorimeter to establish proper limits at LAT level TVAC test
• RFA-30 AO Effects on Germanium Black Kapton-See paper on AO from International SAMPE Technical conference, November 1996. Note that pristine Germanium Black kapton showed no effects from the AO. The ACD will have a scrim outer layer for the thermal blanket; it is recommended that the 2nd layer of the blanket also be germanium black kapton.

Document: LAT-PR-01967 Section 8.C Thermal Design 11
GLAST LAT Project
CDR/CD-3 Review, May 12-16 2003Driving Thermal Design RequirementsDriving Thermal Design Requirements
Parameter Requirement Design Margin ComplyVer. Meth
od
Driving Req
Minimum Radiator area (#) > 5.4 m2 5.57 m2 0.17 m2 Y I433-IRD-
0001 3.2.3.4.1
Max process power indefinite dissipation 615 W @ T(max)615 W LAT + 35 W
Rad @ 29.4 C
5 C uncertainty + 0.6 C
OperatingY T, A
LAT-TD-00225-5
Peak process power dissipated for 10 min (#)720 W for 10 min
@ T(max)720 W for 10 min @
<T(max) Y T, A
LAT-TD-00225-5
Min process power indefinite dissipation 495 W @ T(min) 495 W @ -10 C50% Rad
control auth.Y T, A
LAT-TD-00225-5
Capable of normal operation when loaded by 75 W/Rad of heat from SC solar arrays
75 W/Rad 73.4 W 0 W/Rad Y T, A433-IRD-
0001 3.2.3.4.5
Orbit range of 450 km min to 575 km max 450 - 575 km450 km hot-case 575 km cold-case
OK Y ALAT-TD-00224-5
Capable of maintaining thermal control during exposure to IR, Albedo, Solar fluxes
OK Y T, A
Provide thermal control with LAT pointed 2pi/24/7/365 during any normal LAT mode
OK Y A
LAT max.min operating temp +30 C / -15 C +29.4 C / -3 C +0. 6 C / 12 C Y T, ALAT-SS-00778
Stability of LAT Control Temp point (3) +/- 3 C < +/- 3 C Y T, A
VCHP heater power when LAT is on (at Vmin) < 35 W 13 W @ 27 V 22 W Y DLAT-TD-00225-5
VCHP heater power when LAT is off (at Vmin) < 50 W 42 W @ 27 V 8 W Y D
When off, orbit-average survival heater power at 27 V min (not incl control auth margin)
< 220 W 158 W 62W Y D *Pending
When off, peak survival heater power < 560 W533 W (incl > 30%
control auth)27 W (5%) Y D *Pending
During Obs t-vac, TCS capable of full functionality "lying on its side"
OK Y T, A433-MAR-
0001
(1): Total Power = Process Power + VCHP Reservoir Heater Power = 615 + 35 = 650W (3): LCT defined as the Grid side
(2): Margin on heater power keeps minimum LAT temperature above AT limits of the Grid--DSHP interface point
Document: LAT-PR-01967 Section 8.C Thermal Design 12
GLAST LAT Project
CDR/CD-3 Review, May 12-16 2003Thermal Model Details: LAT Dissipated PowerThermal Model Details: LAT Dissipated Power
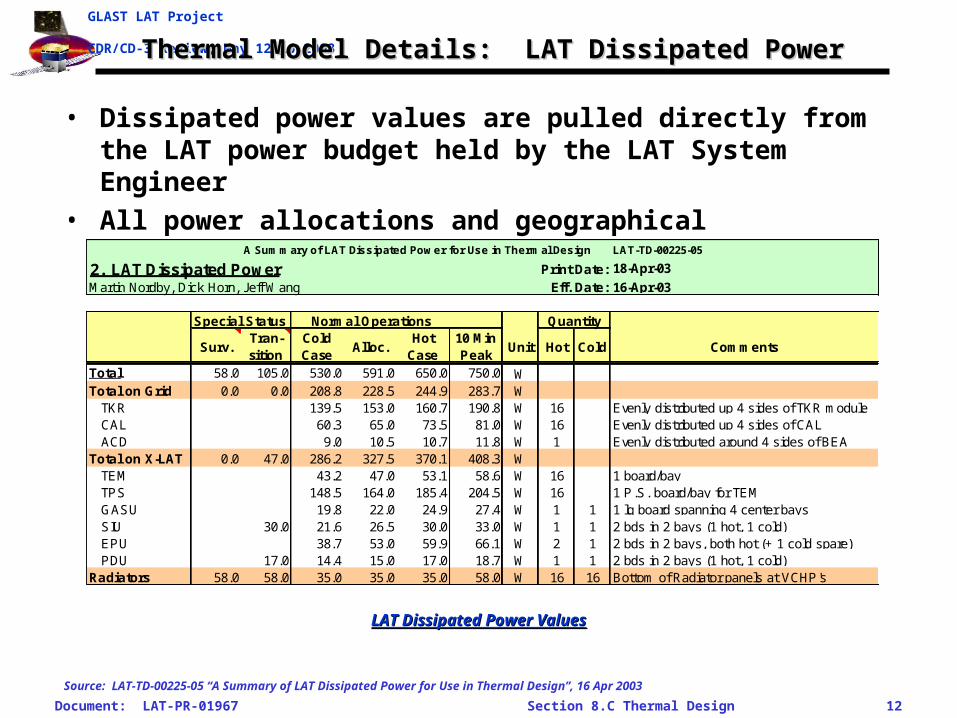
• Dissipated power values are pulled directly from the LAT power budget held by the LAT System Engineer
• All power allocations and geographical distribution is under CCB control
LAT Dissipated Power ValuesLAT Dissipated Power Values
Source: LAT-TD-00225-05 “A Summary of LAT Dissipated Power for Use in Thermal Design”, 16 Apr 2003
A Summary of LAT Dissipated Power for Use in Thermal Design LAT-TD-00225-05
2. LAT Dissipated Power Print Date: 18-Apr-03
Martin Nordby, Dick Horn, Jeff Wang Eff. Date: 16-Apr-03
Special Status Normal Operations Quantity
Surv.Tran-sition
Cold Case
Alloc.Hot
Case10 Min Peak
Unit Hot Cold Comments
Total 58.0 105.0 530.0 591.0 650.0 750.0 WTotal on Grid 0.0 0.0 208.8 228.5 244.9 283.7 W
TKR 139.5 153.0 160.7 190.8 W 16 Evenly distributed up 4 sides of TKR moduleCAL 60.3 65.0 73.5 81.0 W 16 Evenly distributed up 4 sides of CALACD 9.0 10.5 10.7 11.8 W 1 Evenly distributed around 4 sides of BEA
Total on X-LAT 0.0 47.0 286.2 327.5 370.1 408.3 WTEM 43.2 47.0 53.1 58.6 W 16 1 board/bayTPS 148.5 164.0 185.4 204.5 W 16 1 P.S. board/bay for TEMGASU 19.8 22.0 24.9 27.4 W 1 1 1 lg board spanning 4 center baysSIU 30.0 21.6 26.5 30.0 33.0 W 1 1 2 bds in 2 bays (1 hot, 1 cold)EPU 38.7 53.0 59.9 66.1 W 2 1 2 bds in 2 bays, both hot (+ 1 cold spare)PDU 17.0 14.4 15.0 17.0 18.7 W 1 1 2 bds in 2 bays (1 hot, 1 cold)
Radiators 58.0 58.0 35.0 35.0 35.0 58.0 W 16 16 Bottom of Radiator panels at VCHP's
Document: LAT-PR-01967 Section 8.C Thermal Design 13
GLAST LAT Project
CDR/CD-3 Review, May 12-16 2003Thermal Model Details: Electronics Box Dissipated PowerThermal Model Details: Electronics Box Dissipated Power
Source: LAT-TD-00225-04 “A Summary of LAT Dissipated Power for Use in Thermal Design”, 13 Mar 2003
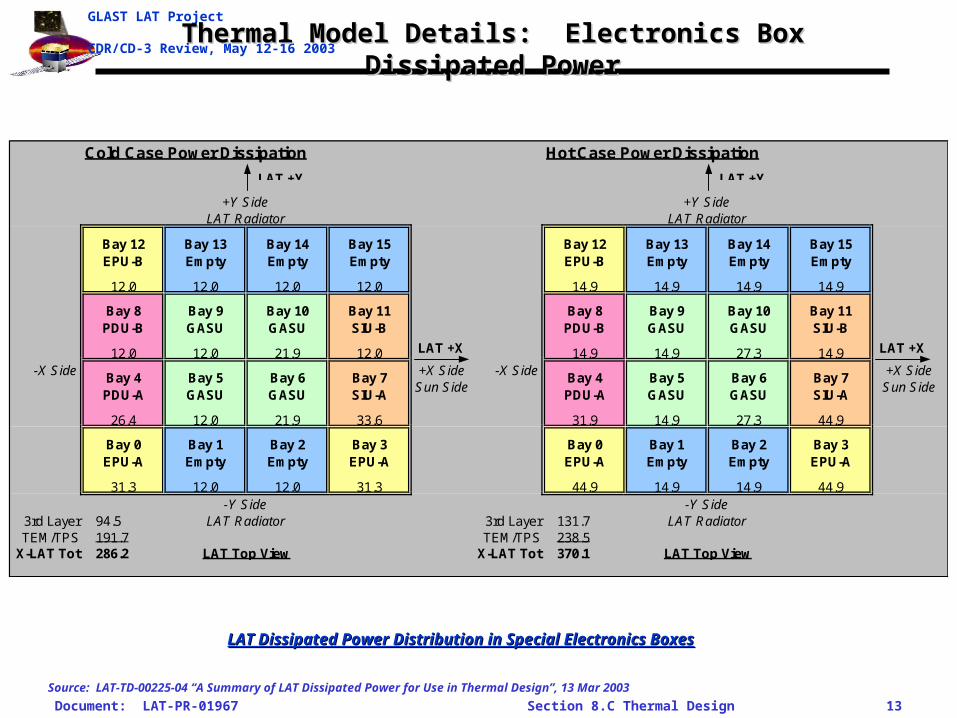
LAT Dissipated Power Distribution in Special Electronics BoxesLAT Dissipated Power Distribution in Special Electronics Boxes
Cold Case Power Dissipation Hot Case Power Dissipation
Bay 12EPU-B
Bay 13Empty
Bay 14Empty
Bay 15Empty
Bay 12EPU-B
Bay 13Empty
Bay 14Empty
Bay 15Empty
12.0 12.0 12.0 12.0 14.9 14.9 14.9 14.9
Bay 8PDU-B
Bay 9GASU
Bay 10GASU
Bay 11SIU-B
Bay 8PDU-B
Bay 9GASU
Bay 10GASU
Bay 11SIU-B
12.0 12.0 21.9 12.0 14.9 14.9 27.3 14.9-X Side
Bay 4PDU-A
Bay 5GASU
Bay 6GASU
Bay 7SIU-A
+X SideSun Side
-X SideBay 4PDU-A
Bay 5GASU
Bay 6GASU
Bay 7SIU-A
+X SideSun Side
26.4 12.0 21.9 33.6 31.9 14.9 27.3 44.9
Bay 0EPU-A
Bay 1Empty
Bay 2Empty
Bay 3EPU-A
Bay 0EPU-A
Bay 1Empty
Bay 2Empty
Bay 3EPU-A
31.3 12.0 12.0 31.3 44.9 14.9 14.9 44.9
3rd Layer 94.5 3rd Layer 131.7TEM/TPS 191.7 TEM/TPS 238.5
X-LAT Tot 286.2 X-LAT Tot 370.1 LAT Top View
-Y SideLAT Radiator
+Y SideLAT Radiator
+Y SideLAT Radiator
-Y SideLAT Radiator
LAT Top View
LAT +X
LAT +Y
LAT +X
LAT +Y
Document: LAT-PR-01967 Section 8.C Thermal Design 14
GLAST LAT Project
CDR/CD-3 Review, May 12-16 2003Environmental Temperature LimitsEnvironmental Temperature Limits
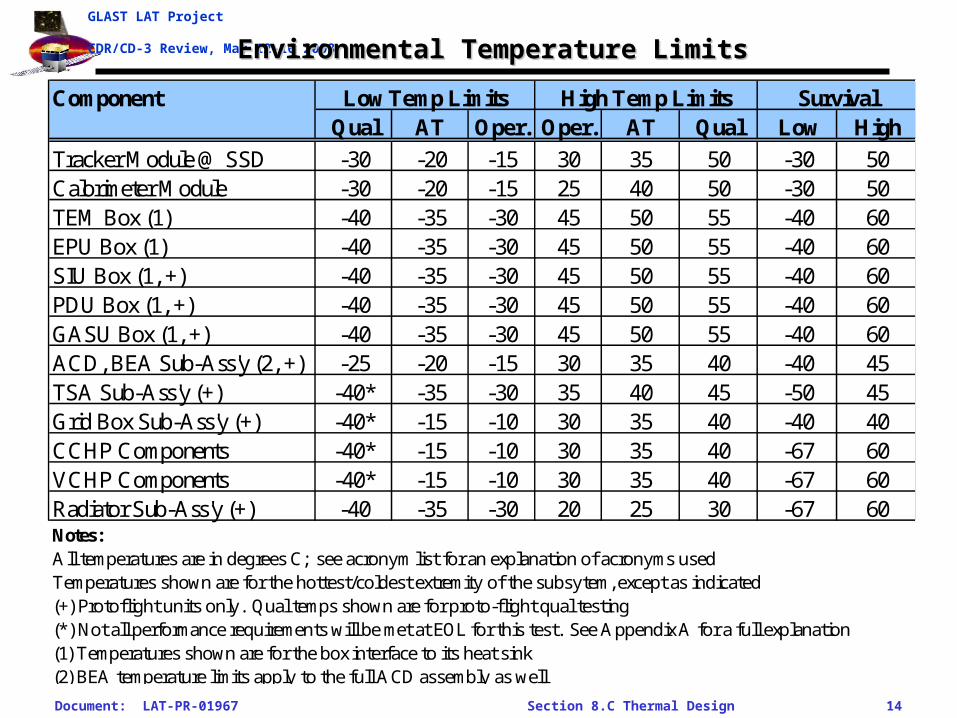
Component Low Temp Limits High Temp Limits SurvivalQual AT Oper. Oper. AT Qual Low High
Tracker Module @ SSD -30 -20 -15 30 35 50 -30 50Calorimeter Module -30 -20 -15 25 40 50 -30 50TEM Box (1) -40 -35 -30 45 50 55 -40 60EPU Box (1) -40 -35 -30 45 50 55 -40 60SIU Box (1, +) -40 -35 -30 45 50 55 -40 60PDU Box (1, +) -40 -35 -30 45 50 55 -40 60GASU Box (1, +) -40 -35 -30 45 50 55 -40 60ACD, BEA Sub-Ass'y (2, +) -25 -20 -15 30 35 40 -40 45TSA Sub-Ass'y (+) -40* -35 -30 35 40 45 -50 45Grid Box Sub-Ass'y (+) -40* -15 -10 30 35 40 -40 40CCHP Components -40* -15 -10 30 35 40 -67 60VCHP Components -40* -15 -10 30 35 40 -67 60Radiator Sub-Ass'y (+) -40 -35 -30 20 25 30 -67 60Notes:All temperatures are in degrees C; see acronym list for an explanation of acronyms usedTemperatures shown are for the hottest/coldest extremity of the subsytem, except as indicated(+) Protoflight units only. Qual temps shown are for proto-flight qual testing(*) Not all performance requirements will be met at EOL for this test. See Appendix A for a full explanation(1) Temperatures shown are for the box interface to its heat sink(2) BEA temperature limits apply to the full ACD assembly as well
Document: LAT-PR-01967 Section 8.C Thermal Design 15
GLAST LAT Project
CDR/CD-3 Review, May 12-16 2003Verification Test TemperaturesVerification Test Temperatures
• Component Level Testing Minimum test margins– 5 C margin from Operating to AT level– 5 C margin from AT to LAT PFQ level
• LAT level Thermal Vacuum Test strategy– Drive all components to their ATP/PFQ level
• Virtually impossible to achieve
• Will most likely be limited by one or two components

Document: LAT-PR-01967 Section 8.C Thermal Design 16
GLAST LAT Project
CDR/CD-3 Review, May 12-16 2003LAT Thermal Math Model and StatusLAT Thermal Math Model and Status
• TSS Model-Calculates radks and heat rates.– 252 Surfaces External, 454 Internal– 2787 Active Nodes External, 1436 Internal
• Sinda Model.– Submodels.
• ACD CDR model• Detailed TKR model• Reduced Cal model• Detailed Grid model• Updated X-LAT and Electronics model• Bus model includes solar arrays and SV
– IRD array for hot case.– Cold case/survival uses Spectrum Astro PDR
solar array.• Detailed radiator and heat pipes• 9812 nodes total
– Heat pipe logic in VCHPs to predict gas front
– Added VCHP heater control logic• Logic will be part of SIU control of thermal system
Model status: the model is mature and includes all subsystem updates for CDR
Document: LAT-PR-01967 Section 8.C Thermal Design 17
GLAST LAT Project
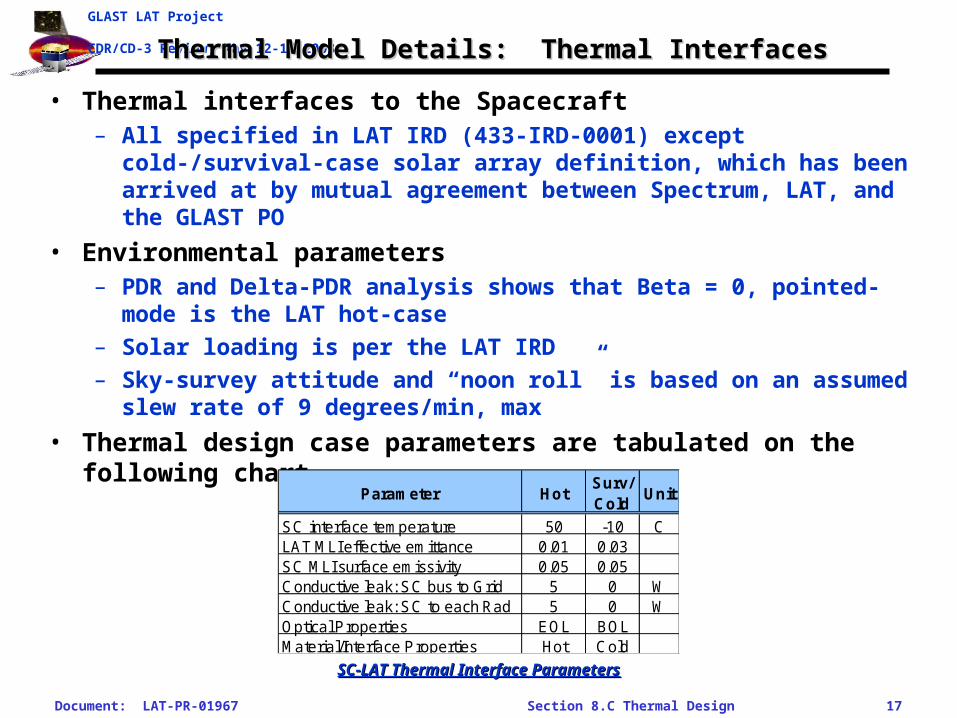
CDR/CD-3 Review, May 12-16 2003Thermal Model Details: Thermal InterfacesThermal Model Details: Thermal Interfaces
• Thermal interfaces to the Spacecraft– All specified in LAT IRD (433-IRD-0001) except cold-/survival-case
solar array definition, which has been arrived at by mutual agreement between Spectrum, LAT, and the GLAST PO
• Environmental parameters– PDR and Delta-PDR analysis shows that Beta = 0, pointed-mode is
the LAT hot-case
– Solar loading is per the LAT IRD
– Sky-survey attitude and “noon roll” is based on an assumed slew rate of 9 degrees/min, max
• Thermal design case parameters are tabulated on the following chart
Parameter HotSurv/Cold
Unit
SC interface temperature 50 -10 CLAT MLI effective emittance 0.01 0.03SC MLI surface emissivity 0.05 0.05Conductive leak: SC bus to Grid 5 0 WConductive leak: SC to each Rad 5 0 WOptical Properties EOL BOLMaterial/Interface Properties Hot Cold
SC-LAT Thermal Interface ParametersSC-LAT Thermal Interface Parameters
Document: LAT-PR-01967 Section 8.C Thermal Design 18
GLAST LAT Project
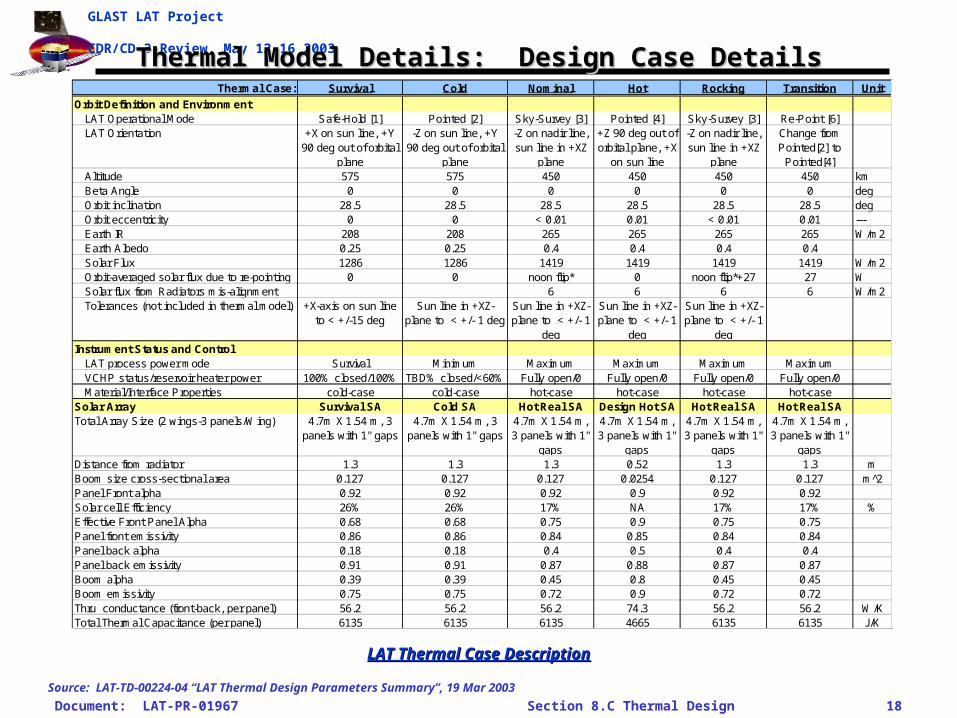
CDR/CD-3 Review, May 12-16 2003Thermal Model Details: Design Case DetailsThermal Model Details: Design Case DetailsThermal Case: Survival Cold Nominal Hot Rocking Transition Unit
Orbit Definition and EnvironmentLAT Operational Mode Safe-Hold [1] Pointed [2] Sky-Survey [3] Pointed [4] Sky-Survey [3] Re-Point [6]LAT Orientation +X on sun line, +Y
90 deg out of orbital plane
-Z on sun line, +Y 90 deg out of orbital
plane
-Z on nadir line, sun line in +XZ
plane
+Z 90 deg out of orbital plane, +X
on sun line
-Z on nadir line, sun line in +XZ
plane
Change from Pointed[2] to
Pointed[4]Altitude 575 575 450 450 450 450 kmBeta Angle 0 0 0 0 0 0 degOrbit inclination 28.5 28.5 28.5 28.5 28.5 28.5 degOrbit eccentricity 0 0 < 0.01 0.01 < 0.01 0.01 ---Earth IR 208 208 265 265 265 265 W/m2Earth Albedo 0.25 0.25 0.4 0.4 0.4 0.4Solar Flux 1286 1286 1419 1419 1419 1419 W/m2Orbit-averaged solar flux due to re-pointing 0 0 noon flip* 0 noon flip*+27 27 WSolar flux from Radiators mis-alignment 6 6 6 6 W/m2Tolerances (not included in thermal model) +X-axis on sun line
to < +/-15 deg Sun line in +XZ-
plane to < +/- 1 degSun line in +XZ-plane to < +/- 1
deg
Sun line in +XZ-plane to < +/- 1
deg
Sun line in +XZ-plane to < +/- 1
degInstrument Status and Control
LAT process power mode Survival Minimum Maximum Maximum Maximum MaximumVCHP status/reservoir heater power 100% closed/100% TBD% closed/<60% Fully open/0 Fully open/0 Fully open/0 Fully open/0Material/Interface Properties cold-case cold-case hot-case hot-case hot-case hot-case
Solar Array Survival SA Cold SA Hot Real SA Design Hot SA Hot Real SA Hot Real SATotal Array Size (2 wings-3 panels/Wing) 4.7m X 1.54 m, 3
panels with 1" gaps4.7m X 1.54 m, 3
panels with 1" gaps4.7m X 1.54 m, 3 panels with 1"
gaps
4.7m X 1.54 m, 3 panels with 1"
gaps
4.7m X 1.54 m, 3 panels with 1"
gaps
4.7m X 1.54 m, 3 panels with 1"
gapsDistance from radiator 1.3 1.3 1.3 0.52 1.3 1.3 mBoom size cross-sectional area 0.127 0.127 0.127 0.0254 0.127 0.127 m 2̂Panel Front alpha 0.92 0.92 0.92 0.9 0.92 0.92Solar cell Efficiency 26% 26% 17% NA 17% 17% %Effective Front Panel Alpha 0.68 0.68 0.75 0.9 0.75 0.75Panel front emissivity 0.86 0.86 0.84 0.85 0.84 0.84Panel back alpha 0.18 0.18 0.4 0.5 0.4 0.4Panel back emissivity 0.91 0.91 0.87 0.88 0.87 0.87Boom alpha 0.39 0.39 0.45 0.8 0.45 0.45Boom emissivity 0.75 0.75 0.72 0.9 0.72 0.72Thru conductance (front-back, per panel) 56.2 56.2 56.2 74.3 56.2 56.2 W/KTotal Thermal Capacitance (per panel) 6135 6135 6135 4665 6135 6135 J/K
Source: LAT-TD-00224-04 “LAT Thermal Design Parameters Summary”, 19 Mar 2003
LAT Thermal Case DescriptionLAT Thermal Case Description
Document: LAT-PR-01967 Section 8.C Thermal Design 19
GLAST LAT Project
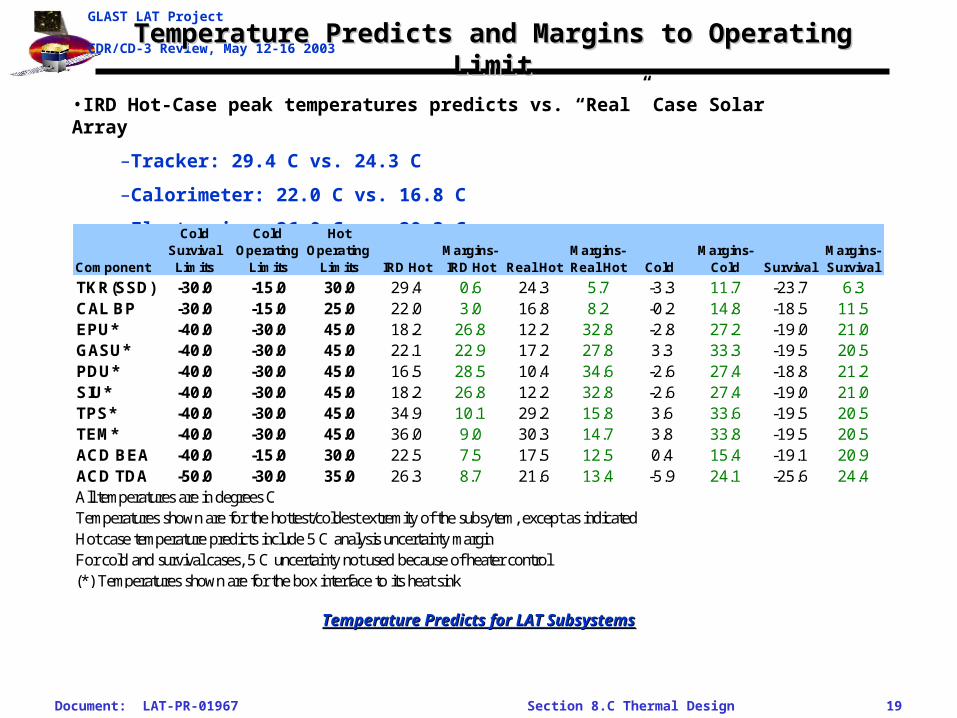
CDR/CD-3 Review, May 12-16 2003Temperature Predicts and Margins to Operating LimitTemperature Predicts and Margins to Operating Limit
Temperature Predicts for LAT SubsystemsTemperature Predicts for LAT Subsystems
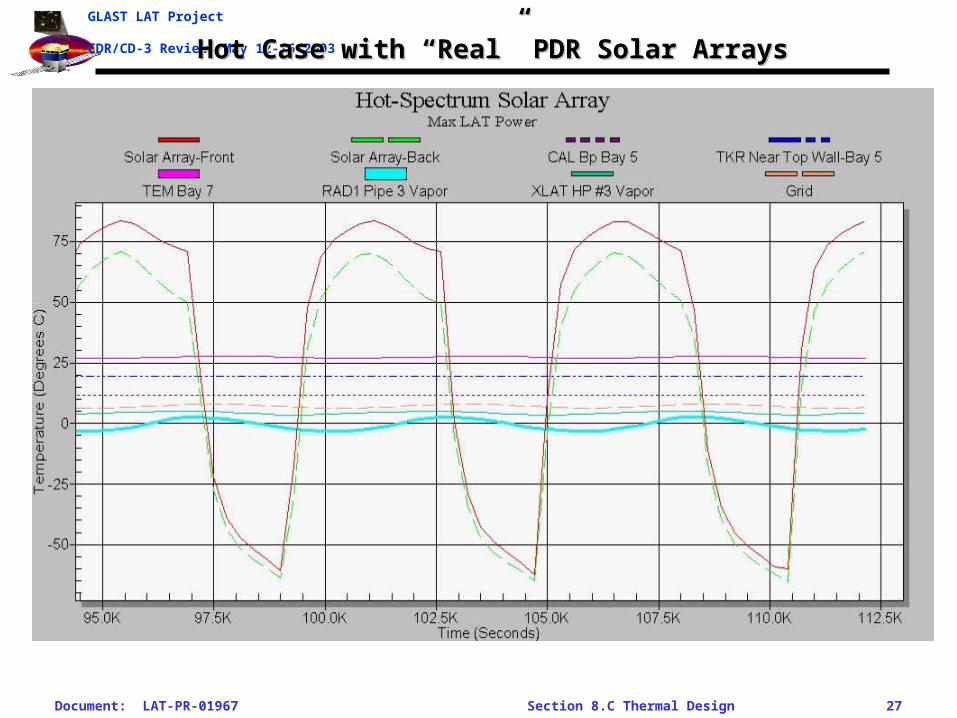
•IRD Hot-Case peak temperatures predicts vs. “Real” Case Solar Array
–Tracker: 29.4 C vs. 24.3 C
–Calorimeter: 22.0 C vs. 16.8 C
–Electronics: 36.0 C vs. 30.3 C
Component
Cold Survival Limits
Cold Operating
Limits
Hot Operating
Limits IRD HotMargins-IRD Hot Real Hot
Margins-Real Hot Cold
Margins-Cold Survival
Margins-Survival
TKR(SSD) -30.0 -15.0 30.0 29.4 0.6 24.3 5.7 -3.3 11.7 -23.7 6.3CAL BP -30.0 -15.0 25.0 22.0 3.0 16.8 8.2 -0.2 14.8 -18.5 11.5EPU* -40.0 -30.0 45.0 18.2 26.8 12.2 32.8 -2.8 27.2 -19.0 21.0GASU* -40.0 -30.0 45.0 22.1 22.9 17.2 27.8 3.3 33.3 -19.5 20.5PDU* -40.0 -30.0 45.0 16.5 28.5 10.4 34.6 -2.6 27.4 -18.8 21.2SIU* -40.0 -30.0 45.0 18.2 26.8 12.2 32.8 -2.6 27.4 -19.0 21.0TPS* -40.0 -30.0 45.0 34.9 10.1 29.2 15.8 3.6 33.6 -19.5 20.5TEM* -40.0 -30.0 45.0 36.0 9.0 30.3 14.7 3.8 33.8 -19.5 20.5ACD BEA -40.0 -15.0 30.0 22.5 7.5 17.5 12.5 0.4 15.4 -19.1 20.9ACD TDA -50.0 -30.0 35.0 26.3 8.7 21.6 13.4 -5.9 24.1 -25.6 24.4All temperatures are in degrees CTemperatures shown are for the hottest/coldest extremity of the subsytem, except as indicatedHot case temperature predicts include 5 C analysis uncertainty marginFor cold and survival cases, 5 C uncertainty not used because of heater control(*) Temperatures shown are for the box interface to its heat sink
Document: LAT-PR-01967 Section 8.C Thermal Design 20
GLAST LAT Project
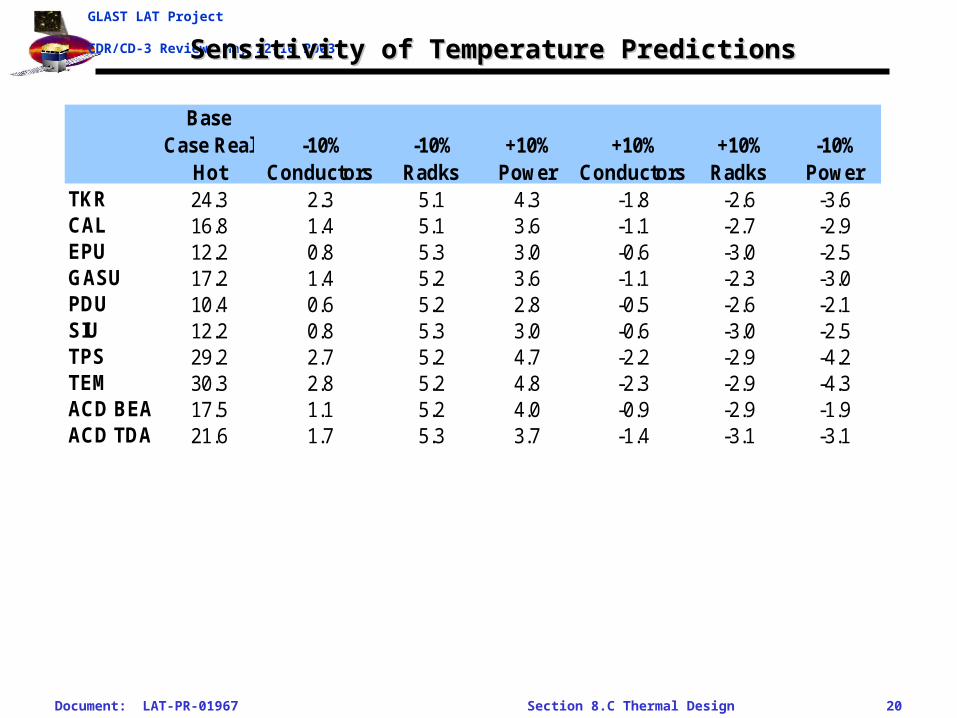
CDR/CD-3 Review, May 12-16 2003Sensitivity of Temperature PredictionsSensitivity of Temperature Predictions
Base Case Real
Hot -10%
Conductors -10% Radks
+10% Power
+10% Conductors
+10% Radks
-10% Power
TKR 24.3 2.3 5.1 4.3 -1.8 -2.6 -3.6CAL 16.8 1.4 5.1 3.6 -1.1 -2.7 -2.9EPU 12.2 0.8 5.3 3.0 -0.6 -3.0 -2.5GASU 17.2 1.4 5.2 3.6 -1.1 -2.3 -3.0PDU 10.4 0.6 5.2 2.8 -0.5 -2.6 -2.1SIU 12.2 0.8 5.3 3.0 -0.6 -3.0 -2.5TPS 29.2 2.7 5.2 4.7 -2.2 -2.9 -4.2TEM 30.3 2.8 5.2 4.8 -2.3 -2.9 -4.3ACD BEA 17.5 1.1 5.2 4.0 -0.9 -2.9 -1.9ACD TDA 21.6 1.7 5.3 3.7 -1.4 -3.1 -3.1
Document: LAT-PR-01967 Section 8.C Thermal Design 21
GLAST LAT Project
CDR/CD-3 Review, May 12-16 2003Hot Case TKR Peak Temperature GradientHot Case TKR Peak Temperature Gradient
Location Temp (degC)
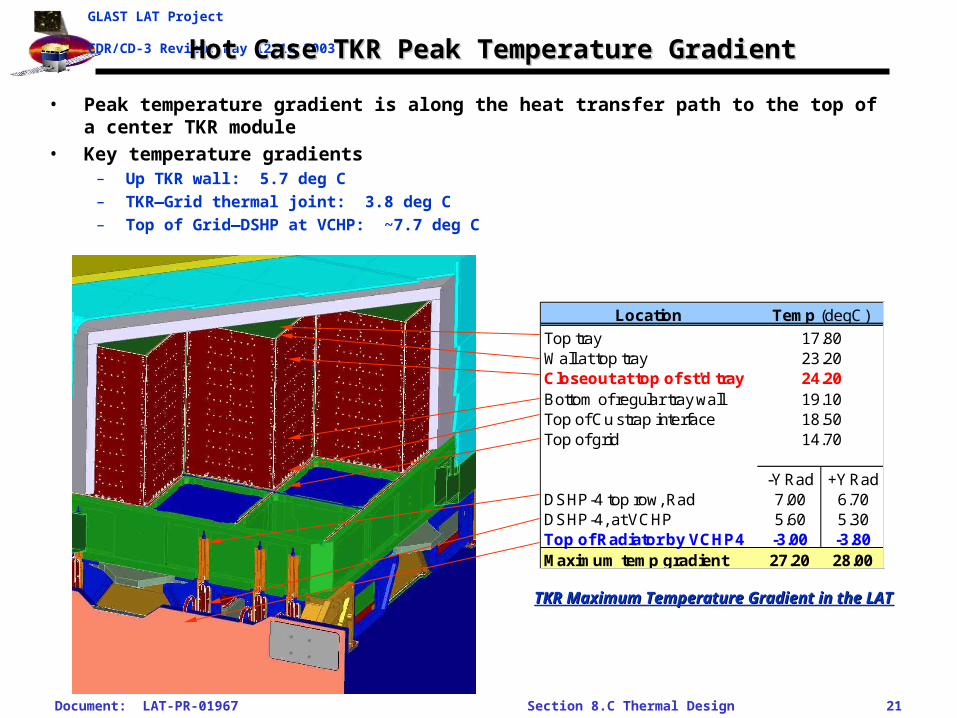
Top tray 17.80Wall at top tray 23.20Closeout at top of st'd tray 24.20Bottom of regular tray wall 19.10Top of Cu strap interface 18.50Top of grid 14.70
-Y Rad +Y RadDSHP-4 top row, Rad 7.00 6.70DSHP-4, at VCHP 5.60 5.30Top of Radiator by VCHP4 -3.00 -3.80Maximum temp gradient 27.20 28.00
• Peak temperature gradient is along the heat transfer path to the top of a center TKR module
• Key temperature gradients– Up TKR wall: 5.7 deg C– TKR—Grid thermal joint: 3.8 deg C– Top of Grid—DSHP at VCHP: ~7.7 deg C
TKR Maximum Temperature Gradient in the LATTKR Maximum Temperature Gradient in the LAT
Document: LAT-PR-01967 Section 8.C Thermal Design 22
GLAST LAT Project
CDR/CD-3 Review, May 12-16 2003Hot Case Environmental Orbit LoadsHot Case Environmental Orbit Loads
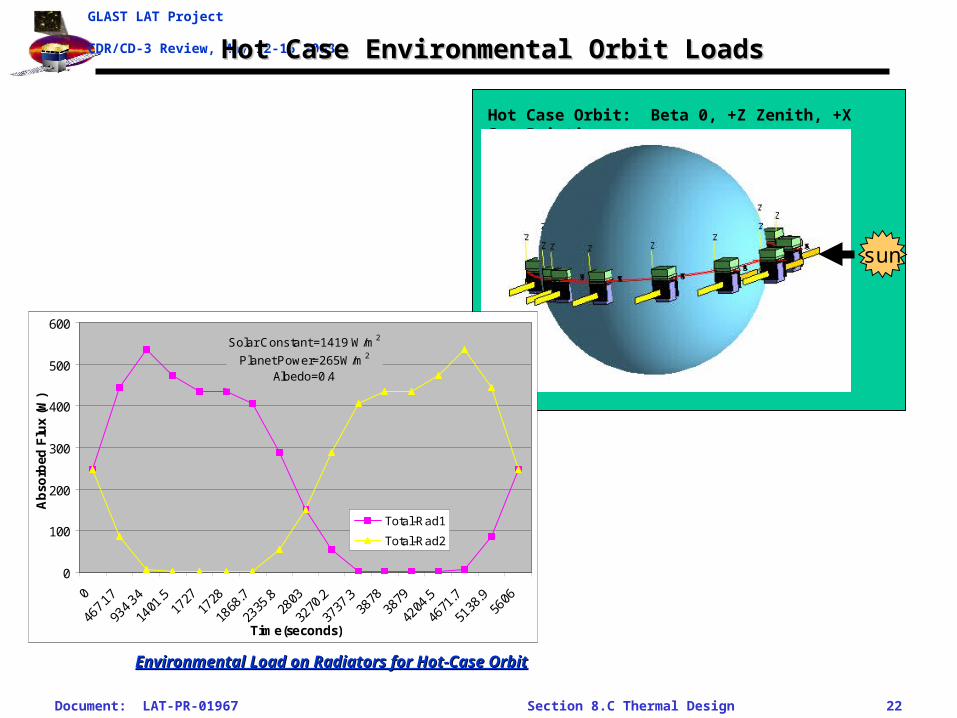
Hot Case Orbit: Beta 0, +Z Zenith, +X Sun Pointing
sun
Environmental Load on Radiators for Hot-Case OrbitEnvironmental Load on Radiators for Hot-Case Orbit
Solar Constant =1419 W/m 2
Planet Power=265W/m2
Albedo=0.4
0
100
200
300
400
500
600
0
467.1
7
934.3
4
1401
.517
2717
28
1868
.7
2335
.828
03
3270
.2
3737
.338
7838
79
4204
.5
4671
.7
5138
.956
06
Time(seconds)
Ab
sorb
ed F
lux
(W)
Total-Rad1
Total-Rad2

Document: LAT-PR-01967 Section 8.C Thermal Design 23
GLAST LAT Project
CDR/CD-3 Review, May 12-16 2003
2009 W orbital heating
252 W orbital heating
235 W orbital heating
83.5 W solar array heating 83.6 W solar array heating
653 W to space 650 W to space
2068 W to space Instrument Power
615 W
17 W from bus
42 W solar array heating
Y
Z
27 W from bus
4.0 W to space 3.9 W to space
Hot Case QMAPHot Case QMAP
Orbital heatingRadiated to spaceBus heatingBus heatingVCHP reservoir-space VCHP reservoir
62 W orbital heating
83 W to space
Hot Case QMAPHot Case QMAP
Hot Operational Orbit Average QmapHot Operational Orbit Average Qmap
28 W from bus
2.1 W solar 2.1 W solar
Document: LAT-PR-01967 Section 8.C Thermal Design 24
GLAST LAT Project
CDR/CD-3 Review, May 12-16 2003 Hot Case IRD TemperaturesHot Case IRD Temperatures
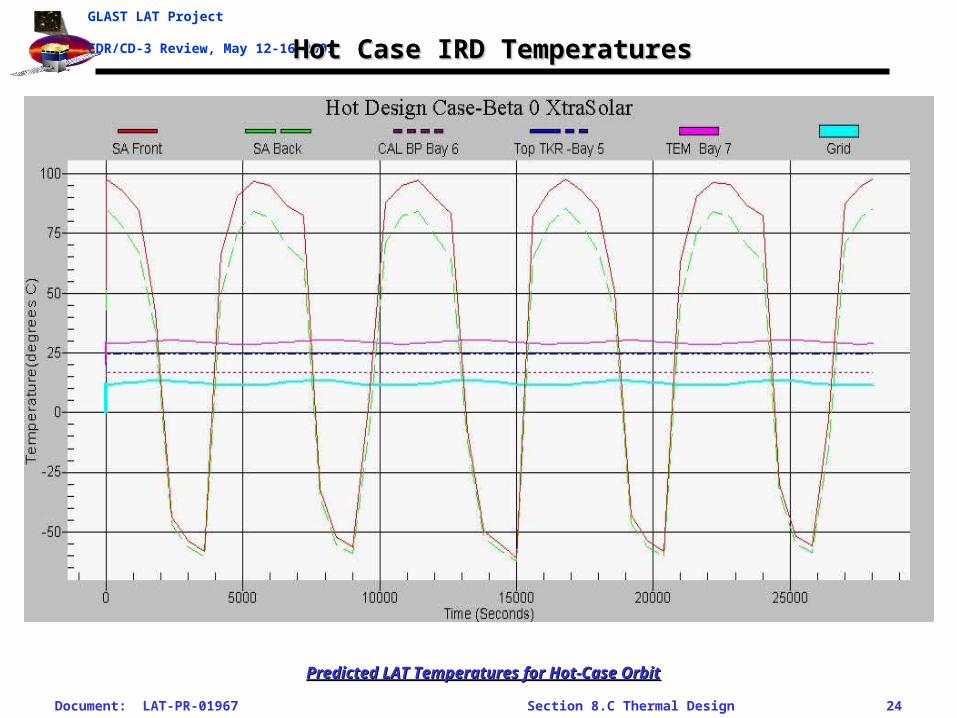
Predicted LAT Temperatures for Hot-Case OrbitPredicted LAT Temperatures for Hot-Case Orbit
Document: LAT-PR-01967 Section 8.C Thermal Design 25
GLAST LAT Project
CDR/CD-3 Review, May 12-16 2003Hot Case IRD Tracker TemperatureHot Case IRD Tracker Temperature
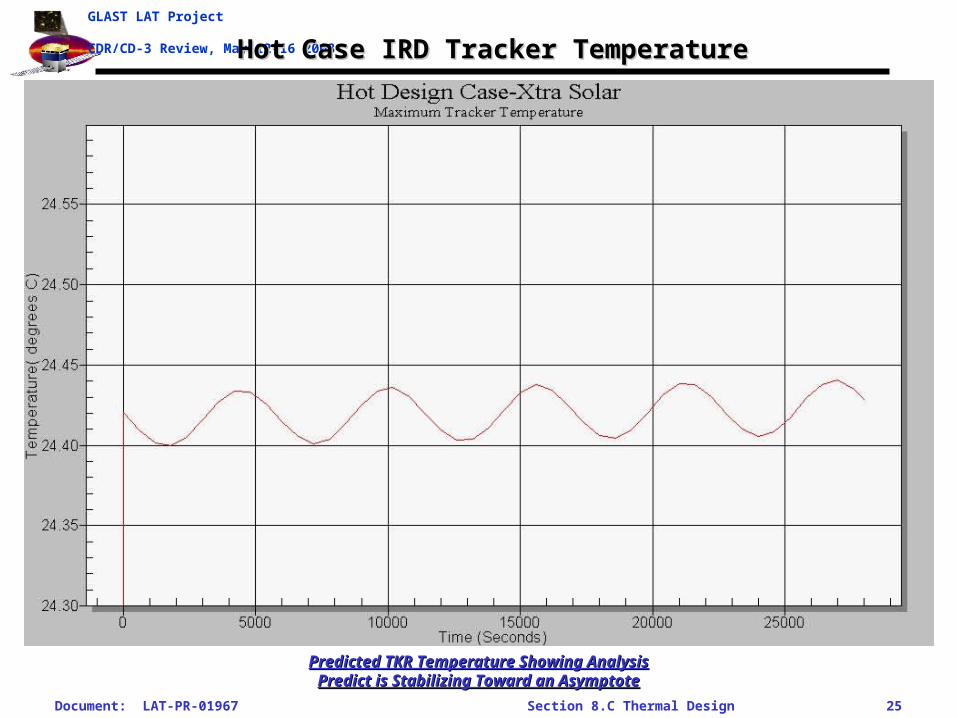
Predicted TKR Temperature Showing Analysis Predicted TKR Temperature Showing Analysis Predict is Stabilizing Toward an AsymptotePredict is Stabilizing Toward an Asymptote

Document: LAT-PR-01967 Section 8.C Thermal Design 26
GLAST LAT Project
CDR/CD-3 Review, May 12-16 2003Hot Case IRD Radiator TemperaturesHot Case IRD Radiator Temperatures
Document: LAT-PR-01967 Section 8.C Thermal Design 27
GLAST LAT Project
CDR/CD-3 Review, May 12-16 2003Hot Case with “Real” PDR Solar ArraysHot Case with “Real” PDR Solar Arrays
Document: LAT-PR-01967 Section 8.C Thermal Design 28
GLAST LAT Project
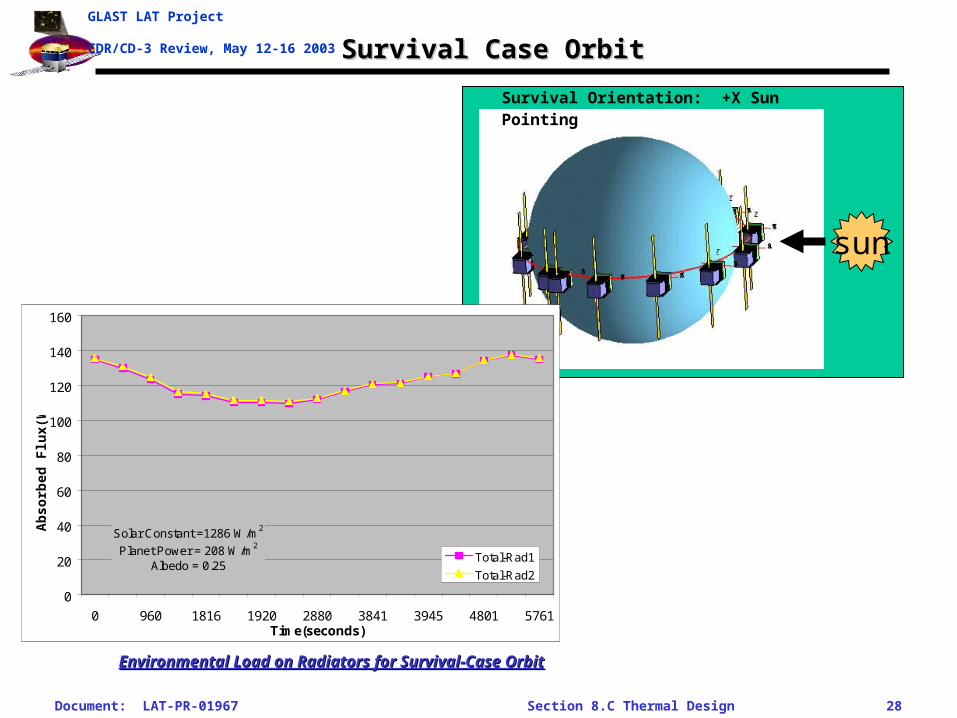
CDR/CD-3 Review, May 12-16 2003 Survival Case OrbitSurvival Case Orbit
sun
Survival Orientation: +X Sun Pointing
Environmental Load on Radiators for Survival-Case OrbitEnvironmental Load on Radiators for Survival-Case Orbit
Solar Constant =1286 W/m2
Planet Power = 208 W/m2
Albedo = 0.25
0
20
40
60
80
100
120
140
160
0 960 1816 1920 2880 3841 3945 4801 5761Time(seconds)
Ab
so
rbe
d F
lux
(W)
Total-Rad1
Total-Rad2
Document: LAT-PR-01967 Section 8.C Thermal Design 29
GLAST LAT Project
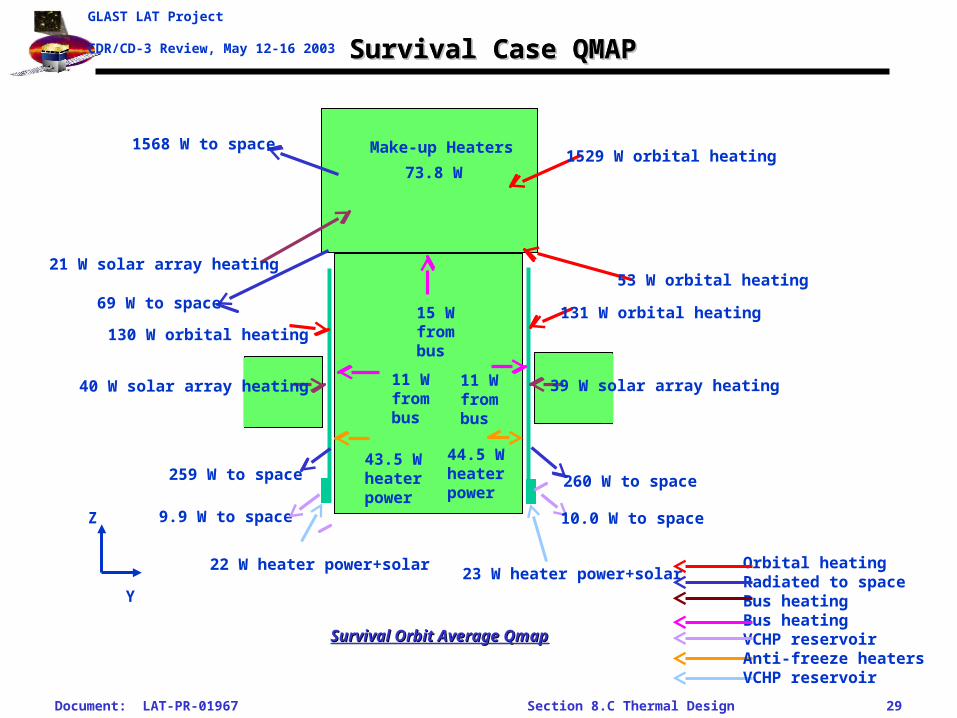
CDR/CD-3 Review, May 12-16 2003 Survival Case QMAPSurvival Case QMAP
1529 W orbital heating
130 W orbital heating
40 W solar array heating
259 W to space
1568 W to space Make-up Heaters
73.8 W
15 W from bus
21 W solar array heating
11 W from bus
9.9 W to space
43.5 W heater power
44.5 W heater power
69 W to space
53 W orbital heating
22 W heater power+solar
Survival Case QMAPSurvival Case QMAP
Y
Z
Survival Orbit Average QmapSurvival Orbit Average Qmap
Orbital heatingRadiated to spaceBus heatingBus heatingVCHP reservoir Anti-freeze heatersVCHP reservoir
131 W orbital heating
39 W solar array heating
260 W to space
10.0 W to space
23 W heater power+solar
11 W from bus
Document: LAT-PR-01967 Section 8.C Thermal Design 30
GLAST LAT Project
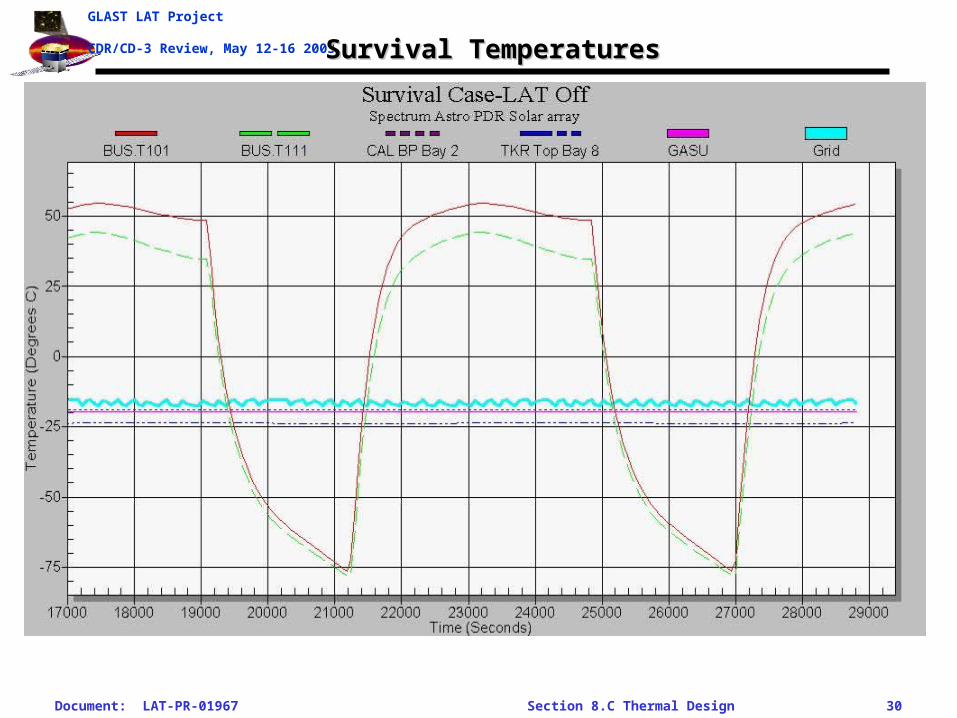
CDR/CD-3 Review, May 12-16 2003 Survival TemperaturesSurvival Temperatures
Document: LAT-PR-01967 Section 8.C Thermal Design 31
GLAST LAT Project
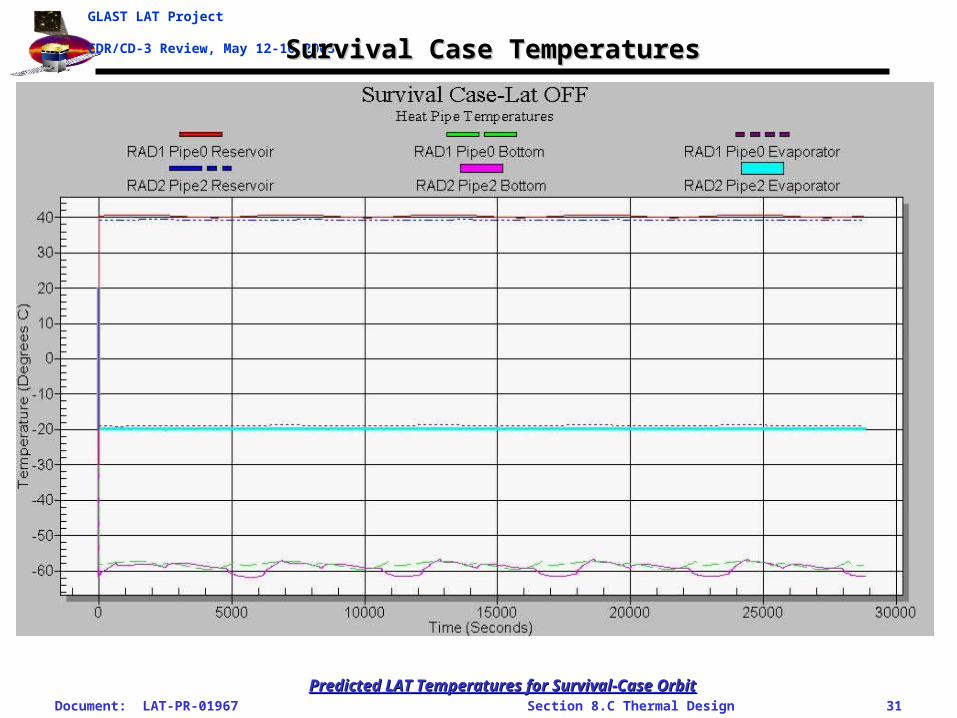
CDR/CD-3 Review, May 12-16 2003 Survival Case TemperaturesSurvival Case Temperatures
Predicted LAT Temperatures for Survival-Case OrbitPredicted LAT Temperatures for Survival-Case Orbit
Document: LAT-PR-01967 Section 8.C Thermal Design 32
GLAST LAT Project
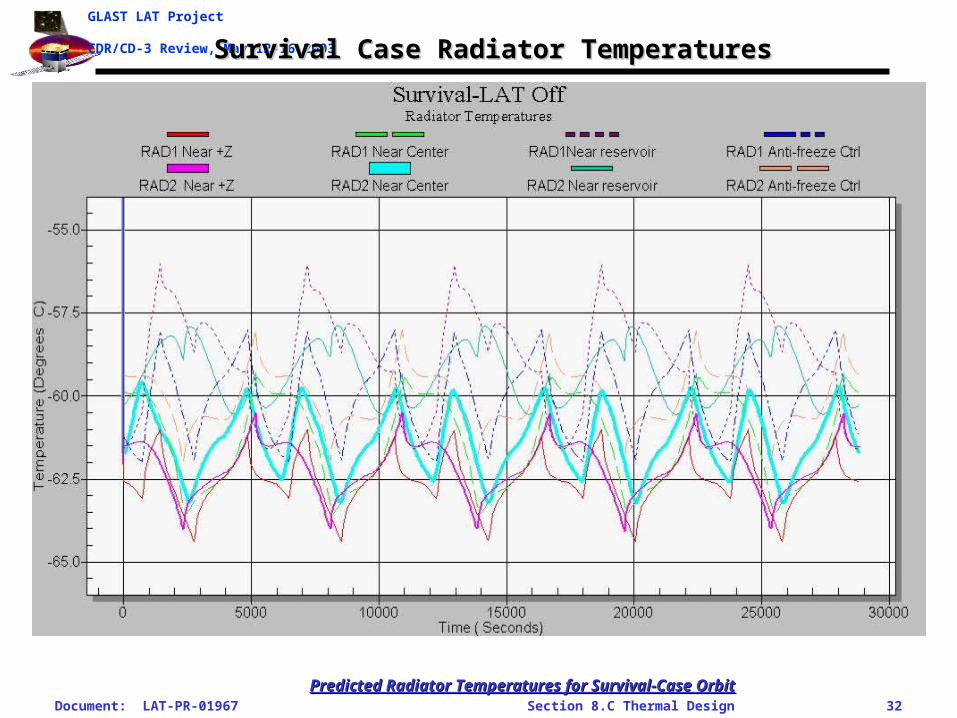
CDR/CD-3 Review, May 12-16 2003Survival Case Radiator TemperaturesSurvival Case Radiator Temperatures
Predicted Radiator Temperatures for Survival-Case OrbitPredicted Radiator Temperatures for Survival-Case Orbit

Document: LAT-PR-01967 Section 8.C Thermal Design 33
GLAST LAT Project
CDR/CD-3 Review, May 12-16 2003 Survival Heater PowerSurvival Heater Power
• Survival heater power (orbit average)• Grid make-up heaters 69 W• VCHP anti-freeze heaters 89 W• X-LAT Plate heaters 0 W• Total heater power 158 W
• Allocation: 220 Watts• Heater power margin: +62 W (43% margin)
Parameter Requirement Design Margin ComplyVer.
Method
When off, orbit-average survival heater power at 27 V min (not incl control auth margin)
< 220 W 158 W 62 W (39%) Y D
When off, peak survival heater power < 560 W533 W @ 35 V (incl >38% control auth)
27 W (5%) Y D
Control margin on heater power, Grid > 30% 62% 25% Y D
Control margin on heater power, Anti-Freeze > 30% 80% 38% Y D
Document: LAT-PR-01967 Section 8.C Thermal Design 34
GLAST LAT Project
CDR/CD-3 Review, May 12-16 2003VCHP Reservoir Heater PowerVCHP Reservoir Heater Power
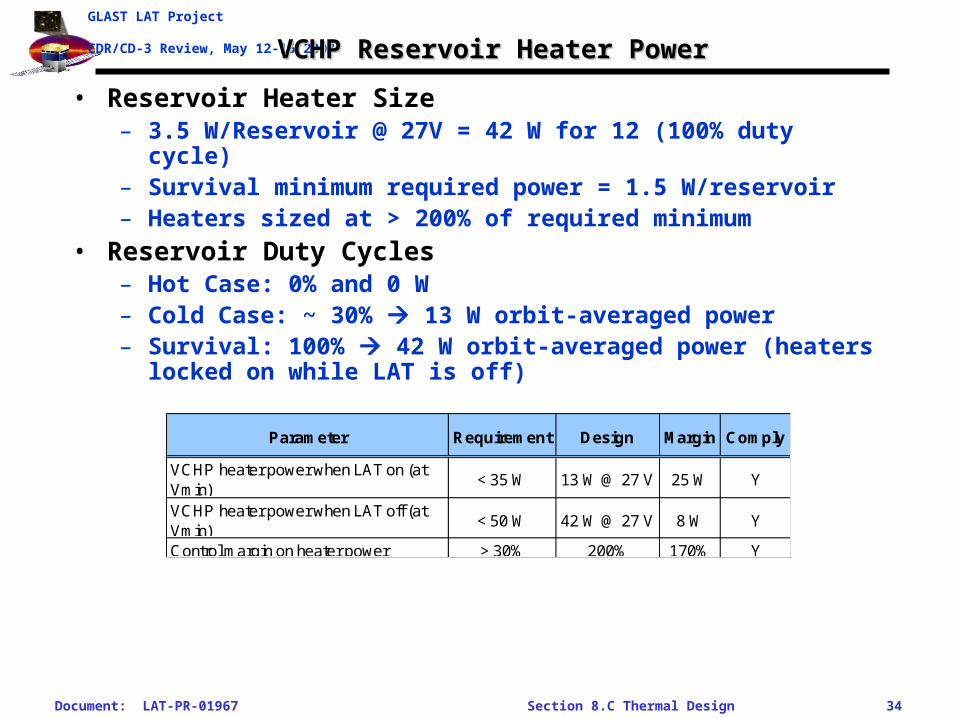
• Reservoir Heater Size– 3.5 W/Reservoir @ 27V = 42 W for 12 (100% duty cycle)– Survival minimum required power = 1.5 W/reservoir– Heaters sized at > 200% of required minimum
• Reservoir Duty Cycles– Hot Case: 0% and 0 W– Cold Case: ~ 30% 13 W orbit-averaged power– Survival: 100% 42 W orbit-averaged power (heaters locked on
while LAT is off)
Parameter Requirement Design Margin Comply
VCHP heater power when LAT on (at Vmin)
< 35 W 13 W @ 27 V 25 W Y
VCHP heater power when LAT off (at Vmin)
< 50 W 42 W @ 27 V 8 W Y
Control margin on heater power > 30% 200% 170% Y
Document: LAT-PR-01967 Section 8.C Thermal Design 35
GLAST LAT Project
CDR/CD-3 Review, May 12-16 2003 Cold Case TemperaturesCold Case Temperatures
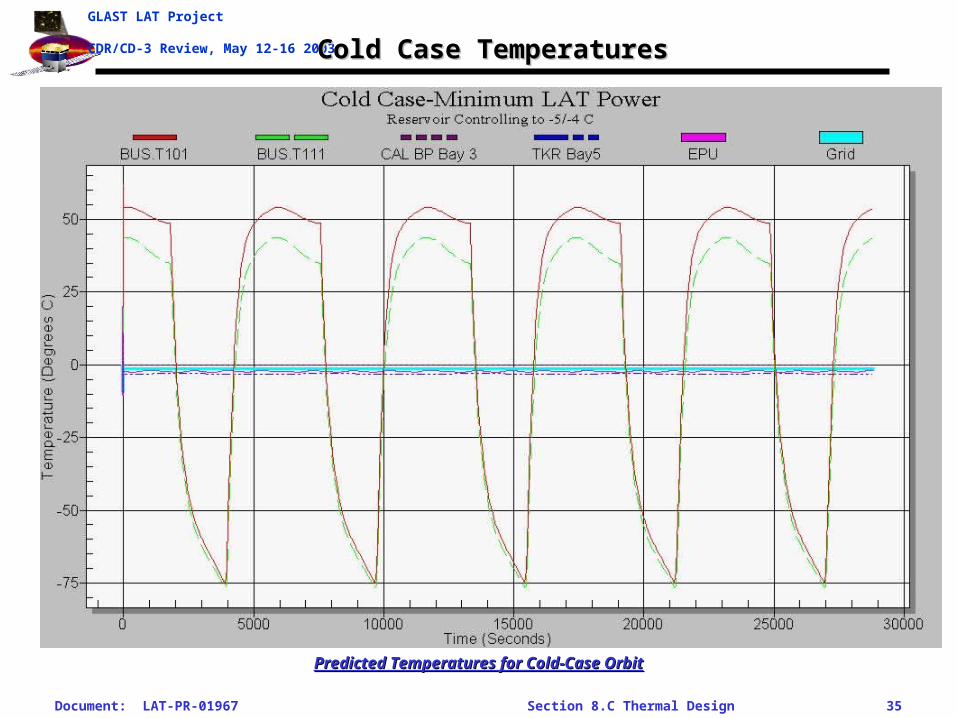
Predicted Temperatures for Cold-Case OrbitPredicted Temperatures for Cold-Case Orbit
Document: LAT-PR-01967 Section 8.C Thermal Design 36
GLAST LAT Project
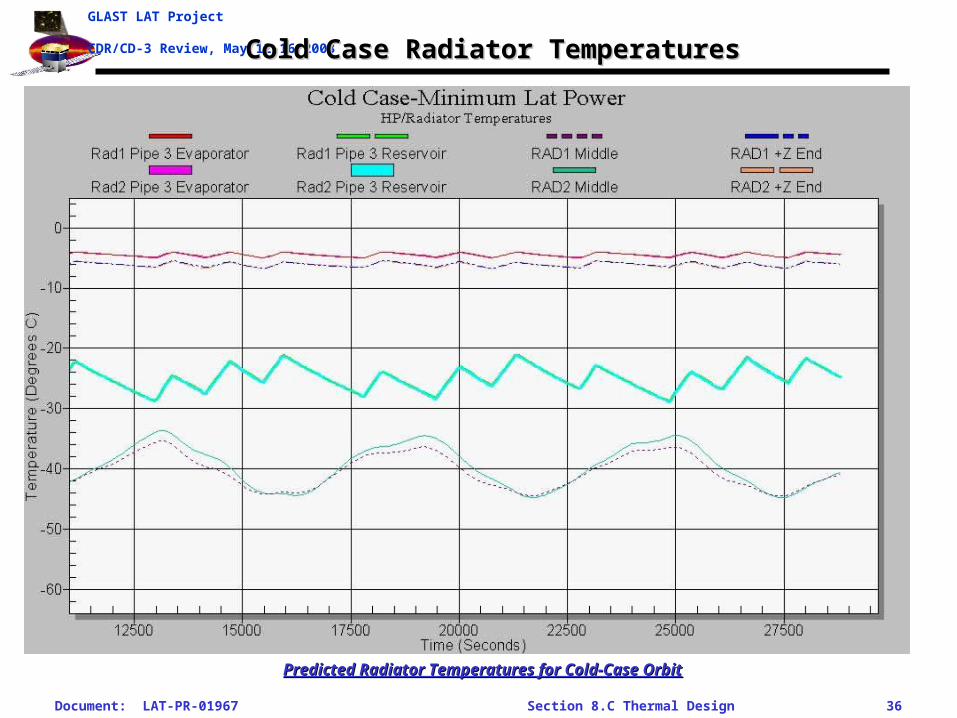
CDR/CD-3 Review, May 12-16 2003Cold Case Radiator TemperaturesCold Case Radiator Temperatures
Predicted Radiator Temperatures for Cold-Case OrbitPredicted Radiator Temperatures for Cold-Case Orbit
Document: LAT-PR-01967 Section 8.C Thermal Design 37
GLAST LAT Project
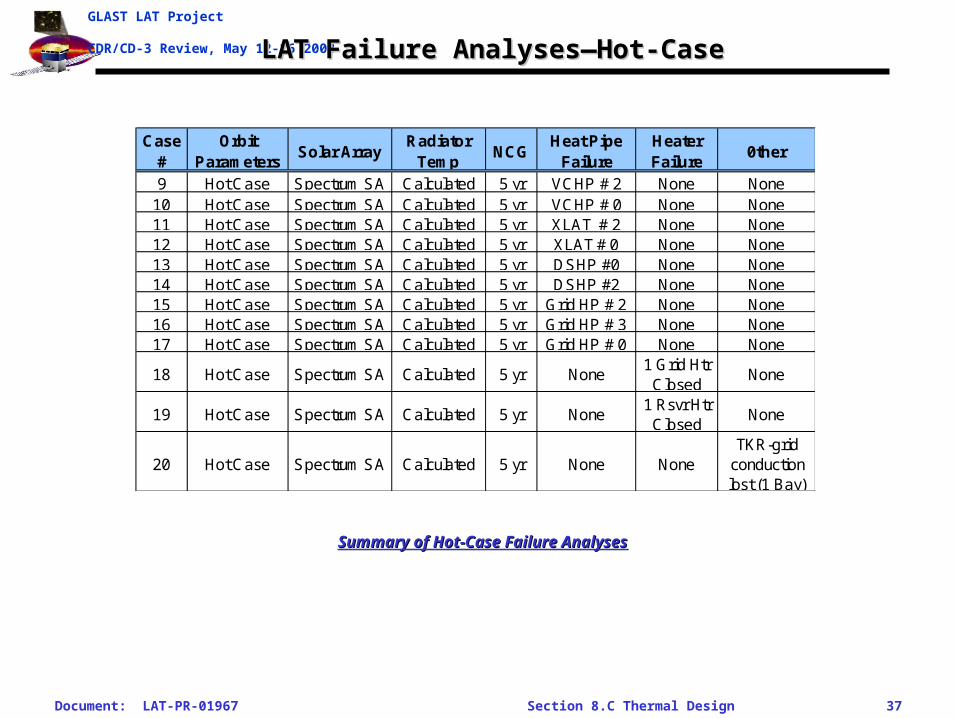
CDR/CD-3 Review, May 12-16 2003LAT Failure Analyses—Hot-CaseLAT Failure Analyses—Hot-Case
Case #
Orbit Parameters
Solar ArrayRadiator
TempNCG
Heat Pipe Failure
Heater Failure
0ther
9 Hot Case Spectrum SA Calculated 5 yr VCHP # 2 None None10 Hot Case Spectrum SA Calculated 5 yr VCHP # 0 None None11 Hot Case Spectrum SA Calculated 5 yr XLAT # 2 None None12 Hot Case Spectrum SA Calculated 5 yr XLAT # 0 None None13 Hot Case Spectrum SA Calculated 5 yr DSHP #0 None None14 Hot Case Spectrum SA Calculated 5 yr DSHP #2 None None15 Hot Case Spectrum SA Calculated 5 yr Grid HP # 2 None None16 Hot Case Spectrum SA Calculated 5 yr Grid HP # 3 None None17 Hot Case Spectrum SA Calculated 5 yr Grid HP # 0 None None
18 Hot Case Spectrum SA Calculated 5 yr None1 Grid Htr
ClosedNone
19 Hot Case Spectrum SA Calculated 5 yr None1 Rsvr Htr
ClosedNone
20 Hot Case Spectrum SA Calculated 5 yr None NoneTKR-grid
conduction lost (1 Bay)
Summary of Hot-Case Failure AnalysesSummary of Hot-Case Failure Analyses
Document: LAT-PR-01967 Section 8.C Thermal Design 38
GLAST LAT Project
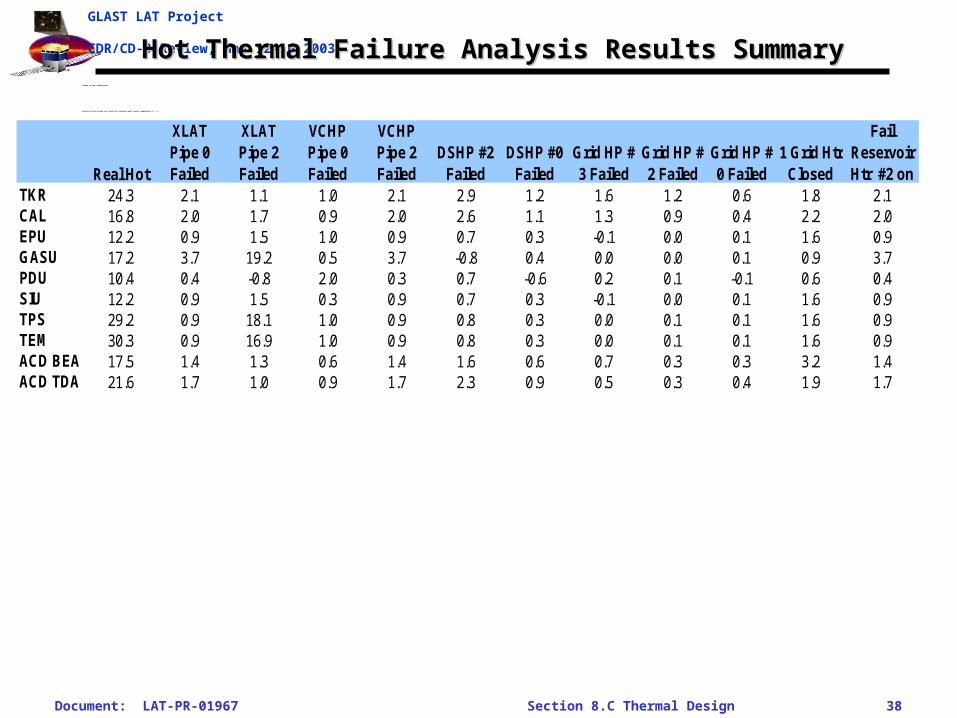
CDR/CD-3 Review, May 12-16 2003Hot Thermal Failure Analysis Results SummaryHot Thermal Failure Analysis Results Summary• Change in peak temperatures
• Failure of heat straps for center Bay increases peak Tracker temperature 4.3 o C
Real Hot
XLAT Pipe 0 Failed
XLAT Pipe 2 Failed
VCHP Pipe 0 Failed
VCHP Pipe 2 Failed
DSHP #2 Failed
DSHP #0 Failed
Grid HP # 3 Failed
Grid HP # 2 Failed
Grid HP # 0 Failed
1 Grid Htr Closed
Fail Reservoir Htr #2 on
TKR 24.3 2.1 1.1 1.0 2.1 2.9 1.2 1.6 1.2 0.6 1.8 2.1CAL 16.8 2.0 1.7 0.9 2.0 2.6 1.1 1.3 0.9 0.4 2.2 2.0EPU 12.2 0.9 1.5 1.0 0.9 0.7 0.3 -0.1 0.0 0.1 1.6 0.9GASU 17.2 3.7 19.2 0.5 3.7 -0.8 0.4 0.0 0.0 0.1 0.9 3.7PDU 10.4 0.4 -0.8 2.0 0.3 0.7 -0.6 0.2 0.1 -0.1 0.6 0.4SIU 12.2 0.9 1.5 0.3 0.9 0.7 0.3 -0.1 0.0 0.1 1.6 0.9TPS 29.2 0.9 18.1 1.0 0.9 0.8 0.3 0.0 0.1 0.1 1.6 0.9TEM 30.3 0.9 16.9 1.0 0.9 0.8 0.3 0.0 0.1 0.1 1.6 0.9ACD BEA 17.5 1.4 1.3 0.6 1.4 1.6 0.6 0.7 0.3 0.3 3.2 1.4ACD TDA 21.6 1.7 1.0 0.9 1.7 2.3 0.9 0.5 0.3 0.4 1.9 1.7
Document: LAT-PR-01967 Section 8.C Thermal Design 39
GLAST LAT Project
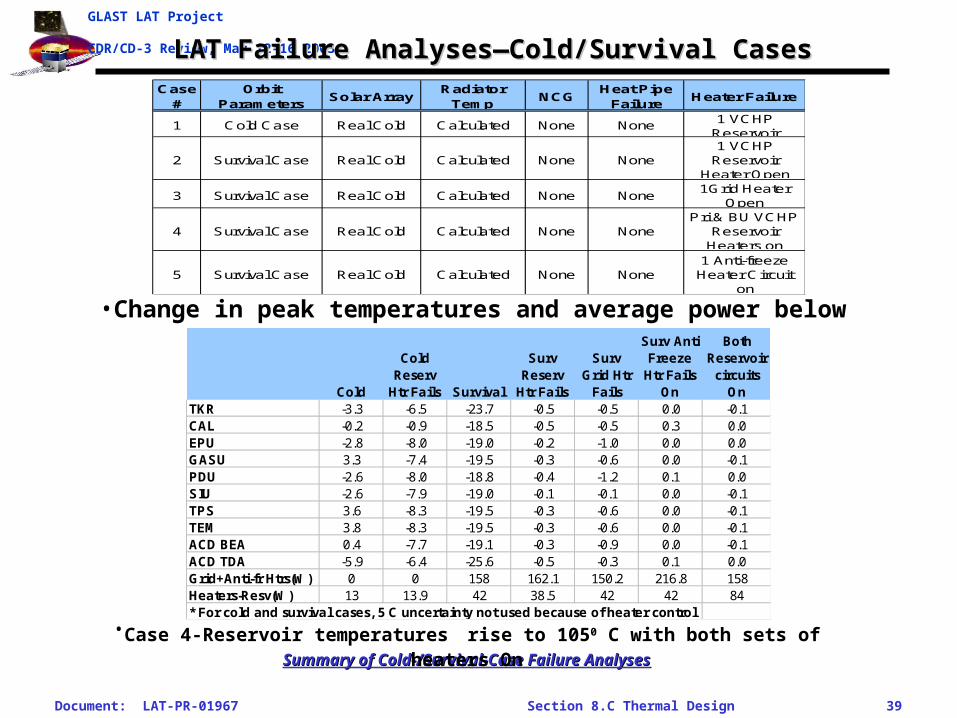
CDR/CD-3 Review, May 12-16 2003LAT Failure Analyses—Cold/Survival CasesLAT Failure Analyses—Cold/Survival CasesCase
#Orbit
ParametersSolar Array
Radiator Temp
NCGHeat Pipe
Failure Heater Failure
1 Cold Case Real Cold Calculated None None1 VCHP
Reservoir
2 Survival Case Real Cold Calculated None None1 VCHP
Reservoir Heater Open
3 Survival Case Real Cold Calculated None None1Grid Heater
Open
4 Survival Case Real Cold Calculated None NonePri & BU VCHP
Reservoir Heaters on
5 Survival Case Real Cold Calculated None None1 Anti-freeze Heater Circuit
on
Summary of Cold-/Survival-Case Failure AnalysesSummary of Cold-/Survival-Case Failure Analyses
•Case 4-Reservoir temperatures rise to 1050 C with both sets of heaters On
•Change in peak temperatures and average power below
Cold
Cold Reserv
Htr Fails Survival
Surv Reserv
Htr Fails
Surv Grid Htr
Fails
Surv Anti Freeze
Htr Fails On
Both Reservoir
circuits On
TKR -3.3 -6.5 -23.7 -0.5 -0.5 0.0 -0.1CAL -0.2 -0.9 -18.5 -0.5 -0.5 0.3 0.0EPU -2.8 -8.0 -19.0 -0.2 -1.0 0.0 0.0GASU 3.3 -7.4 -19.5 -0.3 -0.6 0.0 -0.1PDU -2.6 -8.0 -18.8 -0.4 -1.2 0.1 0.0SIU -2.6 -7.9 -19.0 -0.1 -0.1 0.0 -0.1TPS 3.6 -8.3 -19.5 -0.3 -0.6 0.0 -0.1TEM 3.8 -8.3 -19.5 -0.3 -0.6 0.0 -0.1ACD BEA 0.4 -7.7 -19.1 -0.3 -0.9 0.0 -0.1ACD TDA -5.9 -6.4 -25.6 -0.5 -0.3 0.1 0.0Grid+Anti-fr Htrs(W) 0 0 158 162.1 150.2 216.8 158Heaters-Resv(W) 13 13.9 42 38.5 42 42 84* For cold and survival cases, 5 C uncertainty not used because of heater control
Document: LAT-PR-01967 Section 8.C Thermal Design 40
GLAST LAT Project
CDR/CD-3 Review, May 12-16 2003Thermal Failure Analysis Results SummaryThermal Failure Analysis Results Summary
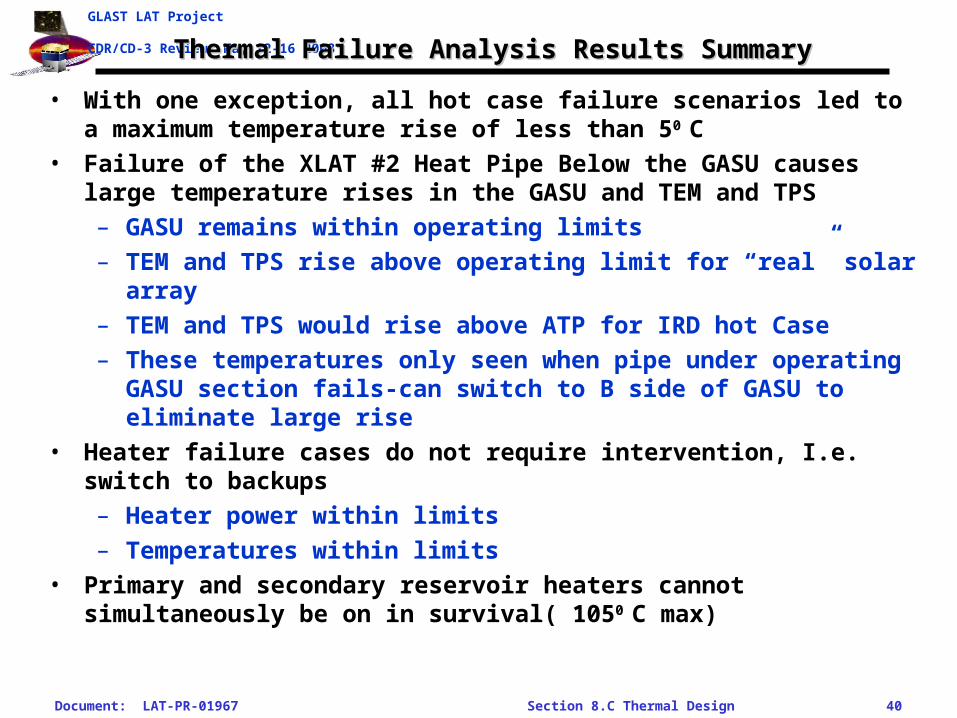
• With one exception, all hot case failure scenarios led to a maximum temperature rise of less than 50 C
• Failure of the XLAT #2 Heat Pipe Below the GASU causes large temperature rises in the GASU and TEM and TPS
– GASU remains within operating limits
– TEM and TPS rise above operating limit for “real” solar array
– TEM and TPS would rise above ATP for IRD hot Case
– These temperatures only seen when pipe under operating GASU section fails-can switch to B side of GASU to eliminate large rise
• Heater failure cases do not require intervention, I.e. switch to backups
– Heater power within limits
– Temperatures within limits
• Primary and secondary reservoir heaters cannot simultaneously be on in survival( 1050 C max)
Document: LAT-PR-01967 Section 8.C Thermal Design 41
GLAST LAT Project
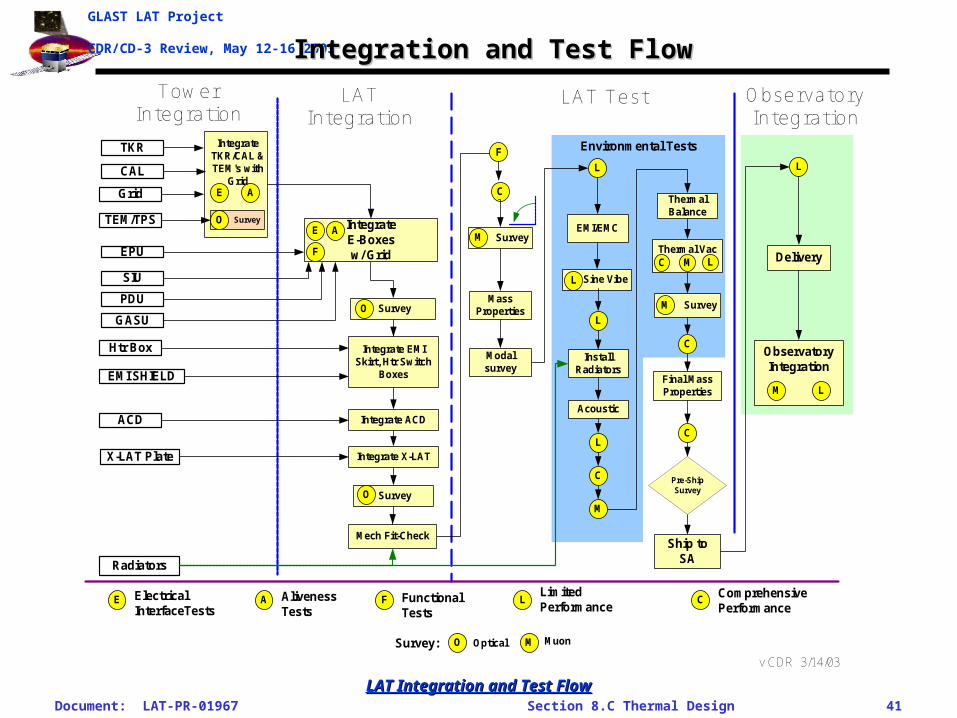
CDR/CD-3 Review, May 12-16 2003 Integration and Test FlowIntegration and Test Flow
ObservatoryIntegration
Sine Vibe
TowerIntegration
LATIntegration
LAT Test ObservatoryIntegration
TKR
CAL
TEM/TPS
Grid
Radiators
EPU
SIU
GASU
PDU
ACD
IntegrateE-Boxesw/ Grid
Htr Box
Delivery
AlivenessTests
LimitedPerformance
X-LAT Plate
C
CLE A
A
MassProperties
EMI/EMC
L
InstallRadiators
Acoustic
L
C
Thermal Vac
ThermalBalance
C L
C
Final MassProperties
Pre-ShipSurvey
L
A
Ship toSA
F
F
F
EMI SHIELD
Survey Survey
M
O M
L
M
O Optical M Muon
IntegrateTKR/CAL &TEM's with
Grid
SurveyO
Integrate ACD
SurveyO
Integrate EMISkirt, Htr Switch
Boxes
Mech Fit-Check
SurveyM
Modalsurvey
E
L
FunctionalTests
Survey:
L
ElectricalInterfaceTests
ComprehensivePerformance
Environmental Tests
E
M
C
v CDR 3/14/03
Integrate X-LAT
LAT Integration and Test FlowLAT Integration and Test Flow
Document: LAT-PR-01967 Section 8.C Thermal Design 42
GLAST LAT Project
CDR/CD-3 Review, May 12-16 2003LAT Thermal Balance/Thermal-Vacuum TestsLAT Thermal Balance/Thermal-Vacuum Tests
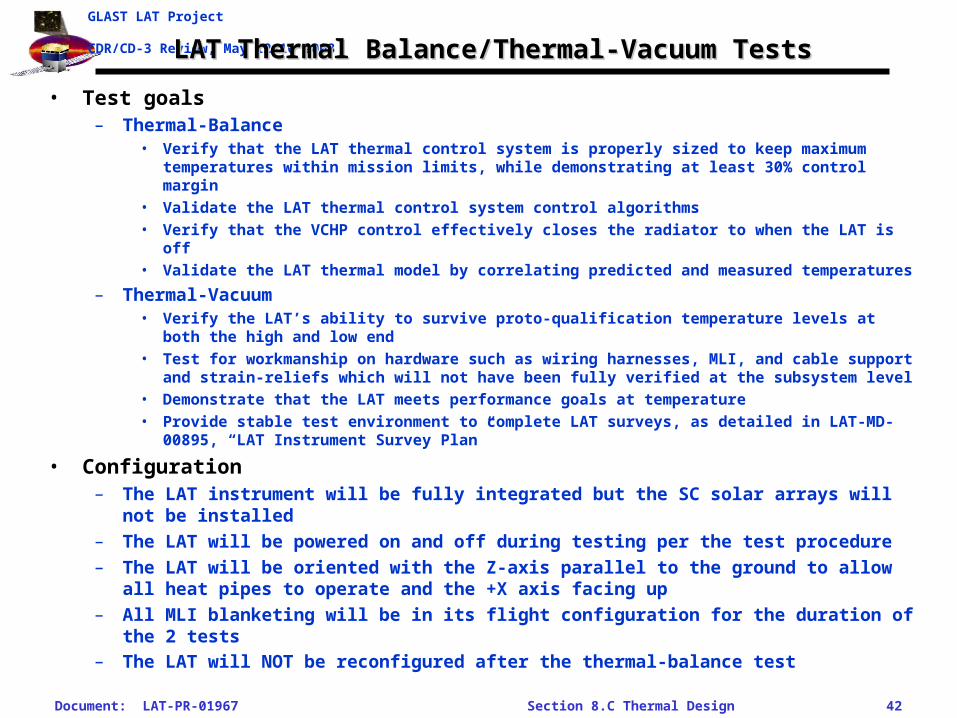
• Test goals– Thermal-Balance
• Verify that the LAT thermal control system is properly sized to keep maximum temperatures within mission limits, while demonstrating at least 30% control margin
• Validate the LAT thermal control system control algorithms• Verify that the VCHP control effectively closes the radiator to when the LAT is off• Validate the LAT thermal model by correlating predicted and measured temperatures
– Thermal-Vacuum• Verify the LAT’s ability to survive proto-qualification temperature levels at both the high and low
end• Test for workmanship on hardware such as wiring harnesses, MLI, and cable support and strain-
reliefs which will not have been fully verified at the subsystem level• Demonstrate that the LAT meets performance goals at temperature• Provide stable test environment to complete LAT surveys, as detailed in LAT-MD-00895, “LAT
Instrument Survey Plan”
• Configuration– The LAT instrument will be fully integrated but the SC solar arrays will not be installed
– The LAT will be powered on and off during testing per the test procedure
– The LAT will be oriented with the Z-axis parallel to the ground to allow all heat pipes to operate and the +X axis facing up
– All MLI blanketing will be in its flight configuration for the duration of the 2 tests– The LAT will NOT be reconfigured after the thermal-balance test
Document: LAT-PR-01967 Section 8.C Thermal Design 43
GLAST LAT Project
CDR/CD-3 Review, May 12-16 2003LAT Thermal Balance/Thermal-Vacuum Tests (cont)LAT Thermal Balance/Thermal-Vacuum Tests (cont)
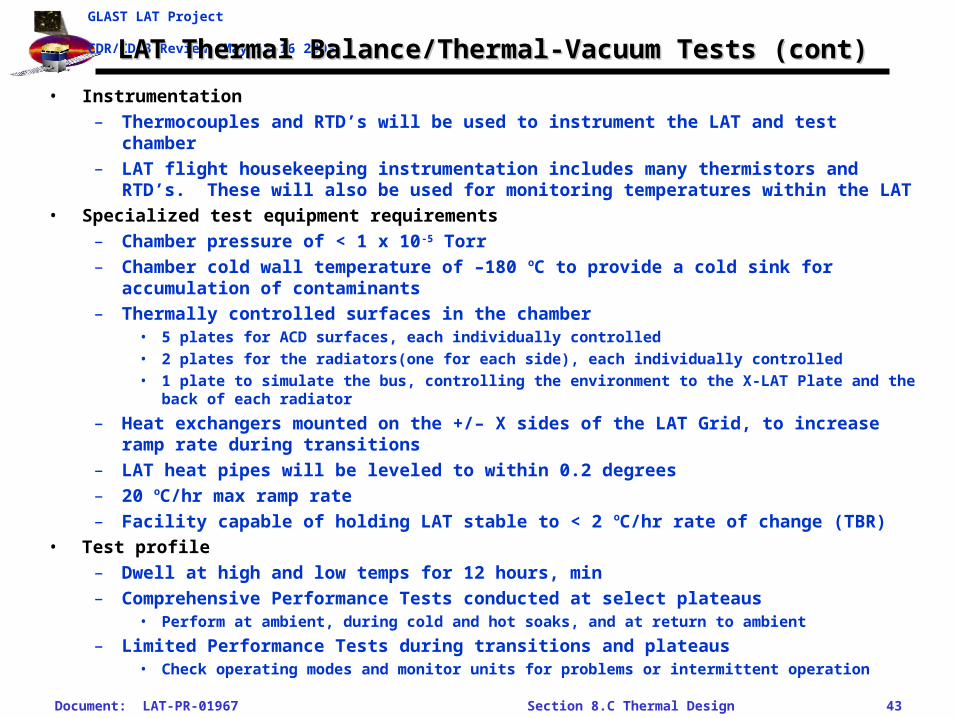
• Instrumentation
– Thermocouples and RTD’s will be used to instrument the LAT and test chamber
– LAT flight housekeeping instrumentation includes many thermistors and RTD’s. These will also be used for monitoring temperatures within the LAT
• Specialized test equipment requirements
– Chamber pressure of < 1 x 10⁻⁵ Torr
– Chamber cold wall temperature of –180 oC to provide a cold sink for accumulation of contaminants
– Thermally controlled surfaces in the chamber• 5 plates for ACD surfaces, each individually controlled• 2 plates for the radiators(one for each side), each individually controlled• 1 plate to simulate the bus, controlling the environment to the X-LAT Plate and the back of each
radiator
– Heat exchangers mounted on the +/– X sides of the LAT Grid, to increase ramp rate during transitions
– LAT heat pipes will be leveled to within 0.2 degrees
– 20 oC/hr max ramp rate
– Facility capable of holding LAT stable to < 2 oC/hr rate of change (TBR)
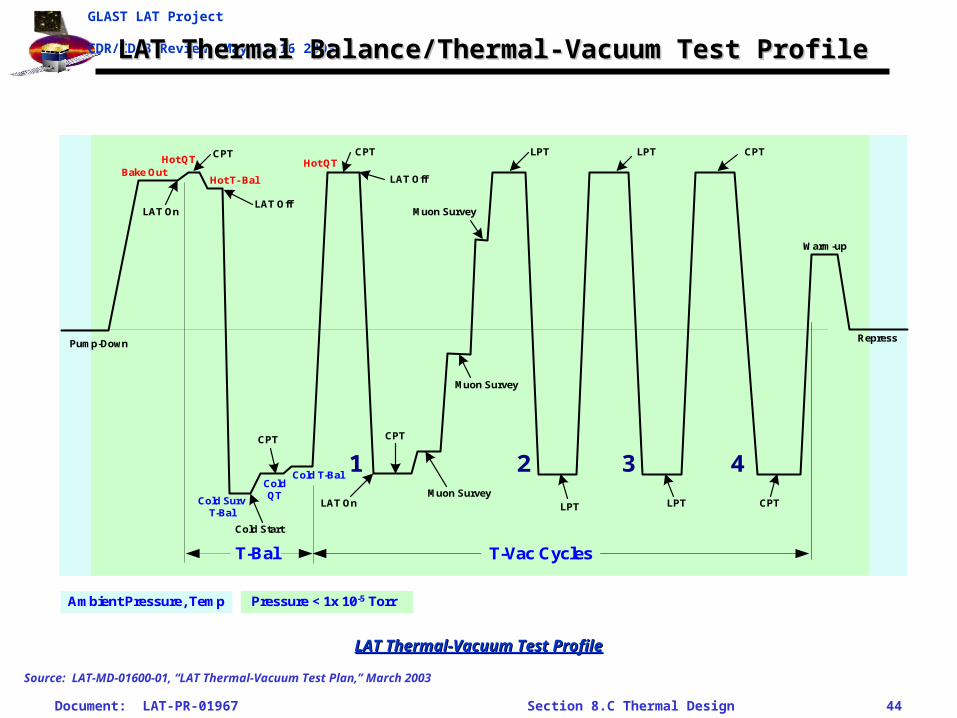
• Test profile
– Dwell at high and low temps for 12 hours, min
– Comprehensive Performance Tests conducted at select plateaus• Perform at ambient, during cold and hot soaks, and at return to ambient
– Limited Performance Tests during transitions and plateaus• Check operating modes and monitor units for problems or intermittent operation
Document: LAT-PR-01967 Section 8.C Thermal Design 44
GLAST LAT Project
CDR/CD-3 Review, May 12-16 2003LAT Thermal Balance/Thermal-Vacuum Test ProfileLAT Thermal Balance/Thermal-Vacuum Test Profile
LAT Thermal-Vacuum Test ProfileLAT Thermal-Vacuum Test Profile
Source: LAT-MD-01600-01, “LAT Thermal-Vacuum Test Plan,” March 2003
T-Vac Cycles
1 2 3 4
Bake OutHot T- Bal
Cold T-Bal
Cold SurvT-Bal
Ambient Pressure, Temp Pressure < 1x 10⁻⁵ Torr
T-Bal
Pump-Down Repress
Warm-up
Hot QT
ColdQT
LAT Off
CPT
Cold Start
CPT
CPT CPT
LAT Off
Muon Survey
Muon Survey
Muon Survey
LPT LPT CPT
LPT LPT CPT
LAT On
LAT On
Hot QT
Document: LAT-PR-01967 Section 8.C Thermal Design 45
GLAST LAT Project
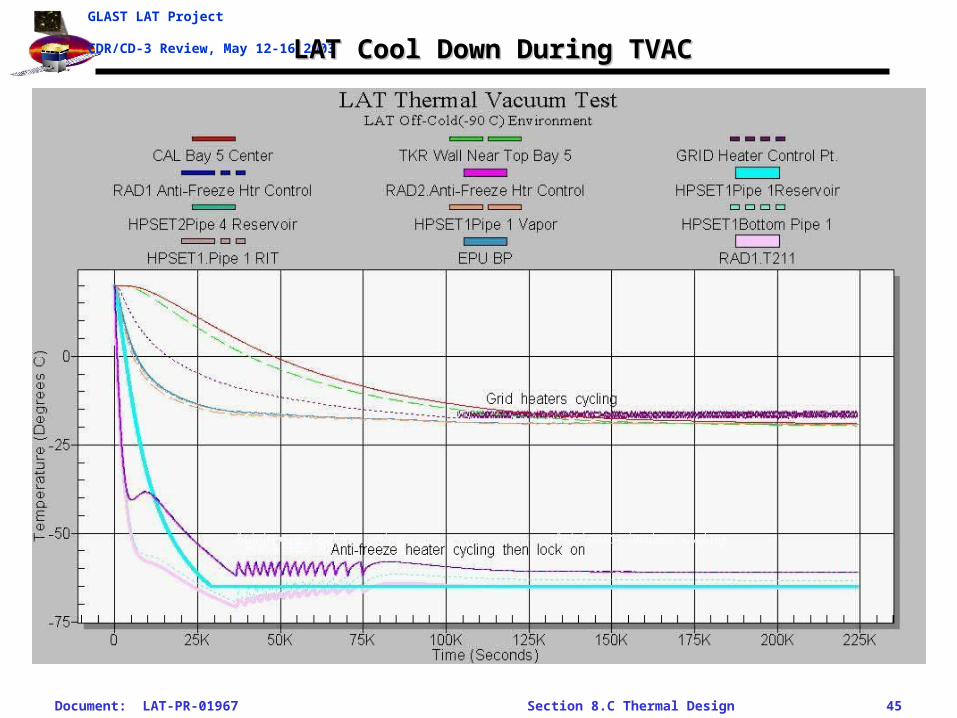
CDR/CD-3 Review, May 12-16 2003 LAT Cool Down During TVACLAT Cool Down During TVAC
Document: LAT-PR-01967 Section 8.C Thermal Design 46
GLAST LAT Project
CDR/CD-3 Review, May 12-16 2003 IssuesIssues
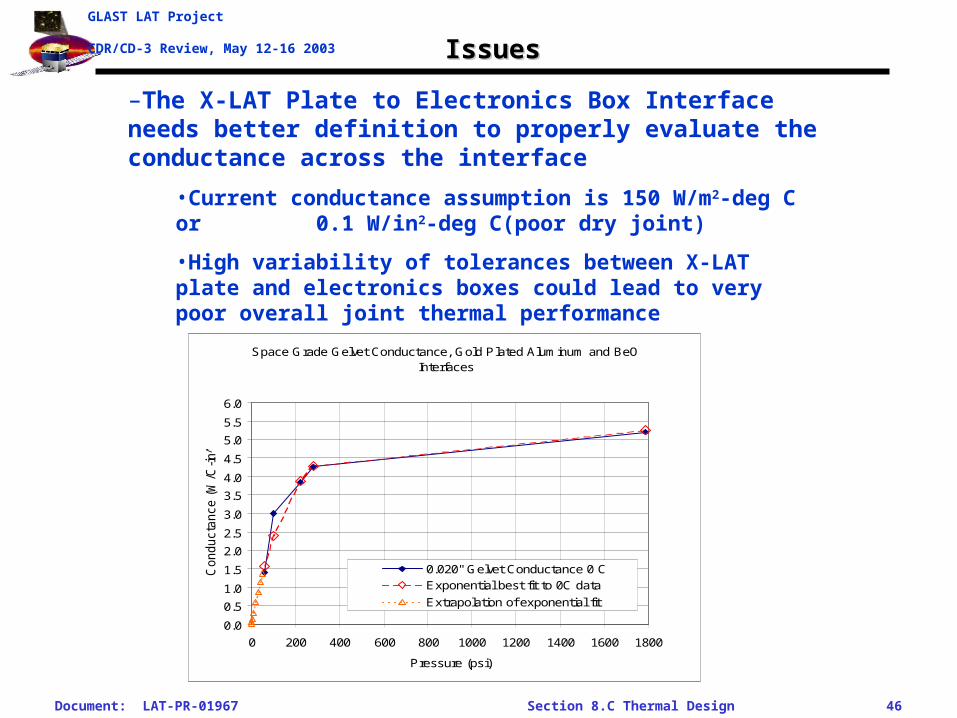
Space Grade Gelvet Conductance, Gold Plated Aluminum and BeO Interfaces
0.0
0.5
1.0
1.5
2.0
2.5
3.0
3.5
4.0
4.5
5.0
5.5
6.0
0 200 400 600 800 1000 1200 1400 1600 1800
Pressure (psi)
Conducta
nce (
W/C
-in^2
)
0.020" Gelvet Conductance 0 CExponential best fit to 0C data
Extrapolation of exponential fit
–The X-LAT Plate to Electronics Box Interface needs better definition to properly evaluate the conductance across the interface
•Current conductance assumption is 150 W/m2-deg C or 0.1 W/in2-deg C(poor dry joint)
•High variability of tolerances between X-LAT plate and electronics boxes could lead to very poor overall joint thermal performance
Document: LAT-PR-01967 Section 8.C Thermal Design 47
GLAST LAT Project
CDR/CD-3 Review, May 12-16 2003 SummarySummary
– We are using a fully integrated thermal model for generating temperature predicts for CDR
– The Radiator thermal design has been changed to incorporate modifications to the spacecraft interface
– Predicts show that we meet all operating limits, with adequate margin, when using the IRD solar arrays
• When using the expected “real” Spectrum Astro solar array, net flux to each radiator drops about 60 watts
• With a “real” solar array, maximum temperatures drop about 5 C
– Predicts show that we meet all operating limits, with adequate heater margin, when using the Spectrum solar arrays in the cold and survival cases
Document: LAT-PR-01967 Section 8.C Thermal Design 48
GLAST LAT Project
CDR/CD-3 Review, May 12-16 2003
Gamma-ray Large Gamma-ray Large Area Space Area Space TelescopeTelescope
AppendixAppendix
Thermal Analysis RFAsThermal Analysis RFAs
Document: LAT-PR-01967 Section 8.C Thermal Design 49
GLAST LAT Project
CDR/CD-3 Review, May 12-16 2003 Peer Review RFAsPeer Review RFAs
Document: LAT-PR-01967 Section 8.C Thermal Design 50
GLAST LAT Project
CDR/CD-3 Review, May 12-16 2003Peer Review RFAs (Continued)Peer Review RFAs (Continued)