document library - european commission
TRANSCRIPT
Education and Training
On the way to ERASMUS+
A Statistical Overview of the ERASMUS Programme
in 2011-12
November 2013
2
Table of contents
Table of contents....................................................................................................................................................................................................................................... 2 Acronyms used in this report ............................................................................................................................................................................................................... 7 Disclaimer ..................................................................................................................................................................................................................................................... 7 Preface ........................................................................................................................................................................................................................................................... 8 1. Erasmus Student Mobility................................................................................................................................................................................................................. 9
1.1. General overview of student mobility .............................................................................................................................................................................. 9 1.1.1. Introduction...............................................................................................................................................................................................................................................9 1.1.2. Outbound Erasmus student mobility (study exchanges and work placements)..............................................................................................10 1.1.3. Inbound student mobility................................................................................................................................................................................................................14 1.1.4. Duration ...................................................................................................................................................................................................................................................16 1.1.5. Grants........................................................................................................................................................................................................................................................17 1.1.6. Students with special needs grants..........................................................................................................................................................................................18 1.1.7. Zero-grant students...........................................................................................................................................................................................................................19 1.1.8. Participating Higher Education Institutions ..........................................................................................................................................................................20
1.2. Erasmus Student Mobility for Studies ........................................................................................................................................................................... 20 1.2.1. Introduction............................................................................................................................................................................................................................................20 1.2.2. Outbound study exchanges...........................................................................................................................................................................................................20 1.2.3. Inbound study exchanges...............................................................................................................................................................................................................22 1.2.4. Subject areas and languages of study ...................................................................................................................................................................................23 1.2.5. Study duration ......................................................................................................................................................................................................................................24 1.2.6. Study grants ..........................................................................................................................................................................................................................................26 1.2.7. Students receiving special needs grants ...............................................................................................................................................................................27 1.2.8. Zero-grant students for studies..................................................................................................................................................................................................27 1.2.9. Work placements combined with studies..............................................................................................................................................................................27 1.2.10. Average expected ECTS credits................................................................................................................................................................................................28
1.3. Erasmus Student Mobility for Placements .................................................................................................................................................................. 28 1.3.1. Introduction............................................................................................................................................................................................................................................28 1.3.2. Outbound student work placements........................................................................................................................................................................................28 1.3.3. Inbound students on work placements...................................................................................................................................................................................29 1.3.4. Work placement hosts .....................................................................................................................................................................................................................30 1.3.5. Subject areas and languages used in work placements...............................................................................................................................................30 1.3.6. Duration of work placements.......................................................................................................................................................................................................31 1.3.7. Work placement grants ...................................................................................................................................................................................................................32 1.3.8. Work placement students with special needs grants .....................................................................................................................................................32 1.3.9. Zero-grant students on work placements.............................................................................................................................................................................33 1.3.10. Work placement consortia ..........................................................................................................................................................................................................33
2. Erasmus Staff Mobility ................................................................................................................................................................................................................... 35 2.1. Introduction................................................................................................................................................................................................................................ 35 2.2. Staff Mobility for Teaching Assignments..................................................................................................................................................................... 38
2.2.1. Introduction............................................................................................................................................................................................................................................38 2.2.2. Outbound staff on teaching assignments ............................................................................................................................................................................39 2.2.3. Inbound staff on teaching assignments ................................................................................................................................................................................40 2.2.4. Subject areas and languages.......................................................................................................................................................................................................41 2.2.5. Duration of teaching assignments............................................................................................................................................................................................42 2.2.6. Grants for teaching assignments...............................................................................................................................................................................................42
2.3. Erasmus Staff Mobility for Staff Training................................................................................................................................................................... 43 2.3.1. Introduction............................................................................................................................................................................................................................................43 2.3.2. Outbound staff training ..................................................................................................................................................................................................................44 2.3.3. Inbound staff training ......................................................................................................................................................................................................................44 2.3.4. Ratio of staff training to teaching assignments ...............................................................................................................................................................45
3
2.3.5. Staff training in companies...........................................................................................................................................................................................................45 2.3.6. Staff composition in staff training and types of activities .........................................................................................................................................46 2.3.7. Duration of staff training...............................................................................................................................................................................................................46 2.3.8. Grants for staff training..................................................................................................................................................................................................................47
3. Erasmus Intensive Language Courses (EILC)........................................................................................................................................................................ 49 3.1. Participation in EILC............................................................................................................................................................................................................... 49 3.2. Inbound EILC participants.................................................................................................................................................................................................... 50 3.3. Outbound EILC participants................................................................................................................................................................................................ 51 3.4. Recognition of participation ............................................................................................................................................................................................... 51
4. Erasmus Intensive Programmes (IPs) ...................................................................................................................................................................................... 52 4.1. Number of IPs ........................................................................................................................................................................................................................... 52 4.2. Participation in IPs.................................................................................................................................................................................................................. 53 4.3. Subject areas of IPs and ECTS awarded....................................................................................................................................................................... 54 4.4. Duration of IPs ......................................................................................................................................................................................................................... 55
5. Cooperation Projects........................................................................................................................................................................................................................ 56 6. Erasmus Programme budget........................................................................................................................................................................................................ 59
6.1. The allocation and use of Erasmus funds at national level ................................................................................................................................ 59 6.2. Year-on-year trends for the four different types of mobility ............................................................................................................................ 60
4
List of charts
Chart 1: Progress to achieving the three million student mobility target
Chart 2: Outbound students by country since 2009
Chart 3: Outbound student mobility: year-on-year growth by country
Chart 4: Number of students by nationality in 2011-12
Chart 5: Age distribution of students in 2011-12
Chart 6: Study exchanges and work placements by home country in 2011-12
Chart 7: Erasmus students as a proportion of the student population by country in 2010-11
Chart 8: Erasmus students as a proportion of graduates by country in 2010-11
Chart 9: Number of inbound students by country since 2009
Chart 10: Inboud and outbound students in 2011-12
Chart 11: Average duration of student mobility since 1994
Chart 12: Average duration of student mobility periods by home country since 2009
Chart 13: Average monthly EU grant for student mobility since 2000
Chart 14 Average monthly EU grant for student mobility by home country in 2011-12
Chart 15: Number of special needs grants for student mobility by home country in 2011-12
Chart 16: Number of zero-grant Erasmus students by home country in 2011-12
Chart 17: Higher Education Institutions active in Erasmus (student and staff mobility) since 2003
Chart 18: Study exchanges since 1987
Chart 19: Total number of study exchanges since 2000 by home country
Chart 20: Outbound study exchanges by country since 2009
Chart 21: Inbound students on study exchanges by country since 2009
Chart 22: Inboud and outbound study exchanges in 2011-12
Chart 23: Share of subject areas in study exchanges in 2011-12
Chart 24: Languages used on study exchanges in 2011-12
Chart 25: Average duration of study exchanges since 1994
Chart 26: Average duration of study exchanges by home country since 2009
Chart 27: Distribution of duration of study exchanges in 2011-12
Chart 28: Average monthly EU grant for study exchanges since 2000
Chart 29: Average monthly EU grant distribution for study exchanges in 2011-12
Chart 30: Average monthly EU grant for study exchanges by home country since 2009
Chart 31: Number of combined placements by home country in 2011-12
Chart 32: Outbound students on work placements by country in 2011-12
Chart 33: Inbound students on work placements by country since 2009
Chart 34: Inboud and outbound students on work placements in 2011-12
Chart 35: Share of subject areas in work placements in 2011-12
Chart 36: Languages used in work placements in 2011-12
Chart 37: Average monthly duration of work placements by home country since 2009
Chart 38: Distribution of duration of work placements in 2011-12
Chart 39: Average monthly EU grant for work placements by home country since 2009
Chart 40: Work placement consortia by country in 2011-12
Chart 41: Ratio of work placements organised within and outside consortia in 2011-12
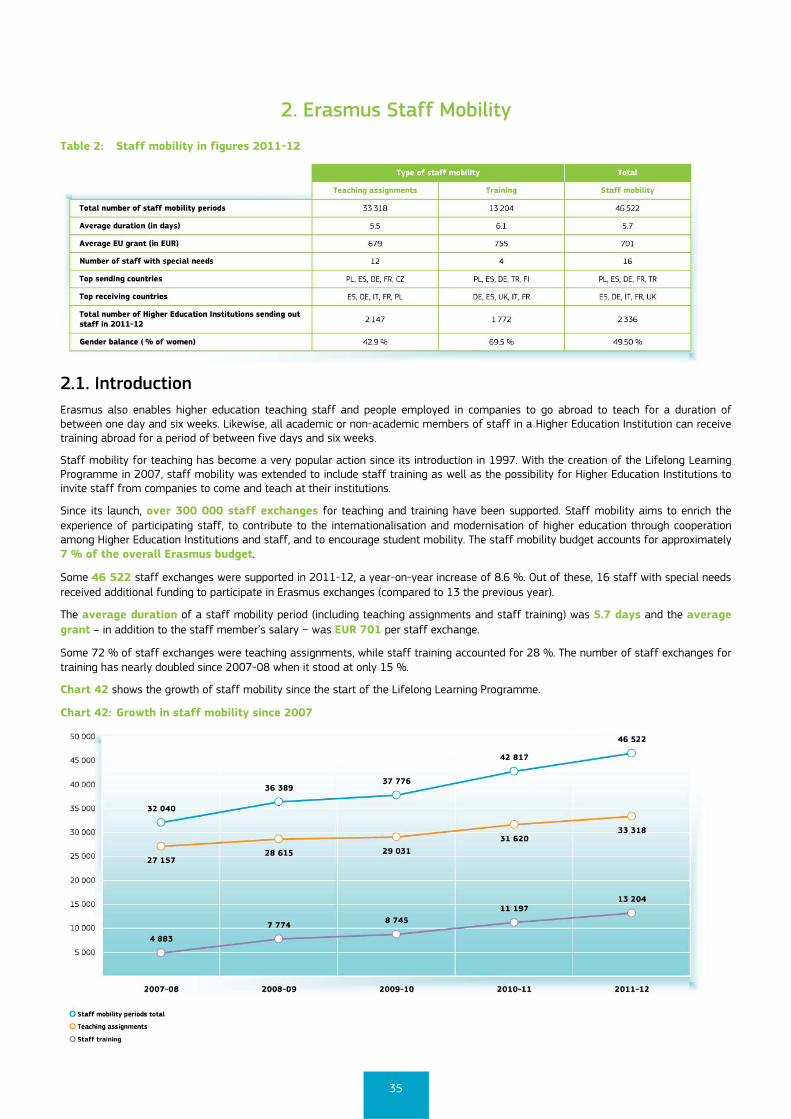
Chart 42: Growth in staff mobility since 2007
Chart 43: Outbound staff exchanges by country in 2011-12
Chart 44: Inbound staff exchanges by country in 2011-12
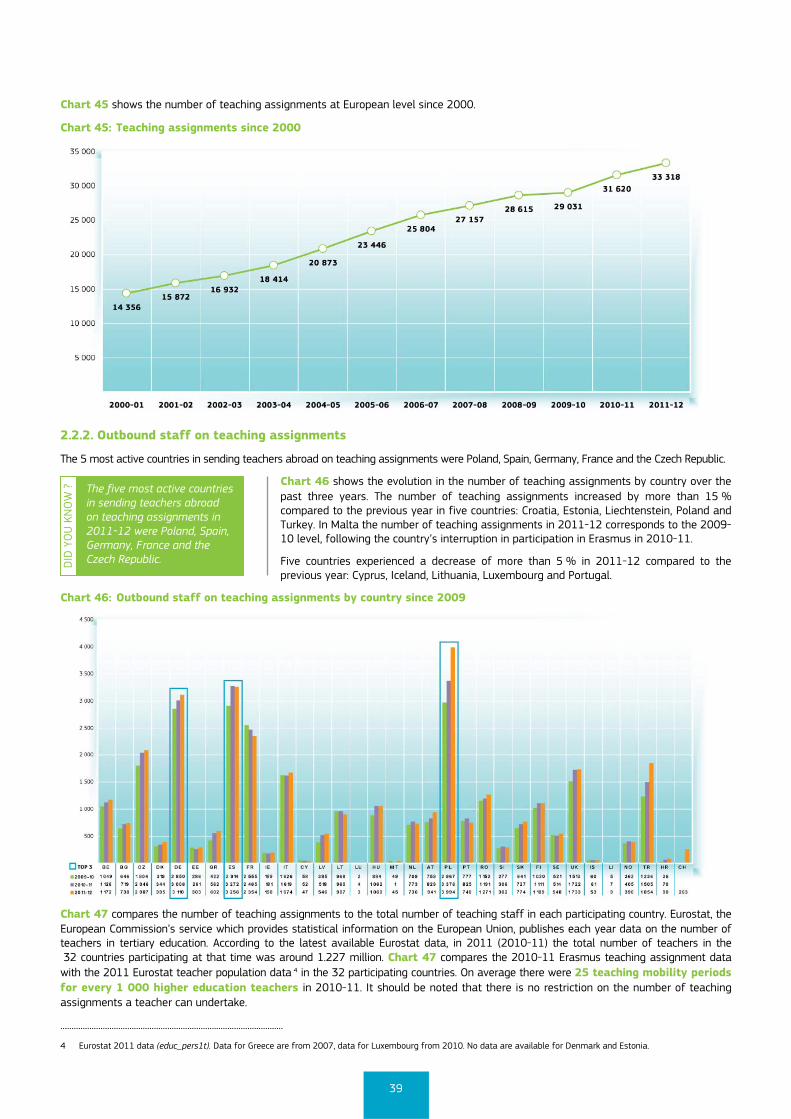
Chart 45: Teaching assignments since 2000
Chart 46: Outbound staff on teaching assignments by country since 2009
Chart 47: Outbound staff on teaching assignments compared to total teaching staff by country in 2010-11
Chart 48: Inbound staff on teaching assignments by country since 2009
Chart 49: Inboud and outbound staff on teaching assignments in 2011-12
Chart 50: Subject areas in study exchanges and teacher exchanges in 2011-12
Chart 51: Languages used in teaching assignments in 2011-12
5
Chart 52: Distribution of duration of teaching assignments in 2011-12
Chart 53: Average total EU grant for teaching assignments since 2000
Chart 54: Average total EU grant for teaching assignments by home country since 2009
Chart 55: Outbound staff on training by country in 2011-12
Chart 56: Inbound staff on training by country in 2011-12
Chart 57: Inboud and outbound staff on training in 2011-12
Chart 58: Ratio of staff training to teaching assignments by home country in 2011-12
Chart 59: Staff training in companies by host country in 2011-12
Chart 60: Category of work at home institution in 2011-12
Chart 61: Average duration of staff training by home country since 2009
Chart 62: Distribution of duration of staff training in 2011-12
Chart 63: Average total EU grant for staff training by country since 2009
Chart 64: Number of EILC courses since 2005-06
Chart 65: Student participation in EILC since 2001
Chart 66: Inbound EILC participants by country since 2009
Chart 67: EILC students as a percentage of inbound students in 2011-12
Chart 68: Outbound EILC participants by country since 2009
Chart 69: Number of IPs since 2000
Chart 70: Number of IPs by coordinating country since 2009
Chart 71: Student participation in IPs by home country since 2009
Chart 72: Teacher participation in IPs by home country since 2009
Chart 73: Distribution of IPs by first subject area in 2011-12
Chart 74: Average duration of IPs by home country in 2011-12
Chart 75: Received and selected applications for Cooperation Projects since 2007
Chart 76: Applications selected for Cooperation Projects by type since 2007
Chart 77: Participation of countries in Cooperation Projects (as coordinators and partners) since 2007
Chart 78: Number of Cooperation Project applications submitted and selected by country (coordinators) since 2007
Chart 79: Cooperation Projects – policy priorities since 2007
Chart 80: Funds for Erasmus decentralised actions since 1988
Chart 81: Erasmus decentralised funds by type in 2011-12
Chart 82: Student mobility and staff mobility: year-on-year growth by home country
Chart 83: Study exchanges and work placements: year-on-year growth by home country
Chart 84: Teaching assignments and staff training: year-on-year growth by home country
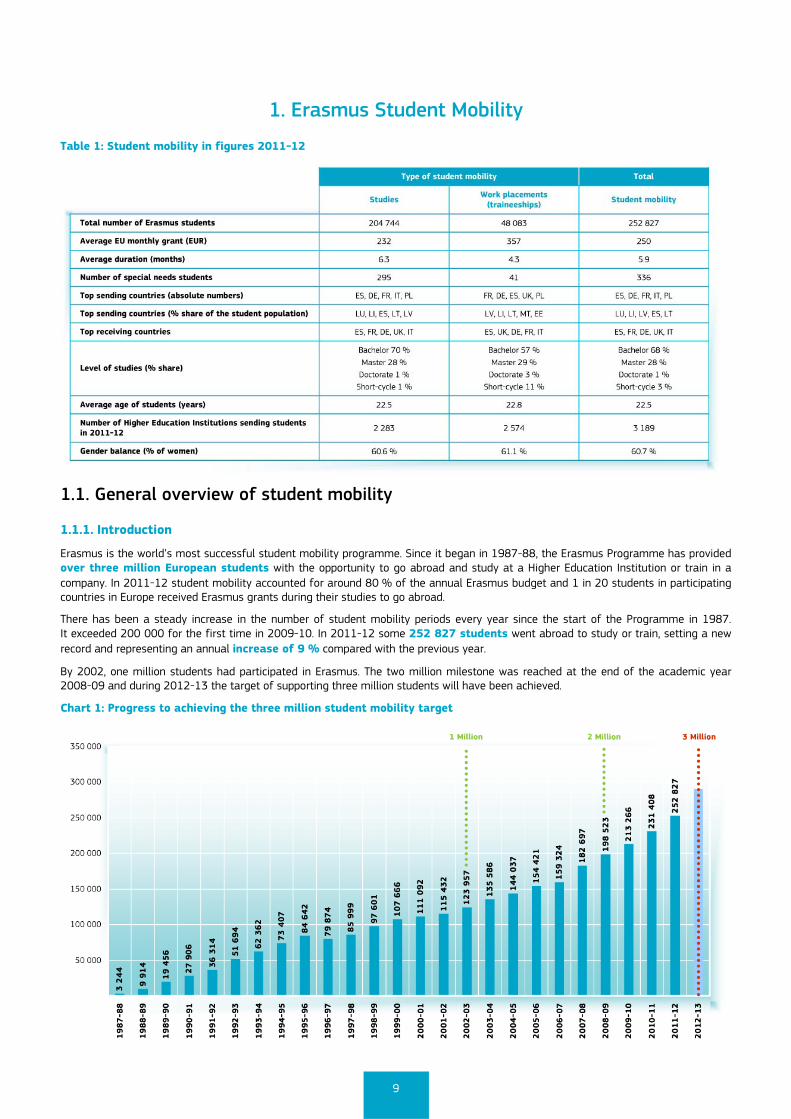
Table 1: Student mobility in figures 2011-12
Table 2: Staff mobility in figures 2011-12
Table 3: Total grants for Cooperation Projects by type since 2007
List of maps
Map 1: Outbound student mobility (study exchanges and work placements) growth since 2007
Map 2: Inbound student mobility in 2011-12 with top 15 host institutions
Map 3: Inbound student mobility (study exchanges and work placements) growth since 2007
Map 4: Outbound staff mobility (teaching assignments and staff training) growth since 2007
Map 5: Inbound staff mobility (teaching assignments and staff training) growth since 2007
Map 6: Inbound staff mobility (teaching assignments and staff training) in 2011-12 with top 15 host institutions
6
List of annexes
Student Mobility
Annex 1: Part 1: Outbound student mobility by country (1987-2006)
Annex 1: Part 2: Outbound student mobility by country (2007-2011)
Annex 2: Average duration of student mobility since 1994
Annex 3: Average monthly EU grant for student mobility since 1994
Annex 4: Inbound and outbound student mobility in 2011-12
Annex 5: Inbound and outbound special needs grants for student mobility in 2011-12
Annex 6: Inbound and outbound Erasmus zero-grant students in 2011-12
Annex 7: Top 100 Higher Education Institutions sending students on mobility in 2011-12
Student Mobility for Studies Annex 8: Outbound study exchanges since 1987
Annex 9: Inbound and outbound study exchanges in 2011-12
Annex 10: Inbound and outbound special needs grants for study exchanges in 2011-12
Annex 11: Inbound and outbound Erasmus zero-grant study exchanges in 2011-12
Student Mobility for Placements
Annex 12: Inbound and outbound placements in 2011-12
Annex 13: Inbound and outbound special needs grants for placements in 2011-12
Annex 14: Inbound and outbound Erasmus zero-grant placements in 2011-12
Staff Mobility Annex 15: Top 100 Higher Education Institutions sending staff on mobility in 2011-12
Annex 16: Inbound and outbound staff mobility in 2011-12
Staff Mobility for Teaching Assignments Annex 17: Inbound and outbound staff on teaching assignment in 2011-12 (including invited staff from companies)
Annex 18: Inbound and outbound invited staff from companies on teaching assignment in 2011-12
Annex 19: Staff on teaching assignment (total number, average duration and grant) since 1997
Staff Mobility for Staff Training Annex 20: Inbound and outbound staff on training in 2011-12
Annex 21: Inbound and outbound staff on training from university to company in 2011-12
Annex 22: Staff on training (total number, average duration and grant) since 2007
Erasmus Intensive Language Courses Annex 23: Student participation in EILC by home country in 2011-12
Intensive Programmes Annex 24: Student participation in Intensive Programmes by home country in 2011-12
Annex 25: Teacher participation in Intensive Programmes by home country in 2011-12
7
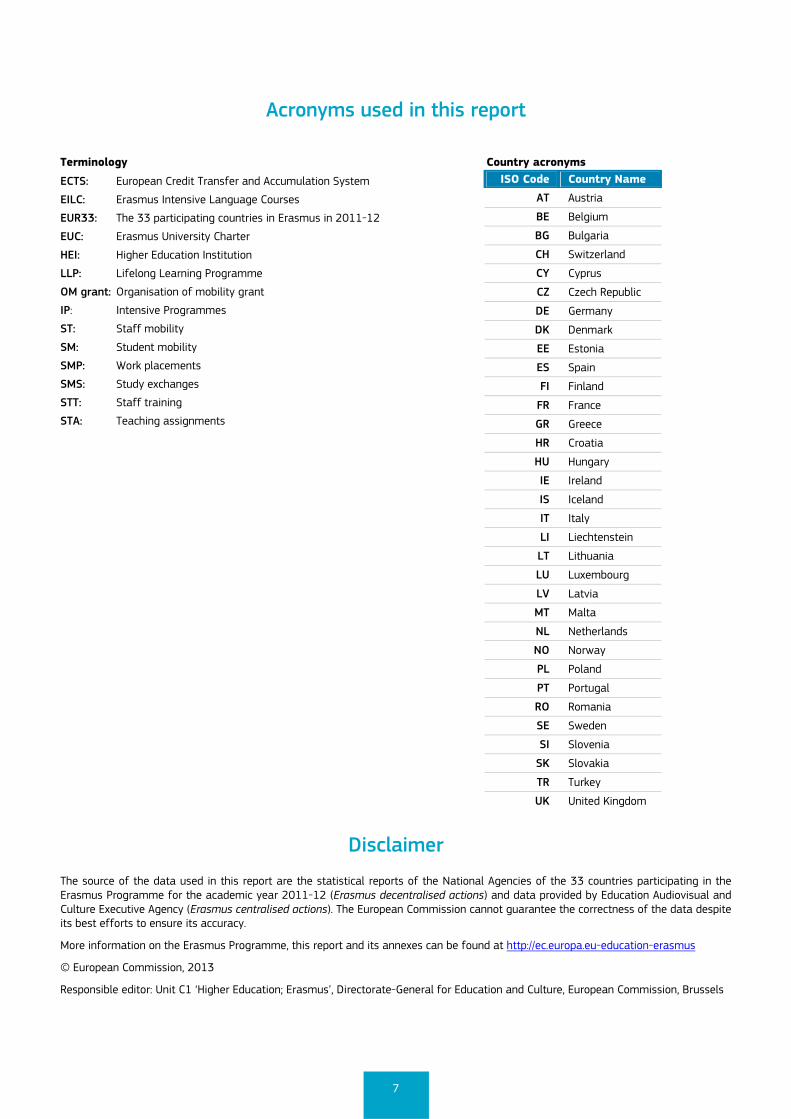
Acronyms used in this report
Terminology
ECTS: European Credit Transfer and Accumulation System
EILC: Erasmus Intensive Language Courses
EUR33: The 33 participating countries in Erasmus in 2011-12
EUC: Erasmus University Charter
HEI: Higher Education Institution
LLP: Lifelong Learning Programme
OM grant: Organisation of mobility grant
IP: Intensive Programmes
ST: Staff mobility
SM: Student mobility
SMP: Work placements
SMS: Study exchanges
STT: Staff training
STA: Teaching assignments
Country acronyms ISO Code Country Name
AT Austria
BE Belgium
BG Bulgaria
CH Switzerland
CY Cyprus
CZ Czech Republic
DE Germany
DK Denmark
EE Estonia
ES Spain
FI Finland
FR France
GR Greece
HR Croatia
HU Hungary
IE Ireland
IS Iceland
IT Italy
LI Liechtenstein
LT Lithuania
LU Luxembourg
LV Latvia
MT Malta
NL Netherlands
NO Norway
PL Poland
PT Portugal
RO Romania
SE Sweden
SI Slovenia
SK Slovakia
TR Turkey
UK United Kingdom
Disclaimer
The source of the data used in this report are the statistical reports of the National Agencies of the 33 countries participating in the Erasmus Programme for the academic year 2011-12 (Erasmus decentralised actions) and data provided by Education Audiovisual and Culture Executive Agency (Erasmus centralised actions). The European Commission cannot guarantee the correctness of the data despite its best efforts to ensure its accuracy.
More information on the Erasmus Programme, this report and its annexes can be found at http://ec.europa.eu-education-erasmus
© European Commission, 2013
Responsible editor: Unit C1 ‘Higher Education; Erasmus’, Directorate-General for Education and Culture, European Commission, Brussels
8
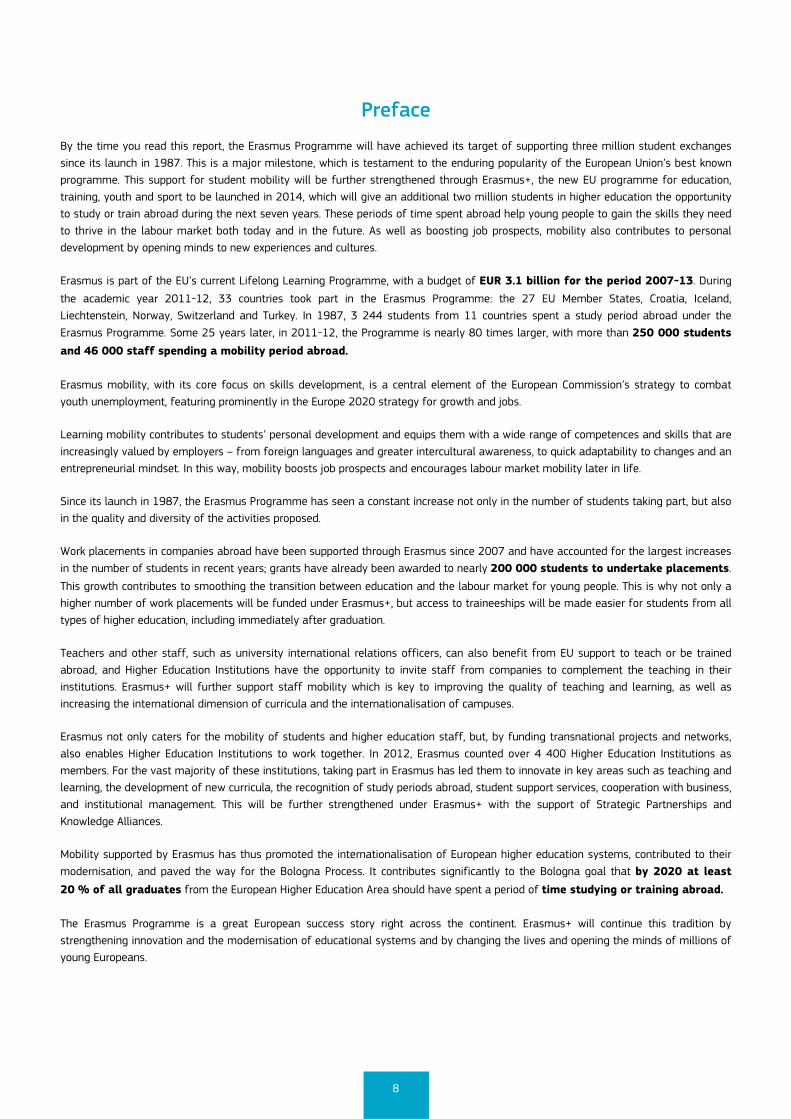
Preface
By the time you read this report, the Erasmus Programme will have achieved its target of supporting three million student exchanges since its launch in 1987. This is a major milestone, which is testament to the enduring popularity of the European Union’s best known programme. This support for student mobility will be further strengthened through Erasmus+, the new EU programme for education, training, youth and sport to be launched in 2014, which will give an additional two million students in higher education the opportunity to study or train abroad during the next seven years. These periods of time spent abroad help young people to gain the skills they need to thrive in the labour market both today and in the future. As well as boosting job prospects, mobility also contributes to personal development by opening minds to new experiences and cultures.
Erasmus is part of the EU’s current Lifelong Learning Programme, with a budget of EUR 3.1 billion for the period 2007-13. During
the academic year 2011-12, 33 countries took part in the Erasmus Programme: the 27 EU Member States, Croatia, Iceland, Liechtenstein, Norway, Switzerland and Turkey. In 1987, 3 244 students from 11 countries spent a study period abroad under the Erasmus Programme. Some 25 years later, in 2011-12, the Programme is nearly 80 times larger, with more than 250 000 students and 46 000 staff spending a mobility period abroad.
Erasmus mobility, with its core focus on skills development, is a central element of the European Commission’s strategy to combat youth unemployment, featuring prominently in the Europe 2020 strategy for growth and jobs.
Learning mobility contributes to students’ personal development and equips them with a wide range of competences and skills that are increasingly valued by employers – from foreign languages and greater intercultural awareness, to quick adaptability to changes and an entrepreneurial mindset. In this way, mobility boosts job prospects and encourages labour market mobility later in life.
Since its launch in 1987, the Erasmus Programme has seen a constant increase not only in the number of students taking part, but also in the quality and diversity of the activities proposed.
Work placements in companies abroad have been supported through Erasmus since 2007 and have accounted for the largest increases in the number of students in recent years; grants have already been awarded to nearly 200 000 students to undertake placements.
This growth contributes to smoothing the transition between education and the labour market for young people. This is why not only a higher number of work placements will be funded under Erasmus+, but access to traineeships will be made easier for students from all types of higher education, including immediately after graduation.
Teachers and other staff, such as university international relations officers, can also benefit from EU support to teach or be trained abroad, and Higher Education Institutions have the opportunity to invite staff from companies to complement the teaching in their institutions. Erasmus+ will further support staff mobility which is key to improving the quality of teaching and learning, as well as increasing the international dimension of curricula and the internationalisation of campuses.
Erasmus not only caters for the mobility of students and higher education staff, but, by funding transnational projects and networks, also enables Higher Education Institutions to work together. In 2012, Erasmus counted over 4 400 Higher Education Institutions as members. For the vast majority of these institutions, taking part in Erasmus has led them to innovate in key areas such as teaching and learning, the development of new curricula, the recognition of study periods abroad, student support services, cooperation with business, and institutional management. This will be further strengthened under Erasmus+ with the support of Strategic Partnerships and Knowledge Alliances.
Mobility supported by Erasmus has thus promoted the internationalisation of European higher education systems, contributed to their modernisation, and paved the way for the Bologna Process. It contributes significantly to the Bologna goal that by 2020 at least 20 % of all graduates from the European Higher Education Area should have spent a period of time studying or training abroad.
The Erasmus Programme is a great European success story right across the continent. Erasmus+ will continue this tradition by strengthening innovation and the modernisation of educational systems and by changing the lives and opening the minds of millions of young Europeans.
9
1. Erasmus Student Mobility
Table 1: Student mobility in figures 2011-12
1.1. General overview of student mobility
1.1.1. Introduction
Erasmus is the world’s most successful student mobility programme. Since it began in 1987-88, the Erasmus Programme has provided over three million European students with the opportunity to go abroad and study at a Higher Education Institution or train in a company. In 2011-12 student mobility accounted for around 80 % of the annual Erasmus budget and 1 in 20 students in participating countries in Europe received Erasmus grants during their studies to go abroad.
There has been a steady increase in the number of student mobility periods every year since the start of the Programme in 1987. It exceeded 200 000 for the first time in 2009-10. In 2011-12 some 252 827 students went abroad to study or train, setting a new record and representing an annual increase of 9 % compared with the previous year.
By 2002, one million students had participated in Erasmus. The two million milestone was reached at the end of the academic year 2008-09 and during 2012-13 the target of supporting three million students will have been achieved.
Chart 1: Progress to achieving the three million student mobility target
10
1.1.2. Outbound Erasmus student mobility (study exchanges and work placements)
As in the previous academic year, Spain sent the most students abroad with 39 545 students leaving for another country. Germany supported the second highest number of students going abroad, followed by France, Italy and Poland.
Some 68 % of students participating in study exchanges and work placements in 2011-12 were Bachelor degree students. Students enrolled in Master’s degree programmes made up 28 % of all participants, with doctoral candidates representing 1 %, while some 3 % of participants were registered at institutions offering short-cycle higher vocational education courses.
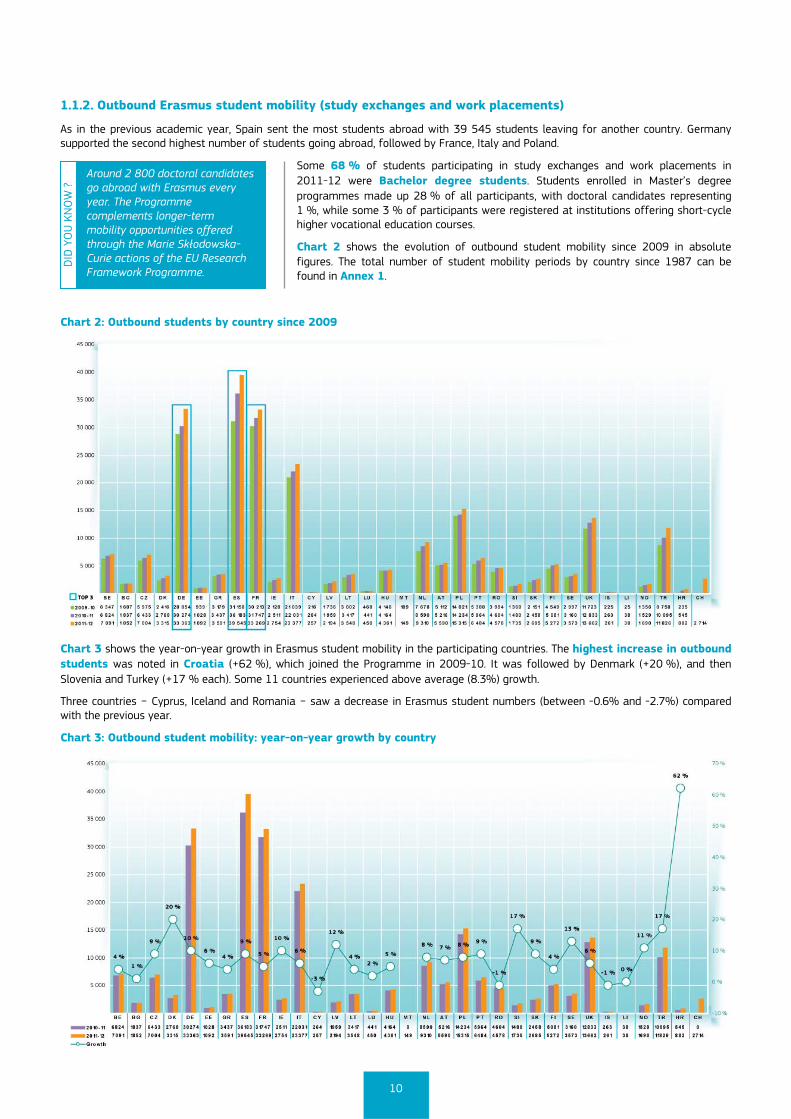
Chart 2 shows the evolution of outbound student mobility since 2009 in absolute figures. The total number of student mobility periods by country since 1987 can be found in Annex 1.
Chart 2: Outbound students by country since 2009
Chart 3 shows the year-on-year growth in Erasmus student mobility in the participating countries. The highest increase in outbound students was noted in Croatia (+62 %), which joined the Programme in 2009-10. It was followed by Denmark (+20 %), and then Slovenia and Turkey (+17 % each). Some 11 countries experienced above average (8.3%) growth.
Three countries − Cyprus, Iceland and Romania − saw a decrease in Erasmus student numbers (between -0.6% and -2.7%) compared with the previous year.
Chart 3: Outbound student mobility: year-on-year growth by country
DID
YO
U K
NO
W ?
Around 2 800 doctoral candidates go abroad with Erasmus every year. The Programme complements longer-term mobility opportunities offered through the Marie Skłodowska-Curie actions of the EU Research Framework Programme.
11
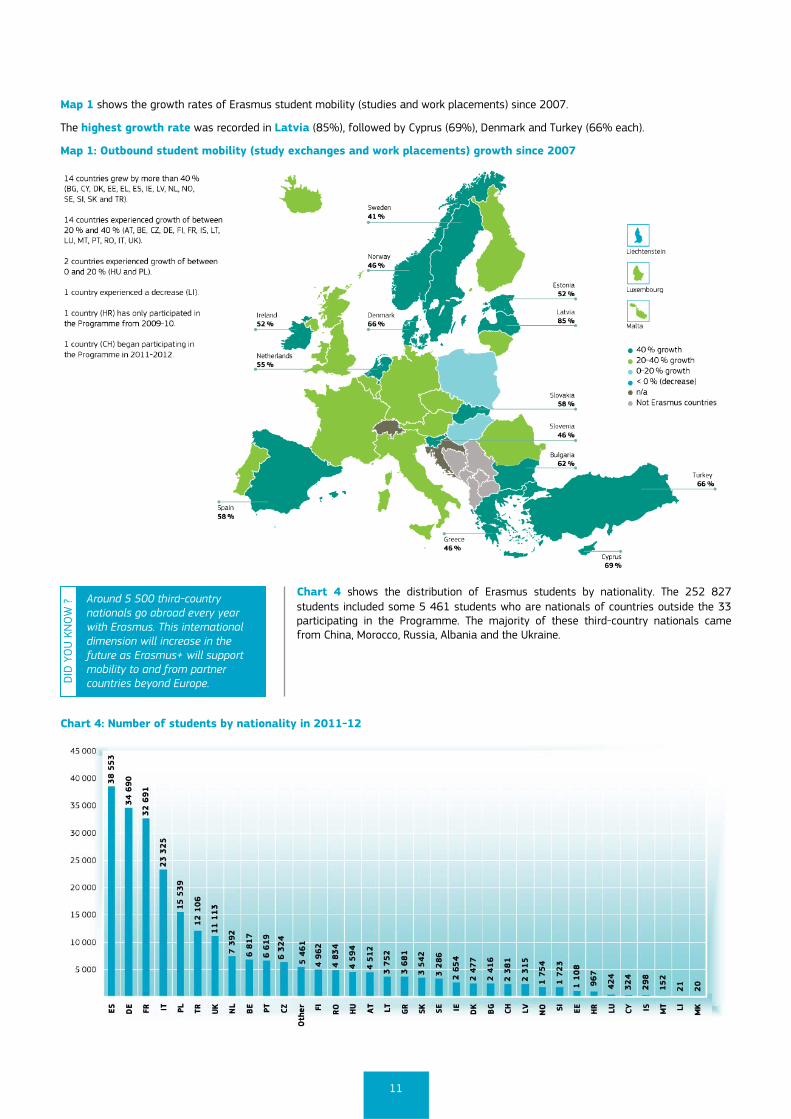
Map 1 shows the growth rates of Erasmus student mobility (studies and work placements) since 2007.
The highest growth rate was recorded in Latvia (85%), followed by Cyprus (69%), Denmark and Turkey (66% each).
Map 1: Outbound student mobility (study exchanges and work placements) growth since 2007
Chart 4 shows the distribution of Erasmus students by nationality. The 252 827 students included some 5 461 students who are nationals of countries outside the 33 participating in the Programme. The majority of these third-country nationals came from China, Morocco, Russia, Albania and the Ukraine.
Chart 4: Number of students by nationality in 2011-12
DID
YO
U K
NO
W ?
Around 5 500 third-country nationals go abroad every year with Erasmus. This international dimension will increase in the future as Erasmus+ will support mobility to and from partner countries beyond Europe.

12
The average age of Erasmus students in 2011-12 remained 22.5 years as in the previous year. It should be noted that this corresponds to the age of students at the time of submitting their application for an Erasmus grant, usually several months before the actual mobility period takes place. The vast majority − 82 % − of Erasmus students were aged between 20 and 24 years old, with the youngest students aged just 17 years old.
Chart 5: Age distribution of students in 2011-12
Chart 6 shows the share of Erasmus student mobility for studies compared to work placements in the participating countries in 2011-12. Work placements corresponded to more than 30 % of all periods spent abroad in five countries: Malta, Latvia, the United Kingdom, the Netherlands and Denmark. On average, student mobility for work placements represented 19 % of all Erasmus student mobility in 2011-12 (up from 17.7 % the previous year).
Chart 6: Study exchanges and work placements by home country in 2011-12
Absolute figures for student mobility correlate strongly with the number of students in the given countries. By comparing these results with the actual size of the student population of the country concerned, the success of the Programme can be seen in relative terms.
Eurostat, the European Commission’s service which provides statistical information on the European Union, publishes each year the size of the student population in European countries. This corresponds to the total number of students enrolled in tertiary education in a given academic year. According to the latest Eurostat data, in 2011 (2010-11) the total student population in the 32 countries participating in the Programme at that time was more than 24.6 million.
13
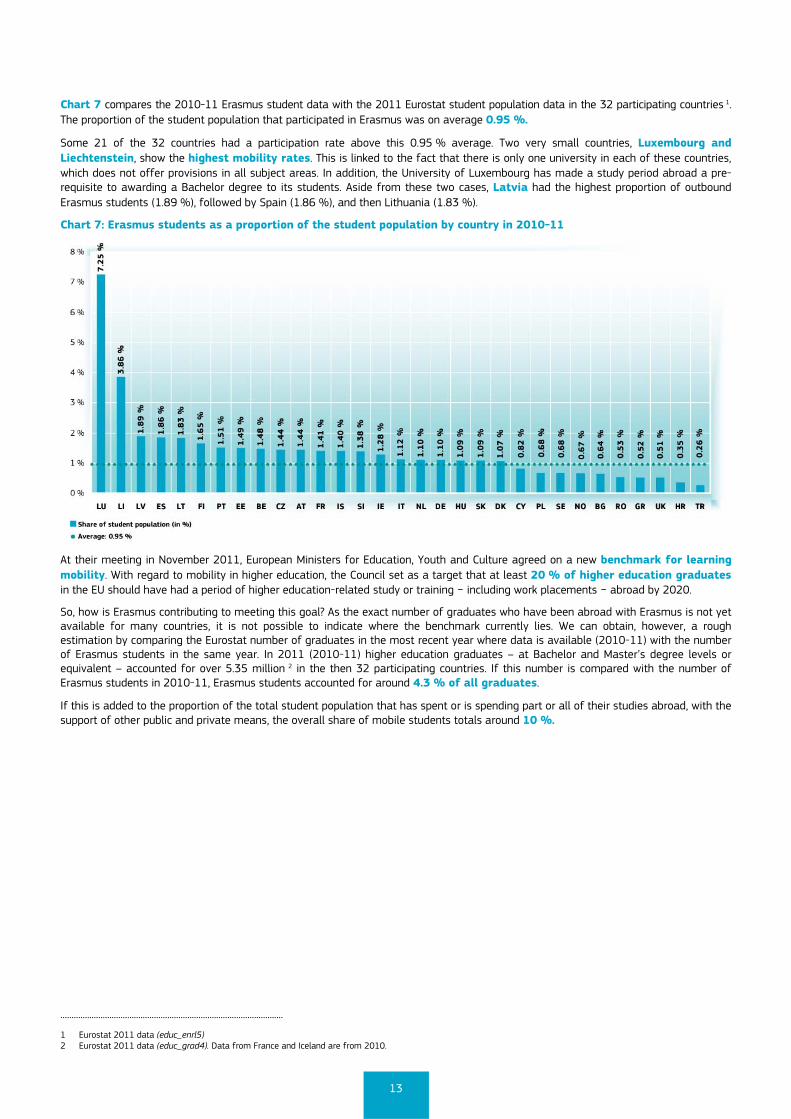
Chart 7 compares the 2010-11 Erasmus student data with the 2011 Eurostat student population data in the 32 participating countries 1. The proportion of the student population that participated in Erasmus was on average 0.95 %.
Some 21 of the 32 countries had a participation rate above this 0.95 % average. Two very small countries, Luxembourg and Liechtenstein, show the highest mobility rates. This is linked to the fact that there is only one university in each of these countries, which does not offer provisions in all subject areas. In addition, the University of Luxembourg has made a study period abroad a pre-requisite to awarding a Bachelor degree to its students. Aside from these two cases, Latvia had the highest proportion of outbound Erasmus students (1.89 %), followed by Spain (1.86 %), and then Lithuania (1.83 %).
Chart 7: Erasmus students as a proportion of the student population by country in 2010-11
At their meeting in November 2011, European Ministers for Education, Youth and Culture agreed on a new benchmark for learning mobility. With regard to mobility in higher education, the Council set as a target that at least 20 % of higher education graduates in the EU should have had a period of higher education-related study or training − including work placements − abroad by 2020.
So, how is Erasmus contributing to meeting this goal? As the exact number of graduates who have been abroad with Erasmus is not yet available for many countries, it is not possible to indicate where the benchmark currently lies. We can obtain, however, a rough estimation by comparing the Eurostat number of graduates in the most recent year where data is available (2010-11) with the number of Erasmus students in the same year. In 2011 (2010-11) higher education graduates – at Bachelor and Master’s degree levels or equivalent – accounted for over 5.35 million 2 in the then 32 participating countries. If this number is compared with the number of Erasmus students in 2010-11, Erasmus students accounted for around 4.3 % of all graduates.
If this is added to the proportion of the total student population that has spent or is spending part or all of their studies abroad, with the support of other public and private means, the overall share of mobile students totals around 10 %.
....................................................................................................
1 Eurostat 2011 data (educ_enrl5) 2 Eurostat 2011 data (educ_grad4). Data from France and Iceland are from 2010.
14
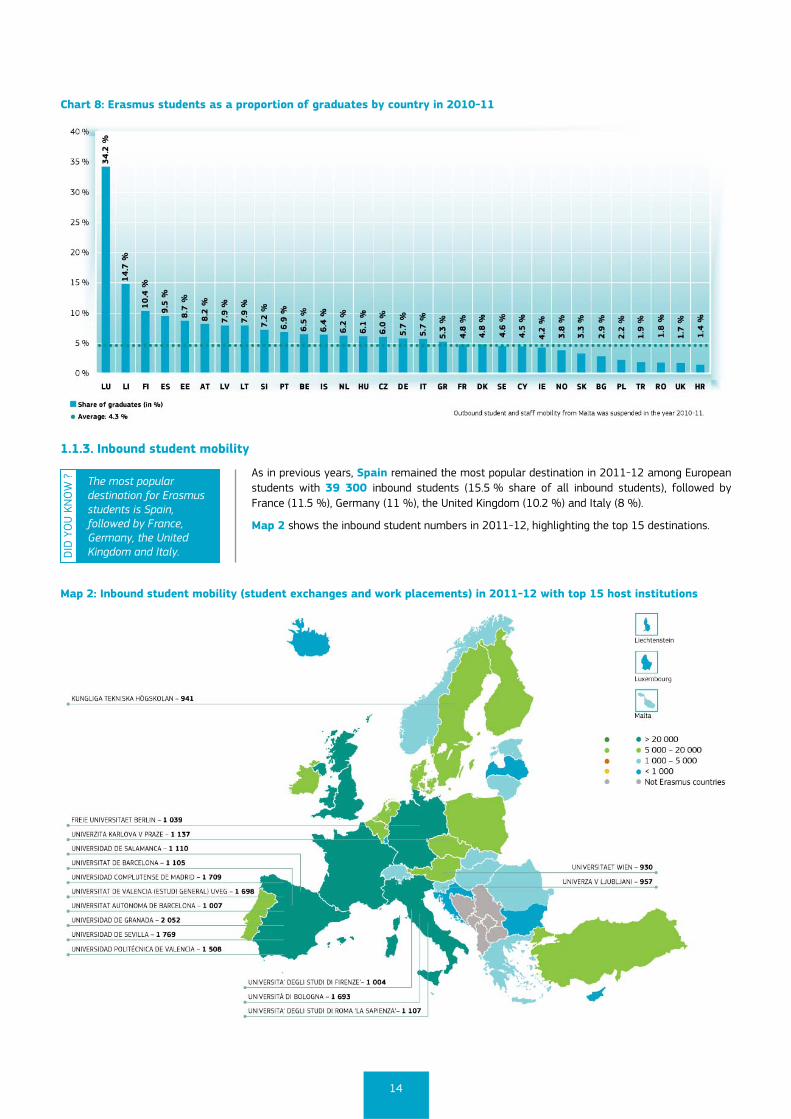
Chart 8: Erasmus students as a proportion of graduates by country in 2010-11
1.1.3. Inbound student mobility
As in previous years, Spain remained the most popular destination in 2011-12 among European students with 39 300 inbound students (15.5 % share of all inbound students), followed by France (11.5 %), Germany (11 %), the United Kingdom (10.2 %) and Italy (8 %).
Map 2 shows the inbound student numbers in 2011-12, highlighting the top 15 destinations.
Map 2: Inbound student mobility (student exchanges and work placements) in 2011-12 with top 15 host institutions
DID
YO
U K
NO
W ?
The most popular destination for Erasmus students is Spain, followed by France, Germany, the United Kingdom and Italy.
15
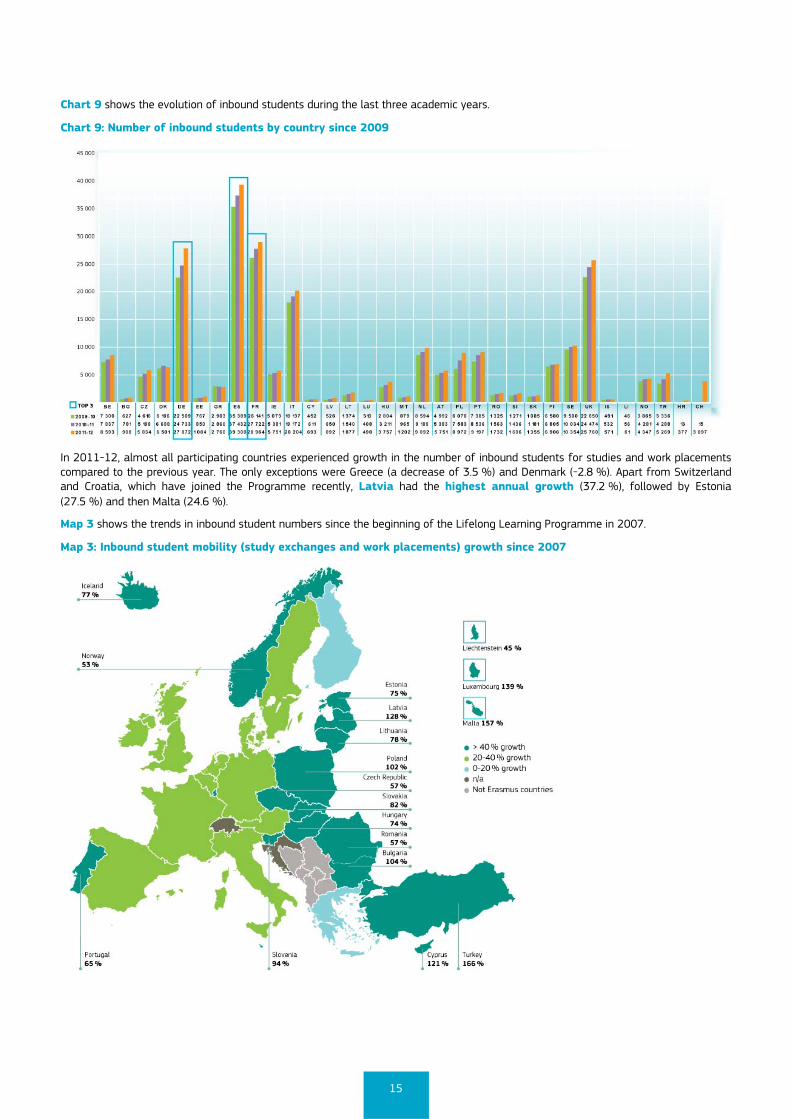
Chart 9 shows the evolution of inbound students during the last three academic years.
Chart 9: Number of inbound students by country since 2009
In 2011-12, almost all participating countries experienced growth in the number of inbound students for studies and work placements compared to the previous year. The only exceptions were Greece (a decrease of 3.5 %) and Denmark (-2.8 %). Apart from Switzerland and Croatia, which have joined the Programme recently, Latvia had the highest annual growth (37.2 %), followed by Estonia (27.5 %) and then Malta (24.6 %).
Map 3 shows the trends in inbound student numbers since the beginning of the Lifelong Learning Programme in 2007.
Map 3: Inbound student mobility (study exchanges and work placements) growth since 2007
16
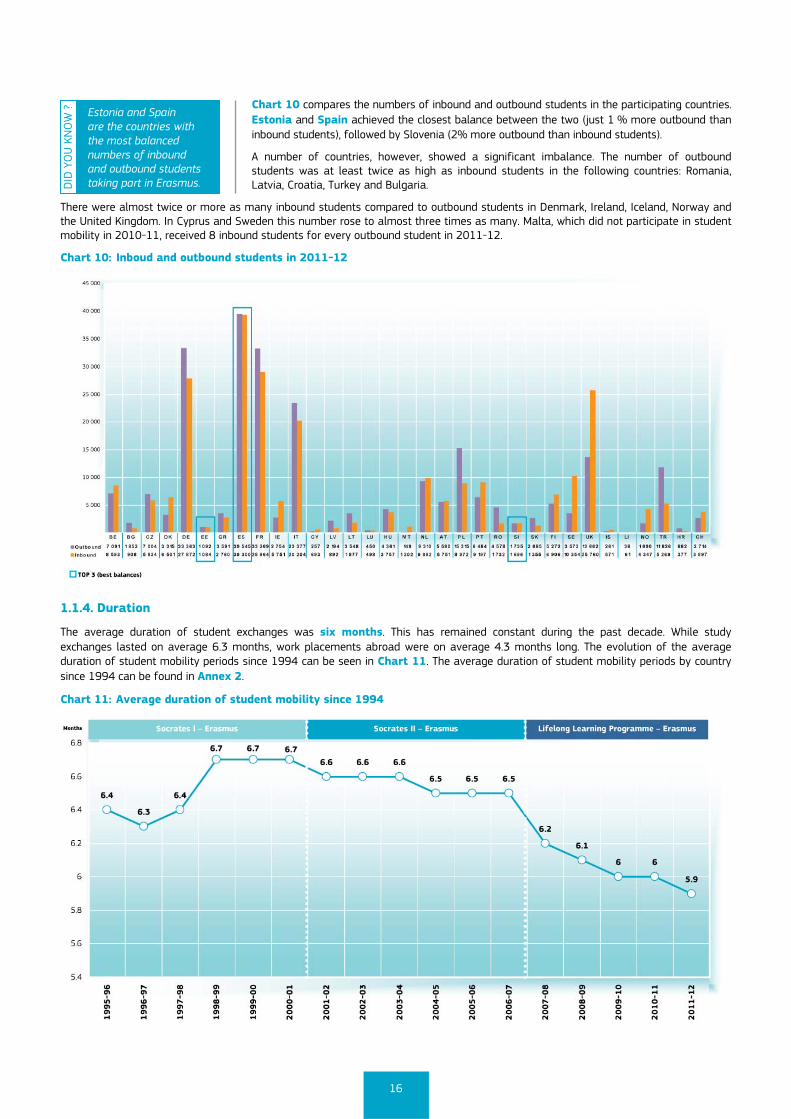
Chart 10 compares the numbers of inbound and outbound students in the participating countries. Estonia and Spain achieved the closest balance between the two (just 1 % more outbound than inbound students), followed by Slovenia (2% more outbound than inbound students).
A number of countries, however, showed a significant imbalance. The number of outbound students was at least twice as high as inbound students in the following countries: Romania, Latvia, Croatia, Turkey and Bulgaria.
There were almost twice or more as many inbound students compared to outbound students in Denmark, Ireland, Iceland, Norway and the United Kingdom. In Cyprus and Sweden this number rose to almost three times as many. Malta, which did not participate in student mobility in 2010-11, received 8 inbound students for every outbound student in 2011-12.
Chart 10: Inboud and outbound students in 2011-12
1.1.4. Duration
The average duration of student exchanges was six months. This has remained constant during the past decade. While study exchanges lasted on average 6.3 months, work placements abroad were on average 4.3 months long. The evolution of the average duration of student mobility periods since 1994 can be seen in Chart 11. The average duration of student mobility periods by country since 1994 can be found in Annex 2.
Chart 11: Average duration of student mobility since 1994
DID
YO
U K
NO
W ?
Estonia and Spain are the countries with the most balanced numbers of inbound and outbound students taking part in Erasmus.
17
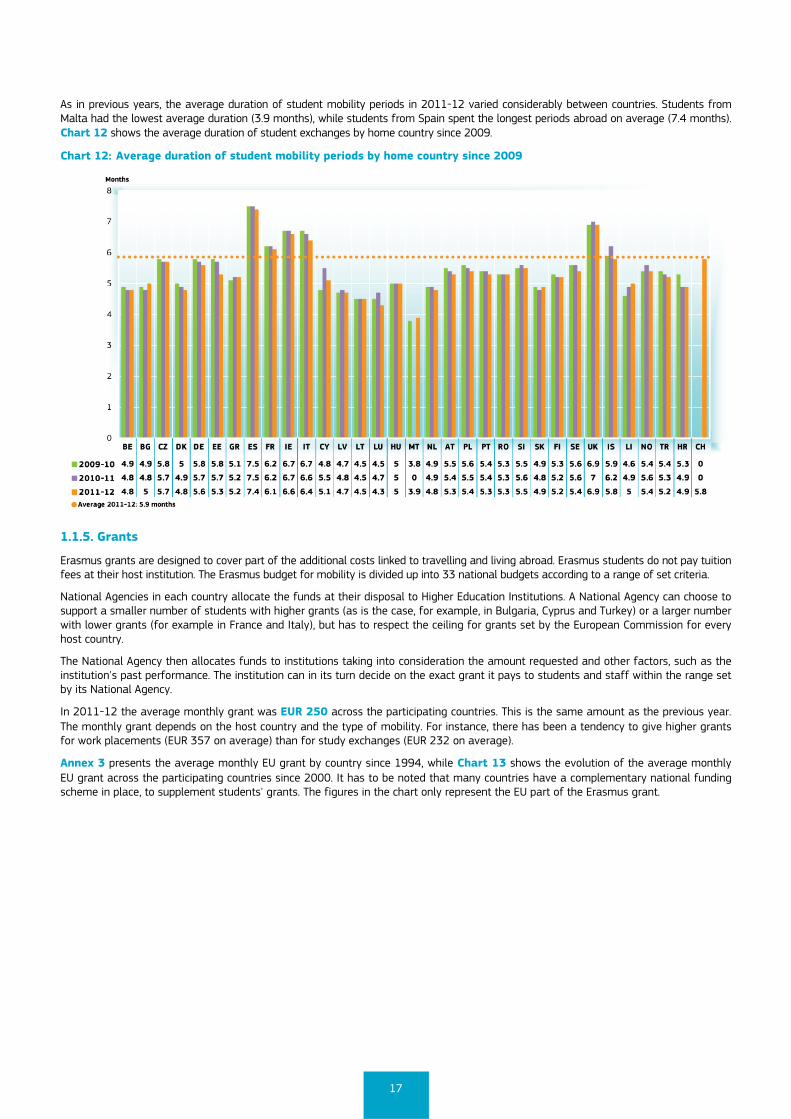
As in previous years, the average duration of student mobility periods in 2011-12 varied considerably between countries. Students from Malta had the lowest average duration (3.9 months), while students from Spain spent the longest periods abroad on average (7.4 months). Chart 12 shows the average duration of student exchanges by home country since 2009.
Chart 12: Average duration of student mobility periods by home country since 2009
1.1.5. Grants
Erasmus grants are designed to cover part of the additional costs linked to travelling and living abroad. Erasmus students do not pay tuition fees at their host institution. The Erasmus budget for mobility is divided up into 33 national budgets according to a range of set criteria.
National Agencies in each country allocate the funds at their disposal to Higher Education Institutions. A National Agency can choose to support a smaller number of students with higher grants (as is the case, for example, in Bulgaria, Cyprus and Turkey) or a larger number with lower grants (for example in France and Italy), but has to respect the ceiling for grants set by the European Commission for every host country.
The National Agency then allocates funds to institutions taking into consideration the amount requested and other factors, such as the institution's past performance. The institution can in its turn decide on the exact grant it pays to students and staff within the range set by its National Agency.
In 2011-12 the average monthly grant was EUR 250 across the participating countries. This is the same amount as the previous year. The monthly grant depends on the host country and the type of mobility. For instance, there has been a tendency to give higher grants for work placements (EUR 357 on average) than for study exchanges (EUR 232 on average).
Annex 3 presents the average monthly EU grant by country since 1994, while Chart 13 shows the evolution of the average monthly EU grant across the participating countries since 2000. It has to be noted that many countries have a complementary national funding scheme in place, to supplement students' grants. The figures in the chart only represent the EU part of the Erasmus grant.

18
Chart 13: Average monthly EU grant for student mobility since 2000
Chart 14 shows the average monthly EU grant by home country in 2011-12. The grant levels varied greatly across the participating countries, ranging from EUR 123 in Spain to EUR 614 in Cyprus.
Wide variations can be seen in the level of student grants in the different sending countries due to the following factors:
the difference in the living costs between the sending and the destination country (the more relatively expensive the receiving country, the higher the grant level);
the level of co-financing at national, regional or institutional level (the higher the level of co-financing, the lower the Erasmus grant level);
the level of demand in the sending country or institution (a high level of demand leads to a reduction of the average grants to maximise the number of periods spent abroad);
the remoteness of the sending country or region.
Chart 14 Average monthly EU grant for student mobility by home country in 2011-12
1.1.6. Students with special needs grants
Erasmus also actively supports the participation of students with special needs by offering them a supplementary grant. In 2011-12, 336 students with special needs received additional funding. This is a significant increase on the previous year (255 students in 2010-11). Most of them – 88 % − chose to go abroad to study.
DID
YO
U K
NO
W ?
In 2011-12, some 336 Erasmus students with special needs received additional funding to study or train abroad. This will be further supported through Erasmus+.
19
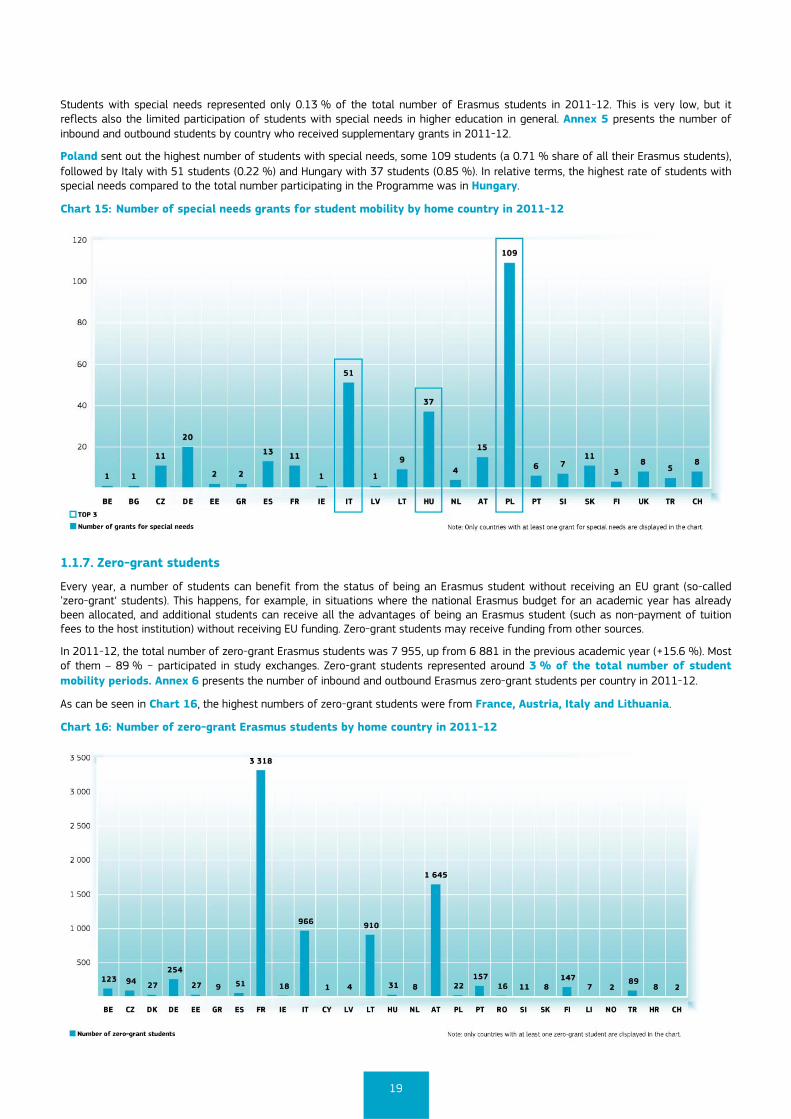
Students with special needs represented only 0.13 % of the total number of Erasmus students in 2011-12. This is very low, but it reflects also the limited participation of students with special needs in higher education in general. Annex 5 presents the number of inbound and outbound students by country who received supplementary grants in 2011-12.
Poland sent out the highest number of students with special needs, some 109 students (a 0.71 % share of all their Erasmus students), followed by Italy with 51 students (0.22 %) and Hungary with 37 students (0.85 %). In relative terms, the highest rate of students with special needs compared to the total number participating in the Programme was in Hungary.
Chart 15: Number of special needs grants for student mobility by home country in 2011-12
1.1.7. Zero-grant students
Every year, a number of students can benefit from the status of being an Erasmus student without receiving an EU grant (so-called ’zero-grant‘ students). This happens, for example, in situations where the national Erasmus budget for an academic year has already been allocated, and additional students can receive all the advantages of being an Erasmus student (such as non-payment of tuition fees to the host institution) without receiving EU funding. Zero-grant students may receive funding from other sources.
In 2011-12, the total number of zero-grant Erasmus students was 7 955, up from 6 881 in the previous academic year (+15.6 %). Most of them – 89 % − participated in study exchanges. Zero-grant students represented around 3 % of the total number of student mobility periods. Annex 6 presents the number of inbound and outbound Erasmus zero-grant students per country in 2011-12.
As can be seen in Chart 16, the highest numbers of zero-grant students were from France, Austria, Italy and Lithuania.
Chart 16: Number of zero-grant Erasmus students by home country in 2011-12
20
1.1.8. Participating Higher Education Institutions
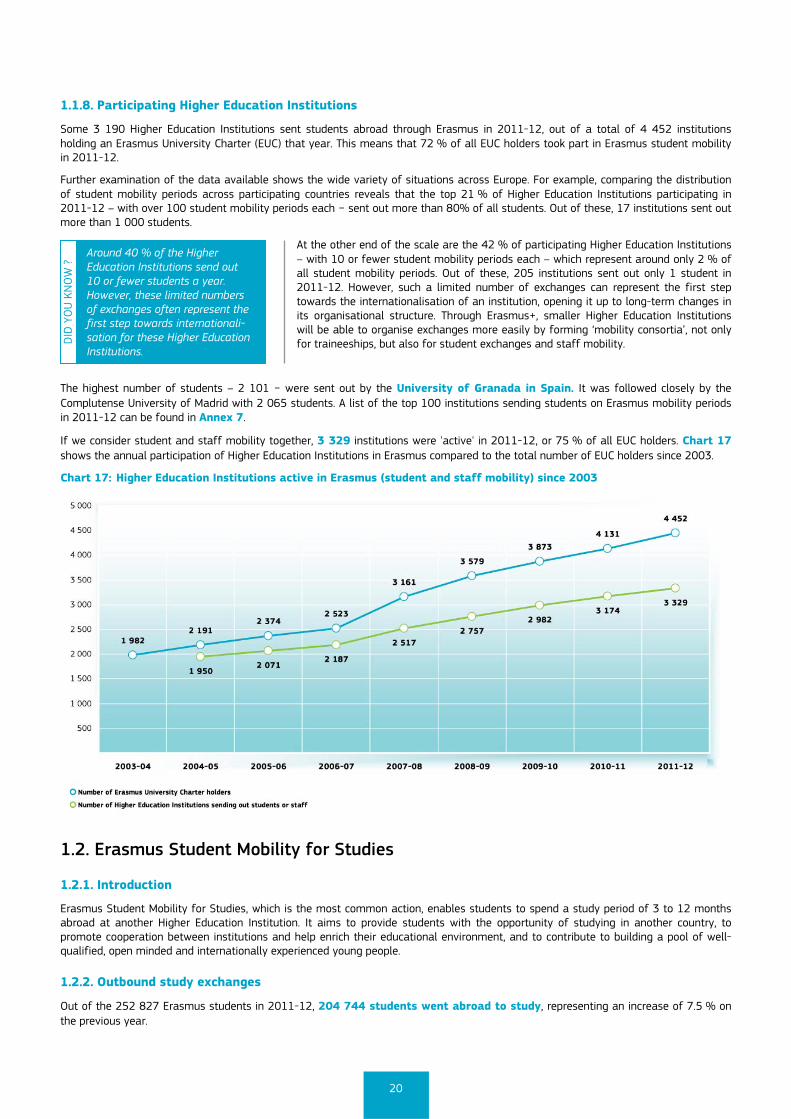
Some 3 190 Higher Education Institutions sent students abroad through Erasmus in 2011-12, out of a total of 4 452 institutions holding an Erasmus University Charter (EUC) that year. This means that 72 % of all EUC holders took part in Erasmus student mobility in 2011-12.
Further examination of the data available shows the wide variety of situations across Europe. For example, comparing the distribution of student mobility periods across participating countries reveals that the top 21 % of Higher Education Institutions participating in 2011-12 – with over 100 student mobility periods each − sent out more than 80% of all students. Out of these, 17 institutions sent out more than 1 000 students.
At the other end of the scale are the 42 % of participating Higher Education Institutions – with 10 or fewer student mobility periods each – which represent around only 2 % of all student mobility periods. Out of these, 205 institutions sent out only 1 student in 2011-12. However, such a limited number of exchanges can represent the first step towards the internationalisation of an institution, opening it up to long-term changes in its organisational structure. Through Erasmus+, smaller Higher Education Institutions will be able to organise exchanges more easily by forming ‘mobility consortia’, not only for traineeships, but also for student exchanges and staff mobility.
The highest number of students – 2 101 − were sent out by the University of Granada in Spain. It was followed closely by the Complutense University of Madrid with 2 065 students. A list of the top 100 institutions sending students on Erasmus mobility periods in 2011-12 can be found in Annex 7.
If we consider student and staff mobility together, 3 329 institutions were 'active' in 2011-12, or 75 % of all EUC holders. Chart 17 shows the annual participation of Higher Education Institutions in Erasmus compared to the total number of EUC holders since 2003.
Chart 17: Higher Education Institutions active in Erasmus (student and staff mobility) since 2003
1.2. Erasmus Student Mobility for Studies
1.2.1. Introduction
Erasmus Student Mobility for Studies, which is the most common action, enables students to spend a study period of 3 to 12 months abroad at another Higher Education Institution. It aims to provide students with the opportunity of studying in another country, to promote cooperation between institutions and help enrich their educational environment, and to contribute to building a pool of well-qualified, open minded and internationally experienced young people.
1.2.2. Outbound study exchanges
Out of the 252 827 Erasmus students in 2011-12, 204 744 students went abroad to study, representing an increase of 7.5 % on the previous year.
DID
YO
U K
NO
W ?
Around 40 % of the Higher Education Institutions send out 10 or fewer students a year. However, these limited numbers of exchanges often represent the first step towards internationali-sation for these Higher Education Institutions.
21
Spain sent the most students abroad for studies (34 103) followed by Germany, France, Italy and Poland. These countries also have the largest student populations in Europe.
Luxembourg, Liechtenstein and Spain sent out the most students compared with the size of their student population.
Bachelor students comprised 70.5 % of all students participating in study exchanges in 2011-12. Students enrolled in Master’s programmes constituted 28.2 % of participants while doctoral candidates were 0.8 %. Finally, those registered for short-cycle higher vocational education courses made up 0.6 % of participants. These proportions correspond closely to those of the previous year.
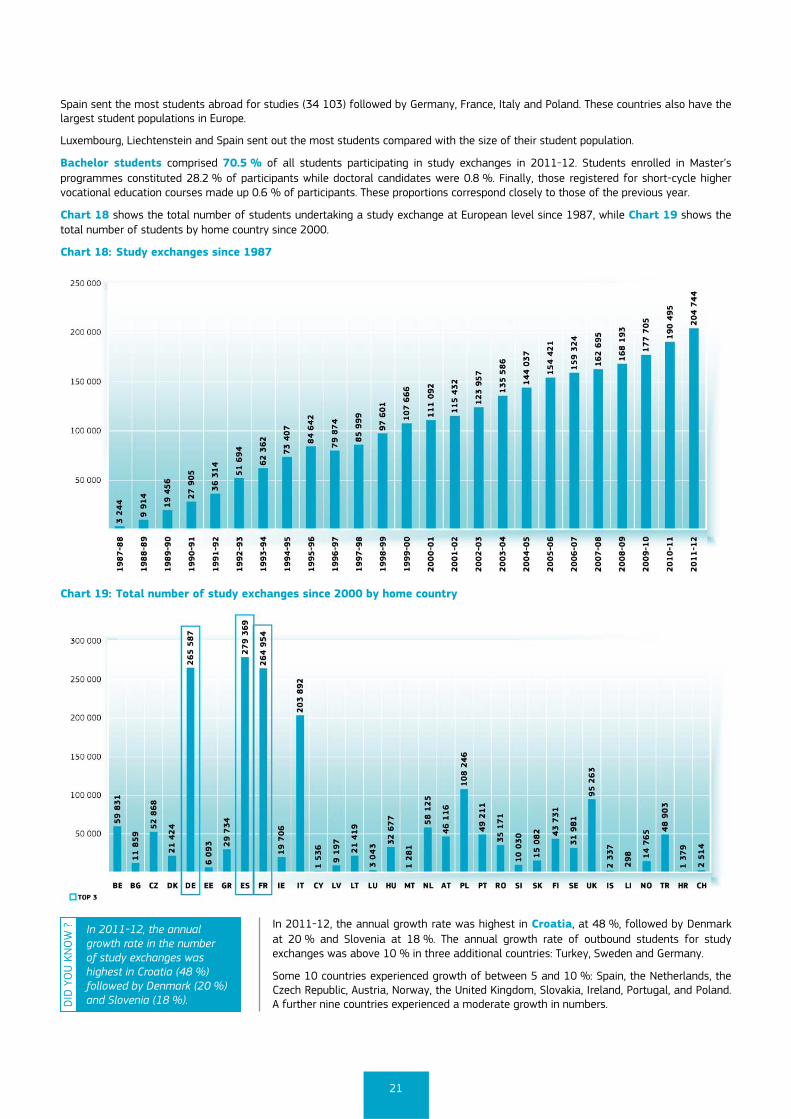
Chart 18 shows the total number of students undertaking a study exchange at European level since 1987, while Chart 19 shows the total number of students by home country since 2000.
Chart 18: Study exchanges since 1987
Chart 19: Total number of study exchanges since 2000 by home country
In 2011-12, the annual growth rate was highest in Croatia, at 48 %, followed by Denmark at 20 % and Slovenia at 18 %. The annual growth rate of outbound students for study exchanges was above 10 % in three additional countries: Turkey, Sweden and Germany.
Some 10 countries experienced growth of between 5 and 10 %: Spain, the Netherlands, the Czech Republic, Austria, Norway, the United Kingdom, Slovakia, Ireland, Portugal, and Poland. A further nine countries experienced a moderate growth in numbers. D
ID Y
OU
KN
OW
?
In 2011-12, the annual growth rate in the number of study exchanges was highest in Croatia (48 %) followed by Denmark (20 %) and Slovenia (18 %).
22
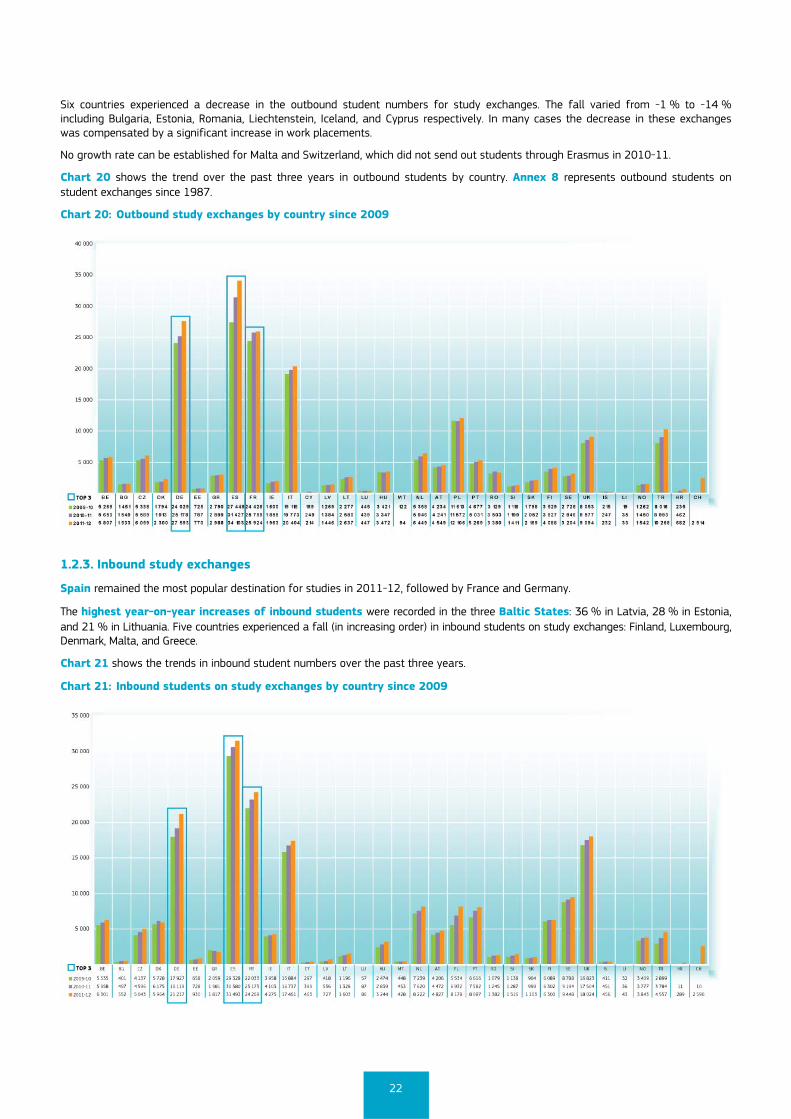
Six countries experienced a decrease in the outbound student numbers for study exchanges. The fall varied from -1 % to -14 % including Bulgaria, Estonia, Romania, Liechtenstein, Iceland, and Cyprus respectively. In many cases the decrease in these exchanges was compensated by a significant increase in work placements.
No growth rate can be established for Malta and Switzerland, which did not send out students through Erasmus in 2010-11.
Chart 20 shows the trend over the past three years in outbound students by country. Annex 8 represents outbound students on student exchanges since 1987.
Chart 20: Outbound study exchanges by country since 2009
1.2.3. Inbound study exchanges
Spain remained the most popular destination for studies in 2011-12, followed by France and Germany.
The highest year-on-year increases of inbound students were recorded in the three Baltic States: 36 % in Latvia, 28 % in Estonia, and 21 % in Lithuania. Five countries experienced a fall (in increasing order) in inbound students on study exchanges: Finland, Luxembourg, Denmark, Malta, and Greece.
Chart 21 shows the trends in inbound student numbers over the past three years.
Chart 21: Inbound students on study exchanges by country since 2009
23
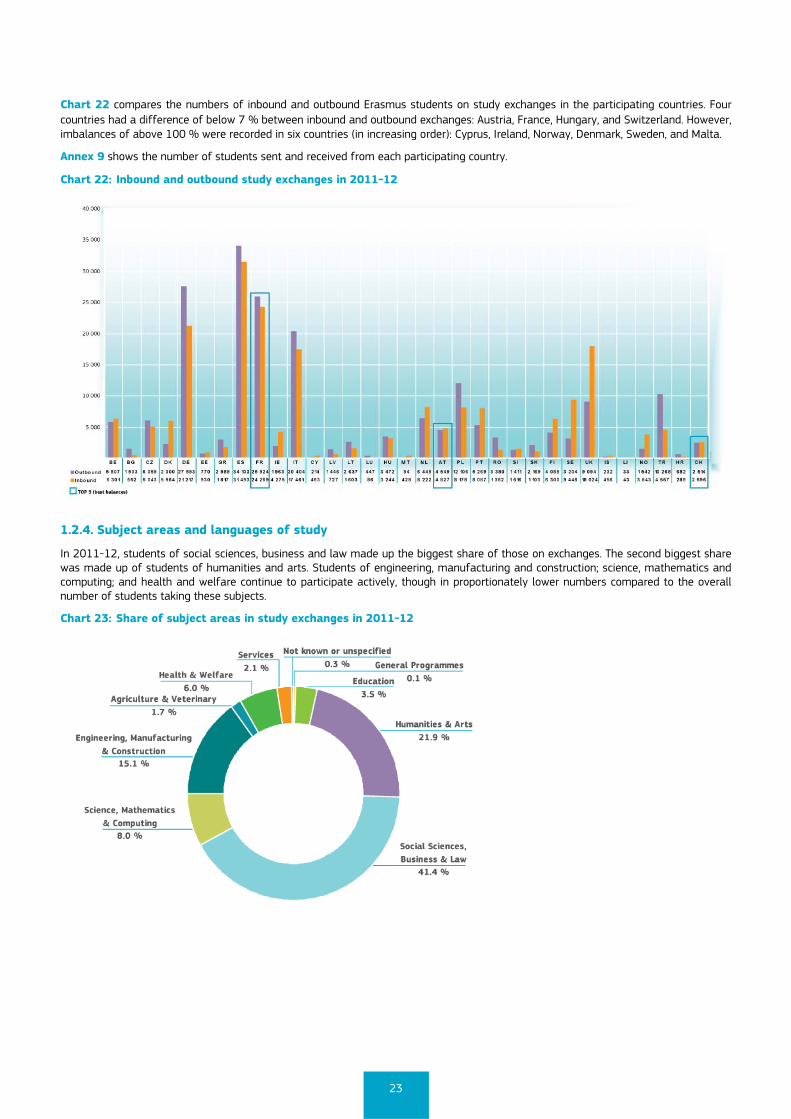
Chart 22 compares the numbers of inbound and outbound Erasmus students on study exchanges in the participating countries. Four countries had a difference of below 7 % between inbound and outbound exchanges: Austria, France, Hungary, and Switzerland. However, imbalances of above 100 % were recorded in six countries (in increasing order): Cyprus, Ireland, Norway, Denmark, Sweden, and Malta.
Annex 9 shows the number of students sent and received from each participating country.
Chart 22: Inbound and outbound study exchanges in 2011-12
1.2.4. Subject areas and languages of study
In 2011-12, students of social sciences, business and law made up the biggest share of those on exchanges. The second biggest share was made up of students of humanities and arts. Students of engineering, manufacturing and construction; science, mathematics and computing; and health and welfare continue to participate actively, though in proportionately lower numbers compared to the overall number of students taking these subjects.
Chart 23: Share of subject areas in study exchanges in 2011-12
24
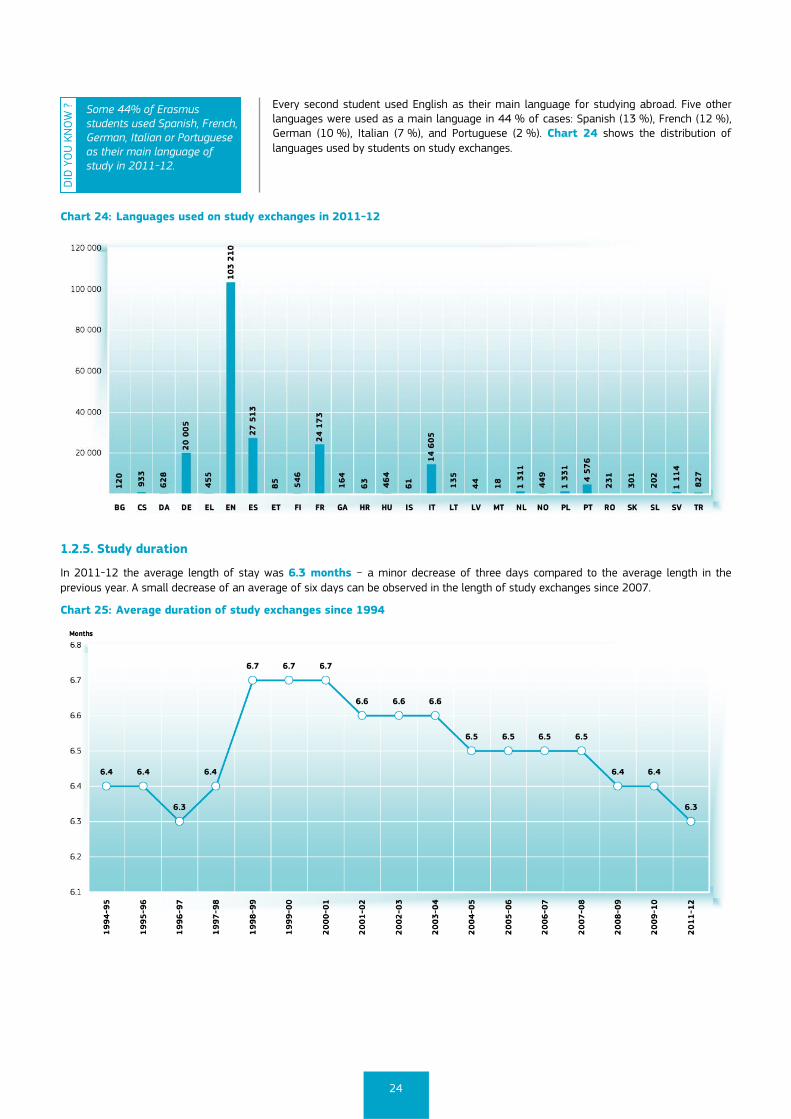
Every second student used English as their main language for studying abroad. Five other languages were used as a main language in 44 % of cases: Spanish (13 %), French (12 %), German (10 %), Italian (7 %), and Portuguese (2 %). Chart 24 shows the distribution of languages used by students on study exchanges.
Chart 24: Languages used on study exchanges in 2011-12
1.2.5. Study duration
In 2011-12 the average length of stay was 6.3 months − a minor decrease of three days compared to the average length in the previous year. A small decrease of an average of six days can be observed in the length of study exchanges since 2007.
Chart 25: Average duration of study exchanges since 1994
DID
YO
U K
NO
W ?
Some 44% of Erasmus students used Spanish, French, German, Italian or Portuguese as their main language of study in 2011-12.
25
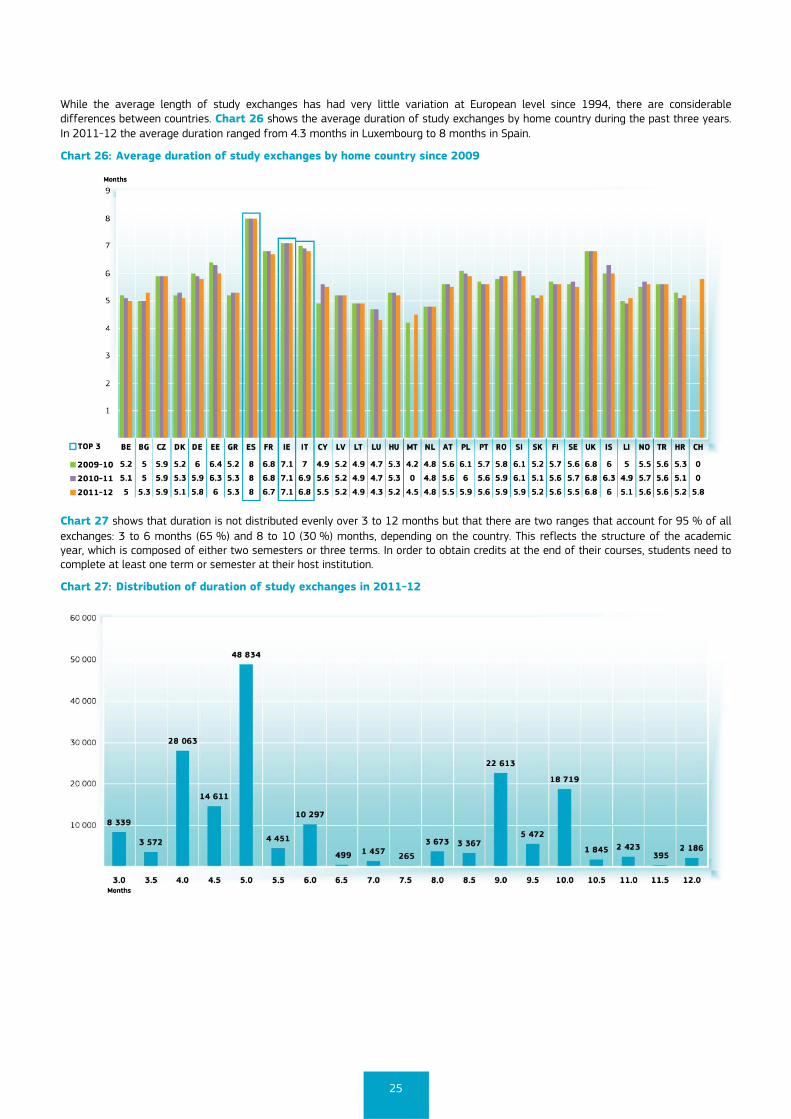
While the average length of study exchanges has had very little variation at European level since 1994, there are considerable differences between countries. Chart 26 shows the average duration of study exchanges by home country during the past three years. In 2011-12 the average duration ranged from 4.3 months in Luxembourg to 8 months in Spain.
Chart 26: Average duration of study exchanges by home country since 2009
Chart 27 shows that duration is not distributed evenly over 3 to 12 months but that there are two ranges that account for 95 % of all exchanges: 3 to 6 months (65 %) and 8 to 10 (30 %) months, depending on the country. This reflects the structure of the academic year, which is composed of either two semesters or three terms. In order to obtain credits at the end of their courses, students need to complete at least one term or semester at their host institution.
Chart 27: Distribution of duration of study exchanges in 2011-12
26
1.2.6. Study grants
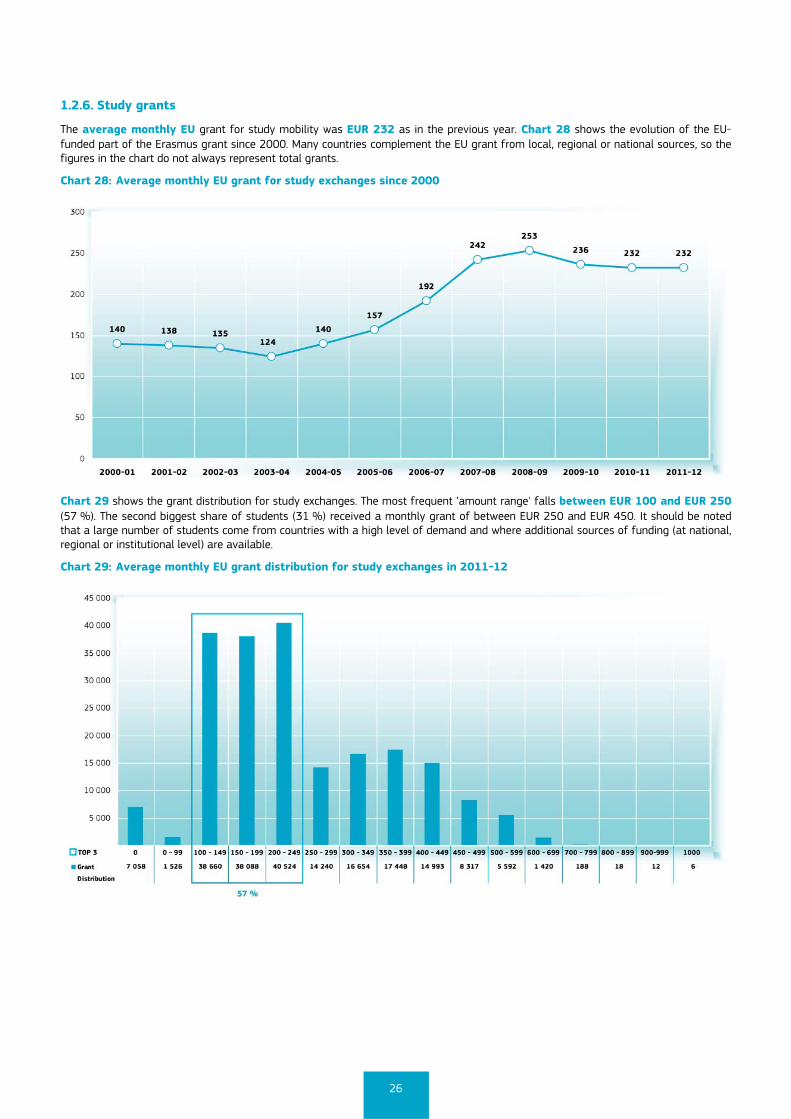
The average monthly EU grant for study mobility was EUR 232 as in the previous year. Chart 28 shows the evolution of the EU-funded part of the Erasmus grant since 2000. Many countries complement the EU grant from local, regional or national sources, so the figures in the chart do not always represent total grants.
Chart 28: Average monthly EU grant for study exchanges since 2000
Chart 29 shows the grant distribution for study exchanges. The most frequent ’amount range' falls between EUR 100 and EUR 250 (57 %). The second biggest share of students (31 %) received a monthly grant of between EUR 250 and EUR 450. It should be noted that a large number of students come from countries with a high level of demand and where additional sources of funding (at national, regional or institutional level) are available.
Chart 29: Average monthly EU grant distribution for study exchanges in 2011-12
27
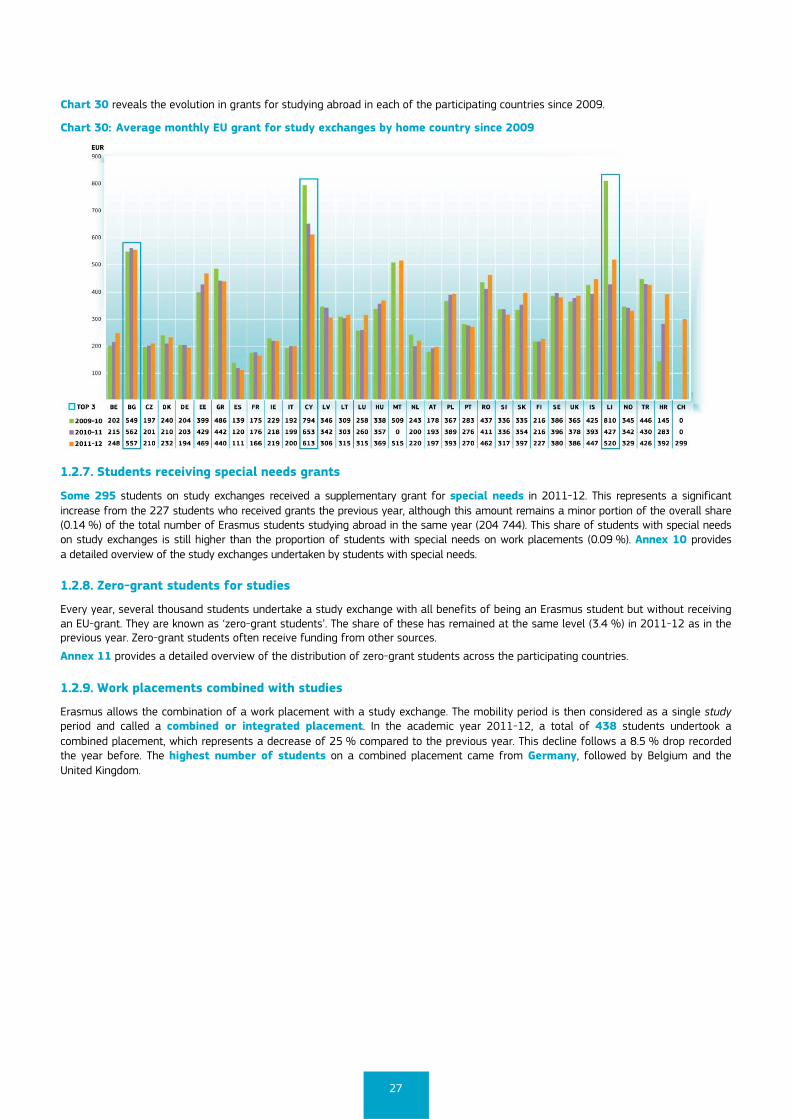
Chart 30 reveals the evolution in grants for studying abroad in each of the participating countries since 2009.
Chart 30: Average monthly EU grant for study exchanges by home country since 2009
1.2.7. Students receiving special needs grants
Some 295 students on study exchanges received a supplementary grant for special needs in 2011-12. This represents a significant increase from the 227 students who received grants the previous year, although this amount remains a minor portion of the overall share (0.14 %) of the total number of Erasmus students studying abroad in the same year (204 744). This share of students with special needs on study exchanges is still higher than the proportion of students with special needs on work placements (0.09 %). Annex 10 provides a detailed overview of the study exchanges undertaken by students with special needs.
1.2.8. Zero-grant students for studies
Every year, several thousand students undertake a study exchange with all benefits of being an Erasmus student but without receiving an EU-grant. They are known as ‘zero-grant students’. The share of these has remained at the same level (3.4 %) in 2011-12 as in the previous year. Zero-grant students often receive funding from other sources.
Annex 11 provides a detailed overview of the distribution of zero-grant students across the participating countries.
1.2.9. Work placements combined with studies
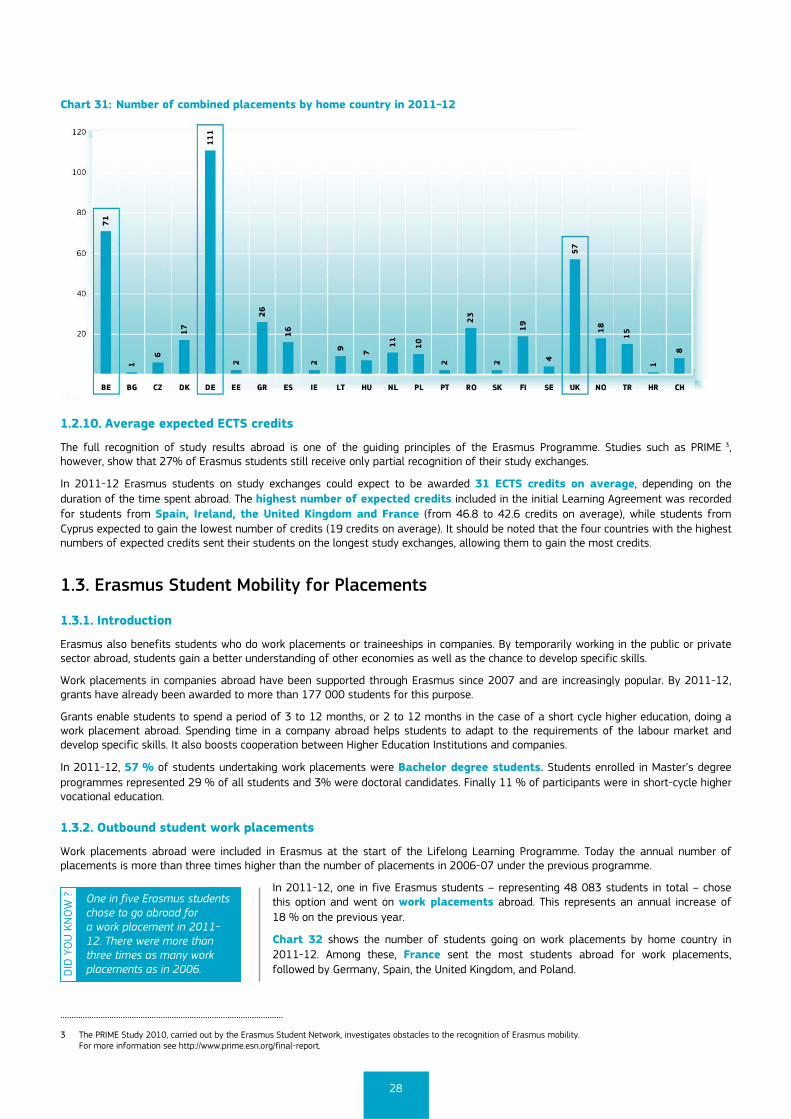
Erasmus allows the combination of a work placement with a study exchange. The mobility period is then considered as a single study period and called a combined or integrated placement. In the academic year 2011-12, a total of 438 students undertook a combined placement, which represents a decrease of 25 % compared to the previous year. This decline follows a 8.5 % drop recorded the year before. The highest number of students on a combined placement came from Germany, followed by Belgium and the United Kingdom.
28
Chart 31: Number of combined placements by home country in 2011-12
1.2.10. Average expected ECTS credits
The full recognition of study results abroad is one of the guiding principles of the Erasmus Programme. Studies such as PRIME 3, however, show that 27% of Erasmus students still receive only partial recognition of their study exchanges.
In 2011-12 Erasmus students on study exchanges could expect to be awarded 31 ECTS credits on average, depending on the duration of the time spent abroad. The highest number of expected credits included in the initial Learning Agreement was recorded for students from Spain, Ireland, the United Kingdom and France (from 46.8 to 42.6 credits on average), while students from Cyprus expected to gain the lowest number of credits (19 credits on average). It should be noted that the four countries with the highest numbers of expected credits sent their students on the longest study exchanges, allowing them to gain the most credits.
1.3. Erasmus Student Mobility for Placements
1.3.1. Introduction
Erasmus also benefits students who do work placements or traineeships in companies. By temporarily working in the public or private sector abroad, students gain a better understanding of other economies as well as the chance to develop specific skills.
Work placements in companies abroad have been supported through Erasmus since 2007 and are increasingly popular. By 2011-12, grants have already been awarded to more than 177 000 students for this purpose.
Grants enable students to spend a period of 3 to 12 months, or 2 to 12 months in the case of a short cycle higher education, doing a work placement abroad. Spending time in a company abroad helps students to adapt to the requirements of the labour market and develop specific skills. It also boosts cooperation between Higher Education Institutions and companies.
In 2011-12, 57 % of students undertaking work placements were Bachelor degree students. Students enrolled in Master’s degree programmes represented 29 % of all students and 3% were doctoral candidates. Finally 11 % of participants were in short-cycle higher vocational education.
1.3.2. Outbound student work placements
Work placements abroad were included in Erasmus at the start of the Lifelong Learning Programme. Today the annual number of placements is more than three times higher than the number of placements in 2006-07 under the previous programme.
In 2011-12, one in five Erasmus students – representing 48 083 students in total – chose this option and went on work placements abroad. This represents an annual increase of 18 % on the previous year.
Chart 32 shows the number of students going on work placements by home country in 2011-12. Among these, France sent the most students abroad for work placements, followed by Germany, Spain, the United Kingdom, and Poland.
....................................................................................................
3 The PRIME Study 2010, carried out by the Erasmus Student Network, investigates obstacles to the recognition of Erasmus mobility. For more information see http://www.prime.esn.org/final-report.
DID
YO
U K
NO
W ?
One in five Erasmus students chose to go abroad for a work placement in 2011-12. There were more than three times as many work placements as in 2006.
29
Chart 32: Outbound students on work placements by country in 2011-12
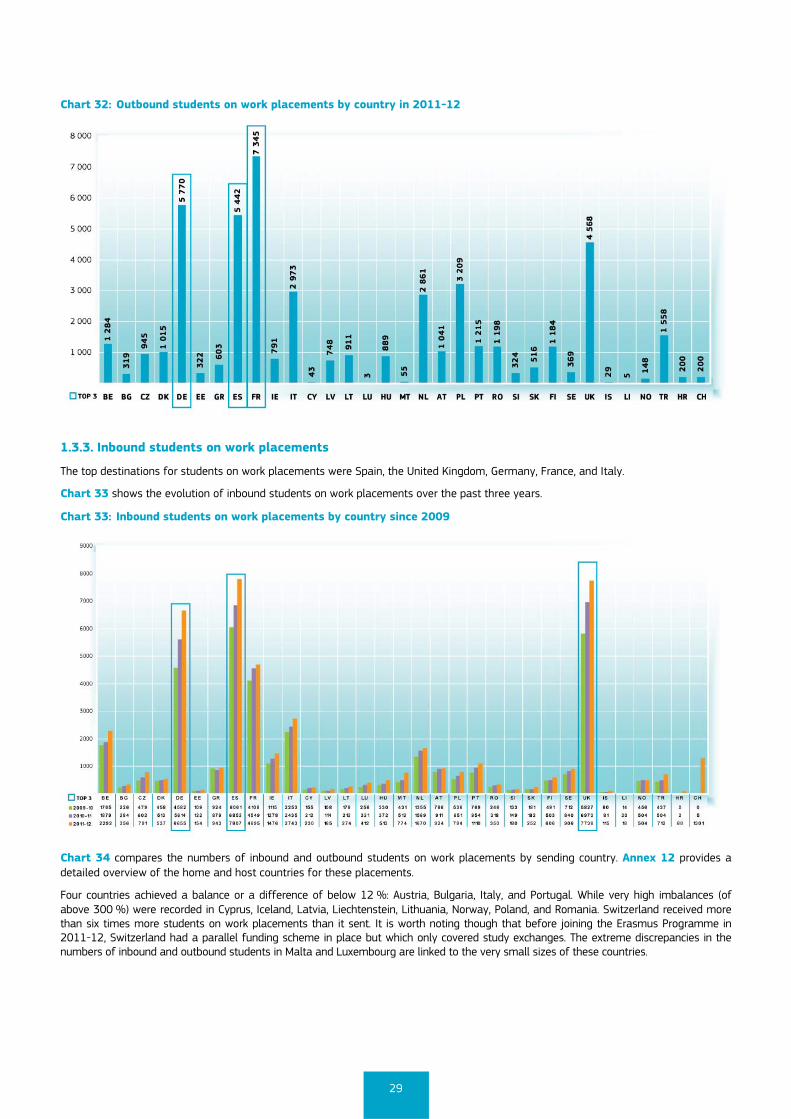
1.3.3. Inbound students on work placements
The top destinations for students on work placements were Spain, the United Kingdom, Germany, France, and Italy.
Chart 33 shows the evolution of inbound students on work placements over the past three years.
Chart 33: Inbound students on work placements by country since 2009
Chart 34 compares the numbers of inbound and outbound students on work placements by sending country. Annex 12 provides a detailed overview of the home and host countries for these placements.
Four countries achieved a balance or a difference of below 12 %: Austria, Bulgaria, Italy, and Portugal. While very high imbalances (of above 300 %) were recorded in Cyprus, Iceland, Latvia, Liechtenstein, Lithuania, Norway, Poland, and Romania. Switzerland received more than six times more students on work placements than it sent. It is worth noting though that before joining the Erasmus Programme in 2011-12, Switzerland had a parallel funding scheme in place but which only covered study exchanges. The extreme discrepancies in the numbers of inbound and outbound students in Malta and Luxembourg are linked to the very small sizes of these countries.
30
Chart 34: Inbound and outbound students on work placements in 2011-12
1.3.4. Work placement hosts
A total of 35 785 enterprises across Europe received Erasmus work placement students in 2011-12, a 16.4 % rise compared to the previous year. The enterprises varied greatly in type and size. Almost half of the students (46 %) went to small, 32 % to medium-sized and 22 % to large businesses.
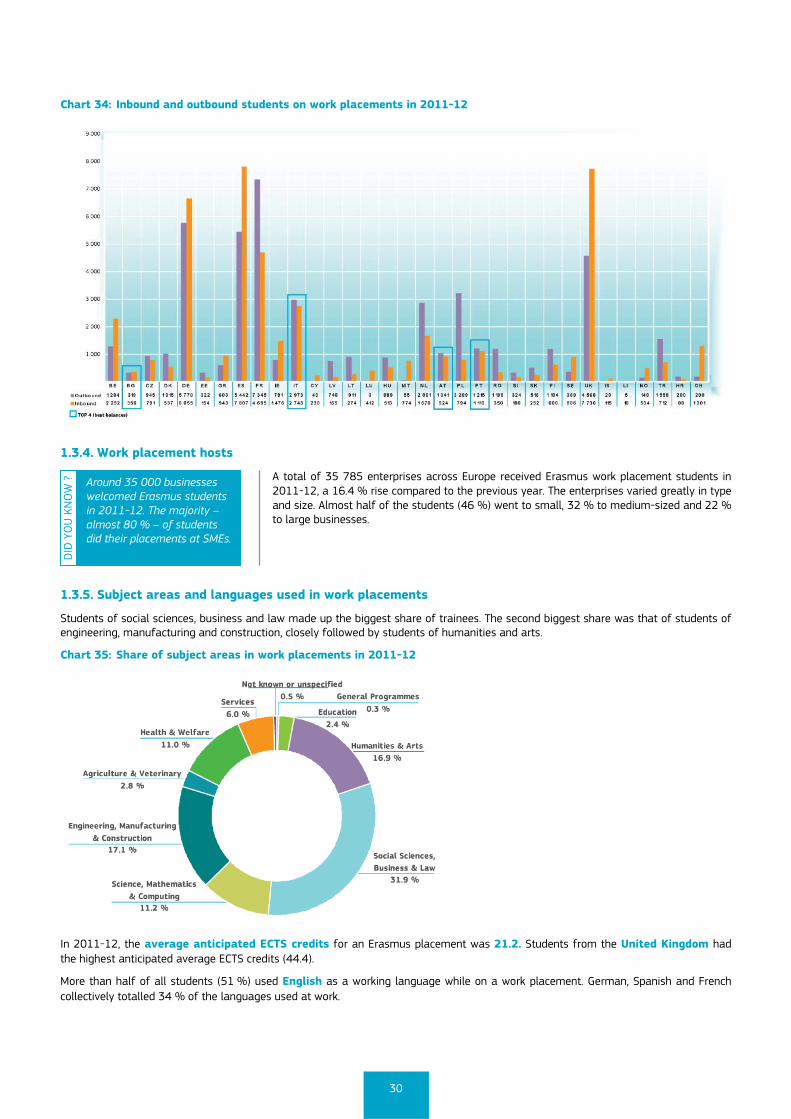
1.3.5. Subject areas and languages used in work placements
Students of social sciences, business and law made up the biggest share of trainees. The second biggest share was that of students of engineering, manufacturing and construction, closely followed by students of humanities and arts.
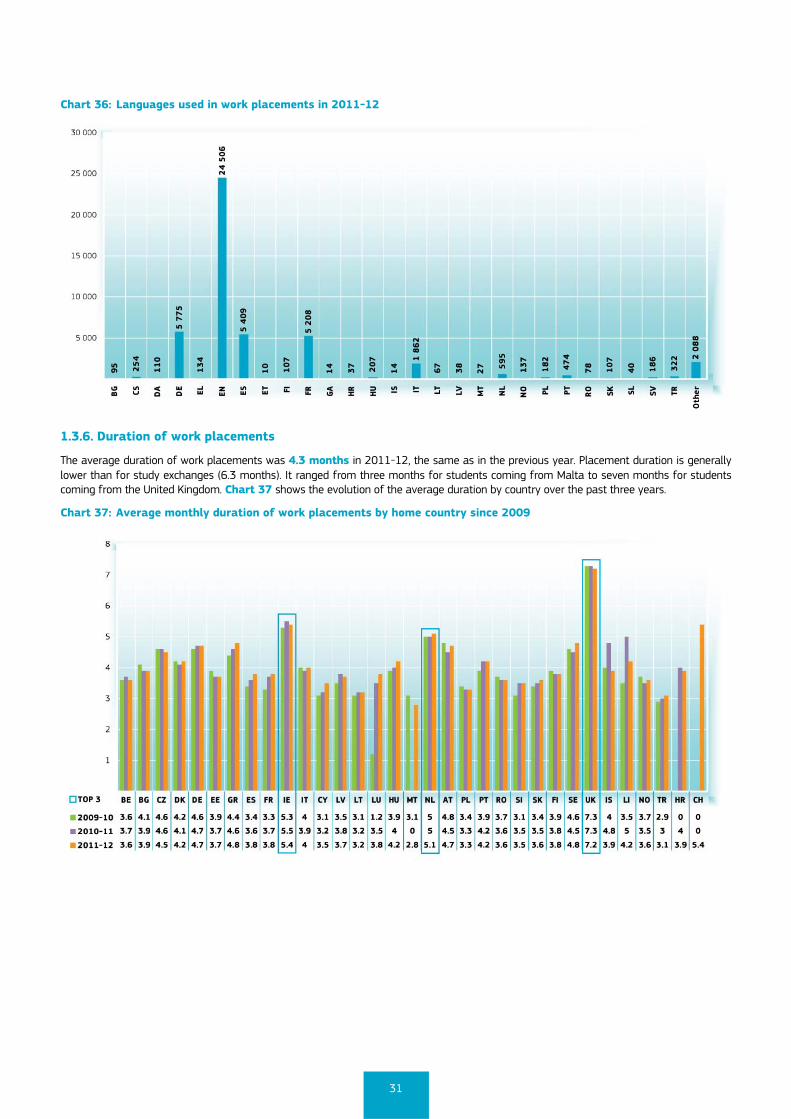
Chart 35: Share of subject areas in work placements in 2011-12
In 2011-12, the average anticipated ECTS credits for an Erasmus placement was 21.2. Students from the United Kingdom had the highest anticipated average ECTS credits (44.4).
More than half of all students (51 %) used English as a working language while on a work placement. German, Spanish and French collectively totalled 34 % of the languages used at work.
DID
YO
U K
NO
W ?
Around 35 000 businesses welcomed Erasmus students in 2011-12. The majority – almost 80 % – of students did their placements at SMEs.
31
Chart 36: Languages used in work placements in 2011-12
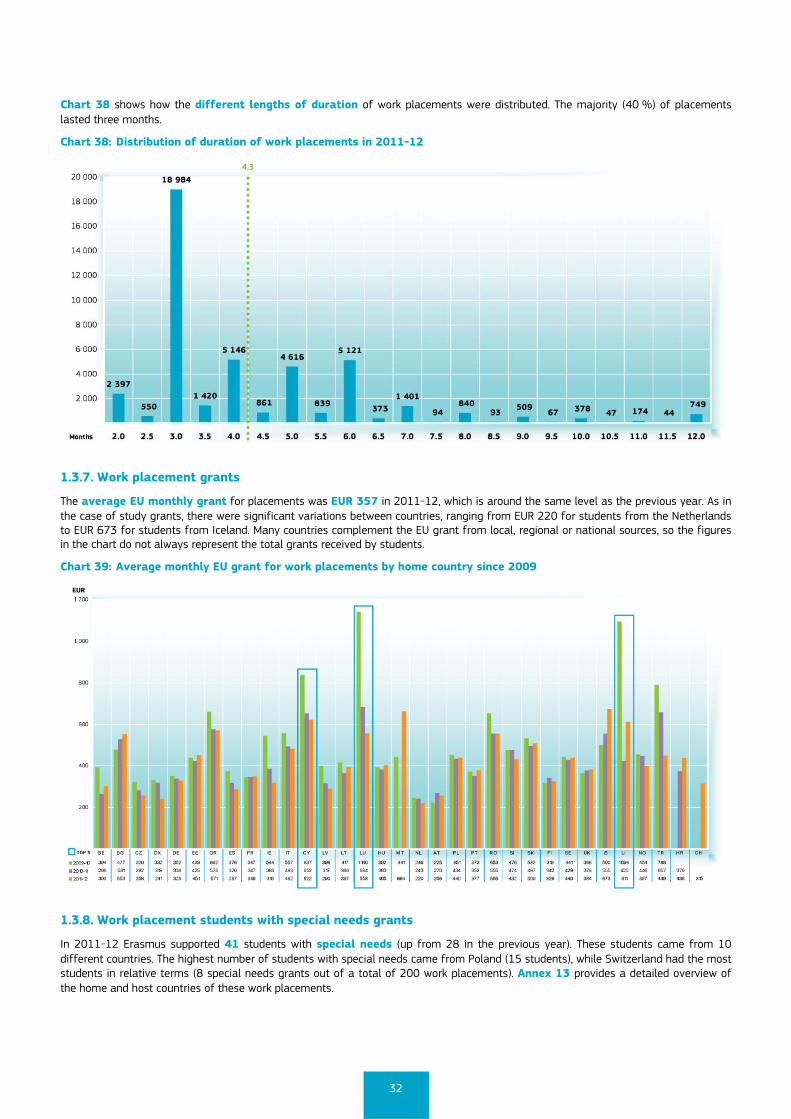
1.3.6. Duration of work placements
The average duration of work placements was 4.3 months in 2011-12, the same as in the previous year. Placement duration is generally lower than for study exchanges (6.3 months). It ranged from three months for students coming from Malta to seven months for students coming from the United Kingdom. Chart 37 shows the evolution of the average duration by country over the past three years.
Chart 37: Average monthly duration of work placements by home country since 2009
32
Chart 38 shows how the different lengths of duration of work placements were distributed. The majority (40 %) of placements lasted three months.
Chart 38: Distribution of duration of work placements in 2011-12
1.3.7. Work placement grants
The average EU monthly grant for placements was EUR 357 in 2011-12, which is around the same level as the previous year. As in the case of study grants, there were significant variations between countries, ranging from EUR 220 for students from the Netherlands to EUR 673 for students from Iceland. Many countries complement the EU grant from local, regional or national sources, so the figures in the chart do not always represent the total grants received by students.
Chart 39: Average monthly EU grant for work placements by home country since 2009
1.3.8. Work placement students with special needs grants
In 2011-12 Erasmus supported 41 students with special needs (up from 28 in the previous year). These students came from 10 different countries. The highest number of students with special needs came from Poland (15 students), while Switzerland had the most students in relative terms (8 special needs grants out of a total of 200 work placements). Annex 13 provides a detailed overview of the home and host countries of these work placements.
33
1.3.9. Zero-grant students on work placements
A total of 897 Erasmus work placement students did not receive an EU grant but undertook their placements as zero-grant Erasmus students. This represents a significant increase of over 60 % on the previous year. It should be noted that zero-grant students often receive funding from other sources.
The highest number of zero-grant students came from France with 303, followed by Austria with 262, and Lithuania with 148.
Annex 14 provides a detailed overview of the distribution of zero-grant students between the participating countries.
1.3.10. Work placement consortia
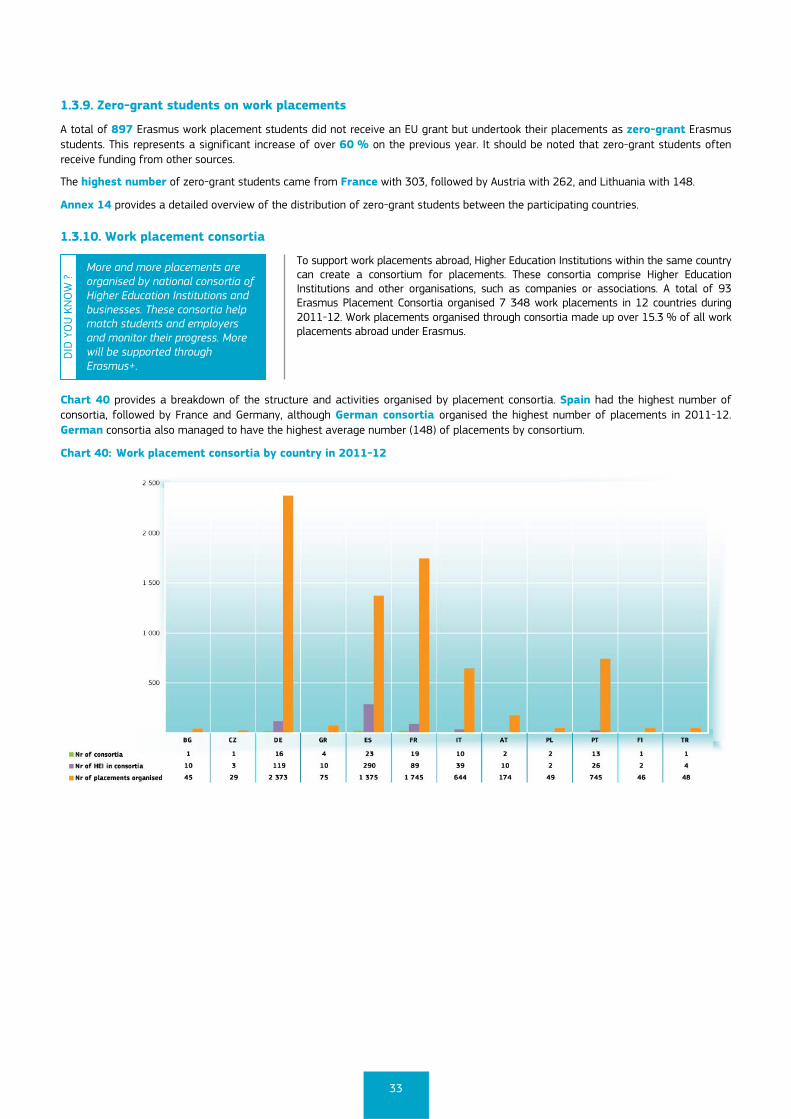
To support work placements abroad, Higher Education Institutions within the same country can create a consortium for placements. These consortia comprise Higher Education Institutions and other organisations, such as companies or associations. A total of 93 Erasmus Placement Consortia organised 7 348 work placements in 12 countries during 2011-12. Work placements organised through consortia made up over 15.3 % of all work placements abroad under Erasmus.
Chart 40 provides a breakdown of the structure and activities organised by placement consortia. Spain had the highest number of consortia, followed by France and Germany, although German consortia organised the highest number of placements in 2011-12. German consortia also managed to have the highest average number (148) of placements by consortium.
Chart 40: Work placement consortia by country in 2011-12
DID
YO
U K
NO
W ?
More and more placements are organised by national consortia of Higher Education Institutions and businesses. These consortia help match students and employers and monitor their progress. More will be supported through Erasmus+.
34
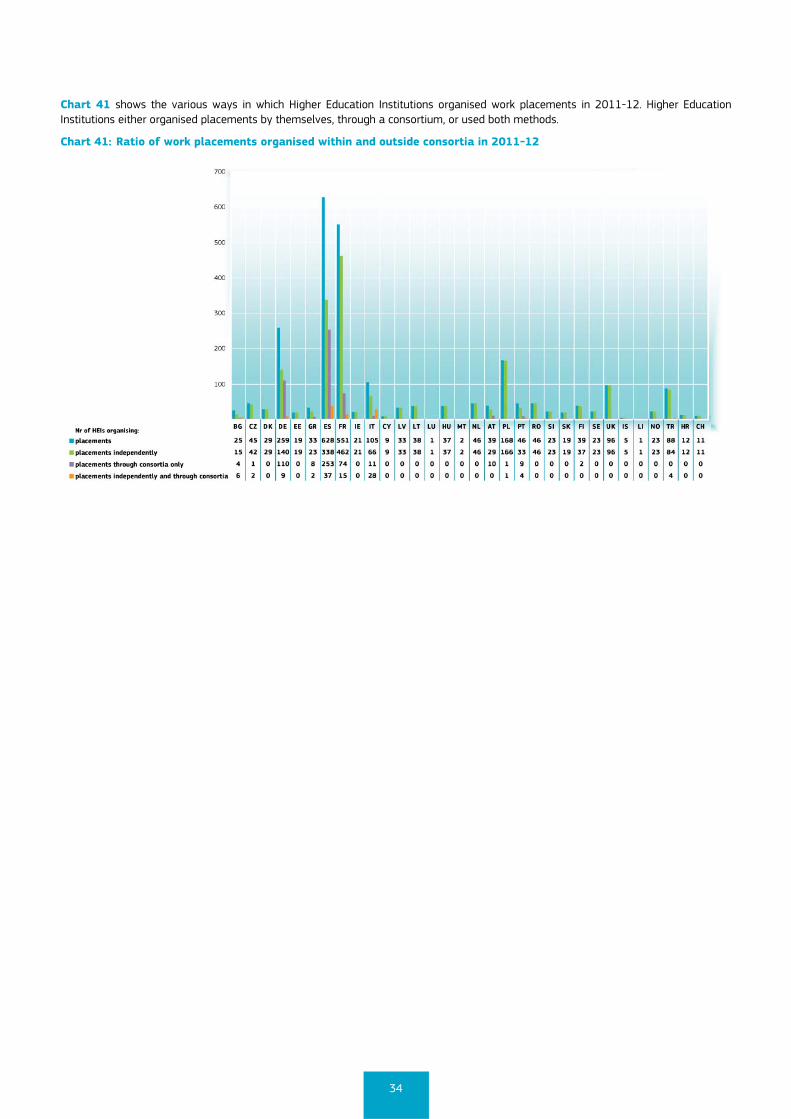
Chart 41 shows the various ways in which Higher Education Institutions organised work placements in 2011-12. Higher Education Institutions either organised placements by themselves, through a consortium, or used both methods.
Chart 41: Ratio of work placements organised within and outside consortia in 2011-12
35
2. Erasmus Staff Mobility
Table 2: Staff mobility in figures 2011-12
2.1. Introduction Erasmus also enables higher education teaching staff and people employed in companies to go abroad to teach for a duration of between one day and six weeks. Likewise, all academic or non-academic members of staff in a Higher Education Institution can receive training abroad for a period of between five days and six weeks.
Staff mobility for teaching has become a very popular action since its introduction in 1997. With the creation of the Lifelong Learning Programme in 2007, staff mobility was extended to include staff training as well as the possibility for Higher Education Institutions to invite staff from companies to come and teach at their institutions.
Since its launch, over 300 000 staff exchanges for teaching and training have been supported. Staff mobility aims to enrich the experience of participating staff, to contribute to the internationalisation and modernisation of higher education through cooperation among Higher Education Institutions and staff, and to encourage student mobility. The staff mobility budget accounts for approximately 7 % of the overall Erasmus budget.
Some 46 522 staff exchanges were supported in 2011-12, a year-on-year increase of 8.6 %. Out of these, 16 staff with special needs received additional funding to participate in Erasmus exchanges (compared to 13 the previous year).
The average duration of a staff mobility period (including teaching assignments and staff training) was 5.7 days and the average grant – in addition to the staff member’s salary − was EUR 701 per staff exchange.
Some 72 % of staff exchanges were teaching assignments, while staff training accounted for 28 %. The number of staff exchanges for training has nearly doubled since 2007-08 when it stood at only 15 %.
Chart 42 shows the growth of staff mobility since the start of the Lifelong Learning Programme.
Chart 42: Growth in staff mobility since 2007
36
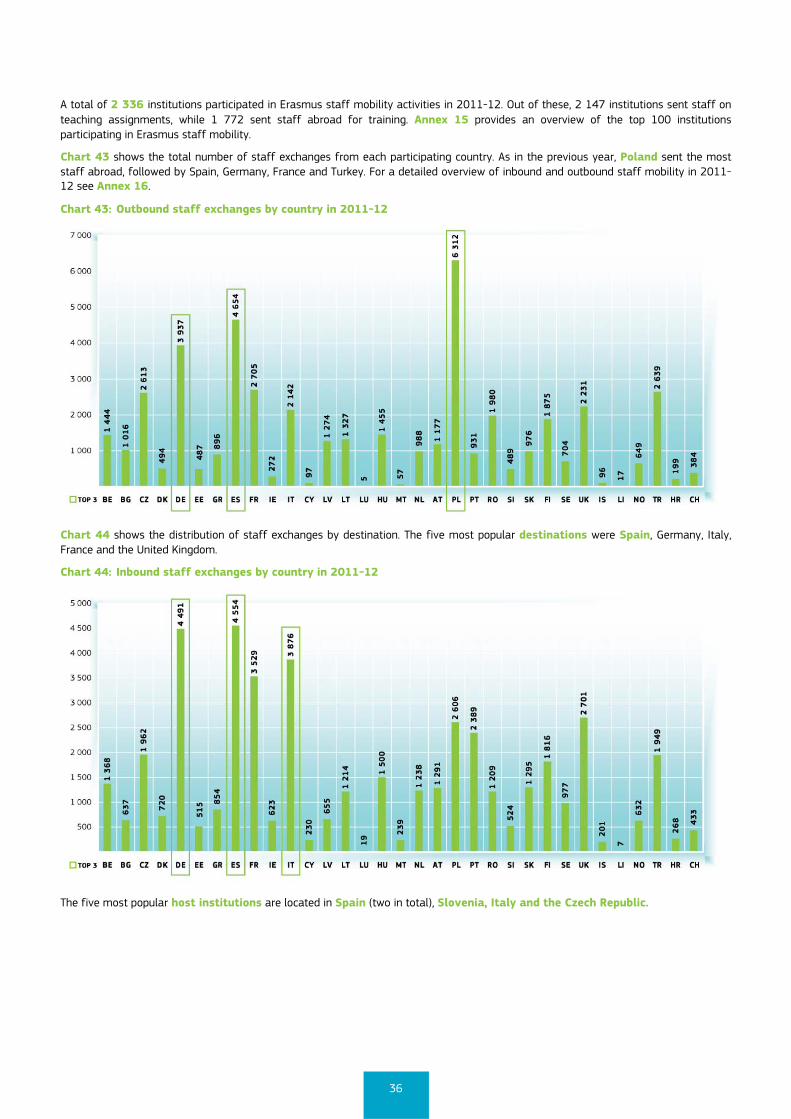
A total of 2 336 institutions participated in Erasmus staff mobility activities in 2011-12. Out of these, 2 147 institutions sent staff on teaching assignments, while 1 772 sent staff abroad for training. Annex 15 provides an overview of the top 100 institutions participating in Erasmus staff mobility.
Chart 43 shows the total number of staff exchanges from each participating country. As in the previous year, Poland sent the most staff abroad, followed by Spain, Germany, France and Turkey. For a detailed overview of inbound and outbound staff mobility in 2011-12 see Annex 16.
Chart 43: Outbound staff exchanges by country in 2011-12
Chart 44 shows the distribution of staff exchanges by destination. The five most popular destinations were Spain, Germany, Italy, France and the United Kingdom.
Chart 44: Inbound staff exchanges by country in 2011-12
The five most popular host institutions are located in Spain (two in total), Slovenia, Italy and the Czech Republic.
37
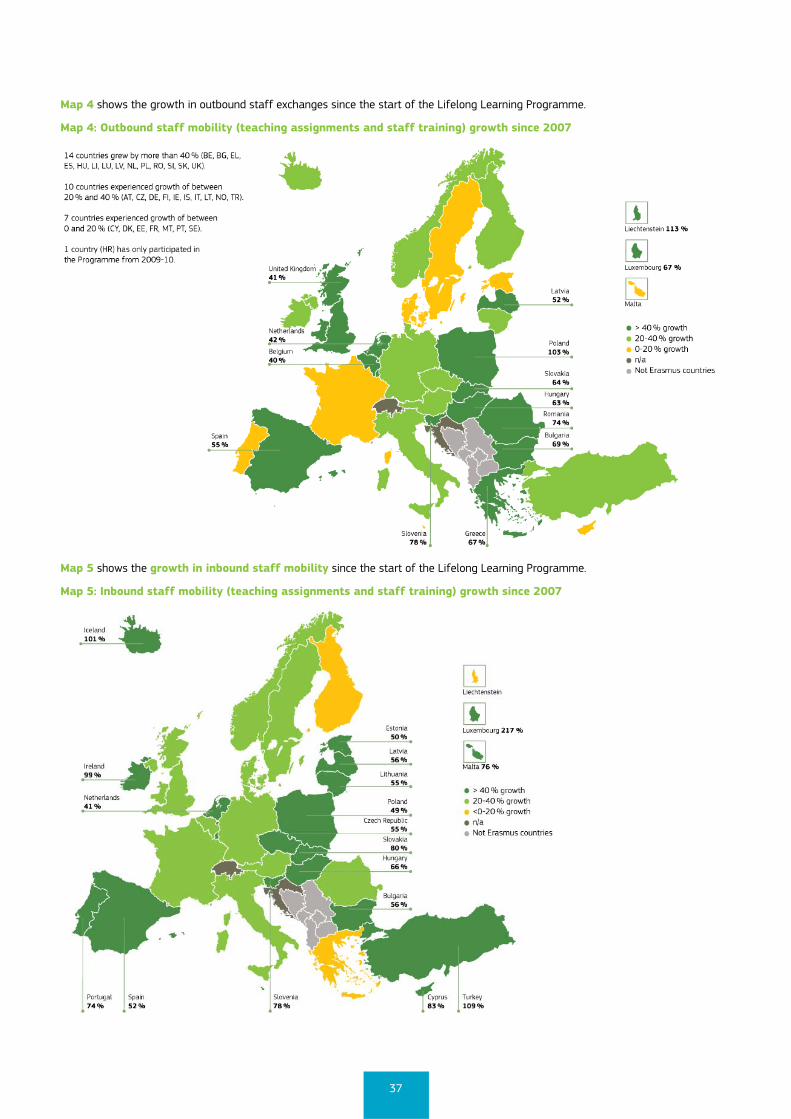
Map 4 shows the growth in outbound staff exchanges since the start of the Lifelong Learning Programme.
Map 4: Outbound staff mobility (teaching assignments and staff training) growth since 2007
Map 5 shows the growth in inbound staff mobility since the start of the Lifelong Learning Programme.
Map 5: Inbound staff mobility (teaching assignments and staff training) growth since 2007
38
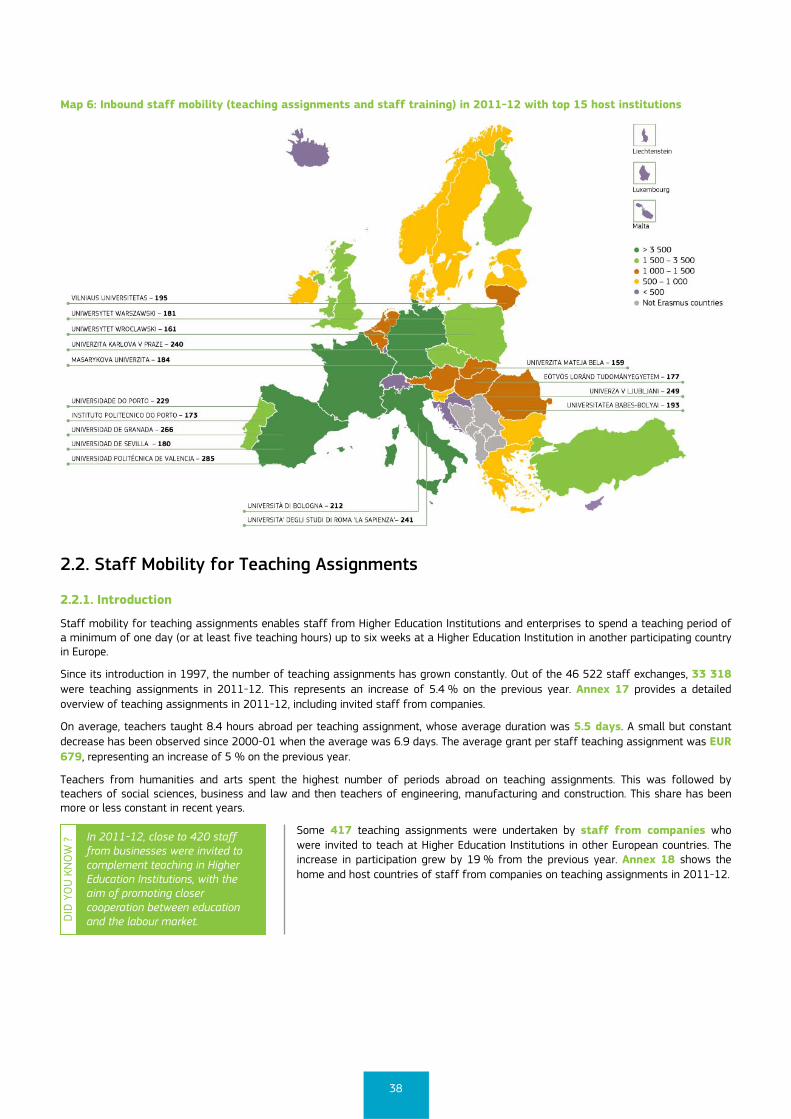
Map 6: Inbound staff mobility (teaching assignments and staff training) in 2011-12 with top 15 host institutions
2.2. Staff Mobility for Teaching Assignments
2.2.1. Introduction
Staff mobility for teaching assignments enables staff from Higher Education Institutions and enterprises to spend a teaching period of a minimum of one day (or at least five teaching hours) up to six weeks at a Higher Education Institution in another participating country in Europe.
Since its introduction in 1997, the number of teaching assignments has grown constantly. Out of the 46 522 staff exchanges, 33 318 were teaching assignments in 2011-12. This represents an increase of 5.4 % on the previous year. Annex 17 provides a detailed overview of teaching assignments in 2011-12, including invited staff from companies.
On average, teachers taught 8.4 hours abroad per teaching assignment, whose average duration was 5.5 days. A small but constant decrease has been observed since 2000-01 when the average was 6.9 days. The average grant per staff teaching assignment was EUR 679, representing an increase of 5 % on the previous year.
Teachers from humanities and arts spent the highest number of periods abroad on teaching assignments. This was followed by teachers of social sciences, business and law and then teachers of engineering, manufacturing and construction. This share has been more or less constant in recent years.
Some 417 teaching assignments were undertaken by staff from companies who were invited to teach at Higher Education Institutions in other European countries. The increase in participation grew by 19 % from the previous year. Annex 18 shows the home and host countries of staff from companies on teaching assignments in 2011-12.
DID
YO
U K
NO
W ?
In 2011-12, close to 420 staff from businesses were invited to complement teaching in Higher Education Institutions, with the aim of promoting closer cooperation between education and the labour market.
39
Chart 45 shows the number of teaching assignments at European level since 2000.
Chart 45: Teaching assignments since 2000
2.2.2. Outbound staff on teaching assignments
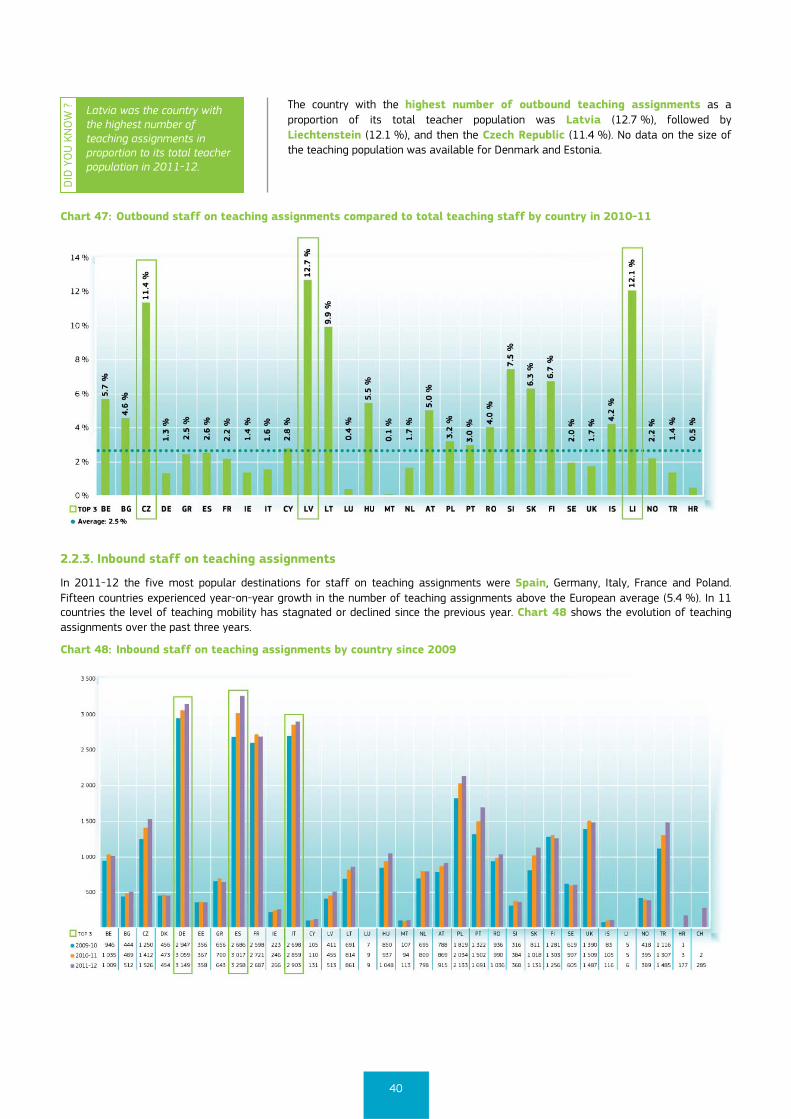
The 5 most active countries in sending teachers abroad on teaching assignments were Poland, Spain, Germany, France and the Czech Republic.
Chart 46 shows the evolution in the number of teaching assignments by country over the past three years. The number of teaching assignments increased by more than 15 % compared to the previous year in five countries: Croatia, Estonia, Liechtenstein, Poland and Turkey. In Malta the number of teaching assignments in 2011-12 corresponds to the 2009-10 level, following the country’s interruption in participation in Erasmus in 2010-11.
Five countries experienced a decrease of more than 5 % in 2011-12 compared to the previous year: Cyprus, Iceland, Lithuania, Luxembourg and Portugal.
Chart 46: Outbound staff on teaching assignments by country since 2009
Chart 47 compares the number of teaching assignments to the total number of teaching staff in each participating country. Eurostat, the European Commission’s service which provides statistical information on the European Union, publishes each year data on the number of teachers in tertiary education. According to the latest available Eurostat data, in 2011 (2010-11) the total number of teachers in the 32 countries participating at that time was around 1.227 million. Chart 47 compares the 2010-11 Erasmus teaching assignment data with the 2011 Eurostat teacher population data 4 in the 32 participating countries. On average there were 25 teaching mobility periods for every 1 000 higher education teachers in 2010-11. It should be noted that there is no restriction on the number of teaching assignments a teacher can undertake.
....................................................................................................
4 Eurostat 2011 data (educ_pers1t). Data for Greece are from 2007, data for Luxembourg from 2010. No data are available for Denmark and Estonia.
DID
YO
U K
NO
W ?
The five most active countries in sending teachers abroad on teaching assignments in 2011-12 were Poland, Spain, Germany, France and the Czech Republic.
40
DID
YO
U K
NO
W ?
Latvia was the country with the highest number of teaching assignments in proportion to its total teacher population in 2011-12.
The country with the highest number of outbound teaching assignments as a proportion of its total teacher population was Latvia (12.7 %), followed by Liechtenstein (12.1 %), and then the Czech Republic (11.4 %). No data on the size of the teaching population was available for Denmark and Estonia.
Chart 47: Outbound staff on teaching assignments compared to total teaching staff by country in 2010-11
2.2.3. Inbound staff on teaching assignments
In 2011-12 the five most popular destinations for staff on teaching assignments were Spain, Germany, Italy, France and Poland. Fifteen countries experienced year-on-year growth in the number of teaching assignments above the European average (5.4 %). In 11 countries the level of teaching mobility has stagnated or declined since the previous year. Chart 48 shows the evolution of teaching assignments over the past three years.
Chart 48: Inbound staff on teaching assignments by country since 2009
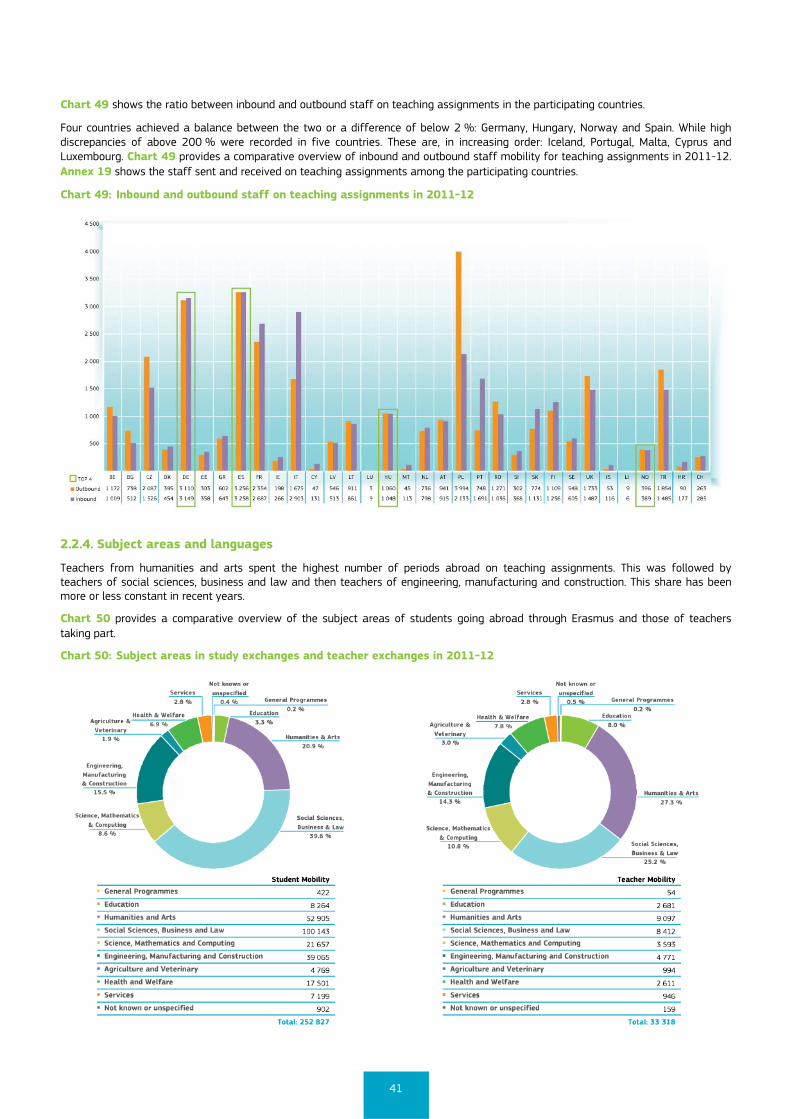
41
Chart 49 shows the ratio between inbound and outbound staff on teaching assignments in the participating countries.
Four countries achieved a balance between the two or a difference of below 2 %: Germany, Hungary, Norway and Spain. While high discrepancies of above 200 % were recorded in five countries. These are, in increasing order: Iceland, Portugal, Malta, Cyprus and Luxembourg. Chart 49 provides a comparative overview of inbound and outbound staff mobility for teaching assignments in 2011-12. Annex 19 shows the staff sent and received on teaching assignments among the participating countries.
Chart 49: Inbound and outbound staff on teaching assignments in 2011-12
2.2.4. Subject areas and languages
Teachers from humanities and arts spent the highest number of periods abroad on teaching assignments. This was followed by teachers of social sciences, business and law and then teachers of engineering, manufacturing and construction. This share has been more or less constant in recent years.
Chart 50 provides a comparative overview of the subject areas of students going abroad through Erasmus and those of teachers taking part.
Chart 50: Subject areas in study exchanges and teacher exchanges in 2011-12
42
Teachers taught most often in English, followed by French, German, Spanish and Italian.
Chart 51: Languages used in teaching assignments in 2011-12
2.2.5. Duration of teaching assignments
In 2011-12 the average duration of staff teaching assignments was 5.5 days. Average duration has remained constant during the past four years. However, a small decrease can be observed since 2000, when the average was 6.9 days.
On average, teachers taught 8.4 hours per teaching assignment abroad in 2011-12.
Chart 52 shows the distribution of the length of stay of Erasmus staff mobility for teaching. The most common (37 %) length of a teaching assignment was five days.
Chart 52: Distribution of duration of teaching assignments in 2011-12
2.2.6. Grants for teaching assignments
In 2011-12, the average EU grant for a teaching assignment was EUR 679 (up from EUR 645 in the previous year), which corresponds to an average of EUR 123 per day. Twelve teachers received a supplementary grant for their special needs, whereas 470 teachers went abroad to teach without EU funding (zero-grant).
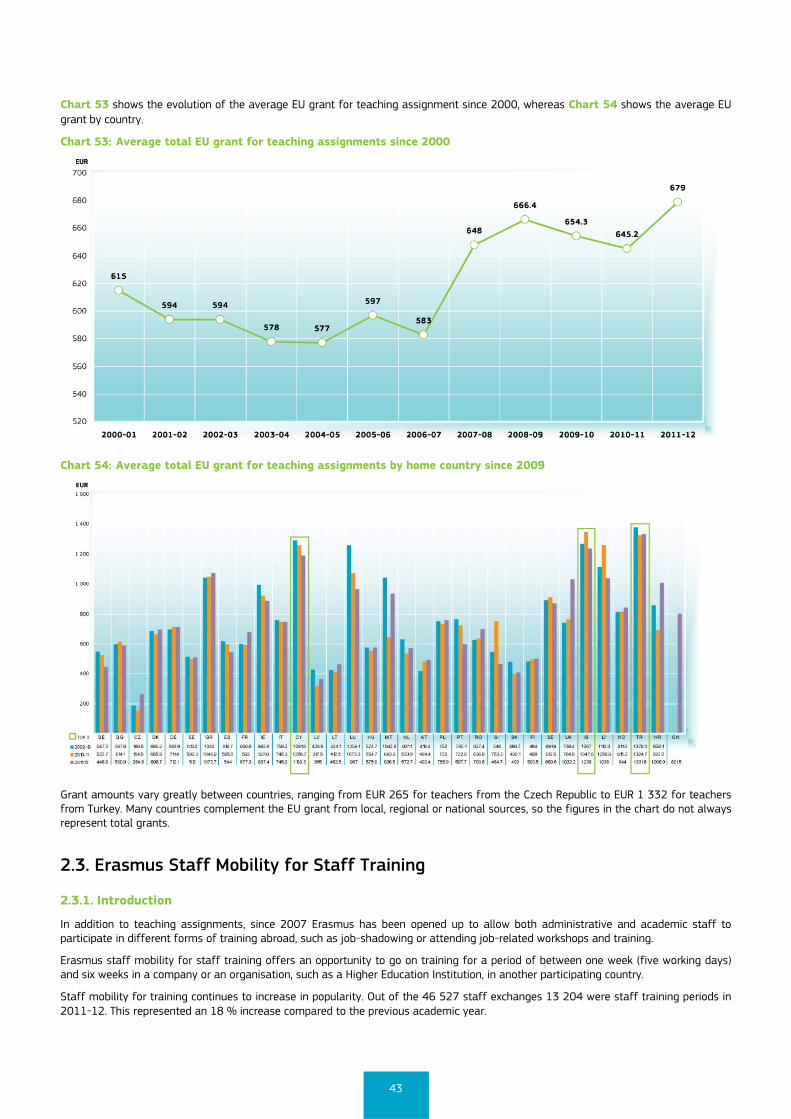
43
Chart 53 shows the evolution of the average EU grant for teaching assignment since 2000, whereas Chart 54 shows the average EU grant by country.
Chart 53: Average total EU grant for teaching assignments since 2000
Chart 54: Average total EU grant for teaching assignments by home country since 2009
Grant amounts vary greatly between countries, ranging from EUR 265 for teachers from the Czech Republic to EUR 1 332 for teachers from Turkey. Many countries complement the EU grant from local, regional or national sources, so the figures in the chart do not always represent total grants.
2.3. Erasmus Staff Mobility for Staff Training
2.3.1. Introduction
In addition to teaching assignments, since 2007 Erasmus has been opened up to allow both administrative and academic staff to participate in different forms of training abroad, such as job-shadowing or attending job-related workshops and training.
Erasmus staff mobility for staff training offers an opportunity to go on training for a period of between one week (five working days) and six weeks in a company or an organisation, such as a Higher Education Institution, in another participating country.
Staff mobility for training continues to increase in popularity. Out of the 46 527 staff exchanges 13 204 were staff training periods in 2011-12. This represented an 18 % increase compared to the previous academic year.
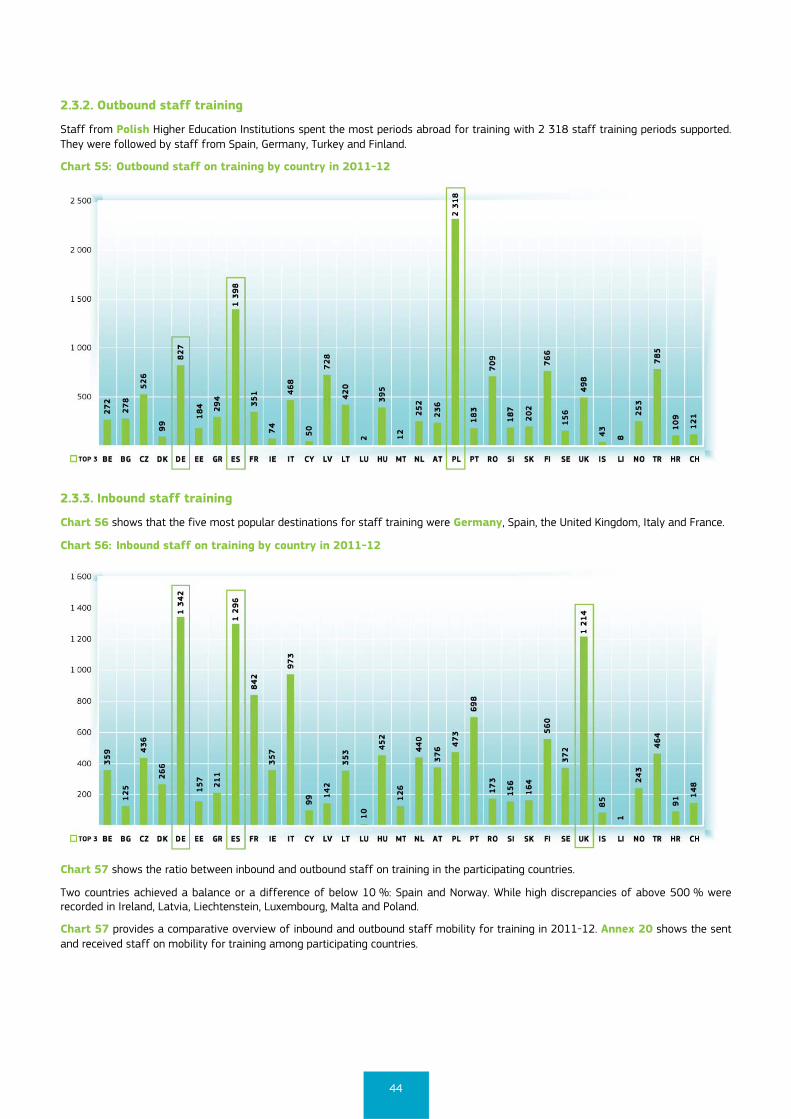
44
2.3.2. Outbound staff training
Staff from Polish Higher Education Institutions spent the most periods abroad for training with 2 318 staff training periods supported. They were followed by staff from Spain, Germany, Turkey and Finland.
Chart 55: Outbound staff on training by country in 2011-12
2.3.3. Inbound staff training
Chart 56 shows that the five most popular destinations for staff training were Germany, Spain, the United Kingdom, Italy and France.
Chart 56: Inbound staff on training by country in 2011-12
Chart 57 shows the ratio between inbound and outbound staff on training in the participating countries.
Two countries achieved a balance or a difference of below 10 %: Spain and Norway. While high discrepancies of above 500 % were recorded in Ireland, Latvia, Liechtenstein, Luxembourg, Malta and Poland.
Chart 57 provides a comparative overview of inbound and outbound staff mobility for training in 2011-12. Annex 20 shows the sent and received staff on mobility for training among participating countries.
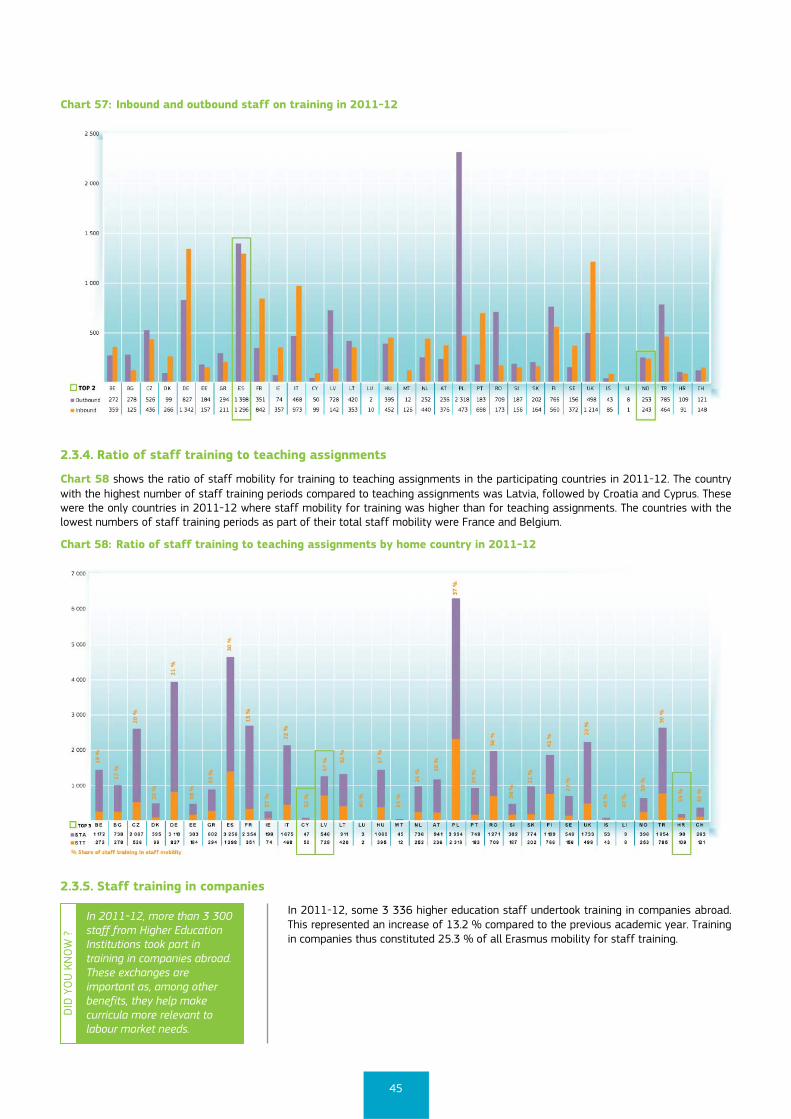
45
DID
YO
U K
NO
W ?
In 2011-12, more than 3 300 staff from Higher Education Institutions took part in training in companies abroad. These exchanges are important as, among other benefits, they help make curricula more relevant to labour market needs.
Chart 57: Inbound and outbound staff on training in 2011-12
2.3.4. Ratio of staff training to teaching assignments
Chart 58 shows the ratio of staff mobility for training to teaching assignments in the participating countries in 2011-12. The country with the highest number of staff training periods compared to teaching assignments was Latvia, followed by Croatia and Cyprus. These were the only countries in 2011-12 where staff mobility for training was higher than for teaching assignments. The countries with the lowest numbers of staff training periods as part of their total staff mobility were France and Belgium.
Chart 58: Ratio of staff training to teaching assignments by home country in 2011-12
2.3.5. Staff training in companies
In 2011-12, some 3 336 higher education staff undertook training in companies abroad. This represented an increase of 13.2 % compared to the previous academic year. Training in companies thus constituted 25.3 % of all Erasmus mobility for staff training.
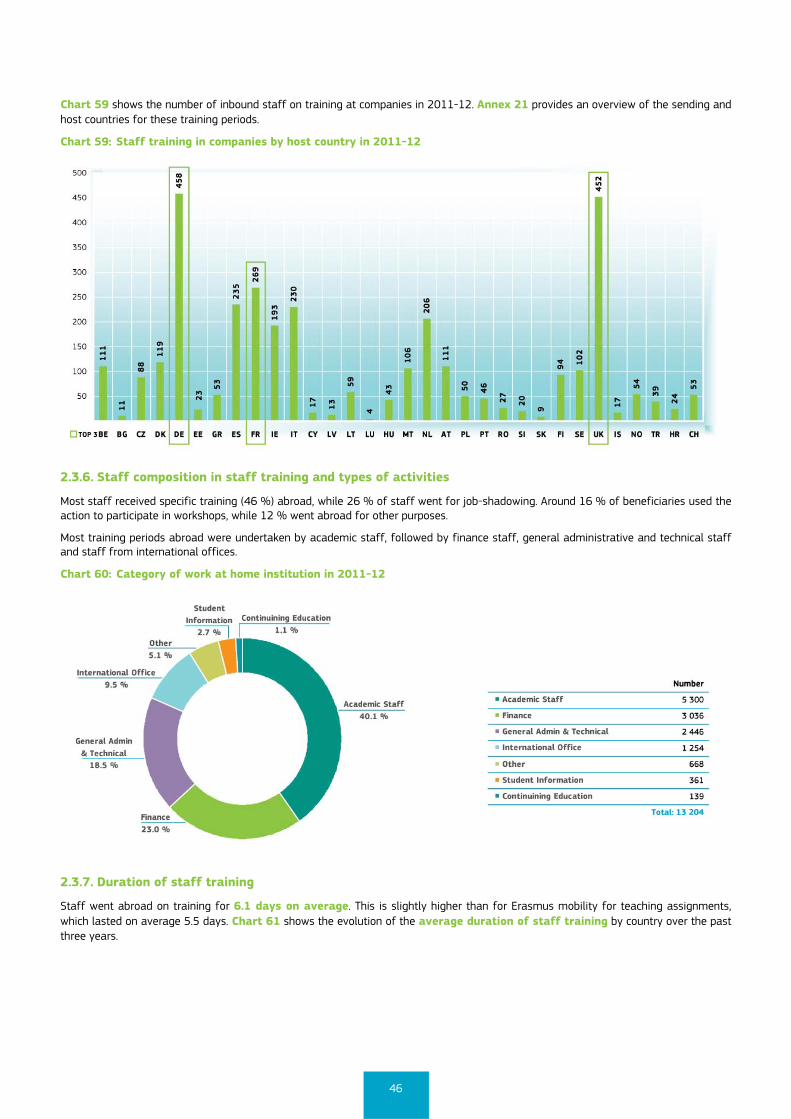
46
Chart 59 shows the number of inbound staff on training at companies in 2011-12. Annex 21 provides an overview of the sending and host countries for these training periods.
Chart 59: Staff training in companies by host country in 2011-12
2.3.6. Staff composition in staff training and types of activities
Most staff received specific training (46 %) abroad, while 26 % of staff went for job-shadowing. Around 16 % of beneficiaries used the action to participate in workshops, while 12 % went abroad for other purposes.
Most training periods abroad were undertaken by academic staff, followed by finance staff, general administrative and technical staff and staff from international offices.
Chart 60: Category of work at home institution in 2011-12
2.3.7. Duration of staff training
Staff went abroad on training for 6.1 days on average. This is slightly higher than for Erasmus mobility for teaching assignments, which lasted on average 5.5 days. Chart 61 shows the evolution of the average duration of staff training by country over the past three years.
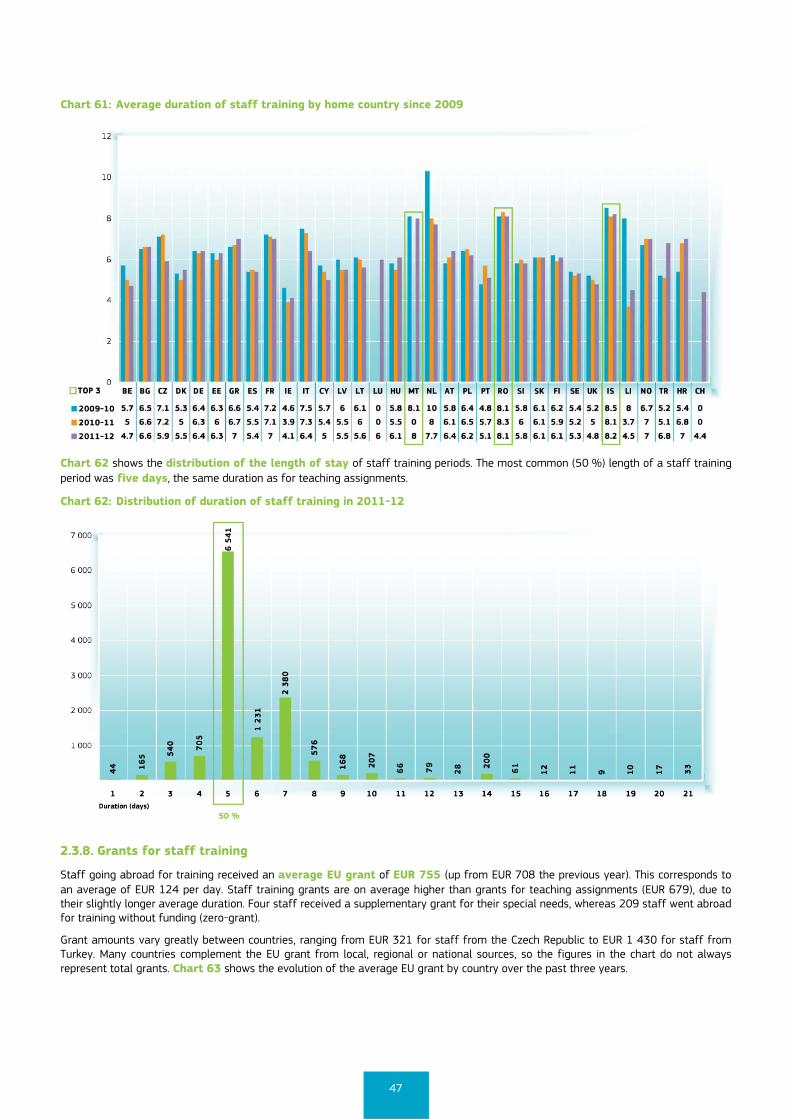
47
Chart 61: Average duration of staff training by home country since 2009
Chart 62 shows the distribution of the length of stay of staff training periods. The most common (50 %) length of a staff training period was five days, the same duration as for teaching assignments.
Chart 62: Distribution of duration of staff training in 2011-12
2.3.8. Grants for staff training
Staff going abroad for training received an average EU grant of EUR 755 (up from EUR 708 the previous year). This corresponds to an average of EUR 124 per day. Staff training grants are on average higher than grants for teaching assignments (EUR 679), due to their slightly longer average duration. Four staff received a supplementary grant for their special needs, whereas 209 staff went abroad for training without funding (zero-grant).
Grant amounts vary greatly between countries, ranging from EUR 321 for staff from the Czech Republic to EUR 1 430 for staff from Turkey. Many countries complement the EU grant from local, regional or national sources, so the figures in the chart do not always represent total grants. Chart 63 shows the evolution of the average EU grant by country over the past three years.
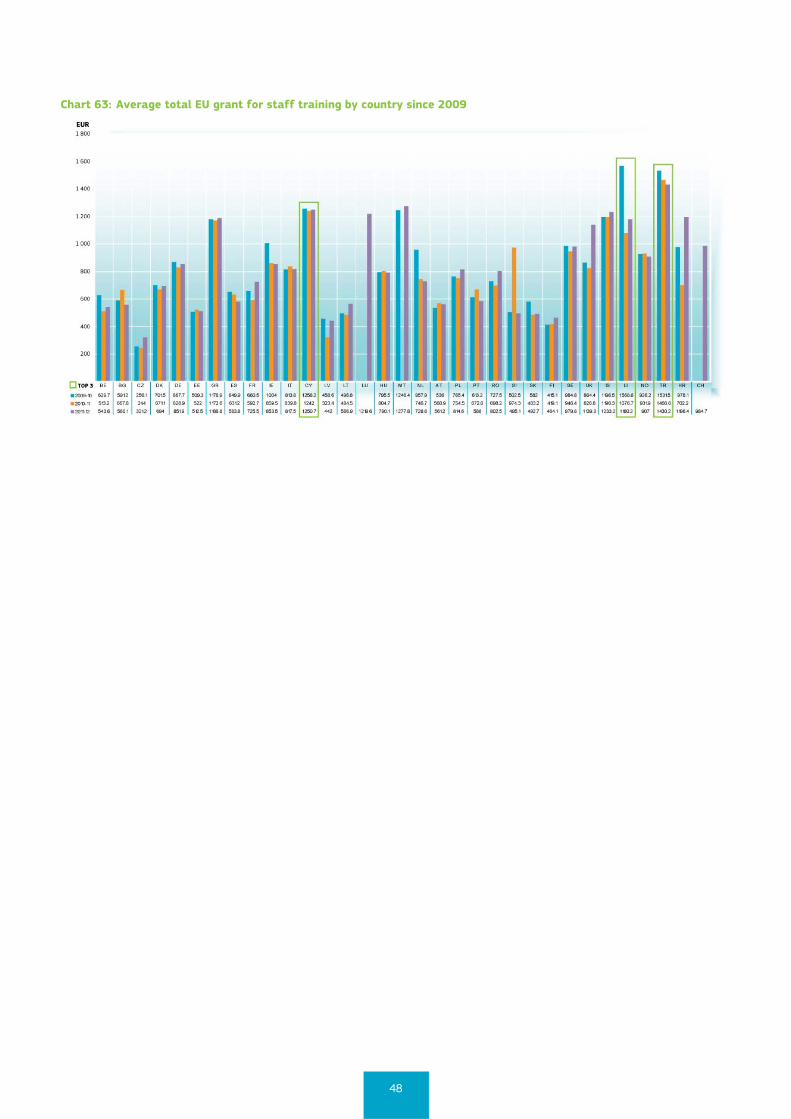
48
Chart 63: Average total EU grant for staff training by country since 2009
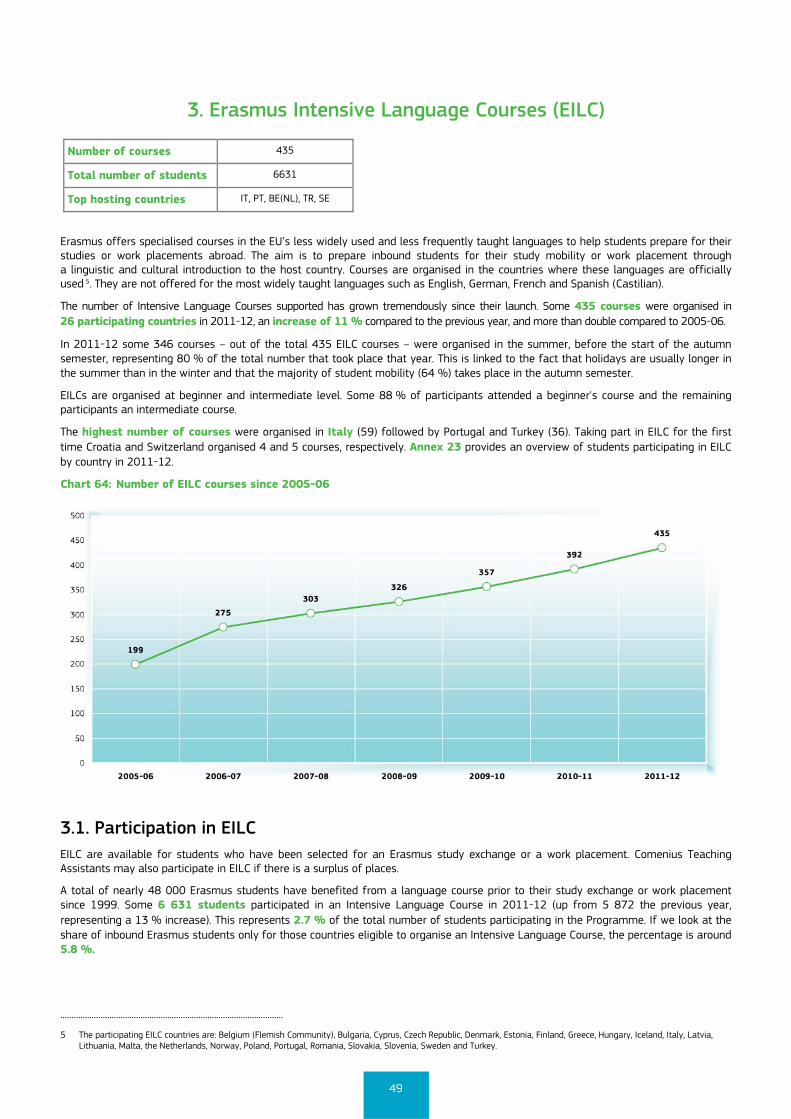
49
3. Erasmus Intensive Language Courses (EILC)
Number of courses 435
Total number of students 6631
Top hosting countries IT, PT, BE(NL), TR, SE
Erasmus offers specialised courses in the EU’s less widely used and less frequently taught languages to help students prepare for their studies or work placements abroad. The aim is to prepare inbound students for their study mobility or work placement through a linguistic and cultural introduction to the host country. Courses are organised in the countries where these languages are officially used 5. They are not offered for the most widely taught languages such as English, German, French and Spanish (Castilian).
The number of Intensive Language Courses supported has grown tremendously since their launch. Some 435 courses were organised in 26 participating countries in 2011-12, an increase of 11 % compared to the previous year, and more than double compared to 2005-06.
In 2011-12 some 346 courses – out of the total 435 EILC courses – were organised in the summer, before the start of the autumn semester, representing 80 % of the total number that took place that year. This is linked to the fact that holidays are usually longer in the summer than in the winter and that the majority of student mobility (64 %) takes place in the autumn semester.
EILCs are organised at beginner and intermediate level. Some 88 % of participants attended a beginner's course and the remaining participants an intermediate course.
The highest number of courses were organised in Italy (59) followed by Portugal and Turkey (36). Taking part in EILC for the first time Croatia and Switzerland organised 4 and 5 courses, respectively. Annex 23 provides an overview of students participating in EILC by country in 2011-12.
Chart 64: Number of EILC courses since 2005-06
3.1. Participation in EILC EILC are available for students who have been selected for an Erasmus study exchange or a work placement. Comenius Teaching Assistants may also participate in EILC if there is a surplus of places.
A total of nearly 48 000 Erasmus students have benefited from a language course prior to their study exchange or work placement since 1999. Some 6 631 students participated in an Intensive Language Course in 2011-12 (up from 5 872 the previous year, representing a 13 % increase). This represents 2.7 % of the total number of students participating in the Programme. If we look at the share of inbound Erasmus students only for those countries eligible to organise an Intensive Language Course, the percentage is around 5.8 %.
....................................................................................................
5 The participating EILC countries are: Belgium (Flemish Community), Bulgaria, Cyprus, Czech Republic, Denmark, Estonia, Finland, Greece, Hungary, Iceland, Italy, Latvia, Lithuania, Malta, the Netherlands, Norway, Poland, Portugal, Romania, Slovakia, Slovenia, Sweden and Turkey.
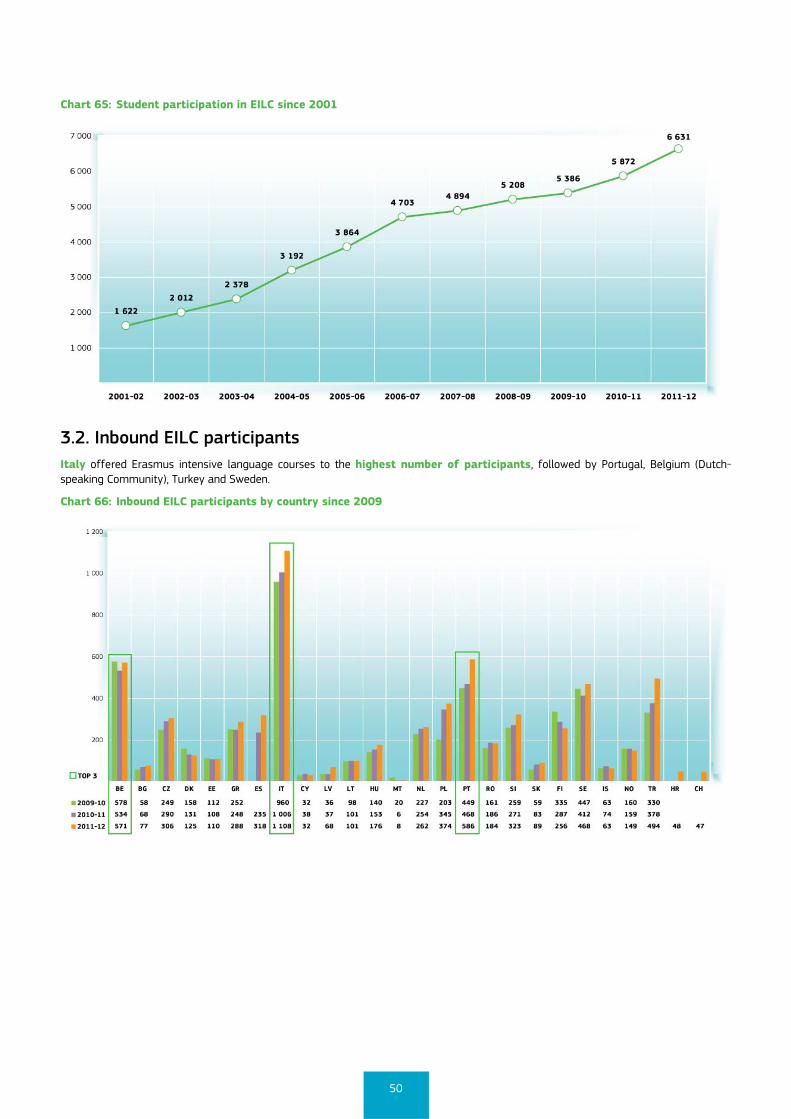
50
Chart 65: Student participation in EILC since 2001
3.2. Inbound EILC participants Italy offered Erasmus intensive language courses to the highest number of participants, followed by Portugal, Belgium (Dutch-speaking Community), Turkey and Sweden.
Chart 66: Inbound EILC participants by country since 2009

51
The highest proportion of inbound students participating in a language course remained in Slovenia, where 19.1 % of inbound students took part, followed by Croatia (12.7 %). Iceland, Romania, Greece and Estonia had participation rates between 10-11 %.
Chart 67: EILC students as a percentage of inbound students in 2011-12
3.3. Outbound EILC participants In absolute terms, Germany sent by far the most participants − 1 333 − on an EILC course in 2011-12. This represents about 4 % of all mobile German Erasmus students this year. The second highest number of students came from Spain (805 students, representing a 2 % share) and then Poland (593 students, representing a 3.9 % share).
Estonia sent the highest proportion (11.5 %) of its students on EILC. It was followed by Cyprus (7.8 %) and the Czech Republic (7 %).
Chart 68: Outbound EILC students by country since 2009
3.4. Recognition of participation Since 2004, the European Commission has recommended that the performance of each student participating in an EILC is assessed, and a certificate and ECTS credits awarded for participation. Whether the home institution recognises credits earned through participation in an EILC depends, however, on what is stated in the student's Learning Agreement.
Since the use of ECTS is not required but only recommended, the situation varies across countries and institutions within the same country. The majority of the EILC organising institutions award ECTS credits. Students can earn from two up to nine ECTS credits depending on the workload and the number of contact hours.
52
4. Erasmus Intensive Programmes (IPs)
Number of Intensive Programmes courses 462
Total number of participating students 15 855
Total number of participating teachers 5 663
Top five organising countries IT, DE, FR, NL, PL
Average duration of Intensive Programmes 12 days
Erasmus also funds Intensive Programmes, which are short subject-related programmes of study (of between 10 days and 6 weeks in length), bringing together students and teaching staff from Higher Education Institutions from at least three European countries. These short study programmes encourage the multinational learning of specialist topics; provide students with access to academic knowledge that is not available in one Higher Education Institution alone; allow teachers to exchange views on course content and new curricula approaches; and test teaching methods in an international classroom environment.
4.1. Number of IPs Since 2007-08 Erasmus Intensive Programmes have been managed individually by the participating countries. They have experienced strong growth during this time. A total of 462 Intensive Programmes were organised in 31 countries during the academic year 2011-12, which represents a 14 % increase on the previous year.
Chart 69: Number of IPs since 2000
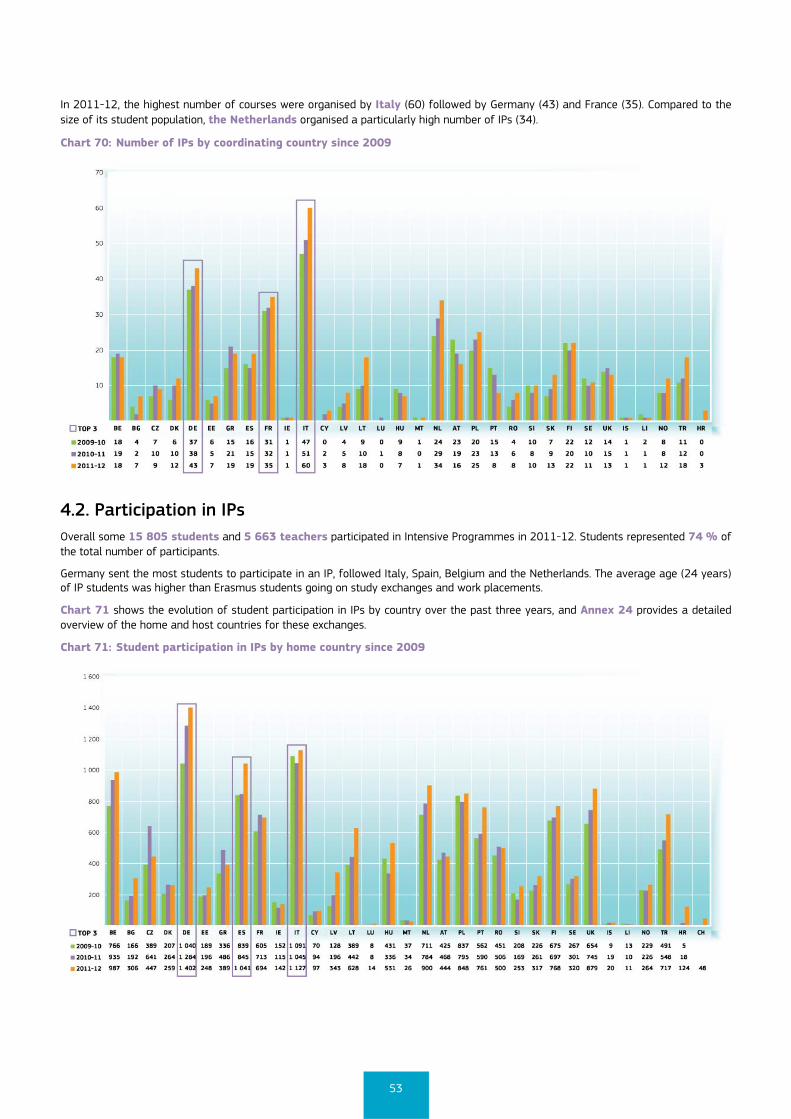
53
In 2011-12, the highest number of courses were organised by Italy (60) followed by Germany (43) and France (35). Compared to the size of its student population, the Netherlands organised a particularly high number of IPs (34).
Chart 70: Number of IPs by coordinating country since 2009
4.2. Participation in IPs Overall some 15 805 students and 5 663 teachers participated in Intensive Programmes in 2011-12. Students represented 74 % of the total number of participants.
Germany sent the most students to participate in an IP, followed Italy, Spain, Belgium and the Netherlands. The average age (24 years) of IP students was higher than Erasmus students going on study exchanges and work placements.
Chart 71 shows the evolution of student participation in IPs by country over the past three years, and Annex 24 provides a detailed overview of the home and host countries for these exchanges.
Chart 71: Student participation in IPs by home country since 2009
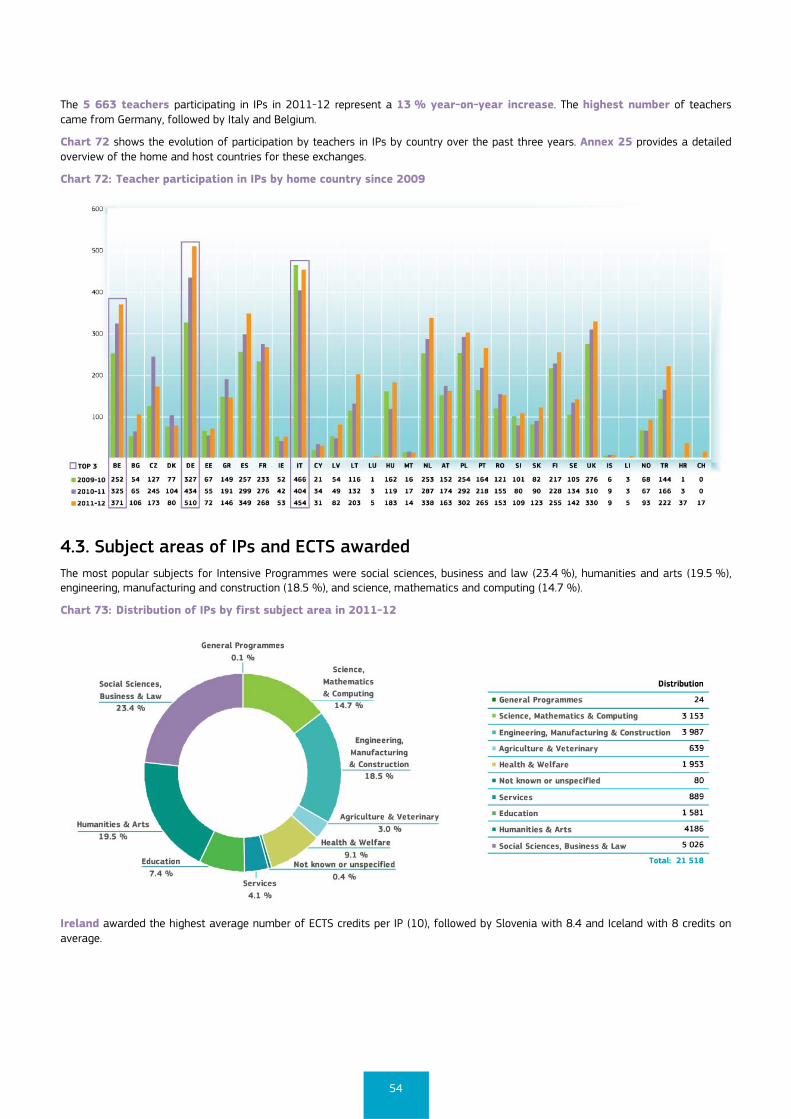
54
The 5 663 teachers participating in IPs in 2011-12 represent a 13 % year-on-year increase. The highest number of teachers came from Germany, followed by Italy and Belgium.
Chart 72 shows the evolution of participation by teachers in IPs by country over the past three years. Annex 25 provides a detailed overview of the home and host countries for these exchanges.
Chart 72: Teacher participation in IPs by home country since 2009
4.3. Subject areas of IPs and ECTS awarded The most popular subjects for Intensive Programmes were social sciences, business and law (23.4 %), humanities and arts (19.5 %), engineering, manufacturing and construction (18.5 %), and science, mathematics and computing (14.7 %).
Chart 73: Distribution of IPs by first subject area in 2011-12
Ireland awarded the highest average number of ECTS credits per IP (10), followed by Slovenia with 8.4 and Iceland with 8 credits on average.
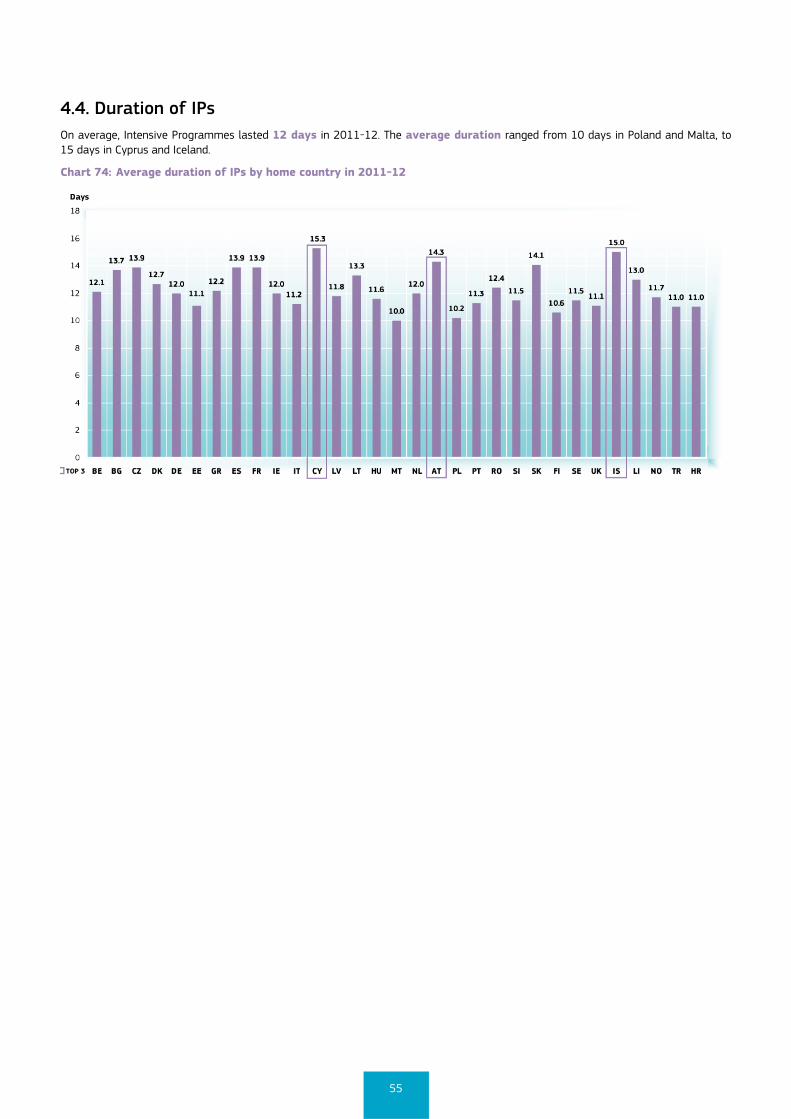
55
4.4. Duration of IPs On average, Intensive Programmes lasted 12 days in 2011-12. The average duration ranged from 10 days in Poland and Malta, to 15 days in Cyprus and Iceland.
Chart 74: Average duration of IPs by home country in 2011-12
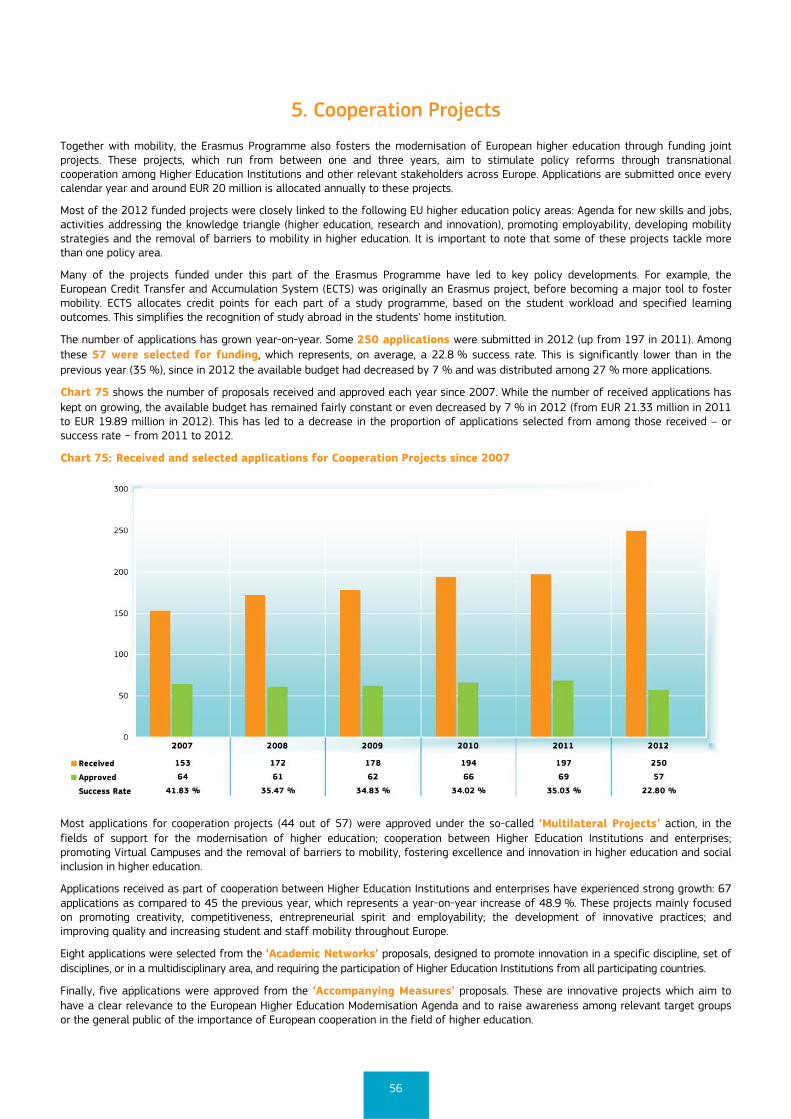
56
5. Cooperation Projects
Together with mobility, the Erasmus Programme also fosters the modernisation of European higher education through funding joint projects. These projects, which run from between one and three years, aim to stimulate policy reforms through transnational cooperation among Higher Education Institutions and other relevant stakeholders across Europe. Applications are submitted once every calendar year and around EUR 20 million is allocated annually to these projects.
Most of the 2012 funded projects were closely linked to the following EU higher education policy areas: Agenda for new skills and jobs, activities addressing the knowledge triangle (higher education, research and innovation), promoting employability, developing mobility strategies and the removal of barriers to mobility in higher education. It is important to note that some of these projects tackle more than one policy area.
Many of the projects funded under this part of the Erasmus Programme have led to key policy developments. For example, the European Credit Transfer and Accumulation System (ECTS) was originally an Erasmus project, before becoming a major tool to foster mobility. ECTS allocates credit points for each part of a study programme, based on the student workload and specified learning outcomes. This simplifies the recognition of study abroad in the students' home institution.
The number of applications has grown year-on-year. Some 250 applications were submitted in 2012 (up from 197 in 2011). Among these 57 were selected for funding, which represents, on average, a 22.8 % success rate. This is significantly lower than in the previous year (35 %), since in 2012 the available budget had decreased by 7 % and was distributed among 27 % more applications.
Chart 75 shows the number of proposals received and approved each year since 2007. While the number of received applications has kept on growing, the available budget has remained fairly constant or even decreased by 7 % in 2012 (from EUR 21.33 million in 2011 to EUR 19.89 million in 2012). This has led to a decrease in the proportion of applications selected from among those received – or success rate − from 2011 to 2012.
Chart 75: Received and selected applications for Cooperation Projects since 2007
Most applications for cooperation projects (44 out of 57) were approved under the so-called ‘Multilateral Projects’ action, in the fields of support for the modernisation of higher education; cooperation between Higher Education Institutions and enterprises; promoting Virtual Campuses and the removal of barriers to mobility, fostering excellence and innovation in higher education and social inclusion in higher education.
Applications received as part of cooperation between Higher Education Institutions and enterprises have experienced strong growth: 67 applications as compared to 45 the previous year, which represents a year-on-year increase of 48.9 %. These projects mainly focused on promoting creativity, competitiveness, entrepreneurial spirit and employability; the development of innovative practices; and improving quality and increasing student and staff mobility throughout Europe.
Eight applications were selected from the ‘Academic Networks’ proposals, designed to promote innovation in a specific discipline, set of disciplines, or in a multidisciplinary area, and requiring the participation of Higher Education Institutions from all participating countries.
Finally, five applications were approved from the ‘Accompanying Measures’ proposals. These are innovative projects which aim to have a clear relevance to the European Higher Education Modernisation Agenda and to raise awareness among relevant target groups or the general public of the importance of European cooperation in the field of higher education.
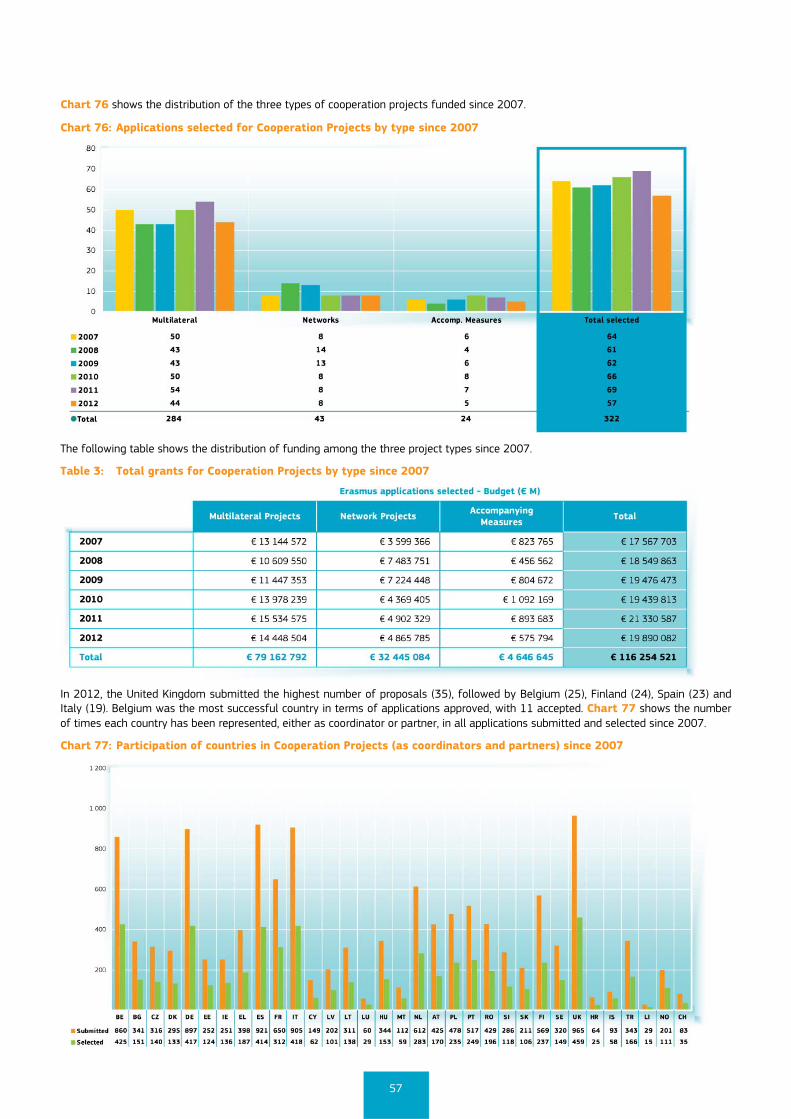
57
Chart 76 shows the distribution of the three types of cooperation projects funded since 2007.
Chart 76: Applications selected for Cooperation Projects by type since 2007
The following table shows the distribution of funding among the three project types since 2007.
Table 3: Total grants for Cooperation Projects by type since 2007
In 2012, the United Kingdom submitted the highest number of proposals (35), followed by Belgium (25), Finland (24), Spain (23) and Italy (19). Belgium was the most successful country in terms of applications approved, with 11 accepted. Chart 77 shows the number of times each country has been represented, either as coordinator or partner, in all applications submitted and selected since 2007.
Chart 77: Participation of countries in Cooperation Projects (as coordinators and partners) since 2007
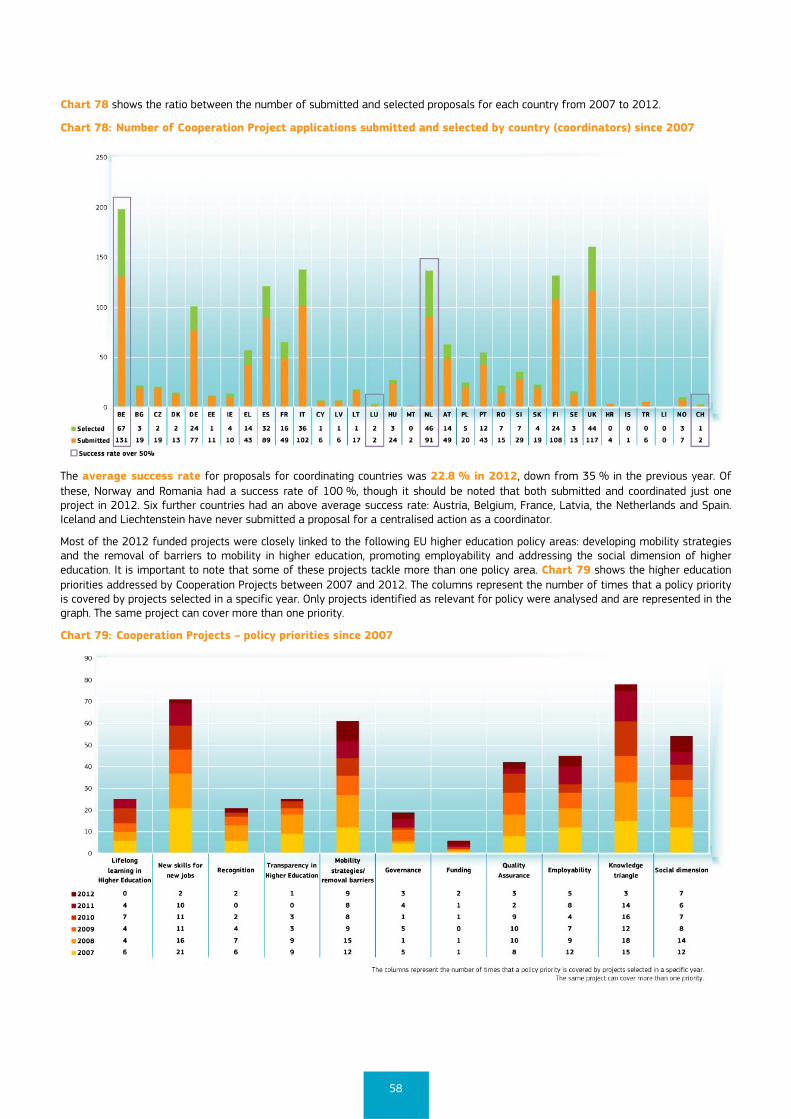
58
Chart 78 shows the ratio between the number of submitted and selected proposals for each country from 2007 to 2012.
Chart 78: Number of Cooperation Project applications submitted and selected by country (coordinators) since 2007
The average success rate for proposals for coordinating countries was 22.8 % in 2012, down from 35 % in the previous year. Of these, Norway and Romania had a success rate of 100 %, though it should be noted that both submitted and coordinated just one project in 2012. Six further countries had an above average success rate: Austria, Belgium, France, Latvia, the Netherlands and Spain. Iceland and Liechtenstein have never submitted a proposal for a centralised action as a coordinator.
Most of the 2012 funded projects were closely linked to the following EU higher education policy areas: developing mobility strategies and the removal of barriers to mobility in higher education, promoting employability and addressing the social dimension of higher education. It is important to note that some of these projects tackle more than one policy area. Chart 79 shows the higher education priorities addressed by Cooperation Projects between 2007 and 2012. The columns represent the number of times that a policy priority is covered by projects selected in a specific year. Only projects identified as relevant for policy were analysed and are represented in the graph. The same project can cover more than one priority.
Chart 79: Cooperation Projects – policy priorities since 2007
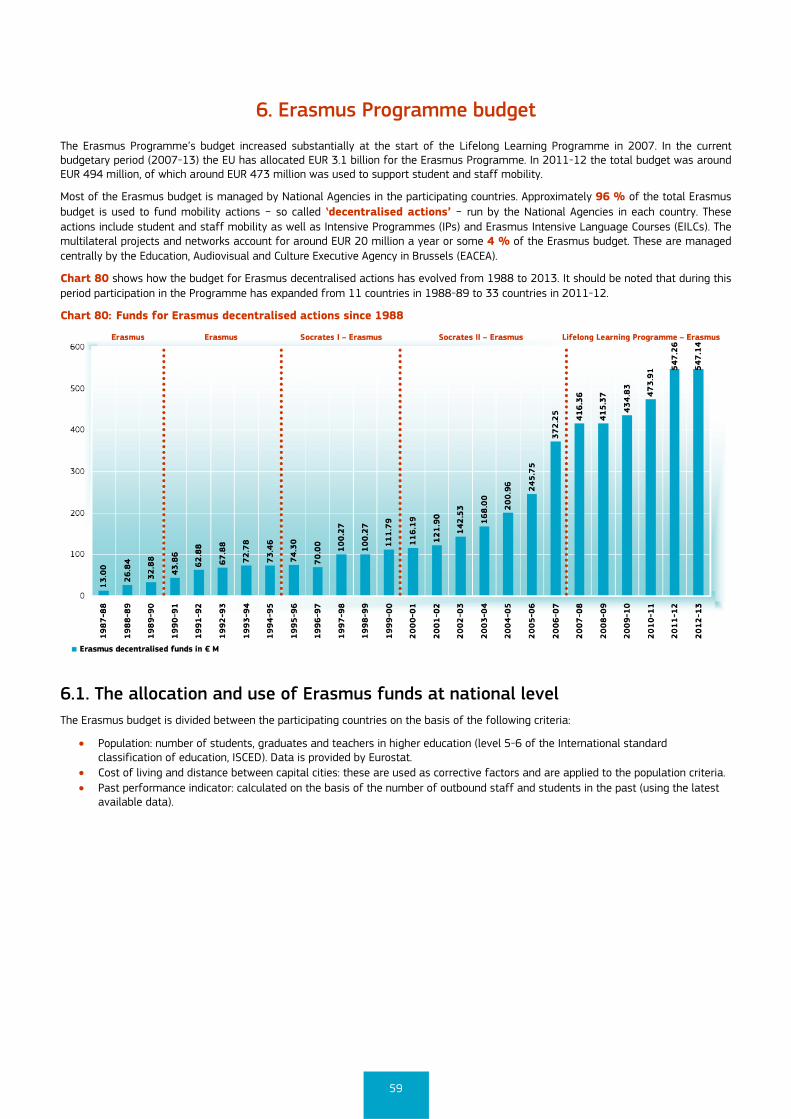
59
6. Erasmus Programme budget
The Erasmus Programme’s budget increased substantially at the start of the Lifelong Learning Programme in 2007. In the current budgetary period (2007-13) the EU has allocated EUR 3.1 billion for the Erasmus Programme. In 2011-12 the total budget was around EUR 494 million, of which around EUR 473 million was used to support student and staff mobility.
Most of the Erasmus budget is managed by National Agencies in the participating countries. Approximately 96 % of the total Erasmus budget is used to fund mobility actions − so called ʽdecentralised actions’ − run by the National Agencies in each country. These actions include student and staff mobility as well as Intensive Programmes (IPs) and Erasmus Intensive Language Courses (EILCs). The multilateral projects and networks account for around EUR 20 million a year or some 4 % of the Erasmus budget. These are managed centrally by the Education, Audiovisual and Culture Executive Agency in Brussels (EACEA).
Chart 80 shows how the budget for Erasmus decentralised actions has evolved from 1988 to 2013. It should be noted that during this period participation in the Programme has expanded from 11 countries in 1988-89 to 33 countries in 2011-12.
Chart 80: Funds for Erasmus decentralised actions since 1988
6.1. The allocation and use of Erasmus funds at national level The Erasmus budget is divided between the participating countries on the basis of the following criteria:
Population: number of students, graduates and teachers in higher education (level 5-6 of the International standard classification of education, ISCED). Data is provided by Eurostat.
Cost of living and distance between capital cities: these are used as corrective factors and are applied to the population criteria. Past performance indicator: calculated on the basis of the number of outbound staff and students in the past (using the latest
available data).
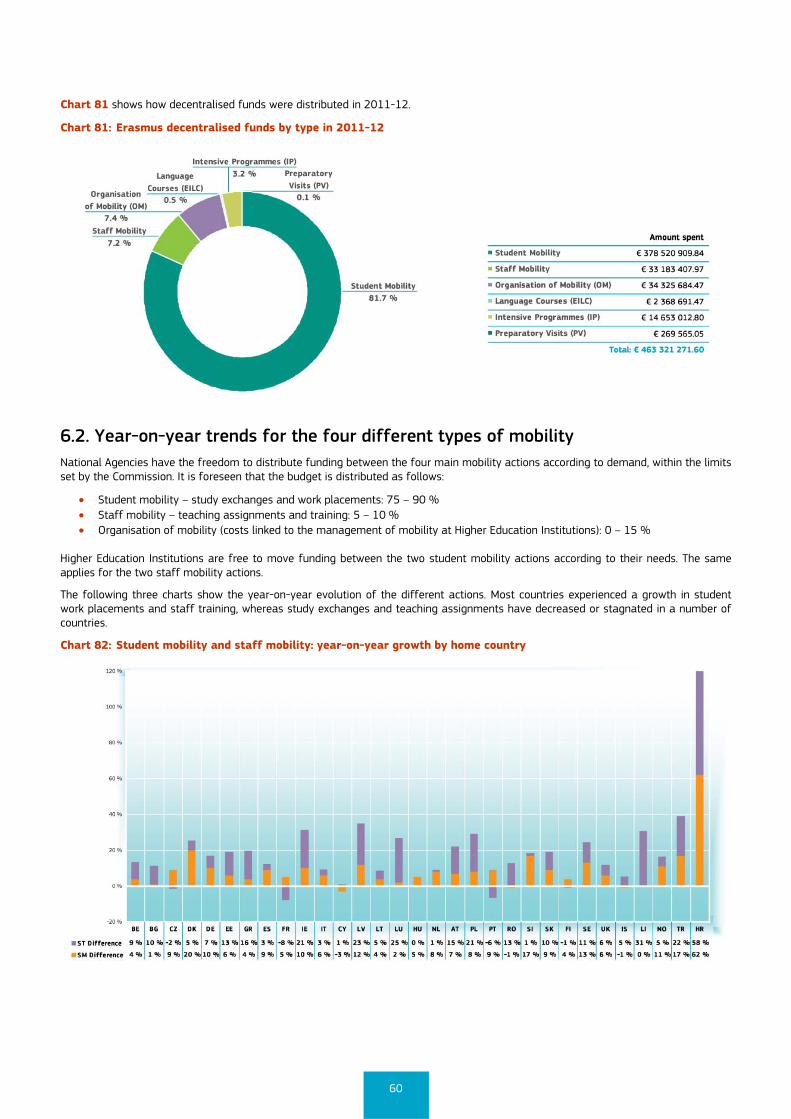
60
Chart 81 shows how decentralised funds were distributed in 2011-12.
Chart 81: Erasmus decentralised funds by type in 2011-12
6.2. Year-on-year trends for the four different types of mobility National Agencies have the freedom to distribute funding between the four main mobility actions according to demand, within the limits set by the Commission. It is foreseen that the budget is distributed as follows:
Student mobility – study exchanges and work placements: 75 – 90 % Staff mobility – teaching assignments and training: 5 – 10 % Organisation of mobility (costs linked to the management of mobility at Higher Education Institutions): 0 – 15 %
Higher Education Institutions are free to move funding between the two student mobility actions according to their needs. The same applies for the two staff mobility actions.
The following three charts show the year-on-year evolution of the different actions. Most countries experienced a growth in student work placements and staff training, whereas study exchanges and teaching assignments have decreased or stagnated in a number of countries.
Chart 82: Student mobility and staff mobility: year-on-year growth by home country
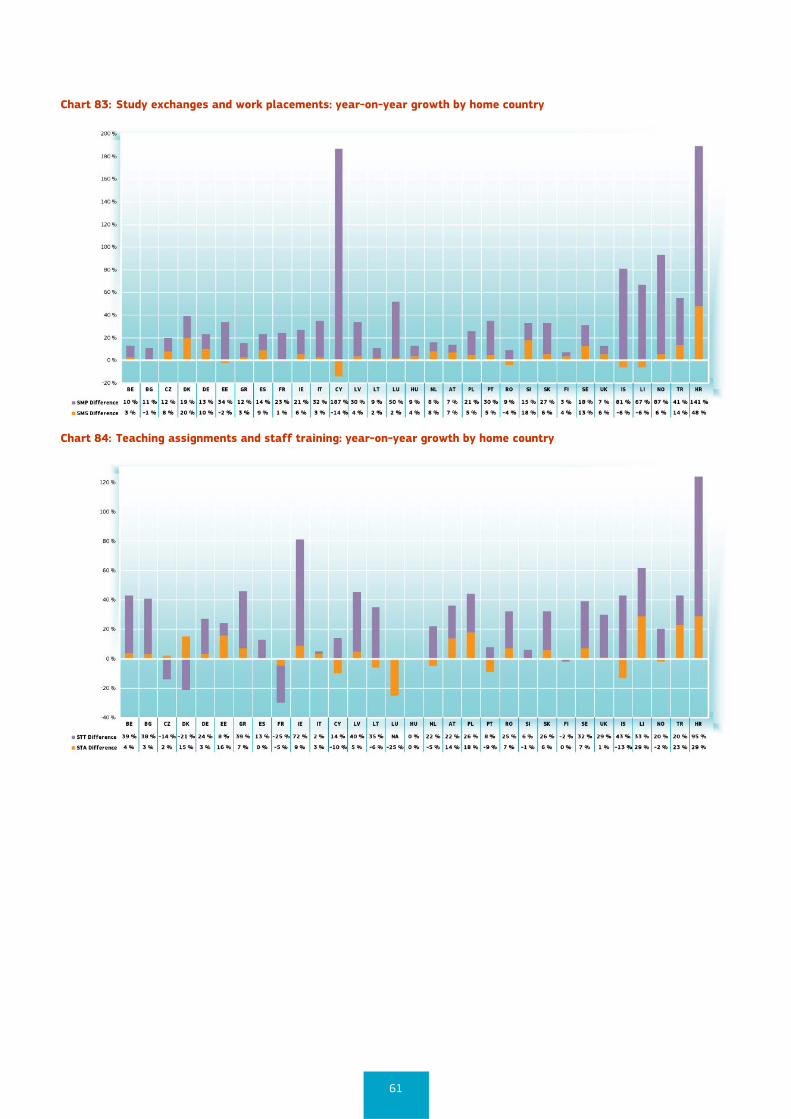
61
Chart 83: Study exchanges and work placements: year-on-year growth by home country
Chart 84: Teaching assignments and staff training: year-on-year growth by home country