document resume author title effectiveness · pdf filedescriptive of a variety of sonar...
TRANSCRIPT

DOCUMENT RESUME
ED 073 237 VT 018 574
AUTHOR Wheaton, George R.; Mirabella, AngeloTITLE .Effects of Task Index Variations on Training
Effectiveness Criteria.INSTITUTION Naval Training Equipment Center, Orlando, Fla.REPORT NO NAVTRAEQUIPCEN-71 -C-00L.9 -1PUB DATE Oct 72NOTE 94p.; Prepared under contract by American Institutes.
for Research, Silver Spring, Md.r-
EDRS PRICE MF-$0.65 HC-$3.29 -
DESCRIPTORS Educational- Programs; Feasibility Studies; *JobTraining; Perf6iffrbe Criteria; Predictor Variables;Simulators; *Skill Development; *Task Performance;Trainees; Trainers; Training Laboratories; *TrainingTechnir%Tes; *Transfer of Training
ABSTRACTA feasibility study was undertaken as part of a
program to develop` quantitative techniques for prescribing the designand use of training systems. As the second step in this program, thepresent study attempted to: (1) refine quantitative indices employedduring the early research, (2) conduct laboratory research on theeffects which task index variation have on training criteria, and (3)support the laboratory results with data gathered in the field. Inone laboratory study, effects of variations in task indices on skillacquisition of a set-up task were examined, while in a companioneffort, preliminary data were collected on relationships between taskindex variations and performance during transfer of training. In thefield study quantitative task index data were related to ratioestimates provided by instructors on four training effectivenesscriteria. Significant multiple correlations were obtained betweentask indices and speed and accuracy of performance during skillacquisition. Predictor patterns changed over time and betweencriteria. Set-up task speed was predicted early in training, whileerrors made were predicted later during acquisition. Similar but moreprovisional relationships were found during transfer of training. Theresults continue to indicate that quantitative task index data can bepredictively related to training criteria. (Author /SB)
a)6
'7'
FILMED FROM BEST AVAILABLE COPY
S DEPARTMENS OF itt-AtIq101.1CA-110N S. WELFAREOFFICE OF FOLIC:. [JO?:
arc . :: VIE%r.t-C".- PERS)". Q. R6
ECE4%
2'4" Cr:NA' ,7 P3+% F 1",;4
REPRCSENE OcE:1AL OEE.E Et",y#0. ros:140',. ift
Technical Report: NANTRAEQUIPCEN 71-C-0059-1
EFFECTS OF TASK INDEX VARIATIONS ON
TRAINING EFFECTIVENESS CRITERIA
George R. WheatonAngelo Mirabella
American Institutes for ResearchSilver Spring, MarylandContract N6133941 -C-0059
NAVTRABQUIPCEN Task No. 1752-02
October 1972
DOD Distribution Statement
Approved for public release;distribution unlimited.
AVAL TRAINING EQUIPMENT CENTER
ORLANDO, FLORIDA 32813

FILMED FROM BEST AVAILABLE COPY
Technical Report: NAVT3KBQUIPCEN 71-C-0059-1
EFFECTS OF TASK INDEX VARIATIONS ON-TRAINING EFFECTIVENESS CRITERIA
ABSTRACT
A feasibility study was undertaken as part of a program t( 'evelop quantita-tive techniques for prescribing the design and use of training systems. Asthe second step in this program, the present study attempted to: (1) -refinequantitative indices employed during earlier research; (2) conduct laboratoryresearch on the effects which task index variations have on -raining criteria;and (3) support the laboratory results with data gathered in the field.
Two laboratory investigations and a field study were conducted. In the firstlaboratory study, effects of variations in task indices on skill acquisitionof a set-up task were examined. In a companion effort, preliminary data werecollected on relationships between task index variations and performance dur-ing transfer of training. In the field study quantitative task index data,descriptive of a variety of sonar trainers and sonar trainee tasks, were re-lated to ratio estimates provided,by instructors on four training effective-ness criteria.
Significant multiple correlations were obtained between task indices and speedand accuracy of performance during skill acquisition. Predictor patternschanged over time and between criteria. Set-up task speed was predicted earlyin training, while errors made were predicted later during-acquisition. Simi-lar but more provisional relationships were found during transfer of training.Speed and, in particular, accuracy of performance during transfer bore con-sistent relationships to task index values. Support for these general find--ings was obtained in the field. Significant relationships were establishedbetween instructors' judgments of training criteria and trainee subtask indexvalues.
The results continue to indicate that quantitative task index data can be pre-dictively related to training criteria. Further development appears warranted.Future research should extend the laboratory findings especially for transferof training, and should seek to generalize these results to field settingsthrough the col:ection of performance data.
GOVERMENT RIGHTS IN DATA STATEMENT
Reproduction of this publication in wholeor in part is permitted for any purposeof the United States Government

NAVTRAENIPCEN 71-O-UU59-1
FOREWORD*
PURPOSE
The objective of this research project is to develop quantitative indices ofthe characteristics of instructors' and trainees' tasks so that the effective-ness of a given amount and type of training on a given task can be predicted.The results of this research should lead to greater accuracy in establishingthe human performance requirements in a training system, greater accuracy inhuman factors design 'recommendations, and improved instructor station design.
ACCOMPLISHMENTS
In the first phase of this research project, the feasibility of an initial setof quantitative indices in describing the trainee tasks on three sonar opera-tor training devices was demonstrated.
In addition, the feasibilit; si using quantitative task characteristic indicesto predict performance was tested by describing the characteristics of track-ing tasks appearing in the experimental literature and predicting trackingperformance. (The AD number for ordering the technical report which describesthefirst phase from the National Technical Information Service, Department ofCommerce, Springfield, Va., 22151, is AD 722423.)
In the second phase of this research project which this technical reportdescribes --the objective was to determine the relationships between systematicvariations in quantitative task characteristic indices and performance mea-sures. This was successfully accomplished by learning and transfer experi-ments in the laboratory and a field validation exercise.
Strong relationships between performance measures and variations in task in-dices (representing various configurations of synthetic trainer tasks) wereobtained. Further, the transfer experiment resulted in data which suggestthe feasibility of predicting transfer effects from quantitative task indices.Finally, the data of the field study validated much of the laboratory data.
PLANS
The next phase of this project will investigate the generality of the findingsin this technical report to a different family of training devices.
12
.(KAvt, vt- clti,4GENE S. MICHELI, Ph.D.Human Factors Laboratory

NAVTRAEQUIPCEN 71- C- 0059 -1
ACKNOWLEDGMENTS
The autYors would like to take this opportunity to acknowledge thecontribu-tions of Dr. Gen S. Micheli to this project. In his role as Project Monitor,Dr. Michell was instrumental in making arrangements for the field portion ofthe effort, in addition to suggesting directions for the laboratory work. Noless significantly, his interest in and general support of the research con-tributed to the success of the project.
The contributions of the U. S. Navy personnel are too numerous to mention.Without their interest aad capable assistance the field portions of the studycould not have been conducted. We would like tc especially thank the officersand men who acted as judges at the following locations: HS1, Quonset Point;FAETULANT, Norfolk; Flrlt T aining Center, Norfolk; FBM Submarine TrainingCenter, Charleston; and the Fleet Sonar School, Key West.
Finally, work could not have been completed without the 24vice and support ofother individuals at AIR. We would like to extend special thanks to Mr. WarrenMcDowell, who with limited materials and great'imagination, developed the"trainers" used in the laboratory research. Last, but by no means least, wewould like to express our thanks to Ms. Jan Strasel, project secretary, forkeeping the project on course.
ii

Section
II
III
IV-
NAVTRASQUIPUN 71-C-0059-1
TABLE OF CONTENTS
INTRODUCTION
Background
Research Objectives
METHOD
Page
1
1
2
3
Quantification of Sonar Training Devices 3
Laboratory Validation of Indices S
Conceptualization and Develcpmentof the Synthetic. Trainer S
Selection of Trainer'Configurations 7
Experimental Procedure 13
Transfer of Training Procedure 14
Field Validation of Indices 14
RESULTS 17
Laboratory Findings 17
Acquisition 17
Transfer 29
Field Findings 32
DISCUSSION 36
Prediction of Set-Up Task Skill Acquisition 36
Prediction of Set-Up Task Transfer of Training . . 37
Prediction of Judged Training Effectiveness 38
Conclusions and Implications for Research 39
REFERENCES
APPENDIX A
APPENDIX B
APPENDIX C
APPENDIX D
APPENDIX E
APPENDIX F
APPENDIX G
APPENDIX H
41
SQS-26CX Set-Up Subtask Operations Flow Chart 42
Task Characteristic Index Values for TraineeSubtasks Evaluated in the Field 45
Operations` Flow Chart for the Complex-All S:rntheticSet-Up Task 54
Instructions for Magnitude Estimates 63
Subtask Standard Flow Charts 66
Ratio Estimate Answer Sheet 71
Mean Instructor Ratio Estimates for the Four Subtasks 73
Intercorrelations of Task Index Values and AdjUTUalMean Instructor Ratio Estimates
iii
78

NAVTRAEQUIPCEN 71-C-0059-1
LIST OF TABLES
Table
1 Set-Up Task Functions Identified from Task-ilgalyticReview
2 Task Characteristic Index Values for Synthetic Trainer- Tasks
Page
3 Intercorrelaiions of Task Index Values and Mean PerformanceTimes Across Trial Blocks for the Laboratory Task's. . . 25
4 Interborrelations of Task Index Values and Mean ErrorsAcross Trial Blocks for the Laboratory Tasks .26
S Summary of Multiple Regression Analyses of Performance Timeand Number of Errors for First, Middle, and Last Block ofAcquisition Trials 28
6 Summary of Multiple Regression Analyses of Instructors' RatioEstimates: Individual Subtasks and-Pooled Subtasks
/4
iv
35
NAVTRA8QUIPCEN 71-C-0059-1
LIST OF .ILLUSTRATIONS
Figure
1 Complex-All Trainer
2 Simple-All Trainer
3 Medium-All Trainer
Page,
8
9
10
4 Mean Performance Time as a Function of Trial Block DuringAcquisition Training for Simple-Third and Simple-NoneTasks 18
Mean Performance Time as a Function of-Trial Block DuringAcquisition Training for Simple-All Tasks '19
6 Mean Performance Time as a Function of Trial Block DuringAcquisition Training for Medium and Complex Tasks 20
7 Mean Errors as a Function of Trial Block During AcquisitionTraining for Simple-Third and Simple-None Tasks 21
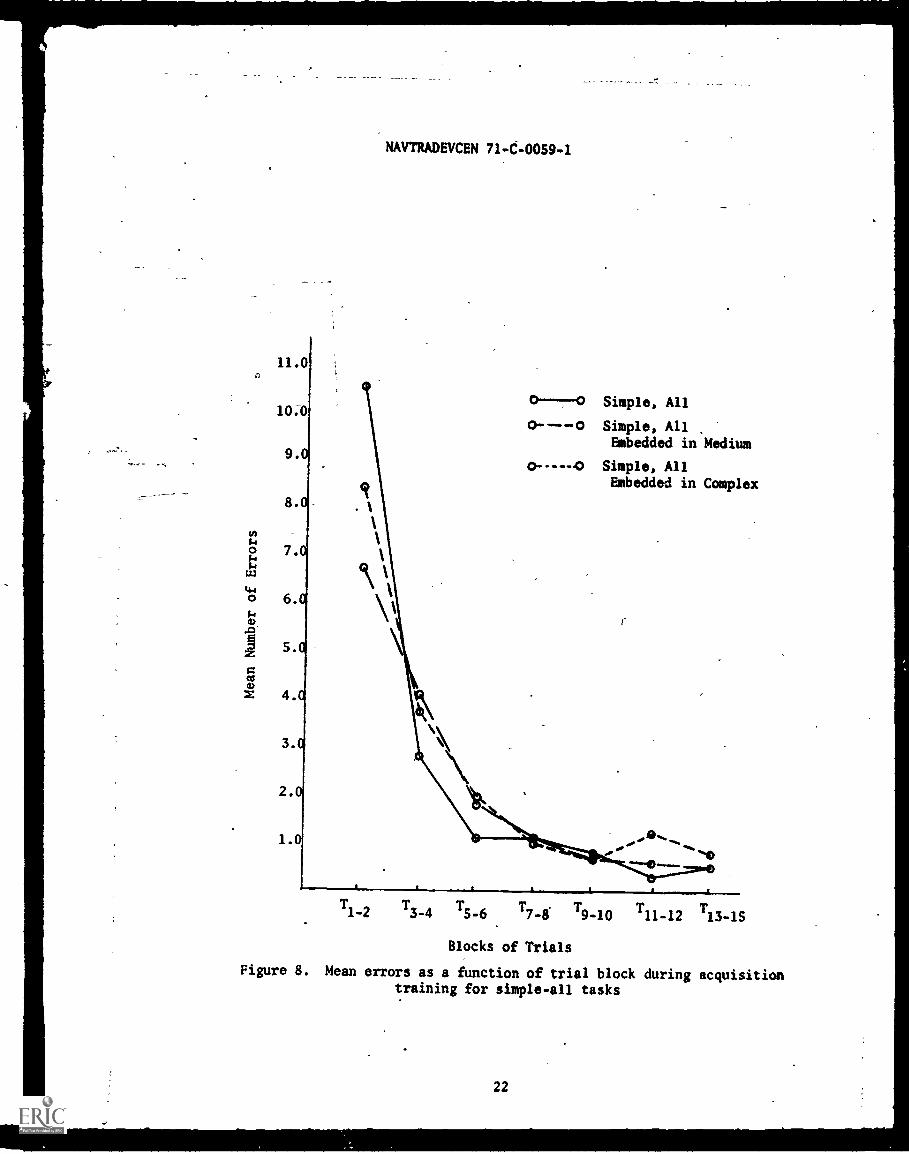
8 Mean Errors as a Function of Trial Block During AcquisitionTraining for Simple-All Tasks 22
9 Mean Errors as a Function of Trial Block During AcquisitionTraining for Medium and Complex Tasks 23
10 Mean Performance Time as a Function of Trial Block DuringTransfer to Medium-All Task 30
11 Mean Errors as a Function of Trial Block During Transferto Medium-All Task 31
v/vi

NAVTRAd4UIPCEN 71-C-0059-1
SECTION I
INTRODUCTION
One of the most difficult and complex problems confronting individualsresponsible for training is the design and development of effective trainingdevices. In military settings, where complex simulators and trainers oftenprovide the basis for instruction, the problem is particularly acute. Duringdevelopment of these complex devices, options are nearly always available withrespect to the design of trainee and instructor stations. Given such options,however, there is seldom any solid basis for choosing among them in terms oftheir relative effectiveness. Faced with alternative designs for the trainee'sstation, one finds it hard to specify with confidence those which will provemost effective in promoting rapid acquisition of skills and/or positive trans-fer to the operational situation. Similarly, given alternatives in design ofthe instructor's station, one may have difficulty in identifying those whichwill enable instructor personnel to function most effectively in carrying outtheir duties.
To deal with ...hese and a series of allied training problems, it is essen-tial to have cata relating selected parameters of alternative designs to as-pects of trainee and instructor performance. If consistent changes in thesecriterion measures could be demonstrated as a function of systematic manipula-tion of design parameters, then such information could be used to predict theeffects which different console layouts, sequences of operation; etc., mighthave on the trainee's rate of learning or the instructor's level of performance.The ability to make such forecasts would provide sounder bases for a,variety oftraining system design decisions including, for example, appropriate degree ofsimulation fidelity, trainee to instructor ratios, and part versus whole train-ing. Equally important, accurate forecasts would aid in identifying those de-sign tradeoffs which could be made without compromising training effectiveness.
BACKGROUND
In spite of the promise inherent in this'approach, the methodology requiredfor its implementdtion has been slow in developing. A major obstacle to morerapid progress has been the lack of an adequate means for describing alternativedesigns. Essentially, a set of indices is desired in terms of which differentdesign configurations might be scaled quantitatively. Until such indices becomeavailable, the relationship between alternative design configurations and thedifferent rates of learning or levels of performance associated with them can-not be meaningfully explored.
In response to this problem, the Naval Training Equipment Center (NAVTRABQUIPCEN)initiated a program of research which was to .be executed in a series of phases.The primary objectives of the first phase were to compile and to demonstratethe feasibility of applying a set of quantitative task indices. This effort,which has been described in detail elsewhere (e.g., Wheaton, Mirabella, andFarina, 1971) entailed several activities which included: (1) identifyingdesign features of training deviCes which conceivably could be quantified; e.g.,number of displays and controls and their arrangements; (2) exploring a varietyof means for their quantification, relying primarily on indices and techniquespreviously developed and reported in the literature; and (3) determining the

NAVTRADEVCEN 71-C-0059-1
feasibility of using the assembled indices to quantify some actual trainingdevices. To keep the scope of this effort within manageable hounds, concernwas limited to features of trainee stations found in various sonar trainingdevices. In spite of this restriction, however, It was assumed that many ofthe features chosen for quantification would be relevant to other types oftrainee stations as well as to instructor stations. Application of the indicesto fourotrainee tasks (i.e., set-up, detection, localization, classification),as represented in a small number of different devices, was attempted. Thisexercise demonstrated that most, if not all, of the indices could be used toscale quantitatively the extent and manner in which the trainee tasks differedwithin and across devices.
RESEARCH OBJECTIVES
As part :" the larger research program and as a sequel to Phase I effort's,the present stt.dy had three objectives. The first objective was to refine theset of quantitative indices employed during the earlier research, adding newdescriptors, if possible, while deleting those which proved unsatisfactory.The second objective was to conduct an investigation of the relationship betweenvariations in quantitative indices and corresponding changes, if,any, in se-lected criterion measures. This effort was to be conducted in a laboratory'setting in order to exercise control over other variables not of immediate inter-est to the present study. The third and final objective was to determine whethersupport for relationships established in the laboratory could be provided bydata collected in the field. Such support would increase confidence in thevalidity of the basic methodology--that of using quantitative task index infor-mation to forecast'the relative effectiveness of,competing designs.
The remainder of this report describes the research performed in pursuitof the three primary objectives. In the next section, Section II, the methodof procedure is presented. The presentation starts with a description'of howdevices were quantified in the field, and proceeds to a discussion of themethods employed in laboratory and field validation studies. The results ofthese studies are presented in Section III. In Section IV, the final section,the results are discussed in terms of their implications for the prediction oftraining device effectiveness and for future research.

NAVTRADEVCEN 71-C-00S)-1
SECTION II
METHOD
The general approach pursued in the current research stemmed from resultsof the previous phase. As already indicated, the thrust of Phase I was to dem-onstrate that alternative design configurations could be scaled quantitatively.It remained to be established, however, that such scaling could be predictivelyrelated to learning and proficiency criterion measures. In order to providesuch evidence, an approach was adopted consisting of three distinct but inter-related activities. Quantification of devices in the field was continued usinga revised set of indices. The data obtained during this exercise were then usedin conductikig a two-pronged validation study ccnsisting of a laboratory and afield effort.
The dual validation effort was felt necessary because of inherent limita-tions in either the laboratory or field approach alone. While the laboratoryapproach would facilitate measurement and experimental control, it would re-quire generalization to actual field conditions. On the other hand, while thefield effort would permit di=ect assessment of the quantitative indices, itpresented the familiar problem of obtaining performance data under operations]conditions. By pursuing both avenues it was hoped that their respective weak-nesses could be offset.
QUANTIFICATION OF SONAR TRAINING DEVICES
Before either validation effort could be initiated, quantitative task indexdata were required on a sample of actual devices. These data were intended toprovide guidelines for the types and ranges of design characteristics to bemanipulated in the laboratory. In addition, they wire to be employed directlyin the anticipated field validation effort as the predictor variables. Accord-ingly, efforts begun during Phase I to apply the quantitative indices were con-tinued during the present research.
Application of the indices was extended to several devices not examinedduring the earlier oork. Altogether, 13 different trainee stations were quanti-fied including: the 14E10/3 at Quonset Point, Rhode Island; the 14831B (AQA-1and ASA-20 stations), 14E14, and X14A2 at Norfolk, Virginia; the 21A39/2 (0A1283,BQR-2C, and BQR-7 stations) at Charleston, South Carolina; and the 14E3, 14A2/C1,SQS-26CX, and 21BS5 (0A1283 and BQR-2B stations) at Key West, Florida.
The proiedures involved in quantifying these devices have been describedat length in an earlier report (e.g., Wheaton, Mirabelli, and Farina, 1971).Briefly, instructor personnel familiar with the operation of each device wereasked to perform and describe in detail all of the primary and contingency ac-tions comprising each of four trainee subtasks. These subtasks, found in most,but not all of the :!evices, included set-up, search or detection, localization,and classification. The task-descriptive data obtained for each subtask werethen converted into flow-chart form for more convenient processing. An exampleof one of the types of flow charts generated is shown in Appendix A for theSQS-26CX set-up subtask.
Upon conversion of the task descriptive data to flow-chart form, they wereanalyzed in terms of a variety of quantitative indices. A reduced set of in-dices from the total compiled during Phase I was employed in the present research.
3

NAVTRADEVCEN 71-C-0059-1
Exclusion of indices from this final set occurred for one of four reasons.Some, most notably a set of task characteristic rating scales, were excludedbecause: (1) they were often difficult to apply objectively, requiring a con-sensus among several analysts; and (2) they referred in many instances tocharacteristics which, althcugh varying across very differ,,lit types of devices,did not appear to reflect readily manipulable design features (e.g., the workload dimension). Still other indices were excluded either because they gener-ated little variation for the present types of devices or because they had been'found from past work to be correlated highly with other descriptors.
The set of descriptors finally adopted included 17 indices. A brief defi-nition of each is given below, together with references when appropriate. In-cluded were the following:
a. MAIN - defined as the number of responses comprising the main ordominant procedural sequence in an operation; fl:w chart. Inthe flow chart, shown in Appendix A,-there are 24 of these cen-tral and display actions (i.e., those connected by solid lines).
b. CNTG - defined as the number of responses comprising the auxiliaryor contingency procedural sequences. The flow chart, shown inAppendix A, contains 24 responses of this type (i.e., those con-nected by dotted lines).
c. TA - defined as the total number of responses (actions) comprising _the procedural sequence in an operations flow2.cl:de:Antsthe sum of MAIN and CNTG.
d. CONT - defined as the total number of different controls manipulatedduring performance of a subtask.
e. DISP - defined as the total number of different displays referencedduring perforiance of a subtask.
f. E - defined as the total number of different equipment elementsinteracted with, this index is given by the sum of CONTfig0.
g. LV - the link value reflecting the relative strength of the sequenceof use ar,ng the various controls and displays. As used here it isthe sum of the products of the number of times a li,nk is used, andthe percentage of use of the link (Fowler, Williams, Fowler, 4Young, 1968).
h. AA% - an index reflecting the percentage of alternative actionspresent in an operation. A score of, "...0% means that the highestnumber of alternative links are used, each with an equal frequencyof use, and 100% score mcars there is only ono link out of and intoeach control, with the same frequency used for all links."(Fowler et al., 1968).
i. F% - another index (Fowler et al., 1968) describing the extent towhich all controls and displays are used an equal number of times(0%) or a theoretically
defined optimum number of times (100%).
4
NAVTRADEVCEN 71-C-0059-1
j. DEI - a measure of the effectiveness with which information
flows from displays via the operator to corresponding con-trols. The index yields a dimensionless number representinga figure of merit for the total configuration of displays andcontrols (Siegel, Miehle, & Federman, 1962).
k - m. D%, C%, E% - defined respectively as the number of display,control, or combined equipment elements which the operatoractually employs relative to the total number of such elementswhich are available for use.
n - q. CRPS, FBR, INFO, INST - refer -co the frequency with whichthe operator makes various types of responses during performanceof the task. Included are responses involving manipulation ofcontrols (CRPS), securing of feedback (FBR), acquisition of in-formation (INFO), as well as those primarily initiated by theinstructor_(INST).
The values actually obtained on each of these 17 indices for the 13 traineestations previously listed are presented in Appendix B. Four separate tablesare presented corresponding to each of the basic trainee subtasks. The indexdata for all four subtasks were used as predictors in the field validationeffort. The index data obtained for the various set-up subtasks provided guide-lines for the laboratory validation effort.
LABORATORY VALIDATION OF INDICES
The general approach to laboratory validation was to develop a modularized,synthetic sonar trainer, capable of being readily configured into a large numberof sonar "trainers," varying in design characteristics, but with a common setof functions. The trainer was designed to evaluate set-up behavior alone. Othersubtasks; i.e., detection, tracking, classification, were excluded because theinstrumentation necessary was considered beyond the scope of available time andresources.
CONCEPTUALIZATION AND DEVELOPMENT OF THE SYNTHETIC TRAINER. Design of thetrainer was preceded by an extensive examination and analysis of the task datacollected during this and the previous phase of our research. Working from boththe original task-analytic data and derivative flow charts, essential set -upfunctions were identified on a trainer-by-trainer basis. A relatively commonset of functions; i.e., cutting across all the trainers studied, was generated(table 1). These functions are basic activities performed by the sonar traineeoperator during set -up -and are relatively common to all the sonar devices whichhave been explored in this program. Approximately 23 set-up functions wereidentified. Some of these were later combined to yield a reduced set of 19functions. For each of these 19 functions, an equipment module was eventuallydesigned.
On a second pass through the devices,. displays and controls needed for eachfunction were identified. These displays and controls were then collapsedacross devices, and duplicate units eliminated to arrive at a final, non-redundant set for each function. These sets of equipment elements were thebasis for designing a module for each of the 19 functions.
5

NAVTRADEVCEN 71-C-0059-1
TABLE I. SET-UP TASK FUNCTIONSIDENTIFIED FROM TASK-ANALYTIC REVIEW
1. Energize the console
2. Check gyro status
3. Activate calibration mode
. 4. Select transducer operation modes, e.g., active/passive, ATF/MTB
5. Select range scale and adjust range cursor
just PPI intensity/focus for:
6. Overall scope
7. Sweep
8. Cursor
9. Adjust audio for comfort level
10. Adjust console illumination- for comfort level
Insert sonar parameters
Geo-references:
11. True/relative
12. Speed
13. Course .
14. Ship centered display/target centered display
Other parameters:
15. Sound velocity
16. Pulse length/dwell time
17. Frequency
18. Sum/difference
19. Depression elevation angle
Calibrate the PPI re:
20. Range cursor
21. Bearing cursor
22. Sweep
23. Check signal meters for operation
6

NAVTRADEVCEN 71-C-0059-1
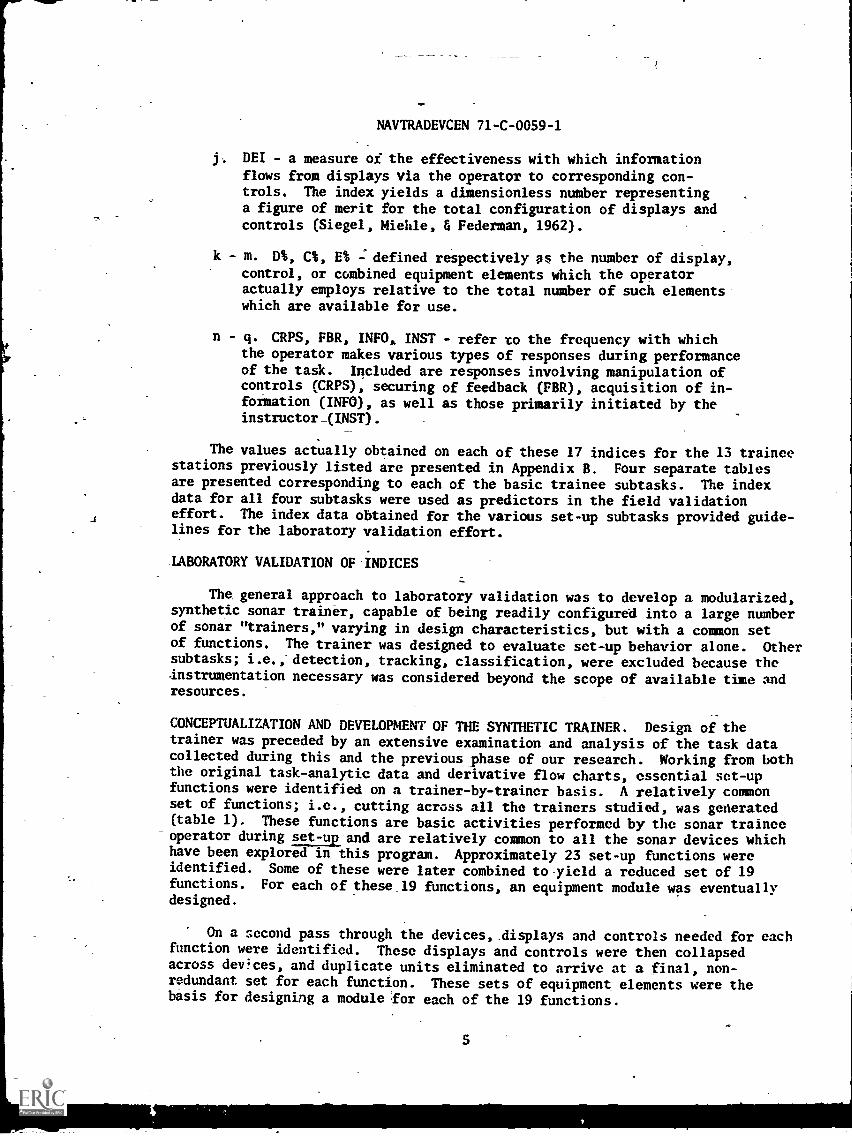
Each module contained displays and controls which duplicated actual hard-ware found in the sonar devices, or which represented the essential functionsof actual hardware. Representative displays and controls were used where thecomplexity of actual hardware was beyond the scope of the current effort. Forexample, simple meter movements arranged as voltmeters across a variable voltagesource were used in place of the PPI. Manipulating this voltage source toeffect a change in meter reading is somewhat analogous to manipulating a hand-wheel to effect changes in the position of a PPI range or bearing cursor. It,
was felt that the essential decision-making and perceptual-motor activity couldbe abstracted via this kind of substitution of hardware, even though the substi-tuted version might appear rather different from the actual hardware. Whereactual hardware consisted of such items as toggle switches, function switches,meters, and jeweled signal lights, actual hardware was used.
For most of the modules, a "simple" and a "complex" form was constructedto represent simple versus more complex hardware for discharging essentiallythe same function. Altogether, a total of 30 different modules was availablefor combination into a variety of trainer - configurations.
SELECTION OF TRAINER CONFIGURATIONS. For purposes of the present research,an attempt was made to compile a set of configurations which would vary as muchas possible along the 17 design indices selected for study. Toward this endtwo anchor configurations were initially selected representing extreme designs.There was a "complex" trainer consisting of all complex panels and a "simple"trainer consisting of all the simple panels which were available (i.e., simplepanels were used at all those roc'tions for which simple panels had been con-structed). The complex ar_ ample configurations are shown in figures 1 and 2.Given the two extreme configurations, an intermediate configuration was thengenerated by randomly selecting either a complex or a simple module for eachfunction on the trainer console. .This configuration, known as the medium-alltrainer, is shown in figure 3.
In addition to these three primary trainers, nine additional trainers wereselected to yield a range of design parameter values. These configurationsessentially represented variations-in the simple trainer or the medium trainer;i.e., the simple trainer embedded in the complex, medium trainer with feedbacklights removed, simple trainer with additional contingency responses includedin the training regimen. These manipulations-were aimed at reducing correla-tions among the design parameters, in particular the correlation between numberof-displays or controls and other design characteristics.
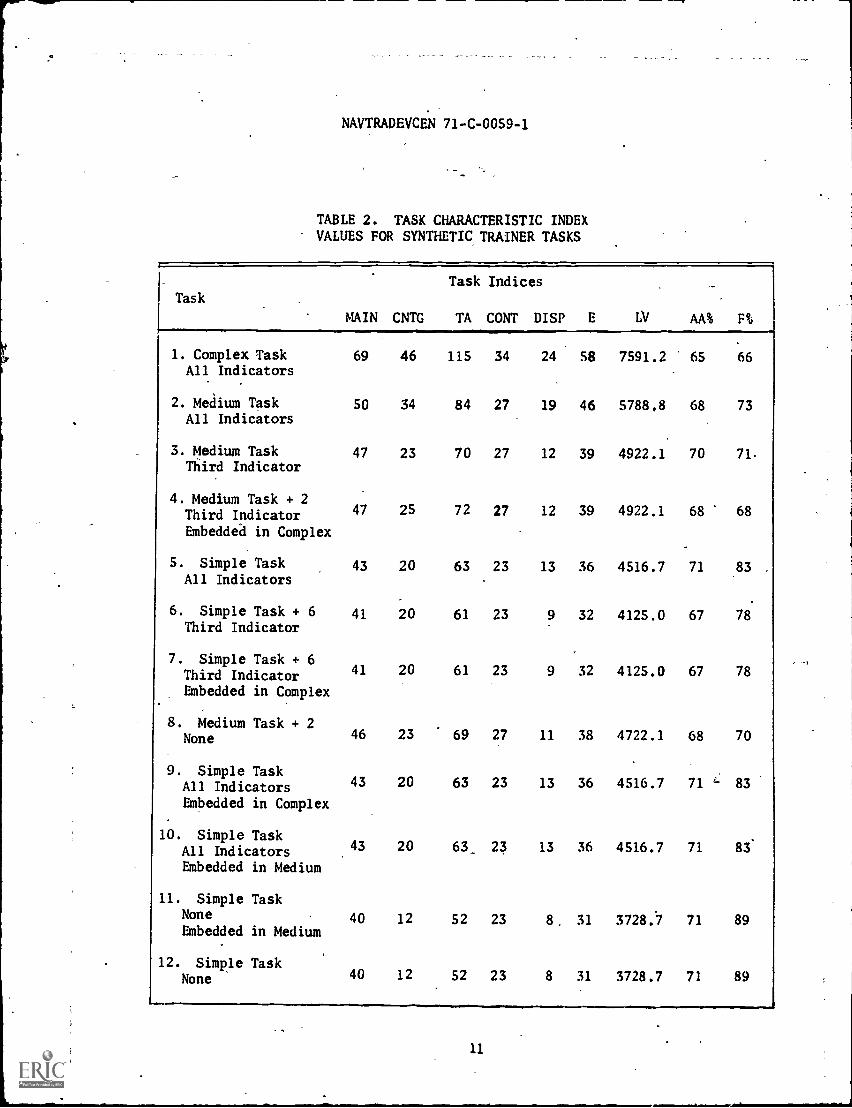
For each trainer, a specific set of procedures or sequence of responses wasdeveloped. These served to define "trainee" tasks.analogous to the trainee set-up subtasks associated with actual sonar training devices. To the extent thatequipment elements were present on a panel, but not involved in task performance,the task was said to be embedded. If a reduced number of feedback lights wasused, the task was labeled according to those indicator groups which were used(i.e., none, every third, all). The 12 tasks which were employed arc listed intable 2, together with their values on the same set of task indices previouslyapplied in the field.
7

CO
Sr
x.
Figure 1.
Complex-All Trainer

NAVTRADEVCEN 71-C-0059-1
,;;;
OlVtOec ,
7
it-4 >16,1.
c
*e
ft
NAVTRADEVCEN 71 -C- 0059 -1
10
fr
c-0
NAVTRADEVCEN 71-C-0059-1
TABLE 2. TASK CHARACTERISTIC INDEXVALUES FOR SYNTHETIC TRAINER TASKS
Task
MAIN CNTG
Task Indices
TA CONT DISP E LV AA% F%
1. Complex Task 69 46 115 34 24 58 7591.2 65 66All. Indicators
2. Medium Task 50 34 84 27 19 46 5788.8 68 73All Indicators
3. Medium Task 47 23 70 27 12 39 4922.1 70 71.Third Indicator
4. Medium Task + 2Third Indicator 47 25 72 27 12 39 4922.1 68 68
Embedded in Complex
5. Simple Task 43 20 63 23 13 36 4516.7 71 83All Indicators
6. Simple Task + 6 41 20 61 23 9 32 4125.0 67 7 8
Third Indicator
7. Simple Task + 6Third Indicator 41 20 61 23 9 32 4125.0 67 78
Embedded in Complex
8. Medium Task + 2None 46 23 69 27 11 38 4722.1 68 70
9. Simple TaskAll Indicators 43 20 63 23 13 36 4516.7 71 83
Embedded in Complex
10. Simple TaskAll Indicators 43 20 63_ 23 13 36 4516.7 7 83-
Embedded in Medium
11. Simple TaskNone 40 12 52 23 8. 31 3728.7 71 89Embedded in Medium
12. Simple TaskNone 40 12 52 23 8 31 3728.7 71 89
11
11=

r
NAVTRADEVCEN 71-C-0059-1
TABLE 2. TASK CHARACTERISTIC INDEXVALUES FOR SYNTHETIC TRAINER TASKS
(Cont)
Task01q-
x10-4 0%
Task Indices
C% Et CRPS FBR INFO INST
. Complex Task 5.3 100 100 100 60 26 29 7All Indicators
. Medium Task 9.7 100 100 100 44 19 21 6All Indicators
. Medium Task 10.9 100 100 100 44 9 17 6Third Indicator
. Medium Task + 2Third Indicator 8,.0 SO 79 67 46 9 17 6Embedded in Complex
. Simple Task 16.3 100 100 100 35 12 16 6All Indicators
6. Simple Task + 6 10.8 100 100 100 39 8 14 6Third Indicator
. Simple Task + 6 8.2 37 68 -55 39 8 14Third IndicatorEmbedded in Complex
8. Medium Task + 2 9.9 100 100 100 46 7 16 6
None
i.. Simple Task 12.7 54 68 62 35 12 16 6All IndicatorsEmbedded in Complex
10. Simple Task 14.3 68 85 78 35 12 16 6All IndicatorsEmbedded in Medium
11. Simple Task 17.3 42 68 67 34 5 13 hNone
Embedded in Medium
12. Simple Task 21.3* 100 100 100 34 5 '13 6
None
12

NAVTRADEVCEN 71-C-0059-1
EXPERIMENTAL PROCEDURE. Following development.of the synthetic. traineraid selection of the specific tasks to be studied, the testing portion of thelaboratory effort was initiated. Subjects who were to serve as trainees duringthis portion of the study were recruited from universities in the metropolitanWashington, D. C. area. The subjects were males who, on the average, wore 22years old, 71 inches tall, and weighed 159 pounds. Subjects were randomly as-signed in groups of five to each of the 12 experimental tasks. The 60 subjectsemployed in this manner were paid for their services.
Upon arrival at the American Institutes for Research (AIR), each subjectwas ushered into the laboratory and seated before the experimental console, con-figured according to the task group to which the subject had been assigned.The following standard instructions were then read:
The experiment you are taking part in today is part of aresearch program.to study how well, and how quickly people learnto operate equipment, which is designed in a variety of differ-ent ways. Your task will be to learn to operate the equipmentwhich is before you. I will go through the operation of the de-vice step-by-step with you. I will do this twice, and then Iwill ask you to repeat the operations from memory a number oftimes. I will correct errors or omissions which you make, butplease do your best to recall the operations. Accuracy and speedare both important for obtaining valid research data. Followingeach run-through, you will be asked to leave the room so that theequipment can be reset. You may wait in the lounge while this is.being done. Are there any questions?
Following presentation of these instructions, the subject was given de-tailed information on how the task was to be performed. Using a specially pre-pared flow chart, similar to that presented in Appendix C for the complex-alltask, the subject was instructed step-by-step in the procedure to be learned.An important aspect of these instructions concerned the standardized reportinglanguage which the subject was to use when describing his task responses. Forexample, instructions for Panel 1 of the complex trainer included the following:
_INSTRUCTION:Set main powerSwitch #1 toStandby Position
VERBAL RESPONSE: "1 to Standby"
13
Check main powerIndicator #2 forGreen Indication
2
"2 is Green"

NAVTRADEVCEN 71-C-0059-1
Standardized responses were used to minimize the variability inherent inthe time required for verbalization of behavior. The complete set-up procedurewas described twice in this manner after which any final questions were answered.
Following this orientation session, 1S experimental trials were administered.Preliminary pilot work indicated that performance reached asymptote within thisnurxer of trials for a prototype trainer. Prior to each trial the subject leftthe testing area and the experimenter set all controls in randomized positionsaccording to a predetermined scenario. Programming of the various trainer con-figurations'was of the simplest kind. The experimenter preset switches and dis-plays either on the trainer itself or on a peripheral control panel. Again,the present scope. of effort limited the sophistication which could be appliedto instrumentation.
Upon being recalled for each trial, the subject went through an entire set-up procedure, verbalizing each response which he made. Correct verbal responseswere precoded on a trial-by-trial basis (for the randomized initial control set-tings) on the experimenter's response sheet. Therefore, measurement of perfor-thance consisted of simply checking off ea-h response as it was emitted by thesubject. Erroneous or omitted responses were so coded. Time to complete eachrun-through was measured with a stop watch. However; the watch was stoppedwhile subject errors were being recorded and corrected. Thus, time, errors ofomission, and errors of comission provided the dependent measures.
TRANSFER OF TRAINING PROCEDURE. The primary laboratory validation focused uponacquisition of set-up skills. However, as an adjunct to this effort, a pilottransfer study was also undertaken. In this effort additional training was pro-vided for five of the 12 groups involved in the main study (groups 2, and 9through 12 in table 2). These particular groups were chosen because they pro-vided some interesting contrasts; i.e., effect of panel clutter or embedding ontransfer (ratio of used to unused displays and controls). Following the regularacquisition trials, subjects in these groups were permitted to rest for one-halfhour. They were then brought back to the laboratory and retrained on the medium -all task. This training regimen was identical to the acquisition regimen; i.e.,two complete run-throughs. However, only 10 training trials were run ratherthan 1S. One of the groups originally trained on "medium all" was not given anyretraining, but merely tested for retention. Ten trials were also employed forthis group.
FIELD VALIDATION OF INDICES
The second prong of the dual validation attempt involved a study of theeffectiveness of the 13 sonar training devices which had been previously taskanalyzed. Ideally, such a study should involve carefully controlled measure-ment of actual training experiences by novice enlistees. Such a procedure, how-ever, would require-considerable interference with on-going training activityand normally is no: ceasible. Therefore, field validation was pursued viastructured intervie, with experienced sonar instructors. These instructorswere asked to rate the tasks - trained on their devices against a set of "synthe--sized" comparison tasks.
14

NAVTRADEVCEN 71-C-0059-1
The data collection was undertaken at sites previously employed fortraining device analysis. These included the Fleet Sonar School at Key West,Florida, the Fleet Ballistic Missile Submarine Training Center at Charleston,South Carolina, and the Fleet Training Center and Fleet Airborne Training Unitat Norfolk, Virginia, and the Quonset Point Naval Air Station in Rhode Island.
At each sonar training device installation visited, a group of four orfive instructors was convened who were qualified on the device under examina-tion. These instructors had the following average experience profile:
Experience category Mean number of years
Total Navy
Sonarman at sea
Sonar instructor
Experience on devicebeing rated
10.9
5.9
1.9
1.3
Instructors were assembled in groups in a classroom setting and were givena series of instructions. These introduced the background of the project, statedthe purpose of the current visit, and explained the method which was to be em-ployed in making judgments about the particular training device under examina-tion. This method required the instructors to compare the set-up, detection,localization, and classification subtasks performed on their device against asimilar set of subtasks associated with a hypothetical sonar trainer. This sameset of hypothetical subtasks was used as a common frame of reference for allgroups of instructors. The hypothetical trainer actually represented a dis-guised amalgam of several of the devices being studied.
Following this general orientation, instructcrs were given detailed in-structions about four specific ratio judgments which they were to make. Theseinstructions, included in Appendix 0, concerned how estimates were to be madeabout: (1) training time; (2) proficiency level; (3) degree of transfer oftraining; and (4) level of task difficulty.
Upon completion of the instructions and, after answering any questions,instructors were provided with flow charts designed to facilitate their judg-ments. Two types of flow charts were used. One set described the subtasks tobe evaluated and were similar, for instance, to the set-up flow charts includedin Appendix A. The other set consisted of the standard flOw charts which wereto be used as the frame of reference. These flow charts appeared in Appendix E.
One subtask was dealt with at a time, starting with set-up and finishingwith classification. For a given subtask, the standardized flow chart was dis,tributed first, and reviewed step-by-step with the instructors. Next, the flowchart, representing the same subtask in the device to he evaluated, was dis-tributed and reviewed in similar fashion. Based upon a comparison of their ownsubtask with the standard, instructors were then asked to provide ratio esti-mates on each of the four criterion dimensions, using the response blank shownin Appendix F.
15

NAVTRADEVCEN 7l-C-00594
When evaluations of all four subtasks were completed, a group discussionwas held to try to arrive at consensus judgments. No attempt was made to forceconsensus, but instructors were encouraged to discuss any disagreements amongtheir ratings. Misunderstandings about evaluation procedures were also, takenup at this time. On the basis of the group discussion, each instructor provideda final judgment. That judgment was accepted, no matter how disparate it wasfrom any other judgments. .
Following evaluation of all of the subtasks for the actual device, instruc-tors were finally asked to make a last series of judgments concerning the rela-tive difficulty of the standard subtasks. This time they were to evaluate thestandard detection, lociTTREM, and classification subtasks, using the standardset-up subtask as a basis for comparison. Such judgments were designed to pro-vide a means for expressing the ratio estimates in terms of a common metric,thus permitting direct comparisons across subtasks.
16

NAVTRADEVCEN 71-C-0059-1
SECTION III
RESULTS
Three distinct sets of results are presented in this section. The firstconcerns the acquisition data obtained on the synthetic set-up trainer. Thesecond set, also based on laboratory research, stems from the pilot transferof training study. Final portions of the results section deal with findingsfrom the field validation exercise.
In the major sections which follow, the same general format is used. Thebasic layout of the data is given first, followed by a brief description ofgeneral findings. The more specific analyses are then presented. These areprimarily in correlational form, attempting to describe the relationship betweentask index variables and a variety of criterion measures.
LABORATORY FINDINGS
Results of the acquisition and transfer portions of the laboratory studyare presented in figures 4-11 and tables 3-5. They describe variations in per-formance speed and accuracy as a function of synthetic trainer task configura -tions.
ACQUISITION. The basic performance data for acquisition training are shown infigures 4-9. In each case either mean performance time (figures 4-6) or meannumber of errors (figures 7-9) is plotted as a function of trial block withtask configuration as the parameter. The 15 acquisition trials originally ad-ministered were collapsed into seven blocks in order to improve stability ofthe data. Thus, each point in thise figures represents an average value forten scores (five subjects per trial over two trials). An exception is the finalblock (T13.15) which spans three trials and represents, therefore, IS scores.
Figures 4-6 and 7-9 have essentially been broken out from two larger timeand error composites in order to improve clarity of presentation. The simple-third and simple-none configurations provide one grouping (figures 4 and 7).The simple-all configurations provide a second grouping (figures 5 and 8), andthe medium and complex configurations yield a third grouping (figures 6 and 9).These pairs of figures describe mean performance time and mean number of errorsrespectively.
Viewed in their entirety, all six figures reveal suh tantial variance inperformance across task configurations. This variance is \shown most clearlyfor the mean performance times of the simple-none, simple-all, and simple-third groups (figures 4 and 5). The medium groups, while contributing to over-all variance, are fairly homogeneous, especially when compared to the complex-all configuration (figure 6). Variation across tasks in terms of error scores,though somewhat less dramatic, is still marked (figures 7-9). This is againparticularly true for the simple-third + 6 and simple-none tasks (figure 7).Demonstrable variance in both the time and error criterion measures was, ofcourse, a prerequisite for the anticipated correlational analyses.
1.7

3S0
300
a2S0
JP)
O 2000=
k044
0
ISO
100
MAVTRADEVCEN 71- C- 0059 -1
V
Simple, Third + 6
Simple, Third + 6Embedded in Complex
Simple, None
Simple, NoneEmbedded in Medium
1 1 1
T1-2
T3-4
TS-6 17-8 T
9-10 T11-12 '3-1S
Blocks of Trials
Figure 4. Mean performance time as a function of tri..1 block duringacquisition training for simple-third and simple-none tasks

NAVTRADEVCEN 71-C-0059-1
00.----40 Simple, All
0"'!"'43 Simple, AllEmbedded in Medium
Simple, AllEmbedded in Complex
T1-2 13-4
TS-6
T7-8 T9-10
T11-12
T13-1S
Blocks of Trials
Figure S. Mean performance time as a function of trial block duringacquisition training for simple-all tasks
19

40
35
30
0
EF.
01)CI)
2500
of
0c.0a.
0 2000
150
100
NAVTRADEVCEN 71-C-0059-1
0-0 Complex, All
0-0 Medium, Third
- 0 Medium, Third+ 2Embedded in Complex
0-----ciNedium, All
Lr----A'Nedium, None + 2
1-213-4 15-6 T
7-8 79-10 11-12 113 -15
Blocks of Trials
Figure 6. Mean performance time as a function of trial block duringacquisition training for medium and complex tasks
20

'NAVTRADEVCEN 71 -C- 0059 -1
Simple, Third + 6
o-----a Simple, Third + 6Embedded in Complex
t---A Simple, None
---16 Simple, NoneEmbedded in Medium
T1-2
T3-4
TS-6
T7-8
T9-10
T11-12
T13-1S
Blocks of Trials
Figure 7. Mean errors as a function of trial block during acquisitiontraining for simple-third and simple-none tasks
r
NAVTRADEVCEN 71-C-0059-1
0-----0 Simple, All
Simple, AllEmbedded in Medium
0- 0 Simple, AllEmbedded in Complex
T1-2
T3-4
TS-6 T7-8 T9-10 T11-12 T13-1S
Blocks of Trials
Figure 8. Mean errors as a function of trial block during acquisitiontraining for simple-all tasks
22

15.0
14.0
13.0
12.0
11.0
10.0
0NLt3 9.0440N
8.0
O 7.0
6.0
5.0
4.0
3.0
2.0
'1.0
NAVTRADEVCEN 71-C-0059-1
0----0 Complex, All
Medium, Third
Medium, Third + 2
Embedded in Complex
Medium, All
tr---A Medium, None+ 2'
T1-2
T3-4
T5-6
T7-8
T9-10
T11-12
T13-15
Blocks of Trials
Figure 9. Mean errors as a function of trial bloctasksk during acquisitiontraining for medium and complex
23

NAVTRADEVCEN 71-C-0059-1
Closer inspection of-both sets of data shows that learning occurred onall tasks. The training regimen brought about a consistent reduction in thetime required to perform each task as well as in the number of errors made.In the case of the "simpler" tasks, time and error scores appear to be reach-ing asymptotic levels (figures 4 and 5, 7 and 8). On the medium and complextasks, however, continued improvement is still noticeable (figures 6 and 9).
It is of interest that in both the time and error data there are twoapparent sources for the observed differences among the various plots. Thefirst is related to type of task, while the second-involves task embedding. Inthis connection task refers to a specific set of procedural responses performedin a prescribed sequence. Embedding refers to the degree to which all of thedisplays and control available are indeed used during task performance.
Variation in performance time due to type of task is clearly seen when thesimple-none, simple-all, and simple-third + 6 plots are compared (figures 4 and5). The consistent ordering in performance time throughout acquisition holdsup for all task types with the single exception of the medium -none, + 2 task(figure 6). With respect to error scores, the clearest consistent differenceis seen the simple-none-and simple-third + 6 tasks (figure 7).
Particularly noteworthy are the different levels of performance associatedwith task embedding. For example, time (figure 4) and errors (figure 7) areboth greater for the 'embedded versions of the simple-third + 6 and simple-nonetasks. For simple-all tasks, this relationship holds only with respect to thetime measures which increase as a function of degree of embedding (figure 5).With only two reversals, the differences in performance associated with taskembedding are maintained throughout acquisition.' The amount of training pro-vided, although reducing the initial spread among these groups, is insufficientto eliminate the effects of extraneous displays and controls. This finding ismade all the more interesting by the fact that performance for these simpletask groups appears to be reaching an asymptote (figures 4, 5, and 8). The re-lationship is not as clear in the case of the medium-third task, which behavesas the simple embedded tasks do with respect to error (figure 9), but showts theopposite relationship for time (figure 6).
In much of the criterion data just described, relationships are stronglyimplied between performance during acquisition and the type of task to whichsubjects are exposed. The fairly consistent ordering of tasks with respect toperformance level directly raises an issue of basic concern in the presentresearch. To what extent are the indices, descriptive of the various trainerconfigurations, related to criterion performance? The Pearson product-momentcorrelation coefficients shown in tables 3 and 4 bear on this issue.
As shown in table 3, correlations of task indices with mean performancetime at each trial block are, in general, highly consistent. With the excep-tion of three variables (D%, C%, and E%), all reported coefficients are sig-nificant (p <;.05). The three exceptions are in themselves interesting be-cause of the consistently small correlations which they exhibit across allseven trial blocks. The same general pattern of relationships is also foundin the mean error data reported in table 4. D%, C%, and E% fail to correlatesubstantially with mean error at any of the trial blocks. All other-indicesdo exhibit substantial correlations with the error criterion. With the excep-tion of the AA% and DEI indices, however, the correlations with error are neitheras strong nor as consistent as they were with the performance time criterion.
24

NAYTRADEVCEN 71-C-0059-1
TABLE 3. INTERCORRELATIONS OF TASK INDEX VALUES AND MEANPERFORMANCE TIMES ACROSS TRIAL BLOCKS FOR THE LABORATORY TASKSt
TaskIndices
Trial Blocks
1 2 3 4 5 6 7
MAIN 73 81 83 86 88 94 88
CNTG 78 82 84 86 90 91 -86
TA 77 82 85 87 91 94 88
CONT 66 72 80 83 87 90 83
D1SP 65 71 68 72 76 83 74
N 69 75 77 Si 84 90 82
IN 74 80 81 84 88 92 85
AA% -75 -75 -85 -80 -83 -73 -79
F% -65 -62 -75 -76 -83 -72 -71
DE1
x10-4-83 -79 -86 -85 -89 -77 -79
0% -06 -01 06 08 13 17 18
C% -04 -01 08 10 15 17 17
E% -12 -06 03 05 10 14 15
CRPS 73 77 87 88 92 90 87
FBR 70 76 69 73 75 82 76
INFO 72 79 79 83 85 92 84
JNST 71 81 80 81 o' 79 90 86
tDecimal points have been omitted from coefficients for clarity.
With 10 degrees of freedom: r '-'~ .708, p "..; .01
.r. ''' .576, p '''; .05
25

NAVTRADEVCEN 71-C-0059-I
TABLE 4. INTERCORRELATIONS OF TASK INDEX VALUES AND MEANERRORS ACROSS TRIAL BLOCKS FOR THE LABORATORY TASKSt
Task
IndicesTrial flocks
1 2 3 4 5 6
MAIN 59 28 41 57 48 73 18
CNTG 65 46 58 69 66 86 36
TA 63 39 51 64 59 81 28
CANT 46 19 46 61 53 69 17
DISP 58 32 34 46 ,43 78 14
N SS 28 41 SS SO 78 16
LV 61 35 45 S9 54 80 22
AA% -61 -62 -83 -89 -88 -73 -73
Fro -49 -41 -75 -76 -76 -66 -43
Dni
x10-4 -67 -72 -93 -88 -88 -77 -68
0% -07 -24 -19 -10 -04 07 -07
C% -04 -20 -12 -01 OS 09 -06
E% -13 -30 -23 -11 -06 OS -11
CUPS 54 33 62 73 67 72 34
FIR 65 42 35 47 44 80 22
1NPO 61 33 40 SS 49' 79 19
INST 60 27 28 45 33 57 16
tDecimal points have been omitted from coefficients for clarity.With 10 degrees of freedom: r y .708, p .01
r .576, p 1Z. .05
26

NAVTRADEVCEN 71-C-0059-1
Of particular concern in both tables 3 and 4 are the generally largecoefficients associated with the TA index. TA, representing the total actionsor total number of responses comprising a task, correlates positively and highlysignificantly (p <;.01) with all time scores. Although the coefficients aregenerally smaller, TA also exhibits a strong relationship with error scores(table 4). By themselves, these relationships are of trivial interest. Theysimply reflect the fact that the longer a task is, the more time,will be re-quired for its performance and the more potential errors there will be. Whatis disturbing, however, is that the relationships between the other indices andthe performance criteria may arise because of dependencies between the remainingindices and TA.
During construction of the various trainers, concern arose over this verypoint. As previously mentioned, it was extremely difficult to manipulate manyof the indices completely independently of,TA. Examination of the task indexintercorrelation matrix (not shown) confirms this impression. TA correlatessignificantly with all other task indices (p4( .01), with the exception of D%,C%, and E%. With respect to the basic criterion data, therefore, it is unclearto what extent the other indices themselves relate to the criteria or simplymirror TA's relationships.
In an attempt to minimize potential contamination due to TA's influence,acquisition time and error scores were transformed prior to further analysis.The data selected for treatment were from the first, fourth, and seventh trialblocks, these points being chosen to represent performance at early, intermedi-ate, and later stages of acquisition. Time and error data sett for each of thethree trial blocks were treated separately. For each data set, single variableregression analyses were conducted using TA as the independent or predictorvariable. This procedure resulted in sets of residual criterion scores fromwhich all variance related to TA had been removed. The residual scores weresimply the difference between the observed raw score values and the values pre-dicted by the TA variable.
Evidence that the residualizing procedure had its intended effect comesfrom two sources. First, correlations between TA and the residual scores arezero. Second, correlations between the other (16) task indices and the resid-ual criteria are greatly reduced. The only significant correlation is betweenE% and performance time at the first block (r = -.58, p <;.05). Relationshipsamong the predictor task index variables are, of course, undisturbed by theadjustment procedure. TA is no longer included in this set and appears in noneof the regression analyses described below.
Six separate regression analyses were performed, one for each of the threetime and three error criterion data sets. A step-wise (step -up) regressionprocedure was employed with a maximum of four predictor variables being fitted.Standard values were employed for the F-level criteria for predictor variableinclusion or deletion. The results of the six analyses aro summarized in table5. For each analysis, denoted by type of criterion, the multiple correlationcoefficient (R) is reporte4 together with the percentage of variance in thecriterion accounted for (R ). Also provided-are the degrees of freedom (df)used in testing the significance of R and the resultant F-value. Finally, thespecific indices included in each regression solution are listed. They appearfrom left to right in the order in which they were entered by the step-wise
27

NAVTRADEVCEN 71-C-0059-1
TABLE S. SUMARY OF MULTIPLE REGRESSION ANALYSES OF PERFORMANCETIME AND NUMBER OF ERRORS FOR FIRST, MIDDLE, AND LAST
BLOCK OF ACQUISITION TRIALS
Criterion R 2_.----R--- dft F
Indices in order ofselection by step-wise
regression program
Time Scores
T1-2 .780 .608 3, 8 4.69* E%, AAA, D%
T7-8 .744 .553 3, 8 - 3.30 E%, AM, DISP
T13-15 .626 .392 3, 8 1.72 AA%, C%, DISP
Error Scores
71-2 .651 .423 3, 8 1.96 E%, C%, D%T-87 .896 .802 3, 8 10.80** AA%, MAIN, D%
T13-15 .875 .766 3, 8 8.73** AA%, CONT, DEI
*p <.05.
**p <C.01.
tSample size (N) = df1+ df
21.
28

NAVTRADEVCEN 7l-C-0059-1
procedure. Only three indices are shown even though in all cases four werefitted. The small sample size (N = 12) suggested a conservative approach todescription of the predictor indices.
As shown in table 5, when the effects upon performance time due to (TA)number of_responses are removed, a significant multiple correlation betweentask indices and time is found only during the very early stages of acquisition(R = .780, p <.05). The relationship is between mean performance time and E%,AA%. and D%. The first and last of these indices reflect the extent to whichsuperfluous equipment elements, especially displays, are encountered during taskperformance. One interpretation is that extraneous equipment has a distractingvalue which initially retards performance time, but whose impact decreases asthe trainee masters the figure-ground (task-configuration) distinction. In
line with this hypothesis, only E% is entered into the solution at T743, whileneither E% nor'D% is entered at 113-15. Also consistent with this same ideathe zero-order correlations of E% and D% with residual time scores are nega-tive and decrease over trial blocks. [For E%, r = -.58, -.49, and -.30; forD%, r = -.52, -.45, and -.29.]
As shown in table 5, a complementary situation exists with respect torelationships between task indices and error scores. That is, no relationshipexists early during acquisition, but strong relationships emerge toward theend of training. By the middle of training, AA%, MAIN, and D% are signifi-cantly correlated with the mean number of errors being made (R = .896, p < .01).AA%, MAIN, and D% individually, however, have non-significant zero-order corre-lations with residual error scores at this time point (i.e., r = -.57, -.08,-.42). During the final block of trials the relation between indices and errorscores is still significant (R = .875, p 4: .01). The mixture of related indiceshas changed, however. MAIN and D% have been replaced by CONT and DEI, whileAA% is still present, as it is in five of the six analyses. The zero-ordercorrelations of AA%, CON?, and DEI with residual errors are r = -.SS, -.10, and-.50 respectively.
More generally, both sets of data show that task indices of the type em-ployed in the present study can be related to learning or performance criteria.The strength of_the obtained relationships suggests that it may be possible touse task index information to predict training criterion levels.
TRANSFER. The basic criterion data for the pilot transfer study are shown infigures 10 and 11. In each case either mean performance time (figure 10) ormean number of errors (figure 11) is plotted as a function of trial block withtask configuration used during acquisition as the parameter. The ten transfertrials actually administered have been collapsed into five blocks. Therefore,each point in these figures represents an average value for ten scores.
In both figures the results are expressed in terms of performance on themedium-all task. In each case six different plots are shown. Two of theseare used as frames of reference. The first portrays performance of the medium-all group during the first portion (trials 1 to 10) of the acquisition session.The second plot shows the performance of this same group during the later,transfer session. All groups rested for one-half hour between acquisition andtransfer sessions. The remaining four plots portray performance on the medium-,all task during the transfer session, after practice was given on interpolatedtasks during acquisition.
29

250
200
ISO
100
SO
NAVTRADEVCEN 71-C-0059-1
Medium, All (Acquisition)
Medium, All (Transfer)
Simple, None
Simple, NoneEmbedded in Medium
Simple, AllEmbedded in Medium
Simple, AllEmbedded in Complex
T1-2
T3-4 S-6
T7-8
T9-10
Blocks of Trials
Figure 10. Mean performance time as a function of trial blockduring transfer to medium-all task.
30

NAVTRADEVCEN 71-C-0059-1
7.0
5.0
Medium, All (Acquisition)
Medium, All (Transfer)
Simple, None
Simple, NoneEmbedded in Medium
Simple, AllEmbedded in Medium
Simple, AllEmbedded in Complex
4.0
3.0
T1-2
T3-4 S-6
Blocks of Trials
T7-B T9-10
Figure 11. Mean errors as a function of trial block during transferto medium-all task
31
NAYTRADEVCEN 71-C-0059-1
In figure 10, the medium-all subjects provide an extremely clean base-line in performance time against which the other functions may be viewed.Performance time for this group is apparently at asymptote and clearly rep-resents an improvement over the times achieved during acquisition. The inter-polated task groups show a slight reduction in performance time during transfer,but across all blocks are slower than the medium-all (transfer) group (p < .05).Even more interesting, perhaps, is the fact that the interpolated groups aresignificantly faster than the medium-all ac uisition ou only at the firsttwo blocks (p 4:.05). Thereafter the interpo ate task and medium-all acquisi-tion data are indistinguishable. This is in spite of the fact that the inter-plated 'groups have, by the third block, had 3.5 times as much practice on set-up consoles.
The breakout due to embedding which occurs during acquisition is not ob-tained in the transfer time data. Furthermore, there is only the barest hint .
of a difference in performance time during transfer due to interpolated tasktype.
The error data shown in figure 11 show a slightly different set of re,-lationships. The baseline mean number of errors for the medium-all group issomewhat variable, though approaching what appears to be an asympcote. Again,there clearly are lower numbers of errors made by this group during transferthan during acquisition. As in figure 10,.there is no suggestion of an effecton errors made due to task embedding.
Particularly noteworthy, however, is the evidence for a task-type effectupon error scores which was not so clearly seen in the time data. The simp:e-none tasks have significantly fewer mean errors than the medium -all acquisitiongroup only at the first block (p < .05). Significantly fewer mean errors areassociated with simple-all tasks, relative to the medium-all acquisition group,on all but the last block of trials (p < .05). Conversely, the simple-allgroups have significantly fewer errors than the simple-none task across thefirst three blocks of trials (p <:.05).
Considered jointly, the pilot data presented in both figures suggest thatthe simple-all subjects can perform well during transfer with respect to accu-racy but that they pay a price in terms of speed. On the other hand, groupswhich were trained on more dissimilar trainers (simple-none groups) pay aprice in terms of both speed and accuracy.
FIELD FINDINGS
The basic ratio estimation data obtained during the field study are shownin Appendix G. In each of four tables, representing the set-up, detection,localization, and classification subtasks, four criterion estimates are shownacross training devices. Each datum represents the mean of instructors' con-sensus magnitude estimates relative to the values assigned to the standardsfor comparison. These standard values were arbitrarily set at 100, 50, SO,and 100 for the four types of criteria.
In any of the tables comprising Appendix G the first striking feature ofthe data is the difference in values across' columns. This is, of course, pri-marily due to the use of different standards of comparison (i.e., 100, SO, SO,
32

NAVTRADEVCEN 71-C-009-1
lnO). The estimation data within any column, however, do show appreciablevariability. On the set-L2 :ask (table G-1), for example, the first andfourth scales have ranges of S0 -390 and 50 -260, respectively. Although notas extreme, the second and third scales also show good variance. Finally, onall scales, mean estimates are obtained which lie both above and below the re-spective standard values. These aspects of the data suggest that the ratioestimation procedure which was employed apparently succeeded in spreading outestimates across devices. As in the laboratory, reasonable variance in thecriteria was a necessary condition for achieving any predictability.
Two additional types of variation are of interest in these data. First,consider the amount of variation, within any subtask and on any specific scale,for similar devices found at different locations. In many cases agreement isextremely good. In others it is not. On the training time scale for the set-up task (table G-1), for example, a fairi large difference between 0A1283stacks exists. The BQR -2B and 2C stacks, however, lead to amazingly similarjudgments.- A more thorough examination of these issues is underway, the de-tails of which are beyond the present level of analysis.
Another interesting variation is seen when one focuses on a specific de-vice and scale, and then looks across subtasks. But before subtasks can becompared, any differences between the standard task examples have to be re-moved. Toward this end, instructors in the present study scaled the detection,localization, and classification standards relative to the set-up standards.Based upon these data, averaged across all instructors, a set of weights wasderived for each subtask. The weights for the first two criteria are shown atthe bottom of the tables in Appendix G for each subtask. Using these weights,for'example, one would conclude that classification training time on the 14E3is almost seven times longer (212 x 1.81 = 384) than localization training(49 x 1.13 = 55). Since comparisons of this type were of interest in thepresent study, Weighted consensus scores were used in all subsequent analyses.Use of these transformed estimates also made a number of combinatory analysespossible.
In Appendix H, zero-order, product-moment correlation coefficients areshown in separate tables for each of the four subtasks. The coefficients de-scribe the relation between task indices and criterion estimates. Two featuresof the data are of interest. First, significant relationships between individ-ual criteria and indices are obtained and cut across all four subtasks. Second,for the most part, when a task index exhibits a significant correlation withone criterion, its correlations with the remaining criteria also tend to bestrong if not always significant. The redundancy among criteria implied bythis observation is confirmed when the intercorrelations among criteria areexamined. In all four subtasks, the correlations between estimated trainingtime and task difficulty range between r = .96 ani r = .84. Those for profi-ciency level and transfer lie between r = .92 and r = .96. The correlationsbetween training time and proficiency level estimates, while still significant,tend to be somewhat lower (i.e., r = -.67 to r = -.89). Because of this smallerredundancy, and because these two estimates were in a sense analogous to crite-ria employed in the laboratory, they alone were chosen for analysis. In thefollowing analyses (C1) denotes the training time estimate, and (C2) stands forthe proficiency level judgment.
33

NAVTRADEVCEN 71-C-0059-1
Finally in Appendix H, significant correlations are shown between theTA variable and the two criteria selected for analysis. TA represents thenumber of actions or responses comprising a task. In the flow charts examinedby the instructors it was possible to convert TA rather directly and perhapssuperficially into a concept of task length or difficulty. To reduce the im-pact of flow-chart length upon instructor estimates and to use data analogousto those analyzed in the laboratory, the regression adjustment procedure wasused again. The C1 and C2 data were transformed into residual scores foranalysis, thereby reducing that portion of criterion variance associated withTA. Resultant correlations between the remaining 16 task indices and the re-sidual criterion scores were greatly reduced.
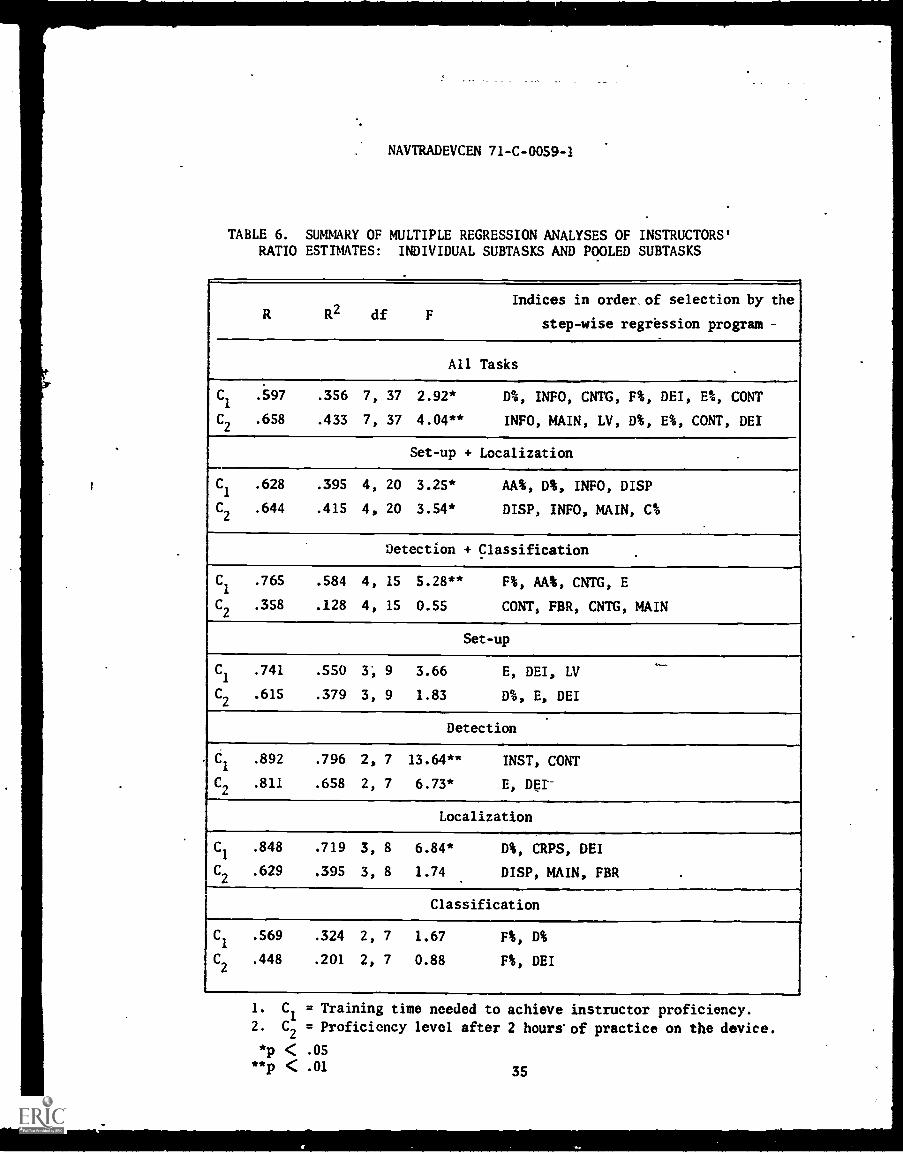
Results of the seven distinct regression analyses performed on the train-ing time (C1) and proficiency level (C2) residual data are summarized in table6. The column headingseire the same ashose previously used in reporting thelaboratory data (table 5). Four of the seven analyses are at the basic sub-task-level. The remaining three are combinatory and examine different poolingsof the subtasks. Set-up and localization are pooled because they seem to rep-resent cases in which the trainee interacts most directly with his stack, par-ticularly in making control settings and adjustments. The detection and classi-fication tasks are pooled because of their perceptual, signal processing flavor.At the highest level of analysis, all four subtasks are examined simultaneously.
In table 6 significant relationships are shown between selected task in-dices and the instructor ratio estimate criteria. These relationships are ob-tained in spite of the highly conservative procedure of using residual scores,a procedure which greatly reduced the zero-order correlations between predictorsand criteria. Significant relationships are established in all but two of theanalyses. The multiple correlations associated with the classification andset-up tasks are not significant by conventional standards (p4( .05). However,the fact that more than half of the variance is accounted for in the set-up(C1) analysis cannot be ignored (p4( .10).
One of the most interesting features of the data shown in table 6 is thatthe patterns of indices which contribute to significance change from subtaskto subtask and from individual subtasks to pooled subtasks. The DEI index,for instance, while related to both criteria in the overall analysis, does notfall out in the intermediate poolings. It does appear, however, at the single.task level. Similarly, AA%, which is one of the primary indices at the'inter-mediate level, disappears from the overall analyses. These shifting patternsimply that different index factors may be required, depending upon the subtaskunder examination.
34
NAVTRADEVCEN 71-C-0059-1
TABLE 6. SUMMARY OF MULTIPLE REGRESSION ANALYSES OF INSTRUCTORS'RATIO ESTIMATES: INDIVIDUAL SUBTASKS AND POOLED SUBTASKS
R R2 dfIndices in order of selection by the
Fstep-wise regression program
All Tasks
C1
C2
.597
.658
.356
.433
7,
7,
37
37
2.92* D%, INFO, CNTG, F%, DEI, E%, CONT
4.04** INFO, MAIN, LV, D%, E%, CONT, DEI
Set-up + Localization
C1
C2
.628
.644
.395
.415
4,
4,
20
20
3.25* AA%, D%, INFO, DISP
3.54* DISP, INFO, MAIN, Co
Detection + Classification
C1
C2
.765
.358
.584
.128
4,
4,
15
15
5.28** F%, AA%, CNTG, E
0.55 CONT, FBR, CNTG, MAIN
Set-up
C1
C2
.741
.615
.550
.379
3,
3,
9
9
,....
3.66 E, DEI, LV
1.83 D%, E, DEI
Detection
C2
.892
.811
.796
.658
2,
2,
7
7
13.64** INST, CONT
6.73* E, DEI
Localization
C1
C2
.848
.629
.719
.395
3,
3,
8
8
6.84* D%, CRPS, DEI
1.74 DISP, MAIN, FBR
Classification
C1
C2
.569
.448
.324
.201
2,
2,
7
7
1.67 F%, D%
0.88 F%, DEI
1. C1
= Training time needed to achieve instructor proficiency.
2. C2
= Proficiency level after 2 hours' of practice on the device.
*p < .05**p < .01 35

NAVTRADEVCEN 71-C-0059-1
SECTION IV
DISCUSSION
In thissection the results which have been detailed in Section III aresummarized separately for the laboratory and the field. The significance ofthese results for task quantification and performance prediction is then dis-cussed. Finally, major conclusions and implications for future research aredrawn.
PREDICTION OF SET-UP TASK SKILL ACQUISITION
The results of the laboratory acquisition study generally showed wide var-iation in performance as a function of task/trainer configuration, variationswhich were at least intuitively systematic. Furthermore, the systematic spreadsin performance, established early in training, were generally maintained through-out acquisition. This is particularly significant because performance tendedto reach stable, asymptotic levels toward the end of acquisition. Finally,regression analysis demonstrated a substantial amount of significant correla-tion between the- task indices and performance.
The predictability which was obtained is all the more significant becausethe prepotent effects of total actions (TA) were statistically eliminated.This predictability was also obtained in spite of a number of sources of errorvariation which were not dealt with to our complete satisfaction. These in-cluded variations due to.subjects, variations due to the use of two experiment-ers, and restrictions in the ranges of some of the index values. For example,DE1 for the field devices ranged from 10 to 500 X 10-4. In the laboratory weobtained a range of S to 21 X 10-4. This restriction may have accounted inpart for the somewhat different patterns of predictors which emerged from thestep-wise regressions for laboratory and field. More comparable ranges of in-dex values may have increased the correspondence among the predictors.
The predictability obtained gains further significance because of itspresence (in some sense) throughout acquisition; i.e., ability to predict per-formance from task indices was more than a Block 1 phenomenon. Moreover, therewas some, though not perfect, consistency in the patterns of predictors whichemerged over time: E%, AA%, and D%, for example, were selected by the step-wise program at more than one block.
But, while predictability was possible throughout acquisition the relation-ship between type of predictability and phase of training was not a simple one.A significant multiple R was .obtained early in training using the time crite-rion, but later in acquisition, significance was obtained with the error cri-terion. A possible explanation for this pattern of modes of predictability isthat all the devices were equally error prone on $lock 1 (i.e., T1_2), but thatdifferential elimination of errors occurred by Block 7 (i.e., T11_15). Differ-ential elimination of time effects is also possible, of course, but appearsless likely. It was apparent to the experimenters during data collection thaton more complex devices, subjects tended to rush through long sequences ofcalibration type responses with attendant carelessness in setting controls orreading displays.
36

'NAVTRADEVCEN 71-C-0059-1
The results of the acquisition study have a number of implications.'.First, they support the feasibility of differentiating set-up performance onsonar type stacks by manipulating panel design. Such differentiation iscritical if any predictability from task indices is going to be possible.They suggest further that it is, in fact, possible to relate such performanceexplicitly to design parameters, even when those parameters are purged ofeffects of variables which are prepotent, but of trivial interest.
The implication of removing TA, eliminating most of the zero-order corre-lation, and still obtaining significant multiple correlations is that the mul-tivariate approach is essential; i.e., individual task indices did not appearcapable of predicting perfOrmance on our training devices. Rather, collectionsof indices, with perhaps specific, but as yet, unidentified patterns of features,are crucial. Moreover, there is some hint in the results that these patternsmay depend upon training stage, though some indices did appear to occur ratheroften.
In addition to implying that predictor patterns may vary with stage oftraining, the results also imply that criterion patterns may be similarly in-fluenced. Thus, the designer may have to ask--not whether indices relate totraining effectiveness, but what patterns of indices relate to what criterionof effectiveness at what stage of training. This is a question which thepresent research cannot answer.
An interesting sidelight is provided by the ordering effect due to embed-dedness. This effect implies that there may be value in using overlays totrain the set-up task, much in the same way that overlays are used to teachanatomy or to facilitate the performance of an assembly line, electronics in-spector. Through such a device, small sets of related details can be presented,while other immediately unrelated details are held back temporarily. Giventhat embeddedness does, in fact, substantially retard training of set-up tasks,it would be of interest to determine whether the use of successive overlays canimprove this training.
PREDICTION OF SET-UP TASK TRANSFER OF TRAINING
The transfer study was a pilot effort to relate some specific design vari-ations to transfer of training from a "simple" device to a more complex device.This might have a very approximate parallelism to training'on a synthetic de-vice in the school setting and then going to a specific stack in the field.
The particular configurations which were used reflected increasing valuesof embeddedness, as reflected in DEI, and increasing numbers of total actionsneeded to complete the task, as reflected in TA and DEI. Here TA was not atrivial variable because, unlike the case for acquisition, TA (on the acquisi-tion task) did not directly affect performance on the task being measured (thetransfer task).
The results were encouraging because there was an intuitively systematicordering of the configurations on Block T1 ..2 of the transfer session. Whiletrue for both speed and accuracy of /performance, it was particularly strikingin the latter case. Error was proportional to the distance (along a similar-ity dimension) between interpolated and transfer tasks. This ordering, wassupported by correlational analysis of DEI and TA which showed significance
37
NAVTRADEVCEN 71-C-0059-1
at p < .05. These results suggest that it may very well be feasible to pre-dict transfer effects from quantitative indices. Emphasis, of course, hasto be placed on the word suggest, since we intended here only to obtain somepilot information. The small number of cases can, at best, only provide en-couragement for pursuing this line of investigation in a more rigorous fashion.
With respect to the time criterion, results showed that the interpolatedgroups (i.e., the "simple" groups) never caught up with the group originallytrained on the medium-all device. They lagged in performance speed during theentire transfer session. This suggests that operators trained on syntheticdevices and then transferred to field stacks might pay a price in speed, whichis not readily mitigated, though conceivably they could attain a satisfactorylevel of accuracy. Herein lies another very interesting and pragmatic line ofinvestigation.
PREDICTION OF JUDGED TRAINING EFFECTIVENESS
The extent of correspondence between results obtained in the laboratoryand results obtained in the field was substantial and very encouraging. Thisis particularly so, given the expected softness of the field estimation data.
First, the success obtained in the laboratory in generating performancevariation across devices was continued in the field. Mean estimates of trainer"effectiveness" showed wide dispersion across the 13 field stacks which werestudied. In particular, the set-up and localization tasks generated wide var-iance. While performance variability was not as great for detection and class-ification, it was nonetheless substantial.
When the ratio estimate data were scaled for effects of standard task dif-ficulty, it was seen that there was considerable variation across subtasks,within devices as well as across devices. This finding, coupled with resultsof the regression analysis, supports the contention that device effectivenessmay depend very heavily on the manner in which the device is used. That is,it may not be feasible to talk about the effectiveness of a training device ingeneric (i.e., figure of merit) terms, but only in terms of the use to whichthe device is being put (i.e., in training specific subtasks). Thus, we canextend a prescription stated earlierthe designer may have to ask what pat-terns of indices relate to what criteria of effectiveness at what stage oftraining for which subtask.
Second, correlational support for the indices was obtained. Relationshipsbetween task indices and judged device "effectiveness" worn demonstrated,though not for all the subtasks. Unfortunately, one of the subtasks not in-cluded among the significant correlationsset upwas of primary importancehere, since it provided the only generalization test of successful predictionin the laboratory. Therefore, comparisons between the field and laboratorymust be made with due caution.
Some correspondence was obtained between the patterns of indices whichwere selected by the regression program for the field data and for the labora-tory data. DEI and D% were common to and prominent in both field and labora-tory set-up. The E index was selected by the regression program for field set-up, while E% was selected for the laboratory set-up. The AA% index was
NAVTRADEVCEN 71-C-0059-1
prominent in the laboratory, but did not appear at all for field set-up. The
discrepancies may have in part occurred because many of the indices are dif-ficult to reflect in the types of flow chart used in the field. The E% index,for example, directly measures the amount of "clutter on a panel"; i.e., dis-plays and controls which are not used for a particular subtask. Though theinstructors were thoroughly familiar with their devices, they did work fromflow charts rather than from the actual device and may not have considered suchfactors as E%. The AA% index reflects looping behavior, and similarly may nothave been fully appreciable from the flow charts. In view of these methodolog-ical problems, it was gratifying to find as much correspondence as did appear.
While it was possible to demonstrate validity for patterns of predictors,
those patterns were not uniform acruss subtasks just as the patterns were notentirely uniform across time in the laboratory work. For example, while DEIentered into the regression for both localization and detection, it entered fordifferent criteria. And other than DEI there was no index which was common toboth localization and detection. When either of these subtasks was pooled, analmost completely different pattern of predictors emerged. Somewhat consistentwith the laboratory data and the statement made earlier concerning variabilityacross subtasks, these facts would appear to indicate that different patternsof predictors; i.e., different "factors" are.needed depending upon the partic-ular use to which the trainer will be put. They also suggest the possiblefruitfulness of a factor analysis of the predictor and criterion data.
CONCLUSIONS AND IMPLICATIONS FOR RESEARCH
The current research effort has supported the feasibility of relating quan-titative indices of equipment design to performance, at least for the restrictedset of indices and trainer stacks examined in the present study. The effdrt hasalso supported the feasibility of predicting transfer effects from equipment de-sign indices. Moreover, this predictability has been demonstrated for sets ofindices corrected for the effects of a prepotent but trivial factor and has beenshown to be more than a transient event.
Clarification of the specific meaning of the data and development of apractical methodology require further research. In general, the followingefforts appear warranted:
a. Results of the present laboratory and field work need to begeneralized to other classes of trainers. This includes de-termining the applicability of the current set of indices toother devices. An attempt is also required, ifpossible, tovalidate the laboratory results in the field based on traineeperformance data.
b. Judgments obtained in the field via opinion sampling should bevalidated against actual performance measurement.
c. Relationships between quantitative indices and transfer of train-ing require more rigorous investigationet least in the labora-tory, but preferably under field conditions also.
39

NAVTRADEVCEN 71-C-0059-1
d. Effects of individual differences and conditions of train-ing need to be interwoven with effects of training taskvariation.
Subsequent phases of this program will deal with one or more of the issuesraised above.

NAVTRADEVCEN 71-C-0059-1
REFERENCES
Fowler, R. L., Williams, W. E., Fowler, M. G., G Young, D. D. An investigationof the relationship between operator performance and operator panel layout forcontinuous tasks. Report No. AMRL-TR-68-170, December 1968. Aerospace MedicalResearch Laboratory, Wright-Patterson Air Force Base, Ohio.
Siegel, A. I., Miehle, W., & Federman, P. Information transfer in display-control systems. VI. A manual for the use and application of the displayevaluative index (Sixth Quarterly Report). Applied Psychological Services,1962, Wayne, Pennsylvania.
Wheaton, G. R., Mirabella, A., & Farina, A. J., Jr. Trainee and instructortask quantification: Development of quantitative indices and a predictivemethodology. Report No. NAVTRADEVCEN 69-C-0278-1, January 1971. Naval Train-ing Device Center, Orlando, Florida.
41

NAVTRADEVCEN 71-C-00594
APPENDIX A
SQS-26CX Set-up Subtask Operations Flow Chart
42

Turn Main
Power Sw
On 0
Check
Set PPI/B-
Read
Power On
Scan Range
Cursor
Ind
Scale Control
Range
Check
B-Scan
Cursor
Brightness
33
la
Check
B-Scan
Stern
Cursor
Brightness
Good Cursor
g:
3clght
Bright?
re
Turn PPI
Cursor
On
33Good
37
Set Pulse
Length
Control
<RS
Ada Cur-
>RS 1 sor Range
Enter Surface
,Sound Velo-
city (low)
.--17-ersor
j Stern
ou
01
r:ght
rs
Check PPI
Cursor On
Ind
19a
Range
Mange
tt
Scale?
37
I
Check B-Scan
Brightness
& Contrast
33
Good
P4Adi Zto-
°lag Tuber
rioo g & c
I22
23
Check
B -Scan
B & C
Check
B-Scan
2,8
Enter Surface
Set Sus/
Check
33Sound Velo-
Diff Sv
S/D Ind
city (101)
to Sum
for' Sum
Stern
Cursor
Bright?
33
Check PPI
Sweep
Brightness
Check PPI
Cursor
Brightness
12
Good
12
r e
op Adj
Sweep
os
Adj
0r 1
Br t Bri
.4 t?
I'Bri
I
-12
Gond
Check PPI
Stern Cursor
Brightness
12
Cursor 01 iltd
t? °I
rle
r
12
18a
Good
Check PPI
Contratt
& Gain
12
Adj PPI
PPI
Co
Fern 12
o o rI 1.
Good
)2
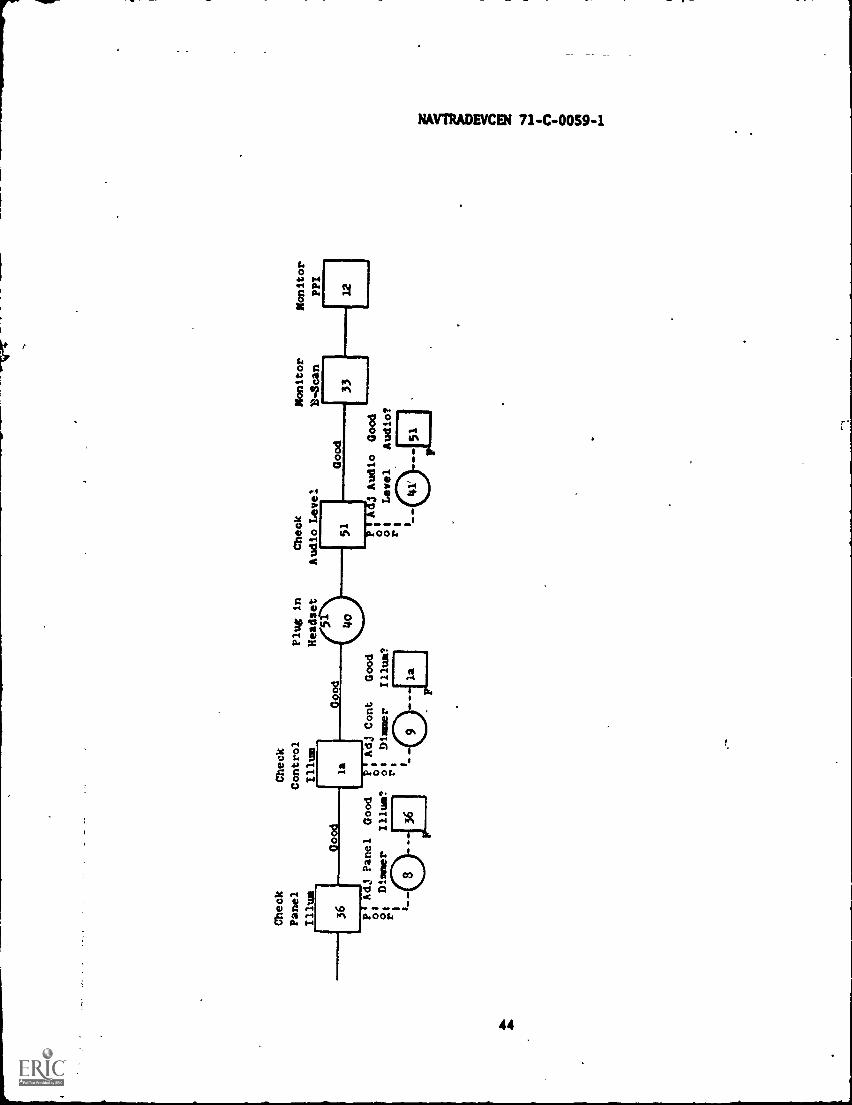
Check
Panel
Ileluu
36
Check
Control
Ilium
Good
la
Good
-71-117,1 Panel Good -15-11-Vij Cont
l
of
Dimmer
Ilium?
o os Dimmer
:136
rI
r
Plug in
Headset
4510 )
Good
Ilium?
Check
Audio Level
51Good
NU
+
Monitor
P. -Scan
33
PI Ad4.1 Audio Good
ol
ol
Level
Audio?
rS
Monitor
PPI
1 12
1

NAVTRADEVCEN 71-C-0059-1
APPENDIX B
Task Characteristic Index Values for Trainee
Subtasks Evaluated in the Field
45

NAVTRADEVCEN 71-C-0059-1
TABLE B-1. TASK CHARACTERISTIC INDEXVALUES FOR SONAR SET-UP TASKS
=1,Task indicesDevice
MAIN CNTG TA CONT DISP E
21B553 24 15 39 . 16 6 22 2S00.2 62 94
LV M% F%
21A39/248 12 60 17 6 23 2927.8 46 860A1283
2185527 6 33 1.5 10 25 2616.7 78 95BQR -2B
21A39/226 9 35 11 11 22 2399.9 67 82BQR-2.0
21A39/230 17 47 14 13 27 3149.9 66 62BQR -7B
14A2C12S 4 29 17 7 24 2466.7 84 100SQS-23B
X14A217 12 29 15 5 20 2040.0 69 92SQS-23 (TRAM)
14E323 17 40 15 10. 25 2740.0 67 95SQS-4
14E1426 14 40 1S 11 26 2933.6 72 97SQS-4
SQS-26CX 24 24 48 20 8 28 2799.8 S7 95
1481041 5 46 19 6 25 2731.6 58 80AQS-13
14831851 38 89 18 S 23 3680.3 39 93AQA-I
148318112 7 119 22 S 27 4369.9 34 67ASA-2G
46

NAVTRADEVCEN 71-C-0059-1
TABLE B-1. TASK CHARACTERISTIC INDEXVALUES FOR SONAR SET-UP TASKS (Cont)
Task indices
-Device DEIx10-1 D% C% E% CRPS FBR INFO INST
21B55
0A1283
21A39/20A1283
21B55
BQR-2B
21A39/2BQR-2C
21A39/2BQR-7B
14A2/C1SQS-23B
X14A2SQS-23 (TRAM)
14E3SQS-4
14E14SQS-4
SQS-26CX
14E10
QS-I3'
148318
23.10 67 84 79 19 10 10
26.84 67 85 79 30 24 6 1
25.07 62 65 64 17 10 6
65.53 85 61 71 14 10 11 0
25.23 81 58 68 19 10 18 0
32.23 33 65 51 18 6 5 4
16.51 28 54 44 15 6 8
35.98 83 75 78 18 12 10
37.57 85 58 67 17 11 12
03.78 29 63 47 20 15 13
14.43 67 8S 78 27 9 10
QA-110.04 83 62 66 42 31 16
14831B25.20 45 100 82 72 32 15
:3A-20
47

NAVTRADEVCEN 71-C-0059-1
TABLE B-2. TASK CHARACTERISTIC INDEXVALUES FOR DETECTION TASKS
Device
MAIN CNTG TA
Task indices
CONT DISP E LV AA% P%
21115521 4 25 3 3 6 1883.3 69 00A1283
21115528 2 30 2 5 7 2000.0 60 0NR-213-
21A39/215 3 18 2 5 7 983.3 46 0BQR-2C
21A39/219 3 22 2 5. 7 1216.7 .46 0BQR-7B
14A2/C1 11 9 20 3 4 7 1053.4 43 0SQS-23D
X14A2 21 4 25 4 2 6 1354.1 43 0SQS-23 (TRAM)
14E3 3 4 7 3 2 5 399.9 43SQS-4
14E14 21 4 25 3 3 6 998.2 24 0SQS-4
SQS-26CX 5 2 7 2 3 5 399.9 43 . 014E10AQS-I3 10 10 20 7 2 9 1057.3 46 0
48

NAVTRADEVCEN 71- C- 0059 -1
TABLE B-2. TASK CHARACTERISTIC INDEXVALUES FOR DETECTION TASKS (Cont)
Task indicesDevice DEl
x10-4 D% C% E% CRPS FBR INFO INS1
21B55 234.04 33 15 27 12 3 10 60A1283
21B55 62.26 31 8 17 7 5 18 1
BQR-2B
21A39/2 48.21 38 11 23 4 3 11 0BQR-2C
21A39/2 61.34 31 8 17 5 3 14 0BQR-7B
14A2/C1 28.68 20 12 15 6 4 10 0SQS-23B
X14A2 55.46 22 7 13 7 5 13 0SQS-23 (TRAM)
]4E3 61.28 17 15 16 3 2 2 0SQS-4
14E14 29.73 23 12 15 7 5 13 0SQS-4
SQS-26CX 594.23 11 6 8 2 0 5 0
14E10
AQS-1320.66 22 29 27 9 3 8 0
49

NAVTRADEVCEN 71-C-0059-1
TABLE B-3. TASK CHARACTERISTIC INDEXVALUES FOR LOCALIZATION TASKS
Task indicesDevice
MAIN CNTG TA , CONT DISP E LV AA% F%
21BSS
0A1283
211155
BQR-211
21A39/2BQR-2C
B21A39/2QR-7B
14A2/C1
SQS-23B
X14A2
SQS-23 (TRAM)
14E3
SQS-4
141114
SQS-4
SQS-26CX
14E10AQS-13
14B31B
AQA-1
14B31B.ASA-20
25 10
36 8
19 12
6 9
11 20
11 0
S 2
14 4
14 9
17 7
36 21
30 14
35
44
31
15
31
11
7
18
23
24
57
44
5
8
4
2
6
4
3
5
5
6
7
11
5
8
5
5
4
4
2
4
6
4
6
6
10
16
9
7
10
8
5
9
11
10
13
17
2116.2
2155.7
1263.4
600.0
1395.5
700.0
399.9
1000.0
. 1414.4
1334.4
2481.3
2224.5
56
45
31
28
38
58
43
49
57
50
38
47
51
60
32
29
67
91
50
100
92
75
60
58
50

NAVTRADEVCEN 71-C-0059-1
TABLE B-3. TASK CHARACTERISTIC INDEXVALUES FOR LOCALIZATION TASKS (Cont)
Device DEJ
x10-4 D% C%
Task indices
E% CRPS FBR INFO INST
21B55111.69 56 26 36 14 8 13
0A1283
21B55 37.28 50 33 40 18 7 19 0BQR -2B
21A39/2 25.85 38 22 29 10 4 17 0BQR -2L
21A39/ 2" 43.80 31 8 17 3 3 9 0BQR-7B
14A2/C1 35.23 20 23 22 14 6 11 0SQS-238
X14A2 38.44 22 14 17 4 2 5 0SQS-23 (TRAM)
14 E3 48.10 17 15 17 3 2 2 0SQS-4
14E14 27.38 31 19 23. 6 4 8 0SQS-4
SQS-26CX 37.E0 21 16 19 9 5 9 0
14E10
AQS-13 26.60 44 26 31 8 7 9 0
14831BAQA-1 15.56 100 24 37 21 9 27 0
14831BASA-20 17.73 SS 50 52 19 10 15 0
51

NAVTRADEVCEN 71-C-0059-1,
TABLE 8-4. TASK CHARACTERISTIC INDEXVALUES FOR CLASSIFICATION TASKS
De vice
MA114 CNTG TA
Task indicos
CONT DTSP E IN AA"..
21855 6 0 6 2 2 4 400.0 50 750A1283
211355 6 0 6 2 2 4 300.0 25 75130-213
21A39/2 8 0 8 2 4 6 500.0 53 100130-2C
21A39/2 12 0 12 3 3 6 850.0 64 50BQR-713 _
14A2/C1 12 3 15 2 2 4 1120.0 62 61SQS-2311
X14A2cne 17 (PDALI)
10 11 21 6 4 10 1133.3 48 52
14E3 13 6 19 4 4 8 1016.8 46 91SQS-4
14E14 5 0 5 1 2 3 .400.0 60 26SQS-4
SQS-26CX 15 5 20 2 4 6 1311.3 57 68
14E10
AQS-13 8 1 9 4 2 6 466.7 40 100
1
52

NAVTRADEVCEN 71- C- 0059 -1
TABLE B-4. TASK CHARACTERISTIC INDEXVALUES FOR CLASSIFICATION TASKS (Cont)
Device DEI
x10-4 - Dt 1:96
Task indices
Et CAPS FBR INFO INST
21B55 273.86 22 10 14 '2 0 4 0
0A1283
21B55 49.93 12 8 10 2 0 4 0
BQR-2B
21A39/2 48.04 .31 11 19 2 0 6 0
BQR-2C
21A39/2 123.40 19 12 15 4 0 8 0
BQR-7B
14A2/C1 91.51 10 8 9 7 0 8 0
SQS-23B
X14A2 18.75 22 21. 22 7 5 9 0
SQS-23 (TRAM)
14E3 3.60 33 20 25 7 3 9 0
SQS-4
14E14 342.33 15 4 8 1 0 4 0
SQS-4
SQS -2GCX 16.50 14 6 10 4 3 13 0
14E1026.70 22 17 18 4 1 4 0
AQS-13
53

NAVTRADEVCEN 71-C-0059-1
APPENDIX C
Operations Flow Chart for the Complex-All
Synthetic Setup Task
54
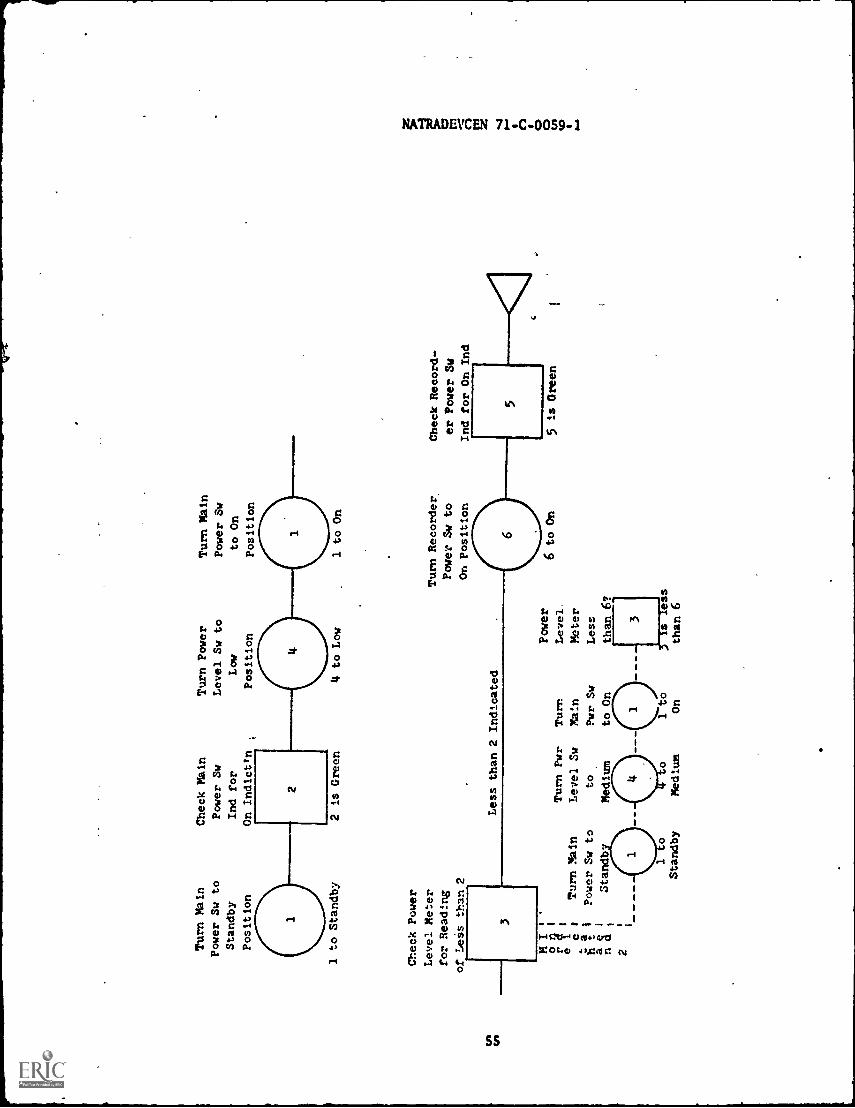
Turn Main
Check Main
Turn Power
Turn Main
Power Sw to
Power Sw
Level Sw to
Power Sw
Standby
Ind for
Low
to On
Position
On Indict'n
Position
Position
1 to Standby
Check Power
Level Meter
for Reading
of Leis than 2
3
2
2 is Green
4 to Low
Less than 2 Indicated
1 to On
Turn Recorder,
Power Sw to
On Position
M I
o n 1
r a /
eC t /
asn 2!
Turn Main
Power Sw to
Standb-
Power
Turn Pwr
Turn
Level.
Level Sw
Main
Meter
to
Less
Pwr Sw
Medium
to On
than 6?
3 1
1o
o1 to
Is less
Medium
On
than 6
Standby
6to
on
Check Record
er Power Sw
Ind for On Ind
5
5is Green
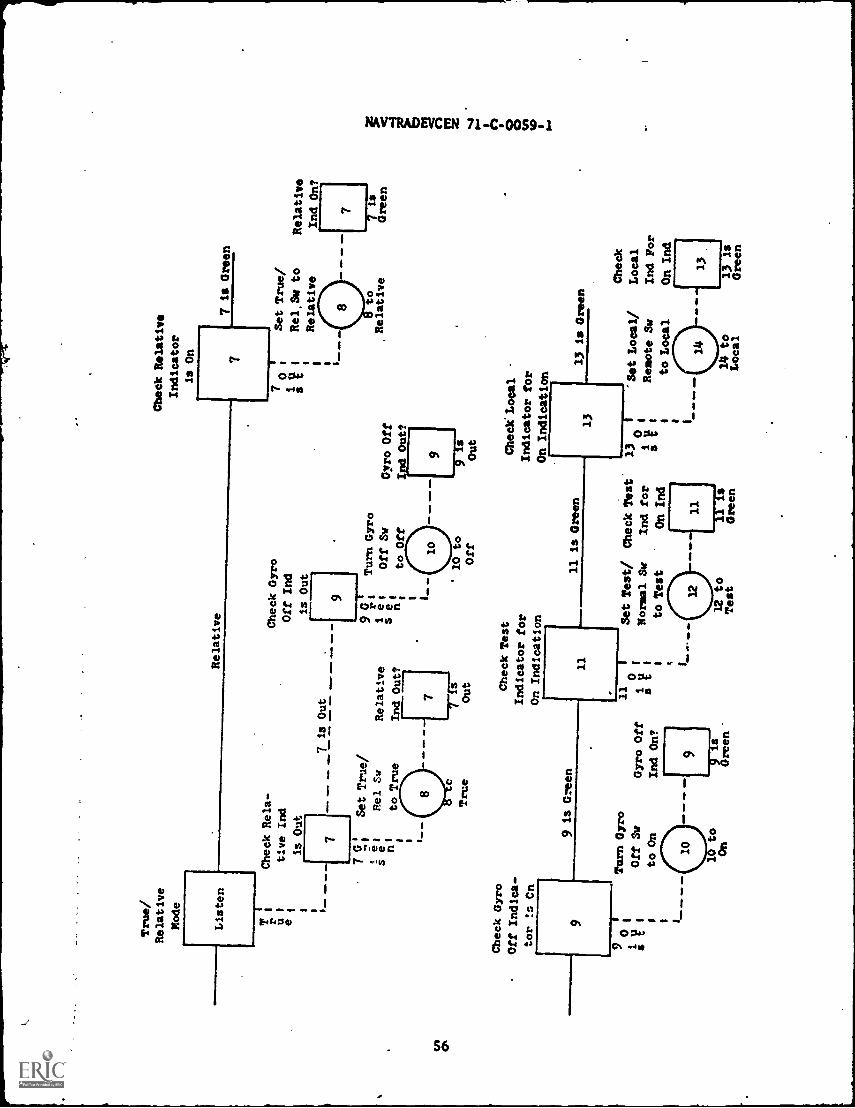
True/
Relative
Mode
Check Relative
Indicator
is On
Relative
7Listen
PU.,....t. U.,..1ft
ONAanle ftwie.n
..
_2
eu
Check Gyro
Off Indica-
tor !r. Cn
9
tive Ind
is Out
7
7 SI
,i el
s e nI
Off Ind
is Out
7is out
.....:
......
..
Set True/
Rel Sy
to True
9is Green
Relative
Ind Out?
Out
9 g
,Turn Gyro
sIee
Off Sw
to Off
I_
Check Test
Indicator for
On Indication
90
Turn Gyro
i V I
Off Sw
to On
On
Gyro Off
Ind On?
mow
mow
110 V
11 A
si V
Gyro Off
In Out?
'
10 to
Off
11 is Green
$Out
Check' Local
Indicator for
On Indication
Set Test/
Normal Sy
to Test
13
.
Check Test
130
1
Ind for
us s
On Ind
I
11
7is Green
t True/
Rel.Sm to
Relative
Relative
Ind On?
to
,Relative
13 is Green
"Set Local/
Remote Sw
to Local
Imo
.11.
MN
Local
IND
Check
Local
Ind For
On Ind
13'
13 is
Green

'Set Frequency
Sw to Low
PositiOn
30
30-to
Low
Check BDI
Meter for Null
Position
29
Set Frequency
Sw to High
Position
29 is Null
29 is'
Off
Null,
Adjust BDI
Low Frequency
Control
Check BDI
Meter for
Null Posi-
tion
Adjust 32
29
29 1.3 Null
30
30 to
Check BDI
Meter for Null
Position
2929
Is
Nul
l
Adjust BDI
High
29 1st
Off
High Frequency
Null'
Control
Set Test/
Check Test
Set Local/
Check Local
normal Sw
IndIcatcr
Remote Sw
Indicator
to normal
is Out
to Remote
IS Out
11
22
14
13
12 to
12 Is Out
14 to
13 is Out
Nornal
Remote
Chock BDI
Meter for
Null Posi-
tion
29
29 is Null
Adjust 31

Active/Passive
Set Active/
Set Xait
Check Xait
Mode
Passive Sw
Mode to
Th Indica-
Instruction
to KP
Molt Th
tor is On
Listen
Multiple Ping Mode
----TSet Active/
Listen
1 Passive Sw
Mode
1to Listen
1
Single
Ping
Mode
Set Track-
ing Mode
Sw to NIB
Set Search
Mode Sw to
Search
15 to
is ten
16 to MTB
18 to
Set A/P
Sw to SP
Search
Set Xait Mode
MCC
Sw to MCC Xait
Xmlt On?
22
5o
17 to
it Th
22 is Green
Set Search
Director
Mode Sw to
Indicator
Director
Ong
Set Search
Rode Sw
to Contact
18 to Contact
Search Sector
Instruction
Listen
All
7 20
---<°
213
4en
1.
Set
.Set Sector
Search
23 to All
Single ,
Sector
1Mode Sw to
Sector
of X
.
6* 1
Single
ctor
Sw
X'
Set Sector
Node em
to All 0
_IO
NE
. .11
1110
.1=
ron
. dm
. WM
,
23 to
thee
24 o X.
3ect4r
Range of
the Day
Liston
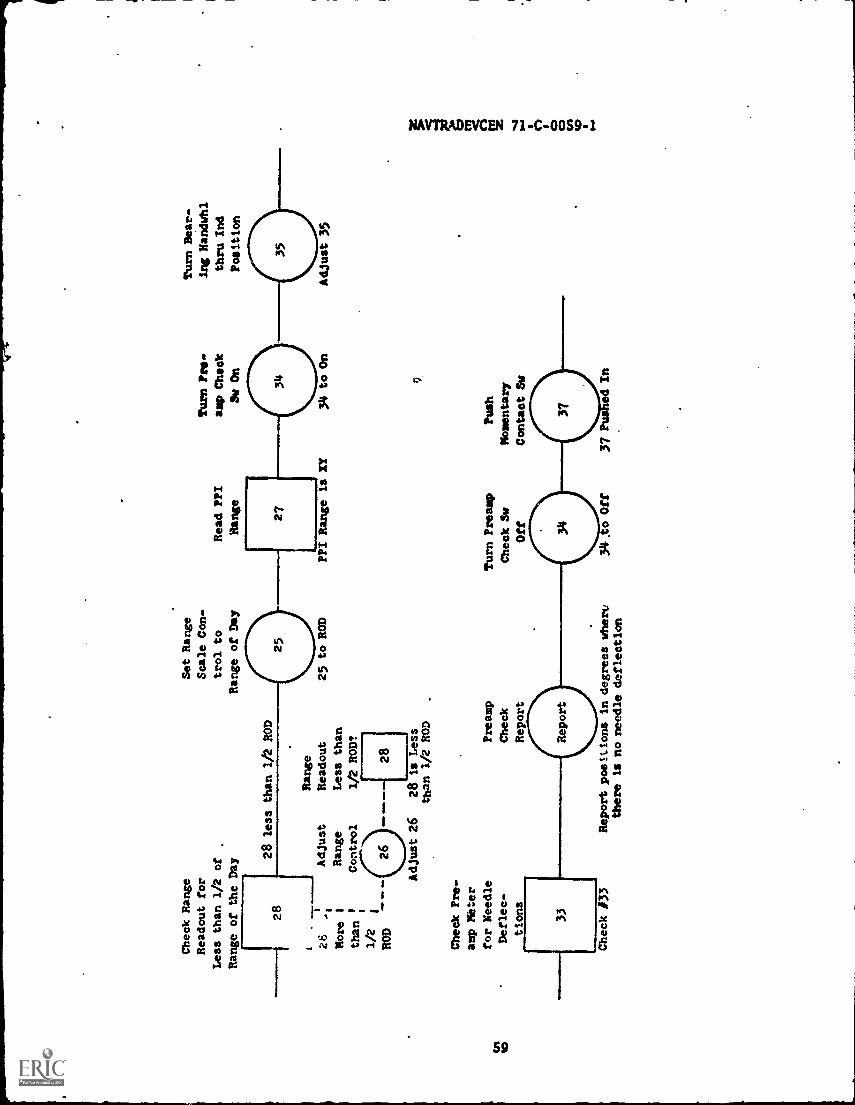
Check Range
Readout for
Less than 1/2 of
Range of the Day
I 28
More
than
1/2
ROD
28
28 less than 1/2 ROD
Set Range
Scale Con-
trol to
Range of Day
Adjust
Range
Control
Range
Readout
Less than
1/2 ROD?
28
Adjust 26
28 is Less
than 1/2 ROD
Check Pre-
amp Meter
for Needle
Deflec-
tions
33
Preamp
Check
Report
Read PPI
Range
Turn Pro
amp Check
9w On
Turn Bear-
ing Handwhl
thru Ind
Position
27
25 to ROD
PPI Range is XY
Turn Preamp
Check Sw
Off
)4 to On
Push
Momentary
Contact Sw
Check #33
Report positions in degrees whery
3k to Off
37
ed In
there is no needle deflection
Adjust 35
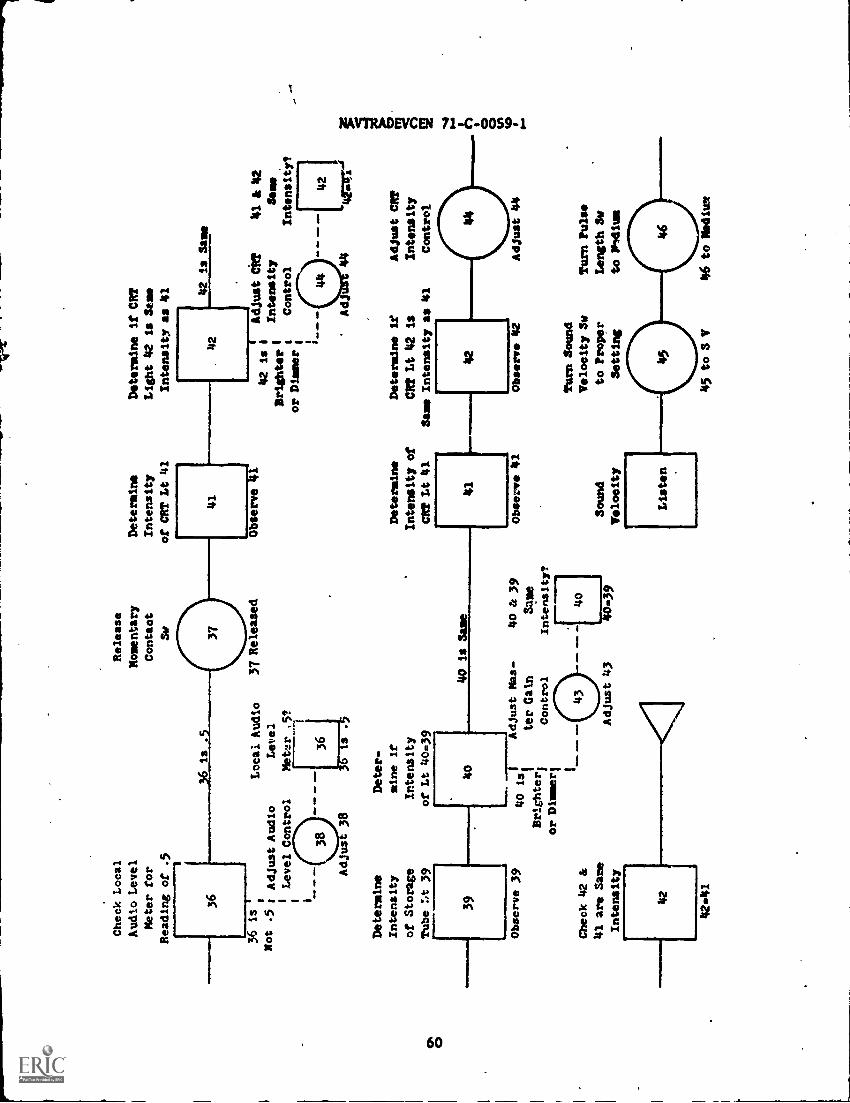
Check Local
Release
Audio Level
Momentary
Determine
Determine if CRT
Meter for
Contact
Intensity
Light 42 is Seas
Reading of
.5Sy
of CRT Lt 41
Intensity as 41
363615.5
36 is
Not .5 t Adjust Audio
ILevel Control
- -
--38
Adjuit 38
Local Audio
Level
Meter .5?
1
37
37Released
41
Observe 414
42
42 is Saes
ins TI
CRT
'` '111 ;
Intensity
DriShter
Control
or Diner
41 &
42
Sam
Intensity?
42
V.;(4
Determine
Deter-
Intensity
mine if
Determine
Determine it
Adjust CR?
of Storage
Intensity
Intensity of
CRT Lt
42is
Intensity
Tube Lt 39
of Lt 40=39
CR? Lt 41
Same Intensity as 41
Control
39
Observe 39
Check 42 &
41 are Sane
Intensity
42
4241
40
40 is Sane
40 is
Brighter'
or Dimmer
Adjust Ras-
ter Cain
Control
Adjust 43
40 es 39
Sam
eIntensity?
f40
40=39
4142
Observe 41
Sound
Velocity
Listen
Observe 112
Turn Sound
Velocity 3y
to Proper
Setting
Adjust 44
Turn Pulse
Length Se
to Pedium
45 to S V
46to Medium

Turn Dwell
Time Sw to
Medium (#3)
Turn Recorder
Freq Sw to
Open
47 to Medium
Determine if
PPI Brightness
Has Changed
MoO
lool
rom
53
4111
16
sit
51
g I
o al
Set Sum/
Diff Sw
to Diff
48
48 to Open
Determine
Brightness
of PPI
51
Observe 51
Turn D/E
Angle 3w to
Maximum
Set Sum/Diff
Sw to Sum
Check Sum
Indicator
Is On
50 to Sum
50 to Diff
Sum In-
dicator
Cut?
Ilm
i 401
. 49 is Out
49
52 to
Maximum
49 is Green
Check for
Own Ship
Own Ship
Speed
Speed Ind,
Listen
53
__13 is OK
;57701---lajust Own Own
Ship
Incorrecti
Ship Speed
Speed
Control
Ind?
s_
WO
40
Adjust 54
53 is OK
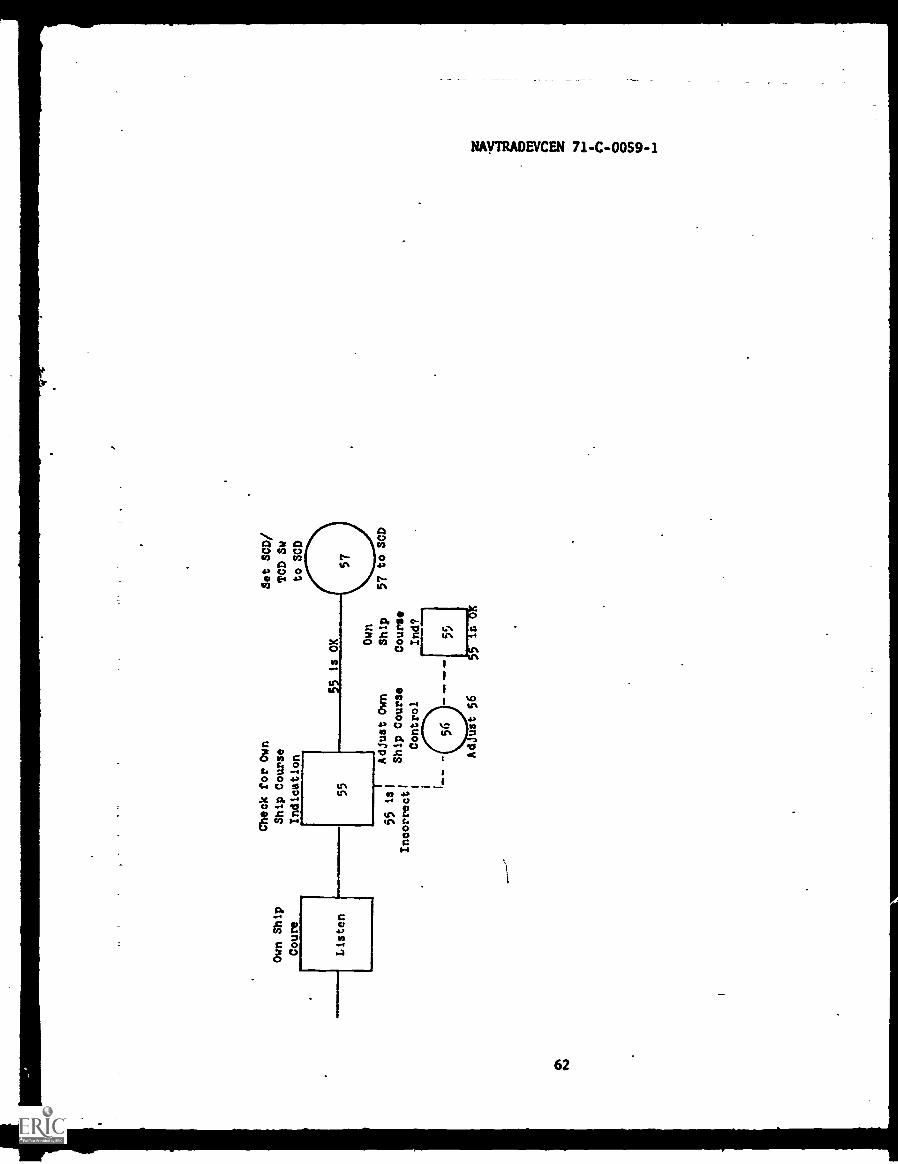
Check for Own
Own Ship
Ship Course
Coure
Indication
1
Listen
55
55 is OK
55 is,
Incorrect' I I I__
Adjust Own
Ship Course
Control
Adjust 56
Set SCD/
TCD Sw
to SCD
57
Own
Ship
57 to SCD
Course
Ind?

NAVTRADEVCEN 7I-C-0059-1
APPENDIX D
Instructions for Magnitude Estimates
63

NAVTRADEVCEN 71-C-0059-1
MAGNITUDE ESTIMATES
What we would like you to do today is to make four judgments about each
sonar subtask (the comparison task) which is performed on your device.
The four types of judgments are described below, together with some prac-
tice examples.
1. Relative to the case of the standard sonar subtask, how manymore or how many fewer units of practice would the average A-schooltrainee need on the comparison task in order to perform it as quick-ly and as accurately as the typical instructor?
[In order to do this in the case of the standard task, 100 unitsof practice are required.]
2. Relative to the case ofthe standard sonar subtask on which2 hours of practice was given, how much better or worse wouldthe average A-school trainee perform the comparison task afterthe'same amount of practice?
[Performance on the standard task after 2 hours of practice isat the SO level.]
3. If the degree of transfer of training from the training situ-ation to the operational situation is SO on the standard task,how much greater or less than 50 is it on the comparison task?
[The degree of transfer of training on the standard task is SO.]
4. Relative to the case of the standard sonar subtask, how muchmore or less difficult would it be for the average A-school traineeto learn to perform the comparison task?
[The difficulty in learning to perform the standard subtask is 100.]
Below are four practice examples. Please complete them now.
1. With respect to the first type of estimate described above, if you thoughtyour task required 2.5 times as much practice as the standard, what valuewould you assign?
2. With respect to the second type of estimate, if you thought traineeswould perform only one-third as well, what value would you assign?
64

NAYTRADEVCEN 71-C-009-1
3. rn the third type of estimate, what value would you assign if you thoughtthe degree of transfer of training on the comparison task was:
Twice as great relative to the standard
Half as great relative to the standard
At the same level as in the standard case
4. In the final type of estimate, what value would you assign if you thoughtthe comparison task was 1-1/2 times more difficult than the standard?
In making the estimates, remember:
Think in terms of our task descriptions rather than in terms ofhow you do or teach the task.
Make your judgments with respect to the overall task.
Remember to assign a value to your judgment which is some fractionor multiple "times" the value of the_standard.
65

t,
NAVTRADEVCEN 71-C-009-1
APPENDIX. E
Subtask Standard Flow Charts
66

Sonar Set-Up Task Standard
Set Recorder
Powr Sw On
Check
Powr On
Ind
Set Auxi-
liary Powr
Supply On
2
Check Chart
Ilium
Level
3AdJ
GOOD
1Panel
Dim Cont
POOR I
Check Auxi-
Set Tr:ick
liary Powr
ing Mode Sw
Supply Ind
to SC
Check Sg.: Ind
Check
Chart
Ilium
.1
Monitor
Headset
Turn Audio
Gain Up
......
Check Audio
Comfort
Level
12
Set Freq
Select Sw
to Low
Set Geo-
reference Sw
to True
Check True
Bear
Ind On
7
F Turn Audio
Gain
Full C-C
Turn Inter -
comm Gain
Full C-C
Adj
Audio
Check
Main
Powr On
21
Check BPI
Ilium
Level
22
POOR
e.__
GOOD
Check
Illum
F
AdJ BPI
Ilium
22
GOOD
0Set Audio
Filter to
Medium
Set Recycle
Rate Sw
to Fast
Plug in
Head-
set
Adj Inter-
Check
comm
Check
Audio
Gain
Audio
117
Check Pen
Deflection
3
Adj
Deflec
POOR1
Gain
L._
GOOD
Check
Def lee
Set BDI
Freq Sw
to Low
18
Check Gyro
Ind On
Monitor
Headset
17
19
Set Main
Powr Sw
On
Monitor
Chart
3
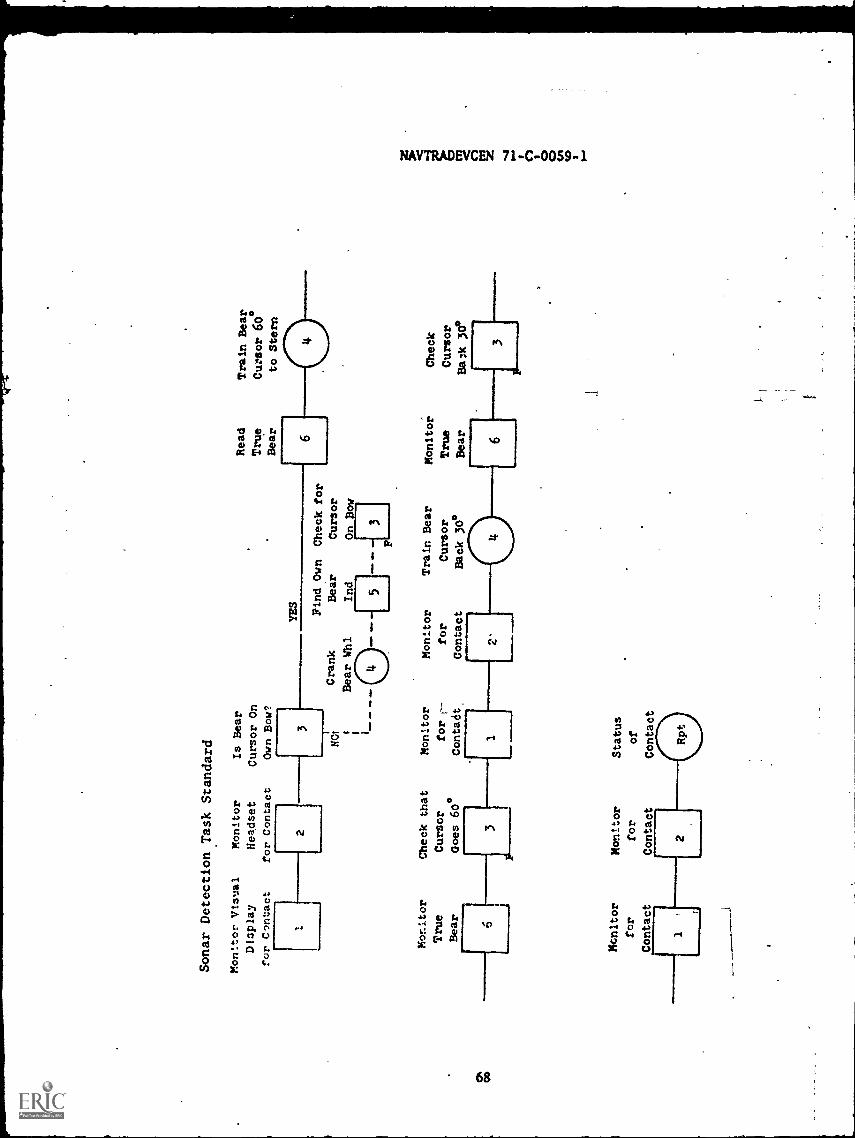
Sonar Detection Task Standard
Monttor Visual
Display
for Contact
Monitor
Headset
for Contact
Is Bear
Cursor On
Own Bow?
Read
True
Bear
Train Beag
Cursor 60
to Stern
2
Monttor
Check that
True
Cursor
Bear
Goes 60°
6131
Monitor
for
Contact
3YES
HOt
Monitor
for r-
Contadt.
1
Crank
Bear Whl
MO
D
Find Own Check for
Bear
Cursor
Ind
On Bow
3
6
Monttor
Train Bear
Monitor
Check
for
Cursor
True
Cursor
Contact
Back 30°
Bear
Bask 300
Monitor
Status
for
of
Contact
Contact
--a
6
j
3

so
Sonar Localization Task Standard
Finds
Moves Cursor
Checks
Strongest
to Strongest
Cursor
Part of Contact, Part of
on
on Display
Contact
Contact
Sets Punc-
Checks
Monitors
tion Sw
Targ
for
to Target
Contact
Change in
Contact
Ind
Contact
78
Reads
Cursor
Bear
3
NO CHANGE
1
Presses
Nev Data
CHANGE 1
But
Reads
Cursor
Range
4
Reports
Receives
Contact
Bearing
Bear &
Clear
Range
Into
6
Monitor
FOUL I
CLEAR
Monitors
Checks
Releases
Targ &
Moves
Cursor
ND
Cursor
Cursor
on Targ
Button
I
Asks if
Sets
Track Control
Function
Checks
Can be
Sw to
Track
Monitors
Transferred
Track
Ind
.Contact
,---___
Yes
Monitors
Tar
1
11
1
F1
co
Video
1
Monitors
Contact
1
- -
Monitor
Audio
6

Sonar Classification Task Standard
Monitor
Chang:
Monitor
Find
Read
Report
Audio
Audio
Audio
Bear
True
Targ
Cues
Filter
Cues
Cursor
Bear
Bear & Class
11
34
Monitor
Audio
r___--
1
Monitor
Video

NAVTRADEVCEN 71-C-0059-1
APPENDIX F
Ratio Estimate Answer Sheet
71

NAVTRADEVCEN 71-C-0059-1
NameTask
Type of Estimate
1. Relative to the case of thestandard sonar subtask, how manymore or how many fewer units ofpractice would the average A-schooltrainee need on the comparison taskin order to perform it as quickly andas accurately as the typical instruc-tor?
2. Relative to the case of thestandard sonar subtask on which2 hours of practice was given,how much better or worse wouldthe average A-school trainee per-form the comparison task after thesame amount of practice?
3. If the degree of transfer oftraining from the training situ-ation to the operational situationis 50 s.L the standard task, howmt.u.n greater or less than 50 isit on the comparison task?
4. Relative to the case of thestandard sonar subtask, how muchmore or less difficult would itbe for.the average A-school traineeto learn to perform the comparisontask?
72
Standard Value Your Estimate
100
SO
50
100

NAVTRADEVCEN 71-C-0059-1
APPENDIX G
.Mean Instructor Ratio Estimates for the Four Subtasks "i
trq
73
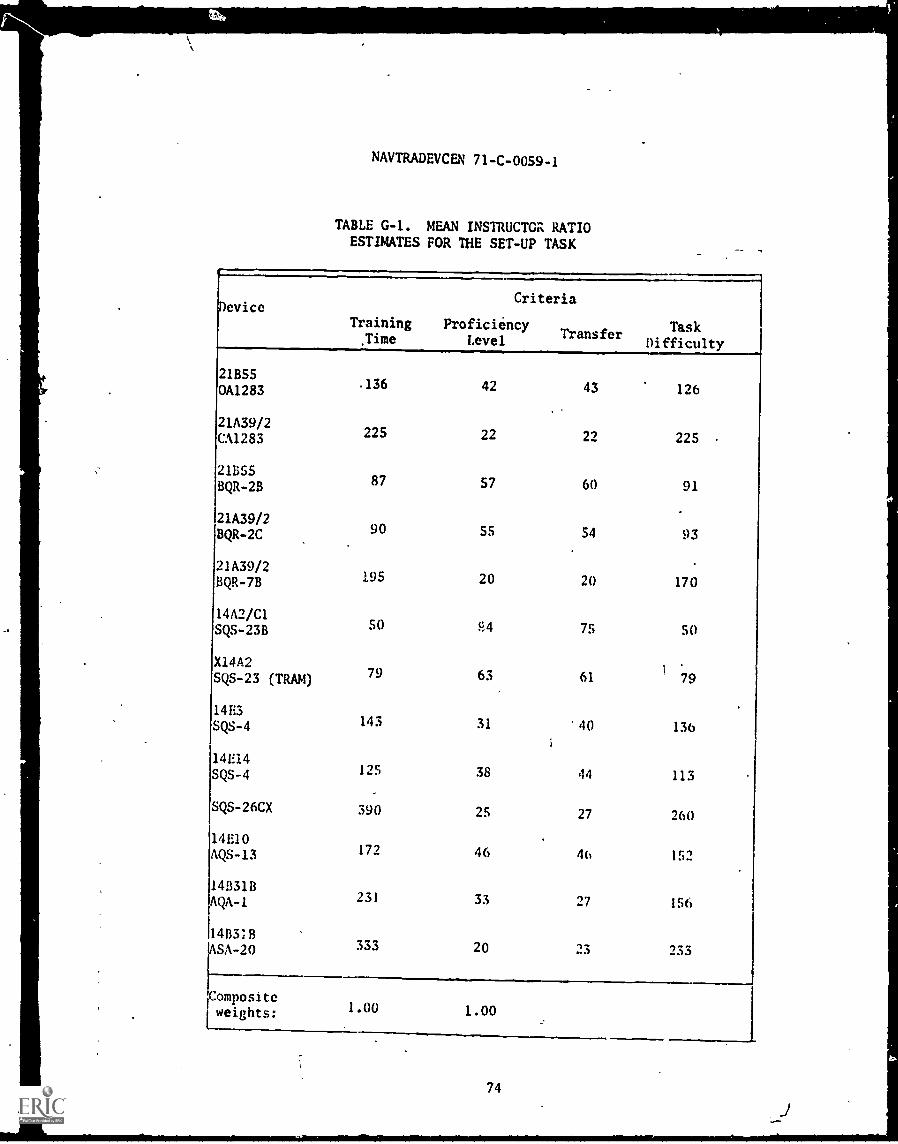
NAVTRADEVCEN 71-C-0059-1
TABLE G-1. MEAN INSTRUCTGa RATIOESTIMATES FOR THE SET-UP TASK
DeviceCriteria
Training Proficiency,Time Level Transfer
TaskDifficulty
21BSS.136 42 43 1260A1283
21A39/222S 22 22 22SCA1283
21B5587 57 60 91BQR-2B
21A39/290 55 54 93BQR-2C
21A39/2195 20 20 170BQR-7B
14A2/C1SO f.1,4 75 50SQS-23B
X14A279 63 61 79SQS-23 (TRAM)
14E3143 31 '40 136SQS-4
14E14125 38 44 113SQS-4
SQS-26CX 390 25 27 260
14E10172 46 46 152AQS-13
14:331B231 33 27 156AQA-1
14B3313
23333 20 1fASA-20
- 233.
Composite1.00 1.00weights:
74

.
NAVTRADEVCEN 71-C-00591
TABLE G-2. MEAN INSTRUCTOR RATIO-ESTIMATES FOR THE DETECTION TASK
Oevice
TrainingTime
Criteria
ProficiencyTransfer
Level
TaskDifficulty
21155
0A1283
211155
BQR-2B
21A39/2BQR-2C
21A39/2
BQR-7B
14A2/C1
SQS:2311
X14A2SQS-23 (TRAM)
14E3
SQS-4
14E14
SQS-4
SQS-26CX
14E10
AQS-13
220
144
100
100
125
129
44
125
70
170
32
,.1
SO
_ SO
45
34
125
45
,,. 90
31
32
3S
_ SO
SO
SO
29
90
45
60
43
158
1
163
100
100
119
129
63
125
90
140
Compositeweights:
1.49 1.32
75

1
NAVTRADEVCEN 71-C-0059-1
TABLE G-3. MEAN INSTRUCTOR RATIOESTIMATES FM THE LOCALIZATION TASK
cviceTraining .
Time
Criteria
ProficiencyTransfer
LevelTask
Difficulty
1B5S 200 36 36 180A1283
11155 410 24 31 299Q8-28
1A39/2 133 35 39 130QR-2C
1A39/2- 76 61 80. 71QR-7B
1,1A2/C1 363 19 35 438QS -23B
14A2 85 70 61 83S-23 (TRAM)
14E3 49 150 119 45QS-4
14E14 86 70 88 SIQS-4
QS -26CX 110 55 SS 105
14E1092 52 50 94
QS-13
48318156 29 19 150
QA -1
48318SA-20
267 22 23 217
ompositeweights: 1.13 1.22
76

NAVTRADEVCEN 71-C-0059-1
TABLE G-4. MEAN INSTRUCTOR RATIOESTIMATES FOR THE CLASSIFICATION TASK
evice
TrainingTime
Criteria
Proficiency
LevelTransfer
TaskDifficulty
1855 59 91 100 66I A1283
11155 87 52 SS 90QR-2B ,1A39/2 100 SO 50 100QR-2C
IA39/2 100 50 50 100
QR-7B
14A2/0 01 31 34 166
QS-23B
14A2 225 21 21 194
QS-23 (TRAM)
14E3 212 28 29 300
QS-4
14E14 200 33 54. 175QS-4
QS-26CX 170 41 115
14E10
QS-13 110 50 SO IOU
ompositeweights:
71.81- 2.01

NAVTRADEVCEN 71-C-00S-1
APPENDIX H
Intercorrelations cf. Task Index Values and Adjusted
Mean Instructor Ratio Estimates
78
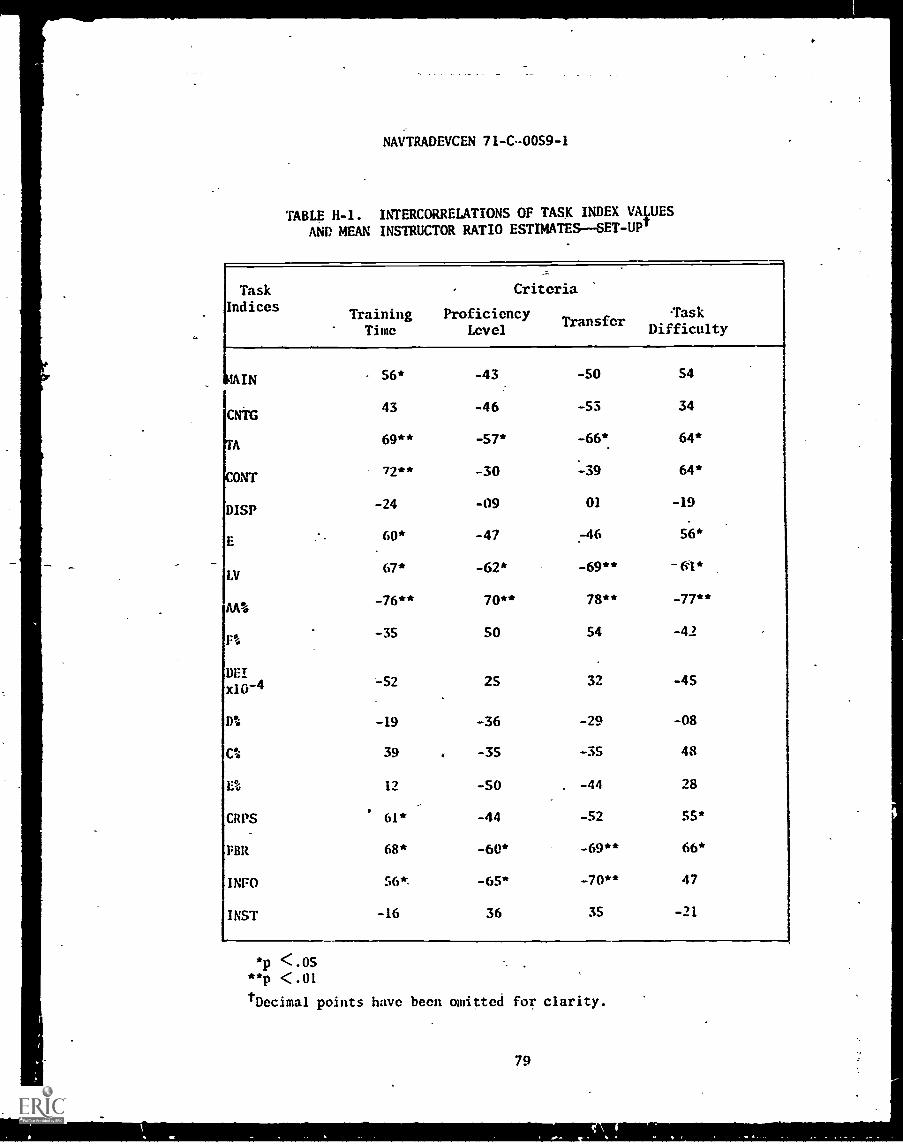
NAVTRADEVCEN 71-C-0059-1
TABLE H-1. INTERCORRELATIONS OF TASK INDEX VALUES
AND MEAN INSTRUCTOR RATIO ESTIMATES--SET-UPI
Task Criteria
Indices
LIN
CNTG
TA
C0N1
DISP
E
AA%
F.
DEI
x10-4
D%
Co
E%
CRPS
FBR
INFO
FINST
Training ProficiencyTime Level
Transfer-task
Difficulty
- 56* -43 -50 S4
43 -46 -53 34
69** -57* -66* 64*
72** -30 -39 64*
-24 -09 01 -19
60* -47 .-46 56*
ILV67*-62* -69** -64*
-76** 70** 78** -77**
-35 50 54 -4)
-52 25 32 -45
-19 -36 -29 -08
39 f -35 -3S 48
12 -SO . -44 28
' 61* -44 -52 55*
68* -60* -69** 66*
56 -65* -70** 47
-16 36 35 -21
11
*p <.05**p <.01
tDecimal points have been omitted for clarity.
79
41.
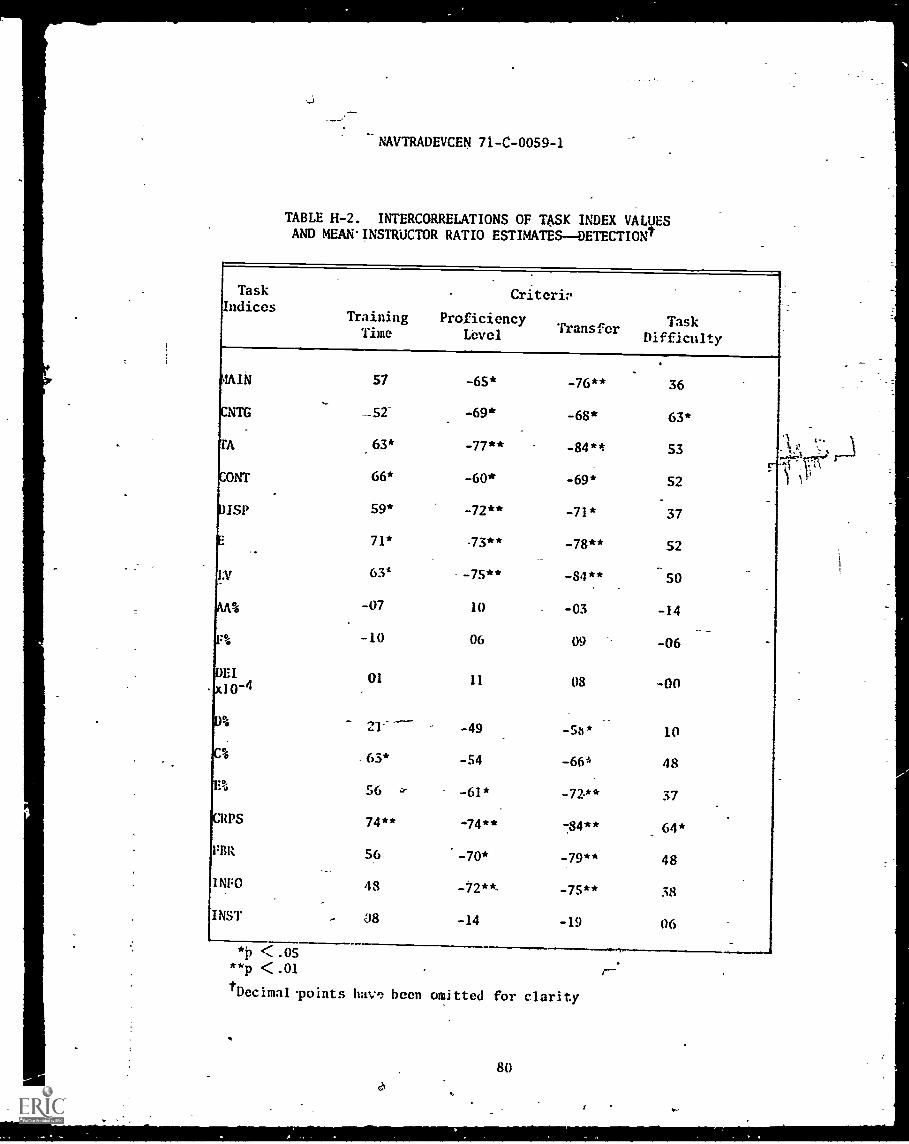
NAVTRADEVCEN 71-C-0059-1
TABLE H-2. INTERCORRELATIONS OF TASK INDEX VALUESAND MEAN INSTRUCTOR RATIO ESTIMATESDETECTION/
TaskIndices
AAIN
ICNTG
TA
CONT
DISP
E
LV
AA%
F%
1DEI
-pc10-4
D%
C%
E%
CRPS
FR
INFO
INST
Criterip
TrainingTime
ProficiencyLevel Transfer Task
Difficulty
57 -65* -76** 36
52 -69* -68* 63*
63* -77** -84** 53
66* -60* -69 * 52
59* -72** -71* 37
71* -73** -78** 52
63' __75** -84** 50
-07 10 -03 -14
-10 06 09 -06
01 11 08 -00
21' -49 -5b* 10
.63* -54 -664 48
56 -61* _T ** 37
74** -74** -84** 64*
56 -70* 779** 48
48 -72**- -75** 38
- J8 -14 -19 06
*P <:.05**p <:.01
/Decimal wints hay., been omitted for clarity
80
Y.+
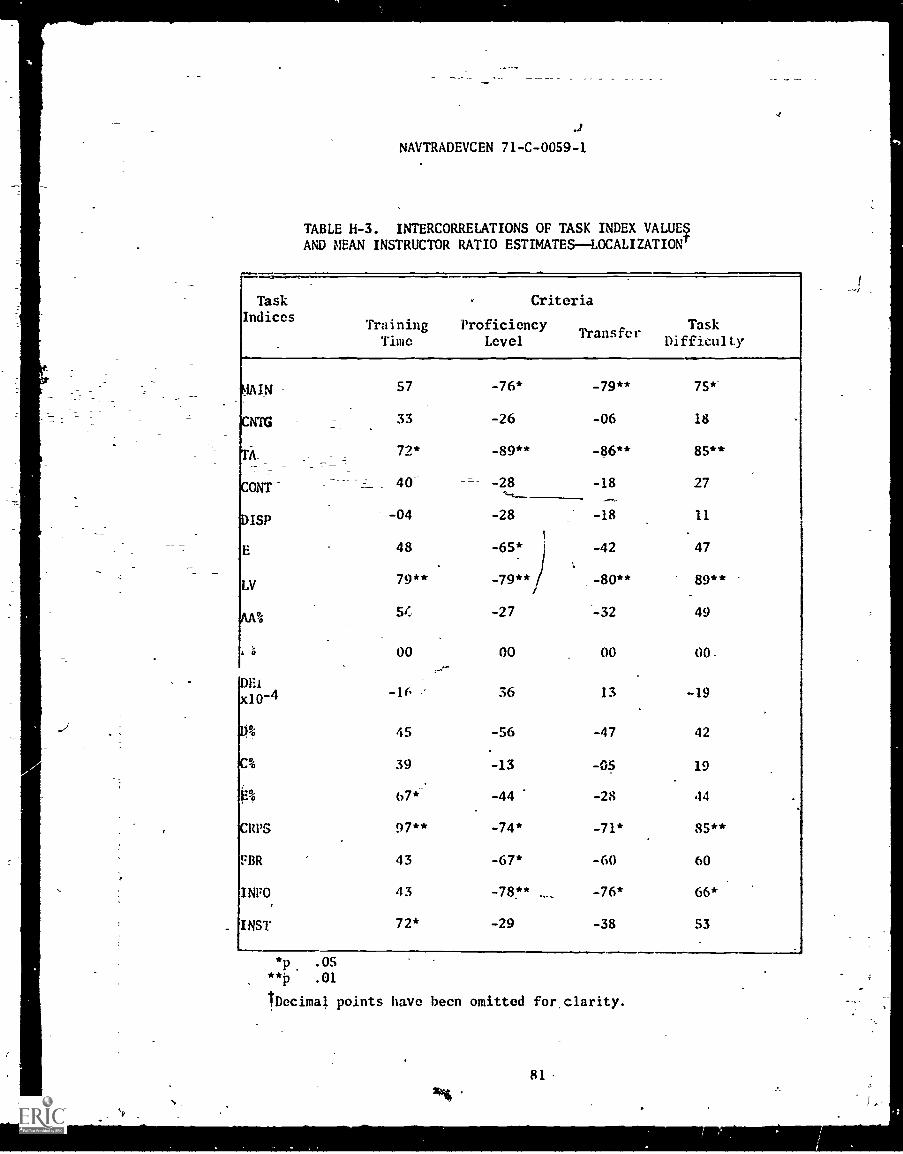
NAVTRADEVCEN 71-C-0059-1
TABLE H-3. INTERCORRELATIONS OF TASK INDEX VALUE§AND MEAN INSTRUCTOR RATIO ESTIMATES--LOCALIZATION'
TaskIndices
TrainingTime
Criteria
ProficiencyTransfer
Level
TaskDifficulty
MAIN 57 -76* -79** 75*
CNTG 33 -26 -06 18
TA_ 72* -89** -86** 85**
CONT- . 40- -- -28 -18 27
DISP -04 -28 -18 11
ti
E 48 -65* -42 47
LV 79** -79** i _-80** 89**
AA% 54 -27 *-32 49
00 00 00 00.
DE.1
I o-4-16 36 13 -19
45 -56 -47 42
039 -13 -05 19
67* -44 -28 44
UPS 97** -74* -71* 85**
FUR 43 -67* -60 60
INFO 43 -78** -76* 66*
INST 72* -29 -38 53
*p. .05
**0 .01
IDecimal points have been omitted for clarity.
81-

NAVTRADEVCEN 71-C-0059-1
TABLE H-4. INTERCORRELATIONS OF TASK INDEX VALUESAND MEAN INSTRUCTOR RATIO ESTIMATES--CLASSIFICATIONt
TaskIn 'ices
TrainingTime
Criteria
ProficiencyTransfer
LevelTask
Difficulty
MAIN - 43 -44 -68* 38
CNTG 74* -63* -71* 62
TA 68* -62 -79** 58
CONT 35 -39 -46 43
DISP 38 -41 -59 40
E 42 -46 -60 47
JAC 65* -58 -75* 487
AA% 30 -16 -12 10 -
.% -40 29 08 -10
'DEI
x10-4 -16 40 67* -21
D% -02 04 00 35
Co 24 -27 -33 47
E% 17 -19 -26 47
CRPS 63* -GO -69* 65*
FBR 65* -54 766* -55
INFO 52 -48 -71* 36
,_._
INST-1 00 00 00 00
*p
**p.05..
.01
IDecimal points have been omitted for clarity.;I
82

UNCLASSIFIEDSecurity Classification
DOCUMENTCONTROLDATA-R&D(Security classification of titiL body 0: abstract and instil:1M annotation oust be entaract when the ovarall mart Is classitimi)
I. ORIGINATING ACTIVITY (C44.411114 MMINW)
-American Institutes for Research8555 Sixteenth StreetSilver Spring, Maryland 20910
AG. 'IMPORT SECURITY CLASSIFICATION
UNCLASSIFIED2b. GROUP
S. REPORT TITLE
EFFECTS OF TASK INDEX VARIATIONS ON TRAINING EFFECTIVENESS CRITERIA
4. DESCRIPTIVE NOTES mum °import and OncliAllve GAN.)Final Report
S. AUT.. Meat num. middle Waal, lase name)
George R. Wheaton and Angelo Mirabella
S. REPORT DATE
October 197274. TOTAL NO. OF owns
- 87.7b. NO. OF ROWS
3a0. CONTRACT OR GRANT NO.
N61339 -71 -C -0059. PROJECT HO.
NAVTRAEQUIPCEN 1752-02
C. .
a
OS. ORIGINATOR'S IMPORT NUSTIDERIS)
ob. OTHER R.TPORT NOM/ (AAp Adger MOW* Oda may be aasienadOda aware)
10. OISTIRIOUTION STATEMENT
Approved for public re.Lease; distribution is unlimited.
st. SUPPLEMENTARY NOTES
None
12. SPONSORING PArLITARY ACTIVITY
Naval Training Equipment Center ..
Orlando, Florida -
F1 1. ASSTRACT
A feasibilityctudy was undertaken as part of a program to develop quantitative tech-niques for prescribing the design and use of training systems. As the second step inthis program, the present study attempted to: (1) refine quantitative indices employedduring earlier research; (2) conduct laboratory research on the effects which task in-dex variations have on training criteria; and (3) support the :aboratory results withdita gathered in the field. Two laboratory investigations an4 a field study were con-ducted. In the first laboratory study, effects of variation_ in task indices on skillacquisition of a set-up task were examined. In a companion effort, preliminary datawere collected on relationships between task index variations and performance duringtransfer of training. In the field study quantitative task index data, descriptive of
. d'variety of sonar trainers and sonar trainee tasks, were related to ratio estimatesprovided by instructors on four training effectiveness criteria. Significant multiplecorrelations were obtained between task indices and speed and accuracy of performanceduring skill acquisition. Predictor patterns changed over time and between criteria.Set-up task speed was predicted early in training, while errors made were predictedlater during acquisition. Similar but more provisional relationships were found durin-transfer of training. Speed and, in particular, accuracy of performance during trans-fer bore consistent relationships to task index values. Support for these genera.findings was obtained in the field. Significant relationships were established betweeinstructors' judgments of training criteria and trainee subtask index values.
I NOV GSOISPLACIIG DO FORM 147II. I JAM INI. WHIMS IGDD ' 1473 01111411.STE IPPOR ARMY WIC UNCLASSIFIED
waselty Clessilksidea

UNCLASSIFIEDSccurity Classification
14.KEY leonos LINK LINK LINK C
isOLI1 WT ROLE WT ROL, 1 T
.
mon
Task Analysis
Quantitative Task IndicesTraining Effectiveness
.
.
,
.
UNCLASSIFIEDSecurity Classification

DISTRIBUTION LIST
NOTE
Mailing labels are prepared, when needed, as a computerlisting, the source of which is updated, on a weeklybasis. It is not practical to prepare distributionlists each time labels are prepared. Therefore, suchlists are prepared semiannually, and a slight discrep-ancy may exist between the addressees on this list andthose appearing on the labels used to distribute thispublication.
USAF HUMAN RES LABAFHRL7D0 OPERATION OFCBROOKS AFB TX 78235
USAF HUMAN RES LABAFHRL-TTTECH TRNG DIVLWRY AFB CO 80230
USAF HUMAN RES LAB-PERSONNEL RSCH DIVLACKLAND AFB TX -78236
USAF HUMAN RES LABAFHRL-TRTRNG RES InvWRIGHT-PATTERSON AFBOH 65433
CHIEF NAVAL RESEARCHPSYCHOLOGICAL SCIENCESCODE 450 NAVY DEPTARLINGTON VA 22217
DR RALPH R CANTERDIR MIL MANPWR RSCHOASD M-RA MR-UPENTAGON RM 3-960WASHINGTON DC 20301
NATL SCIENCE FDNATTN DR HENRY S ODBERT1800 G ST NWWASHINGTON DC 20550
CHIEF NAVAL OPERATIONSATTN DR J J COLLINSOP-07T16 NAVY DEPTWASHINGTON-DC 20350
1 DR JOHN MEYERHDQTRS AIR TRNG CMD X1'TRANDOLPH AFB TX 78148
1 USAF HUMAN RES LABAFHRL-FTFLYING TRNG DIVWILLIAMS AFB AZ 85224
1 CHIEF NAVAL MATERIALMAT 031MWASHINGTON DC 20360
JOSEPH J COWANCH PERS RSCH BRANCHUSCG 11Q P0-1 STA 3-12400 SEVENTH ST S WWASHINGTON DC 2022t,
1 BUREAU NAVAL PERSONNEL.ATTN PERS A3ARLINGTON ANNEXWASHINGTON DC 20370
1 DEPT OF PSYCHOLOGYUNIV OF IL ATURBANA- CHAMPAIGNPROF PSYCH J kADAMSCHAMPAIGN IL 61820
CHIEF NAVAL OPERATIONSATTN CDR H J CONNE(YMSC OP-701E2 NAVY UPIWASHINGTON DC 2035)
1 INSTITUTE OF AVIATIONUNIV OF ILURBANA-CHAMPAIGNSAVOY II. 61874
1
1
1
1
1
1

CHIEF NAV OPERATIONSATTN M K MALEHORNOP-14C NAVY DEPTWASHINGTON DC 20350
COMMANDERNAVELECTSYSCMDCODE 03WASHINGTON DC 20360
NAV AEROSPACE MED INSTNAV AEROSPACE MED CTRATTN CH AVIA PSYCH DIVPENSACOLA FL 32512
COMMANDERNAVSUPSYSCMDCODE 03WASHINGTON DC 20360
COMMANDERNAVORDSYSCMDCODE 03WASHINGTON DC 20360
HUNAN RES RSCH ORCDIV NO 1 SYS OPER300 N WASHINGTON STALEXANDRIA VA 22314
CO NAV MISSILE CTRATTN HD HUMAN FACTORSF.NGRG BR
POINT MUGU CA 93042.
CH RSCII AND DEVI:MT
CH BEHAVIORAL SCI DIVDEPT OF ARMYWASHINGTON DC 20310
COMMANDING OFFICERNAVY MEDICAL"`"""
NEUROPSYCHIATRIC RESCHUNIT
SAN DIEGO CA 92152
DIR DEF RSCH ENGRGARPA
BEHAVIORAL SCI DIVATTN LCOL A W KIBLERWASHINGTON. DC 20301
1 COMMANDER'NAVSHIPSSYSCMDCODE 03WASKINGTON DC 20360
CDR NAVSHIPS SYS CMD-NAVSHIPS SYS CMD HQSSHIPS 03H GEO N GRAINSWASHINGTON DC 20360
1 COMMANDERNAVAIRSYSCMDCODE 03WASHINGTON DC 20360
1 CO NAVMED RSCH INSTNATL NAVMED CTRATTN TECH REF LIBBETHESDA MD 20014
SCIENTIFIC TECHNICALINFORMATION OFFICE.NASAWASHINGTON DC 20546
1 BEHAVIORAL SCI DIVOFC CHIEF RSCH - DEVELDEPT OF ARMYWASHINGTON DC 20319
HUMAN RESOURCES RESCHORGZTN DIV 6 AVIATIONP 0 P3X 428
FORT RUCKER AL 36360
1
1
1.
1
1 HQS AF SYS CMD DLSL 1
OFC SCIENTIFIC RSCHANDREWS APBWASHINGTON DC 20331
1 COMMANDER 1
NAVFAC ENGR CMDNAVFAC ENCR CMD HDQASST DIR R&D DIV(CODE 03)WASHINGTON DC 20390
DIRECTOR
US ARMY MOTIVATION & TNG LABCOMMONWEALTH BLDG -_-
13001300 WILSCN BLVDARLINGTON VA 22209
1

COMDT OF MARINE CORPSCODE AC3CWASHINGTON DC 20380
CHIEF NAVAL RESEARCHATTN CODE 458 DEPT NAVARLINGTON VA 22217
COMMANDING OFFICERPERSTRNG RSCH DEV LABSAN DIEGO-CA 92152
US ARMY BEHAVIORAL SCIRESEARCH LABCOMMONWEALTH BLDG
f-RM 239
1320 WILSON BLVDARLINGTON VA 22209
EXECUTIVE EDITORPSYCHO ABSTRACTSAMER/CAN PSYCH ASSOC1200 17T4 ST NNWASHINGTON DC 20036
NAV PERSONNEL RSCH &DEVFLOPVENT LABATTN LIBRARY
BLDG 200 RM 3307 WNYWASH:NGTON DC 20390
1
1
1
1
1
1
CHIEF OF NAVAL TECH TRNG 1
NAVAL AIR STATION, MEMPHIS (75)MILLINGTON, TN 38054(ATTN: DR. LARRY HARDING,
CODE 34)
Commanding Officer 77Naval Training Equipment CenterOrlando, Florida 32813
Defnse Documentation Center 12Caraeron StationAlexandria, Va 22314
DIR HUMAN RES RSCH ORO
300 WASHINGTON ST.ALEXANDRIA VA 22314
CHIEF OF NAVAL TRNCCODE 017 RASPENSACOLA FL 32508
CDR NAVAIR DUEL CTRATTN HUMAN ENGRG RRWARMINISTER PA 18974
DR JOHN W WEISZDIR HUMAN ENGRG LABUSA ABERDEEN RSCHDEVEL CTR
ABERDEEN PROV GROUNDSMD 21005
1.CO NAVAIR TECH TRNG-NAS.MEMPHISATTN DR G D MAYOHD RESEARCH BRMILLINGTON TN 38054
ERIC CLEARINGHOUSE ONEDUCATION MEDIA-TRCHSTANFORD DNIVSTANFORD CA 94305
n.
1
1
1
1
I