document resume ed 360 022 jc 930 373 author · pdf filebasic english skills) ... they are, on...
TRANSCRIPT

DOCUMENT RESUME
ED 360 022 JC 930 373
AUTHOR Preston, David L.TITLE Using the CCSEQ in Institutional Effectiveness: The
Role of Goal Commitment and Student's Perception ofGains.
PUB DATE May 93NOTE 84p.; Paper presented at the Annual Forum of the
Association for Institutional Research (33rd,Chicago, IL, May 16-19, 1993).
PUB TYPE Reports Research/Technical (143)Speeches /Conference Papers (150)
EDRS PRICE MFO1 /PCO4 Plus Postage.DESCRIPTORS *Academic Persistence; Community Colleges; General
Education; *Goal Orientation; Higher Education;Models; Organizational Effectiveness; School HoldingPower; School Surveys; *Student Attitudes; *StudentBehavior; *Student Educational Objectives; Two YearColleges; Two Year College Students
IDENTIFIERS AIR Forum; *Community College Student ExperiencesQuest
ABSTRACT
The traditional definition of student persistence,advanced by Vincent Tinto in 1975, is that of attendance until degreecompletion. This model, however, does not adequately reflectcommunity college student attendance patterns. To develop aconceptual model of community college student persistence, a studywas conducted of the attendance patterns of 510 students attending asoutheastern Texas community college during spring semester 1992,using student goal-attainment as the indicator of successfultermination. Specifically, the study examined the relationshipbetween goal commitment for five groups of students (i.e., thosepreparing to transfer, preparing for a new career, retaining currentor upgrading skills, attending for personal reasons, and upgradingbasic English skills) and the student's perception of gains on thefollowing general educational goals: career preparation; arts;communications skills; mathematics, science, and technology; personaland social development; and perspectives of the world. Perceptions ofgains in these six dimensions were measured by the "Estimate ofGains" section of the Community College Student ExperiencesQuestionnaire (CCSEQ). Results indicated that the more strategic astudent's goal-commitment (i.e., the longer the student expected toattend college), the more likely that he or she would perceive gainsin the six areas. In addition, members of the transfer group were themost satisfied with their college experiences and showed a greatertendency to persist until goal attainment. A literature review,detailed data analyses and tables, implications and recommendations,and an 86-item bibliography are included. (PAA)
***********************************************************************
Reproductions supplied by EDRS are the best that can be madefrom the original document.
***********************************************************************

14,
r 4
USING THE CCSEQ IN INSTITUTIONAL EFFECTIVENESS:THE ROLE OF GOAL COMMITMENT
AND STUDENT'S PERCEPTION OF GAINS
by
David L. Preston, Ed.D.
PERMISSION TO REPRODUCE THISMATERIAL HAS BEEN GRANTED BY
D. L. Preston
TO THE EDUCATIONAL. RESOURCESINFORMATION CENTER (ERIC,
U.S. DEPARTMENT OF EDUCATIONOft. o Educational Research and Improvement
EDUCATIONAL RESOURCES INFORMATIONCENTER (ERIC)
EXis document has been reproduced asreceived Rom the person or organizationoriginating it
(:) Minor changes have been made to improvereproduction Oua litY
Points of view or opinions stated in this docu-ment do not necessarily represent officio'OE RI position or poky
A Paper Presented at the 33rd Annual AIR ForumMay 16-19, 1993Chicago, Illinois
ti
BEST liFY CLUE

Using the CCSEQ in Institutional EffectivenessAbstract
Student persistence has been studied for severaldecades. The recent research interest in student persistencestarted with Spady's study which was published in 1970.Spady based the development of his model on an early 1950'sstudy of suicide by Durkheim which showed a relationshipbetween the lack of social integration and suicide.
Tinto provided added impetus to the research interest instudent persistence when he published his model in 1975. Headded academic integration and goal commitment to Spady'smodel. Tinto based his model on the conjecture that the morea student was socially and academically involved in collegeactivities, the more likely the student would be to persist.
Much of the student-persistence research has beencentered on four-year educational institutions and based onthe traditional paradigm of a student starting collegeimmediately out of high school then completing a bachelor'sdegree within four years. Using this degree completionparadigm and Tinto's persistence model proved to be tootempting for two-year college student persistenceresearchers. However, Vorhees, Padula, and even Tinto arguedagainst this atheoretical use of the traditional models ofstudent persistence for two-year colleges.
Community college students are nontraditional; that is,they are, on the average, older, go to school part-time, andare not compelled to finish a degree within a prescribed timelimit. These differences from the traditional four-year-student paradigm demand a different model for two-year-student persistence.
In order to help build a foundation for developing atwo-year student persistence model, this study examined oneindependent categorical variable, goal commitment, and sixdimensions of the student's perception of gains construct asthe dependent variables. These six dimensions wereLikert-type scales which measured the gains a student hadperceived they had made on twenty-three general educationgoals. The goal-commitment variable consisted of thefollowing five groups of students: those who were, (1)preparing to transfer, (2) those who were preparing for a newcareer, (3) trying to remain current or upgrade their skills,(4) attending for personal interest, and (5) trying toupgrade their basic English skills. The six dimensions ofthe student's perception of gains construct were: (1) careerpreparation, (2) arts, (3) communication skills,(4) mathematics, science, and technology, (5) personal andsocial development, and (6) perspectives of the world.
The sample consisted of 510 students selected by astratified random sample from the population of studentsattending a southeastern Texas community college during theSpring Semester, 1992. The instrument used was the CommunityCollege Student Experiences Questionnaire (CCSEQ), developedby the Center for Evaluation w^4...ch is directed by Dr. C.

Robert Pace. A manual accompanies the questionnaire whichgives the inter-item correlations, results of factoranalysis, and Cronbach's alpha for the various sections ofthe questionnaire. The factor analysis of data collected bythe authors of the CCSEQ resulted in the six dimensions ofthe student's perception of gains construct used in thestudy.
The definition of community college student persistenceused for this study focused on a student's attending collegeuntil a goal, which s/he had expressed as important, wasattained. This nontraditional definition neither included atime limit nor degree attainment as parameters.
The methodology consisted of multivariate analysis,univariate analysis, and a priori contrasts. Themultivariate analysis, testing the variables, as a system,was significant (Wilk's lambda = .678, p < .05). Theseresults suggested that there was a significant differencebetween the goal-commitment groups with respect to the sixdependent variables.
Significant univariate tests followed, which suggestedthat there was a difference between the goal-commitmentgroups with respect to each of the six dimensions of thestudent's perception of gains construct. A priori contrastswere used to test for a significant difference between thetransfer goal-commitment group and the other fourgoal-commitment groups with respect to the six dependentvariables. Most of those contrasts were significant. Theresults of these contrasts suggested that the more strategicthe student's goal - commitment (that is, the longer thestudent expected to attend college), the more likely s/heperceived as having greater gains on the twenty-three generaleducation goals. These results also indicated that thetransfer group was more satisfied with their collegeexperiences than the other goal-commitment groups, and wouldhave a greater tendency to persist until goal attainment thanthe others.
As for further study, many other grouping variablescould be used in an attempt to find the differeT:ces betweenthese groups with respect to the student's perception ofgains. More research is also needed to show whether there isa significant relationship between student satisfaction, goalattainment, and student persistence. Similar research willhelp in the development of a theoretical model of communitycollege student persistence.
Persistence is an interest to institutions because ofthe institution's goal of helping student's fulfill theirpotential. Keeping students around an institution longenough to help them attain their goals, is part of thisstrategy.
ALIC

Using the CCSEQ in Institutional Effectiveness
The Role of Goal Commitment
and Student's Perception of Gains
Introduction
In 1965, there were 654 two-year colleges in operation
in the United States. By 1985, the number of two-year
colleges had more than doubled, reaching a total of 1350
(Adelman, 1992). The two-year college (also known as junior
college, community college, or technical institute) entered
the postsecondary educational milieu offering easy access to
higher education for all, making going to college very
affordable for most, and usually was within easy commuting
distance for most students. Not only did the community
college grow rapidly during this period, but postsecondary
education in general grew quite rapidly for several reasons.
One reason was the growth in the number of high school
graduates which increased from twenty-five percent of those
entering high school in 1924 to seventy-five percent in 1960
(Deegan and Tillery, 1988). Not only were there more
students in the educational system because of the population
explosion, but more of these students were graduating from
high school.
During this time some university and college leaders
supported the idea of an "in-between" school which bridged
the gap between high school and colleges. These leaders
believed that this "in-between" experience would smooth the

2
transition from high school to college. (This phenomenon
tacitly recognized a problem with student persistence.)
Others conjectured that if another institution provided the
freshman and sophomore years of college, more time could be
spent by four-year colleges on the more advanced students - a
much more efficient use of faculty resources. Both of these
conjectures helped spur the growth and acceptance of the
two-year college.
After the turn of the century, the manufacturing
industry grew very rapidly, especially during and after World
War II. This placed a tremendous demand on society for a
more skilled workforce. The educational system tried to meet
that demand by introducing more vocational/technical
education which resulted in causing even more growth in
postsecondary education, especially for the two-year college
(Cohen and Brawer, 1989).
The community college also flourished because of the
added demands of society for education to solve all of its
ills. For some, education seemed to be the panacea for such
problems as high unemployment and an overburdened welfare
system. This notion was laced with the belief that the more
years of education a person had the greater the benefits for
that person which in turn profited society (Cohen and Brawer,
1989).
Because of the easy access, affordability, and
acceptance of community colleges as legitimate higher
educational institutions, more subpopulations were able to
6

3
access higher education than ever before. Deegan and Tillery
(1988) comment on this for the 1970-1980 time-frame.
"Participation rates of many underrepresented groups (reentry
women, ethnic groups, the disabled, displaced workers)
increased sharply in this generation." (p. 22) With the
large number of students entering higher education, keeping
students was not much of an issue. If a student withdrew
from college, another student took his/her place. However,
this scenario has changed dramatically. "While the 1950s and
1960s were boom years for higher education, the past fifteen
years have been a period of retrenchment. As the traditional
college-age population of eighteen to twenty-four year olds
began to shrink in the late 1970s, many colleges and
universities were forced to do a better job of recruiting and
retaining students." (Porter, 1991; p. vii) This same
phenomenon occurred during the early 1990's with the decrease
in eighteen year-olds projected to bottom out in 1992 (Cohen
and Brawer, 1989). Community colleges will sustain their
enrollments because of several reasons; the demand for
higher education will remain high, enrollments in higher
education by minorities will increase, industries
increasingly will continue to enter into partnerships with
community colleges to do the training of their employees, and
the community college will continue to get their share of the
traditional college student (Cohen and Brawer, 1989). The
pressure on community colleges to provide education to meet
the needs of an ever-expanding diverse society will increase.
7

4
Because of this pressure, community colleges will need more
resources, not less. However, the decrease in funding of
higher education and the increase in the demand for
institutions to live up to their responsibility and
commitment to the student has created yet another crisis in
higher education of doing more with less.
This crisis has been brought about by fed-up taxpayers
and legislators who are focusing on educational results and
questioning the extant integrity of many public institutions
including community colleges. This shift from a laissez
faire attitude towards higher education to the examination of
results/outcomes of a student's college experience is
evidenced by the demand on the part of accrediting agencies
and legislatures that colleges of all types be able to show
that they are effective; that is, institutions demonstrate
with relevant data that their missions and goals are being
attained and there is congruency between what a college
purports it does and what actually happens to its students.
Determining a response to this congruency issue requires a
shift from an institution using input measures to show
institutional effectiveness to outcomes and/or student
performance measures. This shift demands that colleges pay
attention to student persistence to ensure their students
will attain their goals.
Another phenomenon that has occurred in public education
causing concern for what educational institutions are doing
is presented .'.n the Department of Education's report, A

5
Nation At Rice and Bloom's Closina gf the American Mind, two
well-known publications which lament the plight of elementary
and secondary education in the United States. The number of
functional illiterates in our society and high school
completers who are underprepared in basic reading, writing,
and mathemati.cs skills has indeed shocked the nation.
Although these students may have access to higher education,
it is presumptuous to assume these students are prepared for
college-level courses. The response to this upturn in the
number of underprepared students by the community colleges
has been favorable. The community college attempts to
remediate a large percentage of these underprepared students.
Even though the decline in student ability stabilized in
the 1980s, compensatory education grew. The rise in
remedial course enrollment occurred because student
ability had sunk so low that college staff members,
legislators, and the staff of the universities to which
the students transfer had had enough. The dropout and
failure rates were unconscionably high . . . .
Increased enrollments and programs in remedial education
were the result. In 1987, 13 percent of all credit
course enrollment in Illinois community colleges was in
remedial courses . . . . The funding for these courses
sometimes came through the regular academic instruction
budget, as in Austin Community College (Texas) where
one-third of all state-reimbursed funds were allocated
to remedial education.. (Cohen and Brawer, 1989; p. 237)
9

6
Because of this increase in underprepared students,
college-level course work has suffered, exacerbating the
lack-of-persistence problem. Students who are not prepared
for college courses usually do not persist very well no
matter how persistence is defined and/or measured.
Still another phenomenon influencing community college
enrollment, because of the "Technological Revolution" and
"Knowledge Explosion", is the emphasis on "life-long
learning."
Adults will have increasing needs for recurring
education. Among the implication for community colleges
is that most suppliers of education will respond to such
adults' needs for occupational retraining, academic
remediation, and lifelong learning. This competition
will require the colleges to offer cost-effective
programs falling within their mission and with
'erifiable learner outcomes. (Deegan and Tillery, 1988;
p. 29)
Since technology evolves and changes so rapidly and many of
the current skills are being replaced by automation, new job
skills are needed. Many of those who are currently employed
will change careers at least once in their worklife which
will require retraining or learning a new skill to prepare
for a new career. Incumbent upon these institutions
providing retraining is retaining these students until their
goals are met.
Taken together, the phenomena of underpreparedness,
1 e

7
life-long learning, and retraining workers have brought about
a change in the student profile of college students,
especially on community college campuses. The traditional
transfer paradigm no longer fits the behavior of all
community college populations. This change in student
profile and needs places demands on community colleges to
develop curricula which represent the needs of these
populations and to continue to examine their mission and goal
statements.
Couched in this new paradigm is the student persistence
issue. Easy access should not mean easy exit and the
open-door should not turn into a revolving door. A community
college must have a strategy in place to monitor and assess
student persistence so that students attain their goals and
community colleges achieve a higher degree of effectiveness.
Need for the Study
Financing of higher education has become problematical
in Texas as in other states. Where money for increased state
aid for higher education was available just a few years ago,
educational institutions are now facing reductions in state
appropriations. Many states are reducing higher education
budgets and decreasing appropriations to higher education
(Southern Regional Education Board, 1991). Many demands are
being placed on the tax dollar and new taxes are not in
vogue. The competition for the tax dollar has brought about
new demands on public institutions which have to be met
before their state appropriations are received. The

8
major demand which seems to be emanating from this financial
crisis is for effectiveness (which in some regards is an
accountability issue) - institutions doing what they say they
are doing and proving it.
The Southern Region Education Board (SREB) has reported
the reluctance of states to continually give money to higher
education without proof of effectiveness. In fact, some
states are withholding a percentage of an institution's
budget appropriation until certain outcome goals have been
met. Taxpayers are demanding a return on their investment.
This demand suggests that the measure of an institution's
effectiveness becomes the surrogate of the state's goal of
fiscal responsibility. If courses and programs are designed
to teach concepts and develop skills that are prerequisites
of success in jobs or classes at a transfer institution,
students must complete the prerequisites. It is imperative
for students to stay in college until their goals have been
attained. In order to respond to this demand, several
persistence strategies can be imposed on the educational
system helping students stay in college until they attain
their goals. However, a precursor to implementing any of the
strategies suggested is the development of a conceptual
student-persistence model which requires a usable definition
of persistence for community college students.
Several unassailable facts are evident in the literature
related to persistence: (1) education is now considered a
lifelong process, (2) the average worker will change careers

9
at least once, and probably several times before retirement,
(3) the financial responsibility for the undereducated is now
beyond what society can afford to maintain let alone add to
it, and (4) colleges should be held responsible for doing
what they say they are doing. Philosophical changes are
needed by educators and leaders alike.
One of the most remarkable and scandalous aspects of
American higher education is the absence of traditions,
practices, and methods of institutional and social
accountability. How can colleges and universities
assure the American people and themselves that they are
doing what they say they are doing? How does anyone
know that the curriculum really "works?" There must be
ways of demonstrating to state legislatures, students,
and the public at large that the colleges know what they
are doing (or do not know) and that they are doing it
well (or poorly). (Association of American Colleges,
1985; as reported by McClenney, 1989; p. 47)
Community colleges are the colleges-of-choice for not
only first-time-in-college students but for the returning
student who needs retraining to upgrade current skills or
training for a new career. As a result of the change in the
student profile from.the traditional eighteen to twenty-four
year old student to the older, part-time nontraditional
student, and the demand for accountability and effectiveness,
higher education must pay much more attention to student
persistence.
10

10
The higher educational institution, be it two-year or
four-year, is obligated to fulfill its commitment and
responsibility of helping students attain their goals.
Increasing student persistence is but one endeavor that
two-year colleges can undertake to help fulfill this
commitment. In order to attend to this commitment, the
ingredients of student persistence must be studied and
strategies developed and implemented which are designed to
help students reach their goals. Students thereby contribute
even more to society's resources and help reduce the costs to
society for maintaining the underproductive. Educational
institutions must do their part to stop the waste of human
resources.
Statement at the Problem
The current models used by most researchers studyLig
persistence are the ones developed by Tinto (1975),
Pascarella (1983), Bean (1980), and Bean and Metzner (1987).
Even though there are many articles relevant to community
college persistence research, the research does not
adequately address student persistence in community colleges
(Vorhees, 1987: Tinto, 1987). When community college student
persistence is studied, the above models provide a starting
place for researchers but with little consideration for the
model's assumptions. For example, since Tinto (1975)
investigated four-year institutions when developing his
model, making application of his model to two-year
institutions is presumptuous. Researchers having a
14

11
four-year-college mind-set of student persistence play a
large role in biasing the development of a community college
student persistence model.
Tinto's model had its origins in a study of suicide by
Durkheim (1951) and an enhancement of Durkheim's study by
Spady (1970). The results of the Durkheim study suggested a
relation between social integration and some forms of
suicide; that is, the more a person shares values with a
group, the less likely that person will commit suicide.
Tinto added academic integration and goal commitments to
Durkheim's suicide model. Tinto's model has guided much of
the persistence research for four-year and two-year college
students.
There are many studies in the literature specifically
concerned with community college retention. Since 1970,
nearly six hundred studies have been reported through
ERIC dealing with retention/attrition issues. Despite
the large number of studies, few have approached the
problem with a theoretical perspective. Measuring
community college success is a departure from the more
traditional studies conducted using a theoretical model
on four-year institutions. A framework which refine
definitions to account for the multiple outcomes unique
to community colleges is needed. Definitions of
successful outcomes are reported in the literature and
are important in constructing a community college model.
(Daley, 1990; p. 6)
1 g

12
Bean (1980) admits the possibility of the
inapplicability of the Tinto model to the community college
student. Padula (1989) and MacCaffrey, Nora, and Maury
(1989) also described their discontent with the application
of the Tinto Model to community college students. However,
the four-year paradigm developed by Tinto plays a prominent
role in community college persistence research.
The basic premise upon which two-year college
persistence researchers base their model is the four-year
student persistence definition - completing the degree
requirements within four years. This definition does not
describe the behavior of community college students.
Community college students as a whole are older, are
much more likely to attend college part-time, and
because of the nonresidential nature of most community
colleges, are commuters. Community college students
also attend classes for a wide variety of reasons other
than obtaining a degree, including self-improvement,
career advancement, vocational certification, and
earning credit to transfer to a four-year college or
university. Consequently, persistence to degree
completion may not be a valid measure of actual
persistence behavior for community college students.
(Vorhees, 1987; p. 116)
Many researchers find it difficult to adjust to the community
college student profile described by Vorhees. However,
research using the four-year models does provide insight into

13
possible variables needed to help describe the persistence
behavior of the two-year college student. The need is to
approach the study of community college persistence with the
intent of conceptualizing a persistence model for the
institution being studied. From this model, relationships
among the variables presented can then be studied.
Studies of community college are over whelmingly
descriptive in scope. No conceptual models of student
persistence behavior have been advanced, designed
specifically for the two year college setting, which
adequately account for student background
characteristics and how students interact within the
community college environment. (Vorhees, 1987; p. 115)
Because of the suggestions of Vorhees, Padula, and
others, and since community college students attend in much
the same fashion as one would use a library (Adelman, 1992),
the traditional definition of persistence, attending until a
degree is obtained, should be modified to more adequately
reflect community college student attendance behavior.
Traditional persistence indicators such as continuous
reenrollment may be the wrong indicator to use in persistence
research. Another indicator used wrongly for community
college students in a persistence definition is withdrawal
behavior. Withdrawing or leaving a community college may
indicate that the student transferred to another institution
rather than leaving higher education altogether. "Clearly,
there may be no ideal solution to the problems in defining

14
persistence in postsecondary education. Any single
definition of persistence/ withdrawal is unlikely to be
completely satisfactory." (Pascarella, Smart, and Ethington,
1986; p. 54)
Several alternative indicators can be considered as a
substitute for the traditional persistence indicator. As an
alternative, course completion could easily be used as a
indicator of persistence and course completion rate as an
indicator of progressing toward goal-attainment. Because some
community college students attend to update current skills or
to become current in their field, completion of only a few
courses may be needed to attain either of these goals. For
these students, course completion may indicate either their
goal-attainment or progress toward goal - attainment
(persistence).
The last alternative considered is to use
goal-attainment as an indicator of the successful termination
of going to college in lieu of degree completion, and as long
as a student is pursuing that goal, whether or not the
student stops-out or continuously enrolls, s/he is considered
to be persisting. This alternative definition of persistence
is the one that will be used in this study. A time-frame
could be included, but for the purposes of this study, since
it will be a cross-sectional study and not longitudinal,
setting a time-frame would be moot. With this definition of
community college student persistence, the traditional
indicator used to terminate a student's persistence pattern
15
shifts from degree-completion to goal-attainment.
Terenzini and Wright (1987) touched on this relationship
between goal-commitment and persistence, although they were
still tied to the degree-seeking-student syndrome.
While this study included as a background (and
exogenous) variable students' goals with regard to the
highest degree expected, the failure here to include
measures of students' commitments to achieving other
academic and career/vocational goals is more
problematic. These commitments might well be expected
to influence for example, the amount of effort a student
exerts, which, in turn, is likely to affect the level of
that student's academic (and possibly social)
integration. (p. 166)
Vorhees (1987) suggested that the college experiences a
student incurs while in attendance, are very important in any
discussion of student persistence. How a student perceives
the relationship between the institution and themselves is
part of a general sense of satisfaction with his or her
college experiences. The more satisfied a student is with
his or her college experiences, the better the
college/student relationship and the more likely the student
will persist. As students perceive that their goals are
being met because of their college experiences, the more
satisfied they become and the more likely they will persist
to goal-attainment. Hearn (1985) studied the relationships
between students' satisfaction, performance, and persistence.
19

16
He found that student satisfaction is a determinant of
academic performance which in Tinto's model influenced
persistence. Hearn advanced this notion in support of other
researchers (Bean and Bradley, 1984) who also concluded that
satisfaction influences among other behaviors, student
persistence.
Goal commitment, as shown, is an important factor in the
study of student persistence. Similar to the treatment of
community college student persistence by researchers, goal
commitment has been approached from a narrow research
perspective as Grosset (1989) points out: "Student goal
commitment has generally been narrowly operationalized by
degree aspiration information." (p.25) This is another
example of a construct which has been influenced by the
traditional degree-seeking mind-set. Another twist on this
construct is the differentiation between a student's
institutional commitment and a student's goal commitment.
Goal commitment in this study is based on the student's
reasons for attending, which are the intent to, transfer,
obtain skills for a new job, obtain skills to remain current,
attend because of a personal interest, or improving current
English skills. These five possibilities determine the five
goal-commitment groups for this study.
Grosset (1989) collected data on the students who
attended the community college where she was employed and
found that a goal-commitment rubric similar .63 the one above
was more characteristic of community college student behavior

17
than degree completion. "Student self-reported assessments
of goal completion indicated that a large percentage of
'dropouts' actually completed their objectives, despite not
earning a degree." (Grosset, 1989; p. 28)
Pascarella and Terenzini (1980) studied student
peristence at Syracuse University, and reported results
similar to Grosset's. One of the constructs used in their
study consisted of a student's perception of gains or
progress on such items as intellectual and personal
development and academic experiences. They concluded that a
student's perception of making progress on these types of
items seems to influence persistence behavior.
Significance Qt the Studs
Vorhees (1987) and others such as Pascarella, Smart, and
Ethington (1987) complain of the dearth of meaningful
persistence research using community college students as
subjects. This study, however, focuses on one community
college in southeast Texas and will add to the body of
literature helping to alleviate this problem. However, for
this study a different approach will be taken. Since the
traditional persistence definition does not seem to be very
useful for community college persistence research, and the
models described to this juncture do not adequately describe
community college persistence behavior, this research will
operate under the premise that investigating the relationship
between goal commitment (reason for attending) and the
student's perception of gains on twenty-three general
18
educational goals is a precursor to the development and
testing of a persistence model for community colleges.
Community college students leave an institution
(withdraw, attrite, dropout, stop-out) for a variety of
reasons, some of which mirror the reasons students leave
four-year institutions. However, the profile of the
community college student is quite different than the profile
of the four-year college student (Adelman, 1992: Vorhees,
1987: Bean, 1981). This profile suggests that a different
set of criteria may apply to the two-year-college student
persister and/or leaver. The approach taken by this
researcher was to examine two variables of community college
student persistence, using the definition of student
persistence as proposed in this study, within the context of
this profile, lending support to the notion that a community
college student persistence paradigm is needed.
Throughout the eighteenth century those scientists who
tried to derive the observed motion of the moon from
Newton's law of motion and gravitation consistently
failed to do so. As a result, some of them suggested
replacing the inverse square law with a law that
deviated from it at small distances . . . . In the
event, . . . one of them discovered how they could
successfully be applied. Only a change in the rules of
the game could have provided an alternative. (Kuhn,
1970; p. 41)
The significance of this study is to add to the impetus
2'4,

19
advanced by Vorhees, Padula, Bean and others that the study
of community college student persistence needs new
approaches. Investigating variables and relationships that
this researcher considers a part of the community college
student persistence issue is one such approach. As Vorhees
(1987) mentioned, conceptualizing a model is necessary and to
examine relationships such as those in this study is an
important step in developing the necessary research to
underpin the process of conceptualizing a student persistence
model for community colleges.
Problem Statement
The two variables of goal commitment, consisting of five
groups of students, and the student's perception of estimated
gains on attaining twenty-three general educational goals
consisting of six dimensions, will be the focus of this
study. The problem is to examine the relationship between
the student's goal commitment and the student's perception of
gains. In order to determine which groups have perceptions
of gains which are different than the other groups, the
difference between the five goal-commitment groups on the six
dimensions of the student's perception of gains variable will
also be examined. How the results of this study will be used
in the development of a community college persistence model
is left for further research but this study was an attempt to
provide information needed to develop a conceptual model of
community college student persistence.

20
Purpose of the Study
Because the components of a full community college
persistence model are too numerous to be investigated within
the scope of this study, a more modest approach was taken.
This study examined two variables that previous researchers
suggested applicable in explaining college student
persistence to either confirm or eliminate those variables in
a community college environment.
The purpose of this study was to examine the
relationship between community college student goal
commitment and the student's perception of gains which were
measured by the Community College Student Experiences
Questionnaire (CCSEQ) using students attending a southeast
Texas community college as subjects.
Definitions
The goal commitment variable was used as a categorical
variable to separate the sample into five groups and will be
the independent variable for the study. The question which
was used to determine goal commitment asks "What is the most
important reason you are attending THIS college at this
time?" The possible responses to this item are: (1) "To
prepare to transfer to a four-year college or university,"
(2) "To gain skills necessary to enter a new job or
occupation," (3) "To gain skills necessary to retrain, remain
current, or advance in a current job or occupation," (4) "To
satisfy a personal interest," and (5) "To improve my English,
reading, or math skills." These responses are representative

21
of the diverse reasons given by community college students
for attending.
Persistence has been defined as attending a community
college in order to attain one of the goals listed above.
The student's perception of gains on twenty-three general
educational goals because of his or her ..:ollege experiences
while attending is an important component of persistence
behavior. The student's perception of gains was measured by
the "Estimate of Gains" section of the CCSEQ. This section
begins with the statement, "In thinking over your experiences
in this college up to now, to what extent do you think you
have gained or made progress in each of the following areas?"
The respondent was requested to mark one of the following
possibilities to each of the twenty-three statements listed
in this section: (1) Very little, (2) Some, (3) Quite a bit,
or (4) Very much. These responses are treated as a Likert
scale with "Very little" assigned a value of one, "Some"
assigned a value of two, "Quite a bit" assigned a value of
three, and "Very much" assigned a value of four. The
twenty-three statements in this section was used to measure
the six dimensions of the students perceptions of gains
variable. The scale score for each dimension was found by
summing the values of the responses to each of the itmes
assigned to it. These six dimensions or scales were
established by the authors of the CCSEQ who used a factor
analysis on the data collected from over 7,500 respondents.
The factor analysis of these data resulted in the following

22
dimensions: (1) Career Preparation, (2) Arts,
(3) Communication Skills, (4) Mathematics, Science, and
Technology, (5) Personal and Social Development, and
(6) Perspectives of the World.
Researcb, Ouestion
The first research question was: What is the
relationship between a student's goal commitment and his or
her perception of gains, as measured by the CCSEQ, for
community college students enrolled in a southeast Texas
community college?
A second research question was: What are the differences
between the goal-commitment groups on the six dimensions of
their perception of gains?
Research Hypotheses
Hypothesis number one was: There is a difference between
the goal-commitment groups on the six dimensions of the
perception of gains construct.
The second research question generated as a hypothesis,
a set of a priori contrasts suggested by Grosset (1989) which
compared the differences between the goal-commitment groups
on each of the six scales of the student's perception of
gains. The second hypothesis was: There is a greater
difference between the transfer group and the four other
goal-commitment groups on the six dimensions of their
perceptions of gains. That is; the transfer group will
report greater perceptions of gains on the six dimensions
than the other four goal-commitment groups.

23
Methodology
Students enrolled in a single community college in
southeast Texas during the Spring Semester of 1992 were used
as subjects for this study which examined the differences
between the five goal-commitment groups, which were
determined by the subject's reason for attending this
particular college and the subject's perception of gains
construct. The gains construct, which consists of six
dimensions, was measured by the twenty-three statements in
the "Estimate of Gains" section of the Community College
Student Experiences Questionnaire (CCSEQ). A factor analysis
of the data collected by the authors of the CCSEQ determined
the six dimensions. Each of these dimensions was then
treated as a Likert-type scale.
Design
The six dependent variables examined in this study
represented six dimensions of the student's perception of
gains construct. The authors of the CCSEQ derived these six
dimensions by factor analyzing the data gathered from over
7,500 returned questionnaires representing students from
twenty-four community colleges. These dimensions of the
student's perception of gains were: (1) Career Preparation,
(2) Arts, (3) Communication Skills, (4) Mathematics, Science,
and Technology, (5) Personal and Social Development, and
(6) Perspectives of the World.
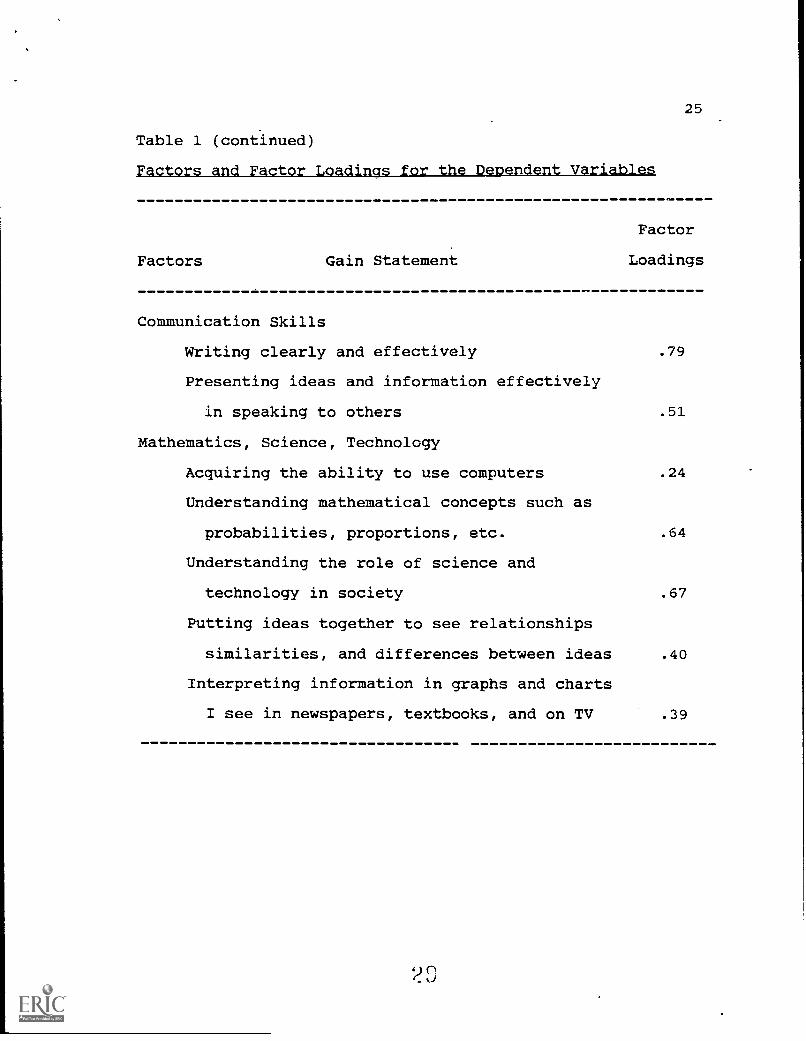
Table 1 lists the factor loadings, as reported in the
CCSEQ manual, for each of the statements used in the
2 I

24
"Estimate of Gains" section of the CCSEQ, grouped by
dimension. The possible responses for each of the student's
perception-off gains statements were: (1) Very Little,
(2) Some, (3) Quite a Bit, and (4) Very Much. Using a
Likert-scaling technique of the "Estimate of Gains"
statements, the value assigned to each response ranged from 1
Table 1
al it it I
Factors Gain Statement
Factor
Loadings
Career Preparation
Acquiring knowledge and skills applicable to
a specific job or type of work .62
Gaining information about career opportunities. .85
Arts
Developing clearer career goals
Becoming acquainted with different fields of
knowledge
Developing an understanding and enjoyment of
art, music, and theater
Developing an understanding and enjoyment of
literature (novels, stories, essays, poetry,
etc.)
.76
.43
.70
.63
25
Table 1 (continued)
Factors and Factor Loadings for the Dependent Variables
Factors
Factor
Gain Statement Loadings
Communication Skills
Writing clearly and effectively .79
Presenting ideas and information effectively
in speaking to others .51
Mathematics, Science, Technology
Acquiring the ability to use computers .24
Understanding mathematical concepts such as
probabilities, proportions, etc. .64
Understanding the role of science and
technology in society .67
Putting ideas together to see relationships
similarities, and differences between ideas .40
Interpreting information in graphs and charts
I see in newspapers, textbooks, and on TV .39
20

Table 1 (continued)
Factors and Factor Loadings for the Dependent Variables
Factors
26
Factor
Gain Statement Loadings
Personal and Social Development
Becoming aware of different philosophies,
cultures, and ways of life .45
Becoming clearer about my own values and beliefs .78
Understanding myself - my abilities and interests .70
Developing the ability to learn on my own,
pursue ideas, and find information .36
Understanding other people and the ability to
get along with different kinds of people .44
Developing good health habits and physical
fitness .26
Perspectives of the World
Developing the ability to speak and understand
another language .33
Developing an interest in political and
economic events .64
Seeing the importance of history for
understanding the present as well as the past .71
Learning more about other parts of the world
and other people .71
3 3

27
for a "Very Little" response to 4 for a "Very Much" response.
The respondent's score for each dimension was found by
summing the value assigned to each of his or her responses to
the gains statements for that dimension. For example, a
subject's score on the dimension "Career Preparation" was
found by summing the values assigned to the subject's
responses to gains statements one, two, three, and four in
the "Estimate of Gains" section of the CCSEQ. The range of
possible scores for the dependent variables were: (1) Career
Preparation: 4 - 16, (2) Arts: 2 - 8, (3) Communication
Skills: 2 - 8, (4) Mathematics, Science, Technology: 5 - 20,
(5) Personal and Social Development: 6 - 24, and
(6) Perspectives of the World: 4 - 16. The scales were
constructed so that the higher the score, the more progress
the student would have perceived.
The in,Aependent variable for the study was goal
commitment, used as a categorical variable, consisting of
five groups of subjects. The subject's response to the
question, "What is the most important reason you are
attending THIS college at this time?", determined to which
one of the five goal-commitment groups the subject was
assigned. The five possible responses to this question were:
(1) "To prepare to transfer to a four-year college or
university," (2) "To gain skills n(c.7'ssary to enter a new job
or occupation," (3) "To gain skills necessary to retrain,
remain current, or advance in a current job or occupation,"
(4) "To satisfy a personal interest," and (5) "To improve my

28
English, reading, or math skills." Because only one
point-in-time measurement of the dependent variables was
collected for these groups, the design was cross-sectional.
The research questions were:
(1) What is the relationship between a student's goal
commitment and his or her perception of gains, as
measured by the CCSEQ, for community college
students enrolled in a southeast Texas community
college?
(2) What are the differences between the goal-
commitment groups with respect to the six
dimensions of their perceptions of gains?
r9Ipulation and Sample
The population for this study included all the students
who were enrolled in a southeastern Texas community college
during the Spring Semester, 1992. The population included
approximately 3,200 students from an area that is heavily
industrialized, mainly by chemical companies. The decision
to use only one community college in the study was based on
cost and convenience to the researcher. The basis for this
decision did not differ from many of the persistence studies
examined by this researcher. The use of only one community
college compromised the generalizability of the results to
other community colleges. However, as stated earlier,
community colleges are, or should be, unique to the community
they serve, and because of this uniqueness, generalizability
of the results to other community colleges may be a moot
32
JP

29
pointenyway.
Since this researcher was obligated to use classes as
the basis for administering the questionnaire,
representativeness of the population was a concern.
Community college students are considered nontraditional, so
the intent was to select a sample which represented the
population with respect to several characteristics. The
characteristics used for testing representativeness of the
sample to the population were gender, ethnicity, age, the
time period for the preponderance of the student's classes
(day, night, or both), and full-time/part-time status. A
student was considered a full-time student if s/he was
enrolled in at least twelve semester credit hours during the
semester.
A sample of classes was selected by a computerized
random selection process, then a chi-square goodness-of-fit
test was used to determine the sample's representativeness
for each of the characteristics listed above. If the
chi-square test showed that the sample drawn was not
representative, a new random sample was drawn using the same
computerized random selection process. Using this process of
selection, a sample of classes was selected. The students
enrolled in those classes represented the population with
respect to the characteristics listed above, and the
questionnaire was administered to that group.
After the first administration of the questionnaire, an
analysis was done in an attempt to determine the actual

30
proportion of each characteristic with respect to the sample.
This process proved to be untenable. Out of the
approximately 550 questionnaires delivered to faculty members
for administration, over 200 were returned uncompleted. As a
result, a second random sample of classes was selected using
the same computerized randomized selection process described
above. It was necessary to follow this process a third time.
After these three separate administrations of the
questionnaire were done, the goal of obtaining 500 completed
questionnaires was attained.
One restriction was imposed upon the study. The
questionnaire had to be administered to the entire class so
that as few classes as possible would be interrupted. This
restriction meant that classes was the only stratum used in
the sampling process. If more strata had been included, each
of the strata would have had to have a sample drawn from it
(Kalton, 1983). Even though this restriction was imposed,
and problems were encountered during the three
administrations of the questionnaire, 510 questionnaires were
returned for analysis.
A class roll was given with each set of questionnaires
with instructions to the faculty asking them to mark the
names of those students who did not complete the
questionnaire. Some of the class rolls were not marked, and
some were not returned.
One other problem which arose, also emanated from the
lack of cooperation by the faculty. Some of the classes
3

31
chosen were not given the questionnaire because faculty chose
not to administer it. Several of the questionnaires were
"lost." One excuse given was that the entire class had
already responded to the questionnaire. The most frustrating
problem was the number of withdrawals and absences, in some
cases over fifty percent, which accounted for many of the
questionnaires' not being completed.
These problems contributed to the non-representativeness
of the sample. Table 2 gives the results of using a
chi-square goodness-of-fit test for each characteristic of
the sample to test the sample for representativeness of the
population. The results in Table 2 were quite disappointing,
but the sampling bias which resulted, if any, was not
examined. After the chi-square analysis for goodness-of-fit,
Table 2
Results of the Goodness-of-Fit Tests
Subpopulation
Chi-Square
Degrees of
Freedom
P
Represent-
tative?
Gender 15.687 1 < 0.001 No
Ethnicity 9.965 5 0.076 Yes
Part/Full Time 34.079 1 < 0.001 No
Age 87.643 5 < 0.001 No
Day/Night/Both 83.048 2 < 0.001 No
35

32
shown in Table 2, ethnicity was the only characteristic that
proved to be representative of the population.
Instrument
The instrument used in this study was the Community
College Student Experiences Questionnaire (CCSEQ), as
developed by the Center for the Study of Evaluation, Los
Angeles, California. Dr. C. Robert Pace, who has been active
in questionnaire development of this type for a number of
years, headed the development of the CCSEQ and was assisted
by Dr. Jack Friedlander and Dr. Penny Lehmann. Prior to the
CCSEQ, Dr. Pace developed the College Student Experience
Questionnaire (CSEQ), an instrument that is similar to the
CCSEQ and has been administered to over 25,000 four-year
college students (Pace, 1990).
Reliabilities for the Quality of Effort scales, as
reported in the CCSEQ Manual, are displayed in Table 3.
These scales are Likert-type scales developed from the
various activities sections on the CCSEQ. As shown in Table
3, the reliabilities were quite good for all these activity
scales. The reliabilities of the scales were also calculated
using the data collected from this study which are also
reported in Table 3, and closely corresponded to the ones
given in the CCSEQ manual. The item-scale correlations are
also given in the test manual and upon, examination, suggest
that the activity items measured were valid. Even though

33
Table 3
College Activities Scales: Estimates of Re'iabilities
Scale Cronbach's alpha
CCSEQ Manual
Cronbach's Alpha
This Study
Course Activities .85 .84
Library Activities .87 .88
Faculty .86 .80
Student Acquaintances .89 .87
Art, Music, and Theater .83 .75
Writing Activities .87 .93
Science Activities .93 .93
Vocational Skills .94 .95
these items were not used in the study, should the
questionnaire's credibility be questioned, the inclusion of
this information would be very helpful in alleviating this
concern.
Data Collection Procedure
The data were collected from the administration of the
CCSEQ to the subjects selected for the study, as explained
aboVe. The completed questionnaires were sent to the Center
for the Study of Evaluation, Los Angeles, California, for
scanning. Once scanned, the data were returned on diskette
for analysis. The data were transferred from the diskette to
a Digital Equipment Corporation VAX 3400 for analysis using
3 '-1

34
SPSS-X, version 4.0.
The administration of the questionnaires was done as
prescribed by the Human Subjects Committee, University of
Houston. The questionnaire had a cover letter describing to
the subject the methods to be used in responding to the
questionnaire and how the subject was to return the completed
questionnaire to insure confidentiality.
Data Analysis Procedures
In order to compare the results presented in the test
manual with the data obtained from the study, a factor
analysis was done on the estimate of gains responses.
Cronbach's alpha was also calculated on the scales, as
defined, so that the factors obtained in the study could be
compared with the results presented in the CCSEQ user's
manual.
The factor analysis on the data collected resulted in
five factors rather than six, as reported in the CCSEQ
manual. The "oblimin" rotation was used because this was the
method used to determine the six factors reported in the
CCSEQ manual. Cronbach's alpha was calculated for the six
factors. These reliabilities ranged from .76 for factor one
(Career Preparation) to .56 for factor two (Arts and
Humanities). In fact, the reliability of only two factors
(Career Preparation and Personal and Social Development)
exceeded the recommended .70 floor. These results suggested
that the sample used for this study was not similar to the
sample reported in the CCSEQ manual. Two reasons that may

35
explain these discrepancies are: (1) the sample did not meet
the representativeness criteria established for this study,
and (2) the uniqueness of community colleges and the
nontraditional profile of their students may indicate that
one should not expect congruity between the results reported
in the CCSEQ manual and other community colleges.
An example of the incongruity between the community
colleges used in the CCSEQ manual and the one in this study
was the gender characteristic. The proportion of males
reported in the CCSEQ manual was 43% male, whereas for the
community college used in this study the proportion of males
was 50%. Another example of incongruity was ethnicity. For
the population used in this study, 77.5% of the population
was white, whereas for the sample in the CCSEQ manual, the
proportion of white students was 61%. The differences in the
profile of the two sets of subjects may account, at least in
part, for the differences found in the results of the factor
analysis as well as the reliabilities between the sample used
in this study and the CCSEQ manual.
Even though the factor analysis of the data used for
this study was not expected to mirror the results reported in
the CCSEQ manual, more congruity between the two sets of
results was expected. The factors reported in the CCSEQ
manual were used in this study rather than those obtained
from doing the factor analysis on the data collected for this
study. This factor analysis was conducted for comparative
purposes and to provide more information about the data

36
collected. The researcher had no intention of replacing
those factors set forth in the CCSEQ manual.
In addition to factor analysis, multivariate analysis
was used because multivariate analysis is designed to examine
several dependent variables simultaneously, as a system. The
results of a multivariate analysis indicate whether or not
there is a difference between goal-commitment groups with
respect to the set of dependent variables. Because this
study consisted of six dependent variables, and because the
research questions asked about the system of variables,
multivariate analysis was used. Multivariate analysis was
also used because this type of analysis provides a more
complete and detailed description of the phenomena being
studied (Stevens, 1986). Multivariate analysis takes into
account the correlation that may exist between the dependent
variables, which is not done in the univariate-only (or
ANOVA) analysis, which makes the multivariate analysis more
powerful than the univariate-only method (Stevens, 1986: Bray
and Maxwell, 1990). Even though these reasons provided
justification for using multivariate analysis, several
concerns about using this methodology were also considered.
One concern arises from using several types of
significance tests in the same study, such as using multiple
t-tests. The level of protection provided by the nominal
level of significance (alpha = .05) could be inflated using
multiple significance tests on the same set of data. An
experimentwise protection for the .05 level of significance
4

37
for subsequent univariate tests was desired. An alternative
to this approach would have been to use a Bonferroni or other
procedure to distribute the alpha across the various
follow-up tests. Bray and Maxwell (1982) addressed this
issue stating that "the term 'protected' comes from the idea
that the overall multivariate test provides protection from
an inflated alpha level on the p univariate tests" (p. 341).
Stevens (1986) offers a conciliatory strategy for the
researcher wishing to resolve this dilemma: "In an
exploratory study, testing each variable for significance at
the .05 level, after a significant multivariate result, is a
reasonable procedure" (p. 143). Bray and Maxwell concur with
Stevens' suggestion.
The experimentwise level of significance for this study
was set at .05 and was used for the overall multivariate
test. Since the result of this test was statistically
significant, univariate F-tests followed. As suggested by
Stevens (1986), the significance level for each of the
univariate F-tests was also set at .05.
The multivariate technique (MANOVA) provided analysis on
the set of dependent variables, taking into account the
correlations between them and indicated that there were group
differences, but not which group differed significantly on
which dependent variable. The univariate F-tests provided
information that the groups differed with respect to the
dependent variables but did not take into account
correlations between the dependent variables. The univariate

38
tests did not indicate which groups differed significantly on
any of the dependent variables. In order to resolve this
predicament, two additional statistical methods available to
thF researcher for additional analysis were: (1) contrasts,
either planned (a priori) or post hoc, and (2) discriminant
analysis.
The first of these, planned contrasts, was used to
analyze the data more parsimoniously. An a priori contrast
was chosen so that the experimentwise significance level
(alpha = .05) could be used as the level of significance for
the contrasts. The a priori contrast chosen for this study
was the "simple" contrast as provided in the MANOVA procedure
section of SPSS-X. Grosset (1989) suggested the a priori
contrast used for this study: "Research has indicated that
the more likely a student is to possess a transfer goal or
the less definite they are about their satisfaction with the
college or their intentions, the less likely they will be
[to] persist" (p. 25). This set of contrasts compared the
transfer group (Reason 1) with the other four groups on the
six dimensions of the student's perceptions of gains. These
contrasts indicated whether or not the transfer group had
significantly greater estimate-of-gains scores than the other
groups on each dimension.
The other statistical analysis available to the
researcher was discriminant analysis. The reason for using
discriminant analysis was explained by Stevens (1986).
Discriminant analysis has two very nice features:
4 -)

I
39
(1) parsimony of description, and (2) clarity of
interpretation. It can be quite parsimonious in that in
comparing 5 groups on say 10 variables, we may find that
the groups differ mainly on only two major dimensions,
i.e., the discriminant functions. It has a clarity of
interpretation in the sense that separation of the
groups along one function is unrelated to separation
along a different function. This is all fine provided
we can meaningfully name the discriminant functions and
that there is adequate sample size so that the results
are generalizable. (p. 232)
The usefulness of this technique was also explained by Bray
and Maxwell (1982).
Discriminant analysis provides more sophisticated and
complex analysis of the data than does the univariate
approach. However, this complexity can be a drawback to
the use of discriminant analysis, particularly when
there are multiple significant discriminant functions.
The underlying dimensionality of the variables, the
relationship of the variables to the underlying
dimensions, and the interrelationships among the
variables are all considered in the discriminant
analysis. In contrast, the univariate approach simply
provides the individual effects of each variable,
ignoring all other variables. Inspecting the univariate
F ratios along with the discriminant coefficients and
canonical variateccorrelations will often provide useful

40
information for interpreting the unique and common
contribution of each variable. (p. 347)
As useful as discriminant analysis seems, this technique
has the following two limitations: (1) results are not likely
to be replicated with different data sets, and (2) since the
analysis uses the data to factor out different functions
repetitively, there is a tendency for capitalization on
chance. After weighing both its advantages and limitations,
discriminant analysis was done for two primary reasons:
(1) its explanatory power of helping the researcher describe
the major differences among groups, and (2) its method of
classifying subjects into groups based on the dependent
variables (Stevens, 1986: Bray and Maxwell, 1980).
The results of the discriminant analysis included
standardized discriminant function coefficients which reflect
the unique contribution of any dependent variable over and
above that of the remaining variables. The standardized
structure coefficients indicate a variable's contribution to
the calculation of the discriminant score. Caution has to be
taken by the researcher in the interpretation of these
coefficients as "each take into consideration the
simultaneous contribution of all the other variables"
(Klec,:a, 1980, p. 83). The discriminant function-variable
correlations, which are the correlations between each of the
discriminant functions and the original variables, were also
used. These coefficients are also referred to as the total
structure coefficients (Stevens, 1986: Daniel, 1990). These
44

41
coefficients help name the discriminant functions in that
high correlations indicate that the variable and the
discriminant function are measuring similar characteristics.
As suggested by Stevens (1986), both the standardized
coefficients and the discriminant function-variable
correlations were used to interpret the discriminant
functions and to group differences on the dependent
variables. As an added confirmation, the analysis included
results on how well the subjects were classified by the
dependent variables.
Analyses Overview
This system of dependent and independent variables was
investigated using two multivariate analysis methods. The
multivariate analysis of variance (MANOVA) showed that the
first research hypothesis was tenable because there was a
significant difference between the goal-commitment groups
with respect to the six dimensions of the dependent variable.
Further investigation suggested there was also a significant
difference between the goal-commitment groups and the six
dimensions of the student's perceptions of gains construct.
The interpretation of these results led to the use of
univariate tests to determine all the significant differences
between the goal-commitment groups on each of the dependent
variables. Even though each of these six univariate tests
was statistically significant which indicated group
differences existed, these tests did not point out which
goal-commitment group was significantly different from

42
another on each of the dependent variables.
A priori contrasts were used to examine the above
differences in more detail. The assumption that the
preparing-for-transfer goal-commitment, which was more
strategic than the other goal commitments, guided the choice
of using the transfer group as the basis for the contrasts.
The results of all but five of these contrasts showed that
there was a significant difference between the transfer group
and the other four goal-commitment groups on each of the
dependent variables. These significant contrasts supported
the notion that the more strategic the goal-commitment, the
more progress the student would perceive s/he made with
respect to the general education goals.
Discriminant analysis was the other multivariate
analysis technique used to investigate the data. The
discriminant functions did not seem to classify the groups
very well, which suggested that the dependent variables were
not good predictors of group memberpip. The results of this
analysis did, however, suggest that the six dependent
variables may be measuring two latent variables which cs3re
the first two discriminant functions in the analysis.
Before these analyses are discussed in detail, an
explanation of the multivariate analysis assumptions is
included.
Validation of the Multivariate Analysis Assumptions
When using a multivariate analysis method, several
assumptions must be validated. These assumptions are:

43
(1) independence of the subjects' responses, (2) multivariate
normality, and (3) homogeneity of the covariance matrices.
The independence-of-responses assumption was addressed by
instructing the subjects to respond to the CCSEQ individually
therefore violation of the independence-of-responses
assumption was not a concern of this researcher. According
to Stevens (1986), "Whenever the treatment is individually
administered, observations are independent" (p. 203).
Multivariate normality and homogeneity of covariance matrices
are closely related in that violation of the homogeneity-of-
covariance-matrices assumption may di. tly result from a
violation of the multivariate-normality assumption.
The significance test used to examine the homogeneity-
of-covariance-matrices assumption was "Box's M" test, which
was significant (M = 119.18, p < .05). This test i.s very
sensitive to non-normality of the multivariate data (Stevens,
1986). Bray and Maxwell (1990) agreed: "Although a test of
homogeneity of covariance matrices is widely available (Box's
M), this test is generally not useful [emphasis mine] because
the test itself is extremely sensitive to departures from
normality" (p. 34). This impasse seemingly could have been
resolved by examining multivariate normality for the data
collected; however, the outcome of the examination became a
complex process with mixed results.
A single significance test for multivariate normality
was not available. Instead, Stevens (1986) suggested two
processes to use in an investigation of multivariate

44
normality. These processes were: (1) use of Mahalanobis'
distances for a graphing procedure which would indicate
normality (explained in Stevens (1986), pages 207 through
212), and (2) examination of several univariate statistics
for each group on each dependent variable. There were 510
responses for which to find Mahalanobis' distances;
therefore, using these distances in a complex procedure to
construct a graph seemed to be an untenable strategy. The
second suggestion of using univariate statistics to show
multivariate normality was the approach taken by this
researcher.
The first univariate analysis used was the examination
of the "generalized variances" for each of the five groups.
These variances were the multivariate measures of
within-group variability for the goal-commitment variables
Table 4
Generalized Variances for Goal-Commitment Groups
Goal-Commitment Group Group Size Generalized Variance
1. Prepare for transfer 213 5081.73
2. Gain skills for new job 16e 2192.66
3. Gain skills to remain
current or advance
81 1253.77
4. Satisfy a personal interest 30 4230.96
5. Improve basic skills 6 N/A

45
(Table 4). In the simplest interpretation of this strategy,
if the largest generalized group-variance was associated with
the largest group-size, the multivariate test (Box's M) would
have been conservative, and the significance reported would
have been too small. If, on the other hand, the smallest
group-size had the largest generalized variance, the
multivariate test would have been liberal, and the
significance would have been too large. The pattern of large
variance with large group-size was not consistent for every
pair of goal-commitment groups. The largest variance
(5081.73) was associated with the group with the largest
group-size (n = 213). Group five (students who were
attending to improve basic skills) had a very .-Nall
group-size (n = 6) but a very large generalized variance
(4230.96). Group four had a small group-size (n = 30) but a
relatively large generalized variance (4230.96). However,
when comparing groups one through four in pairs, the
small-size/large-variance relationship was valid. This
situation was quite similar to an example explained by
Stevens (1986), who concluded, "the effect of heterogeneity
should not be serious, since the literal and conservative
tendencies co-existing [sic,] should have a somewhat
cancelling out effect".(p. 228). Even though the small
group-size of the improve-basic-skills group may have had a
mitigating effect on multivariate normality, the
cancelling-out effect described above, was considered a
reasonable conclusion for this study.
49
46
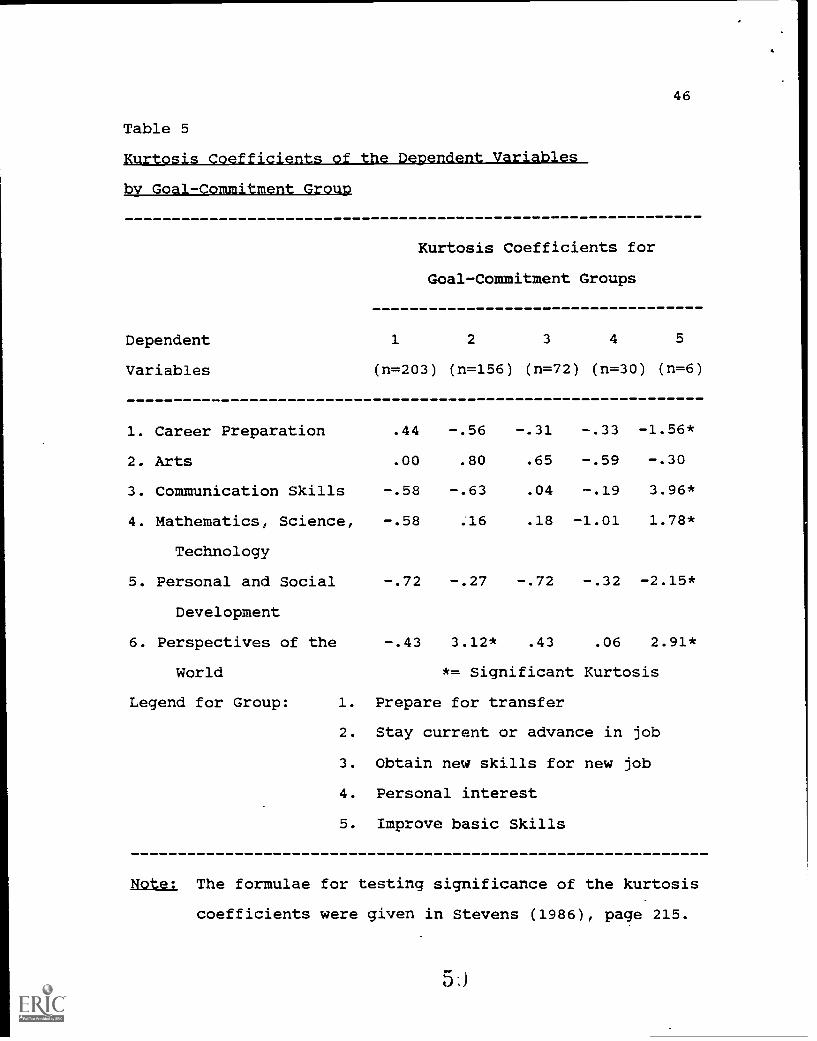
Table 5
Kurtosis Coefficients of the Dependent Variables
by Goal-Commitment Group
Kurtosis Coefficients for
Goal-Commitment Groups
Dependent
Variables
1
(n=203)
2 3 4 5
(n=156) (n=72) (n=30) (n=6)
1. Career Preparation .44 -.56 -.31 -.33 -1.56*
2. Arts .00 .80 .65 -.59 -.30
3. Communication Skills -.58 -.63 .04 -.19 3.96*
4. Mathematics, Science,
Technology
-.58 .16 .18 -1.01 1.78*
5. Personal and Social -.72 -.27 -.72 -.32 -2.15*
Development
6. Perspectives of the -.43 3.12* .43 .06 2.91*
World *= Significant Kurtosis
Legend for Group: 1. Prepare for transfer
2. Stay current or advance in job
3. Obtain new skills for new job
4. Personal interest
5. Improve basic Skills
Note: The formulae for testing significance of the kurtosis
coefficients were given in Stevens (1986), page 215.
5,)

47
Another procedure used to examine univariate normality
was the inspection of each group on each dependent variable.
The two statistics which could have been used for testing
univariate normality, were kurtosis and skewness. Because
platykurtosis (flatness) has the effect of reducing
statistical power, kurtosis was the more important statistic
to use. Except for group five (attending to increase basic
skills), most of the kurtosis statistics (Table 5) were not
significant. This group had such a small group-size, (n=6),
the non-normality results were not surprising. The analysis
of the kurtosis coefficients suggested that, for the most
part, the data were multivariate normal.
The various univariate tests used as surrogates for
testing multivariate normality yielded mixed results.
However, MANOVA is robust with respect to violations of the
multivariate-normality assumption. The results of this study
are presented within the context of these significance tests,
trusting the robustness of the MANOVA procedure to hurdle any
bias which may have been introduced because of violations of
the multivariate-normality assumption.
The cause for the significance of Box's M (used for
testing homogeneity of covariance matrices) was considered,
in part, a result of the small group-size associated with the
basic-skills group. Another reason may have been the non-
representativeness of the sample, as explained earlier.
MANOVA Results
After the assumptions were examined, the overall
5

48
multivariate test (MANOVA) was performed as the first stage
in the systematic process of answering the research
questions. The first step in this investigation was
determining the significance of the system of dependent
variables and five goal-commitment groups. The multivariate
test was statistically significant (Wilk's lambda = .677,
p < .05). This result suggested that hypothesis one was
tenable, and there was a statistically-significant difference
between the five goal-commitment groups with respect to the
six dimensions of the student's perception of gains
construct.
Univariate Results
Since the overall multivariate test was significant,
univariate tests were conducted which examined the
Table 6
Univariate F Tests on the Five Goal Commitment Groups
Goal-Commitment Group
Career Preparation
F value
(DF = 4,462)
8.99 <
p
.001
Arts 19.38 < .001
Communication Skills 8.48 < .001
Mathematics, Science, Technology 6.17 < .001
Personal and Social Development 4.13 .003
Perspectives of the World 16.30 < .001

49
differences between each of the goal-commitment groups with
respect to the six dimensions of the dependent variable.
Each of these tests was statistically significant, as shown
in Table 6.
These significant univariate F-tests suggested that for
each of the goal-commitment groups there was a significant
difference at the same level of significance (Stevens, 1986),
between at least one pair of the six dimensions of the
student's perception of gains construct at the same level of
significance (Stevens, 1986). There was no guarantee as to
which variable-pair would be significant, nor indication of
the linear combination of the variables needed for the
contrast.
Results of the A Priori Contrasts
The final analysis of the data for this multivariate
analysis (MANOVA) compared the transfer group to each of the
other four groups on each of the dependent variables. The
second research hypothesis, which included the a priori
contrasts, conjectured that the transfer group would have
greater perceptions of gain scores for each of the dependent
variables than the other four groups. These contrasts used
the averages (Table 7) of each group on each of the dependent
variables-to test for significance. The contrasts tested
whether or not the means for the transfer group on the six
dependent variables was greater than any of the means for the
remaining four goal-commitment groups. The results of these
contrasts are presented in Table 8.
t, iJ

50
Table 7
Averages. Expressed as Standard Scores. of the
Dependent Variables by Goal-Commitment Grout
Goal-Commitment Perception of Gains Variables
Group
1 2 3 4 5 6
Prepare for transfer 0.10 0.38 0.23 0.18 0.16 0.38
Skills for a new job 0.23 -0.31 -0.02 0.02 -0.03 -0.33
Stay current or
advance in job
0.13 -0.50 -0.42 -0.31 -0.21 -0.31
Personal interest -0.52 0.44 -0.21 -0.43 -0.33 0.06
Basic skills -1.52 -0.45 -0.87 -0.77' -0.54 -0.46
Legend for Gains Variables:
1. Career Preparation
2. Arts
3. Communication Skills
4. Mathematics, Science, Technology
5. Personal and Social Development
6. Perspectives of the World
Upon examination of the significance tests for the
contrasts, there were five (out of 24 separate tests!) non-
significant results (the averages used for this discussion are
the actual averages, rather than the standard scores): (1)
the difference (.16) between the averages for the transfer

51
Table 8
Significance Tests for Contrasts
Dep. Contrast Number
Var.
1 2 3
F p F p F p F
4
p
1 9.79 .002 3.31 .069* 5.20 .023 12.68 < .001
2 47.86 < .001 44.83 < .001 0.12 .727* 4.61 .032
3 6.99 .008 26.45 < .001 5.66 .018 7.60 .006
4 3.00 .084* 14.71 < .001 10.09 .002 5.46 .020
5 4.09 .044 10.09 .002 6.82 .009 3.03 .082*
6 51.31 < .001 32.72 .002 3.15 .077* 4.72 .030
* = non-significant result
Multivariate Tests using Wilk's lambda (WL)
WL .811 .847 .962 .961
p < .05 p <.05 p < .05 p < .05
Legend for Dep(endent) Var(iables):
1. Career Preparation
2. Arts
3. Communication Skills
4. Mathematics, Science Technology
5. Personal and Social Development
6. Perspectives of the World
5

52
Table 8 (continued)
Significance Tests for Contrasts
Legend for Contrasts:
The goal-commitment group attending to prepare for
transfer is compared with each of the others:
1. Transfer vs. Skills for a new job
2. Transfer vs. Stay current or advance
3. Transfer vs. Personal interest
4. Transfer vs. Improve basic skills
Note: F = F value
group (.18) and the skills-for-a-new-job group (.02) on the
Mathematics, Science, and Technology dimension, (2) the
difference (-.03) between the averages for the transfer group
(.10) and the stay-current-or-advance group (.13) on the
Career Preparation dimension, (3) the difference (-.06)
between the averages for the transfer group (.38) and the
personal-interest group (.44) on the Arts dimension, (4) the
difference (.32) between the averages for the transfer group
(.38) and the personal-interest group (.06) on the
Perspectives of the World dimension, and (5) the difference
(.70) between the averages for the transfer group (.16) and
the basic skills group (-.54) on the Personal and Social
Development dimension. These non-significant results, three
of which included the personal-interest group or the basic-
skills group, suggested that the two groups did not differ in

53
their perceptions of gains on the twenty-three general
education goals. There was a large group-size difference
between these groups. These results were not counter-
intuitive as the groups with the small group-size had a
relatively large generalized variance. This large difference
in group-sizes may account for the non-significant F-tests.
In fact, there was a generous preponderance of significant
F-tests, considering that the basic-skills group had such a
small group-size.
One of the other two non-significant results (transfer
group versus skills-for-new-job group on the Mathematics,
Science, and Technology dimension) indicated that the
perception of progress on this dependent variable was the
same for both groups. This may have been precipitated by the
course demands since both groups were, in essence, acquiring
new skills which included an emphasis in at least one of the
areas of mathematics, science, or technology.
The last non-significant contrast, comparing the
transfer group to the stay-current group on the Career
Perspectives dimension, was not surprising and should have
been predicted. Both groups should be concerned with a
"career path" and, intuitively, should have overlap on this
dimension.
In all but five of the contrasts, the results suggested
that the group who prepared for transfer perceived they had
greater gains in attaining the twenty-three general
educational goals used to measure this construct than the

54
other four groups.
Results of Discriminant Analysis
The second multivariate analysis technique used to
investigate the data was discriminant analysis. The reason
for using this technique was twofold: (1) to determine
whether or not the dependent variables could be used as
predictors of the goal-commitment variable, and (2) to
discover whether or not the six dependent variables were
measuring other underlying constructs. The results of the
discriminant analysis are presented in Table 9. These
results suggested that the first two discriminant functions
accounted for most of the variance (75.57% + 16.04% = 91.60%)
for these data. In fact, only the first three discriminant
functions were significant.
Table 9
Canonical Discriminant Function Results
Funct- Eigen Canonical After Chi df
ion Value Variance Corr. Funct. Square
p
0 179.27 24 < .001
1 .330 75.57 .498 1 47.89 15 < .001
2 .070 16.03 .256 2 16.72 8 .033
3 .025 5.78 .157 3 5.24 3 .155
4 .011 2.62 .106
Legend: df = degrees of freedom, Corr. = Correlation
5 (6

55
In order to more parsimoniously examine the results of a
discriminant analysis, two additional items of information
were needed: (1) the standardized discriminant function
coefficients (Table 10) and (2) the structure matrix (Table
11). This information indicated which of the dependent
variables were carrying the same information as the original
variable. The standardized discriminant function
coefficients suggested that the Career Preparation variable
coefficient (-.63721) and the Arts variable coefficient
(-.68983) are supplying the bulk of the information for this
Table 10
Standardized Discriminant Function Coefficients
Dependent Function Coefficients
Variable
1 2 3 4
Career Preparation -.637 .294 1.022 -.087
Arts -.690 -.249 .383 -.746
Communication Skills .010 .664 -.269 -.384
Mathematics, Science .023 .540 -.478 -.080
Technology
Personal and Social -.129 -.166 -.753 .457
Development
Perspectives of the .517 .053 .620 .875
World
5 5

56
discriminant function (1 in Table 9).
The correlations displayed in the structure matrix
helped define any underlying trait that may have been
measured by the dependent variables. "The correlations give
a direct indication of which variables are mostly aligned
with the unobserved trait which the canonical variate
(discriminant function) represents. On the other hand, the
coefficients are partial coefficients, with the efftcts of
the other variables removed" (Stevens, 1986, p. 235).
Klecka(1990) provided a rule-of-thumb to use when
interpreting these coefficients. "When the absolute
magnitude of the coefficients is very large (near +1.0 or
-1.0), the function is carrying nearly the same information
as the variable" (p. 31).
In order to interpret the discriminant analysis using
these two sets of information, they must be examined
juxtapositionally. "That is, use the correlations for
substantive interpretation of the discriminant functions, but
use the coefficients to determine which of the variables are
redundant given that the others are in the set" (Stevens,
1986, p. 236).
The bivariate correlations displayed in the structure
matrix suggested that the information included in the six
dimensions of the students' perceptions of gains construct,
could be explained by just two of the four discriminant
functions. These two discriminant functions suggested two
underlying constructs. The standardized coefficients
C.)

Table 11
Structure Matrix (Correlations)
57
Dependent Correlations with Discriminant Functions
Variable
1 2 3 4
Arts .69 .32 .28 -.38
Perspectives of the .60 .45 .29 .58
World
Career Preparation .28 .81 -.07 -.25
Communication Skills .16 .80 .14 .16
Mathematics, Science -.36 .64 .55 .01
Technology
Personal and Social .17 .60 -.09 .29
Development
indicated the "loading" of a variable's coefficient.
Comparing these "loadings" gave the relative contribution of
each variable to the discriminant function. That is, the
variable with the largest value contributed the greatest
amount of information to the discriminant function.
The first discriminant function had the following three
dependent variables as its primary contributors: (1) Career
Preparation, (2) Arts, and (3) Perspectives of the World. An
examination of the correlations in Table 11 suggested that
othe following dependent variables defined the function:

58
(1) Arts, and (2) Perspectives sf the World. In conclusion,
this researcher identified the following underlying construct
Table 12
Classification Results
Actual
Predicted
Goal-Commitment Groups
Group N 1 2 3 4 5
1 203 154 47 1 0 1
75.9% 23.2% .5% 0% .5%
2 156 53 96 2 0 0
34.0% 61.5% 4.5% 0% 0%
3 72 24 39 9 0 0
33.3% 54.2% 12.5% 0% 0%
4 30 23 3 3 1 0
76.7% 10.0% 10.0% 3.3% 0%
5 6 5 1 0 0 0
83.3% 16.7% 0% 0% 0%
Percentage of "Grouped" cases correctly classified = 55.67%
Legend for Group: 1. Prepare for transfer
2. Stay current or advance in job
3. Obtain new skills for new job
4. Personal interest
5. Improve basic skills

59
measured by discriminant function one: Progress in learning
other cultures and societies through visual media such as
art, reading, and observation.
Information for the second discriminant function was
primarily provided by the following dependent variables:
(1) Mathematics, Science, and Technology, and
(2) Communication Skills. The variables which were used to
define the function were: (1) Career Preparation,
(2) Communication Skills, (3) Mathematics, Science, and
Technology, and (4) Perscnal and Social Development. In
conclusion, this researcher identified the following
underlying construct being measured by discriminant function
two: The perception of gains in the core knowledge needed to
continue until one's goal is attained.
One other result of the discriminant analysis was
obtained by forcing the SPSS program to classify the
dependent measures into the five goal-commitment groups. The
object of this last analysis was to determine if the set of
dependent variables could be used as predictors. The
comparison of this forced grouping with the actual grouping
is displayed in Table 12.
Only 55.67% of the cases were correctly classified by
the discriminant analysis. This percentage seemed to suggest
that the dependent variables were not good predictors of
goal-commitment group. However, upon closer examination, the
first two groups were predicted quite well (75.9% and 61.5%
respectively). In comparison to other studies similar to
6 kJ

60
this one, the overall percentage, 55.67%, was at least as
good as those.
Summary
The multivariate analysis suggested that the research
hypotheses were tenable except for five of the twenty-four a
priori contrasts. The results of the analysis also suggested
that students who have different goal-commitments have
different perceptions of progress on the twenty-three general
education goals measured. As indicated by several
researchers of student persistence, this perception of making
progress has been linked to an overall satisfaction
perception which, in turn, enhances student persistence.
One of the more interesting findings resulted from the
discriminant analysis. This analysis suggested that the
perception of gains construct could be reduced to two
underlying variables, which were the first two discriminant
functions.
Conclusions. Implications and Recommendations
Community college student persistence, defined as
attending a community college until a student's reason-for-
attendance goal is attained, was the context of this study.
Counter to the traditional research in student persistence,
neither time limitations nor degree completion was a concern
of this researcher and was not included in the persistence
definition. As was pointed out by Grosset (1989), Vorhees
(1987), and others, using atheoretical models has been a
problem in studying community college student persistence.

61
At least two reasons can be identified for this lack of model
development: (1) the lack of clear research constructs for
community college student persistence, and (2) the number and
complexity of the variables available for the model. This
study addressed both of these issues, however, only two of
the many possible variables that could have been included in
a community college persistence model were examined.
The independent variable was goal commitment, which
consisted of five student groups in which each group
represented a reason for attending. The dependent variable
was the student's perception of gains construct, which
consisted of six dimensions. This dependent variable
measured the student's perceptions of gains on twenty-three
general education goals (a different construct from goal
commitment). The impetus for this study was the notion that
the more strategic the goal commitment, the greater the
progress the student's perception of gains with respect to
the general education goals.
These two sets of variables were first investigated as a
system, in the multivariate sense, to determine if there were
differences between the goal-attainment groups with respect
to the dependent variables. After multivariate significance
was determined, univariate tests and a priori contrasts were
used to investigate which goal-commitment groups were
significantly different with respect to each dependent
variable.

62
Conclusions
The results suggested that the first research hypothesis
was tenable. That is, there was a significant difference
between the goal-commitment groups with respect to the
student's perception of gains. The second hypothesis was
separated into two parts, the first of which, was analyzed by
using univariate tests. The results of these tests suggested
that there was a significant difference between the
goal-commitment groups with respect to each of the six
dimensions of the student's perception of gains construct. A
priori contrasts were used to analyze the second part of the
hypothesis. The results of these contrasts suggested that
there was a significant difference between the transfer group
and the other four goal-commitment groups, except for five of
the twenty-four contrasts. These significant contrasts
suggested that the more strategic the goal commitment, the
more likely the student would perceive greater gains.
The importance of establishing this relationship between
the student's perception of gains and persistence was given
by Stark, Straw, and Lowther (1986). "Since few research
studies of academic achievement have included student goals
in the student success equation, the potential is largely
untapped" (p. 6). Terenzini and Wright (1987) offered
additional support for this notion of the importance of goal
commitment by stating, "These commitments might well be
expected to influence, for example, the amount of effort a
student exerts, which, in turn, is likely to affect the level
6 c'

63
of that student's academic (and possibly social) integration"
(p. 166). This findings of this study supported this notion.
Implications
The implications are separated into three categories:
(1) implications for policymakers, (2) implications for those
who deal with curricular and classroom-teaching issues, and
(3) implications for the institutional effectiveness process
(outcomes).
Implications for Policymakets
For policymakers, the results have implications for the
following outcomes: (1) student-institutional fit, (2)
enrollment policies, (3) support services, and
(4) student retention. Goal commitment has been linked to
student persistence both directly and indirectly. For
example, an indirect link has been made through a general
satisfaction-of-college-experiences construct. This study
showed the viability of the relationship between goal
commitment and a student's perception of gains with respect
to general education goals. The next research step would be
to determine the effect on student persistence of progress
made toward attaining these twenty-three goals. One might
conjecture that the intervening variable of student
satisfaction might have to be investigated first;.however,
from previous research, this link between the student's
perception of gains and student persistence has already been
established.
Not much imagination is needed to understand the
6 ,

64
necessity for a community college to provide a variety of
programs and services to meet the varied needs of the
community it serves. This understanding forces a community
college to "know its clientele." If congruity does not exist
between what students need (goals) and what a community
college provides, the college will atrophy.
Since goals motivate and direct human behavior, it
stands to reason that colleges would want to assess those
goals. By doing a goal assessment of its students, problem
areas can be identified which would result in important
program changes, curricular improvements, and new or improved
support services (such as counseling, job placement, student
aid, and so forth). More importantly, goal assessment can
bring greater understanding of student persistence.
Community colleges should be interested in student
persistence and how to help students achieve their goals.
Knowing the student's goals, which is an important component
of motivation and student behavior, should help community
colleges implement changes in various processes to take
advantage of the student's goal commitment, thereby improving
student persistence.
Institutional mission and goals are the determinants of
institutional behavior. Grosset (1989) explains the
connection between a community college's mission statement
and student persistence.
Policymakers must come to a decision as to the character
of their educational mission and therefore to an
60

65
understanding of the purpose for which students are to
be admitted and retained within the institution. This
exercise should help clarify the types of student
departure that will be the object of institutional
action and those which are to be considered the natural
outcomes of institutional functioning. (Grosset, 1989,
p. 14)
This study gives an institution a basis upon which to
evaluate its student persistence strategy in light of its
mission and goal statements. In other words, if an
institution's mission and goals prevent the assessment of
student's goals, institutional changes must be made.
Implications for Teachers and Curriculum Directors
The implications for classroom teachers and curriculum
directors are quite explicit. How can teachers help students
achieve their goals if the faculty are unaware of them? How
do faculty expect students to persist if student goals are
not being met? The implication in the context of this study
is that if faculty help students make progress on attaining
their goals, students will tend be more satisfied with their
college experiences and will persist.
Teachers have a set of intended goals they expect the
students to attain and students have their own set of goals
they expect to attain. These two sets of goals not only
impact classroom achievement but also impact student
persistence. Stark, Straw, and Lowther (1989) describe the
role of goals in the classroom by stating, "it increasingly o

66
is apparent that student goals are mediators between the
outcomes instructors intend and those students actually
achieve" (p. 3). The authors emphasize the importance of
student goals by adding the following: ". . . student goals
affect student effort, which, in turn, affects and even
predicts student learning [emphasis mine]" (p. 3). Student
goals should be part of the information a teacher uses to
improve the classroom environment. Students who do not
perceive they are achieving will not persist. The results of
this study supported the notion that goal commitment affects
student achievement, directly or indirectly, through the
student's perception of gains construct. Teachers should not
only have a clearer understanding of the connection between
motivation and achievement, but also should also implement
this understanding in the classroom.
As clearly pointed out, . . . , there has been minimal
effort to link the objectives of a class with a
student's goals. By having both the professor and the
student more actively aware of the inter-relationships
between the purpose of the course and the goal of the
student, there will be a higher motivation to achieve
and greater tendencies for retention. (Stark, Straw, and
Lowther, 1989, p. xvii)
What has been pointed out as implications of the results
for community college faculty, can be repeated for curriculum
directors. After all, classroom instruction is curriculum
applied. o
7u

67
Unfortunately, "researchers have paid more attention to
student goals than have college administers and faculty"
(Stark, Straw, and Lowther, 1989, p. 11). Faculty need to
pay more attention to student goals. By knowing these goals,
a strategy of individualized instruction can be constructed
with the intention of helping students attain their goals.
On a somewhat broader spectrum, those who advise students
could use student-goal information to design a program
specifically aimed at helping students attain their goals.
Implications for Institutional Effectiveness
The third category of implications is that of
institutional effectiveness. The study focused on one
outcome, degree-completion, which is widely used to show
institutional effectiveness. The notion of using degree-
completion for measuring community college student success
was challenged by the results of this study. The attainment
of a degree has been a constant indicator of student success
in much of the student persistence literature. Some
researchers, such as Vorhees and Padula, have argued against
using degree-completion as an indicator of community college
student success. Other indicators of student persistence are
needed, not only to substitute for degree-completion, but
also to reflect the actual attendance behavior of community
college students. Goal attainment should be one of these
indicators.
Outcomes should not be over-emphasized at the abolition
of certain input data such as assessing student's goals.

68
Knowing student goals can be helpful in constructing
strategies that will impact outcomes; in particular,
persistence.
The implications of this study support the call of other
student-persistence researchers for the development of a
theoretical model of community college student persistence.
It seems reasonable to include goal commitment and the
student's perceptions of gains construct in any such z.Ddel.
Recommendations
This researcher encourages replication of this study.
As stated previously, a theoretical community college
persistence model is needed. In fact, after considering the
diversity of the students who attend community colleges, more
than one such theoretical model may be needed. As this study
suggested, goal-commitment and/or the student's perception of
gains construct are strong candidates for inclusion in any
such model.
The data collected for this study was neither
representative of the population nor of the data reported in
the CCSEQ manual. More care should be taken in the sampling
process for subsequent studies. There was also a discrepancy
between the results of the factor analysis done by the
authors of the CCSEQ on their data, and the one done for this
study. As more data are collected, this discrepancy may be
resolved.
Many other research questions are possible using the
data collected from an administration of the CCSEQ.
7`)

69
Certainly still at issue is the difference between each pair
of groups with respect to each dependent variable. Although
twenty-four of these contrasts were examined, many more
remain. Background variables, such as gender and ethnicity,
should be investigated as categorical independent variables.
Other questions on the CCSEQ could be used to group students
and examine differences with respect to the six dimensions of
the dependent variable. One example of this would be to use
the "Time spent on campus other than time spent in class"
item as a blocking variable. Academic and social integration
are important components of many of the student persistence
models. Therefore, using the "time-on-campus" variable in
the same manner that goal commitment was used in this study
could provide insight into the relationship between an
integration component of community college students and
student persistence.
Each of the above suggestions are made in support of
helping build a community college student persistence model.
Since so much data are collected by the CCSEQ, many
exploratory investigations can be made. Concentration on
these suggestions could keep a researcher busy for quite a
long time.

Bibliography
Adelman, Clifford. (1992). The way we are: The community
college as American thermometer. Washington, DC: U. S.
Government Printing Office.
Aitken, Norman D. (1982). College student performance,
satisfaction and retention. Journal of Higher Education,
_52(1), 32-50.
American Council on Education/MacMillan Series on Higher
Education, Association of Community and Junior Colleges,
(1988). Community College _Fact Book.-New York: MacMillan
Publishing Company.
Anderson, Kristine L. (1981). Post-high school experiences
and college attrition. Sociology of Education, 5A, 1-15.
Bean, John P. (1980). Dropouts and turnover: The synthesis
and test of a causal model of student attrition.
Research in Higher Education, 12(2), 155-187.
Bean, John P. (1981). Student attrition. intentions, and
confidences: Interaction effects in a path model Part I:
The 23 variable model. (ED 204 443).
Bean, John P. (1981). The synthesis of a theoretical of
student attrition. A paper presented at the annual
meeting of The American Educational Research
Association, Los Angeles, Ca. (ED 202 444).
Bean, John P. (1982). Student attrition, intentions, and
confidence: Interaction effects in a path model.
Research in Higher Education, 12(4), 291-320.

2
Bean, John P. (1982). The interaction effects of apa and
other determinants of student attrition in a homogenous
population. (ED 216 657).
Bers, Trudy H. and Kerry E. Smith. Persistence of community
college students: The influence of student intent and
academic and social integration. Research in Highez
Education, 21(5), 539-556.
Betz, Nancy E. (1987). Use of discriminant analysis in
counseling psychology research. Journal of Counseling
Psychology, 2A(4) 393-403.
Brawer, Florence. (1988). Assessing student goals and,
Qutcomes. (ED 292 486).
Broughton, Valerie J. (1986). A causal analysis of attrition
at an urban non-residential university. (ED 280 411).
Bray, James H. and Scott E. Maxwell. (1982). Analyzing and
interpreting significant MANOVAs. Review of Educational
Research, .a1(3), 340-367.
Bray, James H. and Scott E. Maxwell. (1985). Multivariate
analysis of variance. Newbury Park, Ca: Sage University
Press.
Cabrera, Alberto F., Maria B. Castafieda, Amaury Nora, and
Dennis Hengstle. (1990). The convergence between two
theories of college persistence. (ED 326 133).
Chickering, Arthur W. and William Hannah. (1969). The process
of withdrawal. Liberal Education, .a5., 551-558.
Cohen, Arthur M. (1986). Perennial issues in community
colleges. (ED 270 139).
3
Cohen, Arthur M. (1989). Reconsidering the community college
contribution. (ED 305 119).
Cohen, Arthur M. and Florence B. Brawer. (1989). The American
community college. San Francisco: Jossey-Bass
Publishers.
Cohen, Elaine Landau. (1984). Assessment. advising and early
warnings: Strategies for improving retention. Santa
Barbara City College, California. (ED 435 550).
Cowart, Susan Cooper. (1990). Project cooperation. Report on
Project Cooperation summer conference for demonstration
sites held in Nashville, Tennessee July 9-11, 1989.
Iowa City, Iowa: American College Testing Program.
Daley, Brian E. (1990). The Kentucky retention model for
community colleges. Community College Journal for
ReaearghAndElannina, 2(2), 5-21.
Daniel, Larry G. (1990). Use of structure coefficients in
multivariate educational research: a heuristic example.
(ED 315 451).
Deegan, William L. and Dale Tillery. (1985). Renewing the
American community college. San Francisco: Jossey-Bass.
DeVoll, Douglas. (1989). Toward a definition of student
Persistence at the community college. Princeton
University. (ED 307 932).
Endo, Jean J. and Richard L. Harpel. (1982). The effect of
student-facullty interaction on students' educational
outcomes. Research in Higher Education, (2), 115-138.
Y

4
Ewell, Peter T. and Dennis P- Jones. (1991). Assessing and
reporting student progress: a response to the "new
accountability." A report prepared for the State Higher
Education Executive Officers. Denver, Colorado.
Dirkhiem, E. (1951). Suicide. Glencoe: The Free Press.
Fairweather, Malcolm M. (1981). College enrollment: the
spatial dimension. College Student Journal Monograph,
15,(1), 1-30.
Farabaugh-Dorkins, Cheryl. (1991). Beginning to understand
why older students drop out of college. Air Professional
File, 39.
Fish, Larry J. (1988). Methods, plainly speaking. Why
multivariate methods are usually vital. Measurement and
Evaluation in Counseling and Development, 21, 130-137.
Grosset, Jane. (1989). A conceptual framework for describing
the causes of student attrition: Institutional Report
#44. Philadelphia Community College. (ED 310 819).
Grosset, Jane. (1991). Patterns of integration, commitment,
and student characteristics and retention among younger
and older students. Research in Higher Education, 22(2),
159-178.
Hackman, J. Richard and Wendell S. Dysinger. (1970). Research
notes: commitment to college as a factor in student
attrition. Socioloay of Education, Al, 311-324.
Hearn, James C. (1985). Determinants of college students'
overall evaluation of their academic programs. Research
in Higher Education, 22(4), 413-437.

5
Heausler, Nancy L. (1987). A primer on MANOVA omnibus and
post hoc tests. (ED 281 852).
Huherty, Carl J. (1975). Discriminant analysis. Review .91.
Educational Research, 15.(4), 543-598.
Huberty, Carl J. and John D. Morris. (1989). Multivariate
analysis versus multiple univariate analyses.
Psychological Bulletin, 105(2), 302-308.
Hummel, Thomas J. and Charles B. Johnston. (1986). An
empirical comparison of size and power of seven methods
for analyzing multivariate data in the two-sample case.
(ED 269 480).
Johnson, Naomi T. and Richard C. Richardson. (1986). A causal
model of academic factors affecting student persistence.
Paper presented at the annual meeting of the American
Educational Research Association. San Francisco. (ED 271
075).
Kalton, Graham. (1983). Introduction to survey sampling.
Newbury Park, Ca: Sage University Press.
Kish, Lester. (1967). Survey sampling. New York: John Wiley
and Sons, Inc.
Klecka, William R. (1980). Discriminant analysis. Newbury
Park, Ca: Sage University Press.
KaAens, David H. (1971). The college "charter" and college
size: effects on occupational choice and college
attrition. Sociology of Education, AA, 270296.

6
Krotseng, Marsha V. (1992). Predicting persistence from the
student adaptation to college questionnaire: early
warning or siren song?. Research in Higher Education,
/2(1), 99-111.
Kuhn, Thomas S. (1970). The structure of scientific
revolution. Chicago: Chicago University Press.
Lehman, Penny W. (1992). The CCSEO: Test manual and
comparative data. Los Angeles, Ca: Center for the Study
of Evaluation, University of California.
Mallette, Bruce I. and Alberto F. Cabrera. (1991).
Determinants of withdrawal behavior: an exporatory
study. Research in Higher Education, 12(2), 179-194.
McCaffrey, Suzanne. (1989). A key to survival: the retention
of adult students in an external degree program. (ED 313
974).
McClennay, Kay M. (1990). Student assessment practices in
the community college: Current state, desired state,
getting there from here. In Project Cooperation:
designing and implementing models of outcomes
as&essments is?for two -year Susan Cooper
Coward (Ed.). Iowa City, Ia: American College Testing
Program.
Metzner, Barbara S. and John P. Bean. (1987). The estimation
of a conceptual model of nontraditional undergraduate
student attrition. Research in Higher Education, 22(1),
15-38.

7
Munro, Barbara Hazard. (1981). Dropouts from higher
education: path analysis of a national sample. American
Educational Research Journal, la(2), 133-141.
Nora, Amaury. (1987). Determinants of retention among chicano
college students: A structural model. Research in Higher
Education, W1), 31-59.
Pace, C. Robert. (1984). Measuring the quality of college
student experiences. (ED 255 099).
Pace, C. Robert. (1958). An approach to the measurement of
psychological characteristics of college environments.
Journal of Educational Psychology, 2(5), 209-277.
Padula, Mary S. (1989). Entering freshman transfer and career
students: A comparison of selected educational
objectives with recommendations for transfer and
academic advisement. Unpublished doctoral dissertation.
New York: Nova University.
Pantages, Timothy J. and Carol F. Creedon. (1978). Studies of
college attrition: 1959-1975. Review of Educational
Researci, 4a(1), 49-101.
Pascarella, Ernest T. and David W. Chapman. (1983). A
multiinstitutional, path analytic validation of Tinto's
model of college withdrawal. American Educational
Research Journal, za(1), 87-102.
Pascarella, Ernest T., Paul B. Duby, and Barbara K. Iverson.
(1983). Long-term persistence of two-year college
students. Sociology of Education, 88-100.
S 3

8
Pascarella, Ernest T., John C. Smart, and Corinna A.
Ethington. (1986). Research in Higher Education, 2_1(1),
47-71.
Pascarella, Ernest T. and Patrick T. Terenzini. (1979).
Interaction effects in Spady's and Tinto's conceptual
models of college dropout. Sociology_ofEducation,
197-210.
Pascarella, Ernest T. and Patrick T. Terenzini. (1980).
Predicting freshman persistence and voluntary dropout
decisions from a theoretical model. Journal of Higher
Education, U(1), 60-75.
Pedhazur, Elazar J. (1982). Multiple regression in behavioral
research (2nd ed.). Fort Worth, Texas: Holt, Rinehart,
and Winston, Inc.
Phillips, Jeffrey C. (1982). Student attrition at the
gammunitycQuaggilgnegclfaLsanag=u1 clarification.
A paper presented at the annual meeting of the American
Educational Research Association, New York. (ED 146
609).
Porter, Oscar F. (1990). Undergraduates completion and
persistence at four-year colleges and universities.
Washingto, DC: National Institute of Independent
Colleges and Universities.
Pugh, Richard C. and Jonathan M. Bolte. (1989). alternate
solutions for ANOVA using 2-way and 3-way completely
randomized factorial designs with disproportional cell
sizes. (ED 314 482).

4
9
Rootman, Irving. (1972). Voluntary withdrawal from a total
adult socializing organization: a model. Sociology of
Education, Aa, 258-270.
Schmitt, Dorren Rafael. (1989). The use of a priori
techniques with a MANOVA. (ED 303 504).
Southern Regional Education Board. (1991). Coping with the
sluggish economy: State responses to revenue shortfalls
and their significance for public schools and higher
education. Atlanta, Ga: Southern Regional Education
Board.
Spady, W. G. (1970). Dropouts from higher education: An
interdisciplinary review and systhesis. Interchange, 1,
64-85.
Spanard, Jan-Marie A. (1990). Beyond intent: reentering
college to complete the degree. Review of Educational
Research, .4(3), 309-344.
SPSS-X User's Guide. (1988). (3rd ed.) Chicago: SPSS Inc.
Stage, Frances K. (1989). Reciprocal effects between the
academic and social integraton of college students.
Research in Higher Education, =5), 517-530.
Stark, Joan S., Katheleen M. Shaw, and Malcolm A. Lowther.
(1989). Student goals for college Courses. ASHE-ERIC
.nigher education report 6, 1989. Washington DC: The
George Washington University.
Stevens, James. (1986). Applied multivariate statistics for
the social sciences. Hillsdale, New Jersy: Lawrence
Eribaum Associates Publishers.
8')

10
Terenzini, Patrick T., Wendell G. Lorang, and Ernest T.
Pascarella. (1981). Predicting freshman persistence and
voluntary dropout decisons: a replication. Research in
Higher Education, 21(2), 109-127.
Terenzini, Patrick T. and Earnest T. Pascarella. (1977).
Voluntary freshman attrition and patterns of social and
academic integration in a university: a test of a
conceptual model. Research in Higher Education, 5,
25-43.
Terenzini, Patrick T. and Thomas M. Wright. (1987).
Influences on students' academic growth during four
years of college. Research in Higher Education, 2_6_(2),
161-179.
Tinsley, Howard E.A. and Diane J. Tinsley. (1987). Uses of
factor analysis in couseling psychology research.
Journal of Counseling Psychology, 11(4), 414-424.
Tinto, Vincent. (1975). Dropout from higher education: A
theoretical synthesis of recent research. Review of
Educational Research, Al, 89-125.
Tinto, Vincent. (1987). Leaving college: Rethinking the
causes and cures of student attrition. Chicago, Ill:
University of Chicago Press.
Tinto, Vincent. (1991). Dropping out and other forms of
withdrawal from college. In Lee Noel, Randi Levitz,
Diana Saluri and Associates (Eds.). Increasing Student
Retention. San Francisco: Josey-Bass.

V
11
Vorhees, R. A. (1987). Toward building models of community
college persistence. A logit analysis. Research in
Higher Education, 2a(2), 115-129.
Webb, Mel. (1989). A theoretical model of community college
student degree persistence. Community College Review,
11(4), 42-49.
Williamson, David R. and Don G. Creamer. Student attrition in
2- and 4-year colleges: application of a theoretical
model. Journal of College Student Development, 29,
210-217.
84