document resume ed 386 648 cg 026 468 author … · center (erici o this document has been...
TRANSCRIPT

DOCUMENT RESUME
ED 386 648 CG 026 468
AUTHOR Sears. VikkiTITLE Effects of Family Structure on High School Students'
Academic Achievement and Behavior.
PUB DATE Aug 95
NOTE 43p.; Research Study, Sam Houston StateUniversity.
PUB TYPE Reports Research/Technical (143)Dissertations/Theses Undetermined (040)Tests/Evaluation Instruments (160)
EDRS PRICEDESCRIPTORS
ABSTRACT
MF01/PCO2 Plus Postage.*Academic Achievement; Family School Relationship;*Family Structure; High Schools; *High SchoolStudents; Nuclear Family; One Parent Family; *Student
Behavior
As students lose traditional family structure, somestudies indicate that their academic behavior may be affected. Thepurpose of this study is to measure the difference in achievement of
high school students from single-parent homes comrared to those fromintact homes. The study is limited to Snook Indepmdent SchoolDistrict (Texas), specifically, Snook High School in the 1994-1995school year. Data were collected on 52 junior and senior students.Grades for English and math were recorded as were behavior referrals.Data collected identifies two groups; those from single parentfamilies (N=20), and those from households with two parents (N=32). Ttests were run to discover the significance of difference in gradebetween the two student groups. Discipline referrals were tabulatedand the means compared. There were significant differences indiscipline and in English, but no significant differences in math
means. (JBJ)
***********************************************************************
* Reproductions supplied by EDRS are the best that can be made *
* from the original document.***********************************************************************

00
00Cr)
(al
EFFECTS OF FAMILY STRUCTURE ON HIGH SCHOOL STUDENTS'
ACADEMIC ACHIEVEMENT AND BEHAVIOR
by
Vikki Sears
A research study
submitted in partial fulfillment
of requirements for the course CNE 579
Sam Houston State UniversLty
August, 1995
(\q
()
(13
L)
U S DEPARTMENT OF EDUCATION
EDUCATIONAL RESOURCES INFORMATIONCENTER (ERICI
O This document has been ieproducediecmedlromthepemonmowin/abononginatmgd
O Minot changes have been made touomoverepmthwt.mooalay
Points of view or opinions staled ml Pm,.document do not necessarily representofficial OERI 1405410004 poll:4
'PERMISSION TO REPRODUCE THISMATERIAL HAS BEEN GRANTED BY
V. 5E-Ag5
TO THE EDUCATIONAL RESOURCESINFORMATION CENTER (ERIC)"
BEST COPY AliMLABLE

TABLE OF CONTENTS
Page
List of Tables iii
List of Figures iv
Chapter
I. Introduction 1
Statement of the Problem 2
Purpose of the Study
Importance of the Study
Definition of Terms 2
Null Hypothesis 2
Limitations and Delimitations 3
Assumptions 3
II. Review of Literature 4
Effects of Family Structure on Success in School 4
Negative Effects of Stress on Performance 5
Effects of Economil7s on Success 6
Ongoing Concerns :7
III. Nethods and Procedures 8
IV. Presentation and Analysis of Data 9
V. Suomary, Conclusions, and Recommendations 18
References 20
Appendixes
A. Cover Letter and Questionnaire 2i
B. Table of Raw Data 24
C. Additional Tables and Figure 26
11

TABLE OF TABLES
Table Page
1. Mean Comparison of 1994 English Scores 10
2. Mean Comparison of 1995 English Scores 11
3. Mean Comparison of 1994 Math Scores 13
4. Mean Comparison of 1995 Math Scores 14
5. Comparison of 1995 Discipline Referrals 17
81. Ray Data 26
CI 27
C2 28
C3 29
C4 30
C5 31
C6 32
c7 33
CS 34
(9 35
C10 36
iii
'1

TABLE OF FIGURES
Figure Page
1. Comparison of Mean Scores of Studenrs from single-Parent
Homes to Students from Two-Parent Homes 15
Cl. Comparison of Discipline Referrals 37
v

CHAPTER I
INTRODUCTION
General Introduction
Some experts in the field of education have been con-
cerned about the children of divorce since the rapid increase
in the number of failed marriages began in the late 1960's.
This started a great change in the structure of American
society;, and just as J. Wepi predicted in the 1970's (as
cited In Featherstone, Cundick, and Jensen, 1992, p.1.) one
half of all new marriages end in divorce. Between 1970 and
1990 the divorce rate tripled, and 50 percent of all children
live at least part of their lives in single-parent homes
(Gelbrich and Hare, 1989, p.115.) According to Finn and
Owings, (1994, p.176) this resulting increase in single-
parent and step-parent families has created a great deal of
concern. As students lose the basic traditional family
structure, some studies indicate that their academic behavior
may be affected. Other changes, especially economic status,
are easily determined, but the impact on school performance is
not as =apparent. Some resdIrchers believe that the absence
of one parent in the home is cause for concern, as it has a
major impact on the academic and social success of a child
(Milne, Myers, Rosenthal, and Ginsburg, 1986, p.125.)
BEST COPY AVAILABLE

2
Statement of the Problem
As families become more non-traditional, students are
exhibiting more failure to achieve academically and socially
in school.
Purpose of the Study
The purpose of this study is to measure the difference
in achievement of high school students from single-parent
homes compared to those from intact homes.
Importance of the Study
If variance occurs, this study may help educators to
realize a possible need for change in views and techniques
in school management.
Definition of terms
1. Blended family. A blended family is formed when two
partners each have children to bring to the marriage and ail
use the same last name.
2. Intact family. An intact family is the traditional
family in which children live with both biological or
adoptive parents.
3. Reconstituted family; A reconstituted family is one
in which the child has a last name different from that of
the male guardian.
Null Hypothesis
No significant difference in school performance exists
between students from non-traditional families compared to
students from two-parent- famkiies.

3
Limitations and Delimitations
The study is limited to Snook Independent School
District (SISD). It is delimited to Snook High School in the
1994-1995 school year. It is also delimited to students in
regular English and math classes.
SISD.
Assumptions
1. Students are representative of future students of
2.4Teacher behavior and referrals are consistent with
all students.
BEST COPY AVAILABLE

4
CHAPTER II
REVIEW OF THE LITERATURE
Effects of Family Structure on Success in SChool
Studies suggest that schools and parents can expect to
see more inappropriate behavior in children who experience
divorce than in children from intact families. Dr. Frank
Brown (as cited in Allers, 1982, .p.67) evaluated 18,244
children in grades 1-12 from 14 states and found that child-
ren from non-traditional homes had numerouS behavior prob-
lems, did considerably worse academically, and were more
often juvenile offenders than their peers from two-parent
families. Ratios indicated nine to five dropouts and eight
to one expulsion cases (Allers, 1982, p.67). A direct re-
lationship between a child's home life and school performance
is evident, and the divorce experience may consume a child's
world (Allers, 1982, p.147).
Pringle's 1970 findings (as cited in Geibrich and Hare,
1989) established the belief that familial factors play an
important role in helping to-identify those students who
are gifted underachievers (Geibrich, et al., p.115). The
research indicated a negative relationship between school
achievement and single-parenthood. The gifted.student from
a single-parent home is more likely to be ranked lower than
his peers (Gelbrich, et al., p.116).
Research by Featherstone, Cundick, and Jensen further
supports the theory that divorce has an adverse effect on

5
the child. The researchers ranked students according to
performance, grades, and citizenship. Consistently, students
from intact families ranked at the top, those from reconstitut-
ed families ranked second, and those from single-parent homes
ranked lowest. Having two constant caregivers of an intact
family appears to be highly advantageous, as these students
had fewer tardies, and absences and higher grade point averages.
R. Kelly Raley's research delves further, stating that 12 per-
cent fewer students:from single-parent.families graduate than
those from intact families (p.12).
Optimistically, some research indicates there is littLe
conclusive evidence to suggest that poor performance in
school is the direct result of being from a non-traditional
family, according to Blechman, 1982 and Bernard and Nesbitt.
1981 (as cited by Featherstone, et al., 1992).
Negative Effects of Stress ona Child's performance
The stress children suffer due to divorce affects the
young student in a variety of ways, and eventually that stress
will manifest itself in the student's performance level.
The negative experiences that surround separation and divorce
may totally consume that child's world, making the child unable
to concentrate, resulting in eventual academic failure (Milne,
et al., p.125). The child may feel both abandoned by the
absent parent and gulity for his leaving.
Monk and Van Boxtel (as cited in Gelbrich,and Hare, 1989)
reinforced the notion that stress is significantly detrimental,
stating that children who have to spend a great deal of time

6
and energy dealing with disruptions in the home have little
energy left to expend on school achievement. Other divorce-
related stress that causes failure in school is from the
child's loss of parental time. parents who are dealing with
their own turmoil have less time and energy to spend on their
children. Reginald Clark (as cited by McLanahan and Sandefur,
1994) argues that parental involvement and support is much
more important than'the number of parents in the home. Often
a single parent who is alone responsible for the welfare of the
entire family is less apt to provide a supportive environment
necessary for academic success (Lanahan, et al., 1994, p.34).
Effects of Economics on Students' Success
Income loss is cited in most situations to be a contrib-
uting factor of a child's failure in school. Divorce and the
loss of one income most often means moving to a less affluent
neighborhood with poorer quality schools. Single parents find
it difficult to afford such things as'private lessons, camp,
trips, and other intellectual stimulation outside of school.
This in turn reduces expectation from parents and motivation
in students. Students who are not expected to go to college
tend to do more poorly in high school (McLanahan, et al.,
1994, p.34).
Allers indicated that some students don't indulge in
extracurricular activities because they know their parent is
struggling financially. When the father is absent, which is
most often the case, the mother is often absent, too, due to

7
employment obligations. This often leaves the child unsuper-
vised, leading to behavior problems, according to Astone and
McLanahan (as cited in Finn and Owings, 1994, p.186). In
addition to failure and behavior problems. one of the most
serious effects of low income occurs when a child quits school
to support himself or the family.
Ongoing Concerns
Of the eight studies rpviewed, it is obvious that each
held legitimate concerns. The information indicates that
family situations affect the performance of the child. It is
also important to note that the level of involvement of at
least one parent is linked-to a child's, success rate. It is
crucial for a parent, whether sinale or married, to be actively
involved in the child's life:-
14;

8
CHAPTER III
Methods and Procedures
To determine the effects of family structure on the
achievements of a student, data were collected on 52 junior
and senior students. The grades for English and math for the
1994 and 1995 school years were recorded. Behavior referrals
for 1995 were also considered. The information was collected
anonymously wtth the help o'f the Snook High School Principal,-f
Mr. Melvin Scnoeneman, and his secretary, Mrs. Joy Horn.
The data collected identified two groups those from
single-parent families (either father or mother) and those
from households with two adults. The latter group, which
involved a total of 32 students, included five homes of
reconstituted families or grandparent auardians. There were
20 students from single-parent homes.
Though the questionnaire (see Appendix A) could be
issued to obtain similar pertinent information in a longer
time frame, the permanent records of the students provided
the necessary information for the study. The recorded data
were entered into a Macintosh computer using the Statworks
program (see Appendix B). The minimum level of probability
to reject the null hypothesis was set at p.05 level of
significance.
a

9
CHAPTER IV
PRESENTATION AND ANALYSIS OF DATA
The study of 52 observations recorded English and math
grades. Of students in the study, 20 were from single-parent
homes and 32 were from two-parent homes. The t tests were
run comparing the mean scores in English and math for the 1994
and 1995 school years.
The mean score comparison in English shows a statistically
signifiCant degree of difference for both years. Table 1
concerns the 1994 English scores, and the results were a
t-value of -3.42, standard deviation 9.62, and a significance
of 0,001. Table 2 indicates similar results for the 1995
school year. The t-value was -2.60, standard dew:a7ion 10.83.
and a significance of 0.012.
The results shown on these two tables indicate that
there is a statistically significant difference in the English
scores of students from single-parent homes and those. of
students from two-parent homes.

10
Table 1.- Mean comparison of 1994 English Scores
Data File: ACHIEVEMENT-FAMILY STATUS
Independent Samples...
Variable: S-ENG-94 M-ENG-94
Mean: 73.05 80.75Std. Deviation: 9.82 6.45
Observations: 20 32
t-statistic: -3.42 Hypothesis:Degrees of Freedom: 50 Ho: 1.11 =
Significance: 0.001 Ha: ).11 pt2

11
Table 2. - Mean Comparison of 1995 English Scores
Data File: ACHIEVEMENT-FAMILY STATUS
Independent Samples...
Yariable: S-E44G-95 M-ENG-95
-Mean: 76.00 82.53Std. Deviation: 10.83 7.34
Observations: 20 32
t-statistic: -2.60 Hypothesis:Degrees of Freedom: 50 Ho: p1 =1.12Significance: 0.012 Ha: ill

12
Comparison of the math scores indicated that there is
no statistically significant difference in the math means.
Tables 3 and 4 show the results of each year. The mean of
the 1994 comparison indicate a t-value of -1.80, a standard
deviation of 9.66, and a significance of 0.078. The results
of the 1995 scores were a t-value of -1.26, standard deviation
11.75, and significance 0.214. Neither of these were
statistically significant to the p'<%05 value.
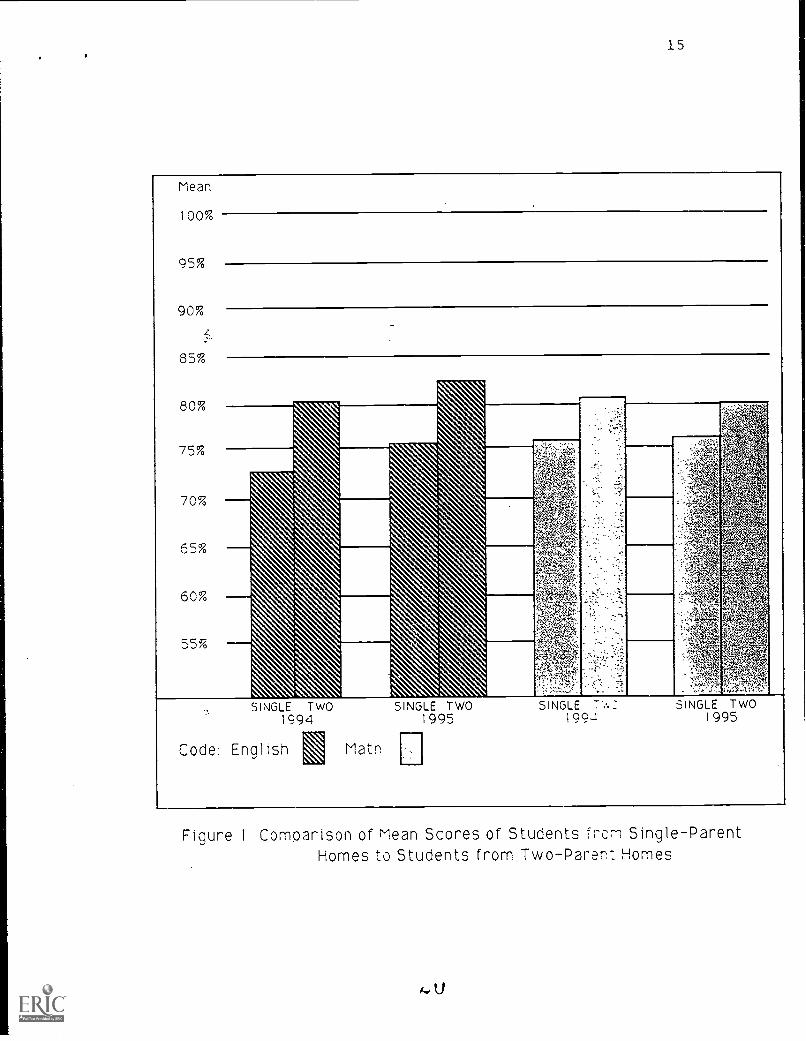
Figure 1 shows the mean scores of rhe two groups,
students from single-parent homes and students from two-parent
homes. The first and third columns are representative of
1994 scores, and the second and fourth columns are of 1995
scores. The two subject areas of math and English are
represented, as the code explains.

13
Table 3. Mean Comparison of 1994 Math Scores
Data File: ACHIEVEMENT-FAMILY STATUS
Independent Samples...
Variable: S-MATH-94 M-MATH-94Mean: 76.65 81.03Std. Deviation: 9.66 7.76Observations: 20 32
t-statistic: -1.80 Hypothesis:Degrees of Freedom: 50 Ho: jil =Significance: 0.078 Ha: m1 # m2
6

14
Table 4. Mean Comparison of 1995 Math Scores
Data File: ACHIEVEMENT-FAMILY STATUS
Independent Samples...
Variable: S-MATH-95 M-MATH-95Mean: 76.70 80.28Std. Deviation: 11.75 8.72Observations: 20 32
t-statistic: -1.26 Hypothesis:Degrees of Freedom: 50 Ho: 111 =Significance: 0.214 Ha: 41
Mean
100%
15
90%
85%
80%
75%
70%
65%
60%
55%
SINGLE TWO1994
Code: English Matn.
SINGLE TWO1995
SINGLE19c4
SINGLE TwO1995
Figure 1 Comparison of Mean Scores of Students from Single-ParentHomes to Students from Two-Parer: Homes

16
Data were also recorded noting the number of times each
student was referred to the office for discipline. A
statistically significant difference in the two groups was
noted, indicating that the attitude of students from single-
parent homes may affect their academic achievements, especially
in subjects requiring reading comprehension and verbal skills.
Table 5 shows the results of the t test indicating that the
mean of students from single-parent homes was 5.80 times
compared to that of students from two-parent homes, which was
1.56. The t-value was 2.62 and probability was .012 (well
below the p:-..05 value). Therefore, it is evident that the
difference in discipline between the two categories of students
is statistically significant. This table is included as a
consideration of interest to the reader.(See also figure
in Appendix C)
Preponderance of difference indicates that there is
variation in the academic achievement of students from
different family structures. Students from two-parent homes
do better and achieve highei' grades than those from single-
parent homes. Even though the differences were not.all found
to be statistically significant, the differences did appear
in each comparison to some degree, favoring the achievement
of students from two-parent homes.

Table 5. Comparison of Discipline Referrals, 1995
Data File: ACH1EVEMENT-FAMILY STATUS
Independent Samples...
Variable: S-DISCIPLINE M-DISCIPLINE
Mean: 5.80
Std. Deviation: 7.04
Observations: 20
1.564.6632
t-statistic: 2.62Degrees of Freedom: 50Significance: 0.012
Hypothesis:Ho: gl =1.12Ha: 41 *1.12

18
CHAPTER V
SUMMARY
Data were colLected and recorded on 52 high school .
students, and t tests were run to discover the significance
of difference in grades between students from single-parent
families and students from two-parent families. The t tests
were run on the Statworks program on a Macintosh computer.
English-grades for each group from 1994 and from 1995 were
compared, as were math grades for the same two years.
Discipline:-referrals mere tabulated and the means
compared. There were significant differences in discipline
and in English. but the differences in math means were not
significant.
Indications are that courses involving language skills
may be more difficult than those involving numbers, as students
use math da_ly to live (ie. in making change) and there is
less concern by youth for accuracy in language. This is
a possibility. Also, the attitude of students makes a
difference in achievement, and seems to be related to family
structure.
CONCLUSION
The null hypothesis was there is no significant
difference in the achievement level of students from single-
parent homes compared to students from two-parent homes.
Based on the t tests, the null hypothesis was rejected it.

19
the area of English. There was a statistically significant
measure of difference in discipline, also rejecting the null
hypothesis. A preponderance of difference also indicates
rejection in the area of math.
RECOMMENDATIONS
Further investigation would be beneficial, possibly
including all areas of education to determine whether or not
subjects based on reading comprehension and verbal skills are
more difficult for students with less attention at home.
Higher level thinking skills should be investigated, and an
in-depth look az the courses that work mainly with numbers
could be studied to determine the accuracy of comparison.
Over a longer period of time, questionnaire information
could be added ro the data collected, and more tests could
be run. More detailed categories would be a benefit. The
categories could be single-parent homes, step-parent homes,
grandparent homes, and intact families. Thls would insure a
more concise comparison.
2.i

20
REFERENCES
Allers, R.D. (1982). Divorce. Children, ahd the School.
Princeton, New Jersey: Princeton Book Company.
Featherstone. D. R., Cundick, B. P., & Jensen, L.C.
(1992). Differences in school behavior and achievement between
children from intact, reconstituted, and single-parent
families. Adolescence, 27. 1-10.
Finn, J. D., & Owings, M. F. (1994). Family structure
and school performance in eighth grade. The Journal of Research
and Development in Education, 27, 176-187.
Gardner, R. A. (1977). The Parents Book About Divorce.
Garden City, New York: Doubleday & Co., Inc.
Gelbrich, J. A., & Hare, E. K. (1989). The effects of
single parenthood on school achievement in a gifted population.
Gifted Child Quarterly, 3. 115-117.
McLahan, S. & Sandefur, C. (1994). Growing Up With a
Single Parent. Cambridge, Mass.: Harvard University Press.
Milne, A. N., Myers, D. E., Rosenthal, A. S. & Ginsburg.
A. (1986). Single parents, working mothers, and the educational
achievement of school children. Sociology of Education, 59.
125-139.
Raley, R. K. (1991) The effects of family composition
on educational attainment. NSFH, 44. 3-37.

21
APPENDIX A
Cover Letter and Questionnaire

SNOOK INDEPENDENT SCHOOL DISTRICT
Box 87
Snook, Texas 77878
July 24, 1995
Dear Parent:
22
Enclosed is a questionnaire being issued to parents of high school
students enrolled in Snook Z.S.D. in an effort to determine the needs of
the changing student population. Please answer and return one form for
each student who resides in your household. The form should be sent to
the school district in the envelope provided by August 1, 1995.
This is an anonymous study; please do not sign your name on any part of
the form. All information will be kept strictly confidential and grouped.
Results may be obtained by contacting the school district office after
September 1, 1995.
Thank you very much for your time in helping with this research as we
strive to assist your child in his/her education.
Sincerely,
Vikki SearsCNE 579 Student
2

23
QUESTIONNAIRE
Directions: Please mark the letter that corresponds with the correct answer foreach question below. Mark only one answer for each question.
1. How many adults live in your home?
A. 1 B. 2 C. 3 or more
2. What is your relationship to this child?
:. A. parent (biological or adoptive) B. Grandparent. '-C..non relative D. other
3. How old is this child?
A. 14 B. 15 C. 16 D. 17
4. How is your child classified?
A..Freshman B. Sophomore C. Junior D. Senior
Directions: Mark the following as above: if the answer is not listed, mai< E.
5. My childs academic grades are usually
A. A/B B. B/C C. C/D D. D/F
6. Regarding my child's performance in English class, he/she
A. never failed B. failed once C. failed twice D. fails often
7. During high school my child's grades have
A. improved B. not changed C. declined
8. I help my child with homework
A. never B. seldom C. often
9. My child is most often involved in
A. sports B. drama C. music D. UIL academics
10. I attend or help my child with
A. sports B: drama C. music D. UIL academics
11. I have received notices from the school regarding the behavior of my child
A. never B. seldom C. often
12. I have received notices from the school regarding my child's grades in Englishor math
A. never B. seldom C. often
13. The most severe discipline my child has received at school is
A. D-hall B. ISS C. suspension D. other
20

24
APPENDIX B
Table of Raw Data
2 z1

Tab
le 6
1. -
Raw
Dat
aA
CH
IEV
EM
EN
T-F
AM
ILY
ST
AT
US
S-E
NG
-94
S-E
NG
-95
S -
MA
TH
-94
S -
MA
TH
-95
SD
ISC
IPLI
NE
M-E
NG
-94
M -
EN
G-9
5M
-M
AT
H-9
4M
-M
AT
H -
95M
-DIS
CIP
LIN
E
169
8368
800
8785
176
720
261
7369
760
8381
286
820
375
7876
715
8689
389
830
462
5075
500
8186
483
721
573
7175
728
7586
576
870
674
7879
758
7277
678
850
781
8482
750
7371
778
752
879
8480
7415
7565
870
7020
950
7070
6712
9394
988
910
1064
7086
899
8996
1096
100
011
6173
5678
2490
9211
9693
012
7894
8395
077
8212
7573
013
7456
8083
493
9313
8485
014
7384
7571
083
8314
8281
015
8276
8866
377
8415
6874
016
7564
5557
1186
8916
9083
017
7780
8187
090
9317
8690
018
8177
7986
073
8018
8180
319
7783
8185
1779
8719
7468
120
9592
9597
078
7520
7480
321
7778
2185
900
2279
8922
9291
023
8678
2384
780
2480
8124
8283
025
8686
2569
630
2676
7726
7370
027
8583
2793
940
2881
7428
7173
029
7579
2973
752
3073
7630
8072
031
7072
3179
7718
3276
8032
8279
0
AE
sT C
OP
Y A
VA
ILA
BLE
3

APPENDIX C
Additional Tables and Figure
26

27
Table Cl.
Data File: ACHIEVEMENT-FAMILY STATUSVariable: S-ENG-94 Observations: 20
Minimum: 50.00 Maximum: 95.00Range: 45.00 Median: 74.50
Mean: 73.05 Standard Error: 2.20
Variance: 96.37Standard Deviation: 9.82Coefficient of Variation: 13.44
Skewness: -0.27 Kurtosis: 0.20

Table C2 .
28
Data File: ACHIEVEMENT-FAMILY STATUSVariable: M-ENG-94 Observations: 32
Minimum: 70.00 Maximum: 93.00Range: 23.00 Median: 79.50
Mean: 80.75 Standard Error: 1.14
Variance: 41.61Standard Deviation: 6.45Coefficient of Variation: 7.99
Skewness: 0.29 Kurtosis: -1.12
311

29
Table C3 .
Data File: ACHIEVEMENT-FAMILY STATUSVariable: S-ENG-95 Observations: 20
Minimum: 50.00 Maximum: 94.00Range: 44.00 Median: 77.50
Mean: 76.00 Standard Error: 2.42
Variance: 117.37Standard Deviation: 10.83Coefficient of Variation: 14.25
Skewness: -0.62 Kurtosis: 0.01

Table C4 .
Data File: ACH1EVEMENT-FAMILY STATUS'Variable: M-ENG-95 Observations: 32
Minimum: 65.00 Maximum: 96.00Range: 31.00 Median: 82.50
Mean: 82.53 Standard Error: 1.30
Variance: 53.81Standard Deviation: 7.34Coefficient of Variation: 8.89
Skewness: -0.15 Kurtosis: -0.56
6
30

31
Table C5 .
Data File: ACH1EVEMENT-FAMILY STATUSVariable: S-MATH-94 Observations: 20
Minimum: 55.00 Maximum: 95.00Range: 40.00 Median: 79.00
Mean: 76.65 Standard Error: 2.16
Variance: 93.40Standard Deviation: 9.66Coefficient of Variation: 12.61
Skewness: -0.62 Kurtosis: 0.17

Table C6 .
32
Data File: ACHIEVEMENT-FAMILY STATUSVariable: M-MATH-94 Observations: 32
Minimum: 68.00 Maximum: 96.00Range: 28.00 Median: 81.50
Mean: 81.03 Standard Error: 1.37
Variance: 60.29Standard Deviation: 7.76Coefficient of Variation: 9.58
Skewness: 0.21 Kurtosis: -0.93
3

33
Table C7.
Data File: ACHIEVEMENT-FAMILY STATUSVariable: S-MATH-95 Observations: 20
Minimum: 50.00 Maximum: 97.00Range: 47.00 Median: 75.50
Mean: 76.70 Standard Error: 2.63
Variance: 138.01Standard Deviation: 11.75Coefficient of Variation: 15.32
Skewness: -0.31 Kurtosis: -0.34

Table C8.
34
Data File: ACHIEVEMENT-FAMILY STATUSVariable: M-MATH-95 Observations: 22
Minimum: 63.00 Maximum: 100.00Range: 37.00 Median: 80.00
Mean: 80.28 Standard Error: 1.54
Variance: 76.08Standard Deviation: 8.72Coefficient of Variation: 10.86
Skewness: 0.23 Kurtosis: -0.75
LIU

Table C9 .
3 5
Data File: ACH1EVEMENT-FAMILY STATUSVariable: S7DISCIPLINE Observations: 20
Minimum: 0.00 Maximum: 24.00Range: 24.00 Median: 3.50
Mean: 5.80 Standard Error: 1.57
Variance: 49.54Standard Deviation: 7.04Coefficient of Variation: 121.35
Skewness: 0.98 Kurtosis: -0.04
41

4
Table ClO.
Data File: ACHIEVEMENT-FAMILY STATUSVariable: M-DISCIPLINE Observations: 32
Minimum: 0.00 Maximum: 20.00Range: 20.00 Median: 0.00
Mean: 1.56 Standard Error: 0.82
Variance: 21.74Standard Deviation: 4.66Coefficient of Variation: 298.39
Skewness: 3.28 Kurtosis: 9.48
36

4
3 7
Referrals
6
4
3
Single Two
Figure C I Comcarlson of Discipline Referrals for Studentsfrom Single-Parent Homes to Students fromTwo-Parent Homes
4 3 BEST COPY AVAILABLE