document resume ed 396 154 - eric · pdf filencm-tr-95-06 nov 95 r117q00003. ... family, and...
TRANSCRIPT

ED 396 154
AUTHORTITLE
INSTITUTION
SPONS AGENCY
REPORT,NOPUB DATECONTRACTNOTEAVAILABLE FROM
PUB TYPE
EDRS PRICEDESCRIPTORS
ABSTRACT
DOCUMENT RESUME
CE 071 897
Ginsburg, Lynda; And OthersWhat Does "100% Juice" Mean? Exploring AdultLearners' Informal Knowledge of Percent.National Center on Adult Literacy, Philadelphia,PA.
Office of Educational Research and Improvement (ED),Washington, DC.NCM-TR-95-06Nov 95R117Q0000340p.
National Center on Adult Literacy, Publications, 3910Chestnut Street, Philadelphia, PA 19104-3111 (orderno. TR95-06).Reports Research/Technical (143)
MF01/PCO2 Plus Postage.Adult Basic Education; *Computation; EducationalResearch; *Mathematical Concepts; *MathematicsSkills; *Numeracy; *Percentage; Student Evaluation
A study examined 60 adult students' informalknowledge of percent and its relationship to their formalcomputational skills. The students studying in adult educationprograms were interviewed to ascertain the following: (1) their ideasof the meanings of three benchmark percentages--100, 50, and 25percent--as they appear in advertising and media contexts; (2) theirability to use these numbers in everyday mental math tasks; and (3)their visual representations of these quantities. Students alsocompleted school-like, computational percent exercises. Students'responses were examined to determine the nature of their informalknowledge and skills; a number of patterns of informal knowledge andformal skills were identified. The range and fragility of studentresponses and the diversity of existing knowledge gaps suggested theneed to broaden the content of percent instruction beyondcomputation. Mathematics assessments should be expanded to includeperformance of real-world tasks and should involve probing ofresponses to explore depth of understanding. (Contains 25references.) (Author/YLS)
,.......:c...--,......*******;:******;:*******1%A::*****AA**;,,,,,***************
Reproductions supplied by EDRS are the best that can be made* from the original document.*************************************************;,A*i ..)**************
NATIONAL CENTER ON ADULT LITERACY
WHAT DOES "100% JUICE" MEAN?EXPLORING ADULT LEARNERS'
INFORMAL KNOWLEDGE OF PERCENT
Lynda GinsburgIddo Gal
Alex SchuhNational. Center on Adult Literacy
University of Pennsylvania
NCAL TECHNICAL REPORT TR95-06NOVEMBER 1995
1.) 5 DEPART MF NI OF EDUCATION
CI 1UGAIIONAL RESOLIFICFS INFOPMAl ION
CENIFF) IFOIC),i,),,Orrn1 I,t, I,I+Vn ,(1.10(1,1Ct d
,...11.01,11111,
1:1 Mot, t ',tinges hay(' UPI, wade ittehr!oninitlin iiiiNy
It, tot rti vitt, .1.1IC1 ill Iii
(!. .14,1 tio1,0 TIE HI Att111 ittl)tt y
BEST COPY AVAILABLE

WHAT DOES "100% JUICE" MEAN?EXPLORING ADULT LEARNERS'
INFORMAL KNOWLEDGE OF PERCENT
Lynda GinsburgIddo Gal
Alex SchuhNational Center on Adult Literacy
University of Pennsylvania
NCAL TECHNICAL REPORT TR95-06NOVEMBER 1995
This work was supported by funding from the National Center on Adult Literacyat the University of Pennsylvania, which is part of the Education Research andDevelopment Center Program (Grant No. RI 17Q00003) as administered by theOffice of Educational Research and Improvement, U.S. Department of Education,in cooperation with the Departments of Labor and Health and Human Services.The findings and opinions expressed here do not necessarily reflect the positionor policies of the National Center on Adult Literacy, the Office of EducationalResearch and Improvement, or the U.S. Department of Education.
NATIONAL CENTER ON ADULT LITERACY, UNIVERSITY OF PENNSYLVANIA, 3910 CHESTNUT STREET, PHILADELPHIA,PA 19104-3111

NATIONAL CENTER ON ADULT LITERACY
UNIVERSITY OF PENNSYLVANIA
3910 CHESTNUT STREET
PHILADELPHIA, PA 19104-3111P HONE (215) 898-2100 FAX (215) 898-9804
The National Center on Adult Literacy (NCAL) was established in 1990 by the U.S. Department ofEducation, with co-funding from the Departments of Labor and Health and Human Services. The missionof NCAL addresses three primary challenges: (a) to enhance the knowledge base about adult literacy; (h) toimprove the quality of research and development in the field; and (c) to ensure a strong, two-wayrelationship between research and practice. Through applied research and development and dissemination ofthe results to researchers, policymakers, and practitioners, NCAL seeks to improve the quality of adultliteracy programs and services on a nationwide basis. NCAL serves as a major operating unit of the LiteracyResearch Center at the University of Pennsylvania.
NCAL publications to date include:
May 1992 Matching Literacy Testing With Social Policy: What Are the Alternatives?Richard L. Venezky (PB92-01, 7 pages)
Oct 1992 Life-Span and Life-Space Literacy: Research and Policy in National and International PerspectivesDaniel A. Wagner (0P92-01, 15 pages)
Oct 1992 Expanding Theories of Adult Literacy ParticipationKaren Reed Wikelund, Stephen Reder, & Sylvia Hart-Landsberg (TR92-01, 30 pages)
Oct 1992 Invitations to Inquiry: Rethinking Staff Development in Adult Literacy EducationSusan L. Lytle, Alisa Belzer, & Rebecca Reumann (TR92-02, 44 pages)
Dec 1992 Developing the Professional Workforce for Adult Literacy EducationSusan L. Lytle, Alisa Belzer, & Rebecca Reumann (P892-02, 11 pages)
Jan 1993 The Analysis of Adult Literacy: Problems in Factor Analysis Bib-Spiralled Item AdministrationDavid Kaplan (0P93-01, 18 pages)
Mar 1993 The Impact of Workplace Literacy Programs: A New Model for Evaluation of Workplace LiteracyProgramsLarry Mikulecky & Paul Lloyd (TR93-02, 180 pages)
Mar 1993 Literacy and Machines: An Overview of the Use of Technology in Adult Literacy ProgramsTerilyn C. Turner (TR93-03, 86 pages)
Jun 1993 Myths and Misconceptions in Adult Literacy: A Research and Development PerspectiveDaniel A. Wagner (PB93-01, 10 pages)
Jun 1993 Literacy and Development: Rationales, Assessment, and InnovationDaniel A. Wagner (IP93-01, 50 pages)
Jun 1993 Early Childhood, Family, and Health Issues in Literacy: International PerspectivesLaurel D. Puchner (IP93-02, 45 pages)
Sep 1993 What Makes Workers Learn? The Role of Incentives in Workplace Education and TrainingDonald Hirsch & Daniel A. Wagner (Eds.) (IP93-03, 243 pages)
Sep 1993 Prison Literacy: Implications for Program and Assessment PolicyAnabel Newman, Warren Lewis, & Carolyn Beverstock (TR93-01, 219 pages)
Sep 1993 Management Information Systems in Adult Education: Perspectives From the States and FromLocal ProgramsMark A. Kutner, Lenore Webb, Rebecca Herman, & Pelavin Associates, Inc. (TR93-04, 150 pages)
Sep 1993 What Can Employers Assume About the Literacy Skills of GED Graduates?David Kaplan & Richard L. Venezky (TR93-05, 45 pages)
NCAL publications to date (continued)
Sep 1993 Should Reading-Diss Wed Adults Be Distinguished From Other Adults Seeking LiteracyInstruction? A Revicw of Theory and ResearchAnne E. Fowler & Hollis S. Scarborough (TR93-07, 101 pages)
Sep 1993 When Less Is More: A Comparative Analysis for Placing Students in Adult Literacy ClassesRichard L. Venezky, Page S. Bristow, & John P. Sabatini (TR93-08, 46 pages)
Sep 1993 Metacognitive Aspects of Adult LiteracyScott G. Paris & Andrea Parecki (TR93-09, 44 pages)
Nov 1993 Teamwork and Literacy: Learning From a Skills-Poor PositionSylvia Hart-Landsberg & Steve Reder (TR93-06, 63 pages)
Nov 1993 Motivations for Learning: Voices of Women Welfare Reform ParticipantsKaren Wikelund (TR93-10, 54 pages)
Nov 1993 Initiating Practitioner Inquiry: Adult Literacy Teachers, Tutors, and Administrators ResearchTheir PracticeSusan L. Lytle, Alisa Belzer, & Rebecca Reumann (TR93-1I, 69 pages)
Nov 1993 Coalition Building for Adult Literacy: Historical and Organizational PerspectivesAnabel P. Newman & Bernadette Lehman (TR93-13, 68 pages)
Nov 1993 Effective Service Delivery in Adult Literacy Programs: A Policy Review and RecommendationsJudith Ann Koloski (TR93-I4, 46 pages)
Dec 1993 Issues and Challenges in Adult NumeracyIddo Gal (TR93-15, 62 pages)
Dec 1993 Adult Literacy Training and the Integration of Human ServicesElizabeth R. Reisner (TR93-I6, 30 pages)
Apr 1994 Measuring Gain in Adult Literacy ProgramsRichard L. Venezky, Page S. Bristow, & John P. Sabatini (TR93- 12, 24 pages)
Apr 1994 Understanding Family Literacy: Conceptual Issues Facing the FieldVivian L. Gadsden (TR94-02, 32 pages)
Apr 1994 Children, Parents, and Families: An Annotated Bibliography on Literacy Development In andOut of Program SettingsVivian L. Gadsden, Ludo C. P. Scheffer, & Joel Hardman (TR94-04, 84 pages)
Jun 1994 Literacy Transfer: A Review of the LiteratureLarry Mikulecky, Peggy Albers, & Michele Peers (TR94-05, 21 pages)
Jun 1994 Instruction and Assessment for Limited-English-Proficient Adult LearnersRonald W. Solórzano (TR94-06, 33 pages)
Jun 1994 Early Warning Signs of Functional Illiteracy: Predictors in Childhood and AdolescenceNazli Baydar, Jeanne Brooks-Gunn, & Frank F. Furstenberg (0P94-01, 13 pages)
Jul 1994 Use It or Lose It? The Problem of Adult Literacy Skill RetentionDaniel A. Wagner (TR94-07, 27 pages)
Jul 1994 Technology: New Tools for Adult Literacy, Videoconference Participant MaterialsJoyce Harvey-Morgan, Christopher Hopey, & R. Karl Rethemeyer (Eds.)(PR94-01, 58 pages)
Sep 1994 Supply and Demand for Literacy Instruction in the United StatesRichard L. Venezky & Daniel A. Wagner (TR94-10, 13 pages)
Sep 1994 The Professionalization of the Teacher in Adult Literacy EducationTimothy Shanahan, Maureen Meehan, & Stephen Mogge (TR94-I 1, 20 pages)

NCAL publications to date (continued)
Sep 1994 The Role of Literacy in the Wealth of Individuals and NationsSue E. Berryman CR94-13, 15 pages)
Oct 1994 Abilities and Competencies in Adulthood: Life-Span Perspectives on Workplace SkillsJacqui Smith & Michael Marsiske (TR94- 12, 36 pages)
Oct 1994 Proceedings. Conference on Adult Mathematical LiteracyIddo Gal & Mary Jane Schmitt (Eds.) (PR94-02, 130 pages)
Nov 1994 Literacy and Adults With Developmental DisabilitiesKaren A. Erickson, David A. Koppenhaver, & David E. Yoder (TR94- I 5, 31 pages)
Nov 1994 Adult Basic Skills in OECD Countries: Policy Issues and a Research AgendaDavid Stern & Albert Tuijnman (IP94-01, 12 pages)
Dec 1994 Who Counts in Adult Literacy Programs? A National Survey of Numeracy EducationIddo Gal & Alex Schuh (TR94-09, 20 pages)
Dec 1994 Adult Numeracy Instruction: A New Approach, Videoconference Participant PacketIddo Gal, Lynda Ginsburg, Ashley Stoudt, R. Karl Rethemeyer, & Caroline Brayer Ebby(PR94-04, 58 pages)
Dec 1994 Literacy and Welfare Reform: Are We Making the Connection?Elena Cohen, Susan Golonka, Rebecca Maynard, Theodora Ooms, & Todd Owen (TR94- 16, 47 pages)
Jan 1995 Self-Assessed Skill Needs and Job PerformancePeter Cappelli & Nikolai Rogovsky (TR94-08, 12 pages)
Jan 1995 Literacy and Voting Behavior: A Statistical Analysis Based on the 1985 Young Adult Literacy SurveyDavid Kaplan & Richard L. Venezky (TR94-I4, 13 pages)
Jan 1995 Literacy and Older Adults in the United StatesGail Weinstein-Shr (TR94-17, 25 pages)
Jan 1995 Proxy Measurement of Adult Basic Skills: Lessons From CanadaT. Scott Murray (TR94-I8, 18 pages)
Jan 1995 Using Large-Scale Assessment Results to 1%!ntify and Evaluate Generalizable Indicators of LiteracyIrwin S. Kirsch & Ann Jungeblut (TR94- 19, 14 pages)
Jan 1995 Nativp 'iteracy and Language Roundtable ProceedingsJoyce Harvey-Morgan (Ed.) (PR94-03, 26 pages)
Mar 1995 The Military Experience and Workplace Literacy: A Review and Synthesis for Policy and PracticeThomas Sticht (TR94-01, 78 pages)
Apr 1995 What Works? Literacy Training in the Workplace, Videoconference Participant MaterialsJoyce Harvey-Morgan (Ed.) (PR95-01, 38 pages)
May 1995 Adult Literacy: The Next GenerationAn NCAL White Paper (TR95-01, 29 pages)
Nov 1995 Making Sense of Technology Terminology for Adult Literacy: A Glossary and Annotated BibliographyAlycia Donohoe, Joseph Campbell, Camille Ciggs, R. Karl Rethemeyer, & ChristopherHopey (PG95-01, 47 pages)
Nov 1995 Technology Planning for Adult LiteracyChristopher E. Hopey & Joyce Harvey-Morgan (PG95-02, 45 pages)
Nov 1995 Funding Technology in Adult LiteracyChristopher E. Hopey & Joyce Harvey-Morgan (PG95-03, 64 pages)
Nov 1995 Making the Right Choice: Evaluating Computer Software and Hardware for Adult Literacy InstructionChristopher E. Hopey, R. Karl Rethemeyer, & Jennifer A. Elmore (PG95-04, 54 pages)
Nov 1995 Joining the On-Line Community: An Introductton for Adult LiteracyR. Karl Rethemeyer (PG95-05, 146 pages)
BEST COPY AVAILABLE

NCAL publications to date (continued)
Nov 1995 Comparing Applied Literacy and Basic Skills Tests as Measures of Adult Literacy PerformanceRichard L. Venezky, John P. Sabatini, & Page S. Bristow (TR95-03, 48 pages)
Nov 1995 Standards for Adult Literacy: Focal Points for DebateRegie Stites, Ellen Foley, & Daniel A. Wagner (TR95-04, 34 pages)
Nov 1995 Adult Literacy in the United Kingdom: A History of Research and PracticeBrian V. Street (TR95-05, 54 pages)
Nov 1995 What Does "100% Juice" Mean? Exploring Adult Learners' Informal Knowledge of PercentLynda Ginsburg, Iddo Gal, & Alex Schuh (TR95-06, 44 pages)
Nov 1995 Learning to Read: Literacy Acquisition by Children and AdultsCharles A. Perfetti & Maureen A. Marron (TR95-07, 56 pages)
Apr 1996 The Infrastructure of Adult Literacy Education: Implications for PolicyHal Beder (TR96-01, 32 pages)
Apr 1996 Evaluation of Workplace literacy Programs: A Profile of Effective Instructional PracticesLarry Mikulecky & Paul Lloyd (TR96-03, 58 pages)
Apr 1996 A Review of Recent Workplace Literacy Programs and a Projection of Future ChallengesLarry Mikulecky, Paul Lloyd, Lisa Horwitz, Sharon Masker, & Patti Siemantel(TR96-04, 54 pages)
Apr 1996 Developing and Evaluating Workplace Literacy Programs: A handbook for Practitioners andTrainersLarry Mikulecky, Paul Lloyd, Jamie Kirkley, & Julie Oelker (PG96-01, 112 pages)
Information on ordering of NCAL publications may be addressed to Dissemination at NCAL.Revised April 10. 1996

NCAL MANAGEMENTDaniel A. Wagner, DirectorRichard L Venezky, Co-Director for Research and DevelopmentJoyce Harvey-Morgan, Associate DirectorVivian L. Gadsden, Associate DirectorSandra K. Stewart, Manager of DisseminationMary 0. Russell, Administrative CoordinatorJanet C. Smith, EditorR. Karl Rethemeyer, Manager, Literacy Technology Laboratory
NCAL SENIOR PROJECT DIRECTORSMaria Carlo, University of Pennsy!vaniaVivian L. Gadsden, University of PennsylvaniaIddo Gal, University of PennsylvaniaJoyce Harvey-Morgan, University of PennsylvaniaSusan L. Lytle, University of PennsylvaniaLarry Mikulecky, Indiana UniversityScott G. Paris, University of MichiganLaurel D. Puchner, University of PennsylvaniaStephen Reder, Northwest Regional Educational LaboratoryR. Karl Rethemeyer, University of PennsylvaniaRegie Stites, University of PennsylvaniaRichard L. Venezky, University of DelawareDaniel A. Wagner, University of Pennsylvania
NCAL NATIONAL ADVISORY PANELChair: Gloria Twine Chisum, Vice-Chair, University of Pennsylvania Board of TrusteesRichard C. Anderson, Director, Center for the Study of Reading, University of IllinoisJoan D. Baraloto, Director, Education and Family Initiatives, USA TodayJames Bowling, Executive Director, Ohio Department of Education, Adult Basic and Literacy
EducationJack Bowsher, Director of Education (ret.), IBM, Inc.Jeanne Chall, Professor, Graduate School of Education, Harvard UniversityJohn Cole, Director, The Center for the Book, Library of CongressThe Honorable William F. Goodling, U.S. Representative, PennsylvaniaBarbara Kapinus, Director, State Education Assessment Center, Council of Chief State School
011icersCarl Kaysen, David W. Skinner Chair of Political Economy, Massachusetts Institute of
TechnologyIrwin Kirsch, Executive Director, Language Learning and Assessment Group,.Educational
Testing ServiceNoreen Lopez, Manager, Adult Education Product Development, Contemporary Books, Inc.Marciene Mattleman, Executive Director, Philadelphia FuturesGeraldine Novelo, Deputy Director (ret.), Instituto Nacional para la Educacidn de los Adultos,
MexicoVan D. Ooms, Senior Vice President and Director of Research, Committee for Economic
DevelopmentBernard P. Reca, Vice President, Bell Atlantic Network Services, Inc.Anthony Sarmiento, Assistant Director, Human Resources Development Institute, AFLCIORobert Schwartz, Program Director, Education, Pew Charitable TrustsSenator Paul Simon, U.S. Senator, IllinoisDorothy Strickland, Professor, Graduate School of Education, Rutgers UniversityFrancis X. Sutton, Vice President (ret.), Ford FoundationPeter Waite, Executive Director, Laubach Literacy Action
NCAL EDITORIAL REVIEW COMMITTEEEunice Askov, Pennsylvania State UniversityHal Beder, Rutgers UniversityVirginia Berninger, University of WashingtonMarilyn Binkley, National Center for Educational Statistics, U.S. Department of EducationBen Burenstein, Drt el UniversityBetty Conaway, Bayl.,r University
5E'3T COPY AVAILABLE
NCAL EDITORIAL REVIEW COMMITTEE (CONTINUED)
Aydin Durgunoglu, University of Illinois at UrbanaMarcia Farr, University of Illinois at ChicagoJohn Fleischman, Media Services and OTAN, Sacramento County Office of EducationBeth Foley, Utah State UniversityMaggie Gaines, Baltimore City Literacy Corp.Sheryl Gowen, Georgia State UniversityKarl Haig ler, Salem CompanyKeiko Koda, Ohio UniversityKenneth Levine, University of Nottingham, UKNoreen Lopez, Adult Education Product Development, Contemporary Books, Inc.Mary Massie, Helene Curtis IndustriesPeter B. Mosenthal, Syracuse UniversityJudith Norback, Center for Skills Enhancement, Inc.Richard K. Olson, University of ColoradoJanice Phillips, Assistant Professor, AED Department, William Rainey Harper CollegeJorie Philippi, Principal, Performance Plus Learning Consultants, Inc., Charleston, West
VirginiaRonald Pugsley, Office of Vocational & Adult Education, U.S. Department of EducationThomas Reeves, University of GeorgiaJudith Sotir, Manager, ITD Center for Excellence, Waunsobee Community CollegeTimothy Shanahan, University of Illinois at ChicagoWilnr:2 Sheffer, Workforce Skills Enhancement, St. Louis Community CollegeRonald SolOrzano, Occidental CollegeKeith Stanovich, Department of Applied Psychology, Ontario Institute for Studies in
EducationSondra Stein, National Institute for LiteracyH. Lee Swanson, University of California, RiversideSally Waldron, SABES World Education Inc.Terrence G. Wiley, California State University Long Beach

ACKNOWLEDGMENTS
The authors thank Lynne Mikuliak, Fred Leinhauser, Nancy Messick, LizWalsh, Louise Klipper, Sharon Malka, Jane Gregoire, and Walter Chisholm forgraciously allowing their classes to be disrupted by student interviews. Theauthors also thank Ashley Stoudt, Caroline Brayer Ebby, Mary Russell, andBetty Conoway for their helpful comments on earlier drafts.
Please send comments to the authors at: NCAL, 3910 Chestnut Street,Philadelphia, PA 19104-3111; Phone: 215-898-2100; Fax: 215-898-9804;E-mail: [email protected]
NATIONAL CENTER ON ADULT LITERACY

TABLE OF CONTENTS
AcknowledgmentsTable of Contents iii
Abstract
Introduction 1
Adults and Percents 2Research Approach and Questions 3
Method 3
Subjects 3
Procedure 4Results 8
Knowledge of 100% as the Basis of the Percent System 8
Performance on Tasks Involving 50% 13
Performance on Tasks Involving 25% 15
General Trends Across Tasks Involving Basic PercentIdeas, 50% and 25% 20
Discussion 22Response Patterns 22Knowledge About the Percent System 23Implications for Instructional Practice 24
Conclusions 25
References 27
ItNATIONAL CENTER ON ADULT LITERACY
WHAT DOES 100%JUICE MEAN?EXPLORING ADULT LEARNERS' INFORMALKNOWLEDGE OF PERCENT
Lynda GinsburgIddo Gal
Alex SchuhNational Center on Adult Literacy
University of Pennsylvatha
Abstract
This report examines adult students' informal knowledge of percent and itsrelationship to their formal computational skills. Sixty adults studying in adulteducation programs were interviewed to ascertain (a) their ideas of the meaningsof three benchmark percents, 100%, 50%, and 25%, as they appear inadvertising and media contexts; (b) their ability to use these numbers ineveryday mental math tasks; and (c) their visual representations of thesequantities. Students also completed school-like, computational percentexercises. Students' responses were examined to determine the nature of theirinformal knowledge and skills; a number of patterns of informal knowledge andformal sldlls were identified. The range and fragility of student responses andthe diversity of existing knowledge gaps suggest the need to broaden thecontent of percent instruction beyond computation. Mathematics assessmentsshould be expanded to include performance on real-world tasks and shouldinvolve probing of responses to explore depth of understanding.
NATIONAL CENTER ON ADULT LITERACY

iNTRODUCTION
Percents are central to many aspects of adults' lives; knowledge of percentsis required for effective understanding of and performance in numerous real-world situations, such as managing personal finances (e.g., understandinginterest), handling functional tasks (e.g., understanding discounts), and dealingwith work-related tasks (e.g., generating indicators of product quality). Someconceptual understanding of percents is also essential for comprehension ofmessages in the media, such as statistical information about economic or socialtrends (e.g., changing tax rates or pollution levels).
Given the importance of the concept of percent, it is surprising that little isknown about children's learning and difficulties with percent, and thatapparently no research has examined adults' knowledge of percent. Researchhas focused on exploring children's acquisition of rational numbers andproportional ideas (Behr, Harel, Post, & Lesh, 1992; Mack, 1990; Wearne &Hiebert, 1988) rather than their understanding of percent. This reflects the viewtaken by many teachers and textbooks (in both K-12 and adult education) thatthe study of percent is only an extension of the study of fractions and decimals.This approach leads to an emphasis on the mechanics of percent-relatedcalculations or converting between percents, fractions, and decimals, rather thanon conceptual understanding.
The few studies that have examined children's knowledge of percentslooked only at specific cognitive processes in limited contexts: Venezky andBregar (1988) focused on solving traditional word problem tasks, Streeflandand van den Heuvel-Panhuizen (1992) explored fifth graders' informalknowledge displayed in response to four daily-life stories, and Joram,Raghavan, and Resnick (1992) investigated students' interpretation of percentsfound in text. A recent study by Lembke and Reys (1994) employed a broaderresearch framework, and examined the performance of students in grades 5, 7,9, and 11 on decontextualized and situational percent problems. Among otherfindings, these researchers reported that older students used a narrow range ofsolution approaches, usually based on procedures learned in school. Incontrast, younger students used a more diverse range of strategies and showedgreater reliance on benchmark percents, such as 50% and 25%. Lembke andReys also reported that students' conceptual understanding and ability to solvepercent problems increased with age, but that even at the eleventh grade.middle-ability students could not solve one fourth of all problems. Theyconcluded that "Formal instruction in the application of percent tends to makethe students' concepts of percent less intuitive and more rule-driven, actuallynarrowing rather than expanding the strategies and the computational methodsstudents use when working with percents" (p. 256).
These and other findings, such as results from the National Assessment ofEducational Progress (Mullis, Dossey, Owen, & Phillips, 1991), imply thatmany students are likely to leave school with an incomplete conceptualunderstanding and computational knowledge of percent, as well as withinsufficient preparation for using or understanding the use ol percents in the realworld. This assumption is bolstered by results from the recent National AduliLiteracy Survey (Kirsch, Jungeblut, Jenkins, & Kolstad, 1993), which showedthat between a quarter and a half of the adult population in the United Stateshave difficulty dealing with many functional tasks involving mathematicalelements, including numerous tasks with percents.
11 4
NATIONAL CENTER ON ADULT LITERACY1
ADULTS AND PERCENTS
This study was designed as a preliminary exploration of adults'knowledge of percents, with a focus on adults who are returning to aneducational setting to study math, such as in a literacy, basic skills, or anemployment-preparation program. We will see that this population issignificant in size.
Based on a survey of a representative sample of 350 adult educationprograms in the United States, Gal and Schuh (1994) estimate thatapproximately 80% of the almost four million adults presently studying instate-administered adult education programs each year receive some matheducation; roughly half of those who study math are classified at the adultbasic education level (ABE, usually taken as equivalent to grades 1-8) andthe remainder at the adult secondary education level (ASE, mostly includingthose preparing for high-school equivalency exams such as the GED). Whileadult education programs in America may teach or re-teach percents tomillions of adult students, we have found no research on adults'understanding of and difficulties with percents. (A search of the ERIC andPSYCHLIT databases did not uncover any report of research involvingadults' understanding of percent. The National Adult Literacy Survey(Kirsch et al., 1993) included questions involving percents but thus far,published reports have not described adults' responses or solution strategiesfor these particular tasks.) Such knowledge is needed to design effectiveteaching and to inform training of teachers and curriculum development.
In designing the present study, it seemed important to attend not only tothe formal skills and knowledge that adults may already have, but also to theinformal knowledge and skills about percents that they bring to their studies.Informal knowledge is likely to be shaped by adults' particular lifecircumstances and experiences after formal schooling ended. We expectedthat most adults in the United States, including those who did not completehigh school, frequently come into some contact with percents in their dailylives, and that adults develop some intuitions or ideas about percents, even ifthey have not formally studied (or fully understood) percents while inschool.
One important aspect of adults' informal experience with percents, whichmay be somewhat different from the informal experiences of younger people,pertains to the greater exposure that adults can be expected to have to"interpretive situations" (Gal, 1993; Kirsch et al., 1993), such as percentsembedded in media-based messages, which require no calculations but rathercomprehension and critical analysis. In addition, adults, more so thanchildren, may come across situations requiring quick "ballpark" estimationsuch as when shopping or dealing with discounts. In such contexts, effectivefunctioning does not necessarily require people to have strong computationalskills, but rather a general, perhaps intuitive, understanding of the percentsystem, as well as "number sense" and mental math skills (Sowder, 1988).
The informal mathematical conceptions and intuitions that adults (andchildren) carry with them may vary in their degree of "correctness"(Fischbein, Den, Nello, & Marino, 1985; Leinhardt, 1988; Mack, 1990;Nunes, Schliemann, & Carraher, 1993; Riley, Greeno, & Heller, 1983).Information about such informal or prior knowledge that adults bring withthem to their studies of percents is essential for the design of effectiveinstruction that builds on students' strengths and tries to ameliorateknowledge gaps or misunderstandings.
J..)
2 TECHNICAL REPORT TR95-06

RESEARCH APPROACH AND QUESTIONS
We chose to explore adults' responses to a variety of tasks involvingpercents, including tasks that people generally encounter only in school as wellas tasks that adults encounter in everyday situations, such as shopping andinterpreting statements with percents. The subjects in this study are adults whoreturned to school because their mathematical (and other basic) skills have beendeemed inadequate by themselves or others. These adults may have informallydeveloped ideas and intuitions about percents (and many other mathematicaltopics) to enable them to function in everyday situations. Our goal was todocument if and how adults modify or invent percent-related ideas in ways thatare meaningful and useful to them.
We focus in this paper on students' understanding of three specific percentvalues: 100%, 50%, and 25%. Knowledge of the percent system requires anappreciation of 100% as the basis for the system. From an informal survey ofadvertisements in the media and in stores, we found 50% and 25% to be amongthe most commonly used percents. In addition, these two percents aremathematically related and easily converted into familiar fractions and decimals.Thus, we expected that adult students would likely have been exposed to thesetwo percents and may have developed personally useful informal knowledgeand strategies for dealing with them. Lembke and Reys (1994) identified thesepercents as "benchmark percents" and we will use that terminology as well.
The specific questions addressed in this study are as follows:
What knowledge do adult students' have of 100% and its role as the basis ofthe percent system?
How do adult students make sense of and solve problems involving thebenchmark percents 50% and 25%?
How are informal knowledge and skills related to formal computationalskills?
Are the standardized tests that most adult literacy programs use to informplacement and advancement decisions sensitive to the level of adults'informal and formal knowledge about percent?
METHOD
SUBJECTS
This study involved 60 adults from seven adult education classes, threeserving inner city and four serving suburban populations. The sample included3 men and 57 women, ranging in age from 18 to 53 years, with a mean age of27.5 years. Only a small number of men participated in the study because fiveof the programs were either designated by funding agencies as "women'sprograms" or were aimed at reducing the dependence of single parents (who areusually women) on public assistance. Fifty-three percent of the students wereAfrican American, 14% were Hispanic, and 33% Caucasian. The students hadbeen studying math (and in most cases, also other subjects) in their classes forbetween 2 weeks and 3 months but had not yet engaged in learning percent. Allstudents in each designated class were given the opportunity to participate in thestudy. All or almost all students in each class expressed curiosity and interest inparticipation.
NATIONAL CENTER ON At VLT LITERACY 3
The stated purposes of the seven educational programs were different,but the goals regarding mathematics were the same for all programstoreview the traditional mathematics curriculum and improve the computationalskills of the students. The programs aim to prepare students for successfulperformance on standardized tests, primarily those used to screen applicantsfor employment training or the GED test.
The vast majority of the students completed between 9 and 12 years ofschool (mean=10.6 years). Three students completed between 6 and 8 yearsof school and 3 others took courses at a community college for either one ortwo years. The programs provided students' scores on the math subtest ofstandardized tests used at the intake stage; five programs used the TABE, theTests of Adult Basic Education; and two used the ABLE, the Adult BasicLiteracy Education test (see Sticht, 1990, for more details on these tests).When expressed in grade-equivalent units (a common practice in adulteducation programs), 15 students (25% of the sample) were classified ashaving scores in the grade range 4.9-6.9, 24 students (40%) in the 7.0-8.9range, and 15 (25%) scored in grade range 9.0 and above (scores wereunavailable for 6 students). Thus, students' achievement on standardizedtests identified them as having lower computational skills than would beexpected on the basis of their prior education. In the analyses reportedbelow, the above-defined grade-level equivalents, rather than the number ofyears of schooling completed, were used to describe groups of students. Theuse of three grade-level groups provides better discrimination than the use ofprior years of schooling for two reasons: (a) 43% of the students in thesample attended school for either 11 or 12 years yet are spread over all threegrade-level groups; they comprise half of the highest grade-level group, halfof the middle-scoring group, and one fourth of the lowest scoring group; and(b) there is no way to describe or evaluate the content of former schooling forthese students.
PROCEDURE
Overall, students were presented with four different types of tasksinvolving percent: explanatory tasks, shopping tasks, visual tasks, andcomputation tasks. The first three types of tasks were presented as part of anindividual, semistructured interview, which lasted approximately 30 minutes.Since students participate in adult education programs on a voluntary basisand often attend only for a limited time, overall assessment time was kept to aminimum. To ensure that reading difficulties would not affect students'responses, the interviewer read pertinent parts of the stimulus materialsaloud. Students' statements were recorded in writing and also audiotaped.About three weeks after the interviews, students at each site completed a briefwritten assessment of computational skills as part of their regular classwork.
EXPLANATORY TASKS
The first part of the interview was designed to provide information onadult students' ideas about five interrelated facets of the meaning of 100%and the role of 100% in the percent system. We identified these facets,described below, as important in conceptualizing the structure of the percentsystem and as useful in comprehension of statements about percents as theyappear in everyday situations. The tasks used to explore these five facets arelisted in Table 1.
4 TECHNICAL REPORT TR95-06

Awareness that percents are expressed on a scale from 0-100; recognition ofthis 0-100 scale and its ordinal nature is the foundation upon which peoplecan base simple interpretations of percent-based statements even if they areunable to compute with percents. (Percents larger than 100 or smaller than 1were not addressed in this study, as they are much less frequentlyencountered.)
Knowledge that the percentages of the parts of a whole must add up to100%.
Recognition that a percentage of a whole can be represented visually in a waythat conveys a sense of its proportional nature or relative size.Identification of 100% as meaning "whole" or "all."Appreciation of the invariability of 100% as the reference point for percent(i.e., that the use of 100 [and not any other number] is an acceptedconvention in describing proportional amounts).
Table
Interview Tasks Used to Assess Knowledge of 100% asthe Basis of the Percent System
Facet Stimulus presented Questions asked1. Percents lie on an
ordinal scale rangingfrom 0 to 100.
2. Percentages of theparts of a "whole"sum to 100%.
3. Visualrepresentation of apercent as aproportional part ofa whole.
4. 100% means"whole" or "all."
5. Use of 100% as theinvariable referencepoint for percents.
Circled line from newspaperarticle stating that a newblood test "detects cancercorrectly in 90% of cases."
Printed statementpurportedly from a magazinestating "In 1970, 15% of allAmerican children wereliving in single parenthomes."
Same as #2 above.
Bottle of apple juice thatsays "100% Juice."
Follow up question whensubject mentioned 100%during the interview.
Do you think this is a goodtest? Why? What does the90% tell you?
Can you tell what percent ofthe children were ma livingin single parent homes?
If this circle represents allthe children in the UnitedStates during 1970, abouthow big a slice of it wouldbe 15%?
What does "100% Juice"mean?
Why did you use 100%?Could you have usedsomething else?
These five facets represent a somewhat different approach than that taken byLembke and Reys (1994) and Allinger and Payne (1986), whose researchfocused on students' knowledge of percent in an instructional context and thusemphasized the mathematical foundations of percent. The present researchfocused more on the knowledge that adults may have developed and bring to anew educational setting, and less on computational, school-based knowledge,which is less relevant in the case of adults who have been out of school forsome time.
NATIONAL CENTER ON ADULT LITERACY 5

SHOPPING TA S KS
The second part of the interview focused on students' reasoning aboutspecific percents that they may encounter in an everyday shopping context.This context was chosen on the assumption that it would be familiar to allstudents, and that it can bring to the surface informal knowledge that student§may have developed or otherwise incorporated into nonschool contexts.Students were shown advertising flyers conta.ming percent statements suchas "Sale, 50% off' and were asked to explain their ideas of the meaning ofthe highlighted percents. Questions that elicited students' ideas of themeaning of 50% and 25% are shown in Table 2 under the column titled"Meaning of the percent."
Table 2Tasks With Benchmark Percents
X111111=111111111111111111111111111Ii
Task type
Percent Meaning Shoppingof the tasks
percent
Visual tasks Writtencomputational
tasks
50% Here it says, How much"50% off." would youCan you pay for $10explain pants on salewhat 50% at 50% ca'?means?
What is 50% of 10?
Why is 50%equal to ...?
The 10 people in the circlewill work on math duringthe class: (10 out of 20=?%)
10 is what % of 20?
25% Here it says How much"25% off." would youCan you pay for anexplain $80 coat onwhat 25% sale at 25%means? off?
Why is 25%equal to ...?
25% of the 20 studentswant to take the GED test:(25% of 20)
What is 25% of 20?
Next, after students described their shopping practices, they were askedto imagine being in a store and wanting to know, before approaching thecashier, how much items on sale would cost. Students were shown drawingsof priced items and discount figures in percent (e.g., a drawing of pants witha price tag stating "$10" and a sign saying, "Pants 50% off'); they wereasked to find the discounted prices mentally, or to approximate the answers ifthey were otherwise unable to come to an answer. No written computationswere allowed in this part since students would be unlikely to use paper andpencil while shopping. Students were asked to think aloud during theprocess and to explain their reasoning. Questions that used 50% and 25% inshopping contexts are shown in Table 2 under the column titled "Shoppingtasks."
6 TECHNICAL REPORT TR95-06

VISUAL TASKS
Visual tasks were used to explore additional aspects of students' reasoningabout percent. These tasks were designed to enable students to reason aboutpercent in a context that was different from the everyday, familiar encounter(shopping) yet was not a school-20 stick figures (sr t. Figure 1) and were askedto assume that the figures represented 20 students in a class. In some tasks,students were given a percent value and were asked to circle the correspondingproportion of stick figures. For example, students were presented with thediagram of 20 stick figures and the statement "25% of the students in this classare planning to take the GED test" and were asked to circle the number ofpeople corresponding to 25%. In other tasks, students were shown the diagramwith a number of stick figures circled and were asked what percent of the 20figures was circled. The questions about 50% and 25% used in this part areshown in Table 2 under the column titled "Visual tasks." Due to constraints oninterview length, mathematically equivalent questions were not asked in theshopping and visual formats.
25% of the students in this class are planning to take the GED test.Circle the people you think will tke the GED test.
UNk;Te*HU:5;Figure 1. Sample Visual Percent Task
WRITTEN COMPUTATIONAL TASKS
The written assessment included three arithmetic items similar inmathematical structure to items in the interview. Two of the items used 50% andone used 25%. These items are shown in Table 2, under the column titled"Written computational tasks," and are shown horizontally across from themathematically equivalent shopping or visual question.
CODING
Responses to interview tasks that involved explanations of meaning ratherthan numerical values were categorized as "appropriate" or "inappropriate"; thecriteria for this identification differed for each question and are explained below.Numerical responses were coded as "correct," "in the ballpark" (within 10%above or below the correct response for the shopping questions since such anestimate might well be useful in that context), of "incorrect," and the solutionstrategies used were described and grouped together into categories. Sincestudents completed the written computational tasks in their class settings, noobservations or explanatory information were available about their responses,and the responses were only coded as arithmetically correct or incorrect.
NATIONAL CENTER ON ilkti'ULT LITERACY 7

RESULTS
KNOWLEDGE OF 100% AS THE BASIS OF THE PERCENTSYSTEM
This section examines students' knowledge of the five basic facets aboutthe percent system discussed above, all of which revolve around the notionof using 100% as the basis for thinking about percent. While each of the fivequestions presented to students was designed to elicit their knowledge abouta different facet, each question very often elicited responses related to otherfacets as well. As students' ideas about these five facets are all interrelated, adiscussion of students' knowledge should take into account all answersrather than single responses in isolation.
IDENTIFYING PERCENT AS LYING ON A 0-100 SCALE
Students were asked to interpret the statement, "This new test detectscancer correctly in 90% of the cases," which appeared in a newspaperclipping shown to them. Almost all students (93%) demonstrated knowledge(either on their own or after probing) that 90% should be evaluated in relationto 100%, where 100% would be a perfect detection rate.
In the sample responses quoted below, two students' conclusions aboutthe acceptability of a 90% success rate were different, yet both studentsindicated that the relative magnitude of a percent value is judged based on itsproximity to 100%, and were thus scored as appropriate.
Steve: It's a good test. Ninety percent is almost all cases. It's close to100%.
Laura: I wouldn't depend on the test, 90% is not good enough forme.
Interviewer: What would be perfect?Laura: 100%.
The remaining 7% of the students provided inappropriate responses,which did not mention 100% as a reference point for evaluating 90%, butrather appeared to interpret 90 in absolute terms.
Sandy: It's good because 90% is a high percentage.Interviewer: What would be the highest?Sandy: I don't know.Interviewer: How about 150%?Sandy: That's higher, that would be better.Interviewer: What would be perfect?Sandy: I don't know.
RECOGNIZING THAT PERCENTAGES OF THE PARTS OF A "WHOLE"ADD UP TO 100%
Students were presented with a statement based on data from the 1970Census, "In 1970, 15% of all American children lived in single parenthomes," and were asked if they could tell what percent of children were notliving in single parent homes. Most students (83%) responded immediatelywith "85%" and indicated that they expected the two percents to complementeach other and sum to 100%.
8 TECHNICAL REPORT TR95-06
Of the 10 students (17%) who did not demonstrate understanding that thesum of the percentages should be 100%, 6 stated that they could not tell whatpercent of the children did not live in single parent homes because they did notknow the total number of people, suggesting they were having difficulty takingadvantage of the proportional nature of percent.
The other four students either guessed at answers or performedinappropriate computations reflecting a "number-grabbing" strategy, in whichthey attempted to compute with whatever numbers were available, evenincluding the year that had been mentioned as part of the question.
Susan: The rest of them, 15 times 1970. You don't have the othernumber, you don't have the all, you don't have the other people.So put 1970 over 15, you have to estimate. Divide 15 into 1970.Whatever is left over, I think 11%.
VISUAL REPRESENTATION OF A PERCENT AS A PART OF A WHOLE
In connection with the statement, "In 1970, 15% of all American childrenlived in single parent homes," students were presented with a circle (pie)containing densely drawn dots, said to represent all the American children in1970. Students were asked to shade a slice of the circle representing the 15% ofthe children who lived in single parent homes.
About three quarters (72%) of the students shaded a section somewherebetween 10% and 20% of the circle. Most of these students divided the circleinto four quarters and shaded in approximately half of one of the quarters.Some students divided the circle into 10 parts, identified each part as 10%, andthen shaded one and one half parts. Others mentally estimated and shadedapproximately 15% without first partitioning the circle intoany series of equalparts, but were able to explain why their estimates were reasonable. All of theseresponses were scored as "appropriate" since they implied that the entire circlerepresented 100% (and thus that 15% was a proportionally small section).
Of the seventeen students (28% of sample) whose responses were scored asinappropriate, eight divided the circle into 15 equal parts. These studentsimplied that 15% meant one fifteenth, and they did not recognize the idea ofpercent as a proportion based on 100. Several students indicated that 15% is "alittle bit" (which shows rudimentary understanding of the ordinal 0-100 scale)but were unable to explain why this is so. The remaining students in this groupshaded different portions of the circle as 15%, and provided no indication, evenafter probing, that for them the entire circle represented 100%.
KNOWING THAT 100% MEANS "WHOLE" OR "ALL"
To provide additional information about students' understanding of 100%as the basis of the percent system, students were asked to interpret the statement"100% juice," printed on a bottle of apple juice, which was shown during theinterview. In this context, 83% of the students stated that to them, 100% means"all" or "wholly" juice.
Anna: It's all juice, all apple juice.Interviewer: Can there be anything else in there too?Anna: No, there shouldn't be.
Several of the students who stated that "100%" means "all" conveyed asense of a contradiction between the mathematical meaning of 100% (i.e., that100% should mean "all") and its actual meaning in the apple juice context (i.e.,
NATIONAL CENTER ON ADULT LITERACY 9
showing awareness of the real-world use or misuse of percent, particularlyrelated to advertising).
April: It's basically natural, all juice, it doesn't have excess water andother things, like when they say 10% juice. Nothing that makes ittaste of apple other than the apple itself.
Interviewer: So there's nothing else but juice?April: I guess, vitamins, like vitamin A. When it says 100% juice, it's
just that kind of juice. I wouldn't think there's nothing else butjuice, but mainly juice. If it's 100%, it may not be 100% all juice butmainly all juice. For example, decaf coffee has some caffeine.
In contrast, 17% of the students responded that 100% either means "themajority" of something, rather than "all" (first quote below) or elserepresents an absolute quantity or amount that is not related to proportionality(second quote below).
Katrina: More juice than whatever they use to make the juice. More of itis natural; it contains less sugar than the rest of the drinks. . . . Morefruit juice in this bottle.
Interviewer: Can there be other ingredients in there too?Katrina: Yes.
Tara: You're going to be drinking 100% juice. There may be otheringredients, but you would want to have at least that much, 100%. Iwould also look at the other ingredients, sugar, sodium.
Interviewer: Do you mean the juice could be higher than 100% juice?Tara: It could be. If it said 100%, I would think it would be at least
100% and I would buy it.Interviewer: So it coula say a higher number than 100%?Tara: Yes. I've never sem one. If I did I would assume it was more
than 100%, if it added another type of apple, two different types ofapples.
USE OF 100% AS THE REFERENCE POINT FOR PERCENTS
To further explore students' knowledge of the special and invariant useof 100% as the basis for the percent system, students were asked to explainwhy they referred to 100% in an earlier question (e.g., when deciding that85% of the children were not Living in single parent homes), and whether anyother percent could have been used instead. Only in responding to such adirect probe were the students forced to justify their use of 100% as anorganizing principle of the percent system, rather than having this ideainferred from their answers to other questions.
Thirty-one of the 60 students (52%) provided appropriate explanationsfor their use of 100% by suggesting that 100% means a "whole" or "all ofsomething."
Interviewer: Why did you use 100%?Lois: A whole is 100%.Interviewer: Is it always 100%?Lois: More or less. It depends on if you're dealing with numbers. Well,
yes, it's always 100% because a whole is 100%.Interviewer: Could you have used a number other than 100%?Lois: No.
10 TECHNICAL REPORT TR95-06
Some of those who gave appropriate responses appeared to be crystallizingor rethinking their ideas about percents even as they constructed theirresponses, and they demonstrated that their understanding of 100% as the basisfor percent is still evolving. Others tied their thoughts about 100% to their lifeexperiences (e.g., with money) rather than to an abstract principle or amathematical convention.
Interviewer: Why did you use 100% [to compute the number of childrennot living in single parent homes]?
Tracey: I always do it by 100, I could do it by 200 but you would have todouble everything. I didn't try it by 200, so I don't know if it wouldwork.
Interviewer: So you could have used 200%?Tracey: I don't know. You probably could, but it would be more work.
100% of 200 would still be 100%, 100% is everything, all of it. Iguess you can't do it by 200%, maybe some people could do it.
Interviewer: Why did you use 100?Dorothy: It all depends on how you're breaking it down. You can use any
number for a whole: fifty fiftieths, four fourths.Interviewer: And when you are dealing with percent?Dorothy: It would have to be over 100, 200% could be a whole, 250%
couldn't be a whole because that breaks the rhythm.Interviewer: So which numbers can be a whole?Dorothy: Zeros: 100, 200, 300.Interviewer: As high as you want?Dorothy: All depends on what type of money you're dealing with. Got 10
million dollars (pause). No keep it at 100%, forget the 200%, etc. 100%is a whole.
The other 29 students (48% of the sample) provided one of severalinappropriate responses. Fifteen of these students (25% of the sample) wereconfident that 100% was the right number to use but were unable to articulatereasons why that was so other than "Percent is always 100," "It seems right,"or "It's 'n my head." Five students were unsure why they chose 100%; theyindicated that other numbers could have been used instead, but were unsure ofwhat such numbers could be. Two students understood 100% as 100individuals or cases, without acknowledging any proportional nature of percent.
Interviewer: Would you always use 100% [to evaluate 90% in "This newtest detects cancer correctly in 90% of the cases"]?
Theresa: Yes. In a way, you don't know. It all depends on how manycases they used. 90% is good out of 100% of the people. If you have250, 90% is not good. It's not half of 250 people. 125 would be half.
Interviewer: Do you mean if there were 250 people, then 125% would behalf?
Theresa: Yes.
Four students explained that they used 100% because it is "the highestpercent can go," and invoked their experience of not encountering a percentgreater than 100 rather than a conceptual understanding of how the percentsystem is structured.
Interviewer: Why did you say 100%?Arlene: That's as high as I think you can go with percentage. I never heard
200% off, 220% off. I never seen any number that's more than 100%,not in stores.
Interviewer: So 100% is the highest?,;
NATIONAL CENTER ON ADULT LITERACY 11
Arlene: More or less. Unless you're taking bigger numbers. If you wanta percent off of $100,000, (pause) doesn't make sense. No, 100%is the highest, no matter what amount of money.
Finally, three students explained that 100% was used because it is a"round number"; they seemed to equate (and confuse) round numbers withrounding of numbers, and did not provide any particular reason why 100was used in dealing with percents.
Interviewer: Why did you use 100%?Tamika: It's a round number, a whole number. I was taught to use it,
you have to round something off and the number was always 100. .. . The nearest 10; 100; 1000; 100,000 always rounded off.They're supposed to come out even.
Interviewer: So why did you use 100%?Tamika: It was easier.Interviewer: Could you have picked something else?Tamika: I could have, 1000, or 1,000,000.Interviewer: Numbers with zeros?Tamika: They don't necessarily have to be zeros. You can round off
numbers in between too. Even the remainder you can round off.
RESPONSE PATTERNS AND EDUCATIONAL ACHIEVEMENT
Tables 3 and 4 provide two different summary views of students'knowledge of 100% as the basis of the percent system (as measured by thefive questions described above).
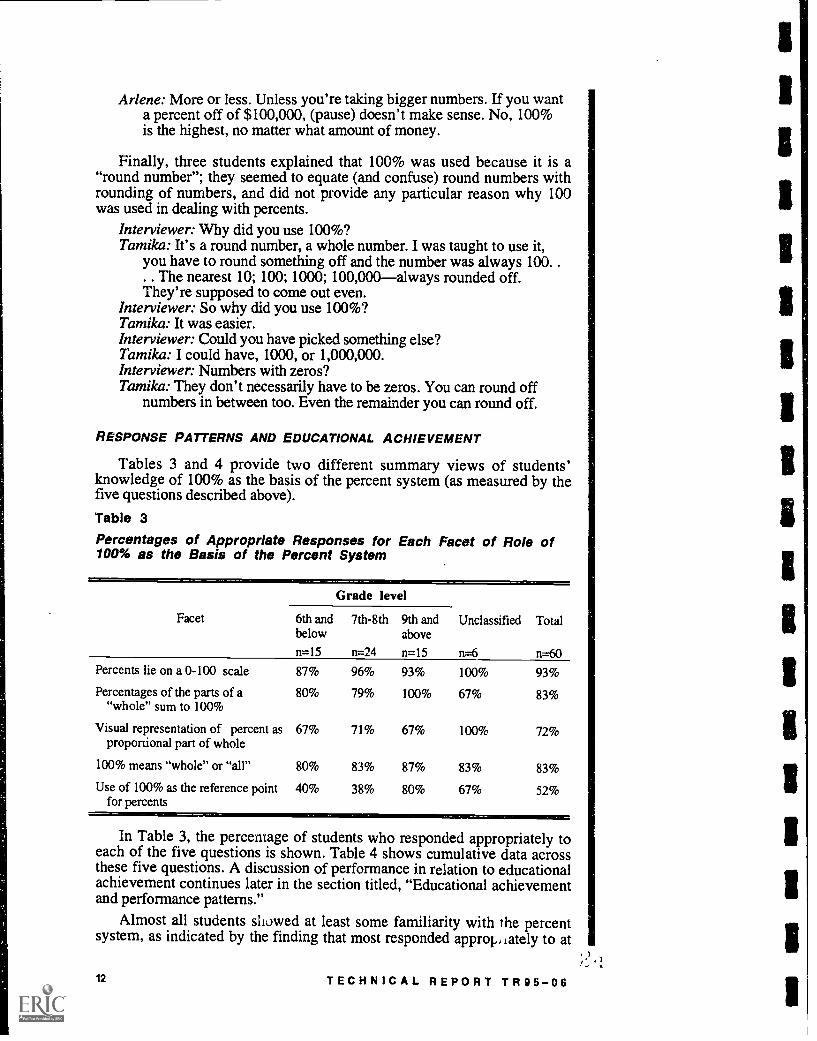
Table 3Percentages of Appropriate Responses for Each Facet of Role of100% as the Basis of the Percent System
Grade level
Facet 6th andbelow
7th-8th 9th andabove
Unclassified Total
n=15 n=24 n=15 no n=60Percents lie on a 0-100 scale 87% 96% 93% 100% 93%
Percentages of the parts of a 80% 79% 100% 67% 83%"whole" sum to 100%
Visual representation of percent asproportional part of whole
67% 71% 67% 100% 72%
100% means "whole" or "all" 80% 83% 87% 83% 83%
Use of 100% as the reference pointfor percents
40% 38% 80% 67% 52%
In Table 3, the percentage of students who responded appropriately toeach of the five questions is shown. Table 4 shows cumulative data acrossthese five questions. A discussion of performance in relation to educationalachievement continues later in the section titled, "Educational achievementand performance patterns."
Almost all students showed at least some familiarity with the percentsystem, as indicated by the finding that most responded approp, lately to at
12 TECHNICAL REPORT TR95-06
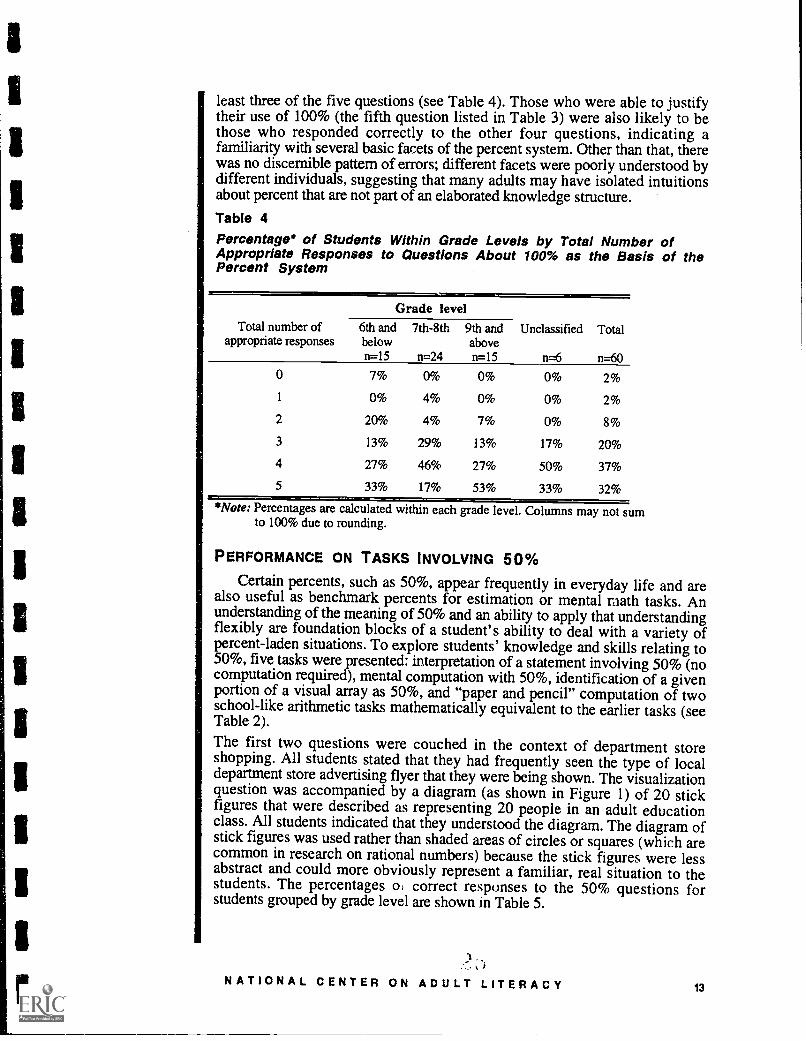
least three of the five questions (see Table 4). Those who were able to justifytheir use of 100% (the fifth question listed in Table 3) were also likely to bethose who responded correctly to the other four questions, indicating afamiliarity with several basic facets of the percent system. Other than that, therewas no discernible pattern of errors; different facets were poorly understood bydifferent individuals, suggesting that many adults may have isolated intuitionsabout percent that are not part of an elaborated knowledge structure.
Table 4Percentage* of Students Within Grade Levels by Total Number ofAppropriate Responses to Questions About 100% as the Basis of thePercent System
Grade levelTotal number of
appropriate responses6th andbelow
7th-8th 9th andabove
Unclassified Total
n=15 n=24 n=15 n n=600 7% 0% 0% 0% 2%
1 0% 4% 0% 0% 2%
2 20% 4% 7% 0% 8%
3 13% 29% 13% 17% 20%
4 27% 46% 27% 50% 37%
5 33% 17% 53% 33% 32%
*Note: Percentages are calculated within each grade level. Columns may not sumto 100% due to rounding.
PERFORMANCE ON TASKS INVOLVING 50%
Certain percents, such as 50%, appear frequently in everyday life and arealso useful as benchmark percents for estimation or mental math tasks. Anunderstanding of the meaning of 50% and an ability to apply that understandingflexibly are foundation blocks of a student's ability to deal with a variety ofpercent-laden situations. To explore students' knowledge and skills relating to50%, five tasks were presented: interpretation of a statement involving 50% (nocomputation required), mental computation with 50%, identification of a givenportion of a visual array as 50%, and "paper and pencil" computation of twoschool-like arithmetic tasks mathematically equivalent to the earlier tasks (seeTable 2).
The first two questions were couched in the context of department storeshopping. All students stated that they had frequently seen the type of localdepartment store advertising flyer that they were being shown. The visualizationquestion was accompanied by a diagram (as shown in Figure 1) of 20 stickfigures that were described as representing 20 people in an adult educationclass. All students indicated that they understood the diagram. The diagram ofstick figures was used rather than shaded areas of circles or squares (which arecommon in research on rational numbers) because the stick figures were lessabstract and could more obviously represent a familiar, real situation to thestudents. The percentages o, correct responses to the 50% questions forstudents grouped by grade level are shown in Table 5.
).,.:.,)NATIONAL CENTER ON ADULT LITERACY 13

Table 5
Percentages of Appropriate or Correct Responses to QuestionsAbout 50%
Grade level
Question type Questionasked
6th andbelow, .
7th-8th 9th andabove
Unclassified Total
n=15 n=24 n=15 n=6 n=60
Meaning What does 100% 100% 100% 100% 100%50% mean?
Shopping What is 100% 92% 93% 83% 93%50% off$10?
Written compu-tation
What is50% of 10?
67% 79% 87% 67% 77%
Visual 10 is what 73% 88% 100% 83% 87%% of 20?
Written compu-tation
10 is what% of 20?
27% 33% 60% 17% 37%
EXPLAINING THE MEANING OF 50%
Students were presented with an advertising flyer stating "50% off' andasked what 50% means in this context. All 60 students explained 50% as"one half." When asked to justify why 50% is the same as one half, 46% ofthe students explained that 50% is one half of 100% or that 50 is one half of100. Forty-one percent of the students used a money metaphor to explain that50% is one half: "50 cents is one half of a dollar" or "$50 is one half of$100." The remaining 13% were confident that 50% meant one half but wereunable to state any reason or justification for this other than "I just think itis. ft
MENTAL MATH AND WRITTEN COMPUTATION WITH 50%
Almost all students (93%) were able to state correctly how much wouldhave to be paid if a $10 pair of pants were on sale for "50% off." Practicallyall of them first converted 50% to its fractional equivalent, one half; statedthat half of $10 is $5; and then took $5 from $10 to yield their answer. Theremaining 4 students (5%) were unable to generate any ideas on how theycould arrive at an answer other than by guessing. In contrast, 77% of allstudents responded correctly to the mathematically equivalent question on thewritten assessment (50% x 10=?).
VISUAL REPRESENTATION AND WRITTEN COMPUTATION WITH 50%
When asked what percent of the array of 20 stick figures were enclosedin a circle containing 10 figures, 87% of the students responded correctly,and all but one explained that because one half of the stick figures wereinside the circle, the circle contained 50% of the figures. One personestablished that each figure represented 5% through trial and error guessing,and then counted by 5s to 50.
14 TECHNICAL REPORT TR95-06
The 13% who did not answer correctly either named the number of figureswithin the circle as the percent or guessed at an answer without being able toexplain a rationale for the guess.
In contrast, only 37% of all 60 students responded correctly to amathematically equivalent computational question, "10 is what % of 20?" Thelarge gap in solution rates between the written and visual forms of the questionwas apparent for students in all grade-level groups. Of the 15 students in thehighest grade-level group, 100% responded correctly to the visual task but only60% solved the equivalent written problem; even larger percentage differentialswere found for the middle and lowest grade-level groups.
RESPONSE PATTERNS ACROSS TASKS INVOLVING 50%
All students answered at least one question appropriately. Twenty students(33%) responded appropriately to all five questions using 50%.
Thirty students (50%) understood the meaning of 50% and were able toapply their understanding of 50% in a shopping context and in a visual task, yetthey failed to solve either one or two mathematically equivalent writtencomputational problems ("What is 50% of 10?" and "10 is what % of 20?").Nine students failed on both computational problems, and 21 students failed tosolve only the second question. These two forms of percent problems ("find thepercentage quantity" vs. "find the percent") are often presented in schoolsettings as completely different tasks requiring different algorithms for solutionrather than as complementary forms of the same concept. Possibly, the studentsknew the algorithm for "finding the percentage given the percent and base"(which is more familiar and generally taught first) but not the "find the percent"algorithm. Perhaps the test-like environment and an expectation that the problemhad to be solved using a computational algorithm prevented students withlimited knowledge of percent algorithms from assuming that they could create amental (or visual) model of the test item, and thus answer the questions withoutformal computational procedures.
The remaining 10 students (17%) displayed various patterns of responses toquestions involving 50%. Included in this group were two students who wereable to solve one written computational task (50% x 10=?) but were unable tosolve eithe l. the equivalent shopping question or the visual task.
PERFORMANCE ON TASKS INVOLVING 25%We expected relatively high performance levels on tasks involving 25%, not
only because 25% appears frequently in daily life, but also because it can beexpressed as a familiar fraction ("quarter") and it is numerically related to 50%.However, when students were presented with shopping, visual, andcomputational tasks similar to those involving 50%, knowledge andperformance were much more limited. Table 6 shows percentages of correctresponses grouped by grade level.
NATIONAL CENTER ON ADULT LITERACY 15
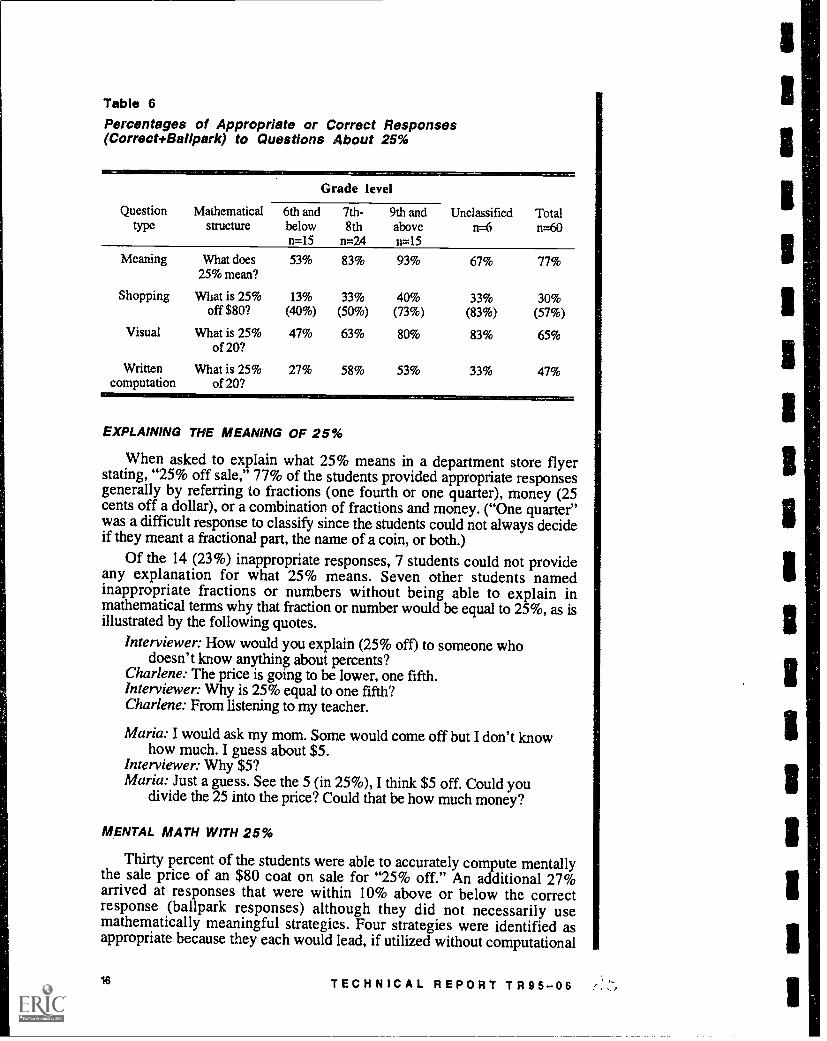
Table 6Percentages of Appropriate or Correct Responses(CorrectBalipark) to Questions About 25%
Grade level
Question Mathematical 6th and 7th- 9th and Unclassified TotaltYpe structure below 8th above n= n=60
n=15 n=24 n=15
Meaning What does 53% 83% 93% 67% 77%25% mean?
Shopping What is 25% 13% 33% 40% 33% 30%off $80? (40%) (50%) (73%) (83%) (57%)
Visual What is 25%of 20?
47% 63% 80% 83% 65%
Writtencomputation
What is 25%of 20?
27% 58% 53% 33% 47%
EXPLAINING THE MEANING OF 25%
When asked to explain what 25% means in a department store flyerstating, "25% off sale," 77% of the students provided appropriate responsesgenerally by referring to fractions (one fourth or one quarter), money (25cents off a dollar), or a combination of fractions and money. ("One quarter"was a difficult response to classify since the students could not always decideif they meant a fractional part, the name of a coin, or both.)
Of the 14 (23%) inappropriate responses, 7 students could not provideany explanation for what 25% means. Seven other students namedinappropriate fractions or numbers without being able to explain inmathematical terms why that fraction or number would be equal to 25%, as isillustrated by the following quotes.
Interviewer: How would you explain (25% off) to someone whodoesn't know anything about percents?
Charlene: The price is going to be lower, one fifth.Interviewer: Why is 25% equal to one fifth?Charlene: From listening to my teacher.
Maria: I would ask my mom. Some would come off but I don't knowhow much. I guess about $5.
Interviewer: Why $5?Maria: Just a guess. See the 5 (in 25%), I think $5 off. Could you
divide the 25 into the price? Could that be how much money?
MENTAL MATH WITH 25%
Thirty percent of the students were able to accurately compute mentallythe sale price of an $80 coat on sale for "25% off." An additional 27%arrived at responses that were within 10% above or below the correctresponse (ballpark responses) although they did not necessarily usemathematically meaningful strategies. Four strategies were identified asappropriate because they each would lead, if utilized without computational
16 TECHNICAL REPORT TR95-06
errors, to a correct solution. Fifty-six percent of the students used one of thesefour appropriate strategies to solve the "25% off of $80" problem.
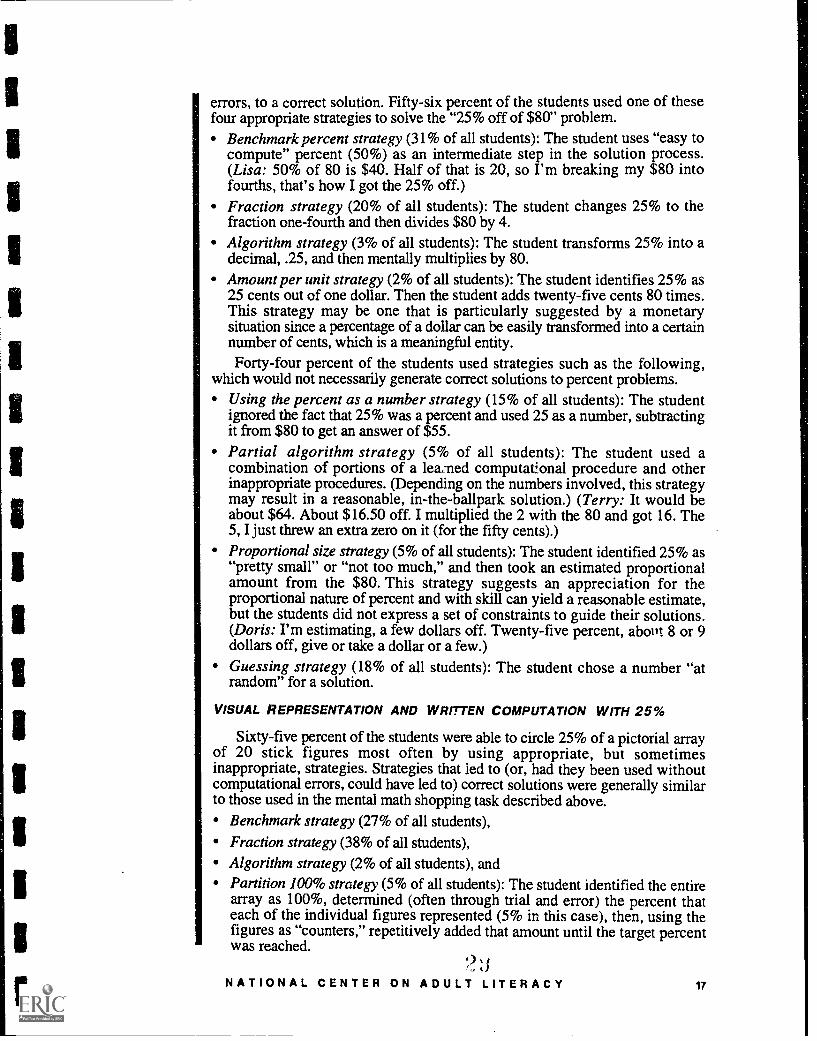
Benchmark percent strategy (31% of all students): The student uses "easy tocompute" percent (50%) as an intermediate step in the solution process.(Lisa: 50% of 80 is $40. Half of that is 20, so I'm breaking my $80 intofourths, that's how I got the 25% off.)Fraction strategy (20% of all students): The student changes 25% to thefraction one-fourth and then divides $80 by 4.Algorithm strategy (3% of all students): The student transforms 25% into adecimal, .25, and then mentally multiplies by 80.Amount per unit strategy (2% of all students): The student identifies 25% as25 cents out of one dollar. Then the student adds twenty-five cents 80 times.This strategy may be one that is particularly suggested by a monetarysituation since a percentage of a dollar can be easily transformed into a certainnumber of cents, which is a meaningful entity.Forty-four percent of the students used strategies such as the following,
which would not necessarily generate correct solutions to percent problems.Using the percent as a number strategy (15% of all students): The studentignored the fact that 25% was a percent and used 25 as a number, subtractingit from $80 to get an answer of $55.
Partial algorithm strategy (5% of all students): The student used acombination of portions of a leaned computational procedure and otherinappropriate procedures. (Depending on the numbers involved, this strategymay result in a reasonable, in-the-ballpark solution.) (Terry: It would beabout $64. About $16.50 off. I multiplied the 2 with the 80 and got 16. The5, I just threw an extra zero on it (for the fifty cents).)Proportional size strategy (5% of all students): The student identified 25% as"pretty small" or "not too much," and then took an estimated proportionalamount from the $80. This strategy suggests an appreciation for theproportional nature of percent and with skill can yield a reasonable estimate,but the students did not express a set of constraints to guide their solutions.(Doris: I'm estimating, a few dollars off. Twenty-five percent, abort+. 8 or 9dollars off, give or take a dollar or a few.)
Guessing strategy (18% of all students): The student chose a number "atrandom" for a solution.
VISUAL REPRESENTATION AND WRITTEN COMPUTATION WITH 25%
Sixty-five percent of the students were able to circle 25% of a pictorial arrayof 20 stick figures most often by using appropriate, but sometimesinappropriate, strategies. Strategies that led to (or, had they been used withoutcomputational errors, could have led to) correct solutions were generally similarto those used in the mental math shopping task described above.
Benchmark strategy (27% of all students),Fraction strategy (38% of all students),Algorithm strategy (2% of all students), andPartition 100% strategy (5% of all students): The student identified the entirearray as 100%, determined (often through trial and error) the percent thateach of the individual figures represented (5% in this case), then, using thefigures as "counters," repetitively added that amount until the target percentwas reached. i
NATIONAL CENTER ON ADULT LITERACY 17

The inappropriate strategies included:Percent as a number strategy (5% of all students),Proportional size strategy (7% of all students), andGuessing strategy (17% of all students).The partition strategy would have been unwieldy for the shopping task
using $80, but was reasonable for the visual task given the task variables,which included the number 20 (evenly divisible into 100%), discrete objectsrather than continuous quantities (money), and the availability of the figuresas counters. The incidence of using the percent as a number (transforming25% into the number "25") was lower for the visual problem with 20 itemsthan for the mental math problem that used $80. The difference in thenumbers used in the problem may have discouraged the use of this strategysince it would seem impossible to separate out "25" of the 20 stick figureswhile it was not impossible to deduct 25 from $80 to find a sale price.
While 39 students were able to answer the "25% of 20 people" visualtask correctly, only 19 of them were also able to solve the mathematicallyequivalent written computational task "What is 25% of 20?". It is possiblethat the students approached the written assessment with the belief thatbecause the assessment resembled a "school task," only school-like strategiessuch as algorithmic computation would be appropriate and therefore did notconsider using informal or intuitive strategies.
RESPONSE PATTERNS ACROSS TASKS INVOLVING 25%
Of the 60 interviewees, 12 students (20%) responded appropriately to allfour different questions involving 25%. Seven people (12%) were unable torespond correctly to any of the questions. The remaining 41 students (68%)exhibited 5 patterns of responses, which are described below.a. Success with all tasks except "25% off of $80." Seven students (12%)
were able to appropriately explain the meaning of 25%, solve the visualtask, and answer the written computational problem, yet were unable tocompute mentally the cost of an $80 coat on sale for 25% off (a real-lifetask). Some of these students simply subtracted 25 from 80, while sometried to compute 25% of 80 by converting to a decimal notation and thenusing a multiplication algorithm, but found the procedure awkwardwithout paper and pencil. One student first tried the percentage amount perunit strategy which is suggested by the monetary nature of the problem,then seemed to move towards finding half of a half (benchmark strategy),but was unable to get through the process.
Angela: Taking 25 cents off each dollar and add up what's left so 75cents eighty times. (pause) I can't.
Interviewer: Can you make a guess?Angela: Cut that 80 in half, that's $40. Two 25%s is 50 and half off of
80 is 40. So $40.
However, when attempting the visual problem (circle 25% of 20 stickfigures), this student was able to complete the process of finding half of ahalf, probably by relying on the diagram to keep track of the quantities whichwere too much to keep in working memory while solving the shoppingproblem.
Angela: Twenty-five minus 20 is 5%, no. (Pause) Here's half, halfagain. So 5 of them will take it (the GED). The whole picture, split in
18 TECHNICAL REPORT TR95-06 ,I;

half, 10 and 10, split it again.Interviewer: Why?Angela: You're not asking for half. Four twenty-five percents make 100.
b. Success with all tasks except the computational question. Six students (10%of all students) responded appropriately to all questions except the writtencomputational question ("25% x 20=?"). These students demonstratedknowledge of the meaning of 25% and an ability to deal with 25% ineveryday environments, but were less competent when dealing with context-free problems.
c. Success only with visual task. Fourteen students (23% of all students) wereable to solve the visual problem, but not the mathematically equivalentwritten assessment problem, nor the shopping problem. These students havesome sense of the meaning of 25% as one fourth, but cannot operationalizethat knowledge in any way other than by visually dividing a quantity into 4parts, as illustrated by the two quotes below.
Interviewer: 25% of the (20) people want to take the GE1D test.Michelle: Only taking off one quarter of it, by counting by 5. Only got 20,
a quarter off of the whole thing. 5, just by looking at it.
Interviewer: Could you figure out how much money this $80 coat costs onsale?
Michelle: $72.50. I divided 25 by 80, leave me with 72 remainder 50.Interviewer: Why did you decide to do that?Michelle: Just by looking at it and taking a guess. I averaged it out. I know
that 25% is one quarter of that price. One quarter off of $80 is $75. $80taking one quarter off, only about 5 bucks off of it, so $75.
d. Success with computational task but not the shopping or visual tasks. Nineadults (15% of all students) provided appropriate answers to the writtenaP,sessment question, but not the mental math shopping task nor themathematically equivalent visual problem. Five of these students explainedthe meaning of 25% appropriately. Apparently, these students havedeveloped computational skills, but lack a sense of the meaning behind thecomputations; this hinders them from making sense of situations where thenumbers involved are not set out in standard, school-based form.Interviewer: Could you figure out how much money this $80 coat costs on
sale?Tara: 25 over 100 probably, probably 80 over 100, cross multiply. I could
multiply quickly, but I don't have paper. Use 100 amount, take 25%,leave me $75, from that I would need 5 more to make 80. Take another$5 off and come up with 30. Take 25 from 80 and another 5, take 30from 80, about $50.
e. Does not operationalize conceptual understanding of 25%. Five students (8%of all students) provided an appropriate response for the meaning of 25% butdid not answer the shopping, visual, or computational tasks involving 25%correctly. Apparently, their intuitions of the meaning of 25% are fragile andthus not really part of an integrated or useful system. The series of responsesgiven by one of these students demonstrates some appropriate ideas thatbecome confused easily.
NATIONAL CENTER ON ADULT LITERACY 19

Interviewer: Here it says "25% off." Can you explain what the 25%means?
Theresa: One fourth off of the price.Interviewer: Why is 25% equal to one fourth?Theresa: Four 25s equals 100 and one 25 is one fourth of 100.Interviewer: Why 100?Theresa: Just thinking in quarters or 25s. Or $25. 4 of them equal to
$100. 25 out of 100 is taking one fourth of the 100.
Shopping problemInterviewer: Could you figure out how much money this $80 coat costs
on sale (with 25% off)?Theresa: $40, half of, 40 and 40 is 80. Split the 80 in half. Half of 50 is
25, so half of 80 is 40.Interviewer: Why 50?Theresa: I broke 80 in half, so I broke the 25 in half. Half of 50 is 25.
Visual problem involving 25%Interviewer: 25% of the (20) people want to take the GED test.Theresa: (Circling 10 students), this is one fourth of the students.
Visual problem involving 50%Interviewer: The 10 people in the circle (out of 20) will work on math
today. What percent of the class is that?Theresa: One half of the class, so 25%. Half of the class is taking math
and half of the class is not.(Theresa did not respond to the written computational 25% question; she
solved written questions involving 50% and other percent values bymultiplying the percent by the base number, disregarding decimalpoints and sometimes losing a zero.)
GENERAL TRENDS ACROSS TASKS INVOLVING BASICPERCENT IDEAS, 50% AND 25%
In all, students were presented with 14 tasks in the interview and writtenassessment: five tasks concerning knowledge of 100%; five tasks involving50%; and four tasks involving 25%. Table 7 summarizes performancesacross these three task categories, and shows the percentage of students whoperformed successfully (using a criterion of responding appropriately to allor all but one of the tasks within a category (i.e., 4 out of 5 tasks involving100%, 4 out of 5 tasks involving 50%, or 3 out of 4 tasks involving 25%).
Table 7Percentages of Students Who Had No More Than OneInappropriate or Incorrect Response for Each Category of PercentQuestions
Grade levelCategories Total
number ofquestions
Knowledge of 100% 5
50% tasks 5
25% tasks 4
6th andbelow
7th-8th 9th andabove
Unclassified Total
n=15 n=24 n=15 no n=60
60% 63% 80% 83% 68%
53% 71% 93% 67% 72%
13% 46% 53% 50% 40%
23 TECHNICAL REPORT TR95-069tjAr,
The success rates in the categories of "Knowledge of 100%" and "50%tasks" are quite similar. Of the 60 students, 41 (68%) were successful with"100% questions" and 43 students (72%) were successful with "50% tasks."When individual performance across these two categories of tasks isconsidered, 55% of the students were successful in both categories and 15%were Successful in neither category. The remaining 30% of the students weresuccessful in one category but not the other, with about half successful in eachcategory.
The finding that 30% of the students were successful in one category butnot the other suggests that the ideas targeted by the two categories of questionsmay not inform each other, meaning that a demonstrated knowledge ofone setof ideas or skills does not necessarily lead to knowledge of the other; each bodyof information or skills is attainable in isolation for these students. Apparently,some students have some knowledge of the different facets of 100%, yet thisknowledge does not help them sufficiently to make sense of situations in which50% appears. Other students realize that 50% is equivalent to one half and areable to apply that knowledge in a useful way, yet do not have an elaboratedconceptualization of a system based on 100% within which 50% has meaning.Perhaps the knowledge of the meaning and application of 50% is notmathematically based but was developed through personal experiences andencountering the common usage of percent words in everyday language inwhich the term "50%" is treated as a word synonymous with "half' rather thanas part of a mathematical system.
Table 7 shows that the tasks using 25% were more difficult for students inall groups than were the 50% tasks. Yet, 24 students (40%) were successfulwith at least three of the four 25% tasks, including 2 students from the groupwith the lowest scores on the standardized tests. The successful students werefound to be those who also demonstrated proficiency on the "Knowledge of100%" questions (only 1 of the 24 students responded appropriately to less thanfour of the five questions) and on the tasks using 50% (only 2 of the 24students were not successful here and all of their missed questions were writtencomputations). These data suggest that those who were competent incomprehending and using 25% also demonstrated both a knowledge of the roleof 100% within the percent system and the ability to use at least one otherpercent (50%) in a meaningful way.
On the other hand, demonstrated knowledge of the facets of 100% does notnecessarily imply an ability to activate that knowledge across a variety of tasksusing 25% (for 18 students), nor does an ability to work with 50% necessarilytransfer to an ability to work with 25% (for 21 students). Knowledge of 100%and the ability to use 50% appropriately, to the extent these constructs wcremeasured, is apparently not always sufficient for students to be in a position togeneralize their knowledge to 25%.
As expected, the highest grade-level group was the most successful with thevarious percent tasks and displayed a broad knowledge of the role of 100% asthe basis of the percent system. However, even within this group, there wasevidence of gaps in understanding as well as some limitations on how and whenknowledge was applied. Less expected was the ability of many in the lowestgrade-level group to respond successfully to many of the questions, particularlythose involving 100%. Half of those in the lowest grade group were able torespond appropriately to either 4 or 5 of the questions regarding basic ideasabout the role of 100% i the percent system. Many of the adult students whoare classified as needing much remedial mathematics education (based onexisting testing practices), appear to have some knowledge of the percent
NATIONAL CENTER ON ADULT LITERACY 21

system and/or some familiarity with 50%; this knowledge, however, seemsto be limited to informal ideas that are not integrated within an elaboratedframework of percent knowledge and that therefore do not inform activitiesinvolving 25%.
DISCUSSION
When adults reenter an educational setting, they come to instruction withpreexisting intuitions and knowledge regarding mathematical concepts andoperations, based on their prior formal learning as well as on informal orwork-related experiences they may have had. The formal knowledge thatadult students bring with them may have been greatly modified or enhancedsince it was acquired in school; also, it may not necessarily be part of anelaborated cognitive structure, but rather have been developed within specificcultural or everyday practices and generally remain tied to those contexts(Bishop, 1992; Lave, Murtaugh, & de la Rocha, 1984; Nunes et al.., 1993).
Clarification of the nature of adults' preexisting knowledge becomeseducationally important if we assume that adults construct new knowledge inpart on the basis of their (pre) existing knowledge. It is often argued that thepreexisting knowledge students bring with them to the classroom canfacilitate, but also hinder, later development of mathematical knowledge andskills (Leinhardt, 1988). However, few detailed descriptions of themathematical knowledge of adult students in the United States have beenpublished. This study focused on clarifying the nature of adults' informaland formal knowledge about percent, a concept having wide application inhome, work, and citizenship life contexts of adults. Research on adults'preexisting knowledge about percent would help illuminate issues inassessment and accommodation during classroom instruction on percent. Bylooking at adults' patterns of responses to percent questions, we establish thebreadth, depth, and range of their preexisting knowledge and describe theenvironment into which new instruction must be integrated.R ESPONSE PATTERNS
Virtually all of the adults who participated in this study, including thosewith low prior educational achievement or "grade level" as determined bystandardized test scores, demonstrated some conceptual understanding ofpercent upon entering their programs. However, response patterns toexplanatory, shopping, visual, and computational tasks varied considerably,both within and across students. Only six students (10%) respondedappropriately to all tasks, even though these tasks involved percent values(100%, 50%, 25%) that many educators would consider simple and that wemight expect adults to understand given that they have to deal with suchpercent values almost daily.
Students classified at the higher grade levels showed stronger percent-related knowledge and skills than students classified at lower grade levels.Such a performance difference is not surprising and could he expected, inpart because performance on both program-administered tests and the writtenassessments used in this study are determined to some extent by the samefactors, such as knowledge of school-taught computational algorithms ortest-wiseness.
While students at the higher grade levels performed better as a group,many of them also showed gaps in their knowledge of percent, whether in
22 TECHNICAL REPORT TR95-06

knowledge of 100%, in informal mental math, or in computation. At the sametime, reasonable performance on some tasks was also found among a sizable,though smaller, group of students classified in the lowest grade level (6th andbelow). Between one third and one half of all students (depending on whichpercent task was used) performed better on mental and visual tasks than onmathematically equivalent written computational tasks. A smaller group didbetter on computational tasks (probably by using school-based algorithms) thanon mental or visual tasks that required more conceptual understanding andflexible problem-solving strategies.
KNOWLEDGE ABOUT THE PERCENT SYSTEM
The basic principle underlying the percent system, that proportions can beexpressed as quantities in relation to a standard number (100), appeared familiarin at least one context to nearly all participating students (who have not yetstudied about percent in their programs). However, students' knowledge of100% was not robust; several students who, in one context, appeared tounderstand the principle that percents are interpreted in relation to a 100-unitsystem nevertheless became hesitant or unsure about it in other contexts.Lembke and Reys (1994) reported a related finding: eleventh-grade studentsshowed less confidence in 100 as the basis for percent than did youngerstudents, even though the older students had the benefit of more formalinstruction in percents.
For many of the students in this study, "100%" appeared as a convenient,commonly used, round number which, in at least some contexts, did notspecifically imply a whole that is always divisible into 100 parts. Somestudents' interpretations of "100% apple juice," for example, were along verbalrather than mathematical lines and were incompatible with statements that theymade about the meaning of 100% in other contexts. Similarly, while moststudents had little or no difficulty interpreting the term "50%" as "half' andmany performed mental computations with 50% without errors, some wereunable to give a mathematical justification for why 50% is equal to half.
We expected that most students who know that 50% is a "half" would alsorealize that 25% is "half of a half," but this was not the case. Performance ontasks involving 25% was markedly lower than on tasks involving 50%. Manystudents identified 25% as "one fourth," or invoked explanations couched intheir experience with the American monetary system (e.g., "25% is equal to aquarter because there are four quarters in a dollar"); they often did not connectthis knowledge of facts about fractions or money to the knowledge of thepercent system that they may have demonstrated on other tasks.
This pattern of results gives rise to the hypothesis that many adults whocome to literacy programs may have developed certain verbal associationsinvolving percents through repeated encounters with percent terms withineveryday discourse (e.g. "I feel 100%," "100% natural"). As a result, theyhave not fully grasped the mathematical principle underlying the meaning ofsuch terms in each specific context and across different contexts.
The teaching and learning challenges caused by the existence of botheveryday and mathematical meanings for terms used in the mathematicsclassroom have been the focus of previous work (e.g., Laborde, 1990). Thecase usually made is that students (or teachers) apply a legitimate everydaymeaning of a term instead of a mathematical meaning, or vice versa, causingconfusion in classroom communication and disrupting understanding. Thisstudy showed a related but different phenomenon: students associate 100% with"all," "50%" with "half," or "25%" with "quarter," but may not fully
`-?
NATIONAL CENTER ON ADULT LITERACY 23
understand the mathematical relationship between 100% and 50%, orbetween 50% and 25%. Each term may gain an idiosyncratic meaning forsome students, based on the context in which it was encountered. Undersuch circumstances, uneven performance on different tasks, of the kindobserved in this study, is quite possible.
IMPLICATIONS FOR INSTRUCTIONAL PRAVZICE
Adult mathematics instruction in percents aims to help students developthe knowledge and skills that will be useful in a variety of contexts, bothwithin and outside of the learning environment. Since adult students alreadyfunction in the real world, new learning should enhance or improve theirexisting numeracy practices as well as enrich their understanding of themathematical foundation that supports these practices. Effective instructionrequires attention to and analysis of existing knowledge and practices.
CONTENT OF INSTRUCTION
As Resnick (1986) and others (e.g., De Vault, 1991) have pointed out,informal knowledge, regardless of its degree of correctness and usefulness,is self-evident, obvious, and easily accessible to the individual holding it,and is embedded in the everyday practices in which it develops. Nunes et al.(1993) observed that knowledge developed in out-of-school contexts is lessaccessible to reflection (i.e., its holder does not have reason to understandthe mathematical generalities that underlie it). Therefore, instruction of adultstudents should encourage them to reexamine the meanings that they attach tofamiliar terms, helping them to see the mathematics within and underlyingthese terms while promoting the development of habits of reflecting on themathematical implications of their everyday practices.
Gal (1993) has noted that professional development resources for adulteducators often do not acknowledge the potential influence of learners'informal mathematical knowledge on the teaching-learning process.Textbooks and workbooks aimed at the adult education market usually focuson developing students' computational skills, and offer few opportunities forstudents to connect classroom exercises with their out-of-school knowledgeand practices. Many textbooks present the study ofpercent as an extension ofthe study of fractions and decimals. This approach leads to an emphasis onthe mechanics of percent-related calculations, or on converting betweenpercents, fractions, and decimals, rather than also on (a) developing anintuitive "feel" for the ordinal properties or meaning of percent (e.g., that90% is "pretty close" to 100%), (b) developing a robust understanding of themeaning of percent in multiple contexts, and (c) developing interpretive skillsappropriate for percent-laden everyday contexts where computation is notrequired.
Interpretive skills are seldom emphasized in textbooks or in professionaldevelopment resources for teachers (Gal, 1993), even though adults'encounters with percents (e.g., in newspapers or financial documents) sooften require comprehension and sense-making rather than computation. Ourcurrent study shows that many students can make appropriate interpretationsof some percent statements, even when their formal or mental computationskills are lacking. Continued development of interpretive skills (includingstudents' mathematical vocabulary and oral skills) may require betterintegration of literacy and numeracy instruction, including the use ofeveryday reading materials that mention percent (e.g., newspapers), rather
34 TECHNICAL REPORT TR95-06
than expecting interpretive skills to develop informally as a by-product ofattention to decontextualized computational skills.
USING ASSESSMENTS TO INFORM INSTRUCTION
Standardized tests such as the TABE or ABLE were used by all theprograms that participated in this study; they are being used by most adulteducation programs in the United States (Gal & Schuh, 1994) to evaluatestudents' mathematical skills. The discussion above suggests that sole relianceon written assessments can provide incomplete or distorted estimates ofstudents' pre-instruction knowledge of percents (and other mathematical skills),and misinform decisions about starting points for instruction (Streefland & vanden Heuvel-Panhuizen, 1992).
Students' true knowledge of percent may at times be masked by ambiguitiescaused by their ability to empby convincingly percent terms based on theircolloquial, non-mathematical use of such terms outside the classroom. This maycause teachers to overestimate students' knowledge, leading to erroneousinstructional decisions. Assessment of percent-related (and other numeracy)skills either at the onset or during instruction, should therefore be enhanced byincluding open-ended, realistic performance tasks or simple simulations, whichwould aim to elicit students' informal as well as formal knowledge. Care mustbe taken to evaluate not only responses to questions involving familiarbenchmark percents, such as 50% or 25%, but also involving less familiarpercents (e.g., 15%, 7%, 1%, 150%). These percents are less likely to triggereveryday verbal associations that may displace mathematical meaning for thestudent or suggest an inaccurate assessment to the instructor.
The difficulties many students displayed in explaining their thinking aboutpercent raise doubts about the appropriateness of using self-assessments as adiagnostic tool; such assessments are currently used by some adult literacyprograms in the United States during an intake process (Gal & Schuh, 1994).Students may be unaware of the patchy or superficial nature of their ownknowledge of percents and, being (mis)led by their familiarity with context-specific applications of percent, may overestimate their knowledge and skills.
CONCLUSIONS
An increasing number of mathematics educators argue that instruction willbe most effective if teachers acknowledge and build upon intuitions andinformal understanding that students bring to the classroom (Lacampagne,1993). This study provided examples of strengths and weaknesses in adultstudents' pre-instruction knowledge of percents; adult educators should becognizant of this situation when planning instruction or when interacting withstudents. Our findings further suggest that the learning of mathematics too oftenoccurs in isolation from its applications, and many functional uses of numeracyskills go unrecognized and unsupported in the mathematics classroom. Bothpractitioners and researchers should continue to explore effective methods forensuring that students' classroom-based skills inform their everydayquantitative practices and interpretive skills, and vice versa.
The knowledge that teachers may glean about students' informal and formalskills regarding percent (and other mathematical subjects) is of limited valueunless teachers make use of it in their instruction. Adult educators are pressuredby the need to prepare many students for passing tests (e.g., GED) and by the
NATIONAL CENTER ON ADULi%3i.ITERACY 25

need to work with students within the same class who have a variety ofabilities and backgrounds. Under such circumstances, many educators !myfind it difficult to assess and accommodate students' preexisting knowledge.(A similar situation may exist in K-12 education. Leinhardt (1988), forexample, describes a case of master mathematics teachers who ignoreelementary school students' informal knowledge.)
Improving methods for assessing the full range of students' preexistingmathematical knowledge is only a first step on the way to improving practice.This study showed that complex and diverse profiles of student knowledgeof percent do exist. Professional development efforts should thereforeencourage educators to consider the specific ways in which they can adapttheir instruction, depending on the results of improved assessments.
Modification of the teaching-learning process by taking into account adultstudents' prior knowledge will face many challenges. The implementation ofa new teaching perspective has been shown to involve a lengthy butworthwhile experimentation process by teachers (Leone lli, Merson, &Schmitt, 1994). Educational organizations must be willing to supportteachers as they explore new instructional and assessment practices. Just asour understanding of adults' mathematical knowledge and learning isevolving, educational practice should also continually evolve to ensure themost effective and meaningful educational experiences for adult students.
26 TECHNICAL REPORT TR95-06
REFERENCES
Al linger, G. D., & Payne, J. N. (1986). Estimation and mental arithmetic with percent. In H.Schoen & M. Zweng (Eds.), Estimation and mental computation (pp. 141-155). Reston, VA:National Council of Teachers of Mathematics.
Behr, M. J., Harel, G., Post, T., & Lesh, R. (1992). Rational number, ratio, and proportion. In D.A. Grouws (Ed.), Handbook of research on mathematics teaching and learning (pp. 296-333).New York: Macmillan.
Bishop, A. J. (1992). International perspectives on research in mathematics education. In D. A.Grouws (Ed.), Handbook of research on mathematics teaching and learning (pp. 710-723). NewYork: Macmillan.
De Vault, M. L. (1991). Feeding the family: The social organization of caring as gendered work.Chicago: The University of Chicago Press.
Fischbein, E., Deri, M., Nel lo, M. S., & Marino, M. S. (1985). The role of implicit models insolving verbal problems in multiplication and division. Journal for Research in MathematicsEducation, 16, 3-17.
Gal, I. (1993). Issues and challenges in adult numeracy (Technical Report No. TR93-15).Philadelphia: University of Pennsylvania, National Center on Adult Literacy.
Gal, I., & Schuh, A. (1994). Who counts in adult literacy programs? A national survey of numeracyeducation (Technical Report No. TR94-09). Philadelphia: University of Pennsylvania,National Center on Adult Literacy.
Jorarn, E., Raghavan, K., & Resnick, L. B. (1992). Children's reasoning about percents in everydaytexts. Paper presented at the annual meeting of the American Educational ResearchAssociation, San Francisco, CA.
Kirsch, I. S., Jungeblut, A., Jenkins, L., & Kolstad, A. (1993). Adult literacy in America: A firstlook at the results of the National Adult Literacy Survey. Washington, DC: U.S. Department ofEducation, National Center for Education Statistics.
Laborde, C. (1990). Language and mathematics. In P. Nesher & J. Kilpatrick (Eds.), Mathematicsand cognition (pp. 53-69). New York: Cambridge University Press.
Lacampagne, C. B. (1993). Transforming ideas for teaching and learning mathematics.Washington, DC: U.S. Department of Education, Office of Educational Research andImprovement.
Lave, J., Murtaugh, M., & de la Rocha, 0. (1984). The dialectic of arithmetic in grocery shopping.In B. Rogoff & J. Lave (Eds.), Everyday cognition: Its development in social context.Cambridge, MA: Harvard University Press.
Leinhardt, G. (1988). Getting to know: Tracing students' mathematical knowledge from intuition tocompetence. Educational Psychologist, 23(2), 119-144.
Lembke, L. 0., & Reys, B. J. (1994). The development of, and interaction between, intuitive andschool-taught ideas about percent. Journal for Research in Mathematics Education, 25(3), 237259.
Leonelli, E., Merson, M. W., & Schmitt, M. J. (Eds.). (1994). Implementing the MassachusettsAdult Basic Education Math Standards: Our research stories. Malden: Massachusetts Departmentof Education.
Mack, N. K. (1990). Learning fractions with understanding: Building on informal knowledge.Journal for Research in Mathematics Education, 21(1), 16-32.
Mullis, I. V., Dossey, J. A., Owen, E. H., & Phillips, G. W. (1991). The state of mathematicsachievement: NAEP's 1990 Assessment of the nation and the trial assessment of the states.Washington, DC: U.S. Department of Education, National Center for Education Statistics.
Nunes, T., Schliemann, A. D., & Carraher, D. W. (1993). Street mathematics and schoolmathematics. New York: Cambridge University Press.
NATIONAL CENTER ON ADULT LITERACY 27
BEST COPY AVAILABLE
Resnick, L. B. (1986). The development of mathematical intuition. In M. Perlmutter (Ed.),Perspectives on intellectual development: The Minnesota symposia on child psychology(Vol. 19, pp. 159-194). Hillsdale, NJ: Lawrence Erlbaum Associates.
Riley, M. S., Greeno, J. G., & Heller, J. I. (1983). Development of children's problem-solvingability in arithmetic. In H. Ginsburg (Ed.), The development of mathematical thinking (pp.153-196). New York: Academic Press.
Sowder, J. T. (1988). Mental computation and number comparison: Their roles in thedevelopment of number sense and computational estimation. In J. Hiebert & M. Behr(Eds.), Nwnber concepts and operations in the middle grades (Vol. 2, pp. 220-235). Reston,VA: National Council of Teachers of Mathematics.
Sticht, T. G. (1990). Testing and assessment in adult basic education and English as a secondlanguage programs. San Diego, CA: Applied Behavioral & Cognitive Sciences, Inc.
Streefland, L. & van den Heuvel-Panhuizen, M. (1992). Evoking pupils' informal knowledge onpercents. In W. Geeslin & K. Graham (Eds.), Proceedings of the sixteenth Psychology inMathematics Education conference (Vol. 3, pp. 51-57). Durham: University of NewHampshire.
Venezky, R. L., & Bregar, W. S. (1988). Different levels of ability in solving mathematicalword problems. Journal of Mathematical Behavior, 7(2), 111-134.
Wearne, D., & Hiebert, J. (1988). Constructing and using meaning for mathematical symbols:The case of decimal fractions. In J. Hiebert & M. Behr (Eds.), Number concepts andoperations in the middle grades (Vol. 2, pp. 220-235). Reston, VA: National Council ofTeachers of Mathematics.
28 TECHNICAL REPORT TR96-06