document resume - eric · · 2014-02-24370,000 veterans attended two-year colleges under the...
TRANSCRIPT

DOCUMENT RESUME
ED 227 915 JC 830 146
AUTHOR Shavelson, Richard J.; And OthersTITLE Potential for Military Recruiting from Two-Year
Colleges and Postsecondary Vocational Schools. A RandNote.
INSTITUTION Rand Corp., Santa Monica, Calif.SPONS AGENCY Office of the Assistant Secretary of Defense for
Manpower and Reserve Aifairs (DOD), Washington,D.C.
REPORT NO Rand-N-1946-MRALPUB DATE Jan 83CONTRACT MDA903-83-C-0047NOTE 114p.PUB TYPE Reports - Evaluative/Feasibility (142) -- Statistical
Data (110)
EDRS PRICE MF01/PC05 Plus Postage.DESCRIPTORS Educational Background; *Enlisted Personnel; Males;
*Military Service; National Surveys; *Personnel Data;Personnel Needs; *Recruitment; *StudentCharacteristics; *Two Year Colleges; *Two YearCollege Students
IDENTIFIERS *Military Recruitment
ABSTRACTWith the military's requirements for high-quality
recruits expected to increase over the next decade, a study wasconducted to evaluate the recruiting potential of two-yearpost-secondary institutions. Specifics, .y, the study sought toascertain the characteristics of two-year colleges, whethersufficient numbers of potential recruits existed in theseinstitutions for fruitful recruitment, the degree to which thesestudents met enlistment standards, the penetrability of the market,the value of previous recruits, and reseirch needed for thedevelopment of successful recruitment policies. A review of theliterature on higher education and military recruiting from thismarket, as well as analyses of data from the Defense Manpower.DataCenter and from three large-scale surveys of youth, revealed that:(1) over 1 million male two-year college students were estimated tofall within recruitment ages; (2) this market had not beensubstantially penetrated, as less than 4% of all 1981 recruitswithout prior military experience had 1 or 2 years of college, andless than 1% of the two-year college class of 1981 were considering amilitary career option; (3) the instability of two-year collegestudents' educational and career goals indicated that with the rightrecruitment incentives and strategies the market could be penetrated;and (4). recruits with prior college experience had lower attritionrates than non-college recruits. Recommendations for further studyare included. (DAB)
***********************************************************************Reproductions supplied by EDRS are the best that can be made
from the original document.*******************************************************************se***

A RAND NOTE(NJ
Prepared for
WFP.4,)1)U(,i;.4 Eft- t-". 1.4 ANTE( tir
. 1 I
kVA' .7 (.141
RandSANTAMONICA,CA.M011
POTENTIAL FOR MILITARY RECRUITING FROMTWO-YEAR COLLEGES AND POSTSECONDARYVOCATIONAL SCHOOLS
RI:Chard J. Shavelson, Gus W. Haggstrom,
John D. Winkler
January 1983
N-1946-MRAL
Office of the Assistant Secretary ofDefense/Manpower, Reserve Affairs
and Logistics
Us 01-PAKI MI NI OF 1 MICA TION
The research described in this report was sponsored by theOffice of the Assistant Secretary of Defense/Manpowet, ReserveAffairs and Logistics under Contract No. MDA903-83-C-0047.
The Rand Publications Series: The Report is the principal publication doc-umenting and transmitting Rand's major research findings and final researchresults. The Rand Note reports other outputs of sponsored research forgeneral distribution. Publications of The Rand Corporation do not neces-sarily reflect the opinions or policies of the sponsors of Rand research.
Published by The Rand Corporation
A RAND NOTE
Prepared for
Rand
POTENTIAL FOR MILITARY RECRUITING FROM
TWO-YEAR COLLEGES AND POSTSECONDARYVOCATIONAL SCHOOLS
Richard J. Shavelson, Gus W. Haggstrom,John D. Winkler
January 1983
N-1946-MRAL
Office of the Assistant Secretary ofDefense/Manpower, Reserve Affairs
and Logistics
APPOOVIID FOR KWIC MIAS* DISTRIWT1ON UNUMITID

- iii -
PREFACE
This Note presents the findings of the Rand research project
"Exploratory Studies of the Recruiting Market in Two-Year Postsecondary
Institutions." Over the next 10 years, the services' requirements for
"high-quality" recruits are expected to increase, while the size of the
manpower pool is expected to decrease. To meet accession needs, as yet
untapped recruiting markets need to be explored. The goal of this
project is to evaluate the recruiting potential of one such market--
the two-year postsecondary institutions. This Note is a progress report
on that evaluation.. It was prepared as part of Rand's Manpower,
Mobilization, and Readiness Program, sponsored by the Office of the
Assistant Secretary of Defense (Manpower, Reserve Affairs, and
Logistics).
The authors wish to thank David Boesel, Arthur M. Cohen, and Anita
Lancaster for their critical reviews of this document. The authors are
responsible, nevertheless, for any errors of commission or omission.
- v
SUMMARY
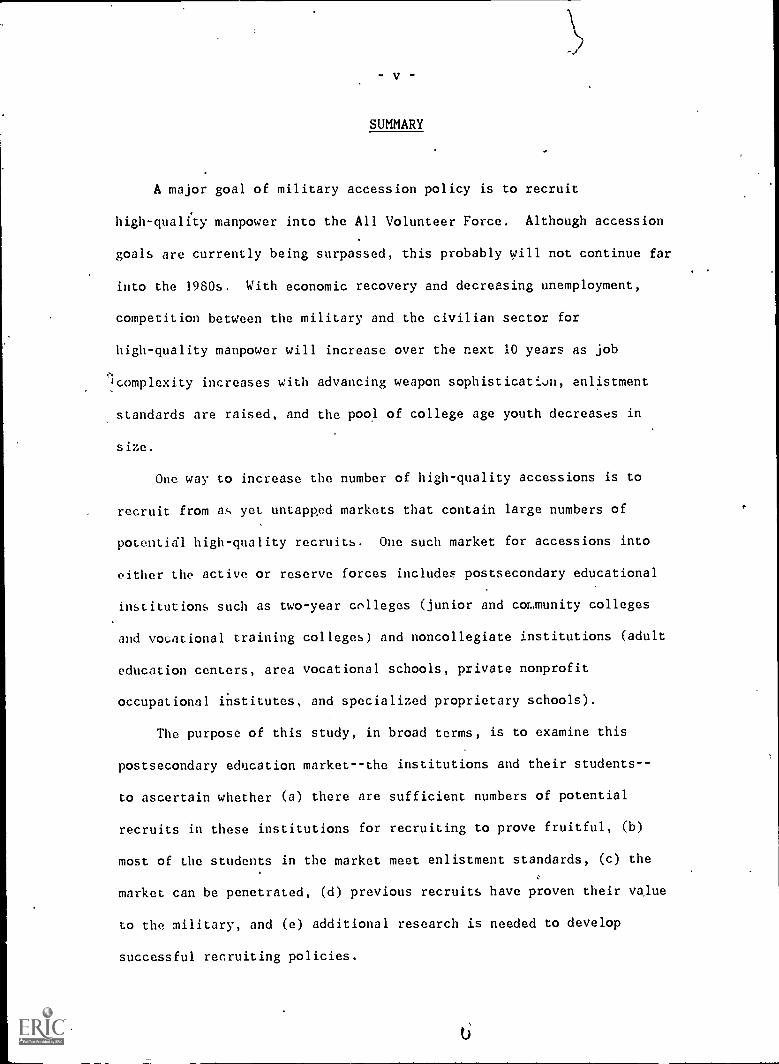
A major goal of military accession policy is to recruit
high-qualfty manpower into the All Volunteer Force. Although accession
goals are currently being surpassed, this probably will not continue far
into the 1960s. With economic recovery and decreasing unemployment,
competition between the military and the civilian sector for
high-quality manpower will increase over the next 10 years as job
.")complexity increases with advancing weapon sophistication, enlistment
standards are raised, and the pool of college age youth decreases in
size.
One way to increase the number of high-quality accessions is to
recruit from as yet untapged markets that contain large numbers of
potentidl high-quality recruits. One such market for accessions into
either the active or reserve forces includes postsecondary educational
institutions such as two-year colleges (junior and cmmunity colleges
and vocational training colleges) and noncollegiate institutions (adult
education centers, area vocational schools, private nonprofit
occupationnl institutes, and specialized proprietary schools).
The purpose of this study, in broad terms, is to examine this
postsecondary education market--the institutions and their students--
to ascertain whether (a) there are sufficient numbers of potential
recruits in these institutions for recruiting to prove fruitful, (b)
most of the students in the market meet enlistment standards, (c) the
market can be penetrated, (d) previous recruits have proven their va,lue
to the military, and (e) additional research is needed to develop
successful recruiting policies.

- vi -
To meet these goals, we surveyed the literature on postsecon4ary
institutions and other tesearch pertinent to recruiting in this market.
The more important of the two studies that directly address recruitment
strat-egies is reviewed In addition, we examined Defense Manpower Data
Center (DMDC) accessions data for 1981, as well as data from three large-
scale surveys of youth: The National Longitudinal Survey of the High
School Class of 19,72 (Levinsohn et al., 1978), High School and Beyond
(Peng et al., 1981), and the 1979 DoD Survey of Personnel Entering
Military Service (Doering et al., 1980).
There is no question that the postsecondary institutions under
study contain large numbers of potentiaChigh-quality recruits, but the
exact sizes of the subpopulations of primary interest are hard to pin
down. Even the estimates of total enrollments in the two-year colleges
vary from one source to another. The National Center for Education
Statistics (NCES) repo:Led that 4.5 million students were enrolled in
these colleges in the fall of 1980, while the Bureau of the Census
estimated the total enrollment in October 1980 to be 3.1 million. In
any case, these figures grossly exaggerate the pool of potential
recruits because the majority of the students are either not eligible to
enlist or have career and family commitments that effectively preclude
military service as an option. If .the Bureau of the Census enrollment
figure is used as a base, there were approximately 1.3 million males in
the two-year colleges in October 1980, of whom approximately 720,000
were 21 or younger. Including a rough estimate of the number of
military eligible males age 22 and above, we estimate that in 1980 there

were something like one million male students in the two-year colleges
who fell within the targeted age range for nonprior service accessions.
Although recruiting policies are ordinarily targeted to individuals
within the 18 to 21 age group, older students should also be considered
for both the active forces and the reserves. Furthermore, students with
prior military service should also be considered in accession policy,
perhaps as important sources of manpower for the reserves: In FY81,
370,000 veterans attended two-year colleges under the Post-Korean
Educational Assistance Program and another 120,000 attended vocational
and technical schools. These numbers suggest that two-year colleges and
vocational s hools might serve as locales for recruiting prior
servicemen
With respect to meeting enlistment standards--age, ability, single
without dependents, gocd.morals, and physical health--recruiting from
two-year colleges and postsecondary vocational schools promises to raise
the overall quality of the enlisted force. Two-year college students
are above average in aptitude, and over 90 percent of those between the
ages of 18 and 21 are single and report being in good physical health.
The two-year college and postsecondary vocational school markets
have not been substantially penetrated to date. For example, less then
4 percent of all nonprior service accessions in 1981 haa one or two
years of college: Less than 1 percent of the freshMen in the two-year
college class of 1981 indicated that L.hey were considering the military
as a career option. Nevertheless, the market contains many students
whose educational and occupational aspirations are unstable, and their
changing aspirations are mirrored by their behavior. Over 60 percent of
the students are enrolled part-time; transfers into and out of college
P
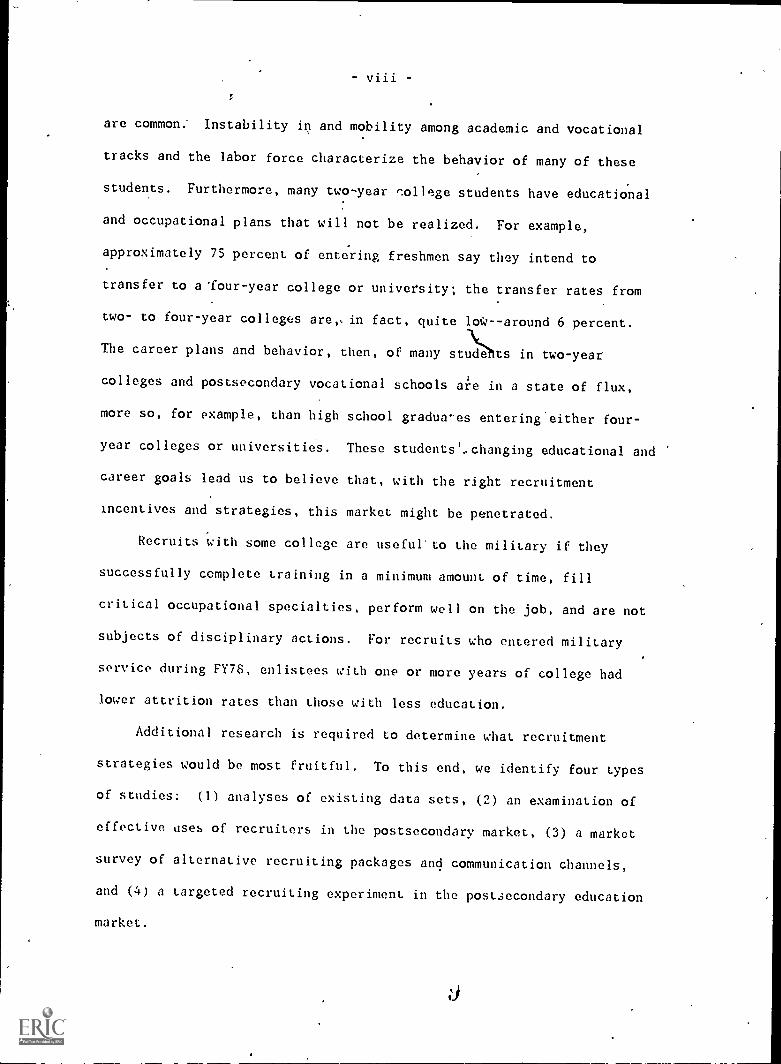
are common: Instability in and mobility among academic and vocational
tracks and the labor force characterize the behavior of many of these
students. Furthermore, many two-year (..ollege students have educational
and occupational plans that will not be realized. For example,
approximately 75 percent of entering freshmen say they intend to
transfer to a lour-year college or university; the transfer rates from
two- to four-year colleges areo in fact, quite loW--around 6 percent.
\IIThe career plans and behavior, then, of many stude ts in two-year
colleges and postsecondary vocational schools ai-e in a state of flux,
more so, for example, than high school gradua'es entering'either four-
year colleges or universities. These studentsl,changing educational and
career goals lead us to believe that, with the right recruitment
incentives and strategies, this market might be penetrated.
Recruits with some college are useful'to the military if they
successfully ccmplete training in a minimum amount of time, fill
critical occupational specialties, perform well on the job, and are not
subjects of disciplinary actions. For recruits who entered military
service during FY78, enlistees with one or more years of college had
lower attrition rates than those with less education.
Additional research is required to determine what recruitment
strategies would be most fruitful. To this end, we identify four types
of studies: (1) analyses of existing data sets, (2) an examination of
effective uses of recruiters in the postsecondary market, (3) a market
survey of alternative recruiting packages and communication channels,
and (4) a targeted recruiting experiment in the postsecondary education
market.
CONTENTS
1
PREFACE iii
SUMMARY
1IGURES xi
TABLES xiii
Section
I. INTRODUCTION 1
II. ANALYSIS OF THE MARKETPLACE: LITERATURE REVIEW 5
Tlie Nature of Target Postsecondary Institutions 5
Size and Control of Two-Year Colleges 8
Locatiohs and Dispersion 10
Growth in Number of Institutions and Enrollmen.s 12
Curricular Functions 16
Financial Stability 19
Characteristics of Students in Two-Year Colleges 21
Numbers of Male Students Between 18 and 21 Years 21
Profile of Two-Year College Students 23
Penetrability of the Market 27'
Utility of Enlistees from Two-Year Colleges 39
Recruiting Environment in Two-Year Colleges 39
III. ANALYSIS OF THE MARKET PLACE: NEW DATA 42
Profile of Students in Two-Year Colleges:Methodological COnsiderations 43
Profile of Two-Year College Students' Characteristics 48
Penetrabiliity of the Market 60
Utility of Recruits with Some College 66
Cost Considerations Associated with Two-Year CollegeAccessions 68
IV. SUMMARY AND RECOMMENDATIONS FOR FURTHER STUDIES 73
Analyses of Existing Data Sets 74
Recruiters in the Postsecondary Marketplace 80
Survey of the Market 81
Recruiting Experiment 83
Appendix 85
REFERENCES 97

1
FIGURES (e
,(
t 1,
1. Male Cohort Sizes and Accession Needs (1973-1990) 2
2. Enrollment in Postsecondary Institutions, 1979 9
3 States with the Largest Concentrations of Two-year Colleges 11
4. Growth in (a) Number of Two-year Institutions and (b) TheirEnrollments: Fall 1963 to Fall 1979 14
5. Enrollment Trends in Collegiate Institutions 15
6. Two-year College Enrollments 16
7. NumberS,of Associate Degrees Awarded, 1970-1980 18
8. Sources of Income for Public Two-Year Colleges 20
9. Breakdown of Two-year College Enrollments in Fall 1980 23
10. Main Activities, Men between 18 and 21 (Fall 1980) 41
li

.13
TABLES
1. Market Density in Noncollegiate Postsecondary and Two-yearCollegiate In,.stitutions, 1979 7
2. Distribution of Enrollments in Private and Public Two-yearColleges, 1979 10
3. States with Largest Numbers of Public Two-year Collbges andEnrollments, 1979 12
4. Characteristics of College Freshmen and Individuals inOther Postsecondary Tracks, Fall 1972 25
4 3. Characteristics of Freshmcn in Two:year Colleges, 1981 27
6. Characteristics of a Sample of Two-Year College Male Stu-dents, Spring 1975 30
7 Two-yearCollege Students' Responses to a Question onEnlistment Propensity 36
8a. Comparison of Attributes of NLS Participants Who Planned toUndertake Certain Postsecondary Activities With Those WhoDid Undertake Those Activities: Means and StandardizedDifferences in Means for Males 44
8b. Comparison of Attributes of NLS Participants Who Planned toUndertake Certain Postsecondary Activities With Those WhoDid Undertake Those Activities: Means and StandardizedDifferences in Means cor Females 45
9a. Attribute Profile of High School Seniors Planning to Under-take Certain Postsecondary Activities (1980): Means forMales 50
9b. Attribute Profile of High School Seniors Planning to Under-take Certain Postsecondary Activities (1980): Means forFemales
10a. Attribute Profile of High School Seniors Planning to EnterTwo-year Colleges or Vocational/Technical Schools (1980):Means for Males
51
52
10b. Attribute Profile of High School Seniors Planning to EnterTwo-year Colleges or Vocational/Technical Schools (1980):Means for Females 53
11. Mean AFQT Scores for Male and Female Accessions by iduca-tional Attainment, 1981 55
12
1/. Percentages of Enlistments in Mental Categories I-IIIA byEducational Attainment and Sex, 1981 56
13. NPS Accessions in the Armed Forces by Educational Attainment,Service, and Sex: FY81 62
143. Aspirations of High School Seniors Planning to UndertakeCertain Postsecondary Activities (1980): Means forMales 63
14b. Aspirations of High School Seniors Planning to UndertakeCertain Postsecondary Activities (1980): Means forF,mlales 63
15a. Aspirations of High School Seniors Planning to Enter Two-year Colleges or Vocational/Technical Schools (1980):Means for Males 64
15b. Aspirations of High School Seniors Planning to Enter Two-year Colleges or Vocational/Technical Schools (1980):Means for Females 64
lo. Attrition Rates Among Nonprior Service Enlistees Who EnteredService During FY78 by Educational Attainment, MentalCategory, and Sex 67
17. Entry Level Pay Grades by Sex and Educational Attainment .... 70
18. Marital Status and Number of Dependents by Sex and Educa-tional Attainment 71
A.1a. Comparison.of Attributes of NLS Participants Who Planned toUndertake Certain Postsecondary Activities With Those WhoDid Undertake Those Activities: Standard Deviations forMales 86
A.1b. Comparison of Attributes of NLS Participants Who Planned toUndertake Certain Postsecondary Activities With Those WhoDid Undertake Those Activities: Standard Deviations forFemales 87
A.241. Attribute Profile of High School Seniors Planning to Under-take Certain Postsecondary Activities (1980): StandardDeviations for Males 88
A.2b. Attribute Profile of High School Seniors Planning to Under-take Certain Postsecondary Activities (1980): StandardDeviations for Females 89
Li
A.3a. Attribute Profile of High School Seniors Planning to EnterTwo-year Colleges or Vocational/Technical Schools (1980):Standard Deviations for Males 90
A.3b. Attribute Profile of High School Seniors Planning to EnterTwo-year Colleges or Vocational/Technical Schools (1980):Standard Deviations for Females 91
A.4. Mean AFQT Scores by Educational Attainment, Sex, and Branchesof Service, 1981 92
A.5. Percentages of Enlistments in Mental Categories I-IIIA byEducational Attainment, Sex, and Branch of Service 93
A.oa. Aspirations of High School Seniors Planning to UndertakeCertain Postsecondary Activities (1980): Standard
Deviations for Males 94
A.ob. Aspirations of High School Seniors Planning to UndertakeCertain Postsecondary Activities (1980): Standard
Deviations for Females 94
A.7a. Aspirations of High School Seniors Planning to EnterTwo-ye- Colleges or Vocational/Technical Schools (1980):Standard Deviations for Males 95
A.7b. Aspirations of High School Seniors Planning to EnterTwo-year Colleges or Vocational/Technical Schools (1980):Standard Deviations for Females
1
95
1 -
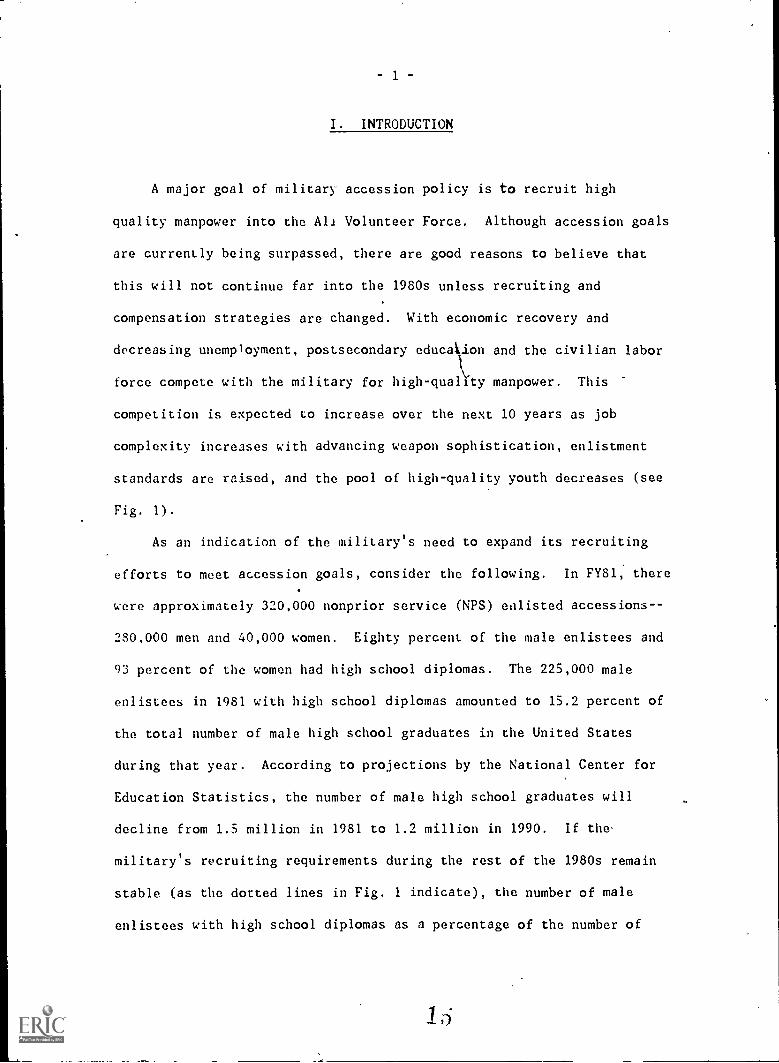
I. INTRODUCTION
A major goal of military accession policy is to recruit high
quality manpower into the Ali Volunteer Force. Although accession goals
are currently being surpassed, there are good reasons to believe that
this will not continue far into the 1980s unless recruiting and
compensation strategies are changed. With economic recovery and
decreasing unemployment, postsecondary educa ion and the civilian labor
force compete with the military for high-quality manpower. This
competition is expected to increase over the next 10 years as job
complexity increases with advancing weapon sophistication, enlistment
standards are raised, and the pool of high-quality youth decreases (see
Fig. 1).
As an indication of the military's need to expand its recruiting
efforts to meet accession goals, consider the following. In FY81: there
were approximately 320,000 nonprior service (NPS) enlisted accessions--
280,000 men and 40,000 women. Eighty percent of the male enlistees and
93 percent of the women had high school diplomas. The 225,000 male
enlistees in 1981 with high school diplomas amounted to 15.2 percent of
the total number of male high school graduates in the United States
during that year. According to projections by the National Center for
Education Statistics, the number of male high school graduates will
decline from 1.5 million in 1981 to 1.2 million in 1990. If the
military's recruiting requirements during the rest of the 1980s remain
stable (as the dotted lines in Fig. 1 indicate), the number of male
enlistees with high school diplomas as a percentage of the number of

2.0 M
1.0M
18 year olds
High school graduates
Total DoD acceuions
..... .0. .
.... .....................
Enlistees with high school diplomas
1975 1980 1985
Fig. 1 Male cohort sizes and accession needs (1973-1990)
1990
male high school graduates would rise from 15.2 percent in 1981 to
18.8 percent in 1990, implying that the military will have to increase
its "take" of the postsecondary male youth cohort by about one-fourth.
If, in addition, efforts to increase the percentage of high school
graduates among new recruits are to be realized, the military will have
to re,lruit approximately 20 percent of all male high school graduates in
the late 1980s.
t;

- 3
One way to increase high-quality accessions is to recruit from as
yeL untapped markets that contain large numbers of potential
high-quality recruits: One such market for accessions into either the
active or reserve force is postsecondary educational institutions such
as two-year colleges (e.g., junior and community colleges and vocational
training colleges) and noncollegiate institutions (adult education
centers, area vocational schools, private nonprofit occupational
institutes, and specialized proprietary schools).
A cursory analysis of this marketplace suggests considerable
potential. There are over 4 million students enrolled in two-year
colleges. About half fall within the prime recruiting ages (18 to 21
years) and virtually all of them have high school diplomas. Moreover,
most students in postsecondary institutions have strong vocational
interests and are preparing for specific occupations, many of which
overlap to some degree with military accession needs.
The purpose of this report is to examine this postsecondary market--
the institutions and their students--to ascertain whether (a) these
institutions might provide fruitful recruiting environments, (b) most of
the students in them meet enlistment standards, (c) the market can be
penetrated, (d) previous recruits have p-oven their value to the
military, and (e) additional research is needed to develop successful
recruiting policies.
To meet these goals; we examined the literature on higher education
and on military recruiting from this market. Only two studies of the
latter type were found. In addition, we examined Defense Manpower Data
Center (OMDC) accessions data for 1981, as well as data from three
4
large-scale surveys of youth: The National Longitudinal Survey of the
High School Class of 1972 (Levinsohn et al., 1978), High School and Beyond
(Peng et al., 1981), and the 1979 DoD Survey of Personnel Entering
.
1
Military Service (Doering et al., 1980). The next section of this Note
reviews the literature as it bears on the institutions and students, the
penetrability of the marketplace, the utility of recruits from it, and
the recruiting environment. Section III gives the results of our
analyses of existing data sets as they bear on accession policy issues.
The finai section presents our recommendations foe the next steps in
developing accession policies for this market.

e
5
II. ANALYSIS OF THE MARKETPLACE: LITERATURE REVIEW
In considering the possibility of recruiting in two-year colleges
and postsecondary vocational institutions, the first question is whether
there are sufficient numbers of potential enlistees to make a concerted
recruiting effort worthwhile. If the answer is affirmative, the next
question is whether these potential recruits would meet current and
projected accession requ.,rements and whether most of them have the
characteristics that would make them prime targets for recruiting: high
school graduates, above average in ability, between the ages of 18, and
21 years, single or married without dependents, and physically and
morally acceptable. An affirmative answer leads to a series of
questions: Is the market penetrable? Are recruits from this market
useful to the military? For example, do they fill critical occupational
specialties? Are they readily trainable? Are they productive? And
finally, can recruiting be conducted successfully within these
postsecondary institutions?
THE NATURE OF TARGET POSTSECONDARY INSTITUTIONS
This study focuses on postsecondary institutions that offer degrees
and certificates below the bachelor's degree. These institutions can be
classified as either collegiate or noncollegiate. The latter include
publicly supported institutions such as adult education centers and area
vocational schools, private nonprofit occupational institutes
(principally trade schools and hospitals), and specialized proprietary
institutions such as schools of cosmetology, business/office colleges,
and flight training. All such institutions emphasize occupational
training.

6
Data published by the National Center for Education Statistics
(NCES) provide a detailed picture of noncollegiate postsecondary school
enrollments and curricula (Kay, 1979). In 1979, NCES estimated that
approximately 1.5 million students were enrolled in 7,625 institutions
(not including correspondence schools). Of these, 812 schools were
publicly controlled, enrolling half a million students, and 6,813
schools were private, enrolling about a million students. The mean
enrollments in public and private noncollegiate institutions were 556
and 133 students, respectively. Within these postsecondary
noncollegiate institutions, the most popular programs of study as
indicatei by the number of offerings and enrollments were: cosmetology,
secretarial training, nursing (principally practical and nurse
assistant), commercial flight training, and auto mechanic training.
Within collegiate instPutions, we distinguish two- and four-year
institutioas and focus on the former. A two-year college is, by
definition, accredited to award an associate degree as its highest
degree. This definition encompasses a number of different institutions,
including junior colleges, community colleges, and a variety of
technical institutes. However, all share the following characteristics:
(a) degree program are of college-level difficulty and (b) the
institution is accredited or preaccredited at the college level by a
nationally recognized accrediting agency or by the fact that its course
credits are a:cepted by at least three other accrediced institutions
(Broyles and Davis, 1982).
Compared with noncollegiate institutions, two-year colleges enroll
a much larger number of students at a smaller number of locations (see

7
Table 1). The NCES estimates that in 1981 there were 1,275 two-year
colleges in the United States, with a total enrollment of about 4.5
million students (Broyles and Davis, 1982). Taken together, enrollment
data for postsecondary institutions indicate that the greatest market
density for potenLial recruits exists at two-year colleges. Average
enrollments in noncollegiate institutions were low compared with
collegiate institutions in those years for which complete data are
available (Table 1). Furthermore, only 8 percent of the noncollegiate
institutions had enrollments greater than 500 students as of 1978 (Kay,
1979, p. 33): Thus, the greatest density of potential recruits would
appear to be in two-year colleges.
Table 1
MARKET DENSITY IN NONCOLLEGIATE POSTSECONDARY ANDTWO-YEAR COLLEGIATE INSTITUTIONS, 1979
Type
Number of
Institutionsa Enrollments
Mean
Enrollment
Public college 926 4,069,462 4,395
bPr4vate college 272 180,565 663
Public noncollege 812 451,800 . 556
Private noncollege 6,813 1,043,400 153
.SOURCES: Broyles and Davis (1982); Kay (1979); Pepin and
Wells (1981).aIn 1981 there were 1,275 two-year colleges in contrast to
1,198 in 1979 reported here.
Data for 1978. 1979 data are unavailable.

- 8
SIZE AND CONTROL OF TWO-YEAR COLLEGES
The characteristics of two-year colleges vary greatly, partly
becausf the individual institutions known today collectively as "two-
year colleges" arose under extraordinarily different circumstances.
Some were established as adjuncts to public secondary schools (e.g., two
years of occupational training beyond the high school degree), some as
adjuncts to colleges and universities (e.g., freshman and sophomore
years of academic education), others as private alternatives to public
education, and still othen; as profit-making institutions. These
initial differences are now reflected in the size, administration, and
location of two-year colleges. Like their noncollegiate counte)parts,
there is an important distinction between public and private two-year
colleges. Of the 1,275 two-year colleges counted by NCES in the 50
states and the District of Colymbia in 1981, 940 (74 percent) were
publicly controlled, and 335 (26 percent) were private (Broyes and
Davis, 1982). In 1979, the most recent year for which enrollment,data
are available, 96 percent of the two-year college students were enrolled
in public institutions (Dearman and Plisko, 1981, p. 164; see Fig. 2).
Based on the number of two-year colleges counted that year by NCES, mean
enrollments were nearly 4,395 in public two-year institutions, compared
with approximately 650 in private two-year institutions (see Table 1).
There are, however, a small number of private two-year colleges
with large enrollments. Table 2 presents data on the distribution of
enrollments in public and private two-year colleges (Dearman and Plisko,
1981). These data indicate that most of the two-year college stt ents
are concentrated in public two-year colleges and in selected,priva
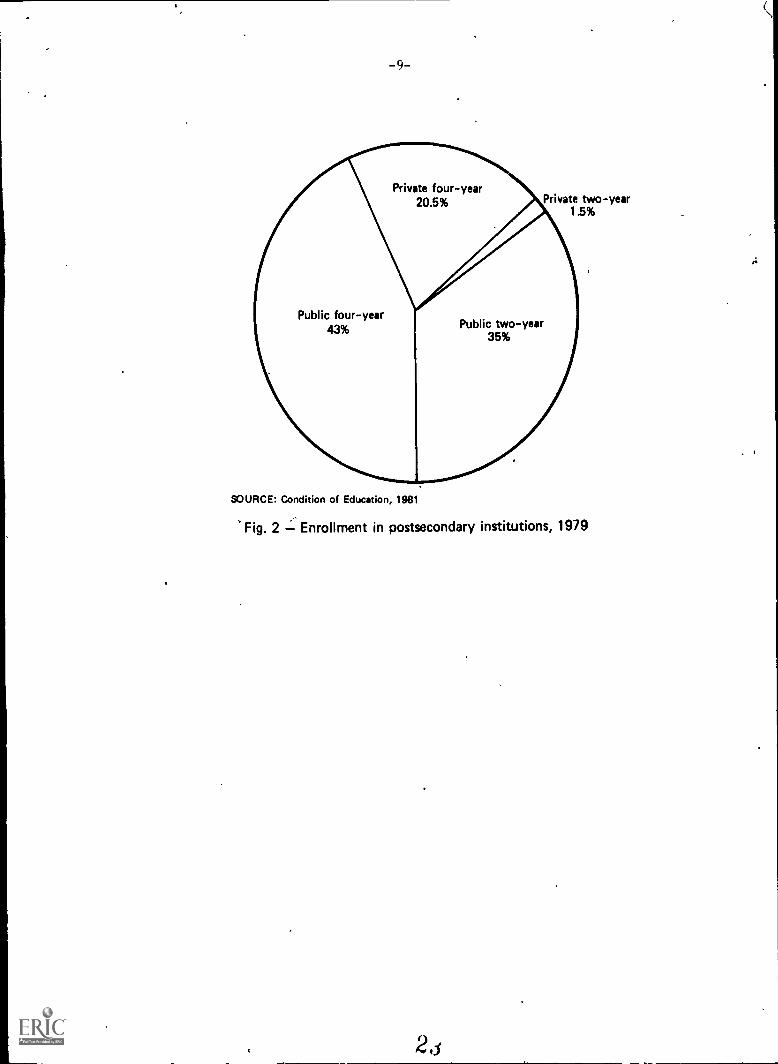
-9-
Private four-year20.5%
Public four-year43%
SOURCE: Condition of Education, 1981
Private two-year1.5%
Public two-year35%
Fig. 2 Enrollment in postsecondary institutions, 1979
2,i

- 10 -
Table 2
DISTRIBUTION OF ENROLLMENTS IN PRIVATE AND PUBLIC TWO-YEAR COLLEGES, 1979
EnrollmentNumber of
Public InstitutionsNumber of
Private Institutions Total
1- 499 36 157 193500- 999 115 78 193
1,000- 2,499 321 27 3482,500- 4,999 187 4 1915,000- 9,999 163 2 165
10,000-19,999 81 0 8120,000-19,999 22 0 22
Total 925 268 1,193
SOURCE: Dearm'an and Plisko (1981).
two-year colleges. Thus, recrulting efforts directed toward this market
could focus on a fairly small number of institutions.
LOCATION AND DISPERSION
Whether public or private, large or small, two-year colleges are
widely dispersed and are found in every state. They are also found in
several butlying territories of the United States-: 12 are in Puerto Rico
and one each in Guam, American Samoa, and the Pacific Island Trust
Territory. As shown in Fig. 3, the dispersion o two-year colleges
corresponds to the population densities in the United States. The
largest numbers of two-year colleges are found in 10 populous states:
California, New York, North Carolina, Pennsylvania, Texas, Illinois,
24

Large concentrations of two-yearcolleges (percent of total)
SOURCE; Education Directory, Collages and Universities (1981-1982)
Fig. 3 States with the largest concentrations of two-year colleges
Ohio, Michigan, Florida, and Washington (Table 3). Further, these
10 states account for half of the institutions and two-thirds of the
efirollments. Indeed, California accounts for over a tenth of the total
null-11)er of institutions in the United States and for over a quarter of
the enrollments. The prevalence of two-year colleges in the more
populous states is not entirely attributable to just population growth.
In California, Illinois, and Texas, ,two-year colleges were promoted by
educators, SOMC of whom argued that two-year postsecondary institutions
should provide lower division education for upper. division research
universities; hence the name "junior college" (cf. Breneman and Nelson,
1981). Today, there are 119 two-year colleges in California', 65 in
Texas, and 62 in Illinois. In other states, two-year institutions were
2:.

- 12 -
Table 3
STATES WITH LARGEST NUMBERS OF PUBLIC TWO-YEAR COLLEGES ANDENROLLMENTS, 1979
St'ate
NumLer of
Institutions Percent Enrollment Percent
California 105 11.4 1,069,082 26.4Texas .,.
4#_58 6.3 253,923 6.3
North Garolina 57 6.2 95,219 2.3Illinois 50 5.4 277,601 6.8Ohio 46 5.0 118,836 2.9New York 42 4.5 242,628 6.0Pennsylvania 38 4.1 98,842 2.4Michigan 30 3.2 199,099 4.9Florida 28 3.0 200,608 4.9Washington 27 2.9 194,115 4.8Other 481 52.0 1,306,857 32.2
Total 925 100.0 4,056,810 100.0
SOURCE: Dearman and Plisko (1981).
established to provide college-level postsecondary education for the
local population, especially in those states where four-year colleges
and universities were few in number or geographically inaccessible to a
large segment of the population. As a consequence, two-year colleges
today outnumber four-year colleges and universities in seven states:
Washington, Nevada, Arizona, Wyoming, New Mexico, Mississippi, and
Alaska.
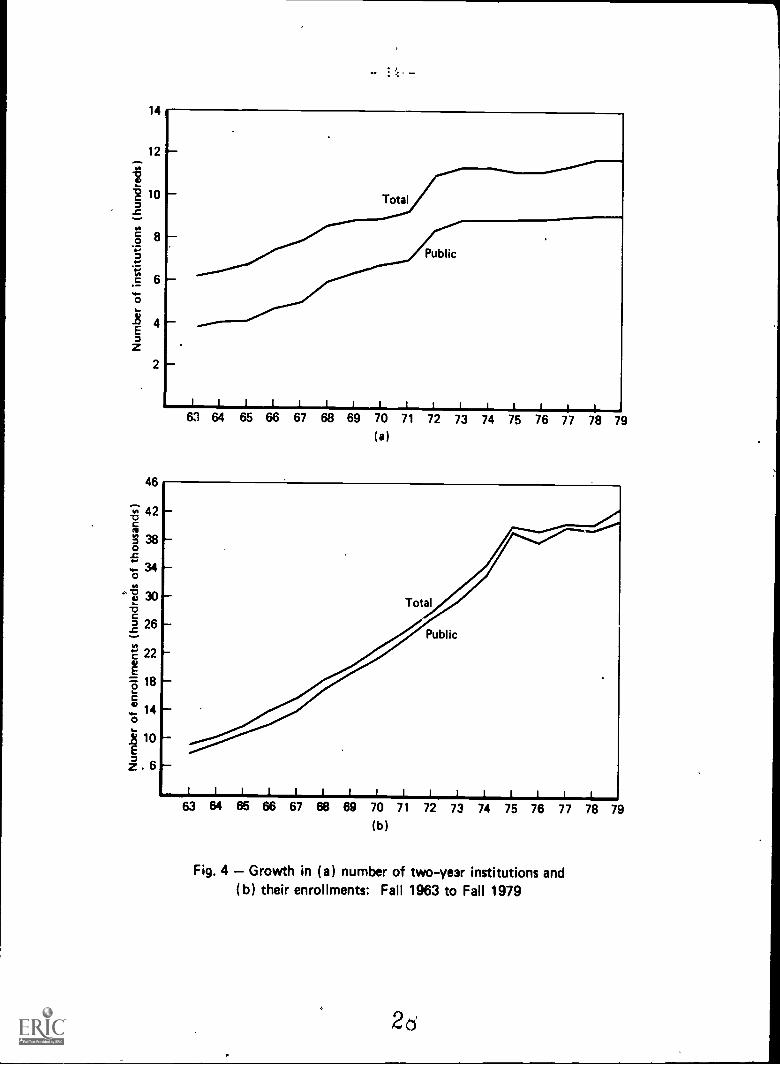
GROWTH IN NUMBER OF INSTITUTIONS AND ENROLLMENTS
Two-year collteges have grown dramatically over the last two
decades. The number of institutions approximately doubled and
enrollments nearly quintupled (Grant and Eiden, 1981). Public

- 13 -
two-year colleges experienced both the greatest growth in the number of
institutions (Fig. 4a) and in enrollment (Fig. 4b). Between 1963 and
1979, enrollments in public two-year colleges increased by 452 percent,
while enrollments in private two-year colleges increased 46 percent.
Meanwhile, the number of public institutions increased by 75 percent,
compared with a 35 percent decrease in private two-year colleges (see
Cohen and Brawer, 1982, Table 1).
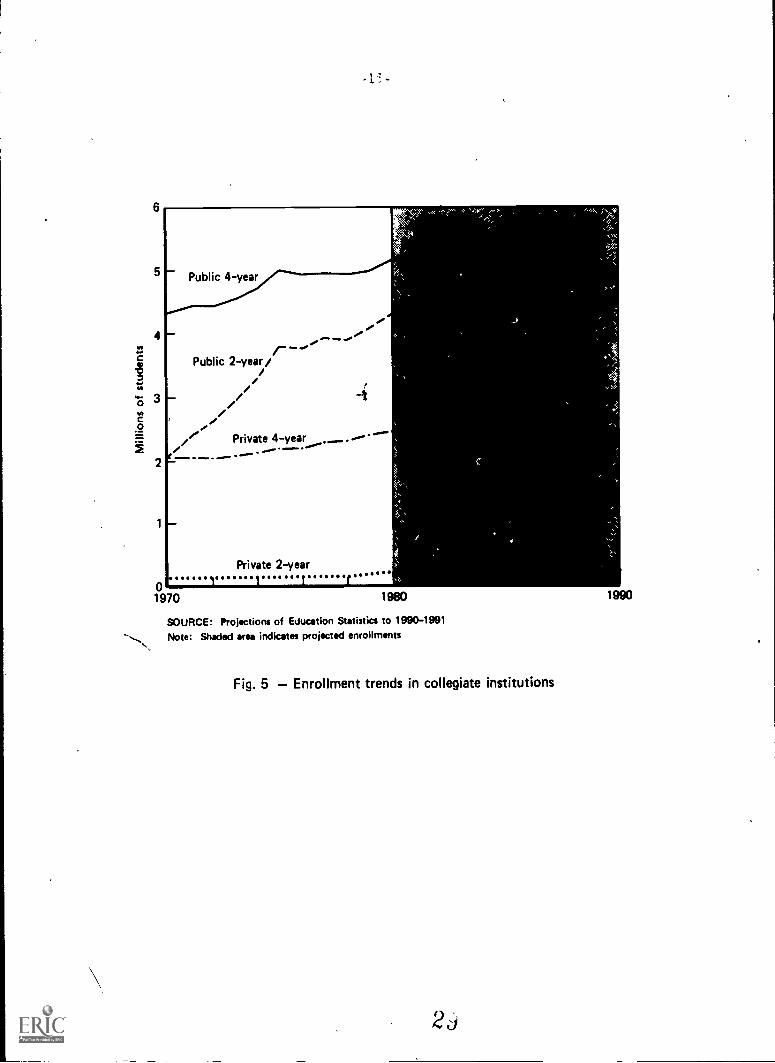
One,way to appreciate the extent of enrollment growth in two-year
colleges is by contrasting it with growth in four-year colleges and
universities. The increase in college-level enrollments during the
seventies was accounted for, in large part, by public two-year colleges
(Fig. 5). In 1970, enrollments in two-year colleges accounted for 26
percent of all enrollments in institutions of higher education. By
1979, this figure had increased to sliahtly more than 36 percent
(Dearman and Plisko, 1981, p. 164). There are a number of reasons for
this, including growth in occupational curricula and,part-time
enrollments.
The rapid growth of two-year colleges ended, however, in 1975,
according to NCES data and projections (Fig. 5). NCES predicts some
grot..th in the two-year colleges du-ing the 1980s, and they may account
for an increasing percentagd of to al college enrollments if escalating
educational costs at the four-year colleges should make the two-year
colleges more attractive to students from low-income families. Thus,
the two-year colleges are likely to continue to enroll a substantial
proportion of the nation's college population.
Finally, the number of part-time students in two-year colleges has
increased dramatically wier the past 10 years (Fig. 6). oday, roughly
65 percent of all students are enrolled part-time.
14
12
110
.57--
....vs
C--6
iigz
2
46
Public
!lilt IILIA 11111,463 64 65 66 67 68 69 70 71 72 73 74 75 76 77 78 79
(a)
1 3°21 26
4 22
gz . IIIIIIIII111111 _L63 64 65 66 67 68 69 70 71 72 73 74 75 76 77 78 79
(b)
Fig. 4 Growth in (a) number of two-ye3r institutions and(b) their enrollments: Fall 1963 to Fall 1979
5
-
6
4
3
2
1
01970
A
Public 4-year
Public 2-year/
Private 4-year-
Private 2-year
-c
1980
SOURCE: Projections of Education Statistics to 1990-1991Note: Shaded area indicates projected enrollments
Fig. 5 Enrollment trends in collegiate institutions
1990

- 16 -
MEND .11/MO rOMO 01 .10- 10.
Part-time
Full-time
1970 1975 1980
ssmm. am. owww
1985
Fig. 6 Two-year college enrollments
1990
CURRICULAR FUNCTIONS
Different missions and objectives in two-year colleges have led to
a broad spectrum of curricular functions. The original purpose of the
"junior college" was to provide academic instruction in preparation for
transfer to a four-year college or university. For those two-year
colleges known as "technical institutes," the primary orientation was
frequently vocational training in preparation for a career. The term
ncommunity college
nwas coined to encompass two-year colleges with
academic or vocational (or both) functions as well as to cover

- 17 -
additional, newer programs including continuing education, remedial
coursework, rAd community service. Community colleges with diverse
programs reflected an effort to expand the constituency of two-year
colleges to include part-time and older students and those who could not'
afford a traditional college education.
Academic preparation and occupational training are still the most
heavily emphasized curricular functions of two-year colleges, but the
emphasis on these curricula has shifted from acadeidic to vocational.
rhis shift is reflected in the number of associate.degrees awarded by
two-year colleges (Dearman and Plisko, 1981; Cohen and Brawer, 1982, and
shown in Fig. 7). Of all associate degrees awarded in the past deCade,
degrees in arts and sciences or general academic programs, which
typically represent transfer degrees, have declined by 20 percent while
degrees in occupational fields have increased by this amount. Mbst of
the vocational-degrees are awarded to students in health science (e.g.,
nursing, dental hygiene), data processing, and industrial arts programs.
Many two-year college students do not complete associate degrees in
either academic or vocational fields. For.example, the attrition from
two-year colleges over a two-year period (1972-1974) was 39.8 percent in
public institituons and 32.2 in private institutions; the attrition in
four-year schools was 28.5 per-.ent and 22.3 percent for public and
private institutions, respectively (Kolstad, 1977). Kolstad also
reported that attrition systematically decreased in both two- and four-
year institutions over the 22-year period from 1950 to 1972. Of the two-
year college students who withdrew in 1973, 46 percent said they planned
to reenter college within a year.

500
400
In
300
100
18
Occupational
Transfer
1971 1972 1973 .1974 1975 1976 1977 1978 1979 1980
SOURCE: Cohn and Brewer (1982)
Fig. 7 Numbers of associate degrees awarded, 1970-1980
Kolstad reported numerous reasons for attrition. Although many
people believe this attrition is due to the inability of two-year
college students to do college-level work, less than 16 percent of them
(<25 percent of the four-year college students) cited difficulty of
studies as a reason for leaving. Rather, the most frequently cited
reason was working full-time (49.5 percent in two-year colleges and 39.4
percent in four-year schools), and then working part-time jobs (26.1 and
17.2, respectively). Attrition is also related to socioeconomic status.
Kolstad reported that, in the two-year colleges, attrition was 46.6
percent in the lowest socioeconomic status quartile, 40.4 percent in the

19 -
)middle two quartiles combined, and 33 percent in the highest quartile.
The analogous figures for the four-year institutions were 33.1, 27.0,
and 17.9.
An extremely important activity conducted within two-year colleges,
one not typically considered a curricular function, is counseling and
career guidance. The importance of this service is related to the fact
that many students in two-year colleges fail to complete their programs
of study and/or do not transfer to four-year colleges or universities.
This has led some to say that two-year colleges serve a "cooling-out"
function in which unrealistic students' aspirations are brought in line
with reality (Clark, 1960, 1980). Some students may find themselves
shifting from an academic to an occupational orientation; others may
find themselves leaving the college for newly attractive employment
options.
FINANCIAL STABILITY
Public two-year colleges receive support from a variety of sources,
including local, state, and federal funds, tuition and private donations
(Breneman and Nelson, 1981; Cohen and Brawer, 1982). The relaxive
proportion of funds received from these sources has been changing.
Today, state aid is the main source of income, and the percentage of
income derived from state aid has been increasing in recent years. In
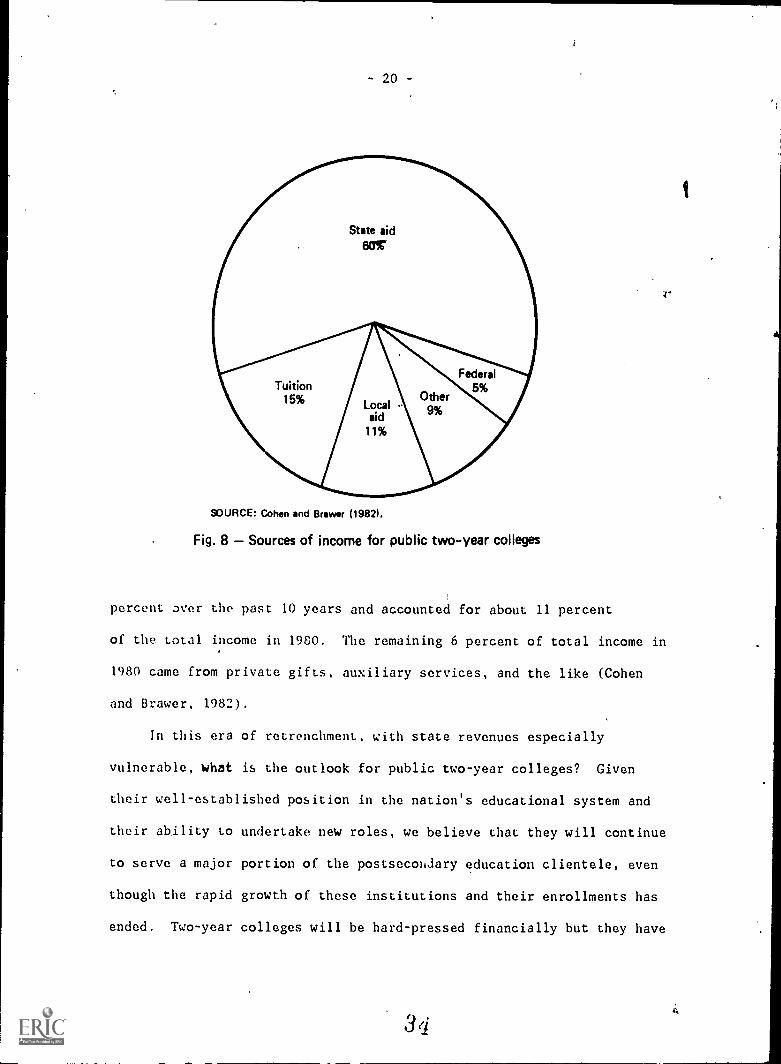
1980, state aid provided approximately 60 percent of the income for two-
year colleges (see Fig. 8). Tuition and fees have accounted for a
fairly constant source of income over the last 20 years; in 1980, theY
accounted for an estimated 15 percent of total income. Federal aid,
which has been a minor source of income for two-year colleges, accounted
for 5 percent of total income in 1980. .Local aid has decreased 75
33
Tuition15%
- 20-
State aid6016`
Local -aid
11%
SOURCE: Cohen and Brewer (1982).
Other9%
Federal5%
Fig. 8 Sources of income for public two-year colleges
percent over the past 10 years and accounted for about 11 percent
of the total income in 1980. The remaining 6 percent of total income in
1980 came from private gifts, auxiliary services, and the like (Cohen
and Brewer, 1982).
In this era of retrenchment, with state revenues especially
vulnerable, what is the outlook for public two-year colleges? Given
their well-established position in the nation's educational system and
their abjlity to undertake new roles, we believe that they will continue
to serve a major portion of the postsecondary education clientele, even
though the rapid growth of these institutions and their enrollments has
ended. Two-year colleges will be hard-pressed financially but they have

21
proved themselves to be extraordinarily adaptive in the past, and there
are a number of ways that they can adapt to threats to their primary
funding bases, possibly including developing new, mutually beneficial
relationOips with the military. For some scenarios of possible
developments, see Breneman and Nelson (1981).
CHARACTERISTICS OF STUDENTS IN TWO-YEAR COLLEGES
From their institutional characteristics and overall enrollments,
the tuo-year colleges appear to provide a very favorable environment for
recruiting. However, a closer look at the students themselves may
reveal obstacles Lo recruiLing. Many students might nol meet enlistment
standards, or they may be unwilling to consider the military as an
occupational alternative. In developing accession policies for the two-
year college market, the first question is how many, of the over 4
million enrollees, meet enlistment criteria. If there are adequate
numbers of potential recruits, the next step is to profile the
characteristics of the students. The question of whether these students
can be attracted into the military is discussed later in this section.
NUMBERS OF MALE STUDENTS BETWEEN 18 AND 21 YEARS
Unfortunately, estimates of the number of males (and females)
falling in the 18 to 21 age range vary from one data base to another.
NCES, using data on fall enrollments supplied by two-year colleges,
estimates that about 4.5 million students were enrolled in the fall of
1980. ,The Bureau of the Census, using a survey of students in October
1980, estimates this number to be about 3.1 million. The 4.5 million
figure is probably an overestimate since many students enrolled at the
beginning of the fall term do not complete the term. However, 3.1
.3

- 22 -
million is probably an underestimate because of the difficulty of
adequately counting students, particularly the transient, older, and
part-time students who constitute a sizable segment of the two-year
college population.
The DoD considers males falling between the ages of 18 and 21 years
as the prime population for nonprior service (NPS) accessions. In spite
of the caveat about the variability of estimates from one data base to
another, we bring the'best data available (U.S. Bureau of the Census,
1980) to bear on the question of whether there are sufficient numbers of
students iR the 18 and 21 age group to warrant a recruiting effort in
two-year colleges. The reader should keep in mind that the following
numbers are probably underestimates of the true values. Of the
estimated 3.1 million students enrolled in the falltf 1980,
approximately 1.3 million (42 percent) were males and, of these males,
approximately 721,000 (55 percent) fall within the targeted age range
(Fig. 9). Finally, 79 percent of the men in the targeted age range were
full-time students. Recruiting policies for the two-year colleges need
not, of course, be targeted to individuals within the 18 to 21 age
group. Older students fallingrwithin acceptable age ranges for the
various branches of the armed forces should also be considered for both
the active forces and for the reserves. Including a rough estimate of
the number of military eligible males of age 22 and above gives a figure
of about one milLion male students in two-year colleges in 1980 who fell
within the targeted age range for NPS accessions, somewhat less than 80
percent of whom were enrolled full time.
Students with prior military service should also be considered in
accession policy, perhaps as important sources of manpower for. the
36
7

- 23-
Over21
21 andunder
Men
754
570558
Women
Pert4inie
SOURCE: Bureau of the Census
602
Full-time
969
Fig. 9 Breakdown of two-year college enrollments in Fall 1980 (thousands)
reserves. Indeed, in FY81, 370,000 veterans attended two-year
colleges under the Post-Korean Educational Assistance Program, and
another 120,000 attended vocational and technical schools (Veterans
Administration, 1982). These numbers suggest that two-year colleges and
vocational schools might serve as locales for recruiting prior
servicemen.
PROFILE OF TWID-YEAR COLLEGE STUDENTS
The literature on the characteristics of students in two-year
colleges is, unfortunately, not sufficiently.detailed for our purposes.
What we would like to have, forexample, are recent data on male and
female students within targeted age ranges enrolled'for degrees in each
.37

- 24 -
of the academic and occupational curricula. These data would include
large numbers of s,tudens and their aptitime test scores, high school
grade-point averages, college grade point averages, aspirations,
socioeconomic status., and so on. At best, the available statistics
provide information on total enrollments by enrollment status (e.g.,
part-time/full-time, degree/nondegree students) and by demographic
characteristics (e.g., age, gender, and ethnic/racial groups). One
purpose of the analyses described in the next section is to fill some of
this intormation gap.
There are few relevant data available on the population of two-
year college students beyond the overall enrollments by sex and part-
time/full-time stltus.(1] The mean age of the two-year college students
is estimated at 28 .years and the modal age at 19,years. The age
distribution is positively skewed because community colleges, with their
broad curricula, serve older people who have enrolled in one or another
course out of personal interest, certification requirements, and so on.
Considerably more is known about the characteristics of first-
time freshmen in the two-year colleges (Astin et al., 1981; Kanouse et
al., 1980). Kanouse et al. (1980) provide data on two-year college
freshmen in the fall of 1972. Of particular importance are the aptitude
scores, since these are the only objective nationally representative
data 'available on two-year college students in the past 10 years. The
mean aptitude scores of male and female students fall between those of
four-year college freshmen and the mean scores of individuals in the
work force and other occupational tracks, including the military (see
Table 4). Similarly, the high school class rank of the two-year college
(1] We focus on nationally representative data because of the greatvariability in ,the representativeness and quality of data from state andcollege level reports.
36

-25-
Table 4
CHARACTERISTICS OF COLLEGE FRESHMEN AND INDIVIDUALSIN OTHER POSTSECONDARY TRACKS, FALL 1972
College Students Labor Force
Variable Four-year Two-year Voc/Tech Civilian Military
Males
Aptitude 224.5 204.8 194.2 186.1 189.8
Percentile rankin class
66.5 47.8 43.8 35.0 38.6
Father's occupa-tion (Duncanscale)
50.5 43.4 36.6 34.8 37.0
Number ofsiblings
2.4 2.6 2.8 3.1 3.4
Years of educa-tion expected
16.6 15.3 13.7 13.4 14.1
Career aspira-tions index
59.8 50.1 36.0 35.5 43.8
Females
Aptitude 223.7 204.9 195.0 191.6 196.8
-Percentile rank.in class
75.5 60.9 55.0 52.0 54.7
Father's occupa-tion (Duncanscale)
49.2 43.4 35.9 ,136.0 31.7
Number ofsiblings
2.5 2.7 2.8 3.1 3.8
Years of educa-tion expected
16.3 14.9 13.4 13.1 14.9
Career aspira- 63.6 55.5 45.5 42.4 45.8
tions index
SOURCE: Kanouse et kl. (1980)
3d

- 26 -
student falls between the ranks of four-year college freshmen and
students entering other postsecondary tracks. These data suggest that,
at least 10 years ago, increasing accessions from two-year colleges
might well increase the overall ability level of enlisted men. Note
also that, except for four-year college freshmen, two-year college
freshmen are on average higher in.sotioeconomic status (as indicated by
the Duncan index of father's occupation) and in both their careei and
educational aspirations.
Astin et al. (1981) reported that 98 percent of the male and female
freshmen in 1981 were high school graduates and another one and a half
percent had general educational development (GED) certificates (see
Table 5). Roughly half the males and two-thiids of the females reported
earning at least a B average. Moreover, 45 percent of the males and 53
percent of the females reported graduating in the top 40 percent.of
their high school classes.
In addition to criteria regarding high school graduation and
ability, the armed forces seek accessions who are single, are 18 to 21
years old, and meet physical qualifications. Virtually all of the
freshmen. in 1981 were single, over 90 percent fell within the targeted
age range, and over 90 percent reported no physical disability.
In sum, the data available on students, particularly for freshmen
in two-year colleges, suggest that there is a concentrated market of
potential recruits who appear to meet enlistment standards. However,
current data are quite limited in detail. For example, there are no
nationally representative measures of student ability (aptitude) and we
cannot provide infOrmation on student characteristics in various
4 U

- 27 -
Table 5
CHARACTERISTICS OF FRESHMENa IN TWO-YEAR COLLECES, 1981
Manpower Needs
Percent of' Two-Year
College StudentsMales Females
High schoolGraduates 98.0 97.9
GED 1.3 1.3
Above average ability> B average in high school 47.5 65.1
In top 40% of class 44.8 .52.6
Single 99.1 ' 98.3
Prime age (18-21 years) 94.8 92.8
No disability 93.5 93.7
SOURCE: Astin et al. s(1981).aFull-time freshmen with no prior college experience
academic programs (e.g., humanities, sciences) and occupational
programs (e.g., health, computer science). Moreover, the most.detailed
data, those on freshmen (Astin et al., 1981), are based on self-reports
rather than on objective records. AdditionAl analyses of current data
on student characteristics are needed to provide an accurate profile of
this recruiting market.
PENETRABILITY OF THE MARKET
In examining accession policies for the two-year college
marketplace, asCertaining that the .arket contains large numbers of
persons who meet accession needs is insufficient. Three further
questions must be answered: (1) Can the market be penetrated? (2) Are
41

- 28-
recruits from this market useful to the militaxy (trainable, able to
fill critical occupational specialties, and perform well)? And (3) SS
these institutions provide an environment conducive to recruiting? We
first consider penetrability and then discuss the other two topics in
the remainder of this secs-ion.
By penetrability we mean the market's potential for yielding higher
enlistment rates under alternative recruitment strategies. We assume
that most students consider their occupational choices rationally and
ask whether the military is among their alternatives. We also recognize
that occupational choice depends on positive (e.g., monetary) and
negative (e.g., unemployment in the civilian labor market) incentives
which are, themselves, uncertain events in the future. And finally, we
believe that, in choosing a particular occupation, the choice depends on
whether the occupation is consistent with students' attitudes and goals
and whether the occupation is sufficiently valued to override costs
associated with choosing it. To penetrate the two-year college market,
DoD can provide (a) information leading more students to consider
military service as a possible career path; (b) incentives (e.g., pay,
travel, occupational training) that make military service attractive to
some of these students; and (c) educational benefits to assist students
in meeting other career and educational goals.
Unfortunately, data on the penetrability of the two-year college
market are sparse. There are no sublished studies that report attempts
by the military to directly recruit from this marketplace (see Sec. III
for a recent, as yet unpublished study). And only two studies (Fisher
et al., 1975; Korman et al., 1973) have indirectly examined the
military's ability to penetrate the market by,asking students on
44

- 29 -
two-year college campuses whether they might join the military and which,
of a small set of alternative recruiting incentives, might induce them to
do so. Since the Fisher study is more recent and encompasses the
findings of the Korman study, we review it in some detail.
A Market Survey
The goals of the Fisher et al., 1975, study were to (a) estimate
the Navy's potential for enlisting male, iwo-year college students,-(b)
determine whether enlistment potential varied systematically with
demographic characteristics, and (c) determine students' preferences for
alternative incentives. The major part of the study was a 1975 survey
of 807 male students 25 years of age or younger. To select respondents
uho were representative of this population, a sample of 20 colleges was
drawn from all two-year colleges with probabilities proportional to
enrollment. At highly trafficked locations within each college, "every
nLh male student" was selected for screening (not more than 25 years of
ago, not obviously physically impaired, and willing to participate in
die study) and given an interview appointment. In this way,
approximately 40 students at each college were interviewed.
The survey included questions on (a) intention to enlist, (b)
potential effectiveness of various recruiting incentives, (c) media
exposure, (d) recruiter contact strategies, (d) verbal ability, and (e)
demographic characteristics. Table 6 provides data on verbal ability
and demographic characteristics of the sample.

-30 -
Table 6
CHARACTERISTICS OF A SAMPLE OF TWO-YEAR COLLEGEMALE STUDENTS, SPRING 1975
Variable Percentage of Sample
Age 18-21 years 84
Mental ability quartile:
First (highest) 40Second 34Third 18
Fourth 8
High school graduates 98
12-14 years of education 90
Single 84
Family income:
Below $10,000 18
$10,000 $19,999 39
$20,000 and above 26
Refused to respond 17
Employment Status:
Full-time 8
Part-time 50
Area resident 80
College program:
TransferOccupational
57
20
SOURCE: Fisher et al. (1975).

- 31
Intention to Enlist
When interpreting data on enlistment intentions, it is important to
understand the relation between plans and behavior. As a proxy,
consider the_relation between sample respondents' educational
aspirations and their behavior. When asked about their educational
aspirations, 14 percent of the sample reported that they planned to
JJcoffiplete the associate degree, whereas 75 percent reported that they
expected to attend a four-year college or university and/or graduate
school.
In spite of the fact that 75% of the sample aspires ta a four-year education (or more), only one-third have applied to afour-year college and only 26% have been accepted. . . . Even
fewer students (16%) have applied for financial aid although
. . . many . . . students reported that they could not afford afour-year college education (Fisher et al., 1975, p. 69).
These findings are consistent with others in the literature (Cohen and
Brewer, 1982) and with data reported by Astin et al. (1981) where
roughly 77 percent of the entering, two-year college freshmen class of
1981 said they intended to earn at least a bachelor's degree, 30 percent
said they expected to do so at two-year college (!) and only 14 percent
said that "chances are very good that they will transfer to another
college." In sum, two-year college students tend to be somewhat
unrealistic planners and this should be taken into account in
interpreting enlistment intentions.
When asked about their overall attitude toward the military, 26
percent were favorable, 43 percent were "half and half," and 29 percent
were unfavorable (2 percent had no opinion). Their immediate plans,
however, tended not to focus on military service: 68 percent intended
4 ;j

- 32 -
to continue their education, 33 percent planned to go to work, and 1
percent planned to enter the armed forces. Asked how likely they were
to enlist in the armed forces, 1 percent indicated that: they would
definitely enlist, 9 percent responded "probably," 34 percent responded
"probably not," 42 percent responded "definitely not," and 14 percent
"didn't know." Of the 80 students (10 percent) considering enlisting,
fewer than eight said they planned to enlist within the next six months,
approximately eight ;or 1 percent of the total sample) said they planned
to enlist six months to a year from the interview, and 64 percent (8
percent of the total sample) said they planned to enlist at some future
Lime.
Students were then asked, "If you were to join or enlist, which
branch of the Active Service would you be most likely to enter?"
Thirty-five percent responded Air Force, 24 percent Navy, 12 percent
Coast Guard, 11 percent Army, 8 percent Marine Corps, and 10 percent
"don't know." Of those 80 students planning to enlist, 30 percent said
they toould choose the Air Force, 28 percent the NaVy, and 23 percent the
Army. Among the most probable accessions, then, the distribution of
preferences was fairly flat. Each student was also asked to indicate
the likelihood that- he would join the Reserve or National Guard. Eleven
percent saidthey definitely Dx_proliably _would joImJi percent said__
they definitely or probably would not join, and 15 percent "didn't
know."
When asked whether they planned to enter the military services as
an officer or an enlisted man, 55 percent selected officer while 33
percent selected enlisted. Academic transfer students selected officer
at a greater rate (65 percent) than did students in occupational
4 0'
- 33 -
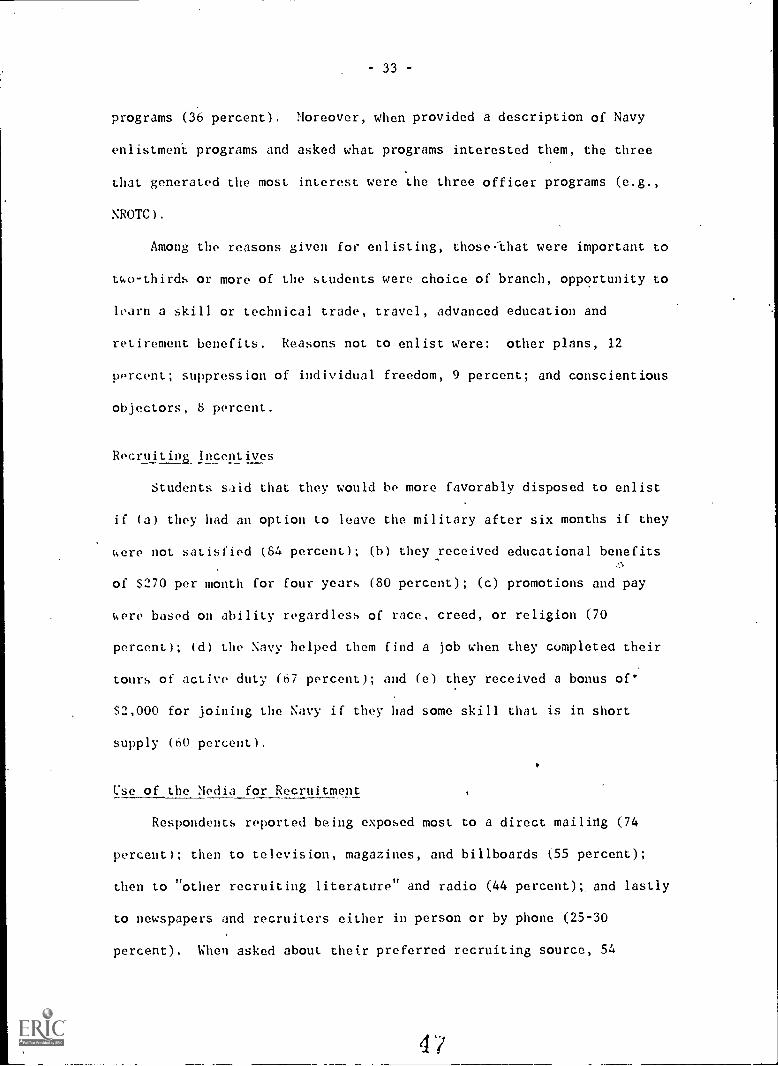
programs (36 percent). Moreover, when provided a description of Navy
enlistment programs and asked what programs interested them, the three
that generated the most interest were the three officer programs (e.g.,
NROTC).
Among the reasons given for enlisting, those.that were important to
tuo-thirds or more of the students were choice of branch, opportunity to
learn a skill or technical trade, travel, advanced education and
retirement benefits. Reasons not to enlist were: other plans, 12
percent; suppression of individual freedom, 9 percent; and conscientious
objectors, 8 percent.
Recruiting Incentives
Students said that they would be more favorably disposed to enlist
if (a) they had an option to leave the military after six months if they
uere not satisfied (84 percent); (b) they *received educational benefits
of $270 per month for four years (80 percent); (c) promotions and pay
uere based on ability regardless of race, creed, or religion (70
percent); (d) the Navy helped them find a job when they completed their
tours of active duty (67 percent); and (e) they received a bonus of'
$2,000 for joining the Navy if they had some skill that is in short
supply (60 percent).
Use of the Media for Recruitment
Respondents reported being exposed most to a direct mailing (74
percent); then to television, magazines, and billboards (55 percent);
then to "other recruiting literature" and radio (44 percent);, and lastly
to newspapers and recruiters either in person or by phone (25-30
percent). When asked about their preferred recruiting source, 54
4 /

- 34 -
percent preferred to talk to a Navy recruiter and 25 percent preferred
to read Navy literature. Forty-one percent of the students preferred
talking to the recruiter in the recruiting office, 21 percent preferred
talking at school, 16 percent had no preference, and 14 percent
preferred talking at. home. Thirty-five percent preferred talking to an
enlisted man, 31 percent to an officer, and-25 percent had no
preference.
In summary, the Fisher et al. study indicates that while, on
average, two-year students in the sample probably meet accession
standards, few consider the military as an occupation after completing
school. Nevertheless, if asked directly whether they planned to enlist,
about 10 percent said "possibly" but at some later date. The most
important enlistment incentives for this sample were an eaily
opportunity to leave the service and a financial bonus. With respect to
recruiting strategies, most had be,en exposed to direct mailings and
preferred meeting recruiters in recruiting offices.
In evaluating thcse results, a number of factors should be kept in
mind. The study vas conducted seven years ago in an environment
considerably different from that of today. The data reported in this
study refer to enlistment intentions, not actual enlistment behavior.
Indeed, fec, students in two-year colleges in 1975 actually enlisted in
1976. Moreover, data presented by Fisher et al. attest to the fact that
these-students are unrealistic planners. Finally, the subjects
participating in this study were volunteers. We do not know how many
refused to participate in the study, what their responses would have
been, and how those responses might have changed the findings.
Nevertheless, the data provide some information for developing
4d

- 35 -
incentives and recruiting methods that might be used to penetrate this
market.
In the absence of definitive studies directly testing the
military's ability to penetrate the two-year college market, and with
the paucity of studies such as Fisher et al., we look for other
indicators of penetrability. We consider the key indicators to be (a)
the past enlistment behavior of two-year college students and (b)
evidence of flux in the plans and behavior of these students. The
latter would presumably indicate how committed the students were to the
educational and occupational plans that led them not to enlist in the
military right after high school.
The data on past enlistment behavior are not encouraging. First,
students in two-year colleges have already opted for education rather
than the military after high school graduation. Second, only 6 percent
of the 1981 NPS accessions had a year or more of college (see Sec. III).
Third, out of about 11,000 students between the ages of 17 and 22 in the
National Longitudinal Study of Labor Force Behavior (Borus, 1982), 196
males and 257 females were enrolled in two-year colleges in 1979, and
282 males and 397 females were enrolled in 1980. Those in two-year
colleges were asked, "Do you think, in the future, that you will
definitely try to enlist, probably try to enlist, probably not try to
enlist, or definitely not try to enlist in the military?" Only three
males and one female said that they would definitely enlist, and 19
males and 30 females said they would probably try to enlist. For
additional data, see Table 7. Finally, only 0.6 percent of the two-
year college freshman class of 1981 reported that they planned on a
militdry career (Astin et al., 1981).
4

- 36 -
Table 7
TWO-YEAR COLLEGE STUDENTS' RESPONSES TO A QUESTIONON ENLISTMENT PROPENSITY
Do you think, in
the future,Ithatyou will'
Enrolled in Two-Year Colleges
Number (%) Number COof Males of,Females1979 1980 1979 1980
Definitely tryLO enlist 3(2) 3(2) 1(0) 1(0)
Probably try toenlist 13(7) 19(7) 19(7) 30(8)
Probably not tryto enlist 61(31) 78(28) 90(33) 116(29)
Definitely nottry to enl:st 86(44) 120(43) 129(50) 210(53)
SOURCE: Borus (1982).
.1
Other alternatives included physical or mental require-ments not met, presently enlisted, and so on. These additionalalternatives aCcount ior all two-year college respondents.
Before overinterpreting these findings to mean that the two-year
college market is impenetrable, several important factors should be
considered. First, the military has not made a concerted effort to
recruit from this market. In contrast, high schools have been the
target for enlistees, and four-year colleges and universities have been
the target for commissioned officers. Second, recruiters are unlikely
to tap the two-year college market because it is a new, unknown
territory for them. Third, as male youth (18 to 21 years of age) sort
themselves into alternative occupational tracks, the largest numbers
enter the labor maiket and the fewest enter two-year colleges (Fig. 10).
UU

8.7 M
> Total4.6 M I
Four-year Two-year---v J
Full-timestudents
Employed Militarysemice
Fig. 10 Main activities, men of age 18 to 21 (Fall 1980)
Other
There are, however, some indicators that lead us to search for
evidence of penetrability, especially when plans and occupational-choice
- 38 -
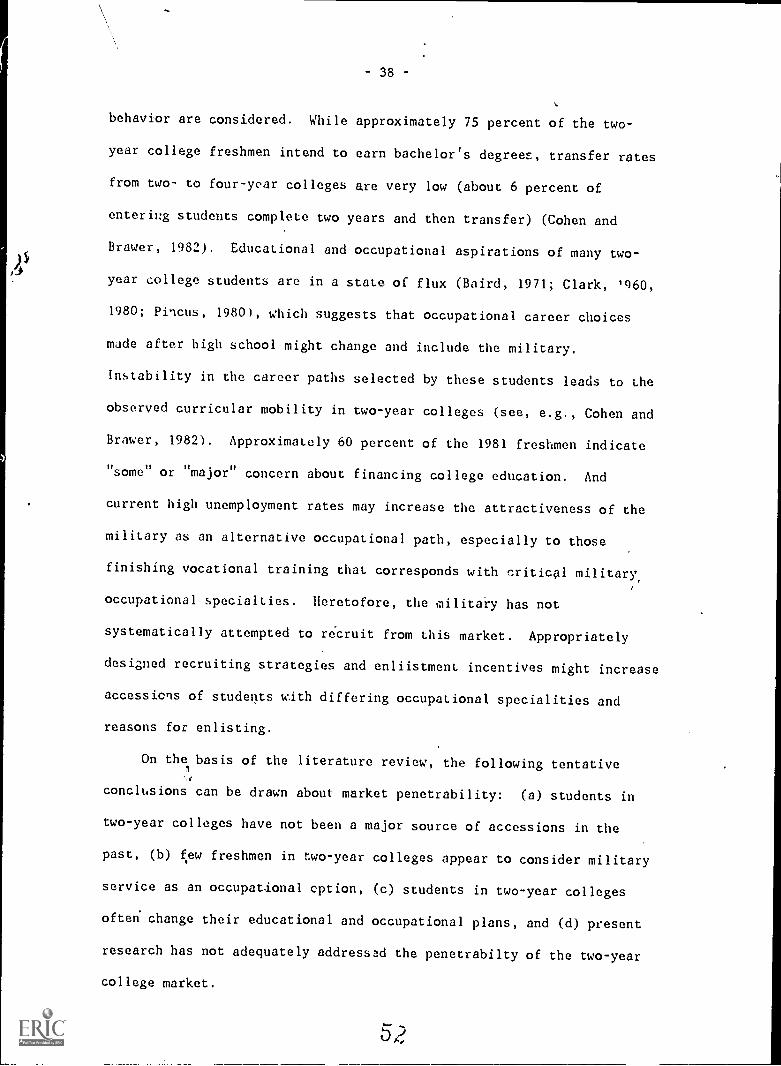
behavior are considered. While approximately 75 percent of the two-
year college freshmen intend to earn bachelor's degrees, transfer rates
from two- to four-year colleges are very low (about 6 percent of
entering students complete two years and then transfer) (Cohen and
Brawer, 1982). Educational and occupational aspirations of many two-
year college students are in a state of flux (Baird, 1971; Clark, 1960,
1980; Pincus, 1980), which suggests that occupational career choices
made after high school might change and include the military.
Instability in the career paths selected by these students leads to the
observed curricular mobility in two-year colleges (see, e.g., Cohen and
Brayer, 1982). Approximately 60 percent of the 1981 freshmen indicate
VI
some11
or major concern about financing college education. And
current high unemployment rates may increase the attractiveness of the
military as an alternative occupational path, especially to those
finishing vocational training that corresponds with critical military,
occupational specialties. Heretofore, the military has not
systematically attempted to recruit from this market. Appropriately
designed recruiting strategies and enliistment incentives might increase
accessions of students with differing occupational specialities and
reasons for enlisting.
On the basis of the literature review, the following tentativeA
conclusions can be drawn about market penetrability: (a) students in
two-year colleges have not been a major source of accessions in the
past, (b) fiew freshmen in two-year colleges appear to consider military
service as an occupational option, (c) students in two-year colleges
often change their educational and occupational plans, and (d) present
research has not adequately addressad the penetrabilty of the two-year
college market.

- 39 -
UTILITY OF ENLISTEES FROM TWO-YEAR COLLEGES
Utility refers to the service performance of recruits from two-
year colleges. Some common measures of utility are (a) trainability
(ability to complete occupational training satisfactorily and on
schedule), (b) willingness and capacity to serve in critical
occupational specialties, (c) productivity, (d) leadership, and (e)
freedom from disciplinary actions.
Typically, recruiting policy focuses cn whether a particuiar market
meets major recruiting goals, especially that of recruiting sufficient
numbers of high-school graduates of above average ability. This goal is
based on the premise that, on average, high-quality enlistees perform
better in the military than individuals with lesser qualifications.
While this premise seems plausible and a high proportion of the students
in two-year colleges would qualify as high-quality recruits, those who
actually enlist constitute only a small minority (and may be atypical)
of the two-year college population. Thus, questions about the potential
utility of recruits from the two-year colleges require investigation.
Unfortunately, no research has been reported on the utility of two-
year college recruits. In Sec. III, we bring some recent data from
DMDC's 1981 accessions file to bear on the question of utility of two-
year college recruits.
RECRUITING ENVIRONMENT IN TWO-YEAR COLLEGES
Counseling and guidance is a major function of over 90 percent of
the two-year colleges (Cohen and Brawer, 1982). The growth of this
function is based on

-40 -
the contention...that community college students are differentfrom the traditional college groups, the affective is asimportant as the cognitive, students need help in moving intothe college and out again into jobs and other schools, andindividualized instruction through counseling and othernonclassroom-based activities is essential (Cohen and Brawer,1982, p. 171).
Thus, an institutional mechanism currently exists through which
recruiting might be conducted.
A Second characteristic of two-year colleges leads us to believe
that these institutions would provide LA environment conducive to
recruiting: they are quite responsive to changes in the economic
environment. In d963, for example, the Vocational Education Act
broadened the criteria for federal aid to sc.hools, and Congress
appropriated $43 million in 1968, $707 million in 1972, and $981 million
in 1974. "On this surge of monies occupational education swept into the
Etwo-year] colleges in a fashion dreamed of and pleaded for but never
before realized by its advocates" (Cohen and Brawer, 1982, p. 192). The
impact of this funding is reflected in the increasing share of associate
degrees awarded to graduates from occupational tracks in these colleges
(see Fig. 7).
In the current economic environment--one of recession, decreasing
federal involvement in education, and fiscal retrenchment in states'
educational funding (McDonnell and McLaughlin, 1982)--we would expect to
see two-year colleges seeking alternative fuhding sources such as the
military.
Two-year colleges are also attractive recruiting environments
because they form a concentrated market; 50 percent of the,institutions
and 65 percent of the enrollments are concentrated in 10 states. Most
of the students satisfy the military's enlistment standards.

- 41 -
There are, however, several factors that indicate recruiting
problems. One is the fact that 60 percent of the students attend two-
year colleges only part-time. Furthermore, even full-time students are
not on campus all of the time, so that recruiters may have difficulty
locating students on campuses. However, if recruitment is coordinated
with the counseling and guidance office on the campus, this problem
might be overcome.
A second potential problem is that, to most recruiters, the
population of two-year college students is unfamiliar. Recruiters who
have not attended college may be reluctant to recrult in this "unknown"
market. Coordination of recruiting with the institution should
alleviate this problem. Further, providing recruiters with specific
information on these students or permitting recruiters to collect this
information from students should prove helpful. Finally, using
educational specialists--past teachers, principals, and counselors--
as intermediaries to establish a link between the schools and the
recruiters may further alleviate the entry problem.
In sum, the facts that two-year colleges are adaptive to the
economic environment and stress career counseling and guidance lead us
to believe that these institutions will be receptive to recruiting on
their campuses as long as recruiting serves their goals as well as the
military's. By this caveat we mean that two-year colleges are likely to
support recruiting as long as the military does not compete with them .
for students.

- 42 -
III. ANALYSIS OF THE MARKET PLACE: NEW DATA
The literature suggests that the two-year colleges might provide
fruitful locales for recruitment in that approximately a million male
students meet enlistment requirements, this market has not been
penetrated in the past, and the educational and occupational plans and
behavior of many students are in a state of flux. But the literature
lacks ixlequate data on important characteristics of these students such
as objective indicators of their aptitude (e.g., cognitive test scores),
the penetrability of the market, and the utility of two-year college
recruits to the military.
To bring additional data to bear on issues of quality,
penetrability, and utility, analyses of two very recent data sets--
High School and Beyond and the DMDC accessions file for FY81--were
undertaken. Unfortunately, neither data set is ideally suited to the
two-year college market. The DMDC file does not provide information
specifically on enlistees from two-year colleges. Rather, it provides
information on enlistees with one or more years of college. The
enlistees with one or two years of coJlege certainly include large
numbers of two-year college students, and we shall assume that the
characteristics of this group will serve as approximations for the
characteristics of the two-year college students who join the military.
High School and Beyond (HS&B) is limited in a different way. It
provides data on 1980 high school seniors,(1) including their post-
secondary plans, but as yet follow-up data are not available to
PI It also provides data on sophomores.

-43 -
ascertain which students actually attended two-year colleges.
Nevertheless, we provide an empirical justification for using data on
high school seniors planning to enter two-year Colleges as proxies for
data on students in two-year colleges. By doing so, we avail ourselves
of a very rich data set, one well suited to providing a detailed profile
of prime-age students in the two-year college marketplace.
PROFILE OF STUDENTS IN TWO-YEAR COLLEGES: METHODOLOGICAL CONSIDERATIONS
To provide a current, detailed profi.le of the entering two-year
college student, we have to justify using seniors who plan to enter
these institutions in the spring of 1980 as proxies for those who
actually entered in the fall of 1980. In short," we need to demonstrate
that those high school students who plan to attend two-year colleges
"look like" those who actually do attend. To this end, we used the
National Longitudinal Survey of the High School Class of 1972
(NLS72)--the data set most closely comparable to HS&B in terms of the
student population (high school seniors), the attributes measured, and
the c%ording of questions. (In fact, HS&B was designed to overlap
closely with NLS72.) We compared the characteristics of high school
seniors in the spring of 1972 who planned to go to two-year colleges
(the "planners") with the "doers," those who actually were enrolled in
two-year colleges in the fall of 1972.
The means of the planners (xP
) and doers (xD) on demographic,
academic, socioeconomic and attitude/aspiration variables are given in
Tables 8a and 8b. These data are for male and female seniors planning
to enter one of three postsecondary education tracks (four- or two-
year colleges or vocational/technical schools), military service, or the
civilian work force. We show data not only on two-year college planners
5 /
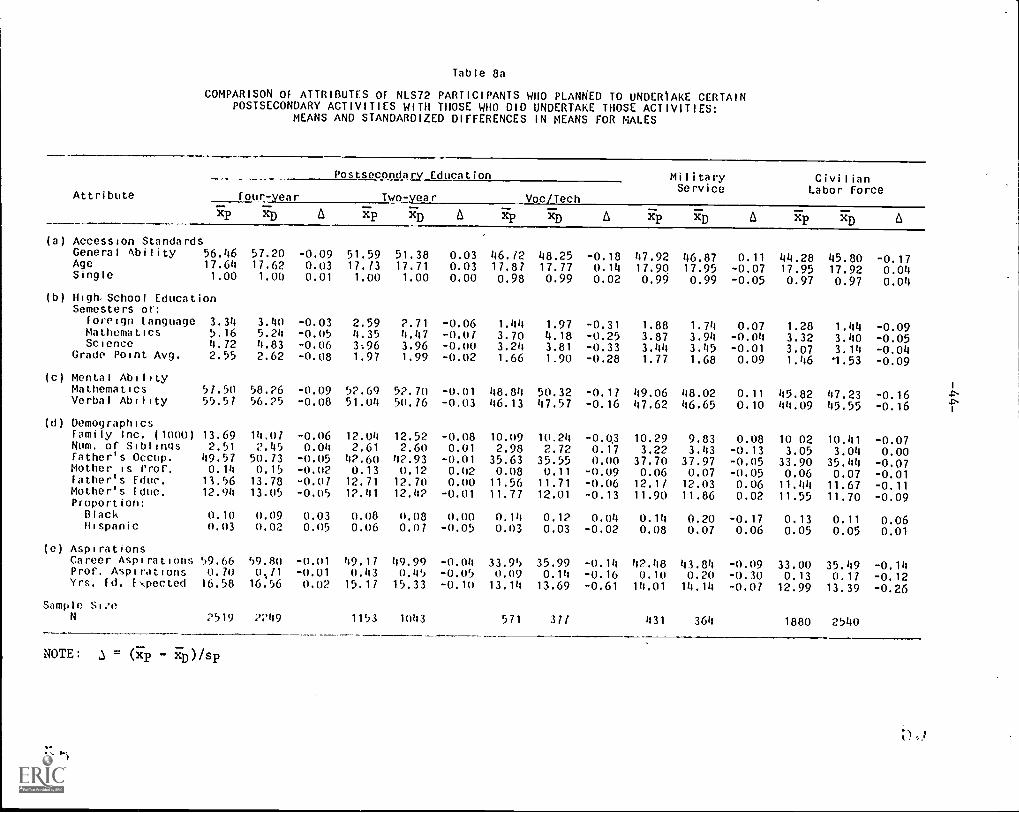
Table 8a
COMPARISON Of ATTRIBUTES OF NL572 PARTICIPANTS WHO PLANt4ED TO UNDER1AkE CERTAINPOSTSECONDARY ACTIVITIES WITH THOSE WHO DID UNDERTAKE THOSE ACTIVITIES:
MEANS AND STANDARDIZED DIFFERENCES IN MEANS FOR MALES
Attribute
Postsecondary Education MilitaryService
CivilianLabor Force
Four-year Two-year Voc/Tech74)
x11) A Rp Rb A RP xi) A ip XD A wip XD A
(a) Accession StandardsGeneral Ability 56.46 57.20 -0.09 51.59 51.38 0.03 46./2 48.25 -0.18 47.92 46.87 0.11 44.28 45.80 -0.17Age 17.64 17.62 0.03 17.73 17.71 0.03 17.87 17.77 0.14 17.90 17.95 -0.07 17.95 17.92 0.04Single 1.00 1.00 0.01 1.00 1.00 0.00 0.98 0.99 0.02 0.99 0.99 -0.05 0.97 0.97 0.04
(b) High,School EducationSemesters of:
foreign Language 3.34 3.40 -0.03 2.59 2.71 -0.06 1.44 1.97 -0.31 1.88 1.74 0.07 1.28 1.44 -0.09Mathematics 5.16 5.24 -0.05 4.35 4.47 -0.07 3.70 4.18 -0.25 3.87 3.94 -0.04 3.32 3.40 -0.05Science 4.72 4.83 -0.06 396 3.96 -0.00 3.24 3.81 -0.33 3.44 3.45 -0.01 3.07 3.14 -0.04Grade Point Avg.
(c) Mental Ability
2.55 2.62 -0.08 1.97 1.99 -0.02 1.66 1.90 -0.28 1.77 1.68 0.09 1.46 1.53 -0.09
Mathematics 51.50 58.26 -0.09 52.69 52.70 -0.01 48.84 50.32 -0.17 49.06 48.02 0.11 45.82 47.23 -0.16Verbal Ability
(d) Demographics
55.57 56.25 -0.08 51.04 50.76 -0.03 46.13 47.57 -0.16 47.62 46.65 0.10 44.09 45.55 -0.16
Family Inc. (1000) 13.69 14.07 -0.06 12.04 12.52 -0.08 10.09 10.24 -0.0.3 10.29 9.83 0.08 10 02 10.41 -0.07Num. of Siblings 2.51 2.45 0.04 2.61 2.60 0.01 2.98 2.72 0.17 3.22 3.43 -0.13 3.05 3.04 0.00Father's Occur). 49.57 50.73 -0.05 42.60 42.93 -0.01 35.63 35.55 0.00 37.70 37.97 -0.05 33.90 35.44 -0.07Mother is Prof. 0.14 0.15 -0.02 0.13 0.12 0.02 0.08 0.11 -0.09 0.06 0.07 -0.05 0.06 0.07 -0.01father's Educ. 13.56 13.78 -0.07 12.71 12.70 0.00 11.56 11.71 -0.06 12.17 12.03 0.06 11.44 11.67 -0.11Mother's [due. 12.94 13.05 -0.05 12.41 12.42 -0.01 11.77 12.01 -0.13 11.90 11.86 0.02 11.55 11.70 -0.09Proportion:
Black 0.10 0.09 0.03 0.08 0.08 0.00 0.14 0.12 0.04 0.14 0.20 -0.17 0.13 0.11 0.06Hispanic
(e) Aspirations
0.03 0.02 0.05 0.06 0.07 -0.05 0.03 0.03 -0.02 0.08 0.07 0.06 0.05 0.05 0.01
Career Aspirations 59.66 59.80 -0.01 49.17 4999 -0.04 33.95 35.99 -0.14 42.48 43.84 -0.09 33.00 35.49 -0.14Prof. Aspirations 0.70 0,/1 -0.01 0.43 0.45 -0.05 0.09 0.14 -0.16 0.10 0.20 -0.30 0.13 0.17 -0.12Yrs. Ed. Expected 16.58 16.56 0.02 15.11 15.33 -0.10 13.14 13.69 -0.61 14.01 14.14 -0.07 12.99 13.39 -0.26
Sample St:e2519 2249 1153 1043 571 371 431 364 1880 2540
NOTE: A = - RO/sp

Table 8b
COMPARISON OF ATiRIBUTES OF NLS72 PARTICIPANTS WHO PLANNED TO UNDERTAKE CERTAINPOSTSECONDARY ACTIVITIES WITH THOSE WHO DID UNDERTAKE THOSE ACTIVITIES:
MEANS AND STANDARDIZED DIFFERENCES IN MEANS FOR FEMALES
Attribute
Postsecondamy Education militaryService
CivilianLabor Force
Four-year Two-year Voc/Tech
FeD A51b
A xP rep Fp3rD
ATeD A
(a) Accession StandardGeneral Ability 56.37 56.99 -0.07 51.63 51.39 0.01 M7.57 48.48 -0.11 47.07 48.97 -0.19 45.93 47.42 -0.17Age 17.56 17.56 0.00 17.59 17.58 0.02 17.68 17.63 0.08 17.94 17.71 0.26 17.73 17.72 0.03Single 0.99 0.99 0.00 0.99 1.00 0.06 0.98 0.97 0.06 0.98 1.00 0.13 0.95 0.95 -0.00
(b) High School EducationSemesters of:Foreign Language 3.84 3.90 -0.03 2.92 3.01 -0.04 2.17 2.55 -0.19 1.98 2.89 -0.49 1.84 2.00 -0.09Mathematics 4.43 4.51 -0.04 3.62 3.74 -0.07 3.10 3.34 -0.15 3.15 4.33 -0.66 2.84 2.87 -0.01Science 4.04 4.09 -0.03 3.42 3.45 -0.02 2.99 3.25 -0.17 2.97 3.83 -0.54 2.64 2.72 -0.05
Grade Point Avg.
(c) Mental Ability
2.89 2.96 -0.07 2.40 2.39 0.01 2.14 2.19 -0.05 2.27 2.54 -0.32 1.99 2.11 -0.12
Mathematics 54.99 55.60 -0.07 50.26 50.07 0.02 46.17 47.26 -0.13 45.46 48.71 -0.34 44.63 45.94 -0.09Verbal Ability 56.45 57.02 -0.07 52.04 51.80 0.03 48.30 49.07 -0.09 47.91 49.14 -0.13 46.74 48.19 -0.16 1
x,
(d) Demographics Lni
Family Inc. (1000) 12.96 13.33 -0.05 11.38 11.36 0.00 9.19 9.37 -0.03 8.34 8.09 0.04 9.08 9.62 -0.10Num. of Siblings 2.56 22.50 0.04 2.68 2.69 -0.01 2.90 2.82 0.05 3.69 3.73 -0.03 3.18 3.10 0.05Father's Occup. 48.14 48.89 -0.03 43.20 43.90 -0.03 35.83 36.65 -0.04 32.68 32.62 0.00 34.27 36.45 -0.11Mother is Prof. 0.17 0.18 -0.03 0.10 0.12 -0.05 0.07 0.08 -0.07 0.08 0.10 -0.05 0.06 0.06 0.01Father's Educ. 13.55 13.71 -0.05 12.65 12.66 -0.00 11.68 11.76 -0.03 11.18 10.85 0.15 11.44 11.63 -0.09Mother's Educ. 12.97 13.12 -0.07 12.36 12.32 0.03 11.1/ 11.96 -0.11 11.82 11.31 0.29 11.43 11.55 -0.07Proportion:
Black 0.14 0.13 0.04 0.09 0.11 -0.08 0.19 0.16 0.06 0.19 0.21 -0.05 0.15 0.11 0.11Hispanic
(e) Aspirations
0.03 0.03 0.03 0.05 0.05 0.00 0.05 0.04 0.06 0.00 0.07 c° 0.04 0.04 -0.00
Career Aspirations 63.46 63.60 -0.01 54.84 55.52 -0.04 42.32 45.59 -0.20 47.24 45.80 0.13 39.41 42.33 -0.22Prof. Aspirations 0.81 0.82 -0.01 0.57 0.58 -0.04 0.23 0.33 -0.22 0.11 0.10 0.04 0.15 0.22 -0.22Yrs. Ed. Expected 16.31 16.28 0.03 14.73 14.87 -0.10 13.19 13.45 -0.27 13.72 14.86 -0.61 12.66 13.08 -0.27
Sample Size2464 2208 1153 943 817 672 62 14 2083 2133
NOTE: A = (iEp - ib)/sp

- 46 -
but also on students planning to enter other tracks because some
analyses will compare students planning to enter ,wo-year colleges in
1980 with students planning to enter other tracks in order to evaluate
their "quality." The delta statistic, denoted by A, is a measure in
standard deviation units of the magnitude of the mean difference between
planners and doers. It provides a summary of the degree to which
planners look like doers. Specifically, delta is the difference between
the moans of the planners and doers divided by the standard deviation of
the planners.(2) The standard deviations of the measures may be found
in Table A.la and Al.b.
Among the two-year college students, the planners look very much
like the doers. The deltas range from -0.10 to +0.03 for men and from
-0.10 to +0.07 for women. The deltas for the four-year college planners
and doors are also uniformly small, all less than 0.10 in absolute
value. In'contrast, there are some sizable differences in means between
the planners and doers n the vocational/technical track, where the
deltas in absolute value run as high as 0.61 for males and 0.27 for
females. Using means of male planners to estimate the actual means for
students in vocational/technical schools leads to underestimate of
the mean numb r of semesters of foreign language,-mathematics, and
science, and (an underestimate of their mean educational aspirations.[3]
12) A delt, of 0.20 is considered a small effect, 0.50 isconsidered a medium effect, and 0.80 is considered a large effect.
[3) If one wishes, the HS&B data can be adjusted for under- oroverestimation using the mean 'difference between planners and doers.For example, the mean difference between the educational expectations ofmale planners and doers was 13.14 - 13.69 = -0.55. This value, -0.55,could be added to the mean educational aspirations of malevocational/technical school.planners in the HS&B data to correct fordifferen.;es is overlap.

-47 -
For seniors planning to enter military service or the civilian work
force, male planners look like male doers. (Professional aspirations
ar( slightly underestimated by the mean of men planning to enter the
military, and educational aspirations are slightly underestimated by
using the mean for men planning to enter the civilian work force.) The
charactertistics of women planning to enter the civilian labor force are
similar to those for the doers, except that planners have slightly lower
educational expectations, on average. In contrast, women planning to
nter the military are different from those who do; however, our sample
s;zes are small in this case, with only 62 planners and 1.4 doers.
In summary, the analysis of NI,S72 indicates that the mean
characteristics describing high school seniors planning to enter
different educational and occupational career tracks provide remarkably
good proxies tor the actual moans of seniors who do enter these tracks.
There are two exceptions to this rule: men planning to enter
vocational/teanical schools and women planning to enter the military
tend to differ from those who enter the tracks in both high school
coursework and educational expectations.
One last methodological consideration remains: Is there any reason
to believe that the relation between the characteristics of planneis and
doers in 1972 holds for planners and doers in 1980? Although we cannot
answer this question defihitively (if we could, we would not have'had to
use data from 1972), a comparison of the attributes of the 1972 planners
with the 1980 planners shows that, on average, they are quite similar
(compare the data in Tables 8 and 9). The attributes of two-year
college planners in 1972 and 1980, for example, were quite similar:

-48 -
general ability (51.59 vs. 50.50); age (17.73 vs. 17.54); single .(1.00
vs. 1.00), semesters of math (4.35 vs. 4.33) and science (3.96 vs.
3.60); and number of siblings (2.61 vs. 2.92). The planners of 1972 and
1980 do differ, however, on several variables where they might be
expected to because of inflation (e.g., family income) or changes in
college requirements (semesters of foreign language). We conclude,
then, that data on the characteristics of planners in the spring of 1980
provide good proxies for data on the characteristics of doers in the
tall of 1980.
PROFILE OF TWO-YEAR COLLEGE STUDENTS' CHARACTERISTICS
In using data on planners from HSZA, we are able to provide a
current, detailed profile of two-year college students falling within
the prime age range for NPS accessions. We first provide a profile of
the attributes of those students with respect to enlistment standards,
high school curricular background, ability, and demographic
characteristics.
Accession_Goals
The military seeks to recruit male high school graduates aged 18 to
21 y(ars who are aboe average in aptitude, single, and in good physical
condition.14) On average, males planning to enter two-year colleges in
1980 met these standards. They scored higher on aptitude than did
students planning to enter military service or the civilian work force,
they averaged 17.5 years of age in the spring of their senior year of
high school (or would be roughly 19.5 years after two years of college),
14) In reporting data on the qpality of two-year college students,we emphasize the data for males because of the military's greater need,in numbers, for males than for females, and for the sake of brevity.

-49 -
and they are predominantly single and in sound physical condition (Table
9a, see also Table 9b; standard deviations may be found in Table A.2a
and A2.b).
A comparison of students planning to enter two-year colleges with
those planning to enter vocational/technical postsecondary schools shows
that those planning collegiate academic programs in the two-year
colleges were above average in aptitude and slightly higher in aptitude
thdn those planning vocational programs, who were, in turn, slightly
higher than those planning to enter vocational/technical schools (see
Table 10a and 10b; standard deviations may be found in Table A.3a and
A3.b).
High School Education
Academically, male two-year college planners fall in between four-.
year college planners and those planning to enter the mili .ry service
or the civilian labor force. They have a B- grade point avenage (women
have a B average), and about the same number of semesters of English,
foreign language, mathematics, and science as do the military planners
and more than those planning to enter the civilian labor force (see
Table 9a). The proportion of two-year college planners enrolled in
physics, chemistry, and computer courses'is about the same as that of
military planners and somewhat greater than that of the civilian labor
force planners. (A smaller proportion of two-year college women
planners was enrolled in physics and computer courses.) Finally, men
planning to enter two-year colleges tended to spend slightly more time
on homework in high school than did military planners and considerably
more time than did civilian labor force planners.
Pt
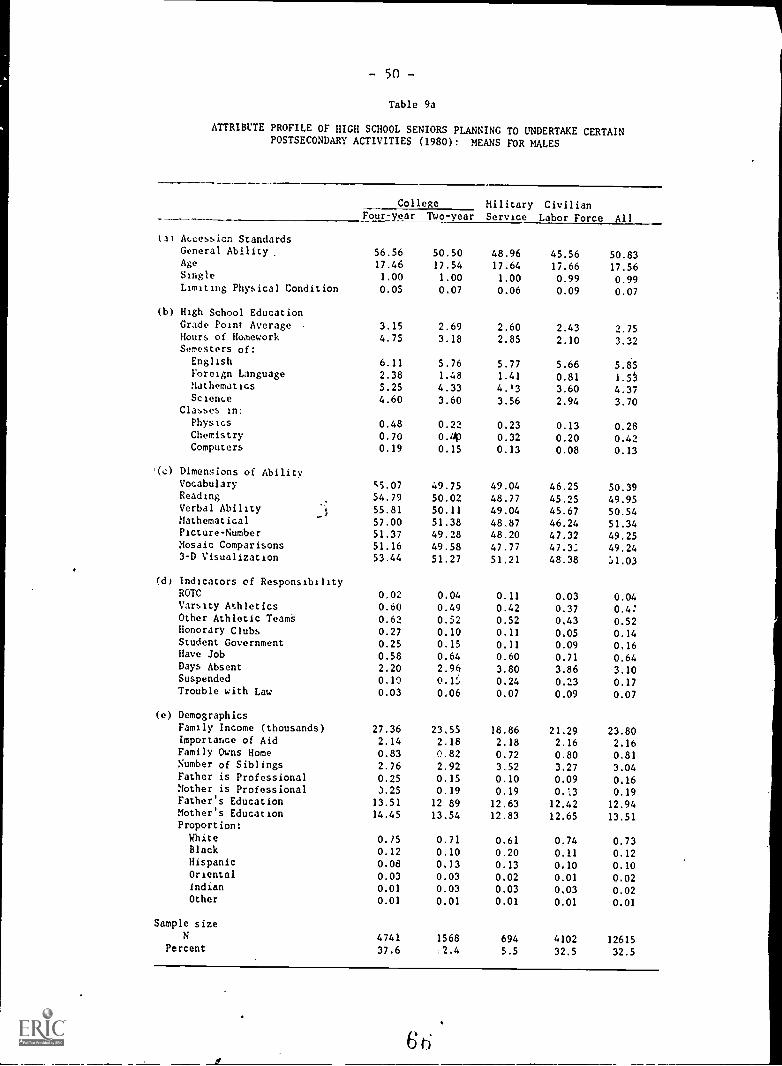
- 50 -
Table 9a
ATTRIBUTE PROFILE OF HIGH SCHOOL SENIORS PLANNING TO UNDERTAKE CERTAINPOSTSECONDARY ACTIVITIES (1980): MEANS FOR MALES
College Military CivilianService Labor Force AllFour-year TWo-year
(al Accession StandardsGeneral Ability 56.56 50.50 48.96 45.56 50.83Age 17.46 17.54 17.64 17.66 17.56Single 1.00 1.00 1.00 0.99 0.99Limiting Physical Condition
(b) High School Education
0.05 0.07 0.06 0.09 0.07
Grade Point Average 3.15 2.69 2.60 2.43 2.75Hours of Homework 4.75 3.18 2.85 2.10 3.32Semesters of:
English 6.11 5.76 5.77 5.66 5.85Foreign Language 2.38 1.48 1.41 0.81 1.5tMathematics 5.25 4.33 4.13 3.60 4.37Science 4.60 3.60 3.56 2.94 3.70
Classes in:
Physics 0.48 0.22 0.23 0.13 0.28Chemistry 0.70 0.40 0.32 0.20 0.42Computers 0.19 0.15 0.13 0.08 0.13
'(c) Dimensions of AbilityVocabulary c5.07 49.75 49.04 46.25 50.39Reading 54.79 50.02 48.77 45.25 49.95Verbal Ability 55.81 50.11 49.04 45.67 50.54Mathematical 57.00 51.38 48.87 46.24 51.34Picture-Number 51.37 49.28 48.20 47.32 49.25Mosaic Comparisons 51,16 49,58 47,77 47.3: 49.243-D Visualization
(d) Indicators of Responsibility
53.44 51.27 51.21 48.38 A.03
ROTC 0.02 0.04 0.11 0.03 0.04Varsity Athletics 0.6Q 0.49 0.42 0.37 0.4;Other Athletic Teams 0.62 0.52 0.52 0.43 0.52Honorary Clubs 0.27 0.10 0.11 0.05 0.14Student Government 0.25 0.15 0.11 0.09 0.16Have Job 0.58 0.64 0.60 0.71 0.64Days Absent 2.20 2.96 3.80 3.86 3.10Suspended 0.10 0.1!, 0.24 0.23 0.17Trouble with Law
(e) Demographics
0.03 0.06 0.07 0.09 0.07
Family Income (thousands) 27.36 23.55 18.86 21.29 23.80Importance of Aid 2.14 2.18 2.18 2.16 2.16Family Owns Home 0.83 0.82 0.72 0.80 0.81Number of Siblings 2.76 2.92 3.52 3.27 3.04Father is Professional 0.25 0.15 0.10 0.09 0.16Mother is Professional 3.25 0.19 0.19 0.13 0.19Father's Education 13.51 12 89 12.63 12.42 12.94Mother's Education 14.45 13.54 12.83 12.65 13.51Proportion:
White 0./5 0.71 0.61 0.74 0.73Black 0.12 0.10 0.20 0.11 0.12Hispanic 0.08 0.)3 0.13 0.10 0.10Oriental 0.03 0.03 0.02 0.01 0.02Indian 0.01 0.03 0.03 0.03 0.02Other 0.01 0.01 0.01 0.01 0.01
Sample sizeN 4741 1568 694 4102 12615
Percent 37.6 2.4 5.5 32.5 32.5
6 ri

- 51 -
Table 9b
ATTRIBUTE PROFILE OF HIGH SCHOOL SENIORS PLANNING TO UNDERTAKE CERTAINPOSTSECONDARY ACTIVITIES (1980): MEANS FOR FEMALES
College Military CivilianService Labor Force
45.57 44.8017.54 17.54
1.00 0.980.05 0.08
2.76 2.703.30 3.03
5.81 5.71
1.40 1.04
3.86 3.203.12 2.59
0.19 0.080.26 0.150.13 0.12
45.98 45.75
46.93 45.6246.01 45.4345.29 44.24
49.41 49.1047.94 49.2247.99 46.45
0.08 0.030.27 0.170.34 0.280.12 0.090.16 0.120.50 0.633.54 3.57
0.12 0.11,0.01 0.02
16.02 18.14
2.31 2.34
0.70 0.75
3.80 3.430.05 0.070.14 0.09
12.37 12.15
12.45 12.30
0.50 0.700.33 0.140.12 0.11
0.01 0.01
0.03 0.030.01 0.01
222 4013
1.6 29.0
All
49.2517.45
0.990.06
2.994.09
5.91
1.86
3.903.29
0.150.37
0.12
49.2149.5249.4848.74
50.8250.5748.47
0.020.24
0.320.200.21
0.59
2.96
0.080.01
21.15
2.240.783.12
0.140.1712.77
13.23
0.69
0.15
0.11
0.02
0.02
0.01
13849
29.0
1
1-........
Four-year
53.7517.36
1.00
0.04
3.31
5.30
6.12
2.684.65
4.03
0.250.600.12
52.8153.27
53.5953.2752.48
51.8650.45
0.01
0.310.360.340.310.582.29
0.050.01
24.33
2.21
0.81
2.860.21
0,2413.39
14.15
0.700.160.10
0.020.010.01
5445
39.3
Two-year
49.1317.42
0.990.04
2.97
3.89
5.89
1.87
3.82
3.21
0.100.35
0.11
49.04
49.6349.3748.64
50.6650.6848.53
0.02
0.230.31
0.160.21
0.602.82
0.070.01
20.98
2.19
0.80
2.980.13
0.1512.66
13.08
0.70
0.120.13
0.020.02
0.01
2312
16.7
(a) Accession StandardsGeneral AbilityAge
Single
Limiting Physical Conditicg
(b) High School Education
Grade Point AverageHours of Home;:ork
Semesters of:EnglishForeign LanguageMathematicsScience
Classes in:PhysicsChemistryComputers
(c) Dimensions of AbilityVocabularyReadingVerbal AbilityMathematicalPicture-NumberMosaic Comparisons3-D Visualization
(d) Indicators of ResponsibilityROTCVarsity AthleticsOther Athletic TeamsHonorary ClubsStudent GovernmentHave JobDays AbsentSuspendedTrouble with Law
(e) DemographicsFamily Income (thousands)Importance of AidFamily Owns HomeNumber of SiblingsFather is ProfessionalMother is ProfessionalFather's EducationMother's EducationProportion:
WhiteBlack
HispanicOrientalIndian
Other
Sample size
Percent
P-1

- 52 -
Table 10a
ATTRIBUTE PROFILE OF HIGH SCHOOL SENIORS PLANNING TO ENTER TWO-YEARCOLLEGES OR VOCATIONAL/TECHNICAL SCHOOLS (1980): MEANS FOR MALES
Twolyear College Voc/Tech
SchoolAcademic Vocational
(a) Accession StandardsGeneral AbilityAge
Single
Limiting Physical Condition
(b) High School Education
52.36
17.51
1.00
0.06
48.0917.58
1.00
0.08
47.27
17.60
0.99
0.06
Grade Point Average 2.76 2.60 2.55Hours of Homework 3.36 2.92 2.41Semesters of: ,
English 5.84 5.65 5.75Foreign Language 1.67 1.22 0.81Mathematics 4.51 4.08 3.78Science 3.84 3.27 2.33
Classes in:Physics 0.25 0.18 0.13Chemistry 0.49 0.29 0.21Computers
(c) Dimensions of Mental Ability
0.14 0.16 0.13
Vocabulary 51.31 47.71 47.37Reading 51.50 48.08 47.12VerbalAbility 51.85 47.84 47.24Mathematical 53.08 49.15 47.85Picture-Number 49.63 48.75 47.90Mosaic Comparisons ' 49.43 49.78 47.863-D Visualization
(d) Indicators of Responsibility
51.44 51.06 50.14
ROTC 0.04 0.04 0.05Varsity Athletics 0.51 0.45 0.39Other Athletic Teams 0.53 0.51 0.44Honorary Clubs 0.13 0.06 0.07Student Government 0.16 0.14 0.11Have Job 0.62 0.67 0.69Days Absent 2.85 3.12 3.26Suspended 0.14 0.17 0.18Trouble with Law 0.06 0.06 0.08
(0 DemographicsFamily Income (thousands) 24.53 22.20 19.82Importance of Aid 2.15 2.22 2.23Family Owns Home 0.83 0.82 0.81Number of Siblings 2.88 2.97 3.19Father is Professional 0.17 0.13 0.08Mother is Professional 0.20 0.18 0.14Father's Education 13.04 12.68 12.43Mother's Education v 13.78 13.18 12.51Proportion:
White 0.73 0.69 0.68Black 0.09 0.11 0.12Hispanic 0.13 0.13 0.15Oriental 0.03 0.03 0.01Indian 0.02 0.04 0.03OLhei 0.01 U.OU 0.01
Sample size
908 660 668Percent 7.2 5.2 5.3
60
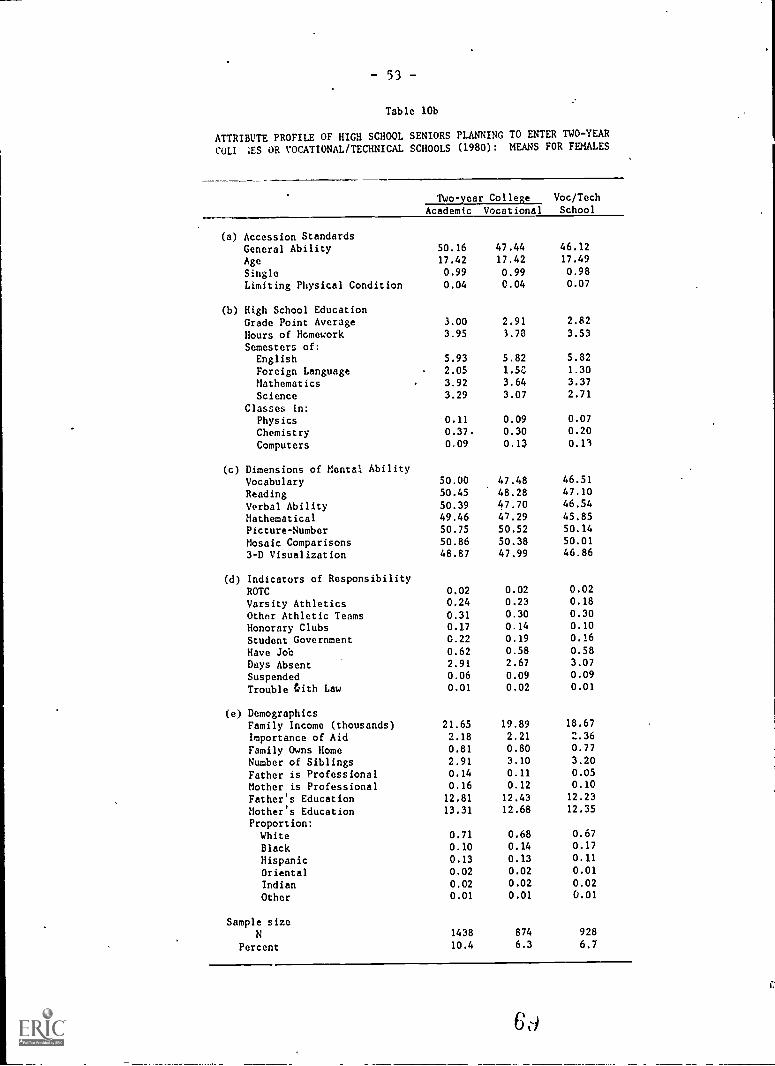
53 -
Table 10b
ATTRIBUTE PROFILE OF HIGH SCHOOL SENIORS PLANNING TO ENTER TWO-YEAR
COLI ;ES OR VOCATIONAL/TECHNICAL SCHOOLS (1980): MEANS FOR FEMALES
-^
Two-year College Voc/TechSchoolAcademic Vocational
(a) Accession StandardsGeneral Ability 50.16 47.44 46.12
Age 17.42 17.42 17.49
Single 0.99 0.99 0.98
Limiting Physical Condition
(b) High School Education
0.04 0.04 0.07
Grade Point Average 3.00 2.91 2.82
Hours of Homework 3.95 3.78 3.53
Semesters of:English 5.93 5.82 5.82
Foreign Language 2.05 1.5C 1.30
Mathematics 3.92 3.64 3.37
Science 3.29 3.07 2.71
Classes in:Physics 0.11 0.09 0.07
Chemistry 0.37. 0.30 0.20
Computers
(c) Dimensions of Mental Ability
0.09 0.13 0.11
Vocabulary 50.00 47.48 46.51
Reading 50.45 48.28 47.10
Verbal Ability 50.39 47.70 46.54
Mathematical 49.46 47.29 45.85
Picture-Number 50.75 50.52 50.14
Mosaic Comparisons 50.86 50.38 50.01
3-D Visualization
(d) Indicators of Responsibility
48.87 47.99 46.86
ROTC 0.02 0.02 0.02
Varsity Athletics 0.24 0.23 0.18
Other Athletic Teams 0.31 0.30 0.30
Honorary Clubs 0.17 0.14 0.10
Student Government 0.22 0.19 0.16
Have Job 0.62 0.58 0.58
Days Absent 2.91 2.67 3.07
Suspended 0.06 0.09 0.09
Trouble Oith Law
(e) Demographics
0.01 0.02 0.01
Family Income (thousands) 21.65 19.89 18.67
Importance of Aid 2.18 2.21 2.36
Family Owns Home 0.81 0.80 0.77
Number of Siblings 2.91 3.10 3.20
Father is Professional 0.14 0.11 0.05
Mother is Professional 0.16 0.12 0.10
Father's Education 12.81 12.43 12.23
Mother's Education 13.31 12.68 12.35
Proportion:
White 0.71 0.68 0.67
Black 0.10 0.14 0.17
Hispanic 0.13 0.13 0.11
Oriental 0.02 0.02 0.01
Indian 0.02 0.02 0.02
Other 0.01 0.01 0.01
Sample size1438 874 928
Percent 10.4 6.3 6.7
6 d
- 54 -
Male two-year college planners in academic programshave more
semesters of academic work in high school than did those in vocational
piograms who, in turn, have more semesters than did students planning to
enter vocational/technical schools ;except for English; see Table 10a).
Further, the proportion of planners who studied physics and chemistry
decreases as we move from the academic track to the vocational/technical
sthools. The proportion of planners enrolled in computer coursework,
however, remains constant across these postsecondary educational tracks:
Aptitude
Two-year college planners fall in between four-year college
planners and military and civilian labor force planners on several
aptitude dimensions.[31 More specifically, two-year college planners
tend to score slightly higher on verbal, quantitative, lnd spatial
ability tests than did military planners and between a third and a half
a standard oeviation higher than did civilian labor force planners. A
cons,stent trend in mean aptitude test scores also emerges in a
(omparison of students planning to enter two-year academic with those
planning to enter vocational college Programs or vocational/technical
schools: aptitude scores decrease systematically moving from the
academic track to the vocational-technical track. (The one exception is
for scores on the Mosiac test.)
We infer from these data that enlistees from the two-year college
market would, on average, meet and even surpass ability standards. Mean
ANT scores for male and female accessions during FY81 enable us to
15) For a discussion of the psyclwmetric properties of these tests,see Heyns and Hilton (1982).
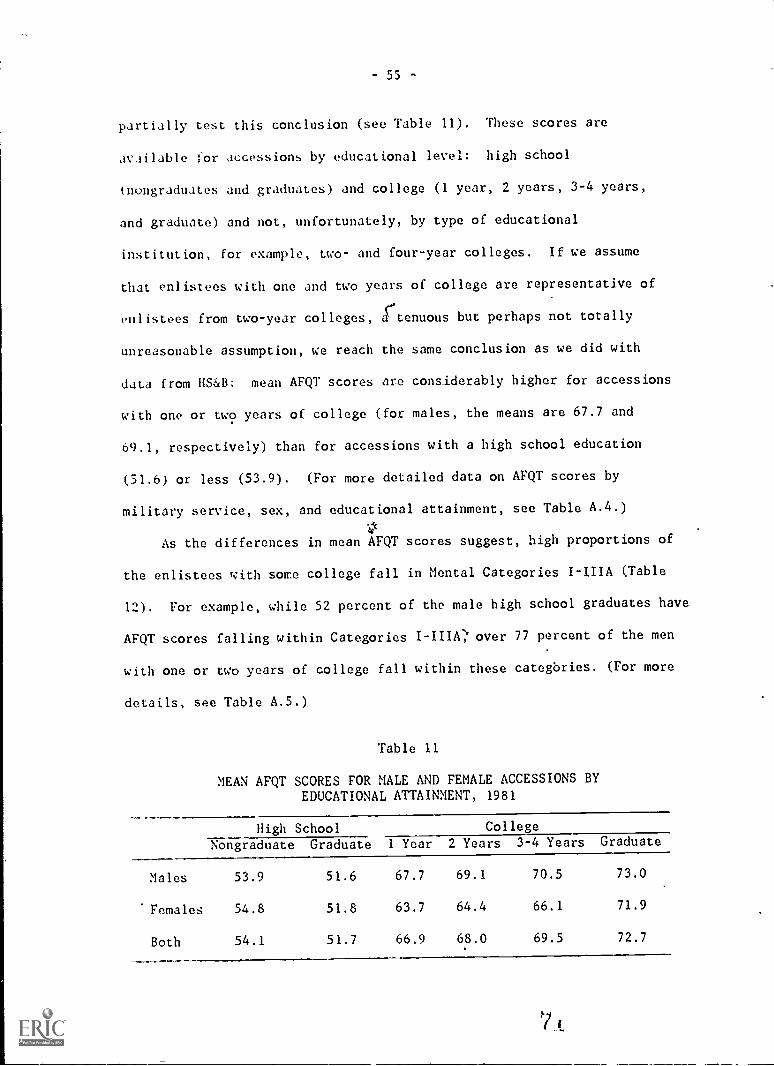
- 55 -
partially test this conclusion (see Table 11). These scores are
available for accessions by educational level: high school
(nongraduates and graduates) and college (1 year, 2 years, 3-4 years,
and graduate) and not, unfortunately, by type of educational
institution, for example, two- and four-year colleges. If we assume
that enlistees with one and two years of college are representative of
enlistees from two-year colleges, (*tenuous but perhaps not totally
unreasonable assumption, we reach the same conclusion as we did with
data from HS&B: mean AFQT scores are considerably higher for accessions
with one or two years of college (for males, the means are 67.7 and
69.1, respectively) than for accessions with a high school education
(51.6) or less (53.9). (For more detailed data on AFQT scores by
military service, sex, and educational attainment, see Table A.4.)
4As the differences in mean AFQT scores suggest, high proportions of
the enlistees r4ith some college fall in Mental Categories I-IIIA (Table
12). For example, while 52 percent of the male high school graduates have
AFQT scores falling within Categories over 77 percent of the men
with one or two years of college fall within these categbries. (For more
details, see Table A.5.)
Table 11
MEAN AFQT SCORES FOR MALE AND FEMALE ACCESSIONS BYEDUCATIONAL ATTAINMENT, 1981
High School College
Nongraduate Graduate 1 Year 2 Years 3-4 Years Graduate
Males 53.9 51.6 67.7 69.1 70.5 73.0
Females 54.8 51.8 63.7 64.4 66.1 71.9
Both 54.1 51.7 66.9 68.0 69.5 72.7

- 56 -
Table 12
PERCENTAGES OF ENLISTMENTS IN MENTAL CATEGORIES I-IIIABY EDUCATIONAL ATTAINMENT AND SEX, 1981
High School CollegeNongraduate Graduate 1 Year 2 Years 3-4 Years Graduate
Males 56.5 52.2 77.4 78.2 79.1 83.1
Females 66.1 53.0 72.5 74.1 73.0 82.9
Both 56.9 52.3 76.4 77.2 77.7 83.1
Responsibility: A Nontraditional Indicator of Quality
As a nontraditional indicator of quality, we looked for evidence of
an individual's participation in extracurricular activities during high
school chat required a commitment of time and energy and a commitment to
others who depended on the individual for successful completion of the
activity. Put more simply, we looked for indicators of
II
responsibility." aigh School and Beyond provided a number of positive
indicators as to whether the individuals participated in: (a) high
school ROTC, (b) sports, (c) leadership activities, or (d) part-time
work. The survey also provided negative indicators including days
Absent from school for reasons other than health and reports of being
suspended from school, put on probation, or having serious trouble with
the law.
As.for participation in sports, leadership,.and work-related
activities, men planning on entering a two-year college were quite
- 57
similar to men planning on the military and fell in between men planning
on' a tour-year college and the civilian labor force.(6j A greeter
proportion of seniors planning to enter the civilian labor force held
jobs than did men planning to enter the military or a two-year college.
Similarly, the proportion of men participating in these activities
systematically decreases from the academic track to the
vocational/technical track. The one exception was the proportion of men
i,orking, which showed, not unexpectedly, the opposite relation between
participation and educational track (see Table 10a). Finally, the
proportion of men planning on the military who participated in high
school ROTC was abOut three times greater than the proportion of men
planning to enter any of the other career tracks, including the academic
and vocational programs in two-year colleges and vocational-technical.
schools (Table 9a and 10a).
Negative indicators of responsibility--indicators of
"irresponsibility"--are absences for reasons other than health,
suspension from school, and trouble with the law. Absences increased
over the four career tracks shown in Table 9a, ranging from slightly
more than two days for four-year college students to almost four days
for men in the civilian labor force.L7) Similarly, the proportion of
men who were suspended or who have had trouble with the law increases
rom the academic to the nonacademic tracks. For all three variables,
fol This pattern of findings holds for women except with respect to
work--considerably fewei women in the military held jobs when in high
school than did women planning to enter the other tracks.
[7) Subjects were asked, "Between the beginning of school last fall
and Christmas vacation, about how many days were you absent from school
tor any reason, not counting illness?" They responded: none (our code
0), 1 or 2 days (our code 1), 3 or 4 days (our code 3), 5 to 10 days
(our code 7), and so on.
- 58 -
there is a clear distinction between men planning to enter college (two-
and four-year) and men planning on military service and the civilian
labor force: men entering college tend to be less irresponsible. This
trend of increasing irresponsibility moving from the academic to the
nonacademic tracks is mirrored in Table 10a, where irresponsibility
tends to incre&se as the educational track becomes increasingly
vocational in orientation.
Demographic information on students planning to enter a two-year
collf.ge is provided in Tables 9a, 9b, 10a and 10h along with data on
persons planning.other careers. In general, these students reported a
moan parental income of $23,550 in 1980, somewhat below the family
income of mon planning on a four-year college and considerably above
that of mon planning on military service (Table 9a1. Moreover, mean
family income decreased from $24,530 for men planning on a two-year
college lu the academic track to $19,820 for mon planning to enter
vocational/technical schools (Table 10a). Eighty-two percent reported
that their family owned its home, in contrast to 72 percent of the men
planning on military service. Fifteen and 19 poicent reported that
their fathers and aothers (respectively) were professionals in the labor
force and had 12.89 and 13.54 years of education, respectively. Men
planning on entering a Wo-year college indicated that aid was somewhat
important in deciding upon a college to attend, as did men planning on
other careers-18) Other data on ethnic/racial background and number of
siblings may be found in Tables ga and 10a.
(8] Aid was more important to women planning to enter the workforce and may even have affected their decisions not to continue witheducation.

59 -
In summary, data on men planning to enter two-year colleges confirm
current stereotypes: On measures of aptitude, academic curricular
background, and dmographic characteristics, they fall in between four-
year college plannerswho score higher on aptitude, have stronger
academic backgrounds, demonstrate greater responsibility, and come from
families with higher socioeconomic status--and military and civilian
work force pl anners.
More. important, however, is the finding that two-year college
planners are remarkably shiailar to military planners on many of the
indicators of "quality." These data indicate_that, on average, male two-
year college planners are ranked slightly higher on the quality
indicators than are male military planners. We interpret this to mean
that recruiting from the two-year college market would help to upgrade
the quality of military accessions. However, analysis of the
(AlAracteri,itics of men planning on academic or vocational programs in
mo-year colleges or in vocational/technical programs leads to a more
specific conclusion--that men planning on vocational/technical school
tend, on average, co fall slightly below men planning to enter the
military on most of the indicators of quality. This leads us to
iecommend a greater recruiting effort in two-year colleges for reasons
of quality as well as market size and density (see Table 1) while
targeting recruiting in vocational/technical schools in critical
occupationa 1 specialties (e.g., electrical engineering, computer
programmers).

- 60 -
PENETRABILITY OF THE MARKET
To determine whether the two-year college market is penetrable,
ideally we would like a randomized recruiting experiment in which a
systematic effort is made to recruit students from this market. Falling
short of an experiment, we would like some behavioral indication, not
just a verbal report of intent, that students in these institutions can
be attracted into the military.
On August 6, 1981, the Commandant of the Marine Corps autnorized
the nationwide implementation of the Community College Enlistment
Program (CCEP), effective October 1981. The program was open to men and
women who met the usual enlistment standards and were second-year
students, associate degree graduates, or students who had completed a
special college course in areas such as welding, drafting, or electrical
construction. CCEP's goal was to obtain, using regular Marine Corps
recruiters, 600 high-quality accessions annually who would filci any one
of over 150 technical or administrative occupational specialties.
Enlistment incentives included guaranteed occupational specialties,
guaranteed four-year assignment in that specialty, appointment to
private first class upon enlistment, promotion to corporal upon
completion of 13 months active duty, promotion to sergeant after 25
months, and bonuses for certain occupations.
As of May 1982, the end of the first six months of the program,
approximately 219 students had enlisted in the program, and 143 had
actually gone to recruit training. Another 50 of the 219 cancelled
theii contracts, and 11 others were about to enter training. Apparently
recruiters were experiencing limited success in enlisting students from
the community collegc market. One major barrier to recruiting was the
reluctance of the recruiters to enter this new market, one virtually
unknoun to them.
Another source of information on the penetrability of the two-
year college market is data on actual accessions during FY81. Those
data are presented in Table 13 by education attainment, sex, and branch
service. infortunately, DMDC's data do not indicate how many
enllstees with one or two years of college attended two-year colleges.
Nevertheless, ue can interpret the counts of accessions with one and two
years of college a5 overestimates_of the number of accessions fxom_t_wo-
year colleges. Put succinctly, the militiry attracted few students from
tuo-year colleges in 1981. Less than 4 percent of all male and 8
percent of the female accessions had one or two years of college.
To put an upper bound on the military's current penetration of the
two-year college market, lot us suppose for the moment that all of the
14,000 enlistees with one or two years of college came from the two-
year colleges. With a total enrollment of around 4.5 million in 1980,
ther uere over 300 tuo-year college students for every enlistee. The
10,800 males in this gronp.constituted only about 1.5 percent of the
estimaired 720,000 male tuo-year college enrollment in the prime age
group (21 or below).
With neither direct nor indirect information on the penetrability
of this market, the last resort is to make informed inferences on the
bdses of students' aspirations (Tables 14 and 15; standard deviations
are reported in Tables A.7a and A.7b) and financial conditions (Tables 9
and 10). In particular, the question arises as to why high school
seniors planning to enter either two-year colleges or the military are
7

- 62-
Table 13
NPS ACCESSIONS IN THE ARMED FORCES BY EDUCATIONAL ATTAINMENT,SERVICE, AND SEK: Fy81
Ciate..g.ory Army T Navy USAF URIC DoD
Males
Nongraduate
H.S. graduate1 yr college2 yrs ,college
3-4 yrs. college
College graduate
total
21,66871,721
1,784,
1,551
572
1,427
98,723
'21,744
56,1331,886
. 1,471
587
518
'82,339
6,986
53,192.1,710
1,500
480
2,430
66,298,
8,177, 58,57528,366 209,412
.609 5,989319, 4,841140 4.779
111 4,486
37722-285082'
'Females
Nongraduate 1,043 746 1,130 10 2,929
H.S. graduate 15,219 7,714 8,174 1,928 33,035
1 yr college 609 494 410 127 1,640
2 yrs colliege, 556 469 398 94 1,517
3-4 yrs coll1ee 201 150 117 18 486
College real/ate 549 188 376 39 1,152
Total 18,177 9,761 10,605 2,216 40,759
Both Sexes
Nongraduate 22,711 22,490 8,116 8,187 61,504H.S. graduate 86,940 63,847 61,3,66 30,294 242,447
1 yr college 2,393 2,380 2,120 736 7,629
2 yrs college 2,107 1,940 1,898 413 6,358
3-4-yrs college 773 737 597 158 2,265
College graduate 1,976 706 2,806 150 5;638
Total '116',900 92,100 76 903 39,938 325,841

- 63 -,
a ga
Table 14
ASPIRATIONS OF HIGH SCHOOL-SENIORS PLANNING TO UNDERTAKE CERTKIN
POSTSECONDARY ACTIVITIES (1980)
a. Means for Males
Career AspirationsProfess4onal AspirationsAgo Hold First Regular 'Job
Years Education ExpectedYears Ed. Expected by Mother
Ability to Complete CollegeAge-Expect to Marry
Age fixpect
Sample size:
Percent
College Military CivilianService Labor Force All
Four-year Two-year
60.17 48.77 43.30 35.74 47.34
0.66 0.41 0.18 -0.17 0.39
22.50 20-.91 19.8,7 18.82 20.75-
17.22 i5.31 14.15 13.26 15.12
17.20 1.5.88 15.42 14.54 15.86
4.70 4.40 4.02 3.69 4.21
24.46 23.93 23.82 23.09 23,82.
26.16 25.61 25.06 24.68 25.46
4741 1568 694 4102 12615
37.6 12.4 5.5 32.5 32.5.
.
b. Means for Semales
College Military CivilianService Labor Force All
Four-year Two-year
CireeeAspiratio0360.78 51.80 47.97 42.79 51.76
Professional Aspirations0.72 0.50 0.24 0.26 0.49
Age Hoid First Regular'Job 21.75 20.13 19.18 18.48 20.24
Years Education Expected 16.95 14.91 14.12 13.15 15.01
Years Ed. Expected by Mother 17.01 15.50 15.50 14.25 15.68
Ability to Complete College 4.63 4.43 3.90 3.66 4.2t
Age Expect to Marry23.57 /9.38' 23.54 21.45 22.51
Age Expect First Child 25.58 24.50 24.98 23.56 24.54
Sample size:5445 2312 229 4013 13849
Percent39.3 16.7 1,6 29.0 , 29.0

- 64 -
Table 15
ASPIRATIONS OF HIGH SCHOOL SENIORS PLANNING TO ENTER TWO-YEAR COLLEGESOR VOCATIONAL/TECHNICAL SCHOOLS (1980)
a. Means for Males
Two-year College Voc/TechSchoolAcademic Vocational
' 'Career Aspirations
Professional AspirationsAge Hold First Regular JobYears Education 4xpectedYears Ed. Expected by Mother
33.140.52
21.31_ 15.75
16.19
42.65
0.2620.3114.70
15.42
35.410.1419.75
13.7714.41Ability to Complete College 4.47 4.30 4.04Age Expect to Marry 24.16 23.61 23.33
95.82 25.33 24.95:ge-Expect First Child
Sample size:
908 .660 668Percent7.2 5,2 5.3
b. Means for Femaies
Two-year College Voc/TechSchoolAcademic Vocational
Career Aspirations 54.27 47.75 42.44Pyofessional Aspirations 0.57 0.39 0.25-Age Hold First Regular Job 20.35 19.78 19.33Years Educa.tion Expected 15.28 14.29 13.68Years Ed. ExpeCted by Mother 15.83 14.93 14.28Ability to Complete College 4.45 4.38 4.07Age Expect to Marry 22.55 29.11Age Expect First Child' 24.69 24.19 23.97
SaMple size:
1438 874 928Percent 10.4 6.3 6.7

-65 -
quite similar on many of the "quality" indicators discussed above but
differ so radically in their intentions to enter the military. A
considerably greater proportion of students planning to enter two-year
colleges aspire to a professional career by age 30 than do students
planning on entering the military (.41 and .50 for males and females
planning to enter a two-year college versus .18 and .24 for the
military). Furthermore, men planning to enter two-year colleges expect
to obtain over a yeaL more education than do men planning. to enter the
military. (This pattern is roughly the same for women.) The higher
expectations among two-year corlege plannersiglitbetiftkedto
financial factors: their parents' mean annual income is about $4,690
more than that for men plann.ing,to enter the military. (This difference
holds for women as well, the difference being almost $5,000.) Other
indicators suggest military planners tome from families of lower
socioeconomic status. Fewer of their families own their own home, they
have more siblings, and their parents have slightly less education
(Tables 9a and 9b). Financial necessity, then, may be an important
factor explaining the differences in career aspirations and educational
expectations betueen seniors .planning to enter two-year colleges and
those planning to join the military.
The implications for accession policy, in part, are these:
recruiting packages need to address two-year-college students-'
.educatiuual expectations, professional aspirations, and financial needs.
Some kind of educational package probably should be included. This
package might include, for example, support for completigg the associate
degree either before active duty or while on active duty, for example,
8.

- 66 -,
through the Conimunity College of the Air Force (Testerman, 'Or it
, might include ROTC scholarships for the most talented to earn bachelors
degrees in disciplines underlying the military's critical occupational
specialties (e.g., engineer,ing, science). Professional aspirations .
might be met, in part, by providing rapid advaneement through the ranks
as, for example, the Marine Corps has done in its Community College
.Enlistment Program. Financial incentives, both for competing with the
civilian labor force and further education, have been built into the
examples above. The importance of financial incentives for two-year
k.-collTge gtild-euts should-not :be underestimated: This applies especially
to the partAime student who has been out of high school for a year or
two, gainfully employed but not on a career ladder, or to the student
from a low7income family where immediate income, not long-term career
opportunities, makes the military particularly attractive.
UTILITY OF RECRUITS WITH SOME COLLEGE
Recruits with some college are useful to the milltary if they
successfully complete training in a minimum amount of timc, fill
critical occupational specialties, perform well bn the job, and.are not
involved in disciplinary actions. The De'fense Manpower Data Center can
provide a wealth of data bearing on utility, especially on the extent to
which enlistees with one, two, or more years of college fill critical
occnpational specialties and pose behavioyal or performance problems.
We examined attrition rates and reasons for leaving the service for
A:he cohort of nonptior service enlistees that entered service during
FY78. The enlistees,were divided into six groups according to their
educational.attainment and, within each educational group, were divided
into two categories of mental ability: Categories I-IIIA and IIIB-IV
(see Table 16).

'ble 16\\.
ATIRIT1ON RATES AMONG NONPR1OR StICE ENLISTEES WHO ENTERED SERVICEDURING FY78 BY EDUCATIONAL ATTA1tMENT, MENTAL CATEGORY, AND SEX
,
\\\
Non-, 'High School Collegegraduate Graduate -"---TiTeYear Iwo_years 3-4 years Graduate
1-1i1A IIIB-IV 1-111A II1B-1V I-111A II1B-IV i-II1A 111B-:IV I-111A 1118-1V I-II1A 111B-1V
Males
<2Number of accessions 29632 36376 82825 88443 4105 1417 3149 975 1030 372 1627 451
Overall attrition (%)through September 1981 53.9 60.1 31.7 42.2 27.6 41.9 28.s 37.9 28.8 41:7 36.0 43.9
Re'ason:
Expiration of term of hservice or early rejease 11.3 15.9 , 9.6 15.9 8.4 15.4, 9,7 15.0 8.9 15.3' 14.9 18.4
Failure to meet behrnioralor performance criteria 34.0 35.5 14.9 19.1 11 9 18.8 10.8 14.6 11.7 16.1 11.1 17.1
Other reasons 8.7 8.8 7.3 7.2 7.4 7.7 7.8 8.4 8.3 10.2 10.1 8.4
Females
aNumber of accessions 2436 1128 18222 10402 1227 384 1023 273 305 75 605 '160
Overall attrition (70)through September 1981 57.0 55.9 47.2 49.2 46.1 42.2 41.2 '43.2 43.9 38.1 44.1 4.4.4
Reason:Expiration of term of bservice or early release 5.3 5.4 9.9 10.6 10.8 8.6 9.5 9.5 12.5 8.0 14.2 15.0
Failure to meet behavioral'or performance criteria 26.6 27.3 14.9 17.1 13.9 15.9
012.1 143 11.1 9.3 11.9 11.9
Other reasons 25.1 23.1 22.5 21.5 21.4 17.7 19.6 19.4 20.3 21.3 18.0 17.5.
1these figures exclude enli.sted,accessions who later entered officer programs and those enlistees whosemental categories are unknown.
h,
. . \Reasons for early release include school attendance, teaching, police duty, seasonal employment, nationalinterest, and "insufficient retainability." \
.
8 4
- 68 -
This study considers the overall attrition of these groups through
September 1981. There are large differences in attrition rates between
enlistees whb did not complete'high school and those who did. The
higher attrition rates among men who did not complete high school is
accounted for mainly by a muCh higher prevalence of separations due to
behavioral and performance problems. Except for the lowest or highest
educational categories, attrition rates are roughly the same, about 29
percent for individuals in Categories I-1IIA and about 40 percent for
individualstin Categories 11111-IV. Attrition rates Zor college
graduates jump to 36 percent for individuals in Categories I-IIIA and 44
percent for Categories IIIB-IV. The incidence of attrition due to
failure to meet behavioral or performance criteria was roughly the *same
for high school graduates and above: between 10.8 and 14.9 percent for
men in Categories I-II1A and 14.6 and 19.1 pei,ent for Category IIIB-IV.
Regardless of educational attainment, attrition due to medical reasons,
family reasons, and so on was on the order of 7 to 10 percent. The
overall pattern for women is similar, The pattern of findings chat high
school.dropouts and college graduates shot% higher losses at expiration
of term of service than the others is probably due to higher voluntary
loss rates for the latter and, in part, to higher involuntary rates for
the former.
COST CONSIDERATIONS ASSOCIATED WITH TWO-YEAR COLLEGE ACCESSIONS
A number of factors affect the cost of two-year college accessions,
including recruiting costs-, advanced pay grades for college credits,
dependency status, and bonuses for entering critical military
specialties. DMDC data on 1981 NPS accessions bear on some of these
cost factors.
,
8;.)

-69 -
Military enlistment pay grades are adjusted for educational
attainment; generally, the greater the education, the higher the pay
grade. While this enlistment policy makes military pay grades more
competitive with the civilian sector and serves as.an enlistment
enduLement, it Aso means that enlistees from the two-year colleges will
receive more pay than those enlisting right after high school. Table 17.
contains data on entry pay grade by years of education. As before, we
use accessions of enlistees with one or two years of college as proxies
for two-year college accessions. Pay grade, as expected-, varies with
educational attainment: most enlistees with less than one year of
college education enter at E-1, whereas enlistees with one or two years
of education enter at E-2 or E-3,.depending.on the number of semester
hours they have completed.
We would expect. a smaller proportion of enlistees with some collegeA
to be single with np dependents than high school graduates simply by,
virtue of differences in ages. Thexe is a clear difference in
de/Pendency status between male enlistees who are high school graduates
(over 90 percent of the total male enlistments) and male enlistees with
one or more years of college (see Table 18). As years of college
inCrease, the percentage of single men with .no dependents decreases
(from 86.2 to 72.7 percent). Enlisted college men haVe a greater
tendency to be married and have dependents. Not surprisingly, the mean
age of male enlistees systematically increases as educational attainment
increases. The picture is somewhat different for women:. 91.2 percent
of the lligh school graduates are single with no dependeAts, roughly 6
\percent more than women in the other educational attainment categories.

- 70 -
Table 17
ENTRY LEVEL PAY GRADES BY SEX AND EDUCATIONAL ATTAINMENT(Percent)
Pay High School CollegeGrade Nongraduate Graduate 1 Year 2 Years 3-4 Years Graduate
Males
E-1 96.1 86.1 20.9 10.5
E-2 1.8 6.2 36.1 9.6
E-3 2.1 7.7 42.9 79.8
E-4 0.0 0.0 0.0 0.0
E-5 0.0 0.0 0.0 0.0
Females
E-1 95.8 88.4 16.6 8.0
9.3 8.0 43.8 10.5
E-3 1.8 3.6 39.6 81..5
E-4 0.0 0.0 0.0 0.1
E-5 0.0 0.0 0.0 0.0
E-6 0.0 0.0 0.0 0.0
9.9
7.3
81.8
0.1
3.0
2.1.
52.4
0.1
0.8...j 42.4
. r
5.6 2.5
6.4 3.0
.87.7 78.4
0.2 0.3
0.2
0.0
15.5,
0.3

71 -
Table 18
MARITAL STATUS AND NUMBER OF DEPENDENTS BY SEX AND EDUCATIONAL ATTAINMENT
(Percent)
High School College
Nongraduate Graduate 1 Year 2 Years 1-4 Years Graduate
Males
Single ,. 9D.2 . 92.5 86.2 81.4 78.4 72.7
Married with
0 dependents 3.4 2.5 4.4 5.8 6.q 7.9
1 dependent 2-.0 1.3 2.6 3.1 3.7 5.3
2 dependents 2.5 2.0 3.5 5,1 6.0 7.8
Other 1.9 1.7 3.3 4.0 5.2 6.3
Females
Single 82.3 91.2 86.7 86.8 86.D 84.3
Married with
0 dependents 9.2 4.4 6.9 6.7 7.6 8.5
.....,
P
1 dependent 3.7 1.6 2.8 2.4 2.7 2.7
2 dependents 2.7 1.5 2.1 2.2 1.6 .3.2
Other 2.1 1.3 1.5 1.9 2.1 1.3
Few 1981 enlistees received bonuses. Only 2.7 percent of the men
and 2.9 percent of the women received bonuses, and the'percentages
appear to be unrelated to educational:attainment.
88

In sum, then, enlistees with one or more years of .:ollege may cost
more than those with a high school education because on average, they
enter at higher pay grades and'are more likely to be married and have
dependents. On the other band, these increased costs apppear to be
offset, at least in part, by lower first-term attrition. A more
detaiied analysis of the costs associated with recruiting two-year
college students is beyond the scope of this study.

- 73 -
IV. , SUMMARY AND RECOMMENDATIONS FOR FURTHER STUDIES
In this section, we summarize the major findings of the study arid
provide the context for recommending further research into the
postsecondary,education market.
The literature review and data analyses suggest thai the
,
postsecondary education market is sufficiently large to warrant further
analysis. For example, we estimate tilat over one million men in this
market fall within recruitment age ranges% The market contains a large
number of potential recruits who meet or exceed enlistment standards.
By recruiting from this market; the military may increase recruit
quality in terms of the proportion of recruits who are high school
graduates with above average aptitude. This market has not been
substantia1:1y penttrated to date. For example, less then 4 percent of
all NPS enlistees in 1981 had one or two years'of college (and we do not
know how many directly enlisted out of two-year colleges).
Nevrtheless, the market contains many students whose educational and
occupational plans are in a svte of flux. These students might
consider enlistment if an at4ractive incentive package designed for them
were offered. Moreover, our analyses suggest that two-year colleges
would provide a cooperative recruiting environment, one that already has
in place an administrative mechanism for, coordinating recruiting with
its counseling and guidance functiiiiis.Finally, preliminary analyses
suggest that, once in the military, these students would perform well.
Although our research has provided a reasonably accurate profile of
the marketplace, we. do not know if.the marktt can be penetrated. ShO.uld

74 -
the military ,increase its recruiting efforts-to attract students leaving_
two-year colleges and vocational schools? The answer depends, in large
part, on whether enlistment rates from these markets can ,be cost
effectively increased. Further studies attempting to determine what
recruitment strategies would be most fruitful are required. To this
end,- we identify four different types of studies: (1) analyses of
existing data sets, (2) an examination of effective use of recruiters in
the postsecondary market, (3) a market survey of alternative recruiting
packages and communication channels, and (4) a targeted recruiting
experiment in the postsecondary education market. We consider each
.alternative in turn.
ANA1,Y_SES OF EXISTING DATA SETS
This study raises more questions about the penetrability and
utility of postsecondary education markets 'than it answers.
Fortunately, a variety of data sets can be exploited to answer the
following questions:
Recruiting Strategies
o To what extent does the military currently attnact talented
stddents from the nation's colleges and froiii its vocational
schools?
o Are there particular locations (states, recruiting districts)
that slgnificantly outperform or underperform others in
recruiting enlistees with some postsecondary education? If so,
where are they?
Q
(,)
- 75 -
o What recruiting practices- (e.g., use_ of educational_
specialists, links between recruiter command and colleges) at
these locations are especially successful?
Ctility of Recruits
o How are individuals from two-year colleges and vocational
schools utilized by the services?
o How well do they perform (as measured,, for.example, by average
years of service, promotion rates, and percentage filling
critical occupational spe,cialties).
o Are enlistees from certain postsecondary education markets more
likely to perform satisfactorily than enlistees from other
markets?
o Are pnlistees from two-year colleges and vocational schools
more likely to serve longer tours of duty than, for example,
enlistees right out of high school?
Postservice Activities
o What happens to high-quality enlistees with some postsecondary
education after they leave the military?
o To what extent do they continue to serve the military as
reservists and workers in defense-related industries?
o Do they fill key positions in the civilian sector after
completing their educations?
More research is needed to provide better as,seSsments of the sizes
ani compOsitions of-the various subpopulations of youth that constitute
the postsecondary recruiting markets. In the past, manpower analysts
92
- 76 -
have viewed-the-eligible population as being grouped by sek, age, mental
category, and educational attainment, with the last.ordinarily
characterized by the dichotomydistinguishing.the high school graduates
from the others. Now that the military is considering broadening its
recruiting efforts to concentrate on particular postsecondary markets,
finer partitions of the youth population becoMe of interest, including
rhose defined in terms of postsecondary track, occupation (or
.instruction program), part-time or full-time status,,and educational
attainment, in addition to the usual demographic factors (sex, race,
age, and marital/parenthood status).
The need for more comprehen.iiveinformation on the youth Labor and
student populations becomes clear when we try to estimate the military's
current penetration rates in various postsecondary education markets.
As the disparate enrollment figures repoted in this study show, there
are large differences between.the two-year college enrollments reported
by the Bureau of Census and those by NCES. But even if they agreed,
disaggregated figures by sex, high school graduating class,
full-time/part-time status, marital/parenthood status, and type of
institutkon are not available.
The problem of assessing penetration rates for the two'-year
c011eges is particularly vexing. Although.DMDC accessions files can be
exploited to determine how many recruits have a year of college or more,
they provide no information as to how many had less than a year of
college, and the type of institution attended is not given. Even with
this information, we would probably not know if individuals enlisted
directly out of college.

- 77 1-
Another problem in estimating penetration rates for the two-year2
colleges is that, unlike high school graduating classes which are fairly
well defined and enumerated, two-year college populations are composed
of numerous cohorts of high school graduates, many of which are not
targets far or even eligible for enlistment. The students in the two-
year co11eges1Rxhibit considerable variability in age, family status,
physical condition, and commitments that make military service
inLonceivable for some of them except in a national emergency. Although
a married man of age 27 with two children, a salary of S25,000, and a
large mortgage may be eligible to enlist, his likelihood of doing so is
infinitesimal. But should he be included in the student population in
defining penetrAtion rates? Where should the lines be drawn in defining
the relevant subpopulations for recruiting purposes? The point here is
that no matter where they are drawn, the distribution of young people in
the sUbpopulations of interest is not_known.
.Al.though crude overall penetration rates can be computed, say, by
dividing the total number of enlis.tees with one or two years of college
by the total enrollment in all two-year colleges, thege estimates may be
misleading, and more refined estimates are not available in any form.
For example, we found no information indicating what proportion of the
entering two-year college freshmen in some year.entered the military
within a year or two (or any other time period). That information,
along with similar information for the other postsecondary tracks, would
provide indicators of the military's current penetration of those tracks
that. might lacer serve as baseline measures for assessing the effects of
changes in recruiting strategies directed at those markets.
94

- 78 -
A better understanding of the youth labor market and the interface
betueen military service and postsecondary education will become more
pressing as the military copes with a shrinking college-age population
and increasing competition from the civilian sector for high-quality
recruits. If the military is to maintain its current manning levels,
the servies must either attract a high percentage of each cohort or
adopt policies that lead to ionger terms of service. Shifting to higher-
quality enlistees may be desirable provided that the shift does not
entail offering enlistment options that lead enlistees to leave the
service, such as shorter tc-rms of service or sizable postservice
educational benefits that amount to negative reenlistment bonuses_
With the military's current eMphasis on recruiting Iligh school
graduates, che cohorts of primary interest are the nation's high school
graduating classes, and recruiting performance and penetration rates
should be gauged in terms of the "takes'? of the individual cohorts.
Idiat information ue have on the composition of the military's recruits
in terms Of thece cohorts leads us to conjecture that the military's
recruiting during the past two years has succeeded in part through
0 ,proportionate recruiting of earlier cohorts of high school graduates.
Although _this tactic has woiked well during the current recession, it
may be impossible to repeat in a healthier eConomy.
To understand the two-year college and postsecondary vocation
school recruiting market and to prOare (or a less favorable recruiting
climate, what is needed is a far more disaggregated analysis of the flow
of the nation's high school graduates in and out Of Military service as
well as in and out of other postsecondary activities. We believe that

79 -,
such an analysis will shed more light on the penetrability and utility
issues as well as on other matters at the interface of military service
and postsecondar} education, including the feasibility of using
postservice educational benefits as recruitment incentives.[1]
The specific research tasks that we recommend are: (1) exploit
existing military personnel files and survey data to determine where the
high-quality recruits (especially those with some co,llege) are coming
from, their attributes, how they are being utilized, and how well and
iong.they serve; (2) use Current national data on labor force
partiLipation, school enrollment, marital/parenthood status, eaucational
attainment, and,military service to provide data on the distribution and
flot, of recent cohorts of high school graduates across postsecondary
activities; (3) us:e longitudinal data files to get better information
on patterns of mil.itâry service, schooling, and civilian labor force
sparticipatidt of the nation's youth. Once follow-up surveys for High
School and Beyond become available, those data will serve this purpose
for the Class of 1980. The National Longitudinal Survey ot the'Class of
1972 is the best available data set ior looking at the experience of a
particular cohort of high school graduates i.n postsecondary education,
military service, and post:service activities up to seven years after
graduation. This rich longitudinal file, although dated, can shed
considerable light on some of the unanswered questions in this study.
The resultant information can b, updateciby other Rand research on
enlistment decisionmakjng (using the National Longitudinal Survey of
[1) Analyses of this sort are being conducted in a related 1andproject on enlistment decisionmaking that utilizes the 1978 NationalLongitudinal Survey of Labor Force Behavior as its database inconjunction with the 1979 DoD Survey of Personnel Entering MilitaryService.
0

- 80 -
Youth 14-22) and annnal surveys of The American Freshman (see, for
example, Astin et al., 1981).
RECRUITERS IN THE-POSTSECONDARY MARKETPLACE
Recruiting in the postsecondary market has not been systematically
studied, and there are a number ofreasons why it should be. *First,
unlike the high school market, most recruiters are unfamiliar with the
postsecondary market; most have neither attended these schools nor
systematically attempted to recruit in this market. Second, two-year
college students', unlike high schobl students, Move on and off campus
unpredictably; over 60 percent of them are part-time.students: Third,
these students have opted for additional education and not military
service after high school; their values and perceptions of military
service arc bound to differ markedly from those of recruiters, most of
whom probably did not attend college before they joined the military.
There are, however, several characteristics of the postsqcondary
education market that lead us to believe that a systematic recruiting
effort can meet both the military's Accession goals and the schools.'
goals' of enabling, students to successfully complete their studies and
finding employment afterwards for them. These schools are remarkably
responsive to the economic and social environment compared with four-
year colleges and universities. In this era of high unemployment, they
appear,to be quite willing to cooperate with the militAry, for example,
by.adapting their vocational education programs to better meet military
needs and by coordinating their career placement with military
recruiting. Moreover, two-year colleges have institutionalized a
counseling and guidance function that appears to be a natural link
between the colleges and recruiters.
9

- 81 -
We recommend, then, research on the interfac.e between recruiters
and two-year colleges and vocational schools. Analyses of DMDC'
accession files, for example, might identify recruiting districts that
'are inlusually successful in recruiting from the target market.
Interviews with recruiters and with local college administrators and
counselors will provide data on successful recruiting strategies. An
examination of successful recruiting strategies used in current pilot
studies,by several branches of the armed forces in the target market
would provide another source of data. The goals of a study of the
recruiter-college interface would be to determine who, if anyone
special, should be selected to recruit in this market, Mint kinds of
preparation, if any, these recruiters need to work successfully in_the
market, and what kinds of adjunct personnel (e.g., educational
specialists) and institutional arrinlgements might facilitate recruiting.
SURVEY OF THE MARKET
There are a number of reasons to believe that the postsecondary
education market can be penetrated. Many students' educational and
occupational aspirations are changing, a fact mirrored by their
behavior. Over 60 percent of the students are enrolled part-time;
transfers into and out of colleges are common. Instability in and
mobility among academic and vocational tracks and the labor force
characterize thebehavior of many of these students. Furthermore, many
tuo-year college students have unrealistic educational and occupational
plans that tend not to be realized. Transfer rates, for example, from
two- to.four-year_colleges are, on average, quite low--around 6 percent
complete a two-year college and 'then transfer to four-year institutions.
82 -
Botanic the career plans and' behavior of many students in postsecondary
. educational instithtions are in a state of flux, we believe that, with
the !right recruitment incentives and strategies,,this marke't might be
penetrated.
A survey of the two-year college and vocational school students and
institutions has mud to commend it. Perhaps its greatest merit is
-timeliness. Within a six-month period, a market survey should provide
information about the demographic characteristics, attitudes, and
aptitudes of the students, the attractiveness of enlistment incentives,
Ond the feasibility of recruiter strategies and media campaigns.
There are, however, several drawbacks to a Market survey. We might
learn a lot about the students' intentions or plans and not about their
-actual enl,istment behavior. This is especially problematic for the
markets i th t,hich we are dealing. Students in.two-year colleges tend
to be unrealistic planners. Also, there will probably, be a considerable
number of stpdants in the sample who respond frivolously or refuse to
respond at all.
On balance, w. belie've the potential benefits of a market survey
outweigh the drm:backs. Information on variables affecting verbal
reports of enlistment attractiveness provide a starting point from which
details of aLternatike enlistment packages can be developed. And
nonresponse, if the desire not to be surveyed is distinguished from
negative attitudes toward the military, provides important information
about penetrability.
In designing a market survey, a number of factorsI
should be taken
into account. First, a recruiter or college counselor should be able to
readily identify the demographic and othGr characteristics of the

83 -
students Measured in the survey. Information on student recruiting
based on characteristics that are not:easily distinguishable is not of
much value. Second, th,e enlistment incentives examined in the survey
should be realistic, i.e., they should be options currently'available to
the services or those that may be available in the near future. Finding
that a six-month term of enlistment would be quite attractive to these
students (see Fisher et al., 1975) is,of small practical value. For
this and other reasons, the strvey should be developed with input from
each branch of the.service and, perhaps, the survey should ideptify the
particular branch With which the enlistment package is associated.
hird, the survey should provide information relevant to the selection
of recruiters and the development of recruiter contact and media7
exposureistrategies.
,REGRUIT(N6 EXPWMENT
Mc studies proposed above would provide information about the
penetrability of the postsecondary education market. However, each has
its shortcomings. The recruiter study does not directly bear on market
penetrability. The analyses of existing data sets provide a baseline
for assessing penetrability by showing what enlistment rates from
different markets have been and what student attributessuch as
socioeconomic status, attitudes toward the military, and career plans--
are related to enlistments. But even very thorough studies of existing
data may shed little light on how changes in recruitment st-ategies
might affect recruiting in certain subpopulatioiis. Sample surveys can,
at best, prottido indirect assessments ot Cho attractiveness of
alternative recruiting practices;.they cannot assess actual enlisment
behavior. The proposed studies provide a rational basis for framing
- 84-
recruitment strategies in the postsecondary education market, but before
considerable amounts of money, time, and human resources are committed
to recruiting fiom this market, more direct evidence of recruitment
llotential seems desirable.
To this end, we recommend examining the feasibility of.conducting a
small-scale, conirolled experimeni to assess the penetrability of the
maTket. This experiment would examine the impact of alternitive
recruiting incentives, recruiier sirategies, and media campaigns on the
enlistment rates of students in two-year Colleges and posisecondary
vocational schools. It would be implemeniod in a few, two-year colleges
and vocational schools in several geographically diverse states. It
wOlild be sequential-aliernative recruiting incentives and strategies
would be continued uniil their feasibility for national implementation
was established. If.ineffeciive straiegies could be eliminated early in
ihe test the time and cosi of conducting ihe study would be minimized,.
Im sum, ihere are a number of different studies that might be
conducted to ascertain the penetrability of the target market and the
associated costs. Taken together, the studies would provide a
reasonably comprehensive analysis of the target matkei and ihe
information needed for developing accession policies.
lLh
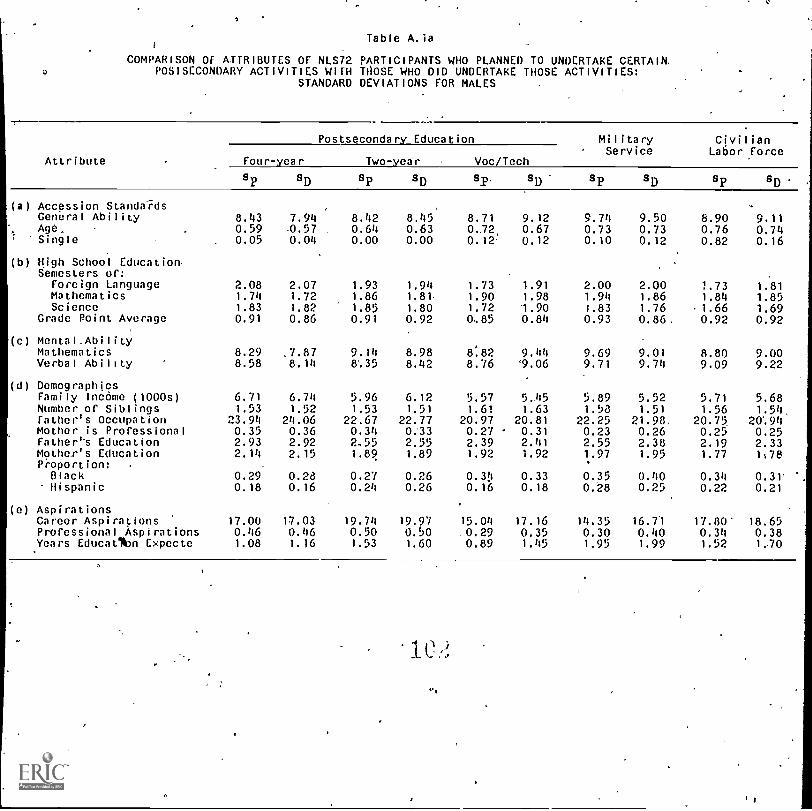
Table A.ia
COMPARISON OF ATTRIBUTES OF NLS72 PARTICIPANTS WHO PLANNED TO UNDERTAKE CERTAINPOS1SECONDARY ACTIVITIES WIEH THOSE WHO DID UNDERTAKE THOSE ACTIVITIES:
STANDARD DEVIATIONS FOR MALES
Attribute
Postsecondary Education Military. Service
Four-year Two-year Voc/Tech
sp SD sp SD Sr. p sp sp
(a) Accession Standa-rdsGederal Ability 8.43 7.94 8.42 8,45 8.71 9.12 9.74 9.50Age.Single
(b) High School Education,Semesters of:
0.590.05
-0.570.04
, 0.640.00
0.630.00
0-72,0.12
.
0.670.12
0.730.10
0.730.12
Foreign Language 2.08 2.07 1.93 1.94 1.73 1.91 2.00 2.00Mathematics 1.74 1.72 1.86 1.81- 1.90 1.98 1.94 1.86Science 1.83 1.82 1.85 1.80 1.72 1.90 1.83 1.76
Grade Point Average
(c) Meotal.Ability
0.91 0.86 0.91 0.92 0,85 0.84 0.93 0.86.
Mathematics 8.29 .7.87 9.14 8.98 8.82 9.44 9.69 9.01Verbal Ability
(d) Demographics
8.58 8.14 8%35 8.42 8.76 '9.06 9.71 9.74
Family Income (1000s) 6.71 6.74 5.96 6.12 5.57 5-45 5.89 5.52Number of Siblings 1.53 1.52 1.53 1.51 1.61 1.63 1.58 1.51Father's Occupation 23.94 24.06 22.67 22.77 20.97 20.81 22.25 21.98.Mother is Professional 0.35 0.36 0.34 0;33 0.27 ' 0.31 0.23 0.26Father's Education 2.93 2.92 2,55 2.55 2.39 2.41 2.55 2.38Mothar's Education 2.14 2.15 1.89 1.89 1.9 1.92 1.97 1.95Proportion: . '
Black 0.29 0.28 0.27 0.26 0.3Y 0.33 0.35 0.40Hispanic
(e) Aspirations
0.18 0.16 0.24 0.26 0.16 0.18 0.28 0.25
Career Aspirations 17.00 17.03 19.74 19.97 15.04 17.16 14,35- 16.71Professional Aspirations 0.46 0.46 0.50 0.50 .0.29 0.35 0.30 0.40Years Educatlbn Expecte 1.08 1.1-6 1.53 1.60 0.89 1.45 1.95 1.99
CivilianLabor Force
Sp SD
8.90 9.110.76 0.740.82 0.16
.
1.78/1 1.V.3
. 1.66 1.690.92 0.92
8.80 9.009.09 9.22
5.71 5.681.56 1.54.
20.75, 20%940.25 0.252.19 2.331.77 178
0.34 0.3V0.22 0.21
17.80' 18.650.34 0.381.52 1,70
ic

Table A.1b
COMpARISON Of AlIR.BUIES Of NLS/2 PARTICIPANTS WHO PLANNED TO UNDERTAKE CERTAIN'POSTSECONDARY ACTIVITIES WITH THOSE WHO DID UNDERTAKE THOSE ACTIVITIES:
STANDARD DEVIATIONS FOR FEMALES
Attribute
PostsecOndary Education MilitaryService
CivilianLabor Force
your-year Two-year Voc/Te:h
sD s sD 8PsD 's sD sD
(a) Accession Standards .
General Ability 8.58 8.22 8.38 8.57 8.51 8.88 9.75 9.27 9.00 8.70Age 0.56, 0.55 0,59 0.58 0.65 0.63 0.86 0.59 0.70 0.68Single
(b) High School Education
0.07 0.07- 0.10 0.06. 0.18 0.14 0,13 0.00 '0.22 0.22
Semesters of:foreign Language 2.10 2.12" 2.09 2.07 2.02 2.12 1.87 2.13 1.91 1.95Mathematics 1.80 1.78 1.83 1.83 1.67 1.79 1.78 1..93 1.66
--1.441.64
Science 1.80 1.79 1.68 1.66 1.59 1.76 1.61 1.72 1.47Grade Point Average
(c) Mental Abilii.y
0.86 0.83 0.91 0.92 0.91 0.91 0.86 0.82 0.95. 0.92
Mathematics 8.75 8.41 8.69 9-07 8.69 9.05 9.61 9.70 8.70 8.50Verbal Ability 8.58 8.27 8.49 8.59 8.60 8.88 9.65 9.25 9.23 8.93'
(d) Demographics'
Family Income (1000s) 6.92 6.07 6:05 6.28 5.30 5.17 5.60 4.15 5.22 5.36Number or, Siblings 1.53 1.52 1.45 1.54 1.60 1.60 1.39 1.71 1.57 1.50
Father's Occupation 23.88 23.85 .21.28 23.04 21.49 22.05 21.13 17,29 20.63 21.19Mother i's Professional 0.37 , 0.38 0.30 0.33 0.25 0.28 0.28 0.30 0.24 0.24Father's Education 3.00 3.00 2.54 2.64 2.33 2.22 2.26 1.66 2.21 2.29Mother's Education 2.22 2.20 1.85 1.99 1.76 1.70 1.71 1.12 1.74 1..75
Proportion: -
Black 0.35 0.33 0,28 0.31 0.39 0.37 0.40 0.41 0.36 0.31
Hispanic
(e) Aspirations
0.18 0.16 0.23 0.22 0.21 0.19 0.00 0.26 0.20 '10.21
Career Aspirations 13.94 13.85 17.76 17.58 16.17 17.87 10.87 11.16 13%47 15.58Professional AspiratiOns 0.39 0.39 0.50 0.49 0.42 0.47 0.31 0.30 0.35 0.42 .,,
Years Education Expected .0.98 1.05 1.40 1.50 0.98 1.37 1.86 1.36' 1.33 1.54
103

- 88
Table A.2a
ATTRIBUTE PROFILE OF HIGH SCHOOL SENIORS PLANNING TO UNDERTAKE CERTAINPOSTSECONDARY ACTIVITIES (1980): STANDARD-DEVIATIONS FOR MALES
. College Military CivilianService Labor Force 611Four-year TWo-year
(a) Accession StandardsGeneral Ability 9.45 9.17 9.93 8.45 110.25Age. 0.58 0.61 0.68 0.70 0.65Single 0,05 0.05, 0.05' 0.09 0.07Limiting Physical Condition
(b) High School Education
0.21 0.25 0.73 0.28 0.25
Grade Point Average 0.70 0.67 0.73 0.67 0.75Hours of Homework 3.48 2.67 2.75 2.16 3.08Semesters of:
English 0.83 1.1% 1.27 1.38 1.19Foreign Language 2.27 1.99 2.16 1.70 2.12Mathematics 1.54 1.81 1.95 1.90 1.91Science 1.81 1.83 1.92 1.83 1.98
Classes in:Physics 0.50 0:42 0.42 0.33 . 0.45Che istry 0.46 0.49 0.47 0.40 0.49Co puters
(c) Di nsions of Mental Ability
0.39 0.36 0.33 0.27 0.34
Vo6ibulary 9.48 ,8.76 9.27 8.10 9.51Reading .9.42 9.58 9.85 1).36 10.33Verbal Ability 9.91 9.25 9.89 8.52 10.27Mathematical 8.62 9.48 10.28 9.14 10.25Picture-Number 9.21 9.87 10.65 10.77 10.18Mosaic Comparisons 9.22 10.42 10:81 10.66 10.293-D Visualization,
(d) Indicators of Responsibility
10.76 9.88 10.75 9.91 10.55
ROTC 0.15 0.19 0.31 0.18 0.18Varsity Athletics 4).49 0.50 0.49 0.4A 0.50Other Athletic Teams 0.49 0.50 0.50 0.49 0.50Honorary Clubs 0.44 0.30 0.32 0.22 0.35Student Government 0.43 0.36 0.31 0.29 0.37Have,Job 0.49 0.48 0.49 0.45 .0.48Days Absent 3.60 4.31 5.20 5.14 4.56Suspended 0.30 0.36 0-.42 0.42 0.37Trouble with Law
(e) Demographics
0.18 0.23 0.25 0-.29 0.25
Family Income (thousands) 14.27 12.73 10.58 12.14 13.35Importance of Aid 0.78 0.77 0.75 0.76 0.77Family Owns Home 0.37 0.38 0.45 0.40 , 0.39Number of Siblings 1.96 2.11 2.48 2.39 2.21Father is Professional 0.43 0.36 0.29 0.28 0.37Mother is Professional 0.43 0.39 0.40 ' 0.34 0.40Father's Education 2.18 1.84 1.75 1.59' 1.95Mother's Education 2.84 ,2.43 2.03 2.01 2.57Proportion:While 0.43 0.45 0.49 0.44 0.44Black 0.33 0.30 0.40 0%31 0.32Hispanic 0.27 0.33 0.34 0.30, 0.30Oriental 0.16 0.17 0.13 0.10 0.14Indian . 0.11 0.)7 0.17 0.17 0.15Other 0.09 0.08 0.12 0.09 0.09
10 4

- 89 -Table A.26
ATTRIBUTE PROFILE OF HIGH SCHOOL SENIORS pLANNING 'TO UNDERTAKE CERTAIN
POSTSECONDARY ACTIVITIES (1980): STANDARD DEVIATIONS FOR FEMALES
J
CO'llege Military CivilianService Labor Torce AllFour-year Two-vear
(a) Accession StandardsGeneral Ability 9.71 8.47 9.48 8.19 9.71
Age. 0.59 4 0.61 0.75 0.70 0.65
Single 0.05 0.09 0.00 0.13 9.12
Limiting Physical Condition 0.20 0.20 0.22 0.27 0.23
(b) High School Education
-
Grade,Point Average 0.68 0.66 0.71 0.71 0.74
Hours of Homei.:ork 3.41 2.84 2.84 2.55 3.14
Semesters of:English 0.84 1.05 1.34 1.31 1.10
Foreign-LangUage 2.36 2.08 2.22 1.69 .2.19
, Mathematics 1.71 1.80 1.93 1.80 1.88
SCience 1.84. 1.79 1.82 1.66 1.87
Classes in:Physics 0.43 0.30 0.39 0.27 0.36
Chem..stry 0.49 0.48 0.44 0.36 0.48
Computers 0.33 0.31 0.34 0.33 0.32A
(c) Dimensions of Meneal Ability 0
Vocabulary 9.49 8.40 8.73 7.99 9.16
Reading, 9.52 8.93 9.58 9.05 9.77
Verbal Ability 9.95 8.64 9.30 8.27 9.72
Mathematical 9.21 8.85 9.98 8.60 9.76
Picture-Number 8.69 9.61 10.71, 10.49 9.65
Mosaic Comparisons 9:40 9.23 12.63 10.15 9.83
3-D Visualization
(d) Indicators of Responsibility
9.55 9.03 9.26 8.46 9.22
ROTC 0,12 0.14 0.27 0.16 0.14
Varsity Athletics 0.46 0.42 0.45 0.37 0.43
Other Athletic Teams 0.41 01-46 0.47 0.45 0.47
Honorary Clubs 0.47 0.37 0.32 t 0.29 6.40
Student Government 0.46 0.40 0.36 0.33 0.41
Have Job 0.49 0.49 0.50 0.48 0.49'
Days Absent 3.53 4.14 5.52 .4.95 4.37
Suspended 0.23 0.26 0.33 0.32 0.28
Trouble with Law 0.09 0.10 0.12 0.14 0.12
(e) Demographics .
Family Income (thousands) 13.79 11.62 9.33 110.59 12.48,
Importance of Aid 0.78 0.78 '0.66. 0.71 0.76
Family Owns Home 0.39 0.40 0.46 0.43 0.41
Number of Siblings 1.97 2.G3 2.30 1 2.42 2.19
Father is Professional 0.41 0.34 0.21 0.25 0.34
Mother is Professional 0.43 0.36 0.34 0.29 0.37
Father's Education z.lp' 1.66 4 1.64 1.37 1.87
Mother's Education 2.76 2.24 1.75 1.73 2.45
Proportion:White 0.46 0.46 0.50 0.46 0.46
Black 0.37 0.32 0.47 0.35 0.35
Hispanic 0.30 0.34 0.32 0.31 031
Oriental 0.15 0.14 0.09 0.12 .0.14
Indian 0.11 0.15 0.18 0.17 0.15
Other 0.09 0.09 0.12 0.09 0.09

90 -
Table A.3a
ATTRIBUTE PROFILE OF HIGH SCHOOL SENIORS PLANNING TO ENTER TWO-YEAR COLLEGESOR VOCATIONAL/TECHNICAL SCHOOLS (1,980): STANDARD DEVIATIONS FOR MALES
Two-vear 'College Voc/TechSchoolAcademic Vocational
(a) Accession Standards
General AbilityAge
Single.
Limiting Physical Condition
(b) High School EducatIon
9.01
0,600.050.23
8.800.62
0.060,27
0.7a0.08
0.24.
Grade Point Average 0.68 0.64 0.64Hours of Homework 2.68 2.64 3.14Semesters of: -,..,...._ .
English 1.28 1.35Foreign Language 2.00 /.94 1_70Mathematics 1.75 1.85. 1.92.Science 1.89 1.69 1.77 ,
Classes in:
Physics 0,43 0.38 0.34Chemistry 0.50 0.45 0.41Computers
(c)'Dimensions of Mental Ability
0,35 0.37 0.34
Vocabulary 8.82 8.28 '8:01Reading ' 9.40 .- 9.48 9.31Verbal Ability 9.16 8.87 8,48Mathematical 9.26 9.31 9.27-Picture-Number 9.89 9.83 10.26Mosaic Comparisons _10.13 10.79t 10.333-D Visualization
(d) Indicators of Responsibility
10.18' 9.47 10.25
ROTC 0.19 0.19 0,21Varsity Athletics 0.50 o.sb 0.49Other Athletic Teams 0.50 0.50Honorary Clubs '
.0.50
0.33 0.23 0.26Student Government 0.37 0.34 0.31Have Job ,0.49 0.47 0.46Days Absent 4.33 4.27 4.38Suspended 0.35 0.37 0.38. ,Trouble with Law
(e) Demographics
0.23 0.23 0.28
Family Income (thousands) 12.66 12.69 11.28Importance.rof Aid 0.78 0.75 0.76Family Owns Home 0.38 0.38 0.40Number of Siblings 2.09 2.14 2.'42Father is Professional 0.37 0.33 0.27Mother is Professional 0.00 0.00 0.00Father's Education 1.91 1.72 1.50Mother's Education 2.46, ' 2.34 1.79Proportion:White 0.45 0.46 0.47Black 0.28 0.32 0.33Hispanic 0.33 0.34 0.35Oriental 0.18 0.16 0.09Indian 0.14 0.19 0.17Other 0.08 0.07 0.12
106
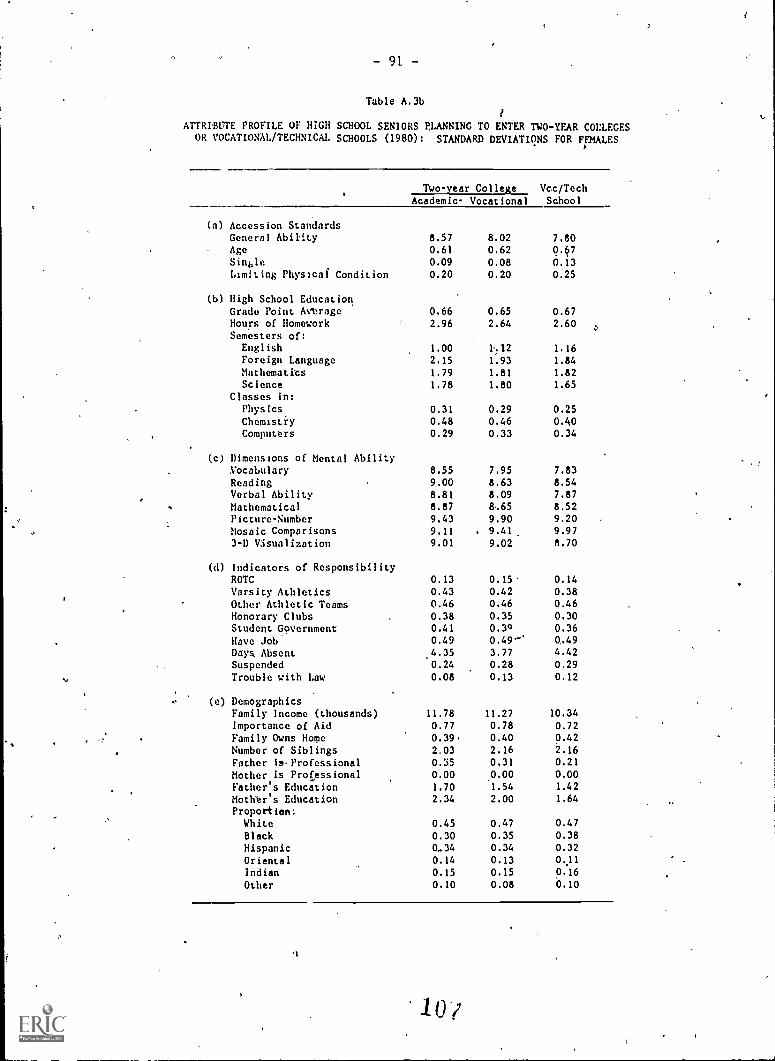
- 91 -
Table A.3b
ATTRIBUTE PROFILE OF HIGH SCHOOL SENIORS PLANNING TO ENTER TWO-YEAR COLLEGESOR VOCATIONAL/TECHNICAL SCHOOLS (1980): STANDARD DEVIATI0NS FOR FIFMALES
Two-year College Vcc/TechSchoolAcademic- Vocational
(a) Accession StandardsGeneral AbilityAge
Sin61 e
Limiting Physical Condition
(b) High School Education
8.57
0.61
0.09
0.20
8.02
0.62
0.08
0.20
7.80
0.§7
0.130.25
Grade Point AVbrage 0.66 0.65 0.67
Hours of Homework 2.96 2.64 2.60Semesters of:
English 1.00 1.12 1.16
Foreign Language 2.15 1.93 1.84
Mathematits 1.79 1.81 1.82
Science 1.78 1.80 1.65Classes in:
Physics 0.31 0.29 0.25
Chemistry 0.48 0.46 0.40Computtrs
(c) Dimensions of Mental Ability
0.29 0.33 0.34
Vocabulary 8.55 7.95 7.83
Reading 9.00 8.63 8.54Verbal Ability 8.81 8.09 7.87
Mathematical 8.87 8..65 8.52
Picture-Number 9.43 9.90 9.20
Mosaic Comparisons 9.11 9.41 9.97
3-D Visualization
(d) Indicators of Responsibility
9.01 9.02 8.70
ROTC 0.13 0.15 0.14
Varsity Athletics 0.43 0.42 0.38
Other Athletic Teams 0.46 0.46 0.46
Honorary Clubs 0.38 0.35 0.30
Student Government 0.41 0.3Q 0.36
Have Job' 0.49 0.49-' 0,49
Days Absent 3.77 4.42
Suspended
.4.35
0.24 0.28 0.29
Trouble with Law
(e) Demographics
0.08 0.13 0.12
Family Income (thousands) 11.78 11.27 10.34
Importance of Aid 0.77 0.78 0.72
Family Owns Home 0.39. 0.40 0.42
Number of Siblings 2,03 2.16 2.16
Father is.Professional 0.35 0,31 0.21
Mother is Professional 0.00 0.00Father's Education 1.70
.0.00
1.54 1.42
Mothtr's Education 2.34 2.00 1.64
Proportion;White 0.45 0.47 0.47
Black 0.30 0.35 0.38
Hispanic 0-34 0.34 0.32
Oriental 0.14 0.13 0..11
Indian 0.15 0.15 0.16
Other 0.10 0.08 0.10
11

- 92 -
.
Table A.4
MEAN AFQT SCORES BY EDUCATIONAL ATTAINMENT, SEX, AND BRANCHES OFSERVICE, 1981
High School College-
Nongraduate Graduate 1 Year 2 Years 3-4 Years Graduate
, Males
Army 46.2 44.0 63.7 65.9 67.3 72.8Navy- 58.0 55.0 69.3 71.0 72.4 73.4USAF 64.0 58.0 69.3 70.4 71.6 74.2USMC 54.5 52.4 70.2 69.2 71.7 68.4
Females
Army 50.8 43.8 59.0 57.2 59.7 70.5Navy
.
59.5 56.5 65.1 67.8 70.3 - 74.6USAF 62.9 59.1 66.3 68.2 70.6 73.3USMC 74.7 65.3 72.0 73.4 74.4 ' 71.8
108

93 -
Table A.5
PERCENTAGES OF ENLISTMENTS IN MENTAL CATEGORIES I-IIIA BYEDUCATIONAL ATTAINMENT, SEX, AND BRANCH OF SERVICE
High School College
Nongraduate Graduate 1 Year 2 Years 3-4 Years0
Graduate
Males
Army 36.0 38.5 70.6 72.9 72.2 81.8
. Navy 66.8 58.1 79.0 80.4 81.9 85.7
USAF 85.5 64.2 81.9 81.6 84.4 85.1
USMC 58.4 52.8 80.3 77.7 78.6 78.0
Females
Army 46.9 35:9 61.2 58.6 60.2 79.6
Navy. 68.5 61.3 75.7 80.6 78.0 86.7
USAF . 82.0 67.8 77.6 82.4 84.8 85.8
USMC loo.q 91.5, 97.6 97.9 100.0 97.4
lod

- 94 -
Table A.6
ASPIRATIONS OF HIGH SCHOOL SENIORS PLANNING TO UNDERTAKE CERTAIN
POSTSECONDARY ACTIVITIES (1980)
a. Standard Deviations for Males
. College MilitaryService
Civilian-Labor Force AllFour-vear Two-year
Career Aspirations 16.71 18.70 16.21 18.08 20.64yrofessional Aspirations 0.47 0.49 0.39 0.38 0.49Age Hold First Regular Job 2.32 2.32 2.56 1.91 2.71Years Education Expected 1.87 1.98 2.38 1.75 2.54years Ed. Expected by Mother 1.98 9.90 2.69 2.41 2.50Ability co Complete College 0.53 0.74 1.04 1.14 0.98Age Expect to Marry 9.49 2.57 2.86 2.85 2.72iAge Expect First Child 2.39 2.56 2.84 2.85 2.71
b. Standard Deviations for Females
College Military CivilianService Labor Force AllFollr:yeLls_iy2::year
Career Aspirations 15.39 16.64 13.69 15.38 17.56Professional Aspirations 0.45 0.50 0.43 0.44 0.50Age Hold First Regular Job 9.95 2.19 2.10 1.62 2.46Years Education Expected 1.88 1.80 2.30 i.65 2.42-Years Ed. Expected by Mother 1.94 2.10 2;68 2.23 2.41Ability to Complete College 0.58 0.68 0.96 1.07 0.94Age Expect to Marry 2.28 2.31 2.70 2.55 2.61Age Expect First Child - 2.19 2.29 2.62 2.53 2.56
110

95 -
Table A.7
ASPIRATIONS OF HIGH SCHOOL SENIORS PLANNING TO ENTER TWO-YEAR
COLLEGES OR VOCATIONAL/TECHNICAL SCHOOLS (1980)
a. StandaH Deviations for Males
Two-year College Voc/TechSchoolAcademic Vocational
Career Aspirations 18.41 17.32 15.36
Erofessional Aspirations 0.50 0.44 0.34
Age Hold First Regular Job 2.38 2.10 1.81
Years Education Expected 2.00 1.76 0_94
Years Ed. Expected by Mother 2.15 2.19 1.71
Ability to Complete Ccllege 0.67 0.82 0.98
Age Expect to Marry 9.59 2.60 2.61
Age, Expect First Child 9.51 2.60 2.73
b. Standard Deviations for Females
Two-year College Voc/TechSchoolAcademic Vocational
Career Aspirations 16.29 .16.42 15.00
Professional Aspirations 0.49 0.49 0.43
Age ilold First Regular Job 2.28 1.99 1.60
Years Education Expected 1.91 1.42 0.98
Years Ed. Expected by Mother 2.13 1.93 1.84
Ability to Complete College 0.66 0.72 0.92
Age Expect to Marry 9.26 2.37 2.50
Age Expect First Child 2.26 2.30 2.35
111
ft,.
97
REFERENCES
Astin, A. W., M. King, and G. T. Richardson, The American Freshman:National Norms for Fall 1981, American Council on Educhtion,.University of California at Los Angeles; 1981.
Baird, L. L., "Cooling Out and Warming Up in the, Junior College,"Measurement and Evaluation in Guidance, Vol. 4, 1971, pp. 160-171.
Borus., M. E., "The Potential for Recruiting Military Personnel in TwoYear Colleges and Vocational Training Institutions," Ohio StateUniversity, mimeograph, 1982.
Breneman, D. W., and S. C. Nelson, Financing Community College: AnEconomic Perspective, Brookings Institution, Washington, D.C., 1981.
Broyles, S. G., and G. C. Davis, Education Directory: Colleges andUniversities 1981-82, National Center for Education Statistics,Washington, D.C., 1982.
Clark, B. R., °The 'Cooling-Out' Function in Higher Education," TheAmerican Jolt-nal of Sociology, Vol. 65, 1960, pp. 569-576.
Clark, B. R., "The 'Cooling-Out' Function Revisited," in G. B. Vaughn(ed.), Questioning the Community College Role: NeW. Directions forCommunity College!.i, Jossey-Bass, San Fraucisco, Vol. 32, 1980, pp.15-31.
Cohen, A. N., and F. B. Brhwer, The American Community College,Jossey-Bass,. San Franciico, 1982.
Dearman, N. B., and V. W. Plisko, The Condition of Education 1981Edition, National Center for Education Statistics, Government PrintingOffice, Washington, D.C., 1981,
Doering, Z. D., D. W. Grissmer, and J. S. Morse, 1979 DoD Survey ofPersonnel Entering Military Servie: Wave 1 Usei's Manual andCodebook, The Rand Corporation, N-1605-MRAL, November 1980.
Fisher, A. H., L. D. Pappas, and S. Shepherdson, Navy RecruitmentPotential in Junior College, Hay Associates Technical Report 7671,July 1975.
' Grant, W. V., and L. J. Eiden, Digest of Education Sta.tistics 181,National Center for Education Statistics, Government Printing Office,Washington, D.C., 1981.
Haggstrom, G. W. The Pitfalls of Manpower Experimentation, The RandCorporation, P-5449, April 1975.
112
98 -
r
Heynes, B., and T. L. Hilton, "The Cognitive Tests fbr High School andBeyond: An Assessment," Sociolopy of Education, Vol. 55, 1982, pp.89-102.
Kanouse, D. E., G.W. Haggstrom, T. J. Blaschke, J. P. Kahan, W. J.Lisowski, and P. A. Morrison, Effects of Postsecondary Experiences onAspirations, Attitudes, and Self-Conceptions, The Rand Corporation,R-2616-HEW, April 1980.
Kay, E. R., Enr011ments and Diagrams in Noncollegiate PostsecondarySchools 1978, National Center for Education Statistics, Superintendentof Documents, U.S. Government Printing Office, Washington D C,September 1979.
Kol.tad, A., Attrition from College: The Class of 1972 Two and One-HalfYears After High School Graduation, National Center for EducationStatistics, ERIC #B-168-396-1; Washington, D1C., 1977.
Kormen, A. K. B. E. Goodstat, A. S. Glickman, and A. P. Romanczick, AnExploratioll Study of Enlistment Incentives Among Junior ColldgeStudents, American Institutes for Research, AIR-32201-6/73-TM-1, June1973.
Levinsohn, J. R., L. B. Henderson, J. A. Roccoboro, and R. P, Moore,National Longitudinal Study: Base Year, First, Second, and ThirdFollow-gp Data File Users Manual, 2 volumes, Research TriangleInstitute, Research'Triangle Park, North Carolina, 1978.
Peng, S. S., W. B. Fettees, and A. J. Kolstad, High School and Beyond:A Capsule Description of High School Students, National Center for_Education StAistics, Washington, D.C., April 1981. .
McDonnell, L. M., and M. W. McLaughlin, Education Policy and the Role ofthe States, The Rand Corporation, R-2755-NIE, May 1982.
'Pepin, A: J., and A. Q. Wells, Associate Degrees and Other Formal AwardsBelow the Baccalaureate'1978-1979, National Center for EducationStatistics, Washington, D.C., February 1981.
Pincus,,F. L., "The False Promises of Community Colleges: ClassConflict and Wicational Education," Harvard Educational RevieW, Vol.50, 1980, pp. 332-361.
Testerman, D. E:Imaginative Programs--A,Military/CivilianPartnership," in K. F. Arns (ed.), Occilpational Educational Today:New Dtrections for Community Colleges, Vol. 33, 1981, pp. 85-92.
Veterans Administration, Veterans' Benefits under Current EducationalPrbgrams: Fiscal Year 1981, RSN 70=82-1, 317376' of Reports andStatistics, Veterans Administration, February 1982.
113

99 -
U.S. Bureau of the Census, Current Population Reports, .Series P-25, No.870, "Estimates of the Population of 'the'United States, by Age, Race,and Sex: 1976 to 1979-," Government Printing Office, Washington, D.C.,1980. ,
a
..
ERIC Clearinghouse for Junior Colleges8118 Math-Sciences Building
University of California
Los Angeles, Ca liforbit. 90024
,
APR 13 1983
6
i